


Intelligent Method for Classifying the Level of Anthropogenic Disasters
by
 , , and
Khrystyna Lipianina-Honcharenko
1,*,
Carsten Wolff
2,
Anatoliy Sachenko
1,3,
Ivan Kit
1 and
Diana Zahorodnia
1 1
Department for Information Computer Systems and Control, West Ukrainian National University, Lvivska Str. 11, 46000 Ternopil, Ukraine
2
Faculty of Computer Science, Fachhochschule Dortmund—University of Applied Sciences and Arts, Otto-Hahn-Straße OHS-23, 44227 Dortmund, Germany
3
Department of Informatics and Teleinformatics, Kazimierz Pulaski University of Technology and Humanities in Radom, Malczewskiego Str. 29, 26-600 Radom, Poland
*
Author to whom correspondence should be addressed.
Big Data Cogn. Comput. 2023, 7(3), 157; https://doi.org/10.3390/bdcc7030157
Submission received: 26 June 2023
/
Revised: 8 September 2023
/
Accepted: 15 September 2023
/
Published: 21 September 2023
(This article belongs to the Special Issue Quality and Security of Critical Infrastructure Systems)
Abstract
:Anthropogenic disasters pose a challenge to management in the modern world. At the same time, it is important to have accurate and timely information to assess the level of danger and take appropriate measures to eliminate disasters. Therefore, the purpose of the paper is to develop an effective method for assessing the level of anthropogenic disasters based on information from witnesses to the event. For this purpose, a conceptual model for assessing the consequences of anthropogenic disasters is proposed, the main components of which are the following ones: the analysis of collected data, modeling and assessment of their consequences. The main characteristics of the intelligent method for classifying the level of anthropogenic disasters are considered, in particular, exploratory data analysis using the EDA method, classification based on textual data using SMOTE, and data classification by the ensemble method of machine learning using boosting. The experimental results confirmed that for textual data, the best classification is at level V and level I with an error of 0.97 and 0.94, respectively, and the average error estimate is 0.68. For quantitative data, the classification accuracy of Potential Accident Level relative to Industry Sector is 77%, and the f1-score is 0.88, which indicates a fairly high accuracy of the model. The architecture of a mobile application for classifying the level of anthropogenic disasters has been developed, which reduces the time required to assess consequences of danger in the region. In addition, the proposed approach ensures interaction with dynamic and uncertain environments, which makes it an effective tool for classifying.
1. Introduction
The modern world is faced with constantly growing challenges in the field of anthropogenic safety, especially in the context of military conflicts. High-risk facilities, which form the basis of the modern technogenic society, can find themselves in a critical state in case of emergencies. This can lead to disastrous consequences for people, the environment, and the economy.
The problem of eliminating the consequences of emergencies, both of a natural and anthropogenic nature, is an important state function. The relevance of this issue is determined by both the number of natural disasters and the prevalence of heavy, chemical, and nuclear-energy industries. Even under normal operation at industrial enterprises [1], minor releases of hazardous substances into the environment are possible, which in the event of an accident can scale into a anthropogenic disaster.
In this context, a research addressed to solve the problem above and aimed at assessing the level of anthropogenic disasters is extremely topical and important for modern society. According to this, authors of the paper are proposing an intelligent method for classifying the level of anthropogenic disasters based on the boosting ensemble methods of machine learning.
The rest of paper is structured as following. In Section 2 an overview of recent related references is performed and research objectives are formed. In Section 3 Boosting Methods are analyzed and Features of the proposed Intelligent Method are considered. In Section 4 is devoted by experimental research including data description and research methodology, Exploratory Data Analysis and classification based on both textual and numeric data. In Section 5 is considered the mobile application architecture, and in Section 6—discussion. Section 7 is summarizing the received results.
2. Related Work
Various methods exist for detecting anthropogenic accidents and disasters, such as visual observation, the use of sensors and monitors, data analysis from third-party sources, and others. However, most of these methods are limited in accuracy and response speed, so there is a need for the development of new and more effective methods for determining the level of anthropogenic disasters. Disaster assessment based on social media data is one of the new directions in risk prediction and management research.
However, such methods also have their limitations and risks, including those related to the insufficient accuracy and reliability of social media data, the possibility of spreading false information, and others. Therefore, it is necessary to carefully analyze and verify the received information before making decisions regarding risk and disaster management.
One approach is the use of information from social networks for management during emergencies [2]. In [3], the application of artificial intelligence, WebGIS, and several algorithms are investigated to enhance emergency response and aid in disaster relief during various natural catastrophes and crisis situations. According to [4], a distributed multi-tier emergency alerting system is developed using sensor-based event detectors, supporting applications for smart cities. This system can detect and deliver real-time emergency alarms based on detected events, pre-known risk levels of specific areas, and temporal information.
In [5], a prototype system was proposed for the effective use of tweets to support resource mobilization tasks during emergencies. The decision pipeline of the proposed system includes the classification of tweets followed by ranking tweets to determine the priority of resource transmission.
In [6], the application of artificial intelligence and data science is explored to ensure smart resilience to emergencies, crises, and disasters. In [7], Support Vector Machine (SVM), K-Nearest Neighbors (KNN), and logistic regression, data analysis algorithms were used and compared for classifying tweets about natural disasters. In [8], the analysis of big data and its applications in smart real estate and disaster management is conducted, identifying key characteristics and potential uses to enhance both domains. Work [9] is dedicated to identifying situational tweets during a disaster. A neural approach, like [10], was developed based on a combination of the RoBERTa model and a feature-based method for identifying situational tweets during a disaster. However, the performance of the proposed approaches depends on the number of tags in social networks related to emergencies, which affects the timely response to the accident.
In [11], recent developments in the field of machine learning, for disaster management are analyzed, focusing on methods and applications such as prediction, risk assessment, hazard detection, early warning systems, monitoring, damage assessment, and post-disaster response, along with recommendations for further research. Civique [12] is considering the another emergency detection system that primarily targets geotagged tweets and uses Support Vector Machines (SVM) and Naive Bayes for training.
In [13], a deep object-oriented change detection structure called ChangeOS was proposed. In [14], a model for determining the response time of emergency services was presented. In [15], a conceptual and architectural basis for the development of emergency detection systems based on the “human as a sensor” (HaaS) paradigm was proposed.
In [16], a hybrid ALBERT-based TextCNN-Hatt model is developed, utilizing topic knowledge for analyzing public sentiments during emergencies, demonstrating the high effectiveness with significant improvements in sentiment detection compared to previous models, and achieving an average accuracy of 89%, AUC of 94%, and CQI of 88%. This model keeps the practical potential for emergency response tasks and aiding decision-makers in responding appropriately to crisis situations. In [17], a hybrid structure was demonstrated including a pre-trained DistilBERT model and a proposed feature selection algorithm for emergency detection. Experiments and comparisons of the proposed system show its advantage in terms of event identification accuracy and feature reduction compared to others.
A Table 1 provides a comparative assessment of the main analogs for detecting emergencies using data analysis from social media.
Despite the availability of various tools for analyzing anthropogenic disasters and providing automated responses [16,17,18], making effective decisions to prevent potential humanitarian-economic disasters remains a problem. Moreover, in existing works, insufficient attention is paid to assessing the consequences of these disasters and determining the level of danger. Considering these shortcomings, a goal of the paper is to develop an effective method for assessing the level of anthropogenic disasters based on information from witnesses to the event. To reach this goal we formed the two key objectives:
- Development of the intelligent classification method for assessing the level of anthropogenic disasters based on the boosting ensemble methods of machine learning.
- Development of the mobile application architecture for classifying the level of anthropogenic disasters in the region.
According to these objectives, the authors present the research below.
3. Materials and Methods
3.1. Boosting Methods
The Boosting method is used in classification to enhance the accuracy of the model. Its essence lies in the combination of weak classifiers into a strong one. Unlike other methods, for example, Bagging [19], Boosting are training models sequentially, where each subsequent model corrects the errors of the previous one. This property plays a crucial role in complex tasks with a variety of data, as is the case with the classification of the level of anthropogenic disasters. Textual and quantitative data coming from event witnesses can have a high variability and heterogeneity, making Boosting the number one choice. Let’s look more closely at the existing Boosting methods.
AdaBoost. AdaBoost stands for “Adaptive Boosting” or adaptive boosting. It turns weak learning algorithms into strong solutions to classification problems. The final Equation (1) for classification can be represented as follows:
where each is a weak learner that takes an object x as input and returns a value indicating the class of the object. For example, in a two-class problem, the sign of the weak learner’s score determines the predicted class of the object, and the absolute value gives confidence in this classification. Similarly, with T, if this classifier is positive, the sample is in the positive class, otherwise it is negative.
Each weak learner generates an initial hypothesis, , for each sample in the training set. At each iteration , a weak learner is selected and assigned a coefficient such that the sum of the training error (2) of the resulting t-classifier of scene enhancement is minimized.
where is the enhanced classifier that has been built before the previous training phase, is some error function, and is the weak learner that is considered for addition to the final classifier.
At each iteration of the training process, a weight is taken and assigned to each sample in the training set equal to the current error on that sample. These weights can be used to inform the training of a weak learner, e.g., decision trees can be grown to help split the sample sets with high weights.
Gradient Boost. In Gradient Boost Machines (GBMs), the learning procedure successively adapts new models to provide a more accurate estimate of the response variable [20]. The basic idea behind this algorithm is to build new baseline training elements that are maximally correlated with the negative gradient of the loss function associated with the entire ensemble. The loss function used can be arbitrary, but if the error function is a classical quadratic error, the training procedure will lead to a consistent error fit. In general, the choice of loss function depends on the researcher and the specific task. This high flexibility makes GBMs easily customizable for any particular data-driven task.
Supervised learning leaves a strong constraint for the researcher, as the data must be provided with a sufficient set of relevant target labels (which can be very expensive to extract, e.g., as a result of an expensive experiment). Given a dataset , where with the number of iterations M refers to the explanatory input variables and y to the corresponding labels of the response variable. The goal is to reconstruct the unknown functional (3) dependence with our estimate so that some defined loss function is minimized:
Thus, is initialized to a constant for to M and a negative gradient is computed to fit the new base learning function . Based on this, the best descent gradient of step size is then found:
The last step is to update the function evaluation (5):
XGBoost. XGBoost is a machine learning algorithm based on a decision tree that uses a gradient boosting framework. In XGBoost, tree construction is based on parallelization. This is possible due to the interchangeable nature of the loops used to build the training base: the outer loop enumerates tree leaves, the inner loop calculates features. A loop found inside another loop prevents the algorithm from parallelizing, since the outer loop cannot start its execution while the inner loop has not yet finished its work. Therefore, to improve the running time, the order of the cycles is changed: initialization takes place when reading data, then sorting is performed using parallel threads. This change improves the performance of the algorithm by distributing computations across threads.
Therefore, there exists a training , where the loss function is differentiated, the training series is determined, and is the learning rate. The initialization of the model (6) has a constant value:
“Gradients” (7) and “Hessians” (8) are defined for to M:
Next, a basic learner (or a weak) is selected (9) using a training set
by solving the optimization task (10, 11):
At the last step (12), you need to update the function evaluation:
CatBoost. The CatBoost library [21] is another effective implementation of gradient boosting over decision trees. CatBoost is an implementation of gradient boosting that allows using binary decision trees as basic predictors. Suppose there is a data set with samples , where is a vector of n features, and is the response feature , which can be binary (i.e., yes or no) or encoded as a numeric feature (0 or 1). The samples are independently and identically distributed according to some distribution p(⋅,∙). The goal of the training task is to train (13) a function that minimizes the expected loss given in
where is a smooth loss function and is the test data selected from the training data . The gradient boosting procedure iteratively builds a sequence of approximations From the previous approximation is obtained in an additive process, such that , with step size α and function which is the base predictor, selected from the set of functions G to reduce or minimize the expected losses (14), defined as:
Often, the minimization problem is approached by Newton’s method using a second-order approximation at or by taking a (negative) gradient step. Either of these functions is a gradient descent.
LightGBM Classifier. The Light Gradient Boosted Machine, or LightGBM for short [22,23], is an open source implementation of gradient boosting. Gradient Boosted Decision Tree (GBDT) is a popular classifier algorithm. Thus, a training set is provided, which consists of pairs , where x represents the data samples and y denotes the class labels. The evaluation function is represented by F(x), and the objective of GBDT optimization from a third-person perspective is to minimize (15) the loss L(y, F(x)):
From a third-person perspective, an iterative GBDT criterion can be derived by employing a linear search (16) to minimize the loss function.
where , —is the number of iterations, —represents the basic decision tree.
But when the number of samples is large or the feature size is huge, the efficiency and accuracy of GBDT still cannot be satisfactory. GBDT is an ensemble algorithm whose base classifier is a decision tree, so the main cost is to find the best splitting points when learning decision trees. Ke et al. [23] proposed a high-performance gradient boosting decision tree using Gradient-Oriented One-Sided Sampling (GOSS) and Exclusive Feature Bundling (EFB) called LightGBM.
For GBDT, information gain is typically used to separate each node. LightGBM uses GOSS to determine the splitting point by calculating the variance gain. First, it selects a sort of absolute gradient values of the training examples in descending order and the top sample of these gradient values called A. Then, a subset B of size is randomly selected from the un-sorted samples . Finally, the samples are partitioned via the estimated (17) variance into .
where represents the negative gradient of the loss function, is used to normalize the sum of the gradients.
Volumetric functions often tend to be sparse and many sparse functions are exclusive. Thus, EFB can be used to accelerate GBDT training. In other words, LightGBM can bundle exclusive features into a single feature, and the feature scanning algorithm can be designed to generate the same histograms from feature bundles. Hence, the computational complexity of LightGBM reduces to with , where .
Thus, LightGBM is an efficient implementation of GBDT with GOSS and EFB to improve computational efficiency without sacrificing accuracy. GOSS is used to split the optimal node by calculating the coefficient of variance. EFB can speed up the GBDT training process by combining many exclusive features with fewer dense features. LightGBM is an ensemble model whose base classifier is a decision tree that can be trained sequentially by fitting negative gradients of the loss function. The LightGBM model (18) can be obtained using a weighted combination scheme.
where M is the maximum number of iterations and is the tree of basic decisions.
3.2. Essence and Features of the Intelligent Method
According ot the Objective 1 we need to develop the intelligent classification method for assessing the level of anthropogenic disasters. “Potential Accident Levels” is a rating system used to determine the potential danger level of an accident. It usually includes four levels [24]:
- Potential Accident Levels I: Minimal danger level. Accidents of this level usually do not cause significant damage and can be easily resolved without special efforts.
- Potential Accident Levels II: Medium danger level. Accidents of this level can cause moderate damage and require more effort to resolve.
- Potential Accident Levels III: High danger level. Accidents of this level can cause the serious damage and require the significant efforts to resolve.
- Potential Accident Levels IV: Extreme danger level. Accidents of this level can cause the catastrophic damage and require extraordinary efforts to resolve.
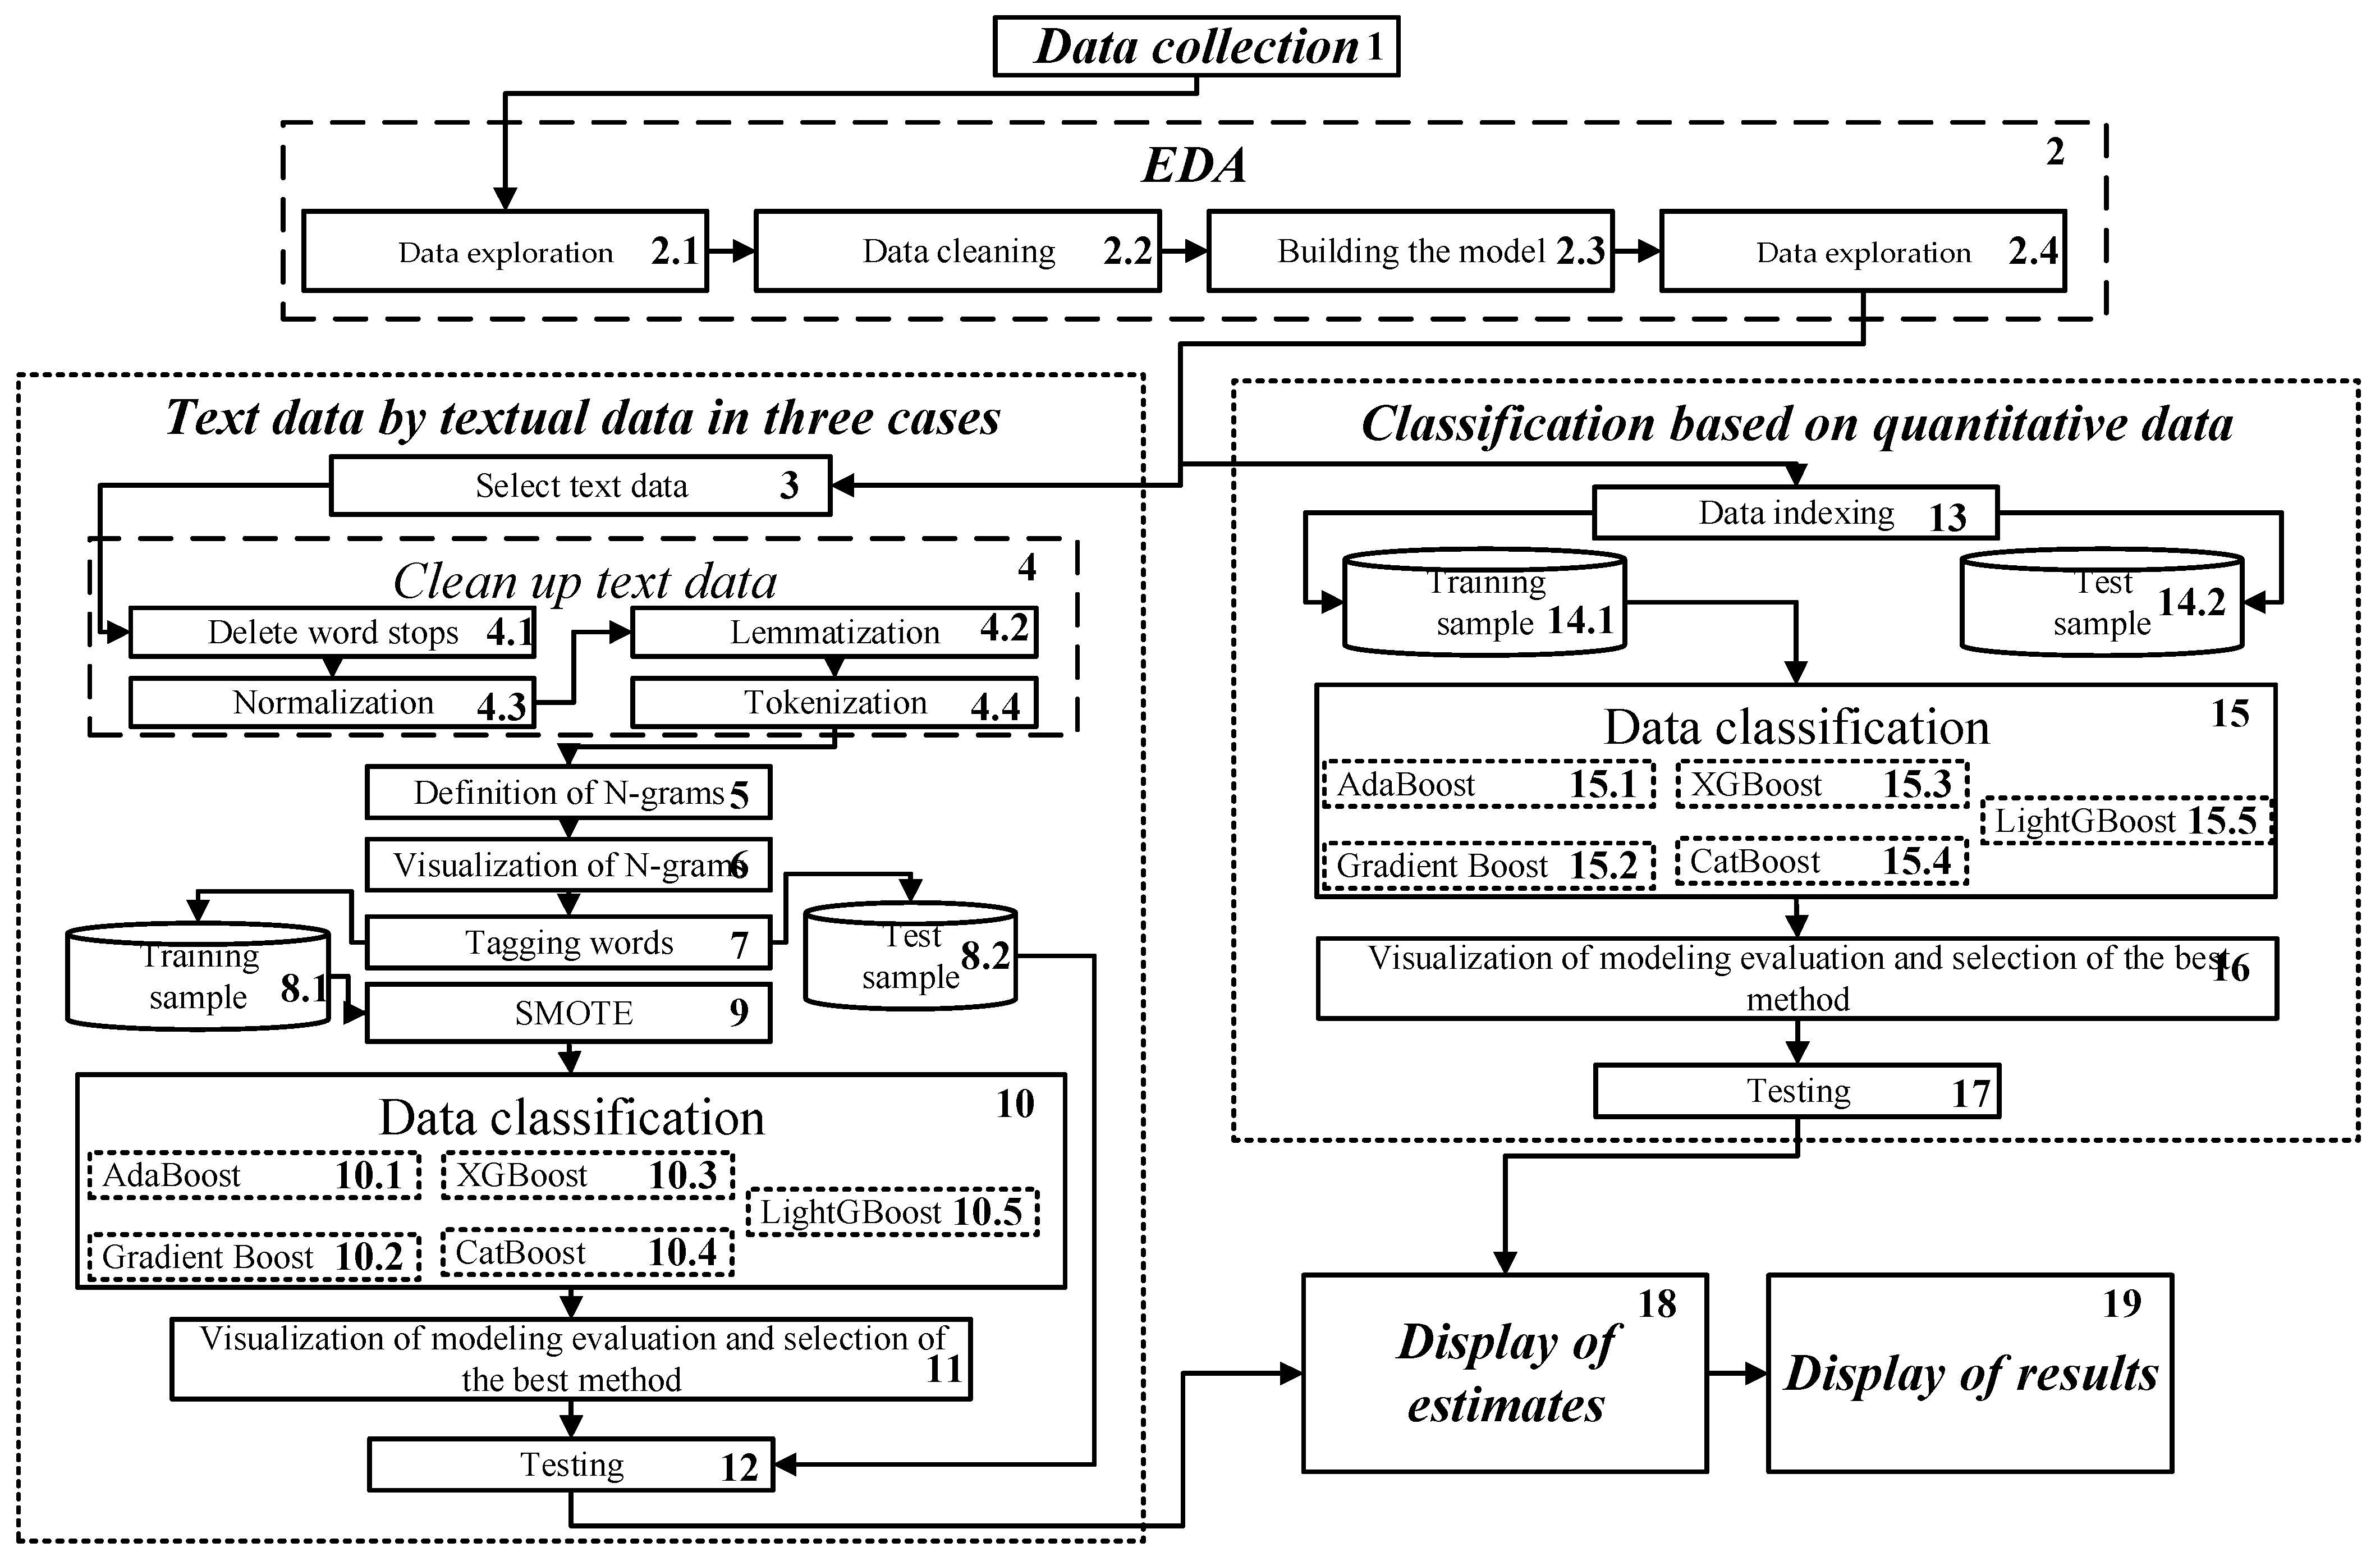
The developed intelligent method is based on the Exploratory Analysis of data collected from accident witnesses, separate classification of textual and quantitative data using machine learning methods, and subsequent visualization of results. According to this, the conceptual structure of the intelligent method includes six main segments: 1—Data collection, 2—Exploratory data analysis, 3—Classification of textual data, 4—Classification of quantitative data, 5—Display of estimates, and 6—Display of results (Figure 1).
At the stage of data analysis, it is important to reduce the time spent on determining the level of potential danger in the region.
The method can be represented by s set of the phases (which correspond to segments above) and steps (see Figure 1):
The Phase 1 is run as Data collection. The data can be collected in the form of a survey of emergency witnesses.
Let us consider the Phase 2 which is run as Exploratory data analysis (EDA) (Segment 2) [25,26]. The EDA is used, on the one hand, to answer questions, test basic assumptions, and create hypotheses for further analysis. On the other hand, it can help further when solving other problems dealing with cleaning/preparing/converting data. The Phase 2 is divided into four steps: data exploration (2.1), data cleaning (Block 2.2), model building (2.3), and presentation of results (2.4).
Regarding the classification of textual (Segment 3) and quantitative (Segment 4) data they are considered separately (see Figure 1) due to differences in their structures and characteristics. In particular, textual data usually consists of unstructured text, which can be difficult to analyze. Methods of textual data classification typically include natural language processing techniques to convert text into numeric vectors with a following analysis.
Quantitative data usually consists of numerical values that can be easily analyzed using various statistical and machine learning methods.
Let us consider the Phase 3, which is run as Classification, based on textual data. The fastest way to get data is to use eyewitness descriptions of the accident. This phase involves the following nine steps:
Step 3.1: Textual data are utilized (Block 3).
Step 3.2: Cleaning the textual data (Block 4) [27,28]. It involves several sub steps: removal of stop words (4.1), normalization (4.2), lemmatization (4.3), and tokenization (4.4).
Step 3.3: Definition (Block 5) and visualization (Block 6) of N-grams [27]. An N-gram can be defined as a continuous sequence of n elements from a given text or speech sample. Elements can be letters, words, or base pairs according to the program. N-grams are usually collected from a text or speech corpus (long textual dataset).
Step 3.4: Tagging of words (Block 7). Part-of-speech tagging (POS) [29] is the process of transforming a sentence into forms—a list of words, a list of tuples, where each tuple has a form (word, tag). The tag in this case is a part of speech tag and indicates whether the word is a noun, adjective, verb, etc. Part-of-speech tags provide insight into the grammatical structure of words in a sentence or text, thereby allowing for inferences to be made about their semantic roles. Other applications of POS tagging include: named entity recognition; co-occurrence resolution; and speech recognition. When POS tagging is performed, it is often the case that the tagger encounters words that are not part of the vocabulary that was used.
Step 3.5: Following that, the data set is partitioned into Training sample (8.1) and Testing sample (8.2) subsets.
Step 3.6: Synthetic Minority Oversampling Technique (SMOTE) [30] (9). The problem with unbalanced classification is that there are too few examples of the minority class for the model to effectively learn the decision boundary. One way to solve this problem is to over-sample the examples in the minority class. This can be achieved by simply copying the instances from the minority class in the training dataset before fitting the model. This may balance the distribution of classes, but does not provide any additional information to the model. An improvement on copying examples from the minority class is to synthesize new examples from the minority class. This is a type of data augmentation for tabular data and can be very effective. Perhaps the most widely used approach to synthesizing new examples is called SMOTE. SMOTE defines a method of data preparation when tuning and evaluating machine learning algorithms.
Step 3.7: Classify the data (Block 10) with an ensemble method of machine learning using a boosting approach. As mentioned above, boosting methods generate a collection of models that together form a robust learner with superior performance and a high accuracy.. Therefore, for textual data classification we select boosting methods such as AdaBoost (10.1) according to (1)–(3), GradientBoost (10.2) according to (3)–(5), XGBoost (10.3) according to (6)–(12), CatBoost (10.4) according to (13)–(15), and LightGBM (10.5) according to (15)–(18).
Step 3.8: Visualization of modeling evaluation and selection of the best method (Block 11). The selection of the best method is based on the modeling estimates by parameters: Accuracy, Precision, Recall and F1-Score [31].
Accuracy—in multiclass classification, accuracy is a metric that measures the correspondence between the set of labels assigned to a sample and the actual set of labels. For accuracy, both sets of labels should match perfectly.
Precision is the ratio between the number of true positives and the number of false positives. The best value is 1, and the worst value is 0.
Recall is the ratio between the number of true positives and the number of false negatives. The best value is 1 and the worst value is 0.
F1-Score—The F1 score can be interpreted as a harmonic average of precision and recall. The F1 score reaches its best value at 1 and its worst value at 0.
Step 3.9: Conducting classification on the test set (Block 12).
Let us consider the Phase 4 which is run as Classification based on quantitative data. The Phase 4 includes the following five steps:
Step 4.1: Indexing the data (Block 13).
Step 4.2: Dividing the data into training (Block 14.1) and test (Block 14.2) samples.
Step 4.3: Data classification (Block 15) includes the five sub steps employing AdaBoost (15.1) according to (1)–(3), GradientBoost (15.2), according to (3)–(5), XGBoost (15.3) according to (6)–(12), CatBoost (15.4) according to (13)–(15) and LightGBM (15.5) according to (15)–(18).
Step 4.4: Visualization of the results obtained (Block 16).
Step 4.5: Conducting classification on the test sample (Block 17). Let’s consider the two final phases (see Figure 1).
Phase 5: Display of the scores (Block 18). In this phase, the model results obtained after training and testing are displayed for analysis. This can include displaying metrics such as accuracy, recall, F1-score, and others, which help to evaluate the effectiveness of the model. Displaying the results can be done in the form of tables, charts, or other visualizations that enabling the easy interpretation of results.
Phase 6: Display of the results (Block 19). This phase may include displaying the predicted labels for the test dataset, comparing the predicted labels with the actual ones, as well as displaying feature importance. This phase helps to determine how well the model performs on new, unseen data, and which features are the most important for prediction.
4. Case Study
4.1. Data Description and Research Methodology
The input data are accident records for 12 different enterprises in 3 different coun tries, each row of which contains information about an accident [32] (Table 2). Each row in the records contains information about the accident, including the date and time of the accident, the location of the accident, the type of industry, the causes and consequences of the accident, the number of victims, the level of the disaster, and the potential level of the accident.
The accident data was then processed and prepared using the Exploratory Data Analysis approach [25,26] for further use of the developed method. The following steps were performed (see Figure 1 Block 2):
- Reading the data from the file and converting it to a format suitable for further processing.
- Cleaning and normalizing the data, including removing unnecessary information and standardizing the format of records.
- Creating a database to store the processed data and building an appropriate interface for accessing this data.
Machine learning libraries such as scikit-learn, pandas, and numpy were used to perform the intelligent method [33]. After pre-processing the data, which included data summarization and cleaning, as well as feature engineering, a machine learning model was built using ensemble classification methods (see Figure 1 Block 10 and 15).
Cross-validation (see Figure 1 Block 12 and 17) was used to evaluate the classification accuracy, which allowed us to obtain the model’s accuracy. After training and testing the model on the validation sample, it was applied to assess the consequences of anthropogenic disasters at other enterprises and in other regions.
4.2. Exploratory Data Analysis
For a comprehensive understanding of the data, Exploratory Data Analysis [25,26] is conducted (see Figure 1, Block 2). The initial phase involves a visual evaluation of the indicators. There are more accidents and disasters in the mining industry. It can be said that the number of accidents in the mining industry is much higher than in the metallurgical industry, so working in the mining industry is more risky than in the latter. A characteristic feature of each industry is the predominant share of men. The data set is biased toward male workers. The total number of direct employees and third-party employees is almost the same, but there are fewer remote third-party employees.
Local-03 (see Table 2) has the highest number of accidents, accounting for about 21% of all plants in the country [32]. This is followed by Local-05, Local-01, and so on.
Most of the critical risks are classified as “Other”, which is almost 50% of the dataset, so there are too many risks that need to be accurately classified. This is followed by press and hand tools, chemicals, cutting, etc.
The level of actual or potential accident—I stands for not severe, and V stands for very severe. Accidents with level I are the most common. This is due to small fault, such as people forgetting their personal protective equipment or dropping a tool, etc. The potential accident level indicates how severe the accident will be due to other factors associated with the accident. Potential accident level IV has the highest number and indicates moderate accident severity.
Next, it is necessary to check the correlation between the potential accident level IV and the accident level in total and relative to the industry sector. There is a significant difference between incident severity and potential incident severity. If the number of accidents increases, the potential accident rate decreases. If the accident rate increases, the potential accident rate increases too. Moreover, a most of the accidents occur at Level 1.
Of all the industries mining has had some accidents, with the most severe level of accidents and the highest potential level of accidents. This is followed by metallurgy and others. The severity levels of incidents are higher in the mining sector (level 4 is slightly higher than levels 2 and 3).
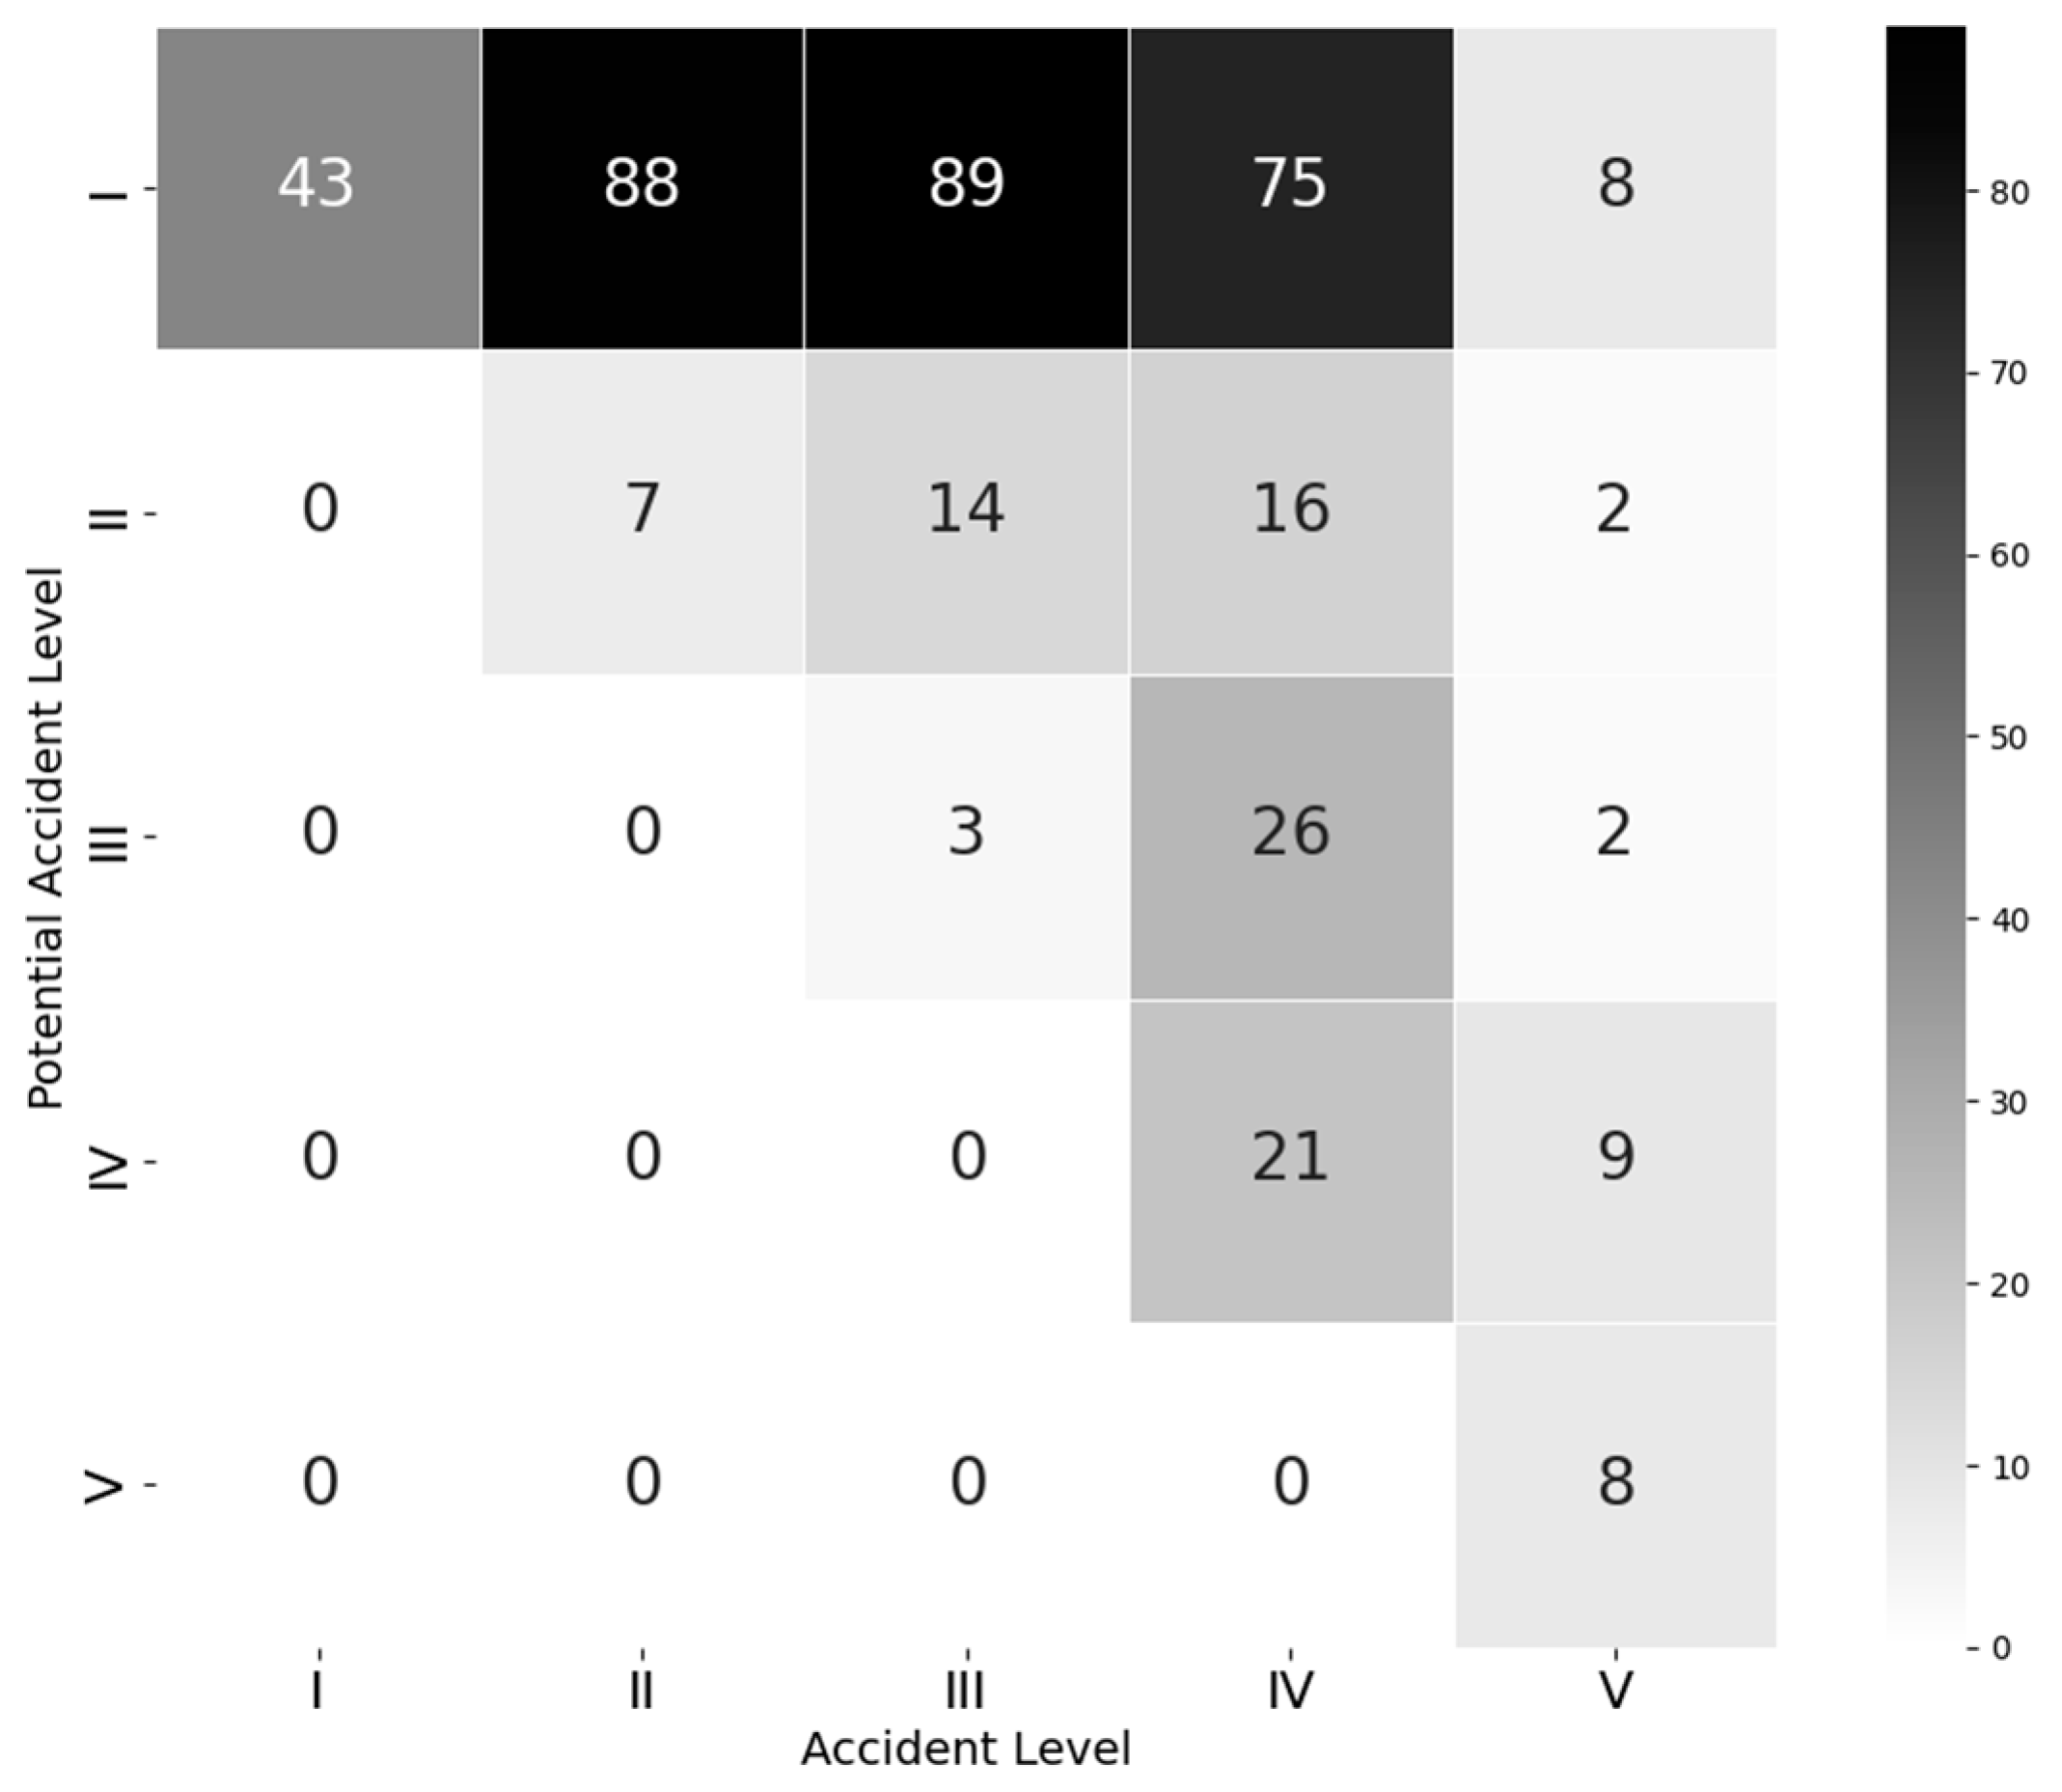
The correlation matrix (Figure 2) shows that there is a moderate correlation between the values of both variables. The highest correlation is between the II and III levels of potential accident with the level I of obvious accident, namely 88 and 89 cases have occurred, respectively.
4.3. Classification Based on Textual Data
Following the initial data processing, the textual records of the emergency are processed (see Figure 1, Block 2). This facilitates the classification of the anthropogenic disaster level based on the descriptions provided by eyewitnesses.
Firstly, according to Figure 1 (Block 4), the text is cleaned, which involves the removal of stop words (see Figure 1, Block 4.1), normalization (see Figure 1, Block 4.3), lemmatization (see Figure 1, Block 4.2), and tokenization of the text (see Figure 1, Block 4.4). The outcomes of this process are shown in Figure 3.
In the next step the N-grams (see Figure 1, Block 5) in relation to industry categories are determined (Table 3). There are many words related to hand and movement, or employees, or their positions.
Then the text is converted into tags subsequently, where the following tags (see Figure 1, Block 7) are used: NN—noun, NNP—proper noun, NNS—plural noun, CD—cardinal digit, DT—determiner, VB—verb, JJ—adjective, RB—adverb, VB—verb, VBD—verb past tense. Among them, the highest count is observed for nouns, with a total of 35 instances.
Following the conversion and tagging of the text, modeling is conducted using machine learning-based classification methods and employing the SMOTE (see Figure 1, Block 9) [34]. Initially, the data is divided into training and test sets. Then the sample is converted into an array, and the training data set is resampled using SMOTE technique.
Applying fast modeling by ensemble machine learning methods with boosting approach and parameters n_estimators = 50, learning_rate = 0.05 we got the following results for classification of textual data (Table 4). As the LGBoost method confirmed the best accuracy (0.99%) we use it for further modeling the test data.
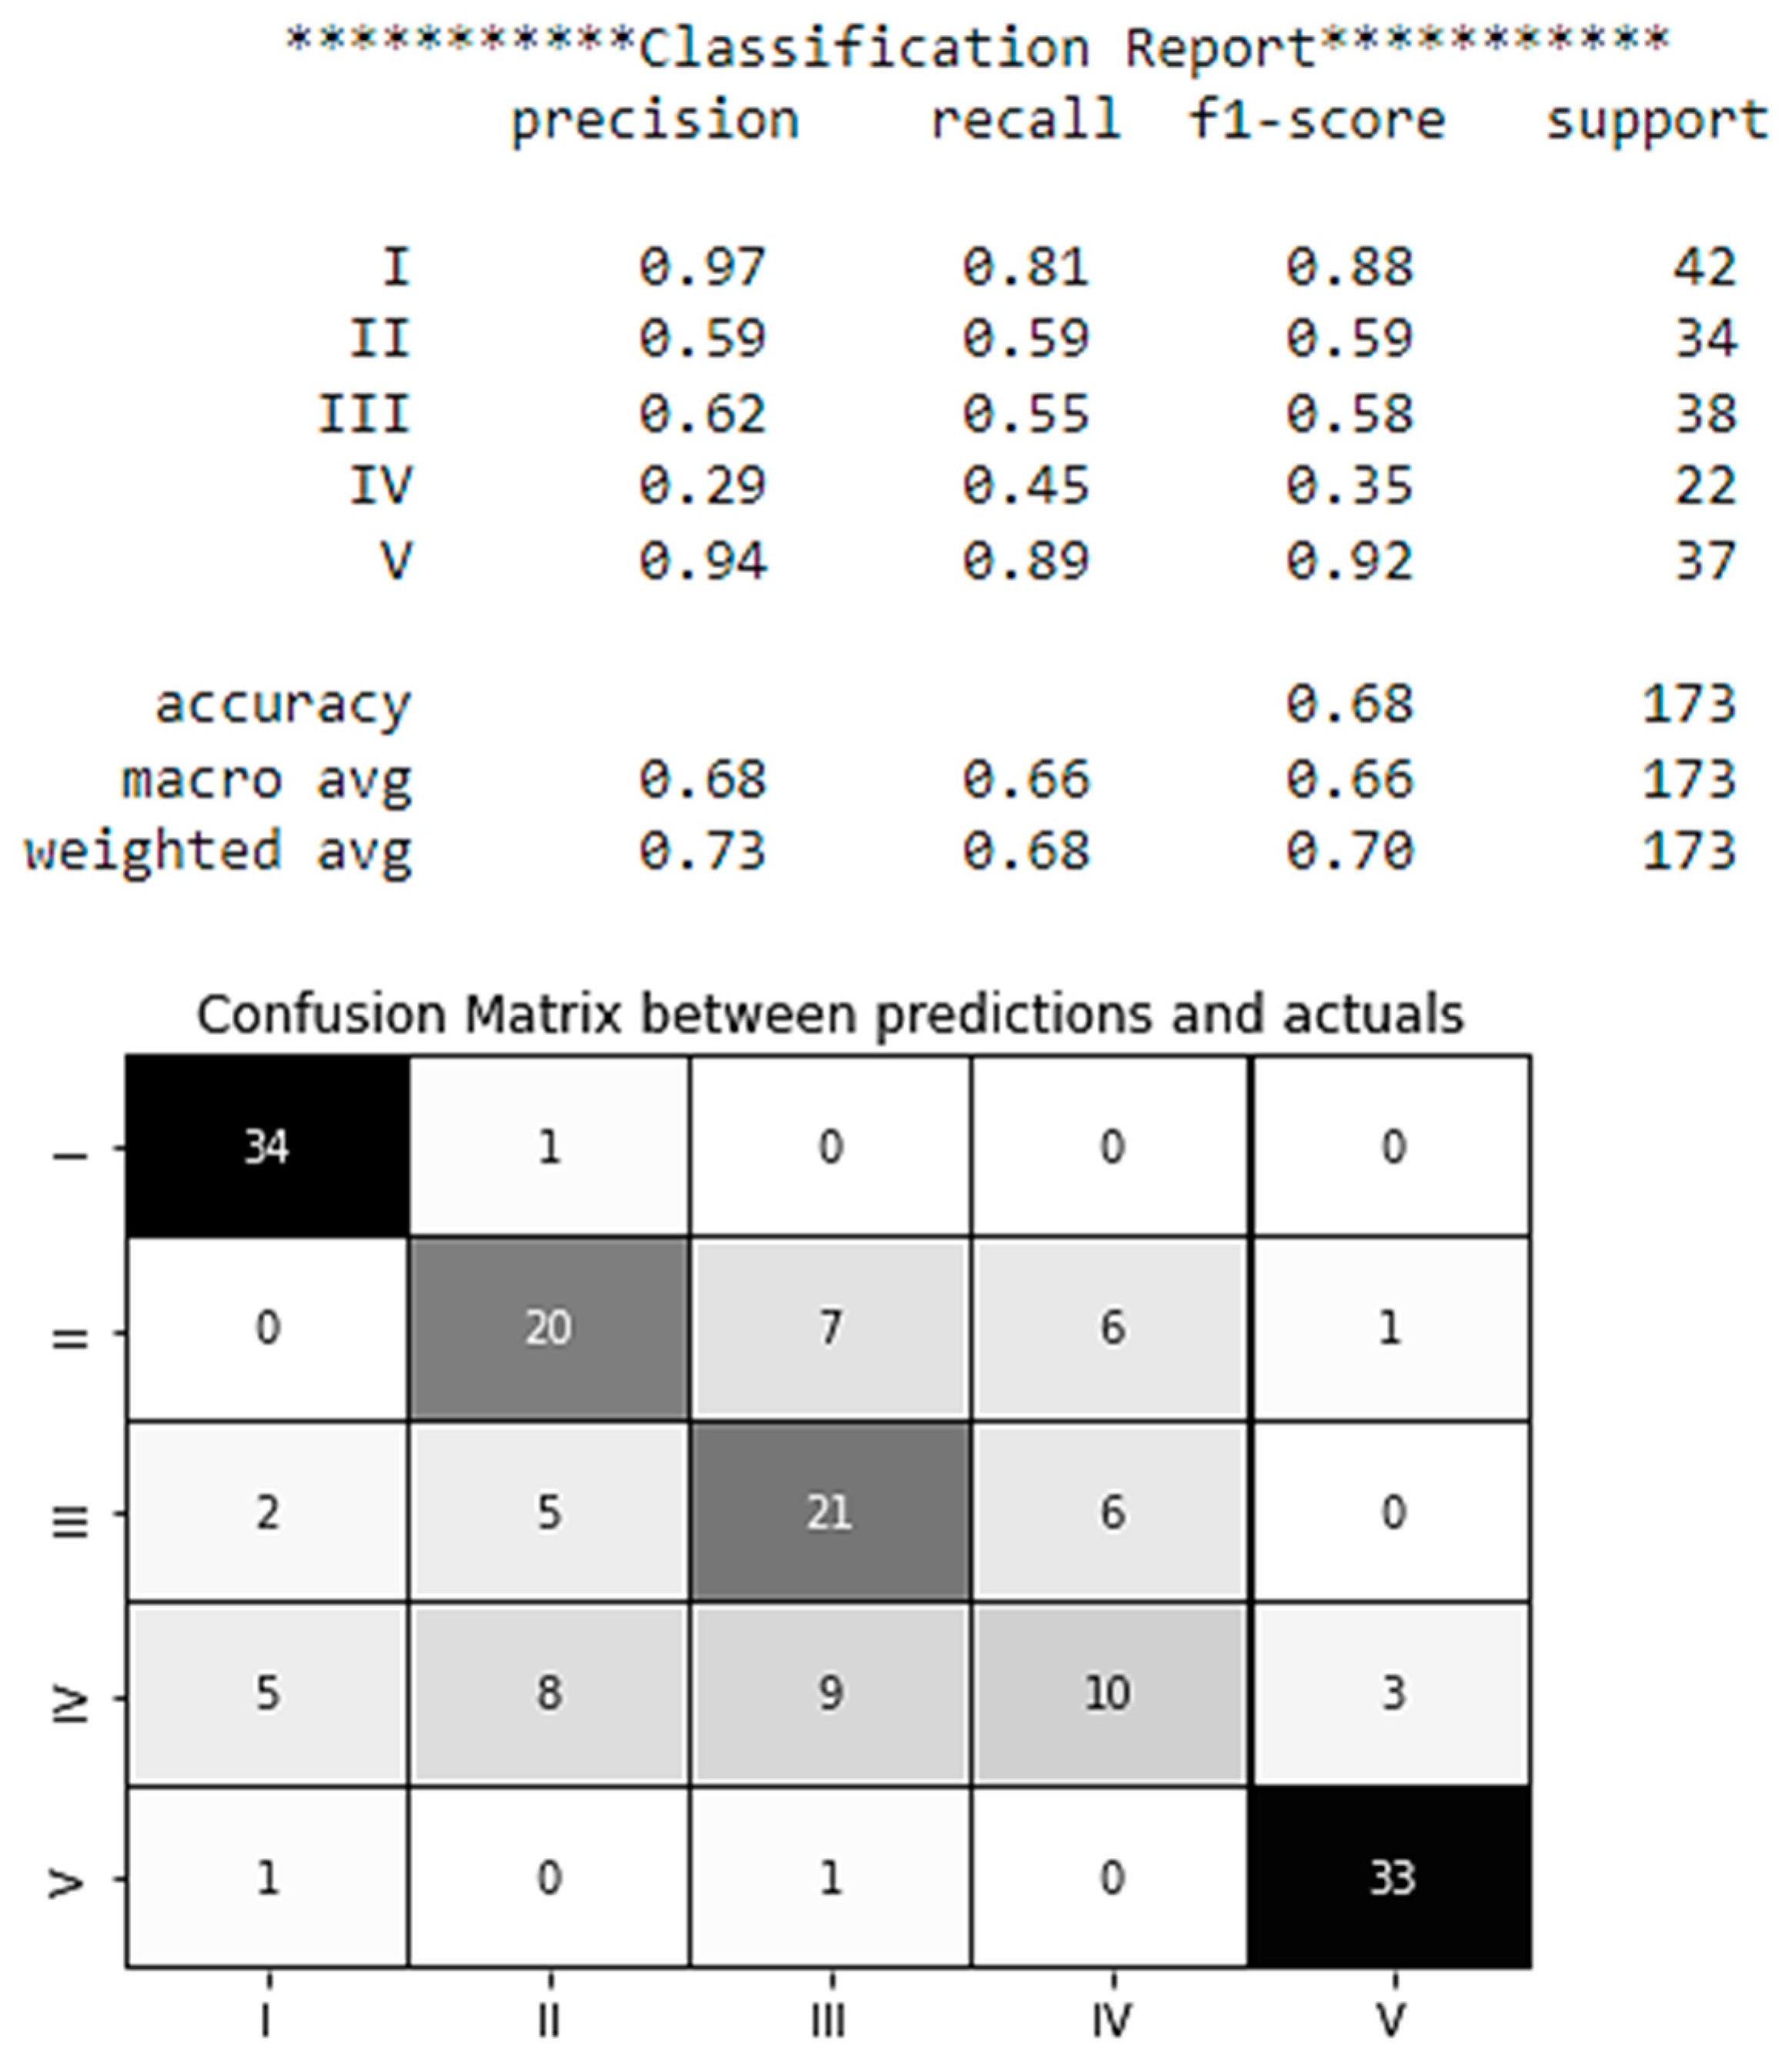
After modeling on the test sample, a report was generated in the form of a Confusion Matrix [35] (Figure 4). As it can be seen from Figure 4, the model demonstrates a high level of accuracy in correctly classifying the majority of test data points. In particular, the model correctly classified 34 values of accident level I out of 173 correctly identified values, and accident level V has classified 33 times correctly.
Moreover, the potential accident levels I and V are better classified with the accuracy of 0.97 and 0.94, respectively (see Figure 4). The average accuracy score of the results is 0.68.
Let’s consider a test example: the accident level relative to the entered text from the test set, with the values Country_02, Local_02, Mining, Accident Level I, Potential Accident Level V, Male, Employee, Others, and the text:
“When performing cleaning with LHD in block F 9970 at level 420, the operator was surprised by a rock block displacement of the side of the gallery, reaching his right leg causing him superficial injury”.
As a result of processing textual data based on the proposed method, the system has correctly predicted the potential level of the accident.
4.4. Classification Based on Quantitative Indicators
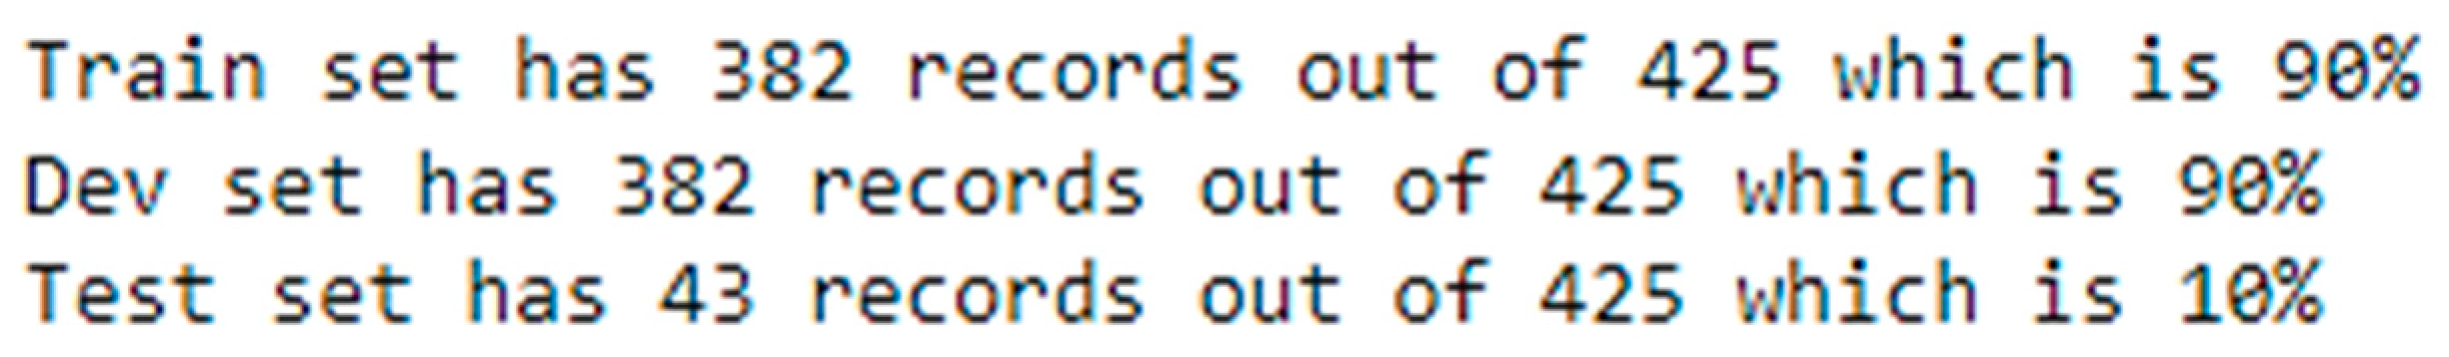
The first step is to convert the data to index values (see Figure 1, Block 13). The data is divided into test and training samples (Figure 5).
As it was argumented above, it’s expedient to use for classification of Potential Accident Level, the following ensemble methods: AdaBoost according to (1), (2), Gradient Boost according to (3)–(5), XGBoost according to (6)–(12), and CatBoost according to (13)–(14). As a result the classification report [36] (see Figure 1 Block 16) is generated per each type of simulation, providing a representation of the key classification metrics per each class. This gives a deeper insight into the behavior of the classifier over global accuracy, which can mask functional deficiencies in one class of a multi-class problem. Visual classification reports are used to compare classification models to select models that are “darker”, have stronger classification performance, or are more balanced.
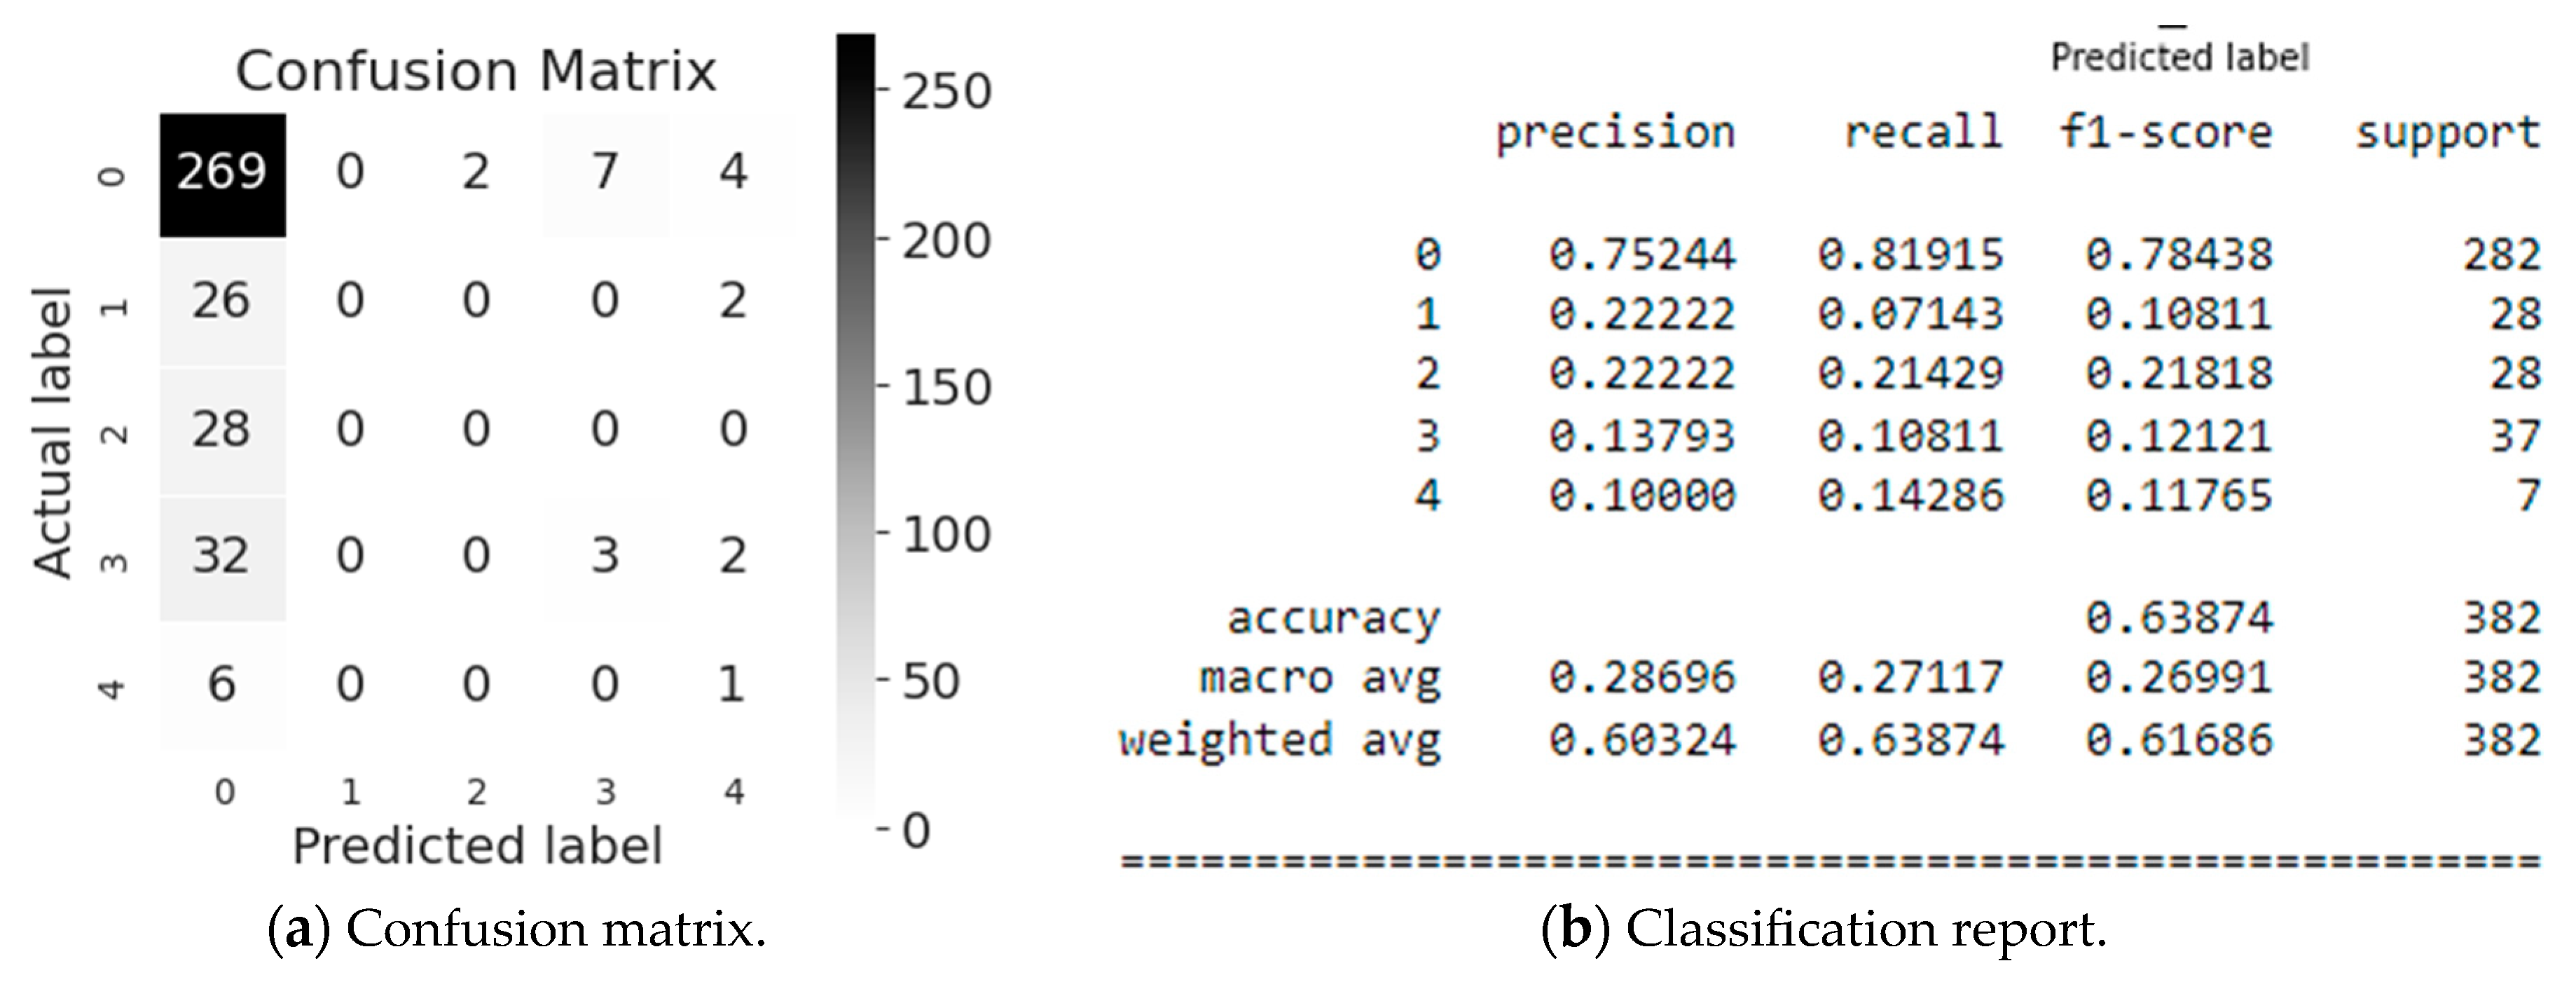
First, let us look at the AdaBoost modeling evaluation (Figure 6). The matrix (Figure 6a) and report (Figure 6b) show that Industry Sector (class 0) is classified most accurately, namely 75%, and the model predicts correctly (82%). This is confirmed by the f1-score (see Figure 6b), which is equal to 0.78 for 282 values referring to the Industry Sector class (class #0). In average, the accuracy of the obtained predicted values for the Potential Accident Level classification equals 64% for a sample of 382 values, which we consider as a low result.
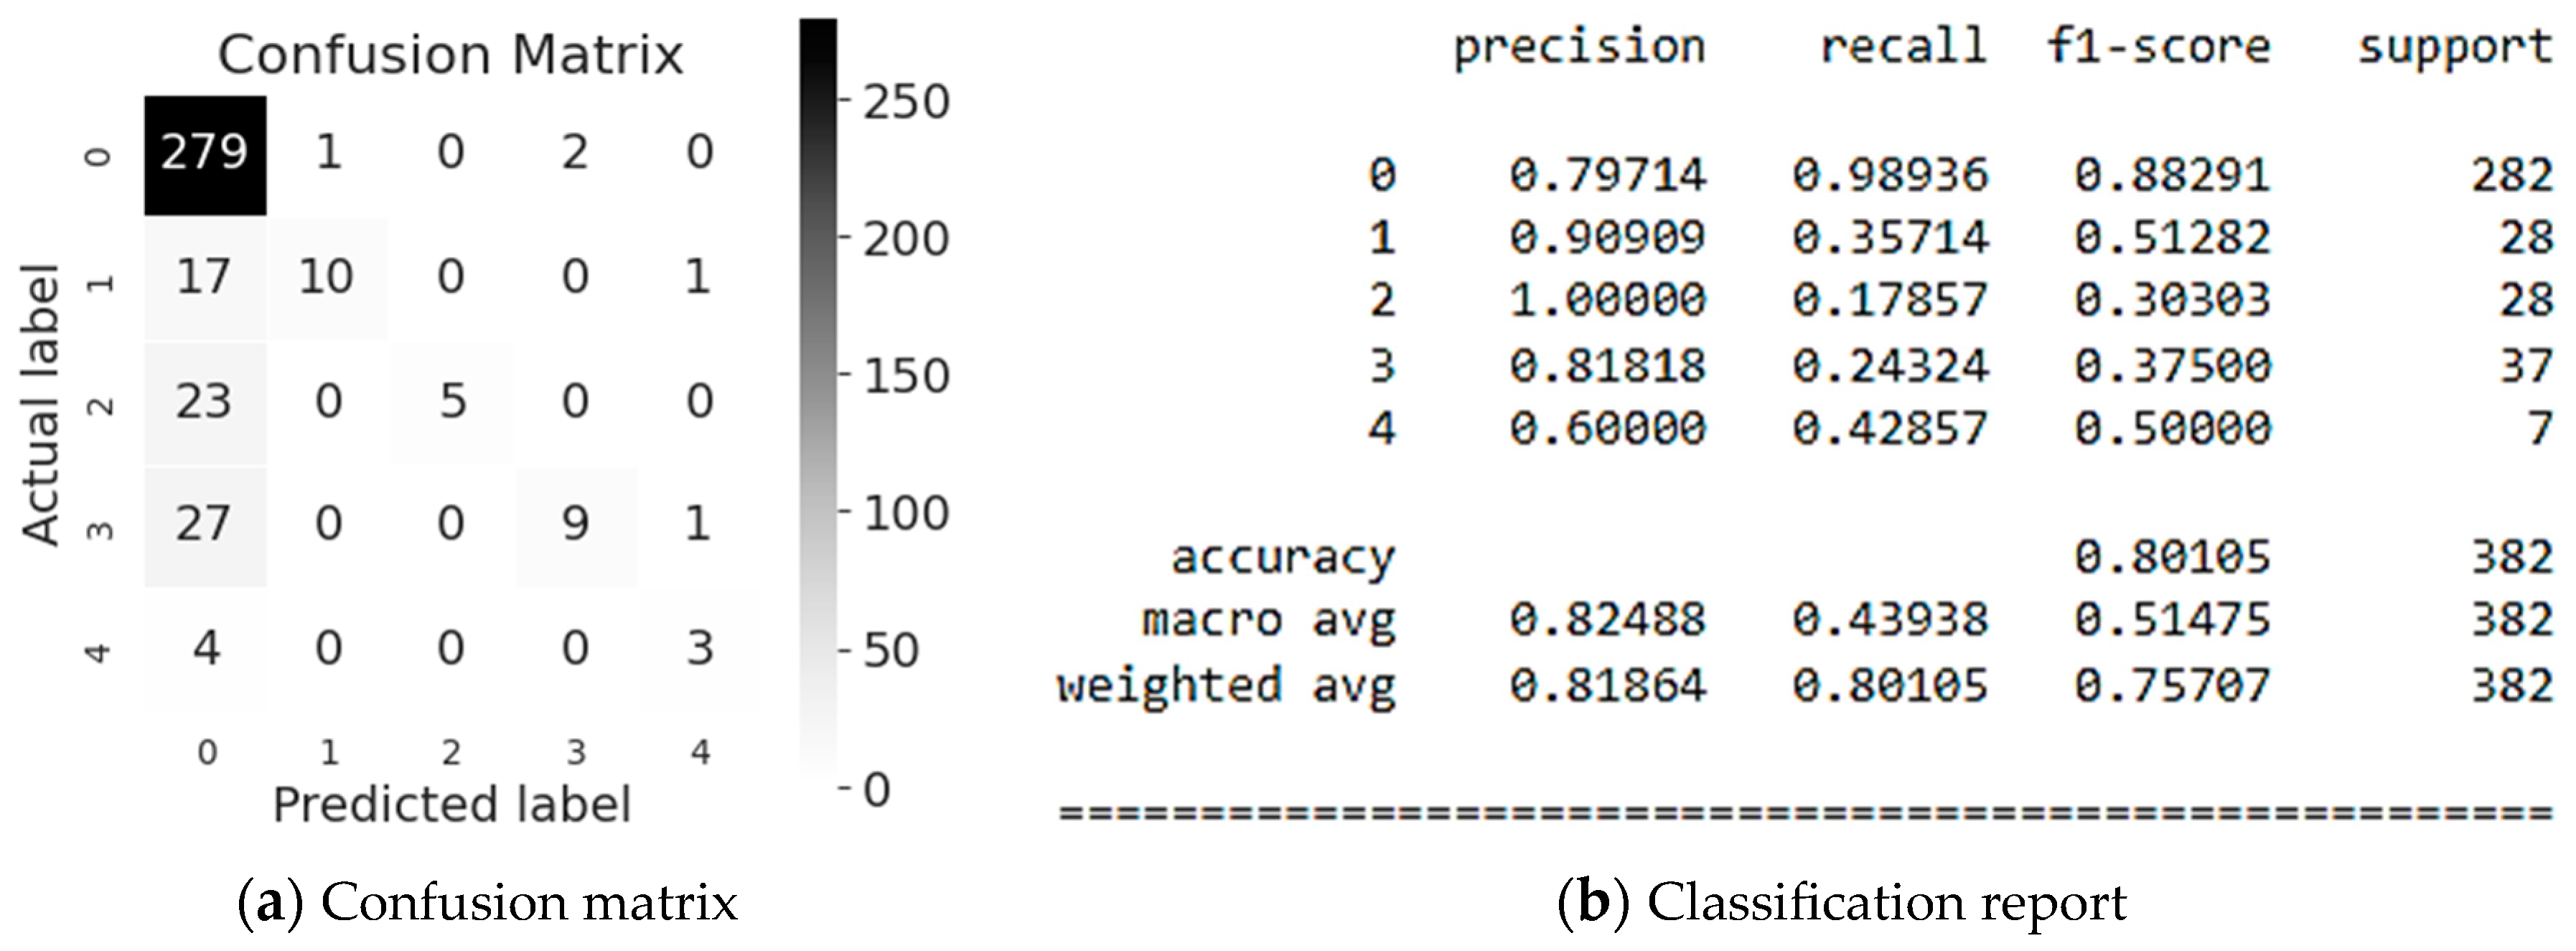
Next, let us evaluate the Gradient Boost modeling (Figure 7). The most accurate classification is Employee or Third Party (class #2), namely 100%. However, the model predicts correctly the 18% of it only. This is confirmed by the f1-score (see Figure 7b), which is 0.30 for 28 values referring to the Employee or Third Party class (class #2), which shows too low accuracy. It is also worth to consider the classification of Industry Sector (class #0), where 80% of the values are recognized, and 99% of which are correctly predicted by the model (see Figure 7b). This is confirmed by the f1-score, which is 0.88 for 282 values, which is a high accuracy. In average, the accuracy of the obtained predicted values of the Potential Accident Level classification is 80%, for a sample of 382 values, which we consider as a good result.
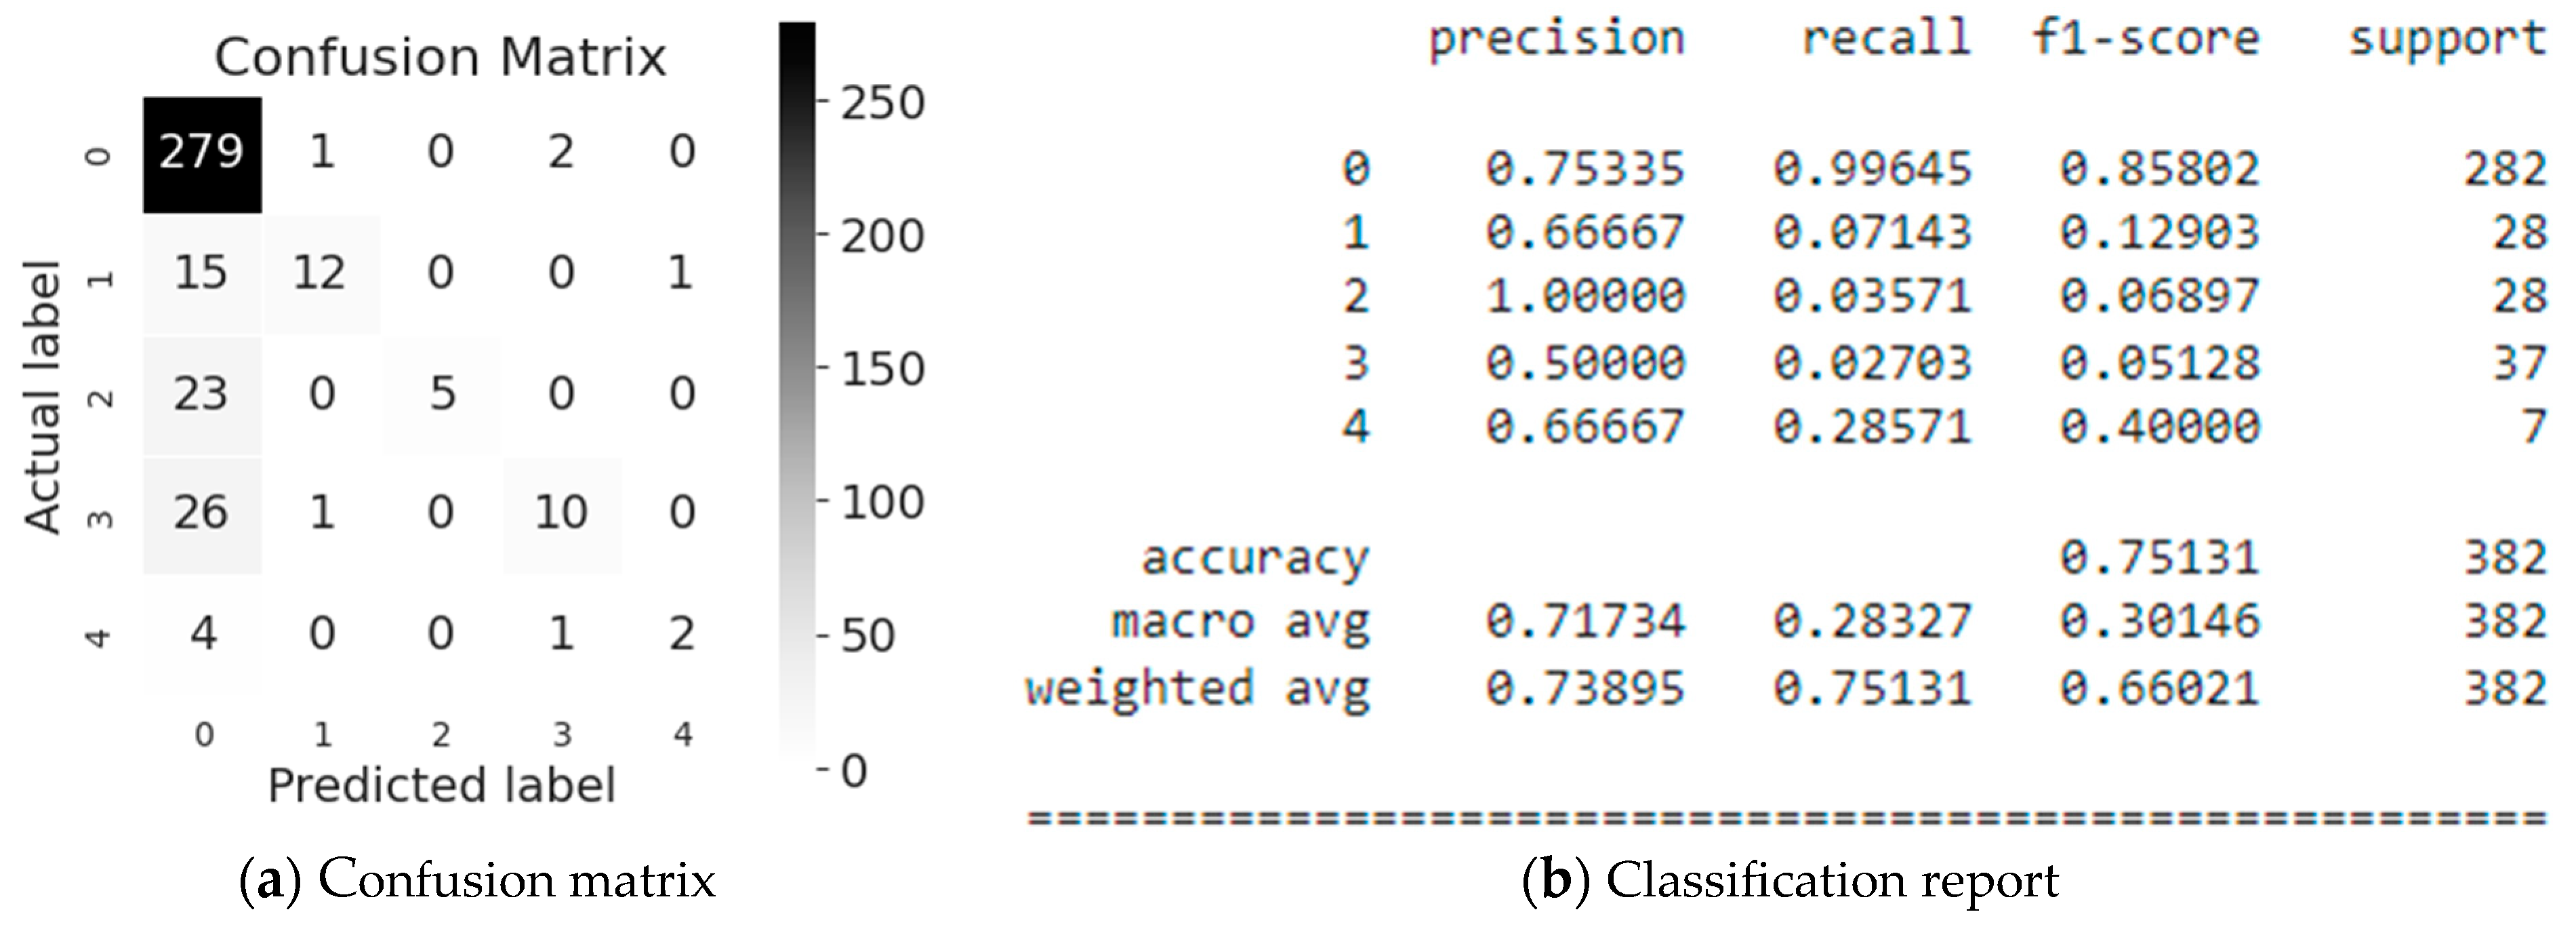
Evaluation results of XGBoost modeling are illustrated in Figure 8. As it can be seen from Figure 8 the Employee or Third Party (class #2) is classified the most accurately, namely 100% of which 4% are correctly predicted by the model. This is confirmed by the f1-score, which is equal to 0.07 for 282 values referring to the Industry Sector class (class #0) (see Figure 8b).
Let us also consider the classification for Industry Sector (class #0), where 75% of the values are recognized, of which 99% are correctly predicted by the model. This is confirmed by the f1-score, which is 0.85 for 282 values (see Figure 8b). In average, the accuracy of the Potential Accident Level classification predictions is 75% for a sample of 382 values.
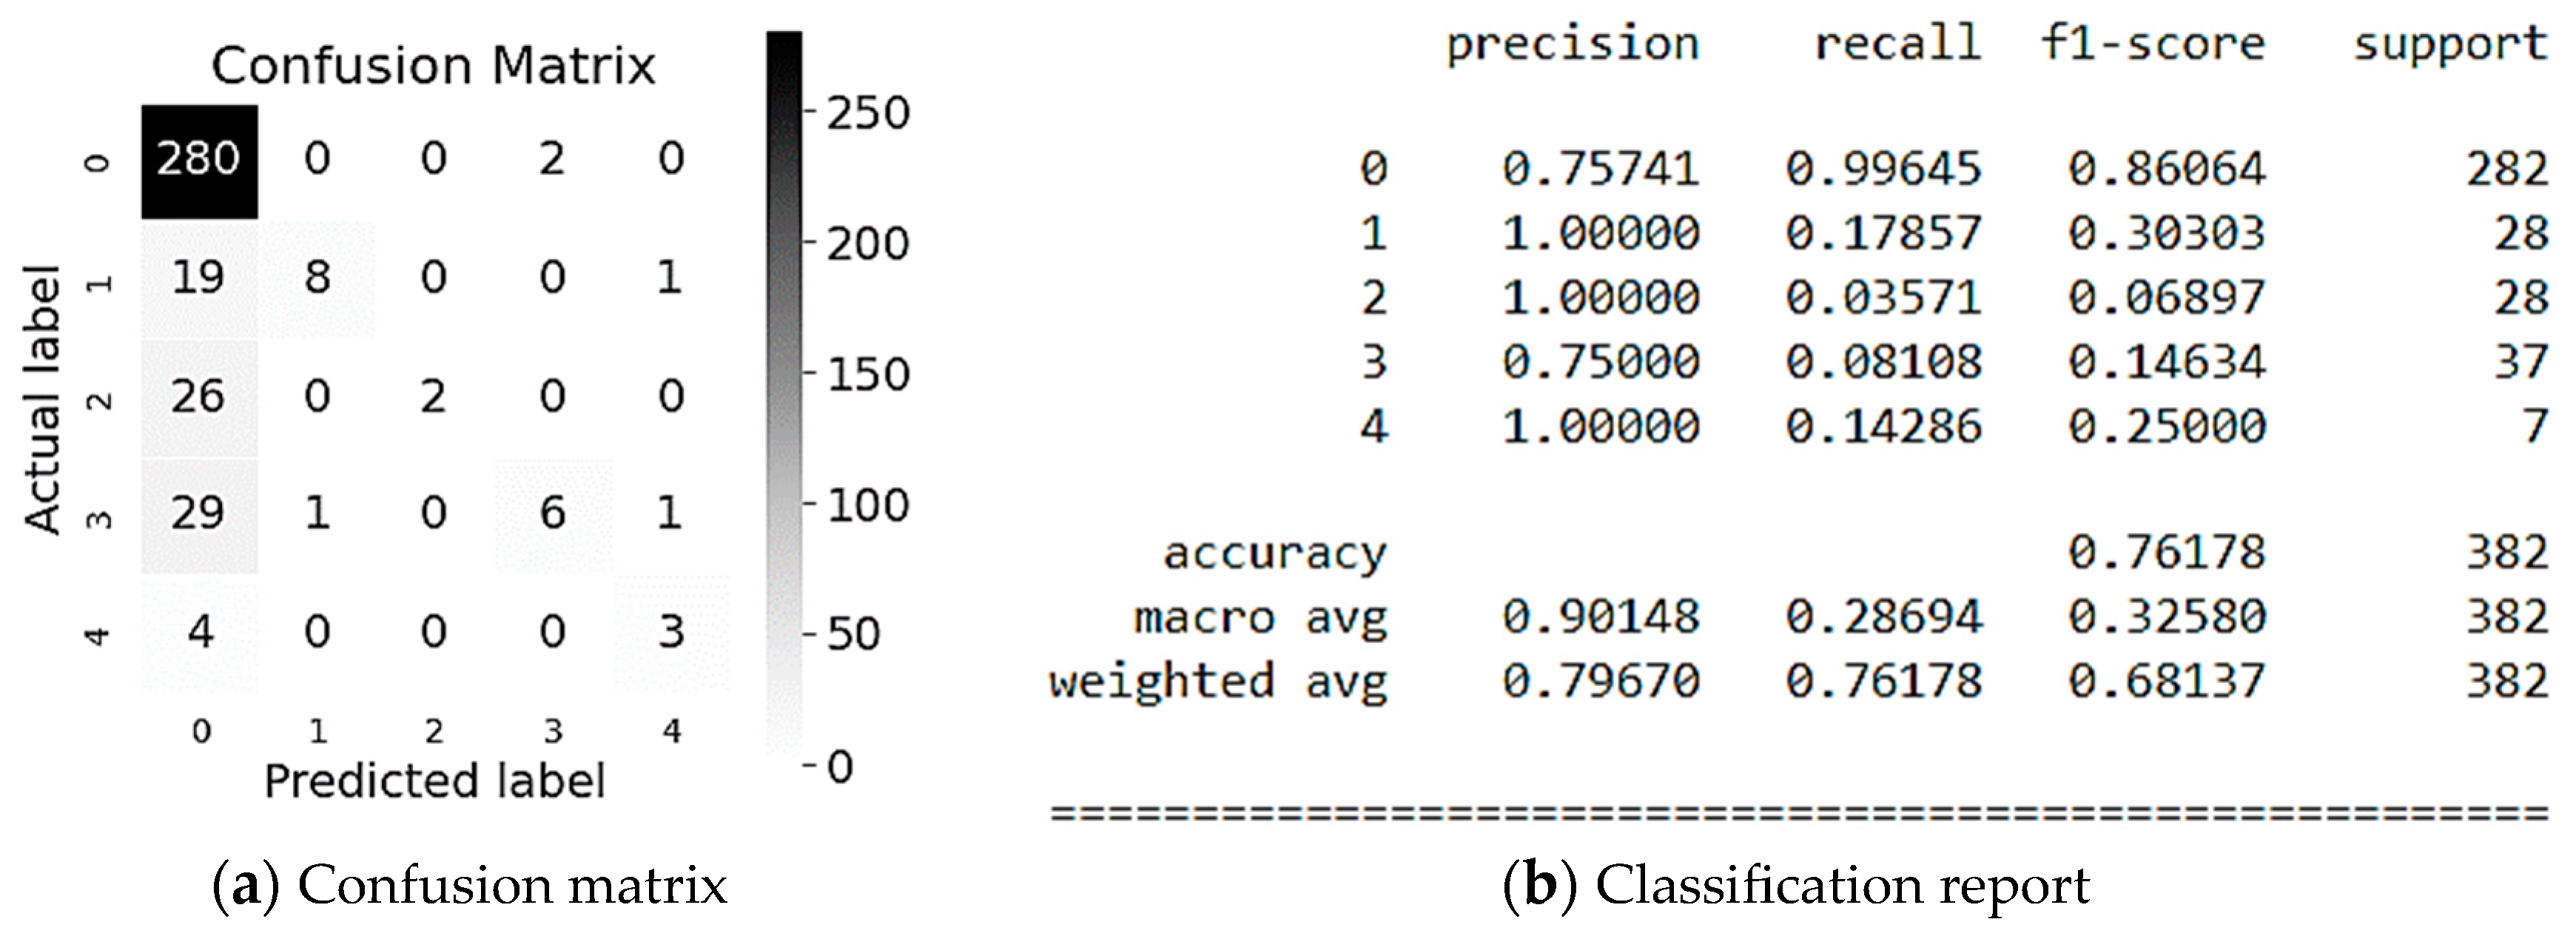
Evaluation results of LigthGBM modeling are illustrated in Figure 9. As it can be seen from Figure 10 the Local (class #1), the Employee or Third Party (class #2), and Genre (class #4) are classified the most accurately, namely, 100% (see Figure 9b). However, only 18%, 4%, and 14%, respectively, are predicted correctly by the model that is confirmed by the f1-score (see Figure 9b). In addition, let us also consider the classification for Industry Sector (class 0), where 76% of the values are recognized, of which 99% are correctly predicted by the model (see Figure 9b). This is confirmed by the f1-score of 0.86 for 282 values (see Figure 9b). In average, the accuracy of the Potential Accident Level classification predictions is 76% for a sample of 382 values, which we consider as the good result.
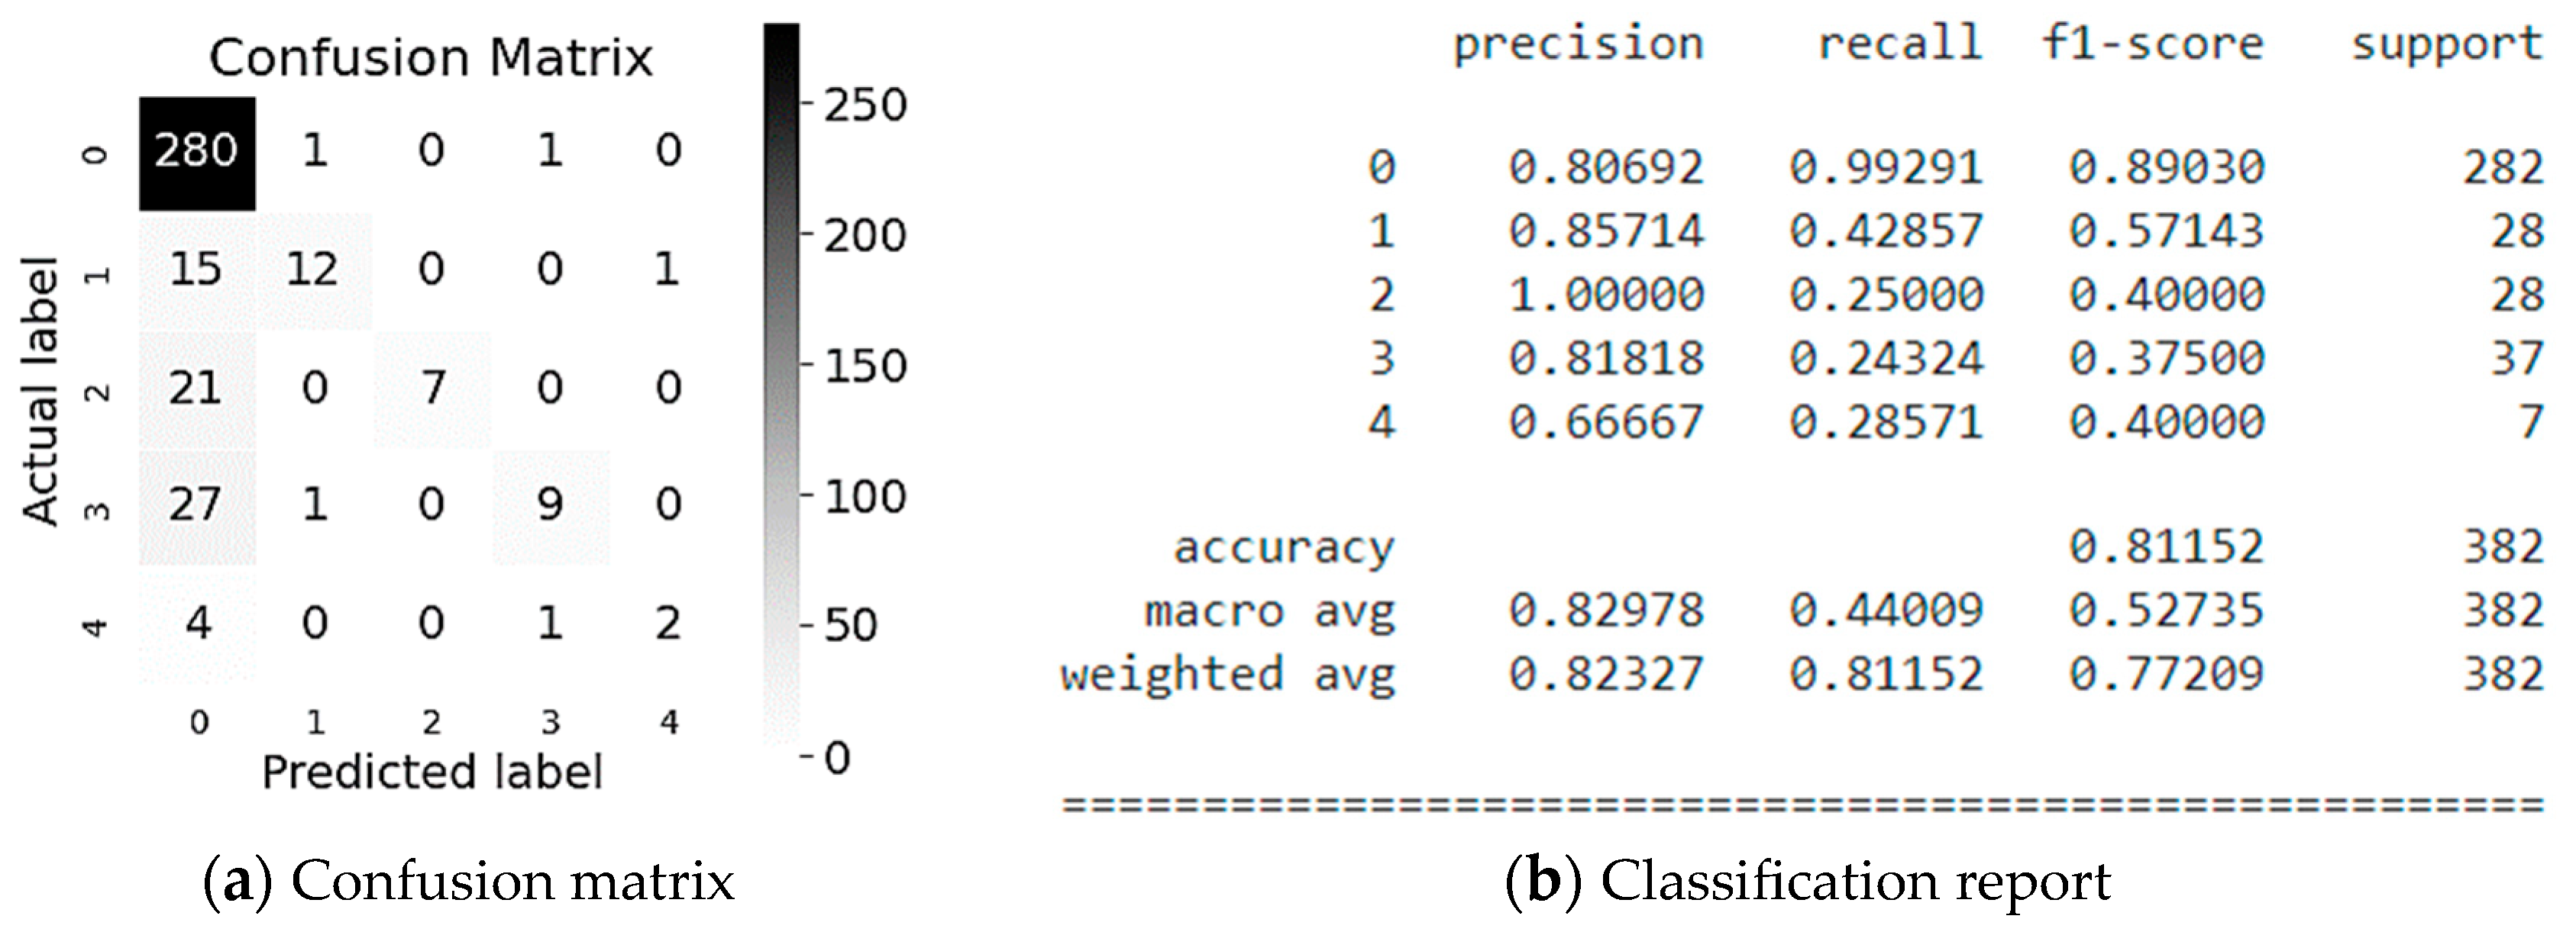
Evaluation results of CatBoost classification method are illustrated in Figure 11. As it can be seen from Figure 11 the Employee or Third Party (class #2) are classified the most accurately is namely 100% of which 25% are correctly predicted by the model (see Figure 11b). This is confirmed by the f1-score, which is equal to 0.40 for 28 values referring to the Employee or Third Party class (class #2) (see Figure 11b). In addition, let’s consider the classification for Industry Sector (class #0), where 80% of the values are recognized, of which 99% are correctly predicted by the model (see Figure 11b). This is confirmed by the f1-score, which is 0.89 for 282 values (see Figure 11b). In average, the accuracy of the Potential Accident Level classification predictions is 81% for a sample of 382 values.
As it can be seen from above the CatBoost method demonstrated the best modeling results for classification and determination of Potential Accident Level. So, it is expedient to employ this method for the test sample below.
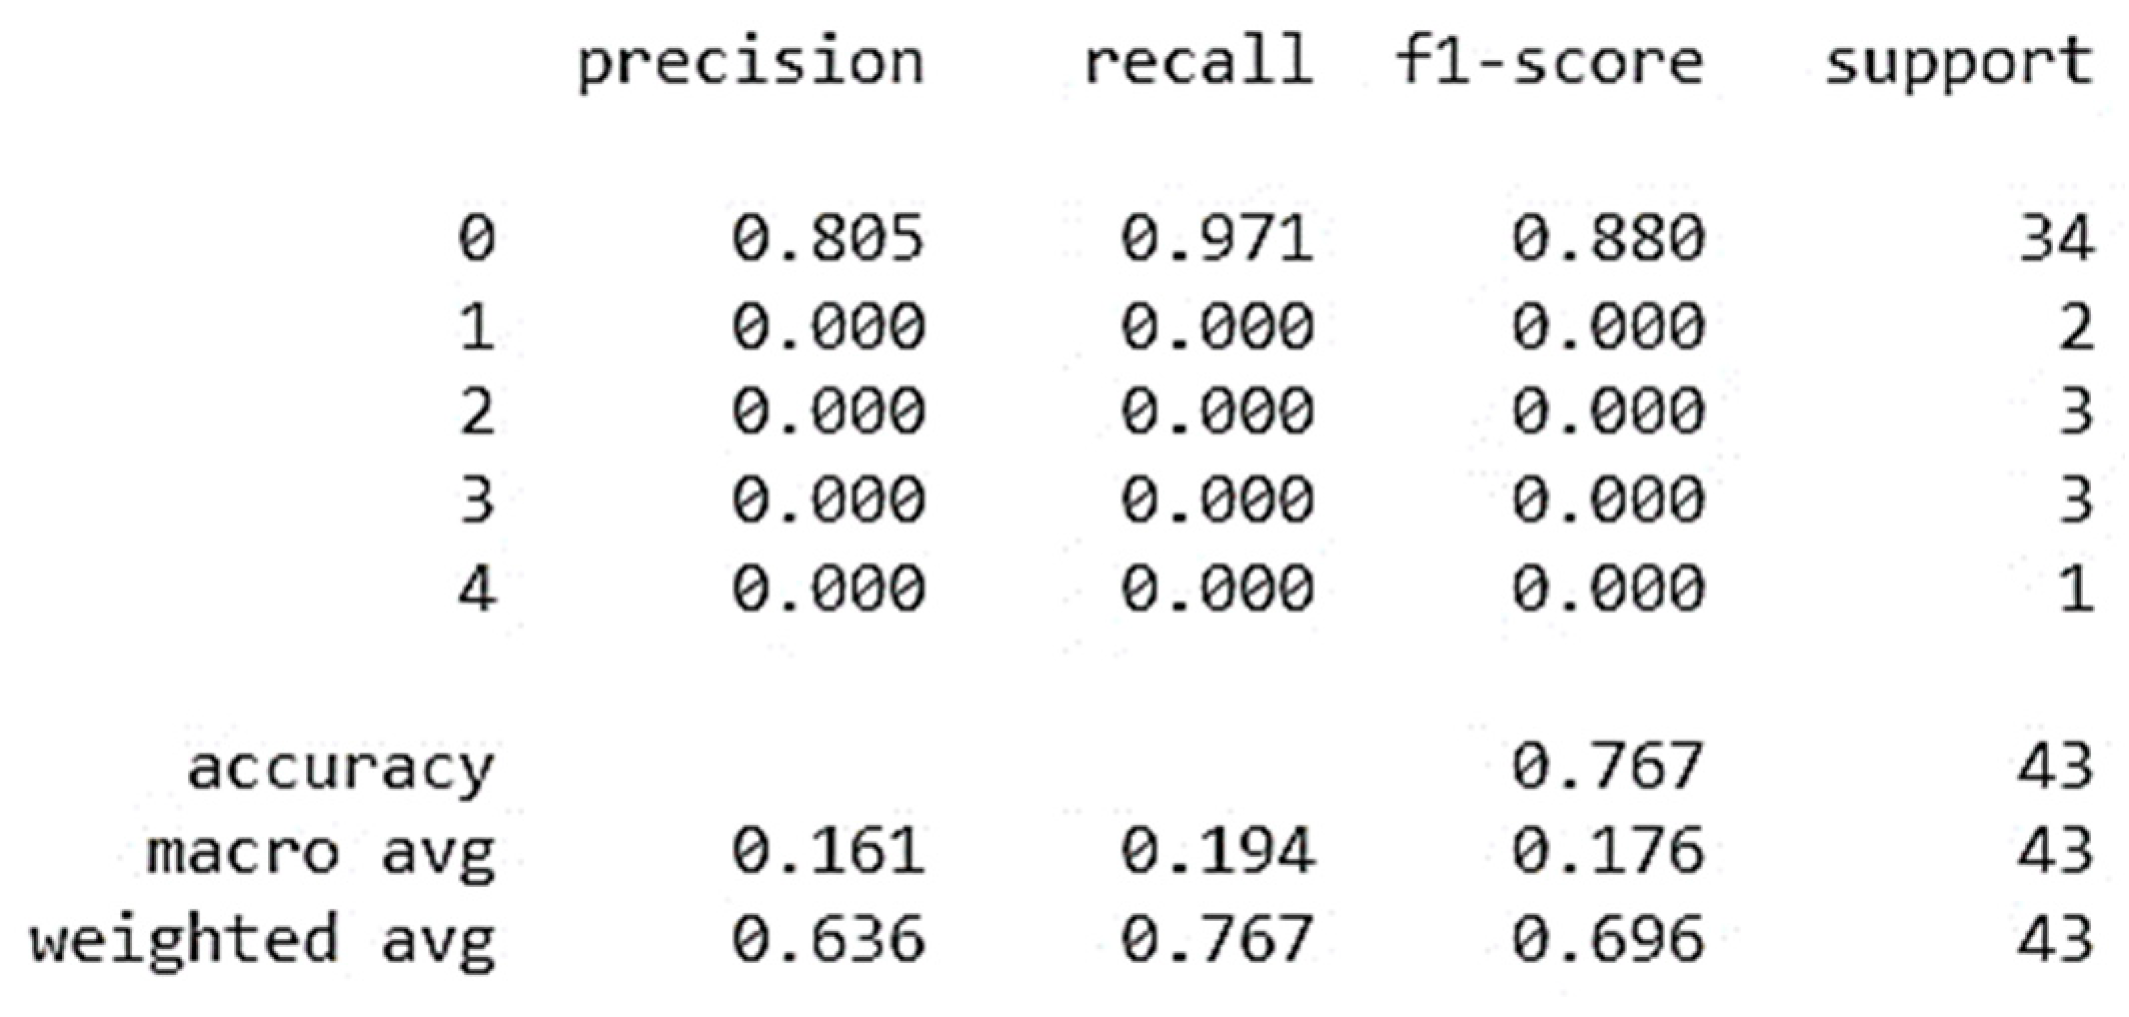
Results of CatBoost simulation on a test sample (data unknown to the system) are shown in Figure 12. As it can be seen from Figure 12 the 80% of values are recognized during the classification of Potential Accident Level in relation to Industry Sector (class #0), and the 97% of them are predicted correctly by the model. The f1-score is 0.88 for 34 values. In average, the accuracy of the Potential Accident Level classification predictions is 77% for a sample of 43 values.
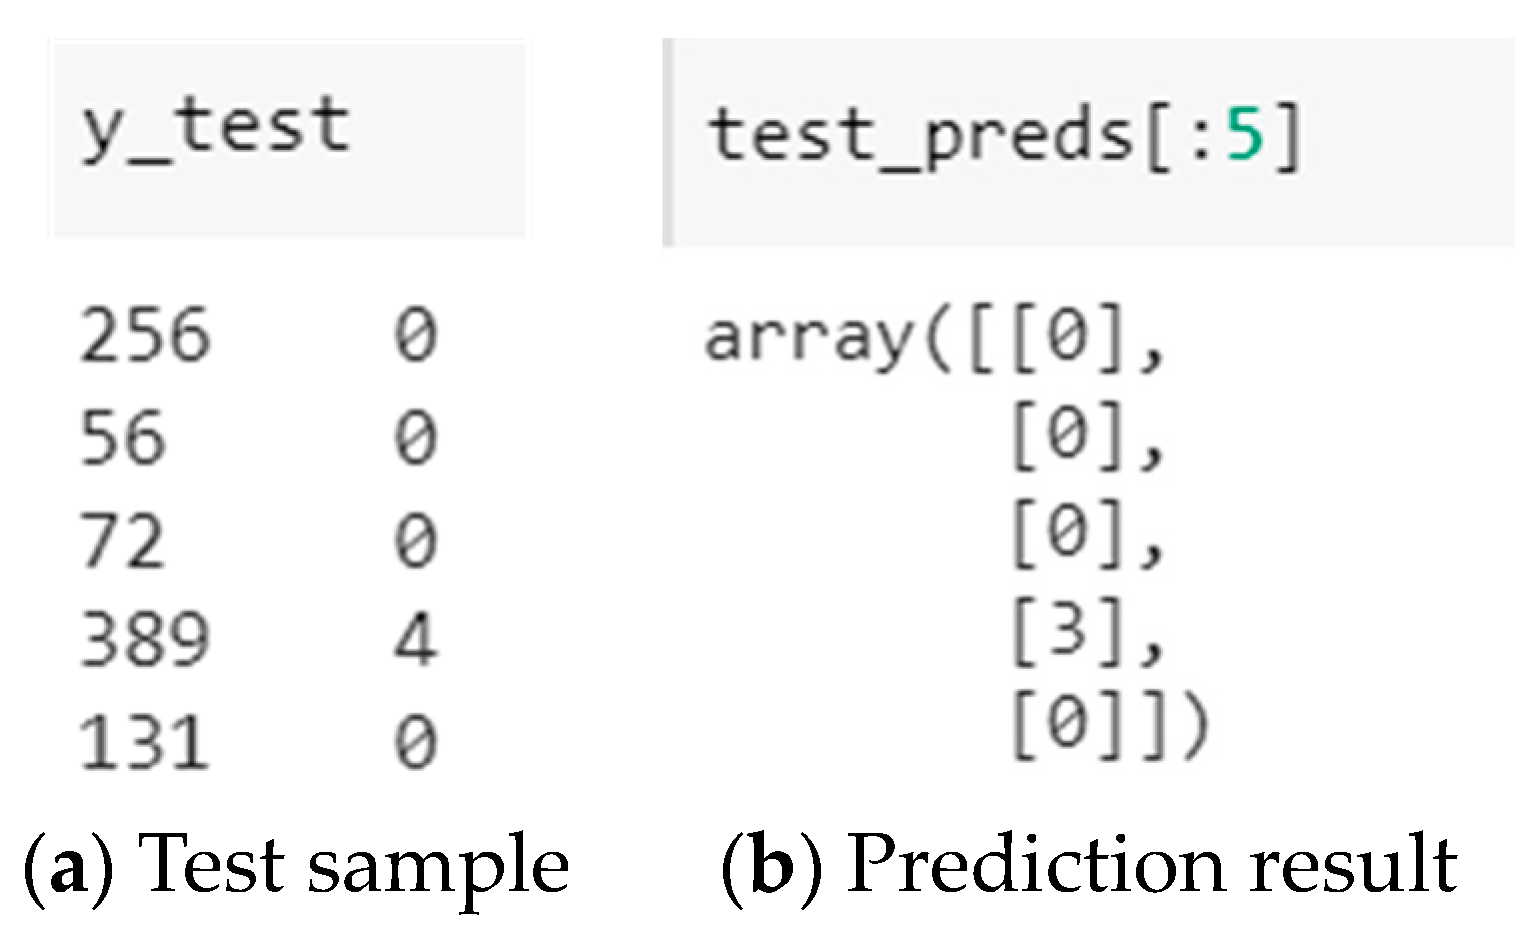
The result of predicting the level of potential accident are illustrated in Figure 13. As it can be seen from Figure 13 the system has predicted the level of potential accident almost correctly for the first 5 lines of the test set (except for line 4). These results demonstrate relatively high.
The accuracy of the system’s predictions demonstrates its effectiveness in determining potential accident levels. The exception in the line 4 signaling the need for further refinement and tuning of the model to ensure more accurate predictions.
5. Mobile Application Architecture
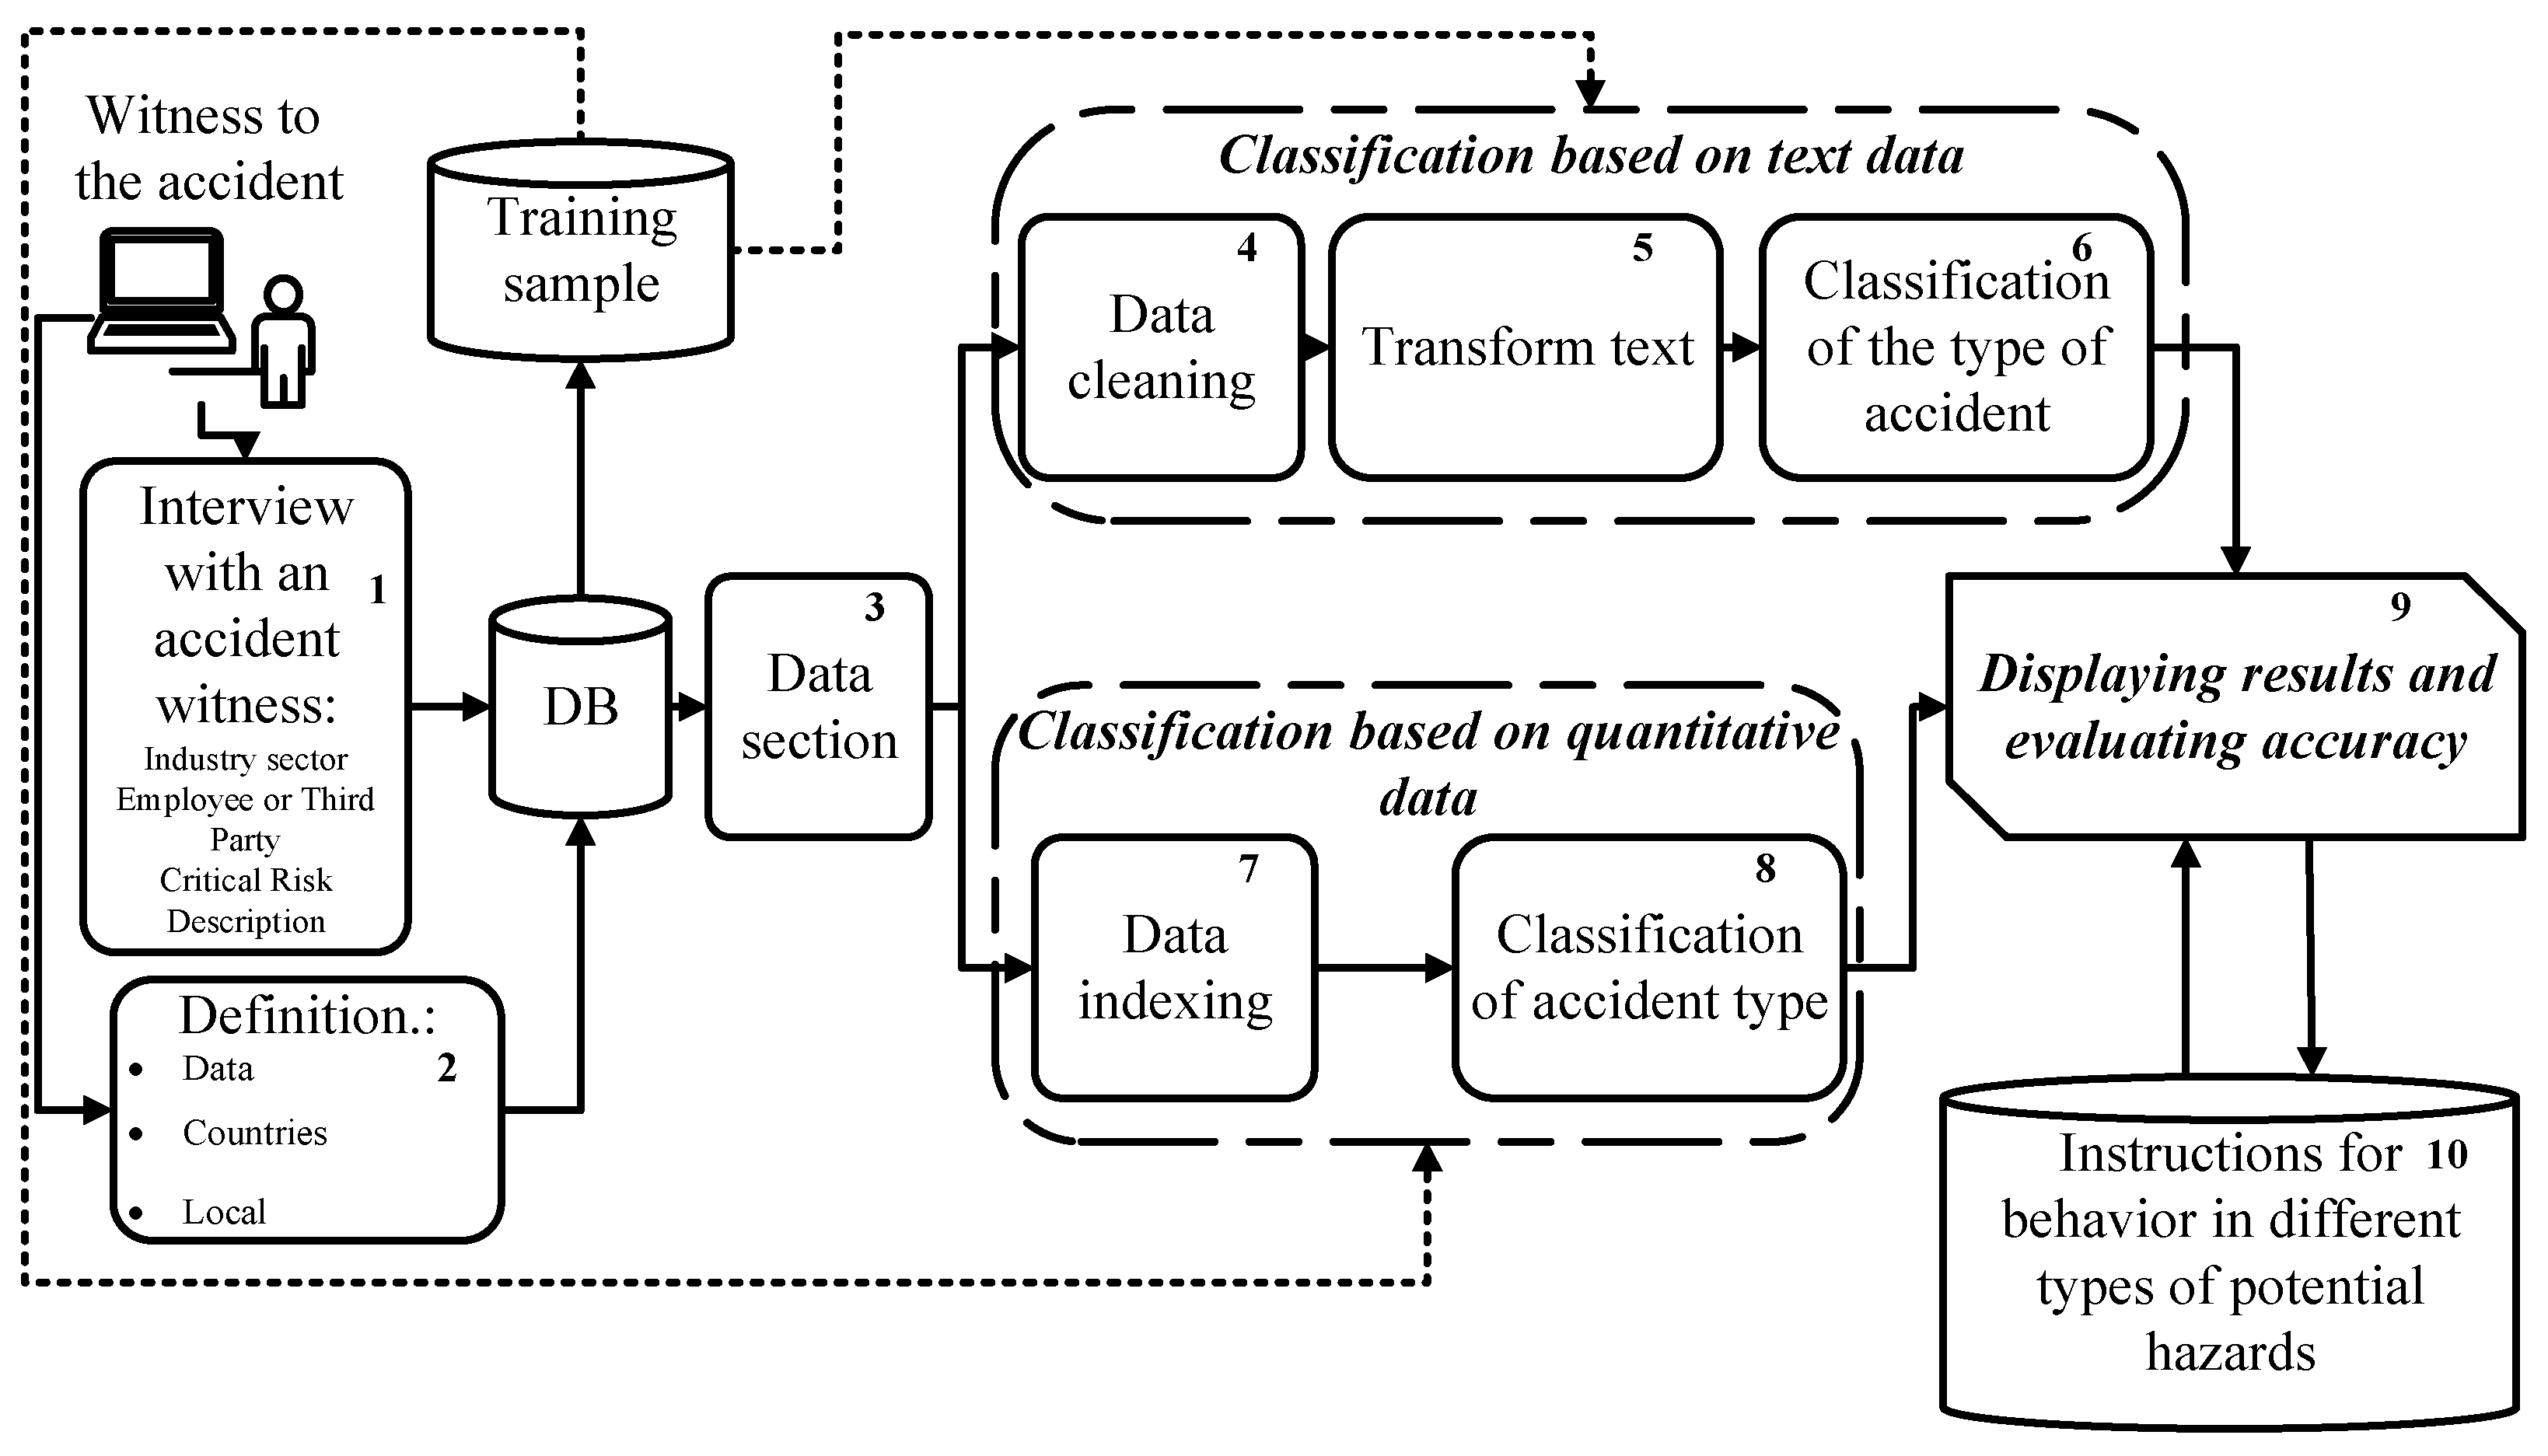
Based on the proposed method, a mobile application architecture (Figure 10) has been developed, which is based on the conceptual structure (see Figure 1) of the intelligent method of classifying anthropogenic disasters. This architecture illustrates the interaction of the application with the user.
The mobile application is designed for accident witnesses and can be a part of a smart city system. At the first stage, the accident witness takes a short survey in which he/she indicates Industry sector, Employee or Third Party, Critical Risk Description (Block 1). In addition, the application determines automatically Data, Countries and Local (Block 2).
Then all the data is transferred to the database and further it is going for retraining the system in the training sample. Next, the data is divided (Block 3) to classify the potential emergency accident, namely, classification based on textual data and classification based on quantitative data. The processing is running in parallel.
For text-based classification, data cleaning (Block 4), text transformation (Block 5), and classification (Block 6) are performed. Then the results are displayed (Step 9).
When classifying the quantitative data, the values are indexed (Block 7) and the classification of level for the potential accident is displayed (Block 9).
Information about precautionary measures and user behavior in a given situation can be displayed too. That information is displayed based on the level indicator of the potential accident (Block 9).
In general, the application provides automating the process of determining the potential level of anthropogenic disasters based on the analysis of textual data and quantitative indicators. In particular, by applying machine learning and text classification methods, it is possible to determine effectively the accident category based on the description of the situation. However, it is important to understand that the application cannot replace professional experts who have the experience and knowledge to determine the level of accident in a particular situation. In addition, other factors/event that are not taken into account in the application, may affect the level of accident in specific circumstances.
Figure 14 illustrates the process of entering the input data. This process is based on prior data analysis and predicting potential accidents. Initially, the user’s geolocation is determined (see Figure 14a), which allows identifying the geographical coordinates of the location of the anthropogenic disaster. Then the user inputs a voice description of the situation, selects the industry where the accident occurred, and indicates their relationship to the event site (whether they are an employee or a third party) (see Figure 14b). All this data is used to determine the probability of an anthropogenic disaster occurrence.
Based on the data input by the user, information about the level of potential accident is generated and displayed. This information can prompt the emergency services to quickly (in real-time) assess the situation, plan their actions, and prepare to respond to the accident while en route to the scene.
Thus, the system analyzes the situation and predicts the potential level of accident. This ensures a timely and efficient response to emergencies, reducing time costs.
The authors have conducted a comparative analysis of the main methods-analogs for detecting parameters of crisis events (Table 5). As it can seen from Table 5, the proposed intelligent method has a slightly lower accuracy with textual data (76%). However, it provides an accuracy assessment of 81% with quantitative data which is absent in [16,17]. Moreover, the developed method provides a comprehensive analysis as it considers both textual and quantitative data. Another advantage of the proposed method is the ability to operate virtually in real time.
Thus, the authors’ contribution, and the work as a whole, is a new approach for assessing consequences of anthropogenic disasters in a real time by the boosting ensemble methods of machine learning and predicting the potential level of accident.
6. Discussion
The proposed intelligent method for classifying the level of anthropogenic disasters and its implementation showed promising results in accurately predicting the level of potential accidents. The CatBoost method proved to be the most effective method for solving this task, as it achieved a high level of accuracy in classifying the level of potential accidents.
Test results on an unknown dataset showed that the model was able to correctly classify most of the test data points. The plurality matrix demonstrated that the model was able to accurately classify potential accident levels V and I with accuracy rates of 0.97 and 0.94, respectively. The overall average accuracy of the results was 0.68, indicating that there is still a room for improvement.
The proposed approach significantly differs from analogues [16,17]. Firstly, it considers both textual and quantitative data in detecting crisis events. Secondly, analogues [16,17] work with messages on Twitter that may be published by people who are not direct eyewitnesses to the situation. The developed intelligent method provides a rapid response to accidents in real-time. This could prevent probably the humanitarian and economic disasters and reduce their impact.
The authors realize the proposed approach has a slightly lower accuracy for textual data (76%) in comparison with analogues However, on the other hand, the presence of an evaluation for quantitative data with accuracy of 81% (which the analogues lack) offsets this shortcoming practically.
Moreover, the authors plan to conduct further research to develop a complex approach that can take into account other influencing factors during the classification of the level of disaster risk. Future research will focus on improving the method through three main approaches. The first approache is integrating data from sensors, which can provide vital information about potential threats depending on the industrial sector. The second one is expanding the scope of the method, including more industrial sectors and geographic regions, which allows testing the universality of the model. The third one is optimizing the method through hyperparameter tuning, using different machine learning algorithms, or ensemble methods. It is expected that these approaches will help to create a more accurate model for identifying potential anthropogenic disasters.
In general, the proposed intelligent method is a valuable contribution to the field of anthropogenic disaster management, as it provides a reliable and accurate way to predict the level of potential accidents. With further development and refinement, this method has the potential to save lives and prevent significant damage to the environment and infrastructure.
7. Conclusions
To automate the identification of potential accidents, and thus speed up the response of emergency services and people in the area of the threat, a mobile application has been developed that implements an intelligent method for classifying the level of anthropogenic disasters. To implement the method, records of disasters at 12 different enterprises in 3 different countries were used as input data. The correlation shows that there is a moderate correlation between the values of both variables. The highest correlation between the second and third level of potential accident with the first level of obvious accident, namely 88 and 89 cases occurred respectively. The accuracy results based on textual data show that the best classification of potential level V and level I of non-safety is achieved with an accuracy of 0.97 and 0.94, respectively. The average accuracy score of the obtained results is 0.68.
The evaluation of the modeling for quantitative data showed the following results. Classification of Potential Accident Level in relation to Industry Sector (class #0), where 80% of values are recognized, of which 97% are correctly predicted by the model. The f1-score is 0.88 for 34 values, which is a fairly high accuracy. On average, the accuracy of the obtained predicted values of the Potential Accident Level classification is 77% for a sample of 43 values, which is a good result.
It’s especially important that the proposed method works with real disaster data, unlike analogues, which ensures its practical significance and direct application under real conditions.
Overall, the authors’ contribution, and the work as a whole, is a new approach for assessing consequences of anthropogenic disasters in a real time by the boosting ensemble methods of machine learning and predicting the potential level of accident. In addition, this work makes an important contribution to the development of technologies that help solve significant social problems, specifically, the creation of a real-time operating system for identifying potential anthropogenic threats.
In the future, the authors are going to investigate way for improving the method and develop a complex approach, taking into account various influencing factors: weather conditions, precision sensor data [37] and the possibility of expanding the scope of the method.
Author Contributions
Conceptualization, K.L.-H.; methodology, K.L.-H.; software, K.L.-H. and I.K.; validation, I.K., D.Z., A.S. and C.W.; formal analysis, A.S.; investigation, K.L.-H.; resources, C.W.; writing—original draft preparation, K.L.-H. and D.Z.; writing—review and editing, A.S. and C.W.; visualization, I.K.; supervision, A.S. and C.W.; project administration, A.S. and C.W.; funding acquisition, C.W. All authors have read and agreed to the published version of the manuscript.
Funding
This research received no external funding.
Data Availability Statement
No new data were created.
Conflicts of Interest
The authors declare no conflict of interest.
References
- Sirola, M.; Hulsund, J.E. Machine-Learning Methods in Prognosis of Ageing Phenomena in Nuclear Power Plant Components. Int. J. Comput. 2021, 20, 11–21. [Google Scholar] [CrossRef]
- Luna, S.; Pennock, M.J. Social media applications and emergency management: A literature review and research agenda. Int. J. Disaster Risk Reduct. 2018, 28, 565–577. [Google Scholar] [CrossRef]
- Sun, W.; Bocchini, P.; Davison, B.D. Applications of artificial intelligence for disaster management. Nat. Hazards 2020, 103, 2631–2689. [Google Scholar] [CrossRef]
- Costa, D.G.; Vasques, F.; Portugal, P.; Aguiar, A. A Distributed Multi-Tier Emergency Alerting System Exploiting Sensors-Based Event Detection to Support Smart City Applications. Sensors 2019, 20, 170. [Google Scholar] [CrossRef]
- Bhoi, A.; Pujari, S.P.; Balabantaray, R.C. A deep learning-based social media text analysis framework for disaster resource management. Soc. Netw. Anal. Min. 2020, 10, 78. [Google Scholar] [CrossRef]
- Cao, L. AI and data science for smart emergency, crisis and disaster resilience. Int. J. Data Sci. Anal. 2023, 15, 231–246. [Google Scholar] [CrossRef]
- Gopnarayan, A.; Deshpande, S. Tweets Analysis for Disaster Management: Preparedness, Emergency Response, Impact, and Recovery. In Innovative Data Communication Technologies and Application. ICIDCA 2019; Raj, J., Bashar, A., Ramson, S., Eds.; Lecture Notes on Data Engineering and Communications Technologies; Springer: Cham, Switzerland, 2020; Volume 46, pp. 760–764. [Google Scholar] [CrossRef]
- Munawar, H.S.; Qayyum, S.; Ullah, F.; Sepasgozar, S. Big Data and Its Applications in Smart Real Estate and the Disaster Management Life Cycle: A Systematic Analysis. Big Data Cogn. Comput. 2020, 4, 4. [Google Scholar] [CrossRef]
- Madichetty, S.; Sridevi, M. A Neural-Based Approach for Detecting the Situational Information From Twitter During Disaster. IEEE Trans. Comput. Soc. Syst. 2021, 8, 870–880. [Google Scholar] [CrossRef]
- Francis, N.; Suhaimi, H.; Abas, E. Classification of Sprain and Non-sprain Motion using Deep Learning Neural Networks for Ankle Sprain Prevention. Int. J. Comput. 2023, 22, 159–169. [Google Scholar] [CrossRef]
- Linardos, V.; Drakaki, M.; Tzionas, P.; Karnavas, Y.L. Machine Learning in Disaster Management: Recent Developments in Methods and Applications. Mach. Learn. Knowl. Extr. 2022, 4, 446–473. [Google Scholar] [CrossRef]
- Kanojia, D.; Kumar, V.; Ramamritham, K. Civique: Using Social Media to Detect Urban Emergencies. arXiv 2016, arXiv:1610.04377. [Google Scholar] [CrossRef]
- Zheng, Z.; Zhong, Y.; Wang, J.; Ma, A.; Zhang, L. Building damage assessment for rapid disaster response with a deep object-based semantic change detection framework: From natural disasters to anthropogenic disasters. Remote Sens. Environ. 2021, 265, 112636. [Google Scholar] [CrossRef]
- Bandyopadhyay, M.; Singh, V. Development of agent based model for predicting emergency response time. Perspect. Sci. 2016, 8, 138–141. [Google Scholar] [CrossRef]
- Avvenuti, M.; Cimino, M.G.C.A.; Cresci, S.; Marchetti, A.; Tesconi, M. A framework for detecting unfolding emergencies using humans as sensors. SpringerPlus 2016, 5, 43. [Google Scholar] [CrossRef]
- Zhang, X.; Ma, Y. An ALBERT-based TextCNN-Hatt hybrid model enhanced with topic knowledge for sentiment analysis of sudden-onset disasters. Eng. Appl. Artif. Intell. 2023, 123, 106136. [Google Scholar] [CrossRef]
- Adel, H.; Dahou, A.; Mabrouk, A.; Elaziz, M.A.; Kayed, M.; El-Henawy, I.M.; Alshathri, S.; Ali, A.A. Improving Crisis Events Detection Using DistilBERT with Hunger Games Search Algorithm. Mathematics 2022, 10, 447. [Google Scholar] [CrossRef]
- Ahmed, A.S.; Basheer, O.N.; Salah, H.A. Breast Tumors Diagnosis Using Fuzzy Inference System and Fuzzy C-Means Clustering. Int. J. Comput. 2021, 20, 551–559. [Google Scholar] [CrossRef]
- Ferreira, A.J.; Figueiredo, M.A.T. Boosting Algorithms: A Review of Methods, Theory, and Applications. In Ensemble Machine Learning; Zhang, C., Ma, Y., Eds.; Springer: New York, NY, USA, 2012. [Google Scholar] [CrossRef]
- Velthoen, J.; Dombry, C.; Cai, J.-J.; Engelke, S. Gradient boosting for extreme quantile regression. Extremes 2023, 26, 1–29. [Google Scholar] [CrossRef]
- Abdullahi, A.; Raheem, L.; Muhammed, M.; Rabiat, O.; Ganiyu, A. Comparison of the CatBoost Classifier with other Machine Learning Methods. Int. J. Adv. Comput. Sci. Appl. 2020, 11. [Google Scholar] [CrossRef]
- Chen, C.; Zhang, Q.; Ma, Q.; Yu, B. LightGBM-PPI: Predicting protein-protein interactions through LightGBM with multi-information fusion. Chemom. Intell. Lab. Syst. 2019, 191, 54–64. [Google Scholar] [CrossRef]
- Ke, G.; Meng, Q.; Finley, T.; Wang, T.; Chen, W.; Ma, W.; Ye, Q.; Liu, T.-Y. LightGBM: A highly efficient gradient boosting decision tree. In Proceedings of the 31st International Conference on Neural Information Processing Systems (NIPS’17), Long Beach, CA, USA, 4–9 December 2017; Curran Associates Inc.: Red Hook, NY, USA, 2017; pp. 3149–3157. [Google Scholar]
- Lettieri, E.; Masella, C.; Radaelli, G. Disaster management: Findings from a systematic review. Disaster Prev. Manag. Int. J. 2009, 18, 117–136. [Google Scholar] [CrossRef]
- Tukey, J.W. Exploratory Data Analysis; Addison-Wesley: Reading, MA, USA, 1977; Volume 2, pp. 131–160. [Google Scholar]
- Majumder, M.G.; Gupta, S.D.; Paul, J. Perceived usefulness of online customer reviews: A review mining approach using machine learning & exploratory data analysis. J. Bus. Res. 2022, 150, 147–164. [Google Scholar] [CrossRef]
- Roman, G.; Lipyanina-Goncharenko, H.; Sachenko, A.; Lendyuk, T.; Zahorodnia, D. Intelligent Method of a Competitive Product Choosing based on the Emotional Feedbacks Coloring. In IntelITSIS; CEUR-WS: Khmelnytskyi, Ukraine, 2021; pp. 246–257. [Google Scholar]
- Wang, C.; Shakhovska, N.; Sachenko, A.; Komar, M. A New Approach for Missing Data Imputation in Big Data Interface. Inf. Technol. Control. 2020, 49, 541–555. [Google Scholar] [CrossRef]
- Jin, S.; Chen, S.; Xie, X. Property-based Test for Part-of-Speech Tagging Tool. In Proceedings of the 2021 36th IEEE/ACM International Conference on Automated Software Engineering (ASE), Melbourne, Australia, 15–19 November 2021; pp. 1306–1311. [Google Scholar]
- Guo, S.; Liu, Y.; Chen, R.; Sun, X.; Wang, X. Improved SMOTE Algorithm to Deal with Imbalanced Activity Classes in Smart Homes. Neural Process. Lett. 2019, 50, 1503–1526. [Google Scholar] [CrossRef]
- Chicco, D.; Jurman, G. The advantages of the Matthews correlation coefficient (MCC) over F1 score and accuracy in binary classification evaluation. BMC Genom. 2020, 21, 6. [Google Scholar] [CrossRef]
- Industrial Safety and Health Analytics Database. Kaggle: Your Machine Learning and Data Science Community. Available online: https://www.kaggle.com/datasets/ihmstefanini/industrial-safety-and-health-analytics-database (accessed on 3 May 2023).
- Paffenroth, R.; Kong, X. Python in Data Science Research and Education. У Python in Science Conference. In Proceedings of the SciPy 2015, Austin, TX, USA, 6–12 July 2015. [Google Scholar] [CrossRef]
- Lipianina-Honcharenko, K.; Lukasevych-Krutnyk, I.; Butryn-Boka, N.; Sachenko, A.; Grodskyi, S. Intelligent Method for Identifying the Fraudulent Online Stores. In Proceedings of the 2021 IEEE 8th International Conference on Problems of Infocommunications, Science and Technology (PIC S&T), Kharkiv, Ukraine, 5–7 October 2021; pp. 218–222. [Google Scholar] [CrossRef]
- Krysovatyy, A.; Lipianina-Honcharenko, H.; Sachenko, S.; Desyatnyuk, O.; Banasik, A.; Lukasevych-Krutnyk, I. Recognizing the fictitious business entity on logistic regression base. CEUR Workshop Proc. 2022, 3156, 218–227. [Google Scholar]
- Classification Report—Yellowbrick v1.5 Documentation. Yellowbrick: Machine Learning Visualization—Yellowbrick v1.5 Documentation. Available online: https://www.scikit-yb.org/en/latest/api/classifier/classification_report.html (accessed on 10 May 2023).
- Sachenko, A.; Kochan, V.; Kochan, R.; Turchenko, V.; Tsahouridis, K.; Laopoulos, T. Error compensation in an intelligent sensing instrumentation system. In Proceedings of the 18th IEEE Instrumentation and Measurement Technology Conference. Rediscovering Measurement in the Age of Informatics (IMTC 2001), Budapest, Hungary, 21–23 May 2001; Volume 2, pp. 869–874. [Google Scholar] [CrossRef]
Figure 1.
A conceptual structure of the intelligent method for classification of anthropogenic disasters.
Figure 1.
A conceptual structure of the intelligent method for classification of anthropogenic disasters.

Figure 2.
Correlation between potential and actual accident level.

Figure 3.
Cleared text.

Figure 4.
Classification report and Confusion Matrix between predictions and actuals.

Figure 5.
Results of data dividing.

Figure 6.
Evaluation of the AdaBoost simulation.

Figure 7.
Evaluation of Gradient Boost modeling.

Figure 8.
Evaluation of the XGBoost simulation.

Figure 9.
Evaluation of LigthGBM modeling.

Figure 10.
Mobile application architecture.

Figure 11.
Evaluation of CatBoost modeling.

Figure 12.
Evaluation of CatBoost simulation on a test sample.

Figure 13.
The result of predicting the level of potential accident.

Figure 14.
Entering input data.


Table 1.
A comparative assessment of emergency detection methods.
| Source | Method | Accuracy |
|---|---|---|
| Bhoi et al. [5] | Hybrid model including LSTM and CNN. | F1-scores on both datasets are 84% and 84% |
| Gopnarayan A., Deshpande, S. [7] | SVM, KNN, and logistic regression. | Not specified |
| S. Madichetty and S. M. [9] | A combination of the RoBERTa model and a feature-based method. | The accuracy is 90% |
| D. Kanojia, V. Kumar, K. [12] | Real-time message classification. | F-measure exceeds 70% and 90% respectively. |
| Avvenuti, M. et al. [15] | Not specified. | Precision = 75%, Recall = 100%, and F-Measure = 86% |
| Zhang & Ma [16] | ALBERT-based TextCNN-Hatt hybrid model enhanced with topic knowledge for sentiment analysis of sudden-onset disasters | 89% |
| Adel, H. et al. [17] | DistilBERT model with Hunger Games search algorithm. | 98% (C6 data set), 97% (C36 data set) |
Table 2.
Data Description.
| No. | Parameter | Description | Non-Null, Count, Dtype |
|---|---|---|---|
| 1 | Data | timestamp or time/date information | 411, non-null, object |
| 2 | Countries | which country the accident occurred (anonymized) | 411, non-null, object |
| 3 | Local | the city where the manufacturing plant is located (anonymized) | 411, non-null, object |
| 4 | Industry sector | which sector the plant belongs to | 411, non-null, object |
| 5 | Accident level | from I to VI, it registers how severe was the accident (I means not severe but VI means very severe) | 411, non-null, object |
| 6 | Potential Accident Level | Depending on the Accident Level, the database also registers how severe the accident could have been (due to other factors involved in the accident) | 411, non-null, object |
| 7 | Genre | if the person is male of female | 411, non-null, object |
| 8 | Employee or Third Party | if the injured person is an employee or a third party | 411, non-null, object |
| 9 | Critical Risk | some description of the risk involved in the accident | 411, non-null, object |
| 10 | Description | Detailed description of how the accident happened | 411, non-null, object |
Table 3.
N-grams in relation to industry categories.
| Index | Words_Metals | Count_Metals | Words_Mining | Count_Mining | Index | Words_Metals | Count_Metals | Words_Mining | Count_Mining |
|---|---|---|---|---|---|---|---|---|---|
| 0 | employee | 50 | causing | 103 | 15 | worker | 14 | accident | 47 |
| 1 | left | 46 | right | 100 | 16 | performed | 13 | collaborator | 44 |
| 2 | causing | 43 | operator | 96 | 17 | mr. | 13 | safety | 44 |
| 3 | right | 37 | time | 96 | 18 | center | 13 | mesh | 44 |
| 4 | hit | 27 | left | 92 | 19 | hose | 12 | work | 43 |
| 5 | hand | 25 | hand | 88 | 20 | area | 12 | hit | 42 |
| 6 | operator | 25 | moment | 62 | 21 | face | 12 | employee | 38 |
| 7 | activity | 25 | level | 60 | 22 | remove | 12 | one | 37 |
| 8 | medical | 24 | assistant | 59 | 23 | sheet | 12 | fall | 36 |
| 9 | report | 23 | worker | 53 | 24 | cut | 12 | circumstance | 35 |
| 10 | finger | 19 | support | 51 | 25 | reaching | 12 | height | 35 |
| 11 | moment | 18 | rock | 49 | 26 | pipe | 11 | floor | 34 |
| 12 | one | 16 | pipe | 48 | 27 | fall | 11 | injured | 32 |
| 13 | collaborator | 15 | equipment | 47 | 28 | acid | 11 | used | 32 |
| 14 | cleaning | 15 | finger | 47 | 29 | contact | 11 | mr. | 31 |
Table 4.
The results of modeling with ensemble machine learning methods.
| Model | Accuracy | |
|---|---|---|
| 0 | AdaBoost | 0.595376 |
| 1 | Gradient Boost | 0.924855 |
| 2 | XGBoost | 0.901734 |
| 3 | CatBoost | 0.791908 |
| 4 | LGBoost | 0.988439 |
Table 5.
Comparative analysis of analogs for detectiing the crisis events.
| Source | Method | Accuracy (Text Data), % | Accuracy (Quantitative Data), % | Real-Time Operation |
|---|---|---|---|---|
| Zhang & Ma [16] | ALBERT-based TextCNN-Hatt hybrid model enhanced with topic knowledge for sentiment analysis of sudden-onset disasters | 89% | N/A | N/A |
| Adel et al., (2022) [17] | DistilBERT model with Hunger Games search algorithm | 98 (C6 data set); 97 (C36 data set) | N/A | N/A |
| Proposed approach | Intelligent method of classifying the level of anthropogenic disasters based on textual and quantitative data | 76 | 81 | Є |
Disclaimer/Publisher’s Note: The statements, opinions and data contained in all publications are solely those of the individual author(s) and contributor(s) and not of MDPI and/or the editor(s). MDPI and/or the editor(s) disclaim responsibility for any injury to people or property resulting from any ideas, methods, instructions or products referred to in the content. |
© 2023 by the authors. Licensee MDPI, Basel, Switzerland. This article is an open access article distributed under the terms and conditions of the Creative Commons Attribution (CC BY) license (https://creativecommons.org/licenses/by/4.0/).
Share and Cite
MDPI and ACS Style
Lipianina-Honcharenko, K.; Wolff, C.; Sachenko, A.; Kit, I.; Zahorodnia, D. Intelligent Method for Classifying the Level of Anthropogenic Disasters. Big Data Cogn. Comput. 2023, 7, 157. https://doi.org/10.3390/bdcc7030157
AMA Style
Lipianina-Honcharenko K, Wolff C, Sachenko A, Kit I, Zahorodnia D. Intelligent Method for Classifying the Level of Anthropogenic Disasters. Big Data and Cognitive Computing. 2023; 7(3):157. https://doi.org/10.3390/bdcc7030157
Chicago/Turabian StyleLipianina-Honcharenko, Khrystyna, Carsten Wolff, Anatoliy Sachenko, Ivan Kit, and Diana Zahorodnia. 2023. "Intelligent Method for Classifying the Level of Anthropogenic Disasters" Big Data and Cognitive Computing 7, no. 3: 157. https://doi.org/10.3390/bdcc7030157