Article

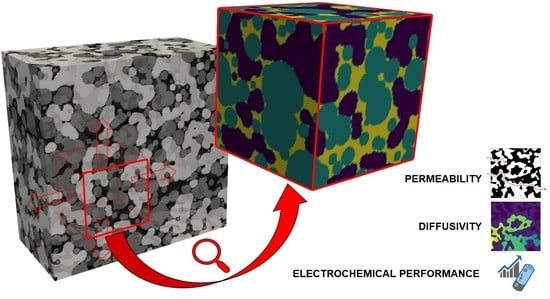
Systematic Workflow for Efficient Identification of Local Representative Elementary Volumes Demonstrated with Lithium-Ion Battery Cathode Microstructures

by
Benjamin Kellers
1,2,*,
Martin P. Lautenschlaeger
1,2,
Nireas Rigos
1,2,
Julius Weinmiller
1,2,
Timo Danner
1,2,* and
Arnulf Latz
1,2,3
1
German Aerospace Center (DLR), Institute of Engineering Thermodymanics, 89081 Ulm, Germany
2
Helmholtz Institute Ulm for Electrochemical Energy Storage (HIU), 89081 Ulm, Germany
3
Institute of Electrochemistry, Ulm University, 89081 Ulm, Germany
*
Authors to whom correspondence should be addressed.
Batteries 2023, 9(7), 390; https://doi.org/10.3390/batteries9070390
Submission received: 15 June 2023 / Revised: 10 July 2023 / Accepted: 16 July 2023 / Published: 22 July 2023
(This article belongs to the Special Issue Materials Design for Electrochemical Energy Storage)

Abstract

:
The concept of a representative elementary volume (REV) is key for connecting results of pore-scale simulations with continuum properties of microstructures. Current approaches define REVs only based on their size as the smallest volume in a heterogeneous material independent of its location and under certain aspects representing the same material at the continuum scale. However, the determination of such REVs is computationally expensive and time-consuming, as many costly simulations are often needed. Therefore, presented here is an efficient, systematic, and predictive workflow for the identification of REVs. The main differences from former studies are: (1) An REV is reinterpreted as one specificsub-volume of minimal size at a certain location that reproduces the relevant continuum properties of the full microstructure. It is therefore called a local REV (lREV) here. (2) Besides comparably cheap geometrical and statistical analyses, no further simulations are needed. The minimum size of the sub-volume is estimated using the simple statistical properties of the full microstructure. Then, the location of the REV is identified solely by evaluating the structural properties of all possible candidates in a very fast, efficient, and systematic manner using a penalty function. The feasibility and correct functioning of the workflow were successfully tested and validated by simulating diffusive transport, advection, and electrochemical properties for an lREV. It is shown that the lREVs identified using this workflow can be significantly smaller than typical REVs. This can lead to significant speed-ups for any pore-scale simulations. The workflow can be applied to any type of heterogeneous material, even though it is showcased here using a lithium-ion battery cathode.

Graphical Abstract

1. Introduction

Modeling and simulation of pore-scale processes with realistic microstructures has extensively developed into an important and predictive tool in the context of electrochemical energy storage materials [1,2,3,4], digital rock physics [5,6,7], and other composite materials [8,9]. This was mainly facilitated by improvements in both computer hardware and imaging technologies, such as micro- and nano-computed tomography (CT) [10], FIB-SEM [11,12], and statistical reconstruction methods [13,14,15]. Together, they enable the simulation of highly resolved images down to the nanometer scale and thereby open the door to computational studies of processes that are hard to access with experimental techniques.
The most common numerical methods used to compute properties from these images are pore network modeling (PNM) [16,17,18] and direct numerical simulation, such as the lattice Boltzmann method (LBM) [5,6,19,20,21,22] and traditional computational fluid dynamics (CFD) [7,23,24,25,26]. Whole software packages have been developed that allow for a detailed digital analysis of microstructural properties and their effect on transport processes [27,28,29]. However, to achieve accurate and predictive simulations, the microstructure volume needs to fulfill the following requirements: (1) It has to be sufficiently large to represent the macroscopic properties of the full microstructure. These properties can either describe the structure (e.g., porosity, pore size distribution, specific surface area, geometric tortuosity, or material composition) or a physical process (e.g., permeability, diffusivity, or conductivity). (2) It has to be small enough to handle computationally, which is limited by available hardware.
Therefore, half a century ago, the concept of a representative elementary volume (REV) was introduced for continuum mechanical stresses [30] and it has since been adapted to flow in porous media [31]. Nowadays, it has become increasingly important in the fields of petroleum engineering and geoscience [5,6,7,16,20,23,32,33], as well as in computational electrochemistry; i.e., battery [19,25,34] and fuel cell materials [17,21,22,24,26,35,36]. An REV is typically defined as the smallest volume in a heterogeneous porous medium for which fluctuations in the properties under investigation converge and become independent of the volume size [31,37]. Two variants of REVs are used in the literature: (1) deterministic REVs (dREVs) and (2) statistical REVs (sREVs) [23,38]. While a dREV is determined by the influence of the domain size at an arbitrary but constant position (mostly at the center of the full microstructure), an sREV is determined by a domain with a fixed size but variable position scanning the full microstructure.
Although simple in their application, both variants require significant computational resources, which renders the process time-consuming. Both employ a definition of an REV as the smallest volume (i.e., V ¯ global ) that is globally representative for the full microstructure. This means, once V ¯ global is known for a certain microstructure, all subsets of this microstructure with size V ¯ global should show similar results; e.g., when being used for image-based simulations. However, V ¯ global is not necessarily the smallest representative volume of a microstructure; i.e., there exists a volume V local V ¯ global [38] that is by itself equally representative of the full microstructure. Due to its smaller size, knowing V local is what is most desirable for most resolved image-based simulation studies. For the derivation of continuum properties [39], the original definition of REVs based on V ¯ global remains favorable. This means that finding the smallest and most representative volume element in a given microstructure can reduce computational efforts significantly while maintaining the quality of the results. Therefore, in this study, first, a new type of REV is introduced. It is called the local REV (lREV). A conceptually related REV definition is already part of the literature concerning battery simulations [25]. Second, an approach is presented that, in a reliable and efficient manner, can identify such lREVs using a predictive and purely structurally informed search algorithm.
This approach is very different from other recently published approaches for efficient REV detection that either use neural networks [20] or replace simulations with image analysis of non-segmented raw micro-CT data [23]. It works as follows: (1) A pore network including a broad variety of geometrical pore-scale information is extracted from the full microstructure. This information is then stored, which guarantees easy and fast access for further post-processing; (2) For a given segmented image of a microstructure, the lower bound of the lREV size is estimated using statistical analysis; i.e., a two-point correlation; (3) Similar to the sREV concept, the lREV size is tested by moving a domain through the full microstructure while keeping the domain size constant. The aforementioned geometrical pore-scale information is evaluated for each domain; (4) The data from step three are used to derive a penalty function that predicts the locations of the most favorable lREVs of a given size. Here, “most favorable” means that these lREVs show the least deviation from the full microstructure with respect to geometrical pore-scale properties included in the penalty function. Thus, they are most representative from a geometrical perspective.
This approach is general and almost independent of the microstructure that is used. The only necessary requirement for the microstructure is that all structural heterogeneities occur on a similar length scale. The underlying assumption is always that the full image is already representative of the medium under investigation. Considering this, the approach is applicable to a broad range of research fields that require structurally resolved porous media simulations; e.g., the development of better energy storage materials. In the following, it is showcased using a lithium-ion battery cathode consisting of NMC622. To prove the quality of the predicted lREVs and thus validate the workflow proposed here, common observables with different physicochemical simulations were employed for the lREVs. These were diffusive transport within both the fluid and the solid, advection of a fluid in the pore space, and simulations of electrochemical characteristics. The results showed that using an informed approach, such as the lREV concept, can lead to REVs that are significantly smaller while still providing statistically similar results in physicochemical simulations. Therefore, to reduce computational efforts and time, it is highly recommended that this efficient approach be used as an intermediate step between image generation and simulation. Although optional, the penalty function should ideally be optimized with respect to the physical process studied on the basis of the lREV.
This paper is organized as follows. In Section 2, the image generation of the microstructure, the geometrical and statistical analysis, and the numerical methods used in this study are described. Results are presented in Section 3. In Section 4, how lREVs can be determined using the methodology suggested in this study is discussed. Finally, conclusions are drawn in Section 5.

2. Methods

2.1. Image Generation and Post-Processing

The 3D image of the cathode used in this study was obtained using nano-CT (SkyScan2211, Bruker Corporation, Billerica, MA, USA) with a resolution of 0.30 μm. The reconstructed grayscale image was then segmented using the commercial software GeoDict® [27]. This software uses a neural network algorithm that has specifically been trained to distinguish pore space, active material, and the carbon-binder domain (CBD) in NMC-like battery electrode microstructures. A similar workflow for graphite-like battery electrode microstructures can be found in a recent related publication [40].

2.2. Application of the lREV Workflow

This section describes the theoretical background of the selection algorithm for lREVs. After some general definitions, the four-step process outlined in the introduction is further specified with a special focus on the methodological approach.
(1)
General definitions
A 3D image with dimensions ( L x , L y , L z ) representing a porous material consisting of N phases can mathematically be described as a function I that maps vectors of discrete coordinates c C to a phase label i { 0 , , N 1 } ; i.e.,
I : C { 0 , , N 1 } , c I ( c ) = i .
Here, the set C is a subset of N 3 including all vectors c = ( c x , c y , c z ) with 0 c k < L k .
Based on Equation (1), a sub-image can be defined as an image with dimensions ( l x , l y , l z ) , where l k L k . This corresponds to a set of vectors r = ( r x , r y , r z ) R C , with s k r k < s k + l k , ( s x , s y , s z ) being the origin coordinates of the sub-image.
Some properties (e.g., the material composition) can be easily determined directly from the images. Using the standard delta distribution δ ( · ) , one can define a phase indicator function F ( i ) as
F ( i ) ( c ) = δ ( I ( c ) i ) .
It labels voxels belonging to phase i with 1, while all other voxels are labeled with 0. Using Equation (2), the volume fraction of phase i is defined as
ϕ i = { c } F ( i ) ( c ) V ,
where V is the volume of the (sub-)image in voxels. The porosity is trivially the volume fraction of the void phase (here i = 0 ). Other properties like geometric tortuosity, pore surface area, or pore size distributions require greater computational efforts when being determined directly based on the image data. This is especially true when repeating the procedure for many thousands of sub-images that are possible REV candidates. In the current study, the number of candidates was of the order of 10 5 . To reduce computational times, pore networks were employed instead.
(2)
Extraction of Pore Network Information
A pore network (PN) is an abstract and simplified representation of the original pore space. It simplifies the geometry of the pore space while conserving its topology. A PN can be extracted from a 3D image by segmenting the pore space into pore regions using a watershed algorithm. The confined connections of pore regions are called throats. Fitting spheres into the pore regions and disks into the throat regions yields the simplest geometrical representation; i.e., spheres connected by cylinders.
In this work, the open-source Python package PoreSpy (version 2.2.2) [29] was used to extract PNs from segmented image data using the so-called SNOW-correction [41]. The latter avoids oversegmentation of the pore space, which is usually observed in highly porous energy storage materials due to spurious maxima in the distance maps.
Once the PN for the full image is extracted, all computations with sub-images are computationally inexpensive. Results for the sub-images are determined by masking the full PN. This is done by selecting only pores with centers that lie inside the sub-image, providing fast access to properties of the PN, including pore size distribution and pore surface area.
Tortuosity is a property that correlates with the diffusive behavior of a material. It is a directional property that can be defined as the average of the shortest paths between two opposite sides of a cuboid that are only contained in a predefined phase. To avoid very expensive image-based computation, it can be approximated from the PN instead. In this work, the geometric tortuosity τ was determined by converting the PN into a mathematical graph, taking its pores as nodes and its throats as edges. The lengths of the throats then serve as weights of the edges.
The shortest geometrical path is then the shortest way along the graph between inlet and outlet nodes. This path is determined for each inlet pore connected to any outlet pore. Pores are defined as inlet or outlet pores, respectively, if their centers are within a distance of 5 voxels from the boundary along the direction of interest. The results were determined using the sparse.csgraph.shortest_path function of the Python package SciPy (version 1.10.1) [42] and averaged over all inlet pores.
(3)
Estimation of lower bound REV
The second step of the workflow is to determine the minimal size of the lREV for a given image. This can be done using statistical analysis [35]. Here, we present an approach using the two-point correlation function (TPC), which is known to be able to capture important microstructural properties [43]. It is determined for each phase of interest. Using Equation (2), the TPC for phase i is given by
S 2 ( i ) ( | c 1 c 2 | ) = F ( i ) ( c 1 ) F ( i ) ( c 2 ) ,
where · denotes the ensemble average. The TPC is a function of the Euclidean distance between two points; i.e., d = | c 1 c 2 | . It can be interpreted as the probability that two voxels with distance d belong to the same phase.
Applying the TPC to a large microstructure can provide an indicator for the size of an lREV. For sufficiently large values of d, the probability density converges to a constant value; i.e., ϕ i . Note that this statement is only true for image data with a certain structural heterogeneity. Most natural materials and materials used in technical applications show such structural heterogeneity. This is, however, not the case for some artificially created materials with pattern-like repeating structures; e.g., with equidistant protrusions or holes. There, the TPC fluctuates around a constant value and does not converge. However, those type of structures render the concept of an REV meaningless anyway.
TPCs are typically defined for 3D images (cf. Equation (4)). The determined S 2 ( i ) for each phase typically converges at a distance d ^ i . The overall value for d ^ is then given by the maximum of the set; i.e.
d ^ = max i d ^ i .
Using this value as a size for the lREV candidates results in cubic sub-images with the shape ( d ^ , d ^ , d ^ ) .
There are, however, microstructures that require a certain length for the simulation domain along one direction. This is, for example, the case for electrochemical energy storage materials, where the full thickness of the electrodes has to be considered for them to be physically meaningful. In such cases, instead of using cubic sub-images and computing the TPC radially for a 3D image, the TPC is computed between planar slices that are perpendicular to the direction k. This evaluation is similar to the planar radial distribution function typically used to study structural properties at the molecular scale (cf. ref. [44]). The value for d ^ i is then defined as the maximum value of d ^ for all slices such that the overall convergence distance is given by
d ^ = max i d ^ i , with d ^ i = max { slices } d ^ i ( slice ) .
This results in sub-images of cuboid shape with square bases ( d ^ , l k , d ^ ) ; such sub-images are sometimes called the representative elementary area (REA). Note that, when using this approach, d ^ can be larger than l k , while radial 3D TPCs are always limited by l k .
(4)
Striding Windows
Depending on the size of the full image, the value of d ^ can still result in a large number of possible lREV candidates. The selection is undertaken using a striding-windows algorithm. A window of fixed dimensions, here ( d ^ , l k , d ^ ) , is moved through the image using the same step size along all directions. This is done until the full image is covered. Figure 1 shows a corresponding example for a 2D image of 2000 × 2000 voxels and a window of 300 × 300 voxels for an exemplary step size of 100 voxels.
Although a step size of 1 voxel would capture every possible candidate, for practicability, larger step sizes are sufficient, since the resulting sub-images differ only slightly in image-based properties and even less in PN-based parameters.
(5)
Penalty Function
In order to rank lREV candidates, we define a so-called penalty function P depending on the geometrical properties of the microstructure or PN, respectively. In general, a penalty function maps a sub-image I to a real number; i.e.,
P : I P ( I ) R .
It should be suitable to quantify the degree of agreement of a sub-image with the full image in certain aspects. In this study, a penalty function of the form
P ( I ) = α = 1 M w α p ¯ α p α ( I ) 0 ,
is used. It is the weighted sum of the absolute deviation of a local property of the sub-image p α ( I ) from the global property of the full image p ¯ α for a set of M properties; i.e., the deviations are weighted by weight factors w. Examples for such properties are the volume fraction of phase i, the specific surface area S, or the geometric tortuosity τ , to name only a few. For the full image, p ¯ α = p α such that P = 0 . The weighting factors should be chosen such that the penalty reflects the importance of the influence of each property p α on the relevant physical and chemical processes of interest. For a given set of sub-images { I } , the best lREV candidate I ^ is the sub-image with the lowest penalty; i.e.
P ( I ^ ) = min { I } P ( I ) .
Normalizing the parts of the sum in Equation (8) to the maximum value in the sub-image set { I } and applying the constraint α w α = 1 normalizes the penalty function to 1; i.e.,
P ( I ) = α = 1 M w α p ¯ α p α ( I ) max { I } | p ¯ α p α ( I ) | 1 .
In a complementary fashion, an additional set of parameters p ˜ β can be introduced imposing hard cutoffs in a determined range p ˜ β min p ˜ β p ˜ β max . Finally, the penalty function is given by
P ˜ ( I ) = P ( I ) if p ˜ β min p ˜ β p ˜ β max β , otherwise .
The use of this extended penalty function P ˜ is demonstrated in the following. It is there denoted as a "hard" penalty, while P is referred to as a "soft" penalty.

2.3. Simulation Methods

2.3.1. Diffusion

The effective diffusivity D eff is used as a characteristic and representative measure for diffusive transport processes. Here, it was determined for both the fluid and the solid phase. Depending on the phase, it can be interpreted as mass diffusion showing pore connectivity or thermal and electrical conductivity showing particle connectivity, respectively. In both cases, the diffusivity was determined only in the + y -direction using 3D LBM simulations. As the simulation setup is similar for fluid and solid diffusivity, it is only described for the fluid diffusivity in the following. All LBM model parameters and results are given in lattice units (e.g., cf. [4]).
The simulation setup consisted of the microstructure sample, from which both the AM and CBD, for simplicity, were assigned equal diffusion coefficients. A concentration gradient Δ C / Δ y was prescribed by setting the concentrations at y = 0 and y = l y to C = 1.0 and C = 0.01 , respectively, using Zou–He boundary conditions [45]. The concentration in the fluid was initially set correspondingly, assuming a linear concentration gradient along the y-direction. The velocity was set to zero. No-slip boundary conditions were applied along the x- and z-directions using bounce-back.
From the simulations, the effective diffusivity D eff was determined as
D eff = D J local J ,
where D = 1 / 8 is the bulk diffusion coefficient, and J local and J are the microscopic and macroscopic diffusive fluxes, respectively. They are defined as
J local = 1 V V j d V , J = D Δ C l y ,
where V = l x l y l z is the total volume of the simulation domain and j can be determined as given in [22], for example. Technically, a D3Q7 lattice with a BGK collision operator was applied [46]. Simulations were conducted using the open-source software Palabos (version 2.3) [47]. Each simulation was stopped when the density converged; i.e., its standard deviation went below 1.0 × 10 6 within 5000 consecutive iterations.

2.3.2. Hydrodynamics

The permeability k is used as a characteristic and representative hydrodynamical measure for fluid flow and pore connectivity. Again, it was determined only in the + y -direction using 3D single-phase flow LBM simulations.
The simulation setup was motivated by experimental setups typically used to determine permeabilities. It consisted of the microstructure sample, from which the AM and CBD were considered as impermeable solid phases. The pore space was initially filled with a liquid of constant density ρ = 1.0 . Along the + y -direction, an external force density f and periodic boundary conditions were applied. In contrast, no-slip boundary conditions were applied along the x- and z-directions using bounce-back.
From the simulations, the permeability k was determined as
k = u Darcy ν f ,
where ν = 1 / 6 is the kinematic viscosity, f = 5 × 10 4 is the external force density, and u Darcy is the Darcy velocity (i.e., the velocity in the + y -direction), averaged over all fluid lattice cells. Technically, a D3Q19 lattice and a BGK collision operator were applied [46]. Simulations were conducted using the open-source software Palabos (version 2.3) [47]. Each simulation was stopped when the kinetic energy of the full simulation system converged; i.e., its standard deviation went below 1 × 10 6 within 5000 consecutive iterations. Further details regarding the model and simulation setup can be found in previous publications from our group [3,4].

2.3.3. Electrochemistry

Electrochemical simulations were performed within the framework of the Battery and Electrochemistry Simulation Tool (BEST) [48], which is a versatile software tool for different kinds of battery simulations. It was jointly developed by the Fraunhofer Institute for Industrial Mathematics (ITWM) and the Institute of Engineering Thermodynamics of the German Aerospace Center (DLR). BEST builds upon a consistent non-equilibrium reversible-thermodynamics ansatz for the description of battery cell operation at the continuum scale [49,50]. It couples the solutions to the mass, charge, and heat conservation equations in each phase with the corresponding electrochemical reactions at the interfaces. The tool enables microstructure-resolved simulations by integrating the aforementioned mathematical model into a finite volume scheme. It employs the Algebraic Multigrid Methods for Systems (SAMG) library, which is a collection of subroutines developed to efficiently solve large systems of linear equations.
The simulation setup consisted of a half-cell with an NMC622 porous electrode and a flat lithium foil as the counter electrode, with two partially compressed Whatman separators (GF/A layers) with a total thickness of 380 μm sandwiched in between. The simulation protocol employed constant-current (CC) charging in the voltage range 2.6–4.3 V with a nominal current of 1 C, which was defined based on the capacity of the full microstructure.
The electrochemical parameterization of the battery materials was undertaken through dedicated fits from experiments or using literature data [51]. An overview of the parameters of the electrochemical simulation is provided in Table S1 in the Supplementary Materials. They correspond to an LiPF6 in an EC + DEC electrolyte.

3. Results

The workflow for efficient identification of lREVs is showcased using a microstructure of a lithium-ion battery cathode. For validation of the workflow and to prove the concept, different tests were conducted with respect to the physical and chemical properties of the lREVs. Three different lREVs were selected that, according to the penalty function (i.e., regarding their structural properties), showed the best agreement with the full image or microstructure. They are denoted as "TOP" in the following. Based on those lREVs, different physical processes were simulated; i.e., diffusive transport within both the fluid and the solid, advection, and electrochemical simulations. The results were then compared to the results from corresponding simulations with the full microstructure. Moreover, they were also compared to simulations with sub-images that, according to the penalty function, showed "LOW" and "SUPERLOW" accordance with the full microstructure. Here, "LOW" and "SUPERLOW" are defined as the worst agreement with the full microstructure based on soft and hard penalties, respectively. In essence, they correspond to the worst candidates in this size class that could be selected using the sREV or dREV concepts. Finally, in addition to the optimum sub-image size (i.e., by definition, the lREV), results were determined for three different sub-image sizes that differed from the optimum image size by factors of 0.5, 2, and 4, respectively.
The full microstructure used in this study had the dimensions ( L x , L y , L z ) = ( 2000 , 130 , 2000 ) voxels. The y-dimension corresponds to the total thickness of a typical lithium-ion battery cathode. The x- and z-dimensions are limited by the field of view of the nano-CT instrument. They are, however, large enough to contain an REV [24,34] and, thus, fit the purpose of this investigation. The microstructure consisted of three phases; i.e., the pore space, AM, and CBD. A cross-section of the microstructure is shown along with other types of porous materials in Figure S1 in the Supplementary Materials.
In the following, the full workflow, including the validation, is presented step by step; i.e., from steps one to four as outlined above.
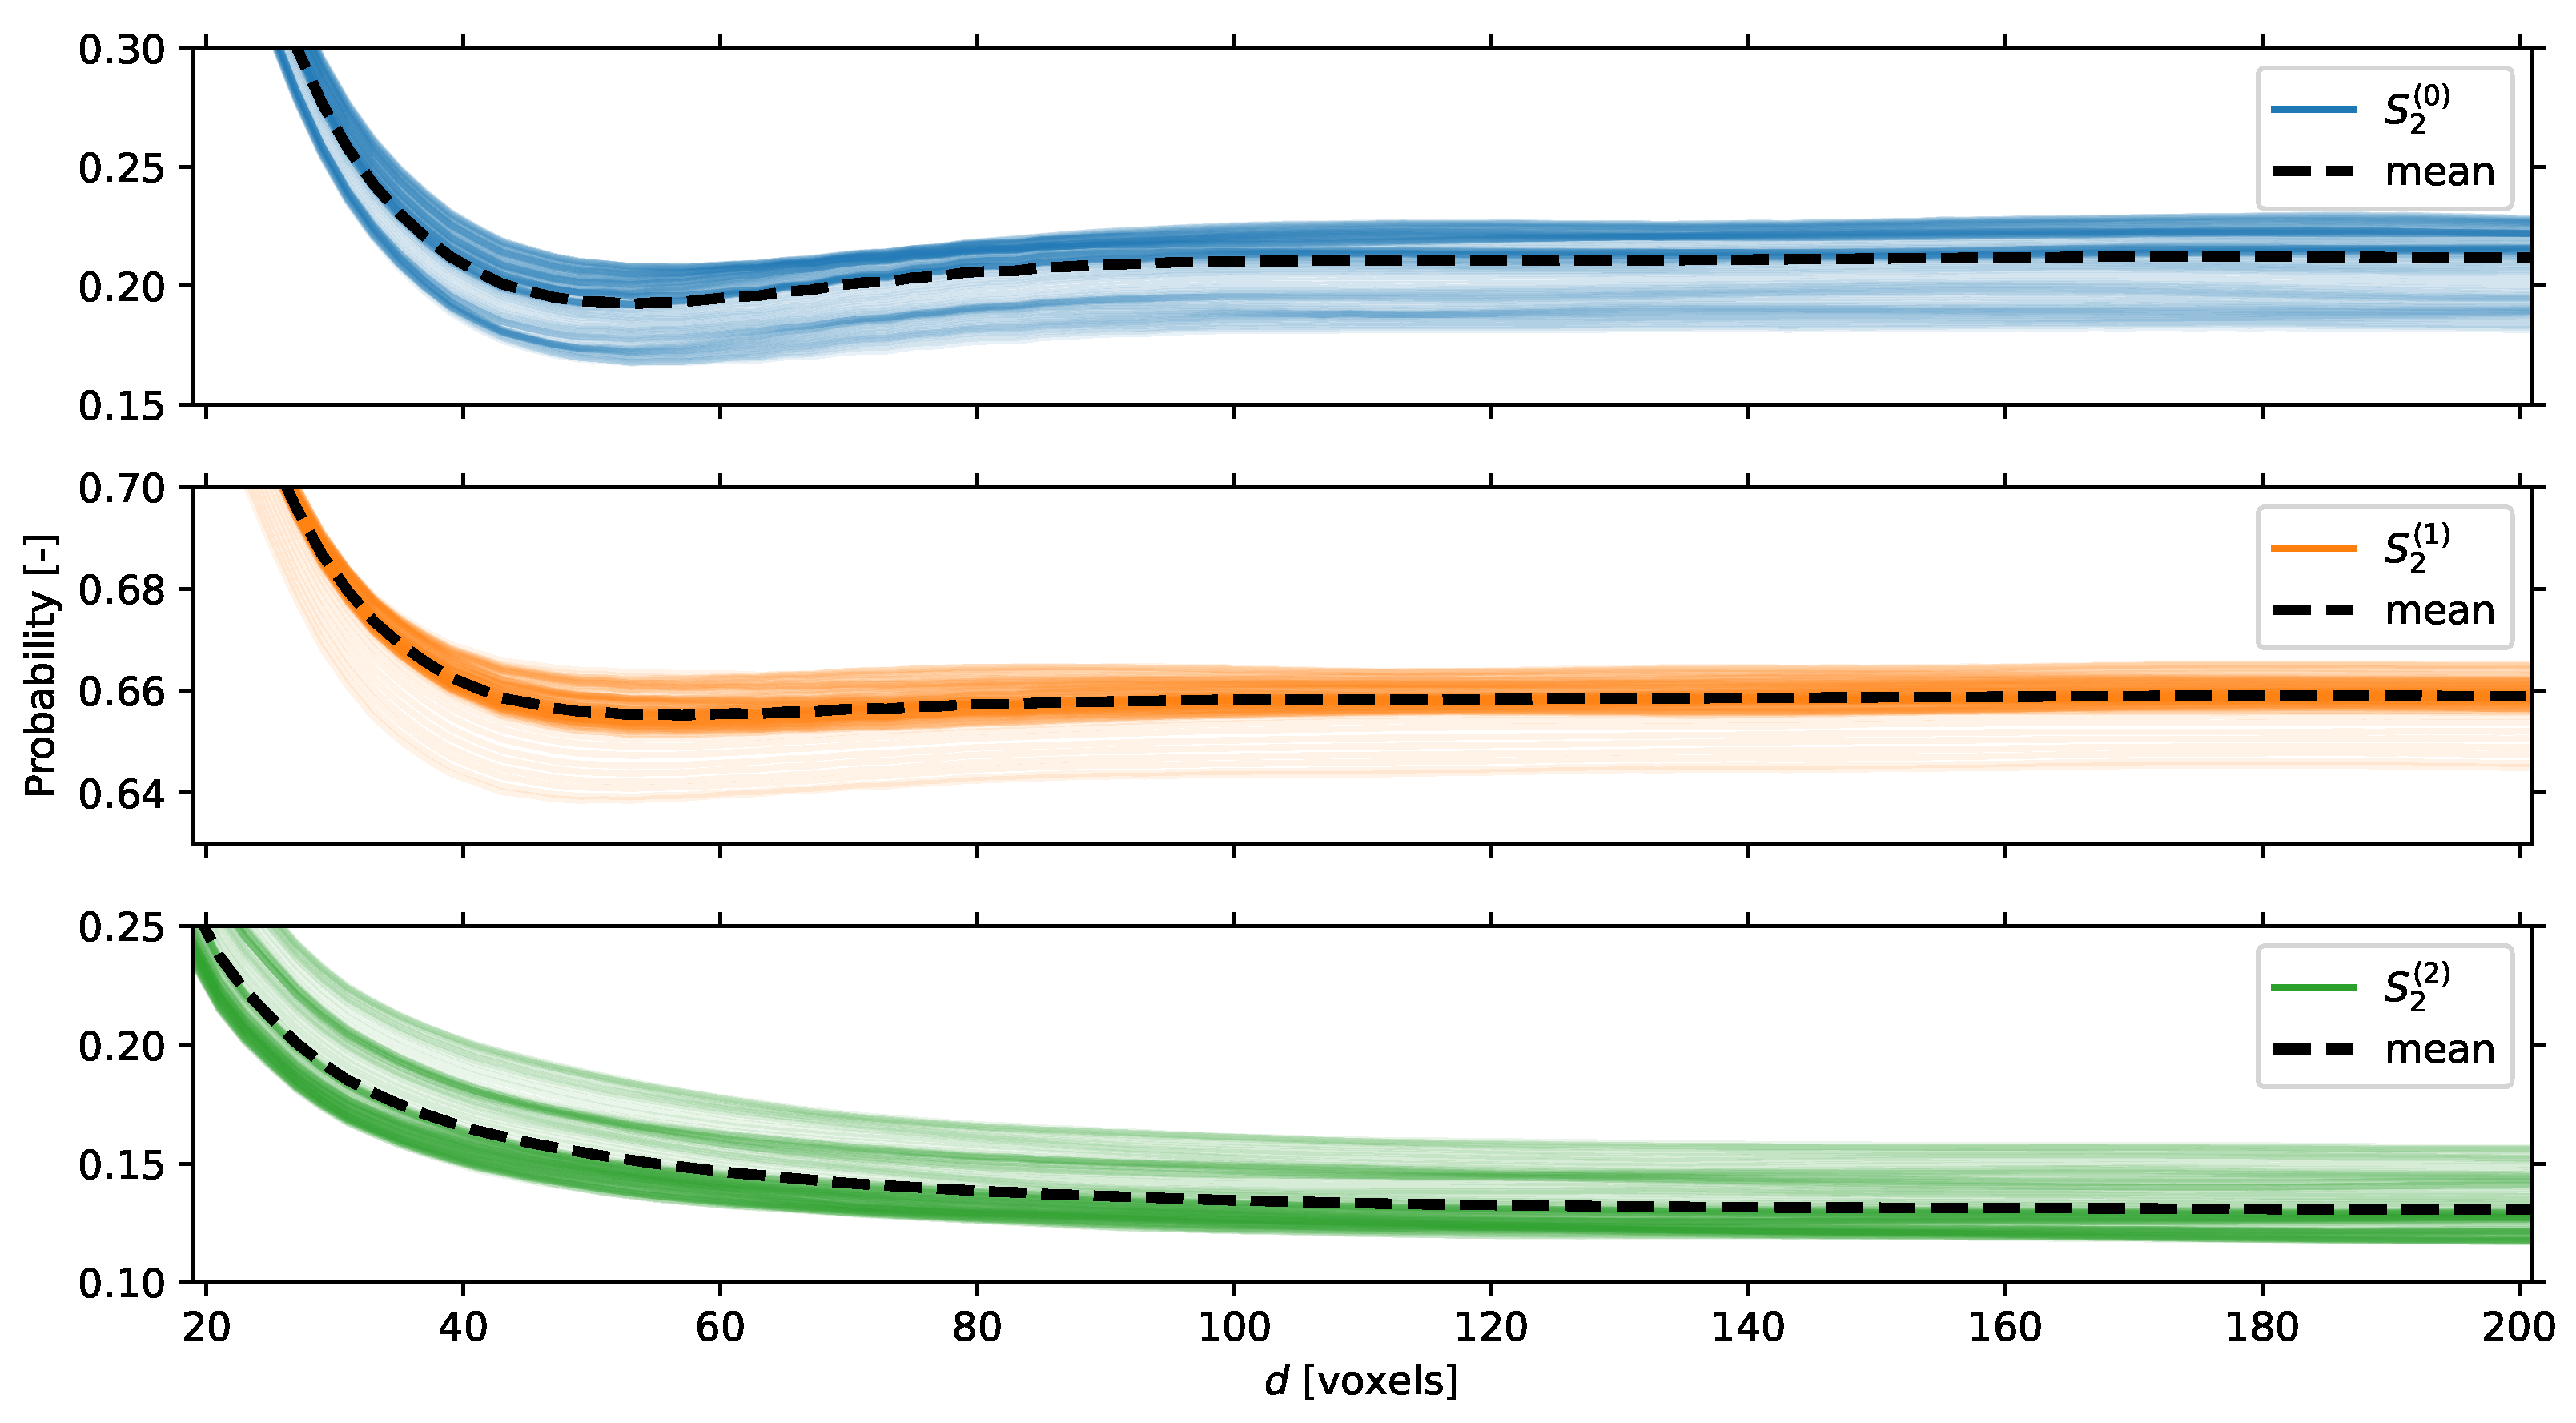
  • Step One: Extraction of Pore Network Information
The PN that was extracted from the full microstructure consisted of more than 39,000 pores and 69,000 throats. The median equivalent pore diameter was determined as 4.33 μm with a standard deviation of 1.74 μm. The geometrical information for the pore centers was used to compute the geometric tortuosity τ . The specific surface area S was determined by summing up the surface areas of all pores, which were provided by the PN, and normalizing the sum by the volume V of the microstructure. The material composition and the corresponding PN properties of the full microstructure are given in Table 1.
  • Step Two: Estimation of the lower bound of the REV
As described in Section 2.2, the TPC was applied to the full microstructure to estimate the lower bound of the REV size. The results are shown in Figure 2 separately for all three phases or components. The lower bound d ^ i for each phase was visually determined as ( d ^ 0 , d ^ 1 , d ^ 2 ) = ( 100 , 90 , 130 ) voxels for the pore space, AM, and CBD, respectively. Thus, the minimum size of the lREV was set as d ^ = 130 voxels along the x- and z-dimensions to be representative for all three phases. For convenience, this value was rounded up to d ^ = 150 voxels.
  • Step Three: Striding Windows
The striding-window algorithm is schematically shown in Figure 1. It was applied to the full image using sub-images with a size of ( l , 130 , l ) voxels, with l = 75 , 150 , 300 , 600 voxels. The step size between adjacent sub-images was 20 voxels in all directions. As mentioned above, this step size was chosen for reasons of practicability while simultaneously ensuring a close and continuous scan of the full image.
  • Step Four: Penalty Function
Finally, an appropriate soft penalty function was defined on the basis of the structural properties. Only those properties were chosen for which it was known that they correlate with diffusive transport, advection, and electrochemical processes. These were porosity ϕ 0 , CBD fraction ϕ 2 , specific surface area S, tortuosity τ , and pore size distribution. The AM fraction ϕ 1 was not included separately, as it inherently results from the other phases as ϕ 1 = 1 ϕ 0 ϕ 2 and strongly correlates with S.
As described above, the data for ϕ 0 and ϕ 2 were determined from the image data, while S and τ were determined from the PN. The pore size distribution and corresponding χ 2 -distribution were computed as described in Appendix A. The influences of S, τ , and χ 2 ( I ) were considered equally important, leading to the identical weights w α = 1 / 3 for all α . Porosity ϕ 0 and CBD fraction ϕ 2 were additionally incorporated as hard penalties, allowing only for deviations of ±1% point around the corresponding value of the full image (cf. Table 1). Numerically, a hard penalty was also assigned to the tortuosity to ensure that it remained finite. The latter removed lREV candidates for which there was no pore connection between the inlet and the outlet, which occurs only for very small lREV sizes.
Figure 3 shows the deviations (cf. Equation (10)) of the local values from the global values; i.e., the deviation of values determined from the sub-images I from the corresponding values from the full image (cf. Table 1). Deviations are shown for all the aforementioned influencing factors that entered the penalty function P ( I ) . The cut size l = 300 is used as an example, while similar plots for the different cut sizes can be found in Figures S2–S4 in the Supporting Information.
Results are shown without applying the hard limits. The position in each heatmap is practically equivalent to the position of the window in the full image. More precisely, the x y -coordinates of a pixel in the heatmaps correspond to the coordinates of the origin point (“lower left corner”) of the corresponding window. For improved readability, the χ 2 sum was normalized to its 90th percentile. Outliers from this range are depicted in dark blue.
The heatmaps indicate a correlation between the porosity ϕ 0 and the specific surface area S, which was also observed in the literature [35,36]. Similar behavior is shown for all other cut sizes in Figures S2–S4 in the Supplementary Materials. In these figures, it can also be observed that deviations in all properties decrease with increasing cut size l.

3.1. Diffusion and Hydrodynamics Benchmark

Figure 4 shows simulation results for D eff / D , both for the pore space (top) and the solid phase (bottom). The results are given for sub-images (symbols) at different cut sizes ( l = 75 to 600). They are compared to the result for the full image (dashed line). The global values are given in Table 2.
Simulation results for the permeabilities (symbols) are shown in Figure 5 for cut sizes l = 75 to 600. They are again compared to the result of the full image (dashed line).

3.2. Electrochemical Benchmark

Figure 6 shows the results for the total transferred charge during the charging simulation. Results for the sub-images are shown for the four different cut sizes (symbols) and compared to a value corresponding to the result for the full image (dashed line). This value was determined as the median value of the results for the nine sub-images with size ( 666 , 130 , 666 ) , each distributed in a three-by-three layout that covered the whole structure. This was undertaken as the maximum volume size that could be handled using the electrochemical simulations was significantly smaller than the full image. Numerical values are given in Table 3. Additionally, for comparison, the min–max range (lighter shaded area) and the standard deviation around the mean range (darker shaded area) for these largest simulations are shown. The full charging curves are provided in Figure S5 in the Supplementary Materials.

4. Discussion

The size of an REV is not only dependent on the structure but is also known to depend on the physical property being investigated [8,31,52]. It is typically larger for transport properties than for static or structural properties [20,52], but it also depends on the accuracy desired for the results.
From Figure 4, the following general observations can be made: (1) The normalized effective diffusivity in the solid is larger than in the pore space as transport properties at interfaces are typically lower than they are in the bulk [53]. (2) Deviations from the full image decrease with increasing cut size, as is also shown in the literature [26,33]. (3) lREV candidates from the category SUPERLOW show larger deviations from the full image than TOP and LOW.
The results from the LBM and BEST simulations also confirmed the predicted optimum lREV size coming from the TPC. For cut sizes l < 150 , large deviations were observed for all categories. They decreased, however, for l 150 , where the categories TOP and LOW especially showed good accordance with the results from the full image. Thus, applying suitable hard penalties leads to lREVs that already capture many of the structural features that determine diffusive transport.
Similar conclusions can be drawn for the permeability results shown in Figure 5. Starting from l = 150 , the values for TOP and LOW approach the value of the full image. Only in one case was a value from the category LOW in better accordance with the value of the full image than the corresponding values from the category TOP. The exact reason for this is unclear. It might be an indication that the weight factors in the penalty are not yet fully optimized for this physical process. Applying hard penalties results in lREVs that show at least good agreement with results from the full image.
The results of charging simulations showed similar behavior. For cut sizes l < 150 , large deviations can be observed for all categories. Starting from l = 150 , the results from the category TOP show the best accordance overall with the results corresponding to the full image. Moreover, applying hard filters had significant consequences. In this case, all results for l 150 from the category TOP fall at least into the min–max range, while most results for LOW fall into this range only for l 300 . The results for SUPERLOW deviate from that range in most cases. Considering that an lREV from the category SUPERLOW corresponds to a randomly chosen REV for which only the size but not the location is known, the simulation results show the need for a systematic REV workflow as presented here.
The most important findings can be summarized as follows: (1) The workflow is predictive only for cut sizes corresponding to at least the lower bound of an REV, as determined in the analysis of the TPC. (2) The cut size predicted by the TPCs is sufficient for most practical applications. (3) Including the right properties or influencing factors in the penalty function is key; however, the exact value of the corresponding weight factor is less important for many use cases. (4) For sufficiently homogeneous materials, hard penalties have a significant effect on the accuracy. Then, even the worst candidates in terms of the soft penalty (i.e., the category LOW) show good accordance with the results from the full image. (5) The BEST simulations illustrate the need for an REV algorithm that results in sub-images that are as small as possible, as the electrochemical simulations are computationally more demanding.

5. Conclusions and Outlook

An efficient and systematic workflow for reliable identification of representative elementary volumes (REVs) was presented. For a given volume size, the workflow successfully predicts the location of the most representative REVs. They were therefore denoted as lREVs. This prediction is based on a penalty function that is purely informed by structural information coming from pore networks (PNs) and image data. No simulations of physical processes, such as diffusion or flow, have to be conducted. Thus, the workflow runs with low computational costs. These benefits can be useful for a broad range of application fields. They are, however, especially useful for battery research, where development times are short and the field is highly competitive. There, using lREVs instead of the full microstructure can save significant computational effort while achieving comparably accurate simulation results. This frees up computational resources, speeds up studies, and enables investigations of larger parameter spaces.
The workflow was demonstrated using cathode materials for lithium-ion batteries. However, it can be readily applied to electrodes made of other materials, such as graphite. Then, the only adaptions that have to implemented concern the estimation of the size of the REV lower bound, as well as the weights in the penalty function. Moreover, the workflow can be applied to any kind of microstructure and, thus, is useful to researchers from a broad range of research fields. Depending on the relevant physical and chemical processes, different structural properties with corresponding weights can be considered in the penalty function. For the penalty function used in this work for lithium-ion battery cathodes, the following structural properties were considered: porosity ϕ 0 , carbon-binder domain (CBD) fraction ϕ 2 , specific surface area S, tortuosity τ , and pore size distribution. The predicted lREVs were tested and validated by simulating different physical processes with sub-images; i.e., diffusive transport, advection, and electrochemical processes during charging. No special focus was laid on the parameterization of the penalty weights, which, however, was shown to have only a minor influence on the overall quality of the results.
This study shows that using a systematic workflow for the identification of lREVs can significantly reduce the size of REVs, as well as the computational efforts needed to run simulations with such REVs. Using so-called hard penalties can further improve the quality of REV identification. Compared to other methods, this workflow is computationally very favorable, as it makes use of one single global PN for the derivation of local structural properties. For the consideration of nonlinear effects; capturing specific electrochemical phenomena, like lithium plating; or handling more complex materials (e.g., anodes or separators; cf. Figure S1 in the Supplementary Materials) with the workflow, different soft penalties and a more sophisticated parameterization of the penalty weights may be required. In particular, lithium plating and stripping are still a topic of elevated interest for many researchers (e.g., cf. ref. [54]). All these aspects will be part of our future investigations.

Supplementary Materials

The supporting information can be downloaded at: www.mdpi.com/xxx/s.

Author Contributions

Conceptualization, B.K., M.P.L. and J.W.; methodology, B.K. and M.P.L.; software, B.K.; validation, M.P.L. and N.R.; formal analysis, B.K.; investigation, B.K., M.P.L. and N.R.; resources, M.P.L. and N.R.; data curation, B.K.; writing—original draft preparation, B.K., M.P.L. and N.R.; writing—review and editing, J.W. and T.D.; visualization, B.K.; supervision, T.D. and A.L.; project administration, T.D. and A.L.; funding acquisition, T.D. and A.L. All authors have read and agreed to the published version of the manuscript.

Funding

This work received partial financial support from the European Union’s Horizon 2020 Research and Innovation Programme within the project “DEFACTO” (grant number 875247), as well as from the Federal Ministry for Economic Affairs and Climate Action within the project “Structur.E” under the reference no. 03ETE018B.

Data Availability Statement

The data presented in this study are available from the corresponding authors, B.K. and T.D., upon reasonable request.

Acknowledgments

This work contributes to the research performed at the Center for Electrochemical Energy Storage Ulm-Karlsruhe (CELEST). The simulations were carried out on the Hawk Cluster at the High Performance Computing Center Stuttgart (HLRS) (grant LaBoRESys) and on JUSTUS 2at Ulm University (grant INST 40/467-1 FUGG). The authors thank Michaela Memm, Zentrum für Sonnenenergie- und Wasserstoff-Forschung Baden-Württemberg (ZSW), for providing the cathode samples and Math2Market GmbH for providing a readily segmented 3D image of the cathode material to be used as a benchmark in this study.

Conflicts of Interest

The authors declare no conflict of interest.

Abbreviations

The following abbreviations are used in this manuscript:
AMActive material
CBDCarbon-binder domain
CFDComputational fluid dynamics
CTComputed tomography
dREVDeterministic REV
FIBFocused ion beam
LBMLattice Boltzmann method
lREVLocal REV
PNPore network
PNMPore network modeling
REARepresentative elementary area
REVRepresentative elementary volume
SEMScanning electron microscope
sREVStatistical REV
TPCTwo-point correlation

Appendix A. Penalty for the Pore Size Distribution

The pore size distribution in the full image was separated into 30 bins of equal width, yielding a relative frequency F k for the kth bin. For a consistent comparison, the distribution of the sub-images I was then constructed using the same binning and yielding the relative frequencies f k ( I ) . Based on both F k and f k ( I ) , the χ 2 -distribution was defined as
χ 2 ( I ) = k ( F k f k ( I ) ) 2 F k .
It is a measure for the deviation of the pore size distributions in the sub-images from that of the full image and enters the penalty function. The larger the values of χ 2 ( I ) are, the worse the agreement of both pore size distributions is. Perfect agreement is denoted by χ 2 ( I ) = 0 .

References

  1. Danner, T.; Eswara, S.; Schulz, V.P.; Latz, A. Characterization of gas diffusion electrodes for metal-air batteries. J. Power Sources 2016, 324, 646–656. [Google Scholar] [CrossRef] [Green Version]
  2. Lu, X.; Bertei, A.; Finegan, D.P.; Tan, C.; Daemi, S.R.; Weaving, J.S.; O’Regan, K.B.; Heenan, T.M.M.; Hinds, G.; Kendrick, E.; et al. 3D microstructure design of lithium-ion battery electrodes assisted by X-ray nano-computed tomography and modelling. Nat. Commun. 2020, 11, 2079. [Google Scholar] [CrossRef] [PubMed]
  3. Lautenschlaeger, M.P.; Prifling, B.; Kellers, B.; Weinmiller, J.; Danner, T.; Schmidt, V.; Latz, A. Understanding Electrolyte Filling of Lithium-Ion Battery Electrodes on the Pore Scale Using the Lattice Boltzmann Method. Batter. Supercaps 2022, 5, e202200090. [Google Scholar] [CrossRef]
  4. Lautenschlaeger, M.P.; Weinmiller, J.; Kellers, B.; Danner, T.; Latz, A. Homogenized lattice Boltzmann model for simulating multi-phase flows in heterogeneous porous media. Adv. Water Resour. 2022, 170, 104320. [Google Scholar] [CrossRef]
  5. Kelly, S.; El-Sobky, H.; Torres-Verdín, C.; Balhoff, M.T. Assessing the utility of FIB-SEM images for shale digital rock physics. Adv. Water Resour. 2016, 95, 302–316. [Google Scholar] [CrossRef]
  6. Sun, H.; Vega, S.; Tao, G. Analysis of heterogeneity and permeability anisotropy in carbonate rock samples using digital rock physics. J. Pet. Sci. Eng. 2017, 156, 419–429. [Google Scholar] [CrossRef]
  7. Jacob, A.; Enzmann, F.; Hinz, C.; Kersten, M. Analysis of Variance of Porosity and Heterogeneity of Permeability at the Pore Scale. Transp. Porous Media 2019, 130, 867–887. [Google Scholar] [CrossRef]
  8. Kanit, T.; Forest, S.; Galliet, I.; Mounoury, V.; Jeulin, D. Determination of the size of the representative volume element for random composites: Statistical and numerical approach. Int. J. Solids Struct. 2003, 40, 3647–3679. [Google Scholar] [CrossRef]
  9. Bargmann, S.; Klusemann, B.; Markmann, J.; Schnabel, J.E.; Schneider, K.; Soyarslan, C.; Wilmers, J. Generation of 3D representative volume elements for heterogeneous materials: A review. Prog. Mater. Sci. 2018, 96, 322–384. [Google Scholar] [CrossRef]
  10. Flannery, B.P.; Deckman, H.W.; Roberge, W.G.; D’Amico, K.L. Three-Dimensional X-ray Microtomography. Science 1987, 237, 1439–1444. [Google Scholar] [CrossRef]
  11. Curtis, M.E. Structural Characterization of Gas Shales on the Micro- and Nano-Scales. In Proceedings of the SPE Canada Unconventional Resources Conference, Calgary, AB, Canada, 19–21 October 2010. [Google Scholar] [CrossRef]
  12. Garum, M.; Glover, P.W.; Lorinczi, P.; Drummond-Brydson, R.; Hassanpour, A. Micro- and Nano-Scale Pore Structure in Gas Shale Using Xμ-CT and FIB-SEM Techniques. Energy Fuels 2020, 34, 12340–12353. [Google Scholar] [CrossRef]
  13. Ren, P.E.; Bakke, S. Process based reconstruction of sandstones and prediction of transport properties. Transp. Porous Media 2002, 46, 311–343. [Google Scholar] [CrossRef]
  14. Strebelle, S. Conditional simulation of complex geological structures using multiple-point statistics. Math. Geol. 2002, 34, 1–21. [Google Scholar] [CrossRef]
  15. Westhoff, D.; Manke, I.; Schmidt, V. Generation of virtual lithium-ion battery electrode microstructures based on spatial stochastic modeling. Comput. Mater. Sci. 2018, 151, 53–64. [Google Scholar] [CrossRef]
  16. Blunt, M.J.; Bijeljic, B.; Dong, H.; Gharbi, O.; Iglauer, S.; Mostaghimi, P.; Paluszny, A.; Pentland, C. Pore-scale imaging and modelling. Adv. Water Resour. 2013, 51, 197–216. [Google Scholar] [CrossRef] [Green Version]
  17. Rebai, M.; Prat, M. Scale effect and two-phase flow in a thin hydrophobic porous layer. Application to water transport in gas diffusion layers of proton exchange membrane fuel cells. J. Power Sources 2009, 192, 534–543. [Google Scholar] [CrossRef]
  18. Misaghian, N.; Sadeghi, M.A.; Roberts, E.; Gostick, J. Investigating the Role of the Triple-Phase Boundary in Zinc-Air Cathodes Using Pore Network Modeling. J. Electrochem. Soc. 2022, 169, 100549. [Google Scholar] [CrossRef]
  19. Astaneh, M.; Maggiolo, D.; Ström, H. Finite-size effects on heat and mass transfer in porous electrodes. Int. J. Therm. Sci. 2022, 179, 107610. [Google Scholar] [CrossRef]
  20. Santos, J.E.; Yin, Y.; Jo, H.; Pan, W.; Kang, Q.; Viswanathan, H.S.; Prodanović, M.; Pyrcz, M.J.; Lubbers, N. Computationally Efficient Multiscale Neural Networks Applied to Fluid Flow in Complex 3D Porous Media. Transp. Porous Media 2021, 140, 241–272. [Google Scholar] [CrossRef]
  21. Gao, Y.; Hou, Z.; Wu, X.; Xu, P. The impact of sample size on transport properties of carbon-paper and carbon-cloth GDLs: Direct simulation using the lattice Boltzmann model. Int. J. Heat Mass Transf. 2018, 118, 1325–1339. [Google Scholar] [CrossRef]
  22. García-Salaberri, P.A.; Zenyuk, I.V.; Shum, A.D.; Hwang, G.; Vera, M.; Weber, A.Z.; Gostick, J.T. Analysis of representative elementary volume and through-plane regional characteristics of carbon-fiber papers: Diffusivity, permeability and electrical/thermal conductivity. Int. J. Heat Mass Transf. 2018, 127, 687–703. [Google Scholar] [CrossRef]
  23. Singh, A.; Regenauer-Lieb, K.; Walsh, S.D.C.; Armstrong, R.T.; Griethuysen, J.J.M.; Mostaghimi, P. On Representative Elementary Volumes of Grayscale Micro-CT Images of Porous Media. Geophys. Res. Lett. 2020, 47, 1–9. [Google Scholar] [CrossRef]
  24. Hack, J.; García-Salaberri, P.A.; Kok, M.D.R.; Jervis, R.; Shearing, P.R.; Brandon, N.; Brett, D.J.L. X-ray Micro-Computed Tomography of Polymer Electrolyte Fuel Cells: What is the Representative Elementary Area? J. Electrochem. Soc. 2020, 167, 013545. [Google Scholar] [CrossRef]
  25. Kashkooli, A.G.; Amirfazli, A.; Farhad, S.; Lee, D.U.; Felicelli, S.; Park, H.W.; Feng, K.; De Andrade, V.; Chen, Z. Representative volume element model of lithium-ion battery electrodes based on X-ray nano-tomography. J. Appl. Electrochem. 2017, 47, 281–293. [Google Scholar] [CrossRef]
  26. Zenyuk, I.V.; Parkinson, D.Y.; Connolly, L.G.; Weber, A.Z. Gas-diffusion-layer structural properties under compression via X-ray tomography. J. Power Sources 2016, 328, 364–376. [Google Scholar] [CrossRef] [Green Version]
  27. GeoDict Simulation Software Release 2023. Math2Market GmbH, Germany. Available online: https://www.math2market.com/geodict-software/geodict-software-download.html (accessed on 3 April 2023).
  28. Gostick, J.; Aghighi, M.; Hinebaugh, J.; Tranter, T.; Hoeh, M.A.; Day, H.; Spellacy, B.; Sharqawy, M.H.; Bazylak, A.; Burns, A.; et al. OpenPNM: A Pore Network Modeling Package. Comput. Sci. Eng. 2016, 18, 60–74. [Google Scholar] [CrossRef] [Green Version]
  29. Gostick, J.T.; Khan, Z.A.; Tranter, T.G.; Kok, M.D.; Agnaou, M.; Sadeghi, M.; Jervis, R. PoreSpy: A Python Toolkit for Quantitative Analysis of Porous Media Images. J. Open Source Softw. 2019, 4, 1296. [Google Scholar] [CrossRef]
  30. Hill, R. Elastic properties of reinforced solids: Some theoretical principles. J. Mech. Phys. Solids 1963, 11, 357–372. [Google Scholar] [CrossRef]
  31. Bear, J. Dynamics of Fluids in Porous Media; Environmental Science Series; American Elsevier: New York, NY, USA, 1972. [Google Scholar]
  32. Puyguiraud, A.; Gouze, P.; Dentz, M. Is There a Representative Elementary Volume for Anomalous Dispersion? Transp. Porous Media 2020, 131, 767–778. [Google Scholar] [CrossRef]
  33. Vik, B.; Bastesen, E.; Skauge, A. Evaluation of representative elementary volume for a vuggy carbonate rock—Part: Porosity, permeability, and dispersivity. J. Pet. Sci. Eng. 2013, 112, 36–47. [Google Scholar] [CrossRef]
  34. Shearing, P.R.; Howard, L.E.; Jørgensen, P.S.; Brandon, N.P.; Harris, S.J. Characterization of the 3-dimensional microstructure of a graphite negative electrode from a Li-ion battery. Electrochem. Commun. 2010, 12, 374–377. [Google Scholar] [CrossRef]
  35. Yan, Z.; Hara, S.; Kim, Y.; Shikazono, N. Homogeneity and representativeness analyses of solid oxide fuel cell cathode microstructures. Int. J. Hydrog. Energy 2017, 42, 30166–30178. [Google Scholar] [CrossRef]
  36. Joos, J.; Ender, M.; Carraro, T.; Weber, A.; Ivers-Tiffée, E. Representative volume element size for accurate solid oxide fuel cell cathode reconstructions from focused ion beam tomography data. Electrochim. Acta 2012, 82, 268–276. [Google Scholar] [CrossRef]
  37. Baveye, P.; Rogasik, H.; Wendroth, O.; Onasch, I.; Crawford, J.W. Effect of sampling volume on the measurement of soil physical properties: Simulation with X-ray tomography data. Meas. Sci. Technol. 2002, 13, 775–784. [Google Scholar] [CrossRef]
  38. Zhang, D.; Zhang, R.; Chen, S.; Soll, W.E. Pore scale study of flow in porous media: Scale dependency, REV, and statistical REV. Geophys. Res. Lett. 2000, 27, 1195–1198. [Google Scholar] [CrossRef]
  39. Bachmat, Y.; Bear, J. Macroscopic Modelling of Transport Phenomena in Porous Media. 1: The Continuum Approach. Transp. Porous Media 1986, 1, 213–240. [Google Scholar] [CrossRef]
  40. Sandherr, J.; Kleefoot, M.J.; Nester, S.; Weisenberger, C.; DeSilva, A.K.; Michel, D.; Reeb, S.; Fingerle, M.; Riegel, H.; Knoblauch, V. Micro embossing of graphite-based anodes for lithium-ion batteries to improve cell performance. J. Energy Storage 2023, 65, 107359. [Google Scholar] [CrossRef]
  41. Gostick, J.T. Versatile and efficient pore network extraction method using marker-based watershed segmentation. Phys. Rev. E 2017, 96, 023307. [Google Scholar] [CrossRef] [Green Version]
  42. SciPy: Fundamental Algorithms for Scientific Computing in Python. Version 1.10.1. Available online: https://scipy.org/ (accessed on 3 April 2023).
  43. Bodla, K.K.; Garimella, S.V.; Murthy, J.Y. 3D reconstruction and design of porous media from thin sections. Int. J. Heat Mass Transf. 2014, 73, 250–264. [Google Scholar] [CrossRef] [Green Version]
  44. Lautenschlaeger, M.P.; Hasse, H. Shear-rate dependence of thermodynamic properties of the Lennard-Jones truncated and shifted fluid by molecular dynamics simulations. Phys. Fluids 2019, 31, 063103. [Google Scholar] [CrossRef]
  45. Zou, Q.; He, X. On pressure and velocity boundary conditions for the lattice Boltzmann BGK model. Phys. Fluids 1997, 9, 1591–1596. [Google Scholar] [CrossRef] [Green Version]
  46. Bhatnagar, P.L.; Gross, E.P.; Krook, M. A Model for Collision Processes in Gases. I. Small Amplitude Processes in Charged and Neutral One-Component Systems. Phys. Rev. 1954, 94, 511–525. [Google Scholar] [CrossRef]
  47. Latt, J.; Malaspinas, O.; Kontaxakis, D.; Parmigiani, A.; Lagrava, D.; Brogi, F.; Belgacem, M.B.; Thorimbert, Y.; Leclaire, S.; Li, S.; et al. Palabos: Parallel Lattice Boltzmann solver. Comput. Math. Appl. 2021, 81, 334–350. [Google Scholar] [CrossRef]
  48. Fraunhofer ITWM. BEST—Battery and Electrochemistry Simulation Tool. 2014. Available online: https://www.itwm.fraunhofer.de/best (accessed on 3 April 2023).
  49. Latz, A.; Zausch, J. Thermodynamic consistent transport theory of Li-ion batteries. J. Power Sources 2011, 196, 3296–3302. [Google Scholar] [CrossRef] [Green Version]
  50. Latz, A.; Zausch, J. Thermodynamic Derivation of a Butler–Volmer Model for Intercalation in Li-Ion Batteries. Electrochim. Acta 2013, 110, 358–362. [Google Scholar] [CrossRef]
  51. De Lauri, V.; Krumbein, L.; Hein, S.; Prifling, B.; Schmidt, V.; Danner, T.; Latz, A. Beneficial Effects of Three-Dimensional Structured Electrodes for the Fast Charging of Lithium-Ion Batteries. ACS Appl. Energy Mater. 2021, 4, 13847–13859. [Google Scholar] [CrossRef]
  52. Mostaghimi, P.; Blunt, M.J.; Bijeljic, B. Computations of Absolute Permeability on Micro-CT Images. Math. Geosci. 2013, 45, 103–125. [Google Scholar] [CrossRef]
  53. Lautenschlaeger, M.P.; Hasse, H. Thermal, caloric and transport properties of the Lennard–Jones truncated and shifted fluid in the adsorbed layers at dispersive solid walls. Mol. Phys. 2020, 118, e1669838. [Google Scholar] [CrossRef]
  54. Liang, Y.; Ding, W.; Yao, B.; Zheng, F.; Smirnova, A.; Gu, Z. Mediating Lithium Plating/Stripping by Constructing 3D Au@Cu Pentagonal Pyramid Array. Batteries 2023, 9, 279. [Google Scholar] [CrossRef]
Figure 1. A schematic representation of the striding-window selection in 2D for an image with a size of 2000 × 2000 voxels and a window size of 300 × 300 voxels. The step size is 100 voxels (grid lines) for illustration purposes. In practice, smaller step sizes are recommended. For illustration purposes, only some exemplary windows are shown. However, when applying the workflow, the full image is covered.
Batteries 09 00390 g001
Figure 2. TPCs for all 130 image slices (solid opaque lines) and their means (dashed line). From top to bottom: pore space (phase zero, blue), AM (phase one, orange), and CBD (phase two, green). The convergence of all functions is clearly visible.
Batteries 09 00390 g002
Figure 3. Deviation between the local and global results for the structural influencing factors. In addition, results for the penalty function are given. Values are shown as heatmaps in the range indicated by the legend and color map. Each pixel corresponds to one window (details in text).
Batteries 09 00390 g003aBatteries 09 00390 g003b
Figure 4. LBM simulation results for D eff / D for the four different cut sizes (symbols) compared to the value for the full image (dashed lines).
Batteries 09 00390 g004
Figure 5. LBM simulation results for the permeability k for the four different cut sizes (symbols) compared to the value for the full image (dashed line).
Batteries 09 00390 g005
Figure 6. Total transferred charge in charging simulations for the different cut sizes (symbols). For comparison, the median (dashed line), min–max range (lighter shaded area), and the standard deviation range around the mean (darker shaded area) for the nine largest simulations are shown (details in text).
Batteries 09 00390 g006
Table 1. Pore network and image properties p ¯ α of the full image.
Porosity ϕ 0 (%)Binder Vol. Frac. ϕ 2 (%)Tortuosity τ (-)Spec. Surf. Area S (1/m)
21.0913.021.2188,209
Table 2. LBM results for diffusion and permeability simulation with the full image.
D eff ( void ) / D (-) D eff ( solid ) / D (-)k (1/m 2 )
0.0850.690 9.89 × 10 13
Table 3. Electrochemical simulation results for total transferred charge simulated with sub-images of shape ( 666 , 130 , 666 ) to determine properties of the full image.
Median (mAh/cm 2 )min|max (mAh/cm 2 )Mean ± Std. Deviation (mAh/cm 2 )
1.8401.813|1.864 1.836 ± 0.017
Disclaimer/Publisher’s Note: The statements, opinions and data contained in all publications are solely those of the individual author(s) and contributor(s) and not of MDPI and/or the editor(s). MDPI and/or the editor(s) disclaim responsibility for any injury to people or property resulting from any ideas, methods, instructions or products referred to in the content.

