Article

Experimental and Numerical Investigations of a Thermal Management System Using Phase-Change Materials and Forced-Air Cooling for High-Power Li-Ion Battery Packs

1
College of Mechatronical and Electrical Engineering, Hebei Agricultural University, Baoding 071001, China
2
Automobile NCO School, Army Military Transportation University, Bengbu 233011, China
3
Department of Mechanical Engineering, Imperial College London, South Kensington Campus, London SW7 2AZ, UK
*
Author to whom correspondence should be addressed.
Batteries 2023, 9(3), 153; https://doi.org/10.3390/batteries9030153
Submission received: 30 November 2022 / Revised: 11 February 2023 / Accepted: 25 February 2023 / Published: 27 February 2023
(This article belongs to the Special Issue Feature Papers to Celebrate the First Impact Factor of Batteries)

Abstract

:
The thermal management system of a power battery is crucial to the safety of battery operation; however, for the phase-change material (PCM) thermal management system of a battery, the thermal cycling of phase-change material under large discharge rate conditions will lead to thermal conductivity degradation and thermal stress problems. A method of manufacturing PCM containers with metal fins to package pure phase-change material is put forward to solve the problem. The system temperature under different conditions is studied using numerical and experimental methods. A thermal resistance model is built to analyze the thermal transfer performance of PCM containers with fins. The results show that the PCM container structure can effectively control the battery temperature within the suitable temperature range under the low discharge rate, but the maximum temperature of the battery pack at the high discharge rate of 3 C will exceed the optimum operating temperature range. Adding fins can reduce the maximum temperature and improve the system temperature uniformity. By combining fins with forced-air cooling, the maximum temperature and maximum temperature difference of the battery pack at a high discharge rate can be effectively reduced.

1. Introduction

As one of the main power sources of pure electric vehicles, the power battery directly affects the power performance of the vehicle. In fact, the lithium-ion (Li-ion) battery is very sensitive to temperature [1,2]. When the battery pack temperature exceeds the appropriate range, it will affect its charge and discharge performance and other characteristics such as internal resistance, state of charge (SOC), voltage, charge and discharge efficiency, and cycle life [3,4]. Studies have shown that the optimum operating temperature range is 20 °C~50 °C for the Li-ion battery packs of pure electric vehicles, and the maximum temperature difference between cells in the pack should not exceed 5 °C [5,6]. Therefore, the use of a battery thermal management system (BTMS) to maintain the battery pack temperature within the appropriate operating temperature range is of great significance for ensuring battery capacity and life and improving the power and safety of pure electric vehicles and hybrid electric vehicles.
A BTMS can be categorized into passive and active thermal management systems or based on the medium [4,7]: (1) air for cooling/heating/ventilation; (2) liquid for cooling/heating; (3) phase-change materials (PCM); (4) heat pipe for cooling/heating. Air cooling is the simplest way of thermal management and is low-cost but limited by space. Air cooling can be divided into natural cooling and forced convection heat transfer. The latter has better heat dissipation performance but requires auxiliary equipment such as fans, pumps, pipes, and so on, which leads to a large volume, complex structure, and high maintenance cost [8,9]. Liquid cooling has superiority with a high heat transfer coefficient and low power consumption. At the same time, the structure of the liquid-cooled system plays a crucial role in cooling efficiency. The study investigated the performance of the liquid-cooled battery thermal management system by designing a serpentine microchannel inlet and outlet arrangement. The research found that the battery management system had the best cooling performance when the inlets and outlets were staggered, and the maximum temperature of the battery system was 311.2592 K [10]. Therefore, liquid cooling can effectively guarantee the battery temperature, but the designed liquid cooling structure is still complex. The liquid cooling needs to seal the battery pack to prevent coolant leakage. A BTMS using PCM is another emerging technology. In recent years, PCMs have become a research hotspot in the field of BTMSs due to their advantages of no additional energy consumption, good temperature control effect, and flexible arrangement according to the battery pack structure [11]. Since Al-Hallaj [12] put forward the method of applying PCMs to the thermal management system of a power battery pack in 2000, a lot of research work has shown that the battery system using PCMs is effective.
However, it is found that when the solid PCMs melt, an uneven internal temperature appears near the surface of the melting PCM, and the heat dissipation effect is deteriorated [13,14]. Meanwhile, many studies directly put batteries into PCMs. When PCMs melt, the batteries are prone to displacement, resulting in potential safety hazards and the leakage of PCMs. Additionally, pure PCMs have a low thermal capacity and low thermal conductivity, resulting in low thermal management system efficiency and a tendency for PCMs to melt susceptibly. In order to improve the thermal conductivity of pure phase-change materials, researchers have made composite phase-change materials, such as graphite, carbon fiber, foam metal, and other high thermal conductivity materials and pure PCM [15,16,17,18]. However, studies have shown that after some thermal cycles of melting and solidification, the thermal conductivity of the PCM will decrease, the melting point will be unstable, and significant thermal stress will be caused by the considerable change in density during the phase-change process [19]. Phase-change micro-encapsulation technology can solve a series of problems caused by the melting of PCMs to a certain extent but has a high production cost and long production cycle. Therefore, it is necessary to further optimize the manufacturing process and reduce production costs for phase-change microencapsulation [20]. Furthermore, some studies have shown that reducing the space occupied by PCMs can also reduce the fluidity of melted PCMs [21]. At the same time, excessive heat accumulation in a PCM will make the PCM lose its temperature control effect, so it is necessary to couple other heat dissipation models to take away heat [22].
However, a single thermal management method cannot quickly maintain the battery in the appropriate temperature range and cannot exert high cooling efficiency. Therefore, a novel hybrid BTMS using a PCM combined with other methods is presented in this paper, which has the advantages of good temperature uniformity, high thermal conductivity, low cost, and high mechanical stability. The hybrid BTMS of a 16 Ah high-power battery is studied under a different discharge rate condition. Aiming at the problem of thermal instability issue caused by the melting of PCMs, a method of manufacturing PCM containers by adding metal fins with high mechanical stability to package pure PCMs was proposed. This structure is optimized to improve thermal conductivity and temperature uniformity. Additionally, a thermal resistance model is established to analyze the thermal transfer performance of the PCM container with fins. Meanwhile, to reduce the thermal accumulation of PCMs, the coupling of forced-air cooling and PCM containers is used to study the temperature control effect of the thermal management system at a high discharge rate.
The remainder of this paper is organized as follows. Section 2 introduces the experiment setup and test procedure. Section 3 presents the system structure and numerical modeling. After that, the experiment and numerical simulation results are illustrated, and discharge rate, fins, and wind velocity effects on the cooling system are discussed in Section 4. Finally, some conclusions are drawn in Section 5.

2. Experimental Setup

To validate the model and study the temperature control performance of the BTMS, an experimental setup, as shown in Figure 1, was built. The battery pack and thermal management system are placed in the thermal chamber. The battery charging and discharging are controlled by the battery test equipment (Neware CT-4001, manufactured in China). Meanwhile, the total voltage and current of the battery pack can also be collected using the battery test equipment. The temperature is collected by the data acquisition card and then transmitted to the computer through the network cable for recording. A commercial blower for a vehicle is adopted, whose speed can be controlled by the blower controller. The computer can communicate with the blower controller by controller area network (CAN). The temperature control range of the thermal chamber is +10 °C–85 °C, and the temperature deviation is ±2 °C. The voltage measurement range of the battery test equipment is 0–50 V, and the current measurement range is 0–150 A. The accuracy of the current measurement is 0.1% of the full range, and that of the voltage measurement is 0.1% of the full range. A data acquisition card can provide 8-channel temperature acquisition, and 5 k-type thermocouples are adopted to measure temperature, whose temperature accuracy is ±1 °C. The temperature measurement points will be described later.
The parameters of the batteries are shown in Table 1. A PCM container filled with phase-change material is installed between the battery cells. There are four types of PCM container structures: without fins, 3 fins, 5 fins, and 7 fins. The fins have a thickness of 2 mm for 3 fins, 1.2 mm for 5 fins, and 0.9 mm for 7 fins. The structure of the PCM container is shown in Figure 2, and the pure phase-change material is enclosed between the fins of the PCM container. This structure can improve the thermal conductivity of the PCM container and the uniformity of the surface temperature of the battery. At the same time, this structure plays a certain supporting role for the pure phase-change material and avoids the problem of high thermal conductivity material settlement caused by thermal stress after repeated thermal cycles of melting and solidification in the phase-change material. In the future, the topology of fins can be optimized to achieve higher thermal conductivity and temperature uniformity.
Pure paraffin has the advantages of no supercooling and precipitation, stable performance, non-toxic, non-corrosive, low price, and so on. Paraffin wax No. 44 is selected to study. Its specific physical properties are shown in Table 2. The amount of phase-change material can be estimated from the energy balance. The energy balance is governed by Equation (1).
Q b a t g = Q p c m l + Q p c m s + Q s h e l l + Q b a t i
where Qbatg Q b a t g is the total battery-generated heat, Q p c m l is the PCM absorbed energy by latent heat, and Q p c m s is the PCM absorbed energy by sensible heat. Q s h e l l and Q b a t i are the internal energy increments of the shell of the plate and battery, respectively. If the sensible heat of the PCM and the other increments of internal energy are ignored, there will be a certain margin for the calculated PCM usage. Taking battery 1 C discharge as an estimate, the estimation formula is as follows.
q × t = γ × m p c m
where q is the heating rate for batteries, the unit is W; t is 1 C discharge time, the unit is s, γ   is the latent heat of phase-change material, the unit is J∙kg−1, mpcm is mass of PCM, the unit is kg. Theoretically, the PCM can absorb less than 100%, 25%, and 11.1% battery heat generation under 1 C, 2 C, and 3 C discharge conditions.
The thickness of the PCM container shell designed is 2 mm. According to the size of the contact surface with the battery, the maximum side size of the PCM can be calculated to be 99 mm × 61 mm. According to the volume of the PCM, the thickness of the PCM can be obtained. After calculation, the thickness of the PCM can be 5 mm, while the size of the PCM container is 103 mm × 65 mm × 9 mm.
The arrangement of temperature measurement points is very important for the battery management system. The battery management system gets the distribution characteristics of the battery temperature field using these points. However, the arrangement of the temperature measurement points is limited by hardware resources in engineering practice and should be as few as possible. In the experiment setup, it is possible to arrange as many temperature measurement points as possible to obtain the temperature field distribution of the battery. To be consistent with the actual project, this article attempts to use as few temperature measurement points as possible to obtain the battery’s maximum and minimum temperatures. The layout of the temperature measurement points refers to the results of the temperature field distribution from the later numerical simulations. According to the simulation results, the maximum temperature is located in middle battery cell 5 without forced air cooling, while the one located in battery cell 7 is with forced air cooling. The minimum temperature located in battery cell 1 or 10 is without forced air cooling, while that located in battery cell 1 is with forced air cooling. Therefore, battery cell 1 is adopted to monitor the minimum temperature. The final temperature measurement point (TMP) is shown in Figure 3. TMP1, TMP2, and TMP4 monitor the highest temperature, while TMP3 and TMP5 monitor the lowest temperature. The experimental results show that in the case of no forced air cooling, the highest temperature is TMP1, while the one with forced air cooling is TMP4.
The experimental process is as follows. First, the battery and PCM container, fan, air duct, and other different experimental equipment constitute different battery cooling systems through different combinations. The chamber temperature is set at 25 °C. The battery module is charged with a constant current and constant voltage charging method. The constant charging current is 1 C, the charging cut-off voltage is 3.65 V, and the constant-voltage charging cut-off current is 0.1 C. Then, the battery rests for 3 h in the thermal chamber to achieve thermal and electrochemical equilibrium. Then different discharge rates and wind speeds are set in the experimental stage, and voltage, current, temperature, and other data are measured. The depth of discharge is set to 0.9 during the experiment; hence, discharge time is 3240 s,1620 s, and 1080 s for 1 C, 2 C, and 3 C, respectively. Finally, we repeat the experiment three times to record the collected data and take the average values.

3. Mathematical Modeling

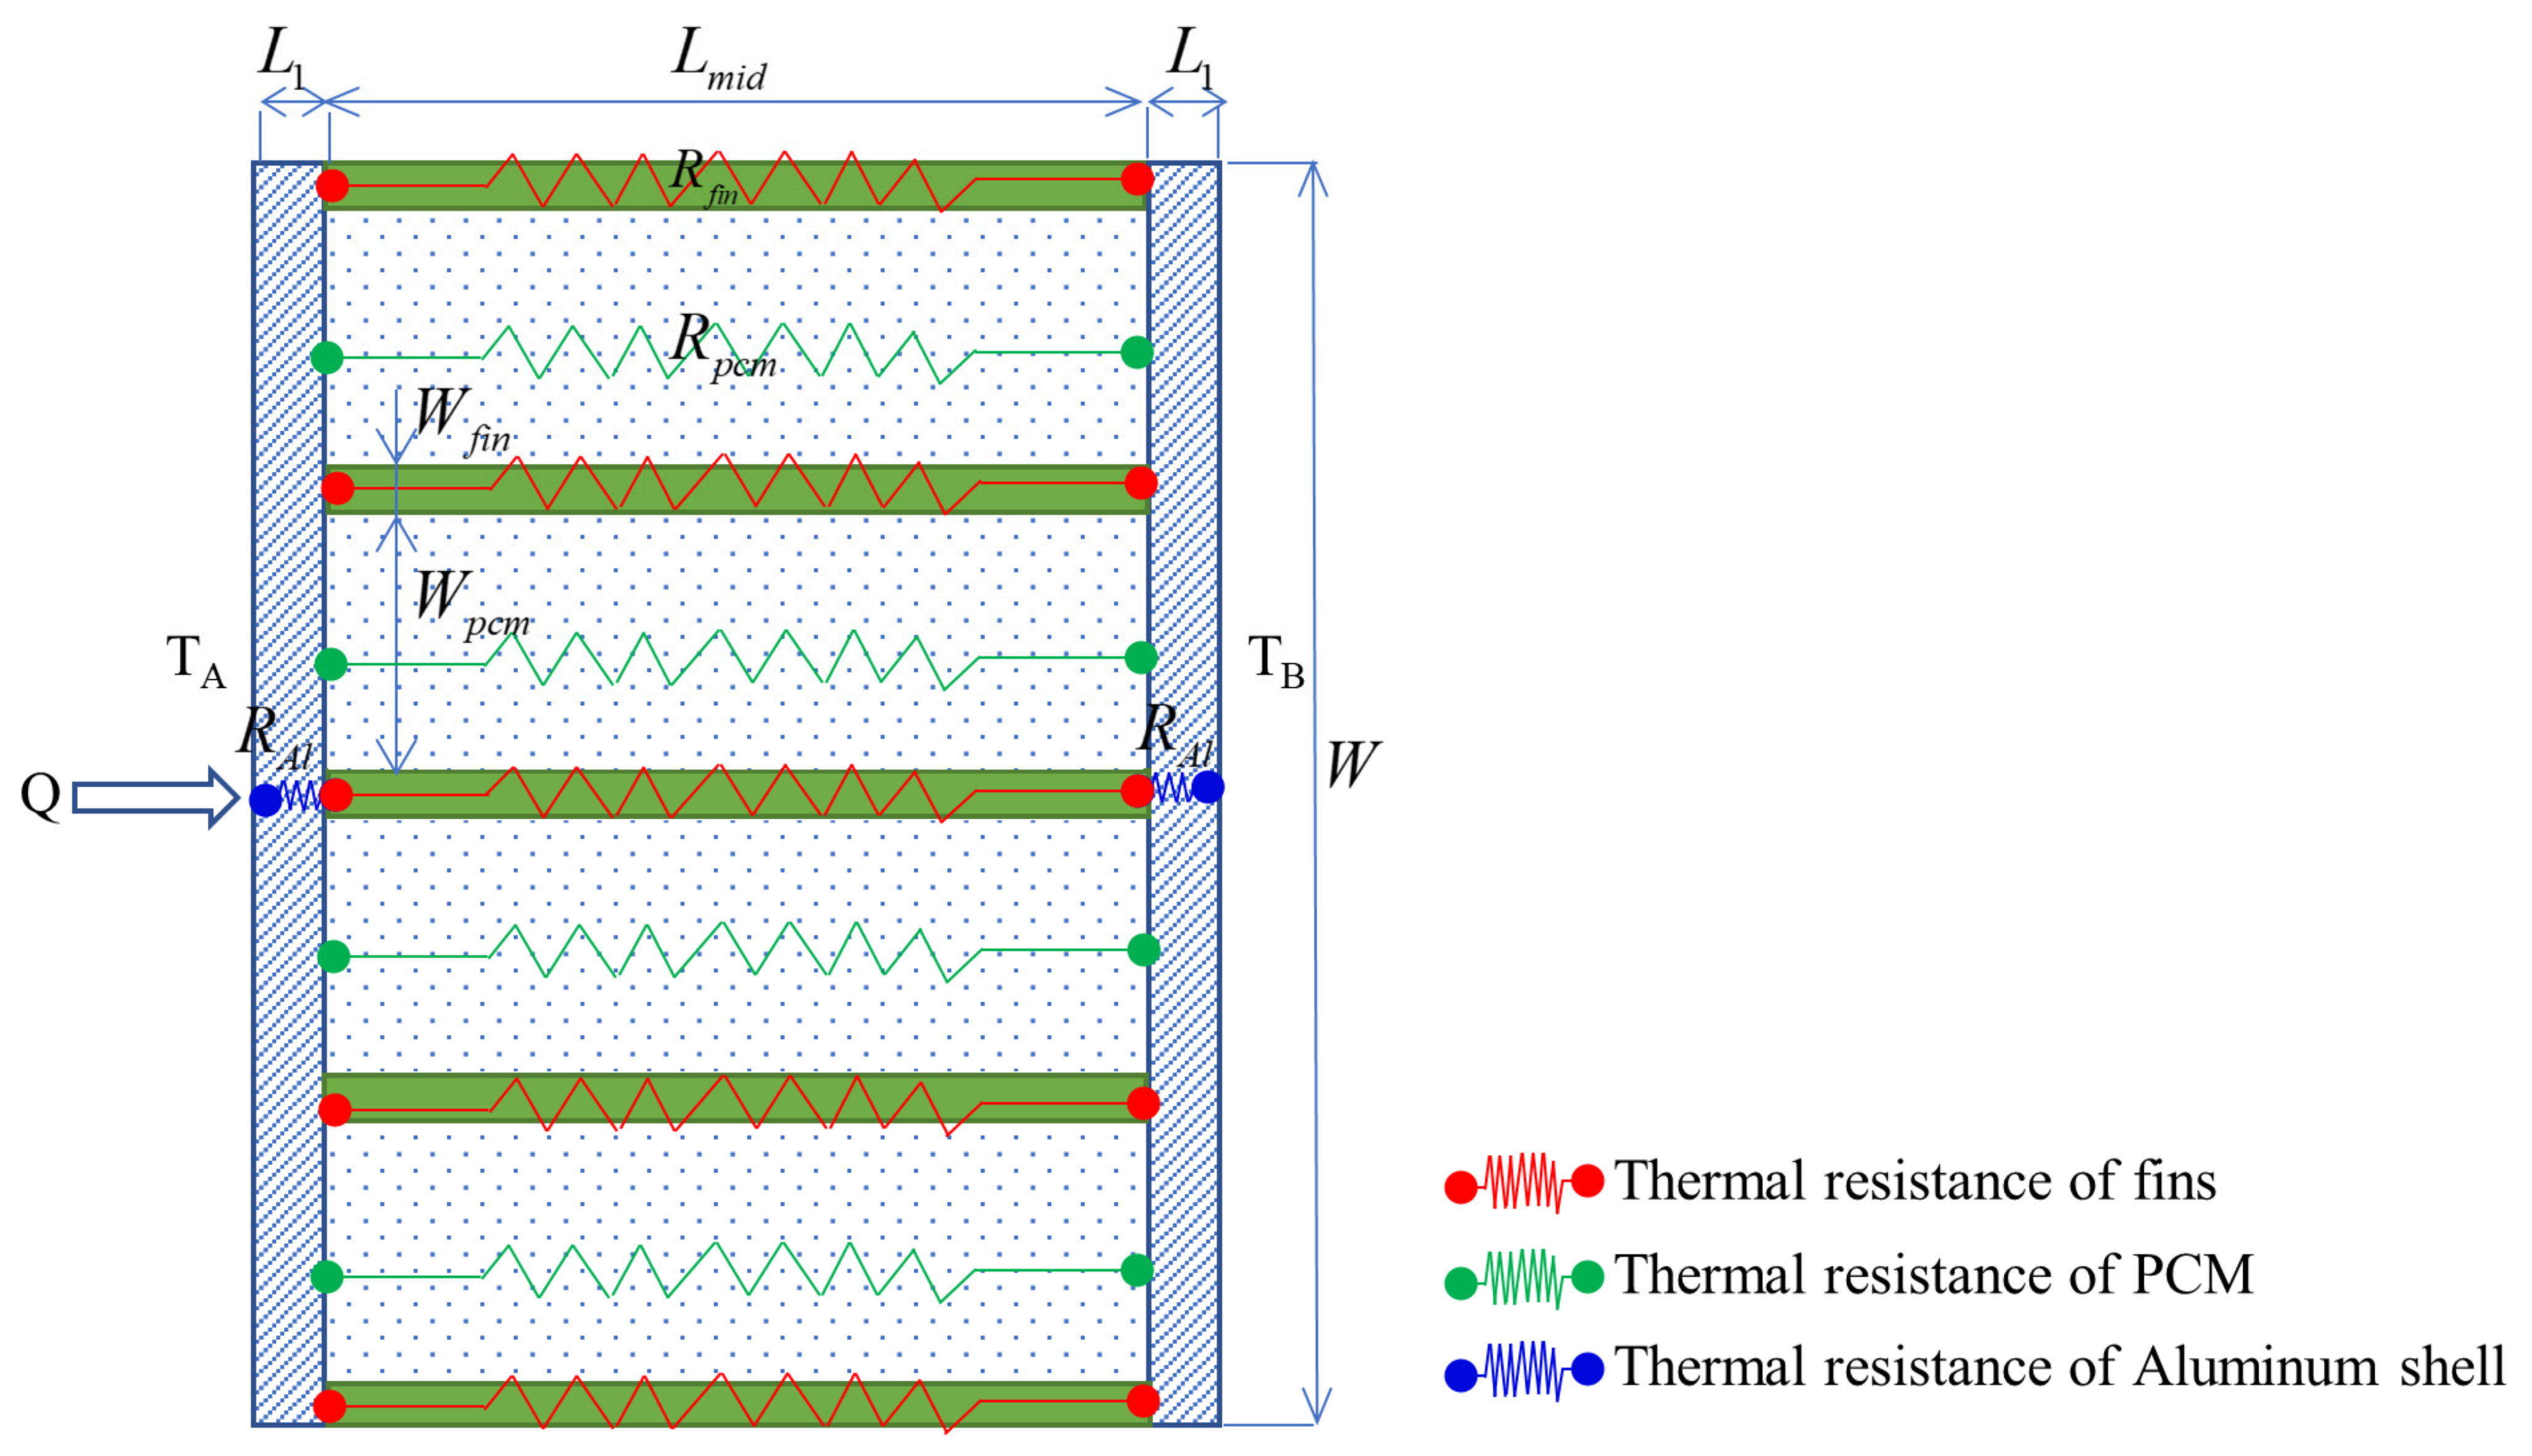
3.1. Model Establishment

The structure of the battery module is shown in Figure 4. Ten square lithium-ion batteries are connected in series in the battery pack. The upper number represents the battery serial number, the lower number represents the PCM container serial number, and the serial number starts at the air inlet. The three-dimensional model of the battery pack is shown in Figure 5a. An air-forced cooling system is installed with an air duct under the bottom of the battery module. A battery module consists of a battery cell, PCM container, and air duct. The PCM is an independent computational domain to describe the phase change. To simplify the problem, the influence of convection after melting is neglected.
The cross-sectional size of the air duct is 63 mm × 15 mm, and the duct is made of aluminum with a thickness of 1 mm. The battery PCM container shell, fins, and air duct are made of aluminum so that they can be treated as one computational domain. As a separate solid domain, the battery contains a heat source with anisotropic thermal conductivity. The air in the air duct is used as the fluid domain to cool the battery and the PCM container through convection.
In the analysis of the heat generation, heat transfer, and heat dissipation of the BTMS, a cell, two PCM containers, and a part of the air duct are considered, including the cell, PCM containers, fins, and forced air cooling, in order to facilitate a unified analysis. Specific heat management system modeling can be tailored based on this analysis. The model is shown in Figure 5b. In this system, batteries are used as heat sources, and PCMs use latent heat to absorb heat. It is considered heat conduction in PCMs neglecting the convective effect after melting. The heat transfer between the PCM container and fins is conduction. The forced convection heat transfer occurs between the duct and the battery module, including the PCM container.
The Computational Fluid Dynamics (CFD) software STAR-CCM+ (Version 2019.3, Siemens, DEU) is employed to simulate and analyze the three-dimensional model. The three-dimensional geometric model is imported into it and meshed. The meshing result is shown in Figure 5c. A polyhedral mesher and surface remesher are adopted to generate the mesh. The mesh result is topologically valid and has no negative volume cells, and the independence of the mesh was validated.
The model assumes that the specific heat capacity, density, thermal conductivity, and internal resistance of the battery cell are constant and do not change with temperature. The specific heat capacity, density, and thermal conductivity of PCMs are constant and isotropic. The energy exchange form between contact surfaces is only heat conduction, ignoring the thermal resistance between contact surfaces. In the actual experiment, the contact surface is filled with thermally conductive adhesive to reduce thermal resistance. Because the module is wrapped with thermal insulating material, it is considered that there is no energy exchange between the system and the outside world.
Batteries are regarded as heat sources of uniform heating, and heat transfer is carried out in the form of heat conduction in the interior of batteries. The governing equation is as follows [23].
ρ C p T t = λ x 2 T x 2 + λ y 2 T y 2 + λ z 2 T z 2 + q v
where ρ is the density of the battery, C p is the specific heat capacity of the battery, λ x , λ y , λ z is the thermal conductivity of the battery in three directions of x, y, and z, and q v is the heat generation rate per unit volume.
The heat sources of Li-ion batteries are mainly the electrochemical reaction heat, Joule heat, polarization heat, and side reaction heat [24]. Bernardi et al., based on the hypothesis of homogeneous heating, proposed a theoretical mathematical model of the heat generation rate, which can be written as Equation (4) [25].
q = I ( U o c V ) I ( T U o c T )
where I is discharge current, U o c is open circuit potential, and V is cell voltage. The first term is joule heat, including polarization heat, and the second term is entropy change heat. Electrochemical reaction heat is prominent only when the working temperature of the battery exceeds 80 °C, and the side reaction heat is very small so that they can be ignored generally, and only Joule heat and polarization heat are considered. The total heat generation rate is
q = q o + q p = I 2 ( R o + R p ) = I 2 R
where q is the total heat generation rate, qo is Joule heat, qp is polarization heat, Ro is battery ohmic resistance, Rp is polarization resistance, and R is equivalent internal resistance and is a constant in this paper.
The enthalpy model is adopted for the PCM phase-change process. In the model, the melt interface is not tracked explicitly. Instead, the liquid fraction, which indicates the fraction of the cell volume that is in liquid form, is associated with each cell in the domain. The mushy zone is modeled as a “pseudo” porous medium. The fraction of liquid phases in the control unit is used to describe the porosity. During the melting process, the fraction of the liquid phase gradually increases. Therefore, the porosity of phase-change materials increases from 0 to 1 after completely melting. When the phase-change material is completely solidified, the porosity decreases from 1 to 0, and the velocities also drop to zero.
The enthalpy model can be described with Equations (6)–(9) [26]. The volume fraction of liquid is defined as:
β = 0 T < T s o l i d s T T s o l i d s T l i q u i d s T s o l i d s T s o l i d s < T < T l i q u i d s 1 T l i q u i d s < T
The enthalpy of material is the sum of sensible enthalpy h and latent heat Δ H .
H = h + Δ H
and
h = h r e f + T r e f T C p d T
h r e f is the reference enthalpy, T r e f is the reference temperature, and C p is the constant pressure-specific heat capacity.
For the solidification and melting model, the energy equation is as follows:
t ( ρ H ) + · ( ρ ν H ) = · ( k T )
Here, H is enthalpy, ρ is the material density, and ν is fluid velocity.
The heat transfer of the air-duct and air is convection. The fluid flow and heat exchange processes are governed by three basic laws of conservation of mass, momentum, and energy. The energy equation has the same expression as Equation (9), while the continuity and momentum equations can be written as follows [27].
ρ t + · ( ρ ν ) = 0
t ( ρ v ) + · ρ ( v ν ) = P + μ 2 v
where μ is fluid viscosity and P is static pressure.
The two-sided wall with energy exchange is defined as the coupling boundary, including the convective heat transfer boundary of fluid and solid and the heat conduction boundary of solid and solid. The energy flowing in the coupling boundary should be equal to the energy flowing out. The coupling boundary in this paper includes (1) the inner surface of the PCM container–outer surface of PCM, (2) the PCM container outer surface–outer surface of the battery, (3) the outer surface of PCM container–outer surface of the air duct, (4) outer surface of the battery–outer surface of the air duct and (5) outer surface of the air-inner surface of the air duct. (1) to (4) are the solid–solid boundary. The boundary condition is as follows.
T s 1 = T s 2 , λ s 1 T n w = λ s 2 T n w
where, Ts1 and Ts2 are the temperatures on the two sides of the solid–solid wall, respectively, λ s 1 and λ s 2 are the thermal conductivity of two solid regions, respectively, and n   is the normal unit vector. (5) is a solid–fluid boundary, and the boundary condition is as follows.
- λ T n w = h ( T w T a i r )
where   λ is the thermal conductivity of aluminum since the battery shell and plate shell are both made of aluminum. h is the coefficient of the convective heat transfer and is calculated automatically using the CFD software. T w   T w and T a i r are temperatures of the air-duct inner surface and airflow, respectively.
In the two cooling systems in this paper, except for the inlet and outlet surfaces of the air duct and the coupling boundary surface, the remaining non-coupling surfaces are set as wall surfaces, which are an adiabatic surface with no slip, no rotation, and zero heat flow. The air-duct inlet is the velocity inlet, and the outlet is the pressure outlet. The initial conditions are mainly temperature and inlet velocity, which need to be determined according to experimental conditions, such as 25 °C, 5 m/s, etc.

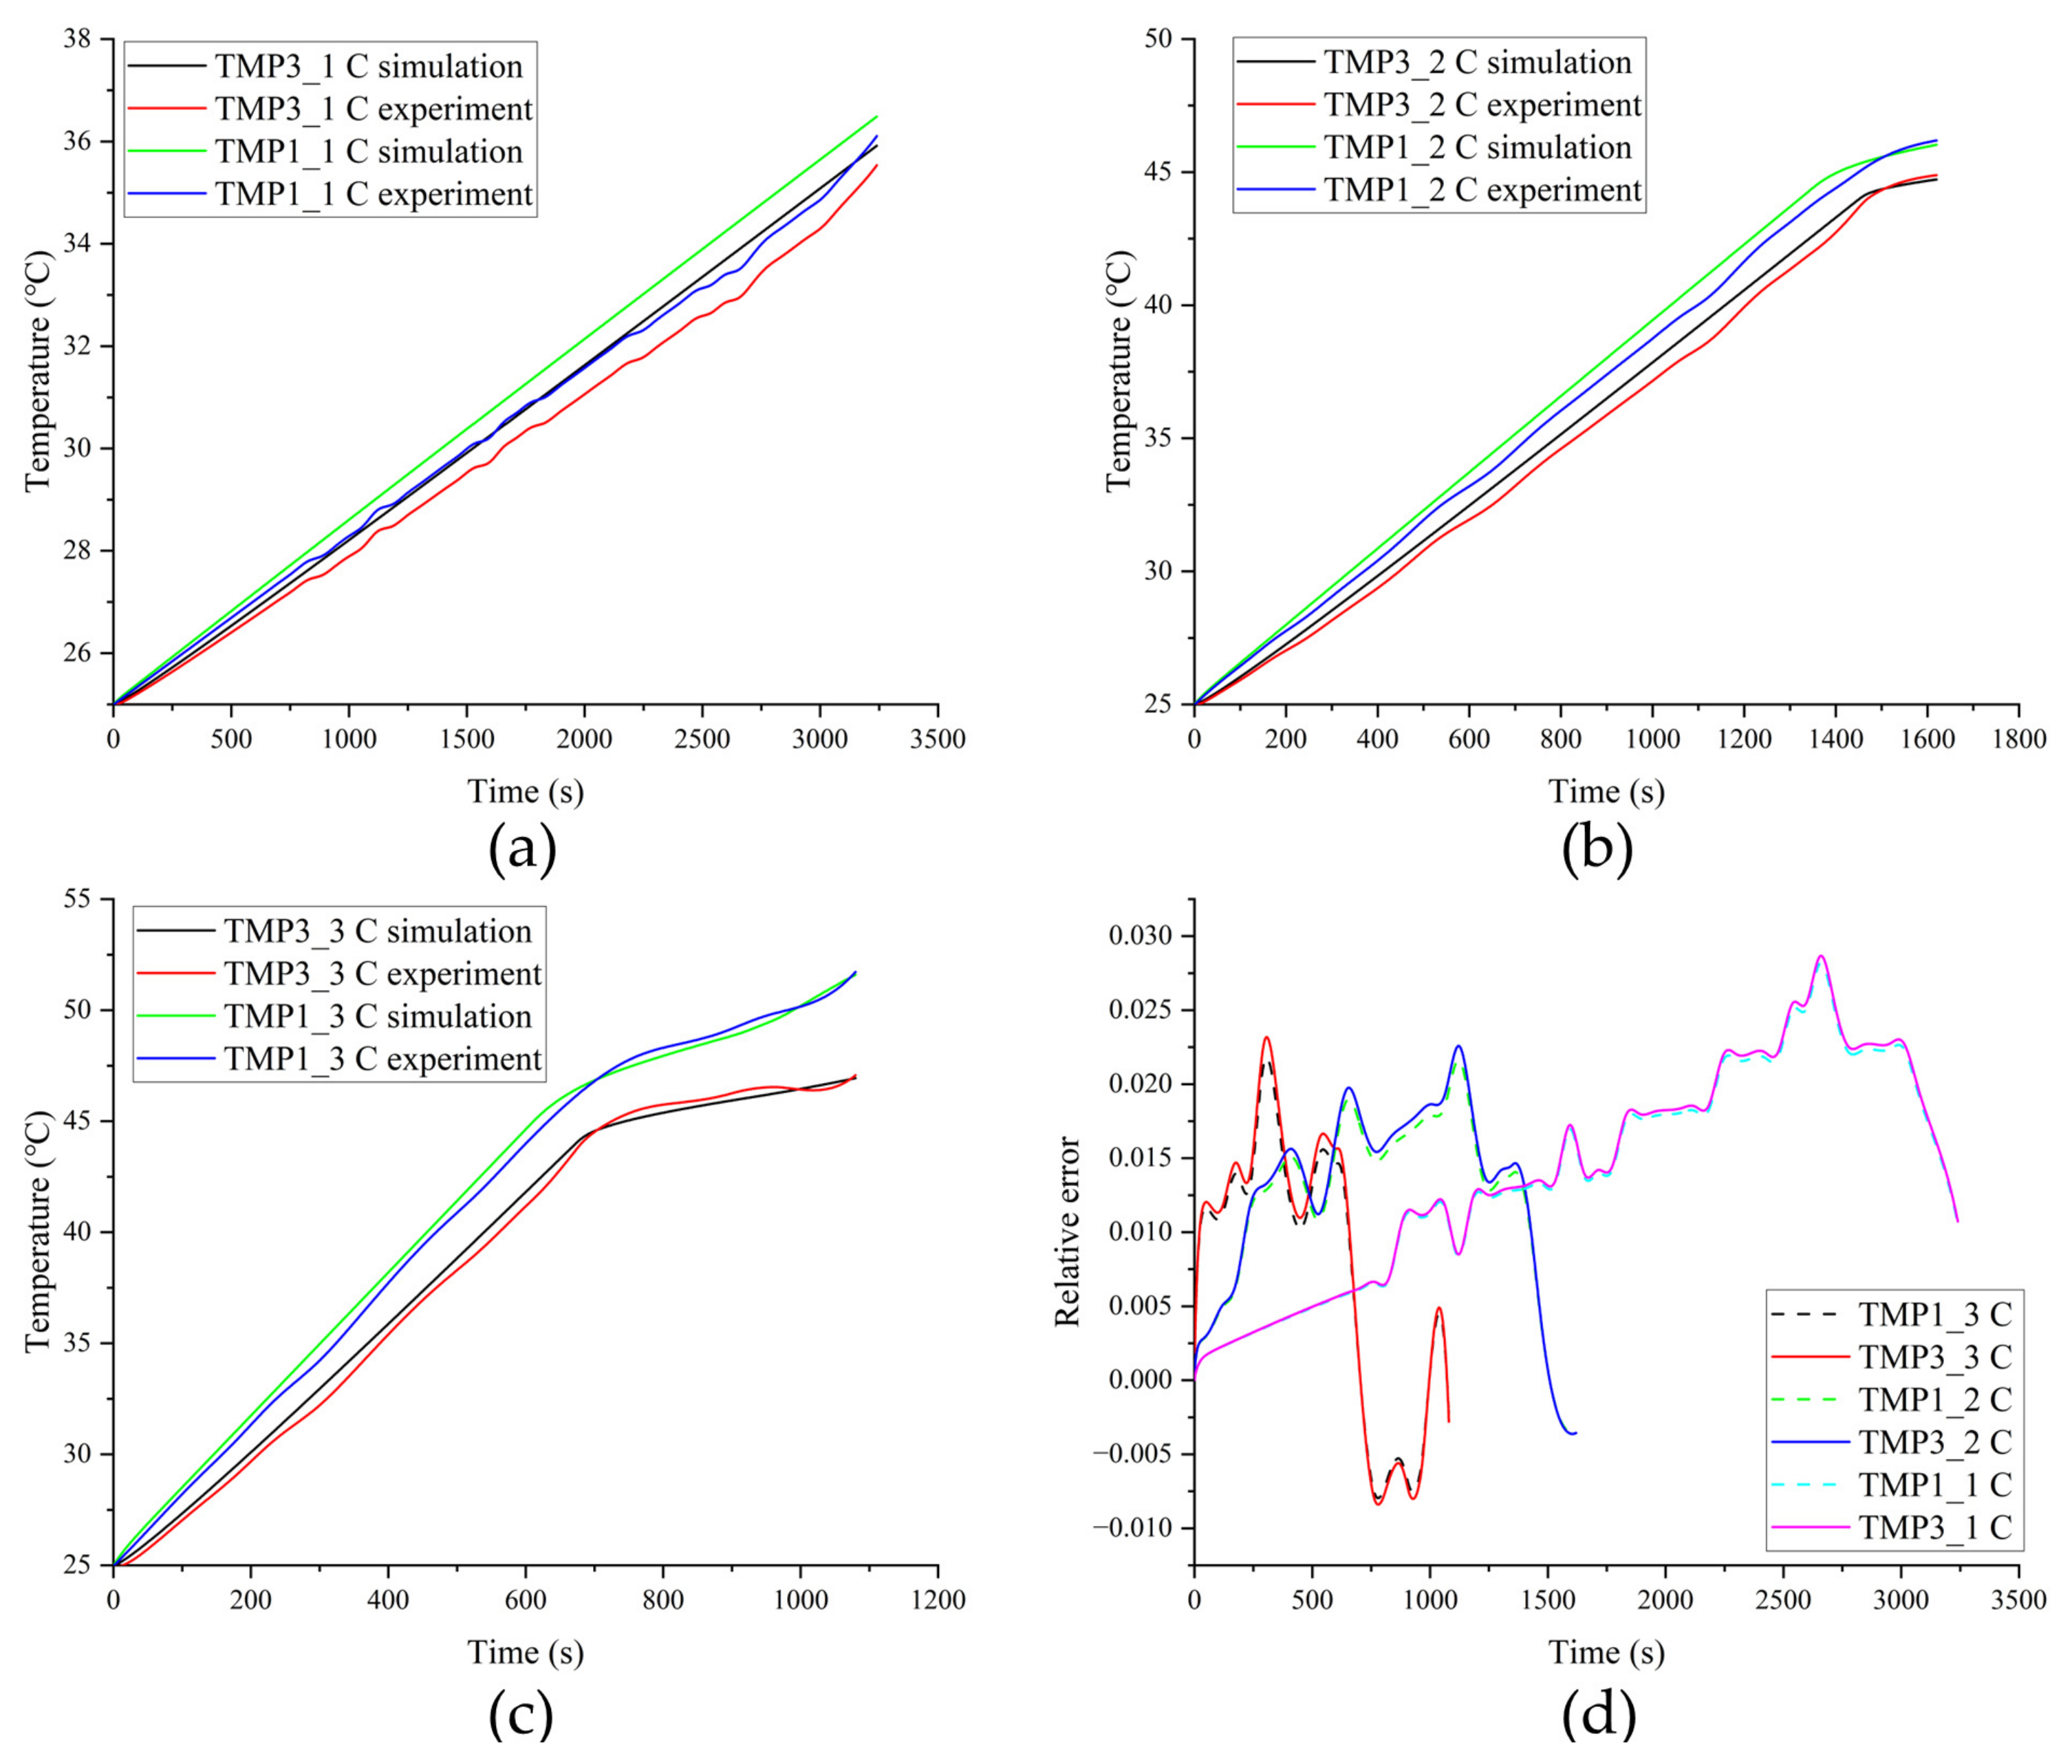
3.2. Model Validation and Uncertainty Analysis

In order to verify the validity of the model, TMP1 and TMP3 are used as representatives, one for TMP1 to collect high temperature and one for TMP3 to collect low temperature. The simulation results and relative errors under different discharge rates are shown in Figure 6a–d. It is observed that the maximum relative error of the model reaches 3% at a 1 C discharge rate. While the accuracy of model relative error is reduced at 2 C and 3 C discharge rates, and the maximum error is below 2.5%. This is due to the large relative error caused by the low-temperature rise and the small measurement temperature range at low discharge rates. Mean Absolute Error (MAE) and Root Mean Square Error (RMSE) are shown in Table 3. In view of the above, the accuracy of the model is acceptable.
In addition, the internal resistance of the battery, the current measurement accuracy, and the PCM thermal conductivity also cause the model error. As the PCM melts, the thermal conductivity of the PCM will change, which will affect the accuracy of the battery heat transfer model. The internal resistance of the battery includes ohmic resistance, polarization resistance, etc. The internal resistance of the battery will change with the temperature, the state of charge, and the service life of the battery, and thus it is necessary to develop an online high-precision identification method of the battery’s internal resistance in the whole life cycle to improve model accuracy. This can be facilitated by cloud computing. To improve the accuracy of battery current measurement, on the one hand, high-precision sensors are needed, and on the other hand, filtering algorithms can be used to suppress interference.

4. Results and Discussion

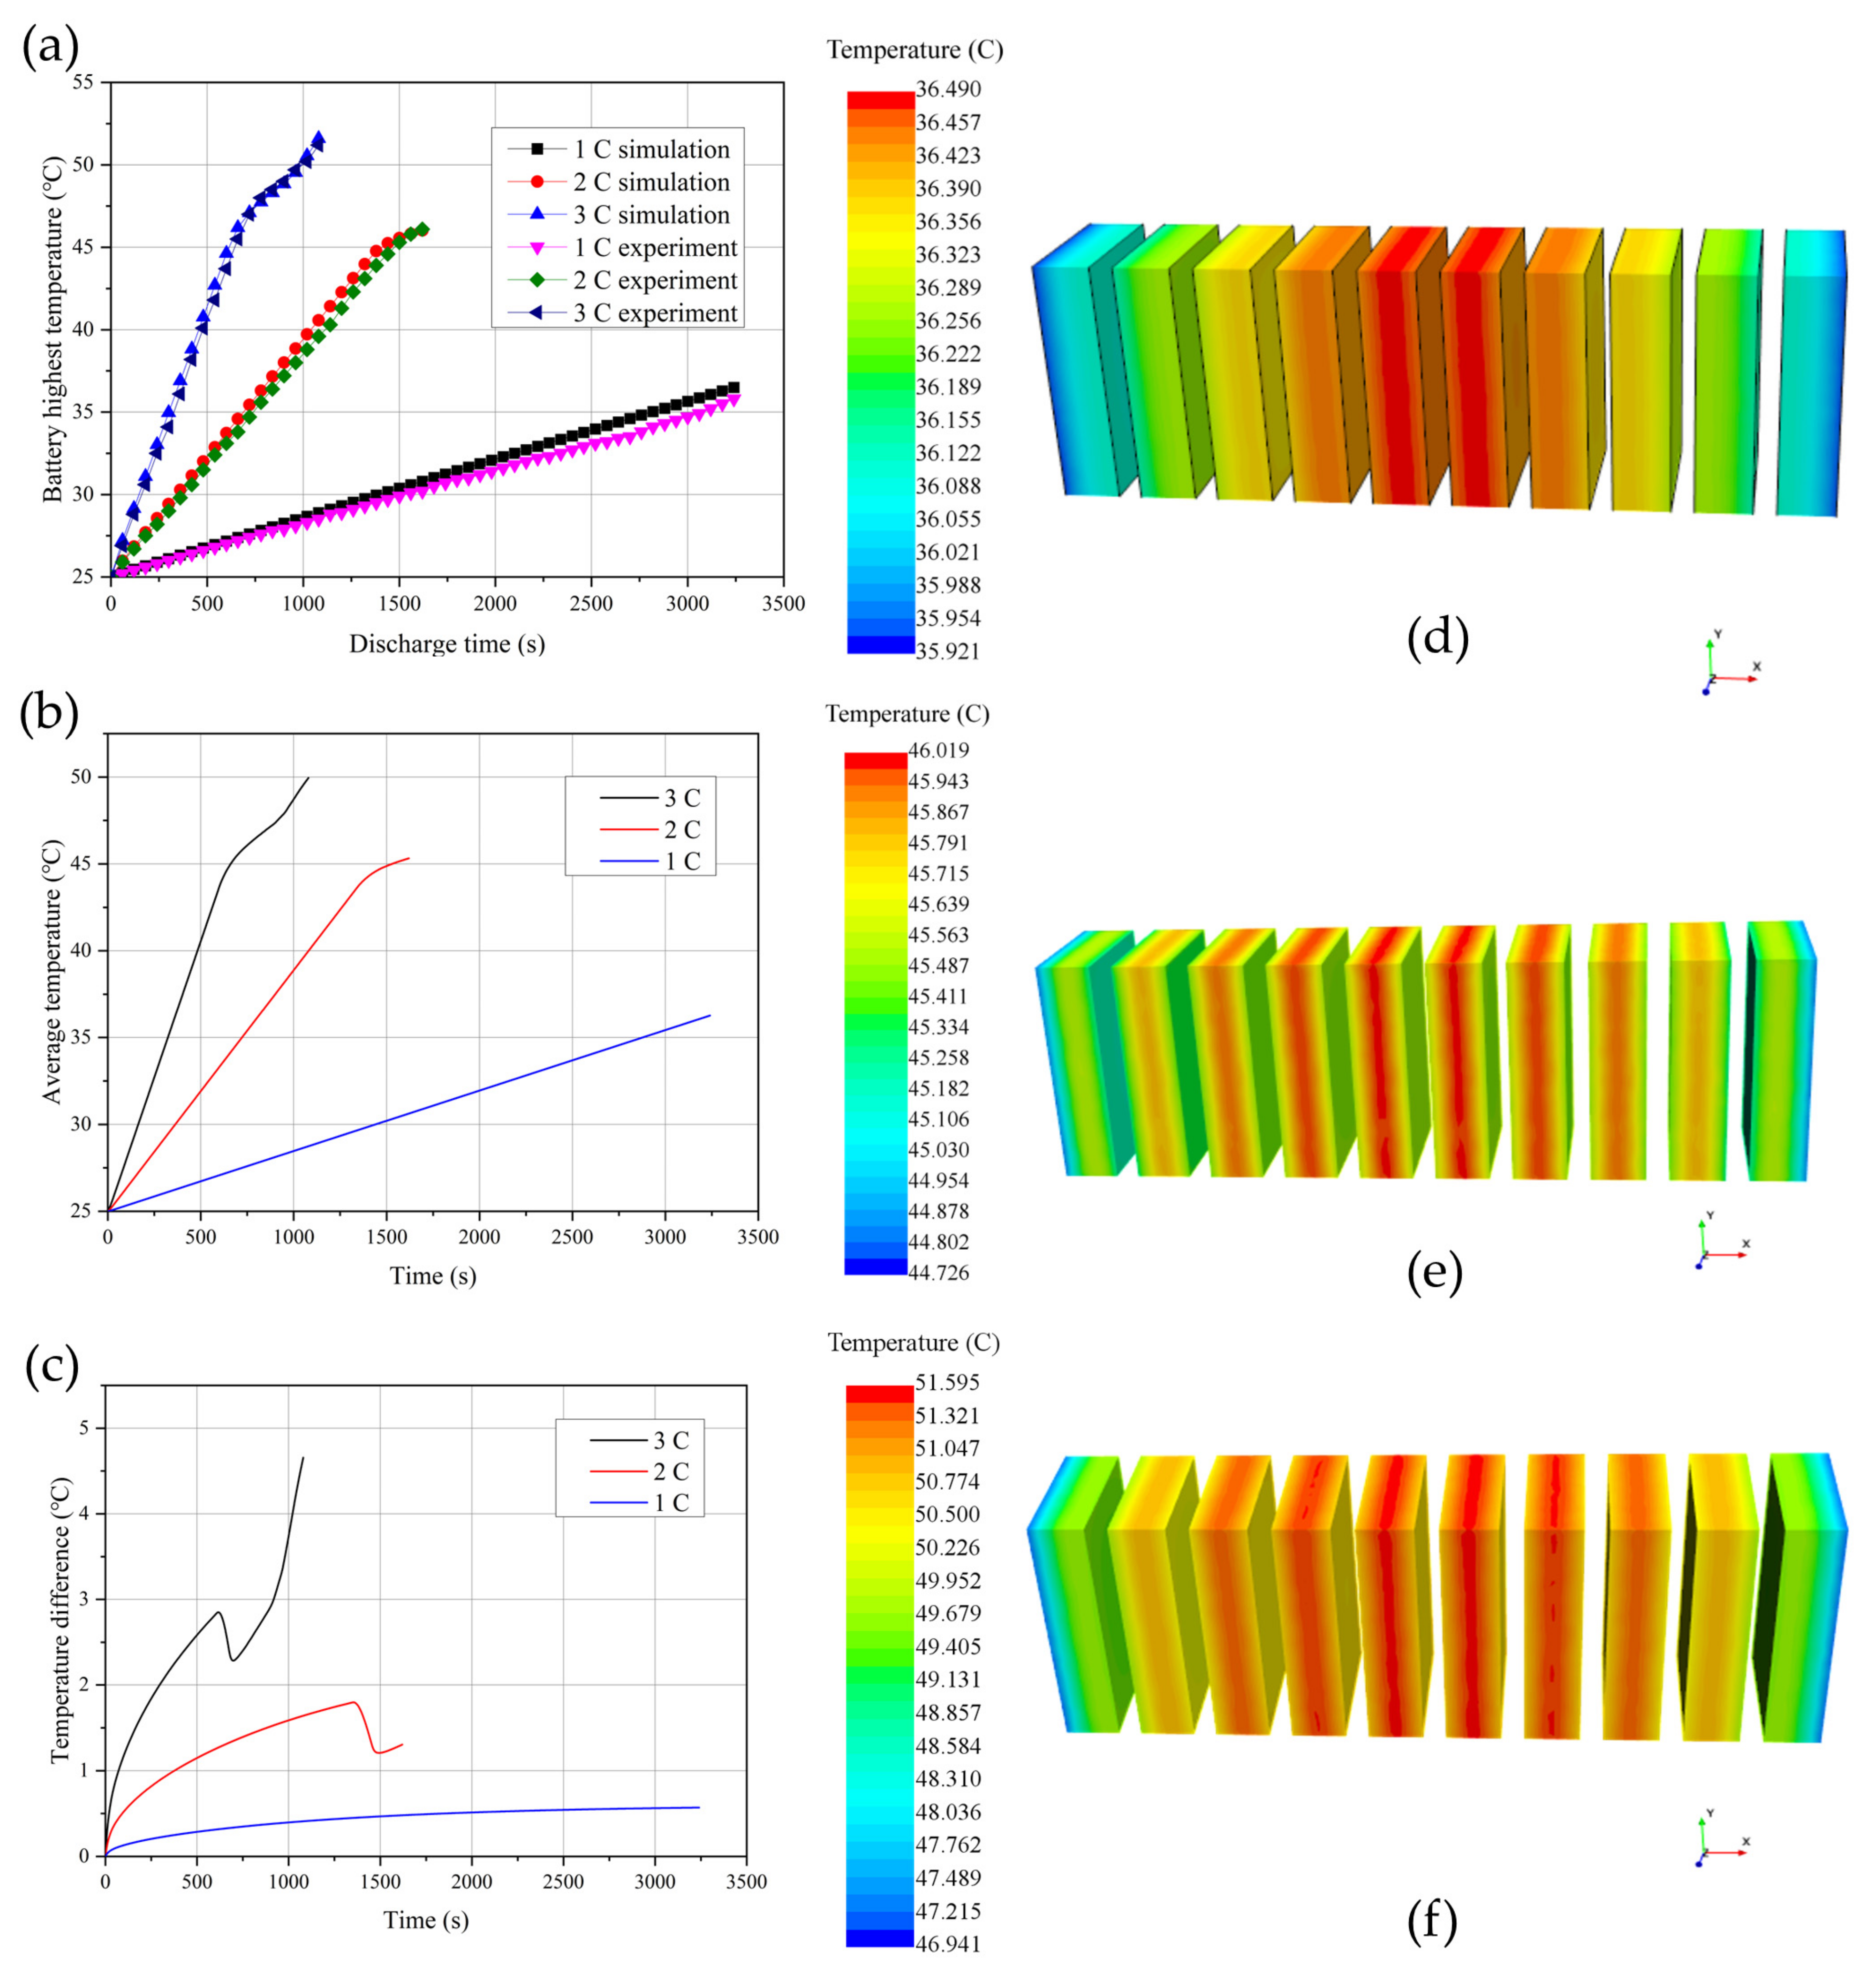
4.1. The Thermal Performance at Different Discharge Rates

Figure 7a is the temperature rise curve of the battery pack experimentally and simulated at different discharge rates of the finless PCM container. The experimental and simulation temperatures have the same rising trend when discharging. Modeling observations of the maximum temperatures are the same as experimental observations, with a maximum error of 3.19%. Hence, the model can be validated again. Figure 7b shows the average temperature rise curves at discharge rates of 1 C, 2 C, and 3 C, respectively. As can be seen in the figures, with the continuous discharge of batteries, the temperature of the batteries keeps rising, and the temperature curve of 1C discharge does not form a plateau, while temperature curves of 2C and 3C have obvious plateaus. This plateau is caused by a phase change latent heat effect. As can be seen from Figure 7a,b, the maximum surface temperature and average surface temperature of the battery pack at the end of 1 C discharge are only 36.491 °C and 36.265 °C, which are far lower than the phase-change temperature range of 44 °C~46 °C. Therefore, no obvious temperate curve plateau is observed. This is because the heat generated by the battery pack has been absorbed by the sensible heat of the whole heat dissipation system. When the battery temperature is lower than the phase-change temperature, the experimental temperature value is lower than the simulated temperature value, which is mainly because the thermal chamber cannot be completely sealed, and some heat generated by the battery will be transferred to the insulating material and air. When the temperature of the battery is in the temperature plateau, the experimental temperature is higher than the simulation temperature. This is because the thermal conductivity of liquid PCM is lower than that of solid PCM. The thermal conductivity of liquid PCM is set to the thermal conductivity of solid PCM in simulation. The lower thermal conductivity makes it difficult to transfer heat to the interior of the PCM in the experiment, so the temperature plateau in the experiment is higher than that in the simulation. By observing the experimental temperature curve of 1 C in Figure 7a, it can be found that in the later stage of discharge, the heat generation rate of the battery increases significantly due to polarization and internal resistance, and the internal resistance increases with increasing temperature. Thus, the temperature rise rate will increase significantly at this stage. However, there is no obvious tendency to accelerate the temperature rise during 2 C and 3 C discharging. First, they all enter the phase-change zone at a later stage, and the temperature plateau eliminates the effect of accelerated temperature rise. Second, the discharge time is short under a high discharge rate, and the battery stops discharging as soon as the side reaction and polarization reaction are in the initial stage.
When discharging at 2 C, the temperature plateau indicates that the PCM has entered the phase-change stage, and the latent heat of PCMs begins to absorb heat. Because the phase-change temperature of paraffin is a temperature range, the temperature plateau is not a horizontal curve but a curve with almost no temperature rise. At the end of the discharge, the temperature plateau did not end. The maximum temperature is 46 °C, which does not exceed the optimal working temperature of the battery pack by 50 °C. It is noteworthy that the phase-change temperature range of PCMs is 44–46 °C, but the surface temperature of the battery begins to enter the temperature plateau period at about 45 °C. This is because the pure paraffin chosen in this paper has a low thermal conductivity, and the heat transfer from the cell to the paraffin is slow. Therefore, some heat will accumulate on the surface of the battery, which will slightly increase the starting point of the temperature platform.
From the temperature rise curve of 3 C discharge, it can be seen that in the platform area of the temperature curve, the maximum surface temperature of the battery pack does not exceed 50 °C, but after the platform area, the maximum temperature rises rapidly before the end of the discharge, reaching 51.6 °C. On the one hand, when discharging at 3 C, the discharging time is shorter, and the battery generates more heat. On the other hand, the thermal conductivity of pure paraffin PCMs is lower, the discharging time at a low discharge rate is longer, and the PCMs can absorb more temperature, while the time of PCMs absorbing heat becomes shorter at a high discharging rate. Therefore, the starting point of the 3 C discharge temperature plateau is higher than that of the 2 C discharge temperature plateau.
Figure 7d–f show the temperature fields of the battery pack at three discharge rates. The temperature of the battery pack is symmetrically distributed along the X direction, the middle temperature is high, and the temperature on both sides is low. The highest temperature appears in four directions of the Y and Z directions near the two batteries in the middle, while the lowest temperature appears on the outer faces of the two batteries near the sides. This is because the internal battery is more affected by the heat of other batteries, while the edge battery is less affected by other batteries. Due to the bad heat dissipation conditions, the propagation features of the middle battery need to be studied if it is in a thermal runaway state. Therefore, thermal barrier and heat removal are critical to the battery.

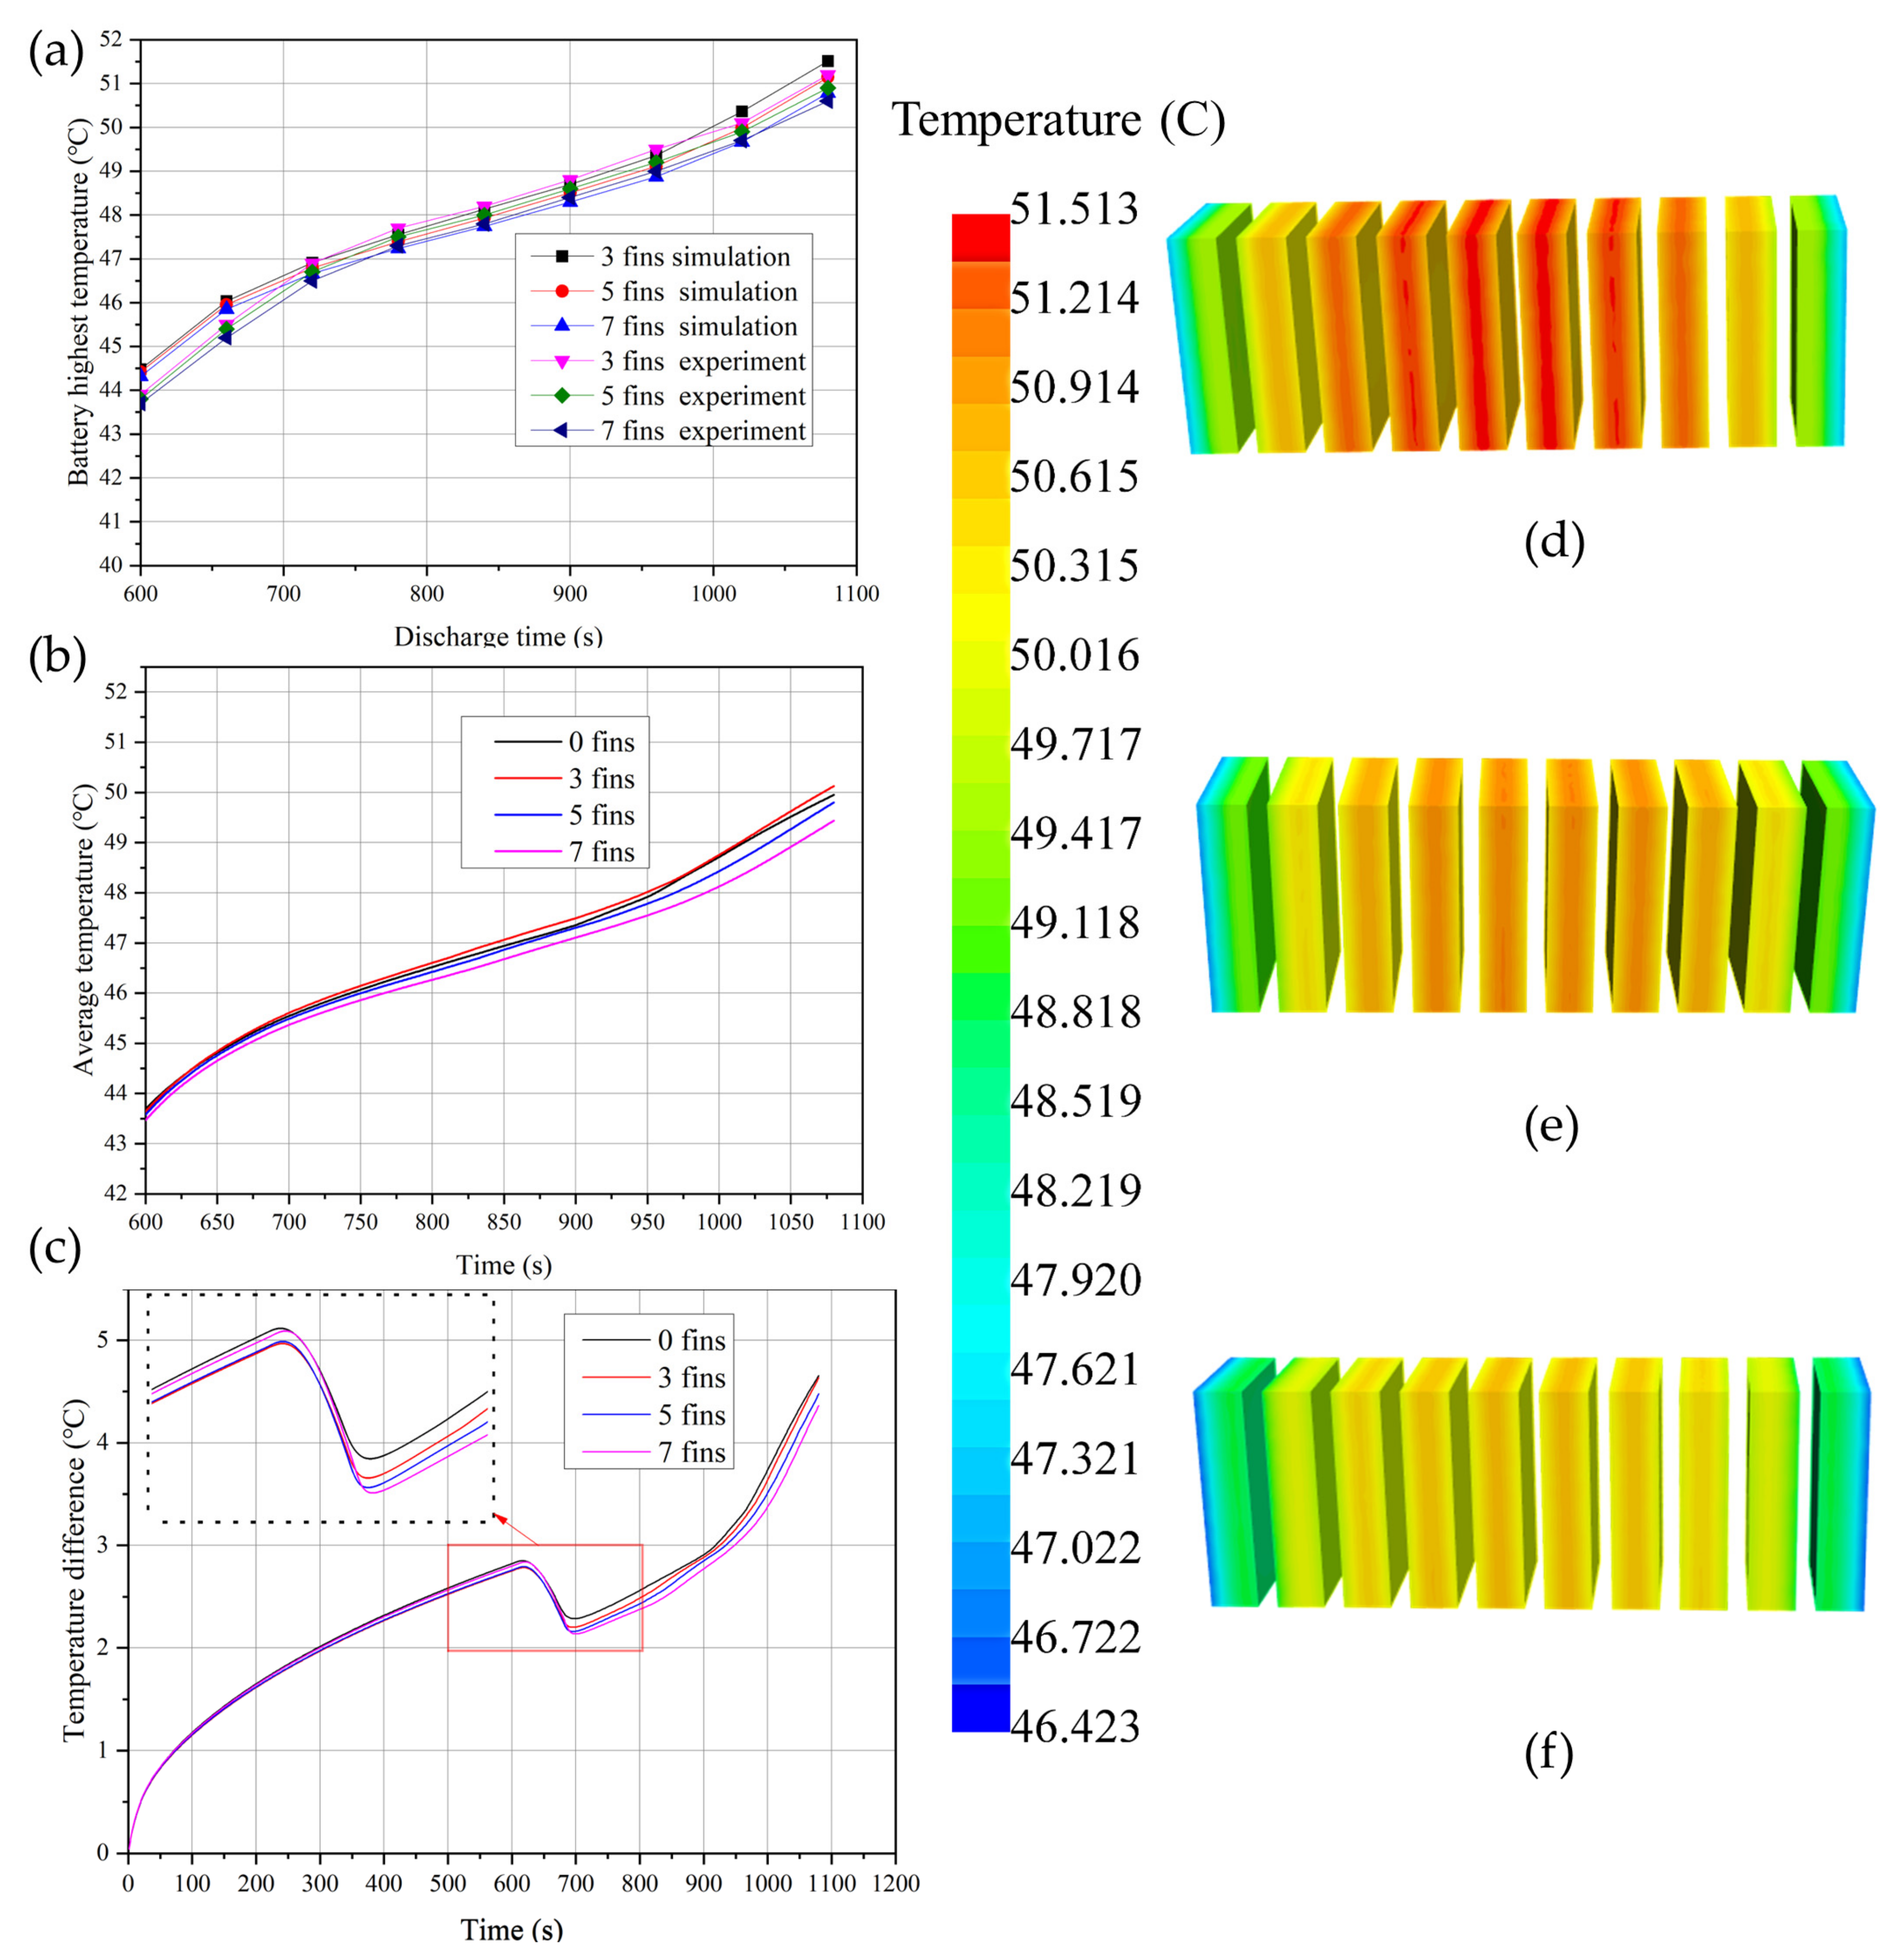
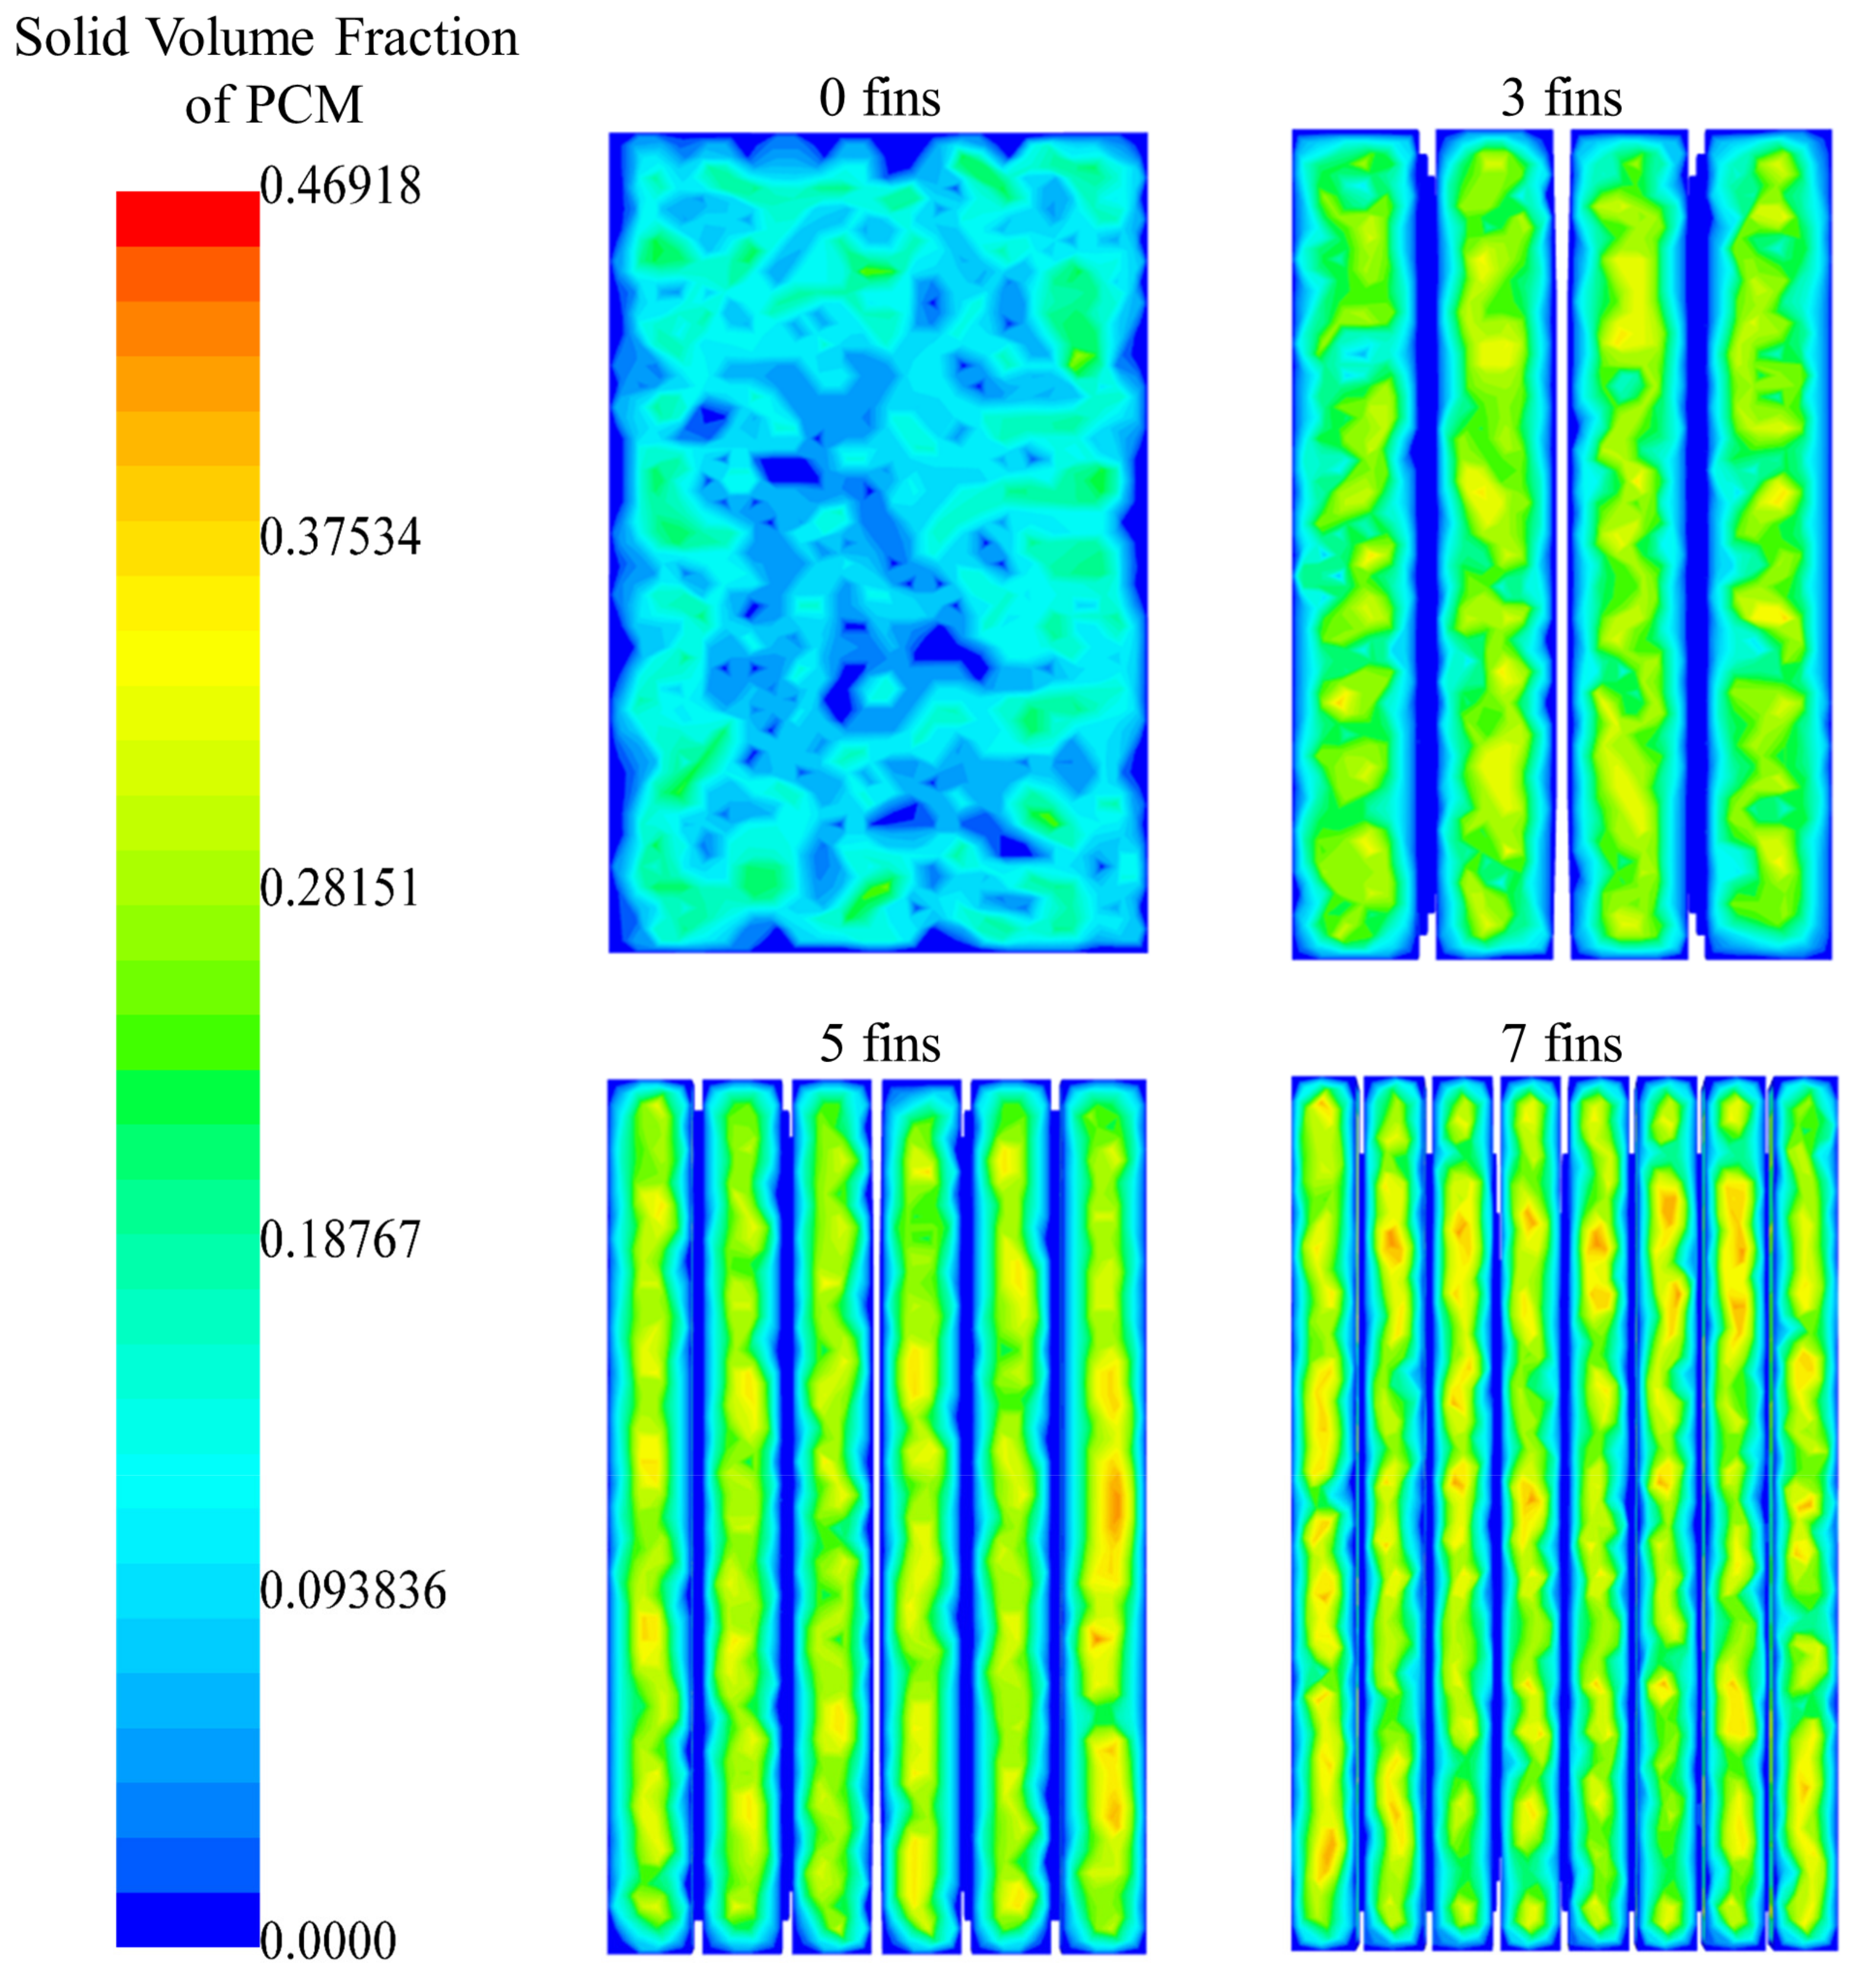
4.2. Fin Effect on Cooling System

Since the maximum temperature of the battery is more than 50 °C and the maximum temperature difference is large when the discharge rate is 3 C, the discharge rate of 3 C is chosen to study the influence of the number of fins on the battery cooling system.
The max, average temperature, and temperature difference curves of PCM container cooling systems with different fin numbers are shown in Figure 8a–c, respectively. The experimental and model temperatures have the same rising trend on different fins. Modeling observations of the maximum temperatures are the same as experimental observations with a maximum error of 1.42%; hence, the model can be validated again. As can be seen from Figure 8a–c, Increasing the number of fins reduces the max, average temperature, and temperature difference on the battery surface.
As can be seen from Figure 8a, under the influence of thermal convection of liquid PCM, the fluctuation of temperature plateau will occur in the experiment, but the fluctuation will be reduced with the increase in the fin number. This is because the increase of fin makes the flow range of liquid PCM smaller, thus reducing the influence of thermal convection.
Figure 8d–f are the temperature field diagram of the PCM cooling system with different fins. It can be seen from the figures that the maximum temperature of the battery surface decreases at the end of discharge with the increase of fins. Compared with the final temperature of a battery surface without fins, the final temperature of a battery surface with three fins, five fins, and seven fins is 51.5 °C, 51.1 °C, and 50.8 °C respectively, which decreases by 0.1 °C, 0.5 °C, and 0.8 °C. Among them, the temperature drop in the 3-fin is lower. The main reason is that part of the PCM in the PCM container is replaced by an aluminum fin, and the heat capacity of aluminum is only about half of that of the PCM. Although the heat transfer area of the 3-fin PCM container is increased, the temperature will be higher when the sensible heat capacity absorbs the same heat. Therefore, the temperature of the 3-fin PCM container decreases only a little. The same reason makes the average temperature curve of the 3-fin plate even higher than that of the 0-fin plate, which can be seen in Figure 8b. When the volume of fins is fixed, the heat transfer area of 5- and 7-fin PCM containers increases significantly, so the maximum temperature decreases. In addition, from Figure 8c, the maximum temperature difference of the battery pack decreases with the increase in the number of fins. The results are 4.6 °C, 4.5 °C, and 4.4 °C respectively. It can be seen from the temperature difference curve that when the phase transition starts, there will be obvious inflection points, which correspond to the plateau of the maximum temperature and the average temperature curves. As can be seen from Figure 8a–c, with the increase in the number of fins, the time of the temperature plateau is prolonged, and the temperature decreases. Among them, the temperature plateau period of a PCM container without fins is 129 s, the average temperature is 48.4 ℃, and the temperature plateau period of a battery surface with seven fins is 220 s, and the average temperature is 47.7 °C. Therefore, the temperature plateau period was prolonged by 91 s, and the average temperature was reduced by 0.7 °C.
In principle, the temperature range of the battery surface temperature plateau should be the same as that of the PCM, that is, 44 °C~46 °C, with an average temperature of 45 °C. The average temperature of the plateau on the surface of the battery without fins is 3.4 °C higher than that in the ideal state (45 °C), so the average temperature of the plateau on the surface of the battery with seven fins is reduced by about 20.1% relatively, and the effect is obvious.
As mentioned above, adding fins to the PCM container can prolong the period of the temperature plateau and reduce the average temperature of the temperature plateau, thus making the temperature control effect closer to the ideal state. At the same time, this phenomenon also shows that after discharge, due to the low thermal conductivity of pure PCMs, the external heat is not easily transferred to the interior of PCMs in time, and then some phase change cannot occur.

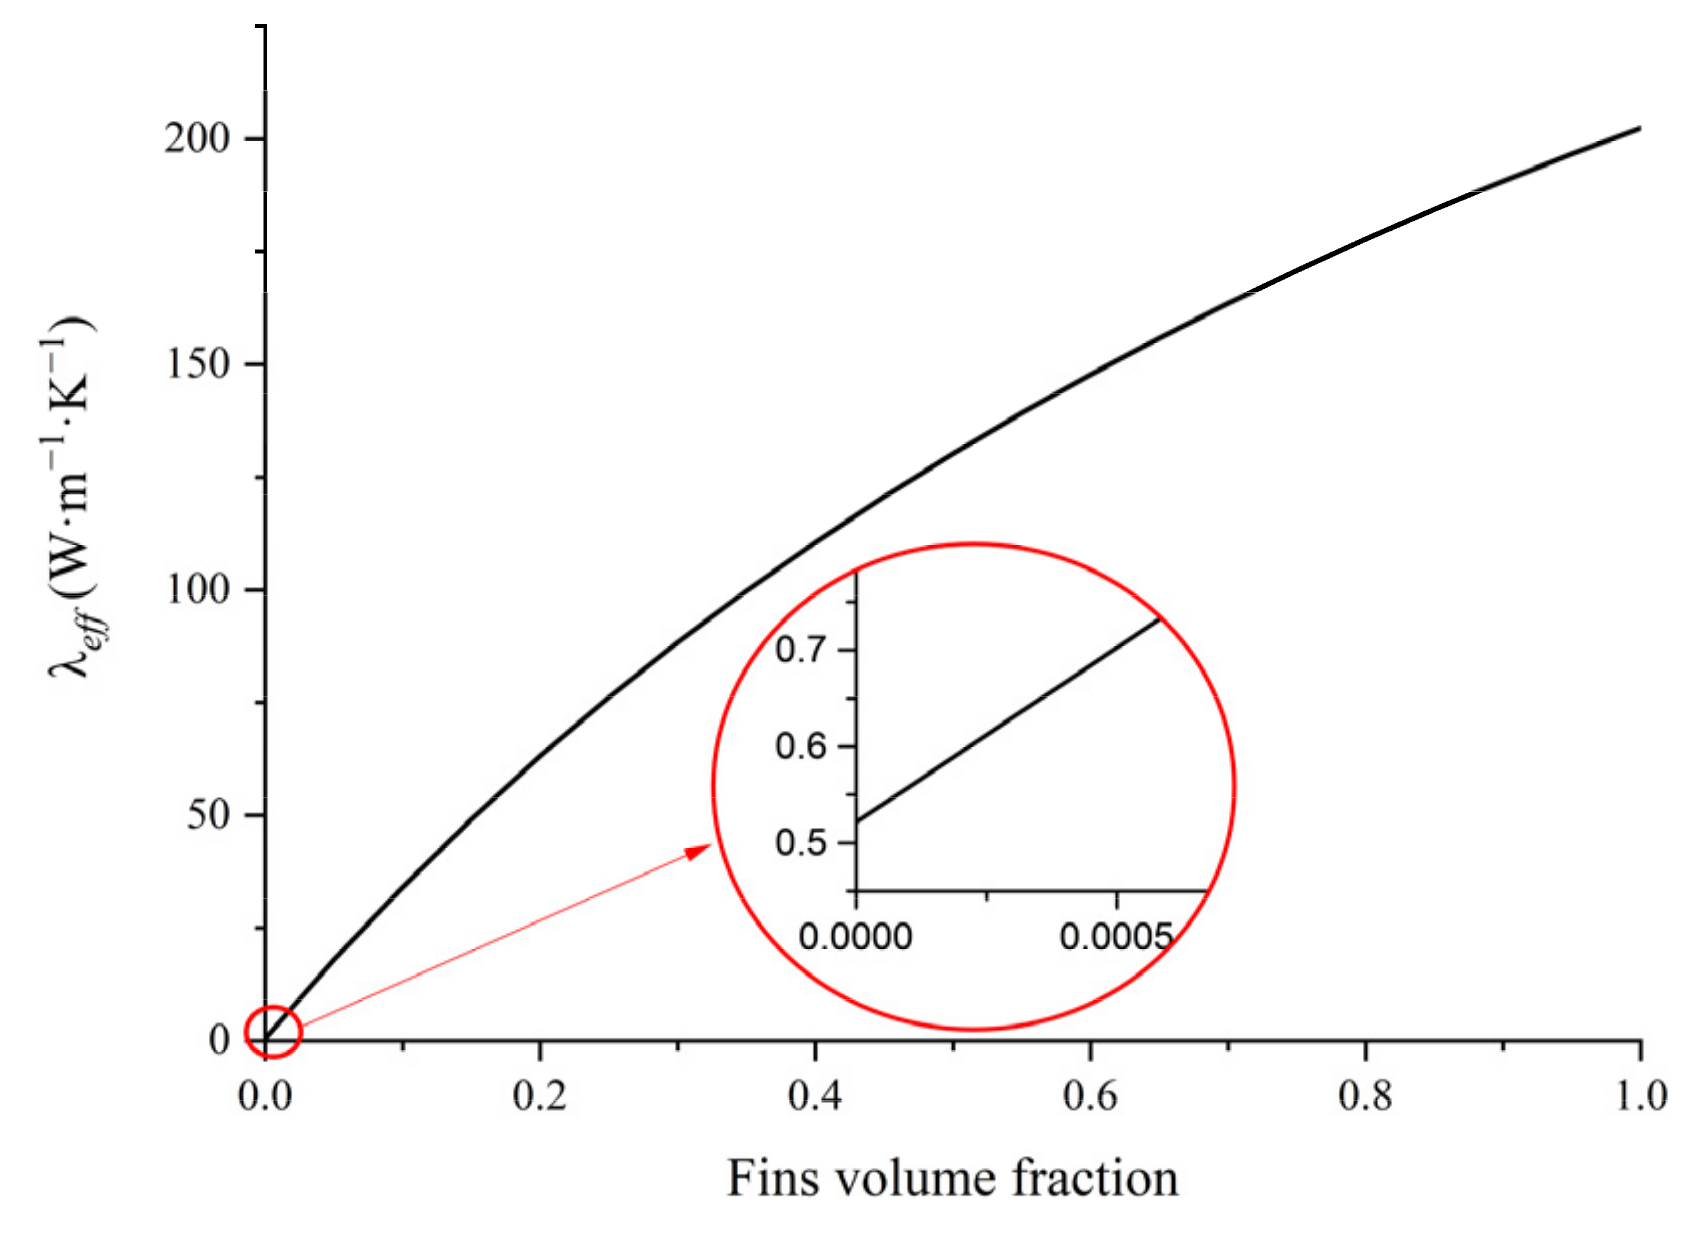
4.3. PCM Container Heat Transfer Analysis

A PCM container with fins packing the PCM is the main factor in deciding the BTMS performance; hence it is necessary to establish a theoretical model to analyze the heat transfer performance. The PCM container heat transfer includes heat conduction with an aluminum shell, fins, PCM, and latent heat absorption. For the computational efficiency, the following assumptions are made: (1) The effect of liquid convection in the process of phase change is ignored; (2) The temperature changes slowly in the process of phase change, which is considered as steady-state heat conduction; (3) The contact thermal resistance of each contact surface is ignored; (4) The heat transfer only occurs between the PCM container and the battery. The convection and thermal radiation between the PCM container and the surrounding environment are ignored. The thermal resistance mode is shown in Figure 9, in which the dimension is amplified, and the ratio is not as same as the real PCM container. H is the PCM container height which is vertical to the paper. Assuming that an even heat resource is allocated at the left side, the left side temperature is TA, and the other side is TB.
The dimensions are constrained by Equations (14) and (15).
L = 2 L 1 + L m i d
W = ( n + 1 ) W p c m + ( n + 2 ) W f i n
where L 1 is the thickness of the PCM container, L m i d is the thickness of PCM and fins, W is the width of the PCM container, W p c m is the width of the PCM block, and W f i n is the width of the single fin.
The volume fraction of fins α can be written as Equation (16):
α = ( n + 2 ) W f i n ( n + 1 ) W p c m + ( n + 2 ) W f i n = ( n + 2 ) W f i n W
Total thermal resistance is as Equation (17).
R t o t = 2 R A l + n + 2 R f i n + n + 1 R p c m 1
where R t o t is total thermal resistance, R A l is the aluminum shell thermal resistance, R f i n is the fin thermal resistance, R p c m is the thermal resistance of the PCM block separated by fins, and n is the fin quantity.
PCM equivalent thermal resistance is as follows:
R p c m = L mi d λ p c m W p c m H
λ p c m is PCM thermal conductivity. It is worth noting that the conduction of PCM is variable during phase change; the equivalent thermal conductivity is relevant to the volume fraction of liquid.
The fin equivalent thermal resistance is
R f i n = L mi d λ A l W f i n H
Since fins are made of aluminum, the thermal conductivity of fins is aluminum conductivity, and the upper and lower sides are regarded as fins, too, when calculating the equivalent thermal conductivity.
“Aluminum shell” refers to right- and left-side shells and the aluminum shell equivalent thermal resistance is
R A l = L 1 λ A l W H
The total PCM container effective conductivity can be written as Equation (21).
λ e f f = L R t o t W H
We can get Equation (22) from Equation (14) to Equation (21)
1 λ e f f = β λ A l + 1 β α λ A l + λ p c m ( 1 α )
where β = 2 L 1 L .
In this paper, L 1 = 2 mm, L = 9   mm , λ A l = 202.4 W·m−1·K−1, and λ p c m = 0.29 W·m−1·K−1.The relationship between PCM container effective conduction and the fin volume fraction is illustrated in Figure 10. The effective thermal conductivity increases rapidly at low volume fraction while increasing slowly at high volume fraction zone. Hence, improving the fin volume fraction can enforce PCM container heat transfer. However, the volume fraction of the PCM container and the heat capacity of the phase-change material are contradictory. If the volume fraction is too large in the finite volume, the latent heat capacity of the PCM will be insufficient. When the volume fraction is constant, increasing the number of fins will increase the contact area between the fins and the PCM, so the heat conduction ability of the PCM container can be enhanced.
Fins are crucial for PCM container heat transfer. At the discharge end of 3 C, the solid volume fraction of PCM is shown in Figure 11, where the plate is the first plate. The PCM of the plates (2 to 10) was melted completely because the plates (2 to 10) had bad heat transfer conditions. As can be seen in Figure 11, the solid volume fraction increases when the number of fins increases. That means the fins can improve heat transfer performance, and meanwhile, the fluidity became smaller because of the high solid volume fraction. In addition, the solid PCM in the container with zero fins is mainly located between the core and the side of the container. At the same time, the PCM in the core and side is melted more completely. The PCM in the plate with fins is distributed more evenly because of the fins separating. Hence, the liquid phase of PCM has smaller space in the plates with fins, and the PCM structure is more stable.

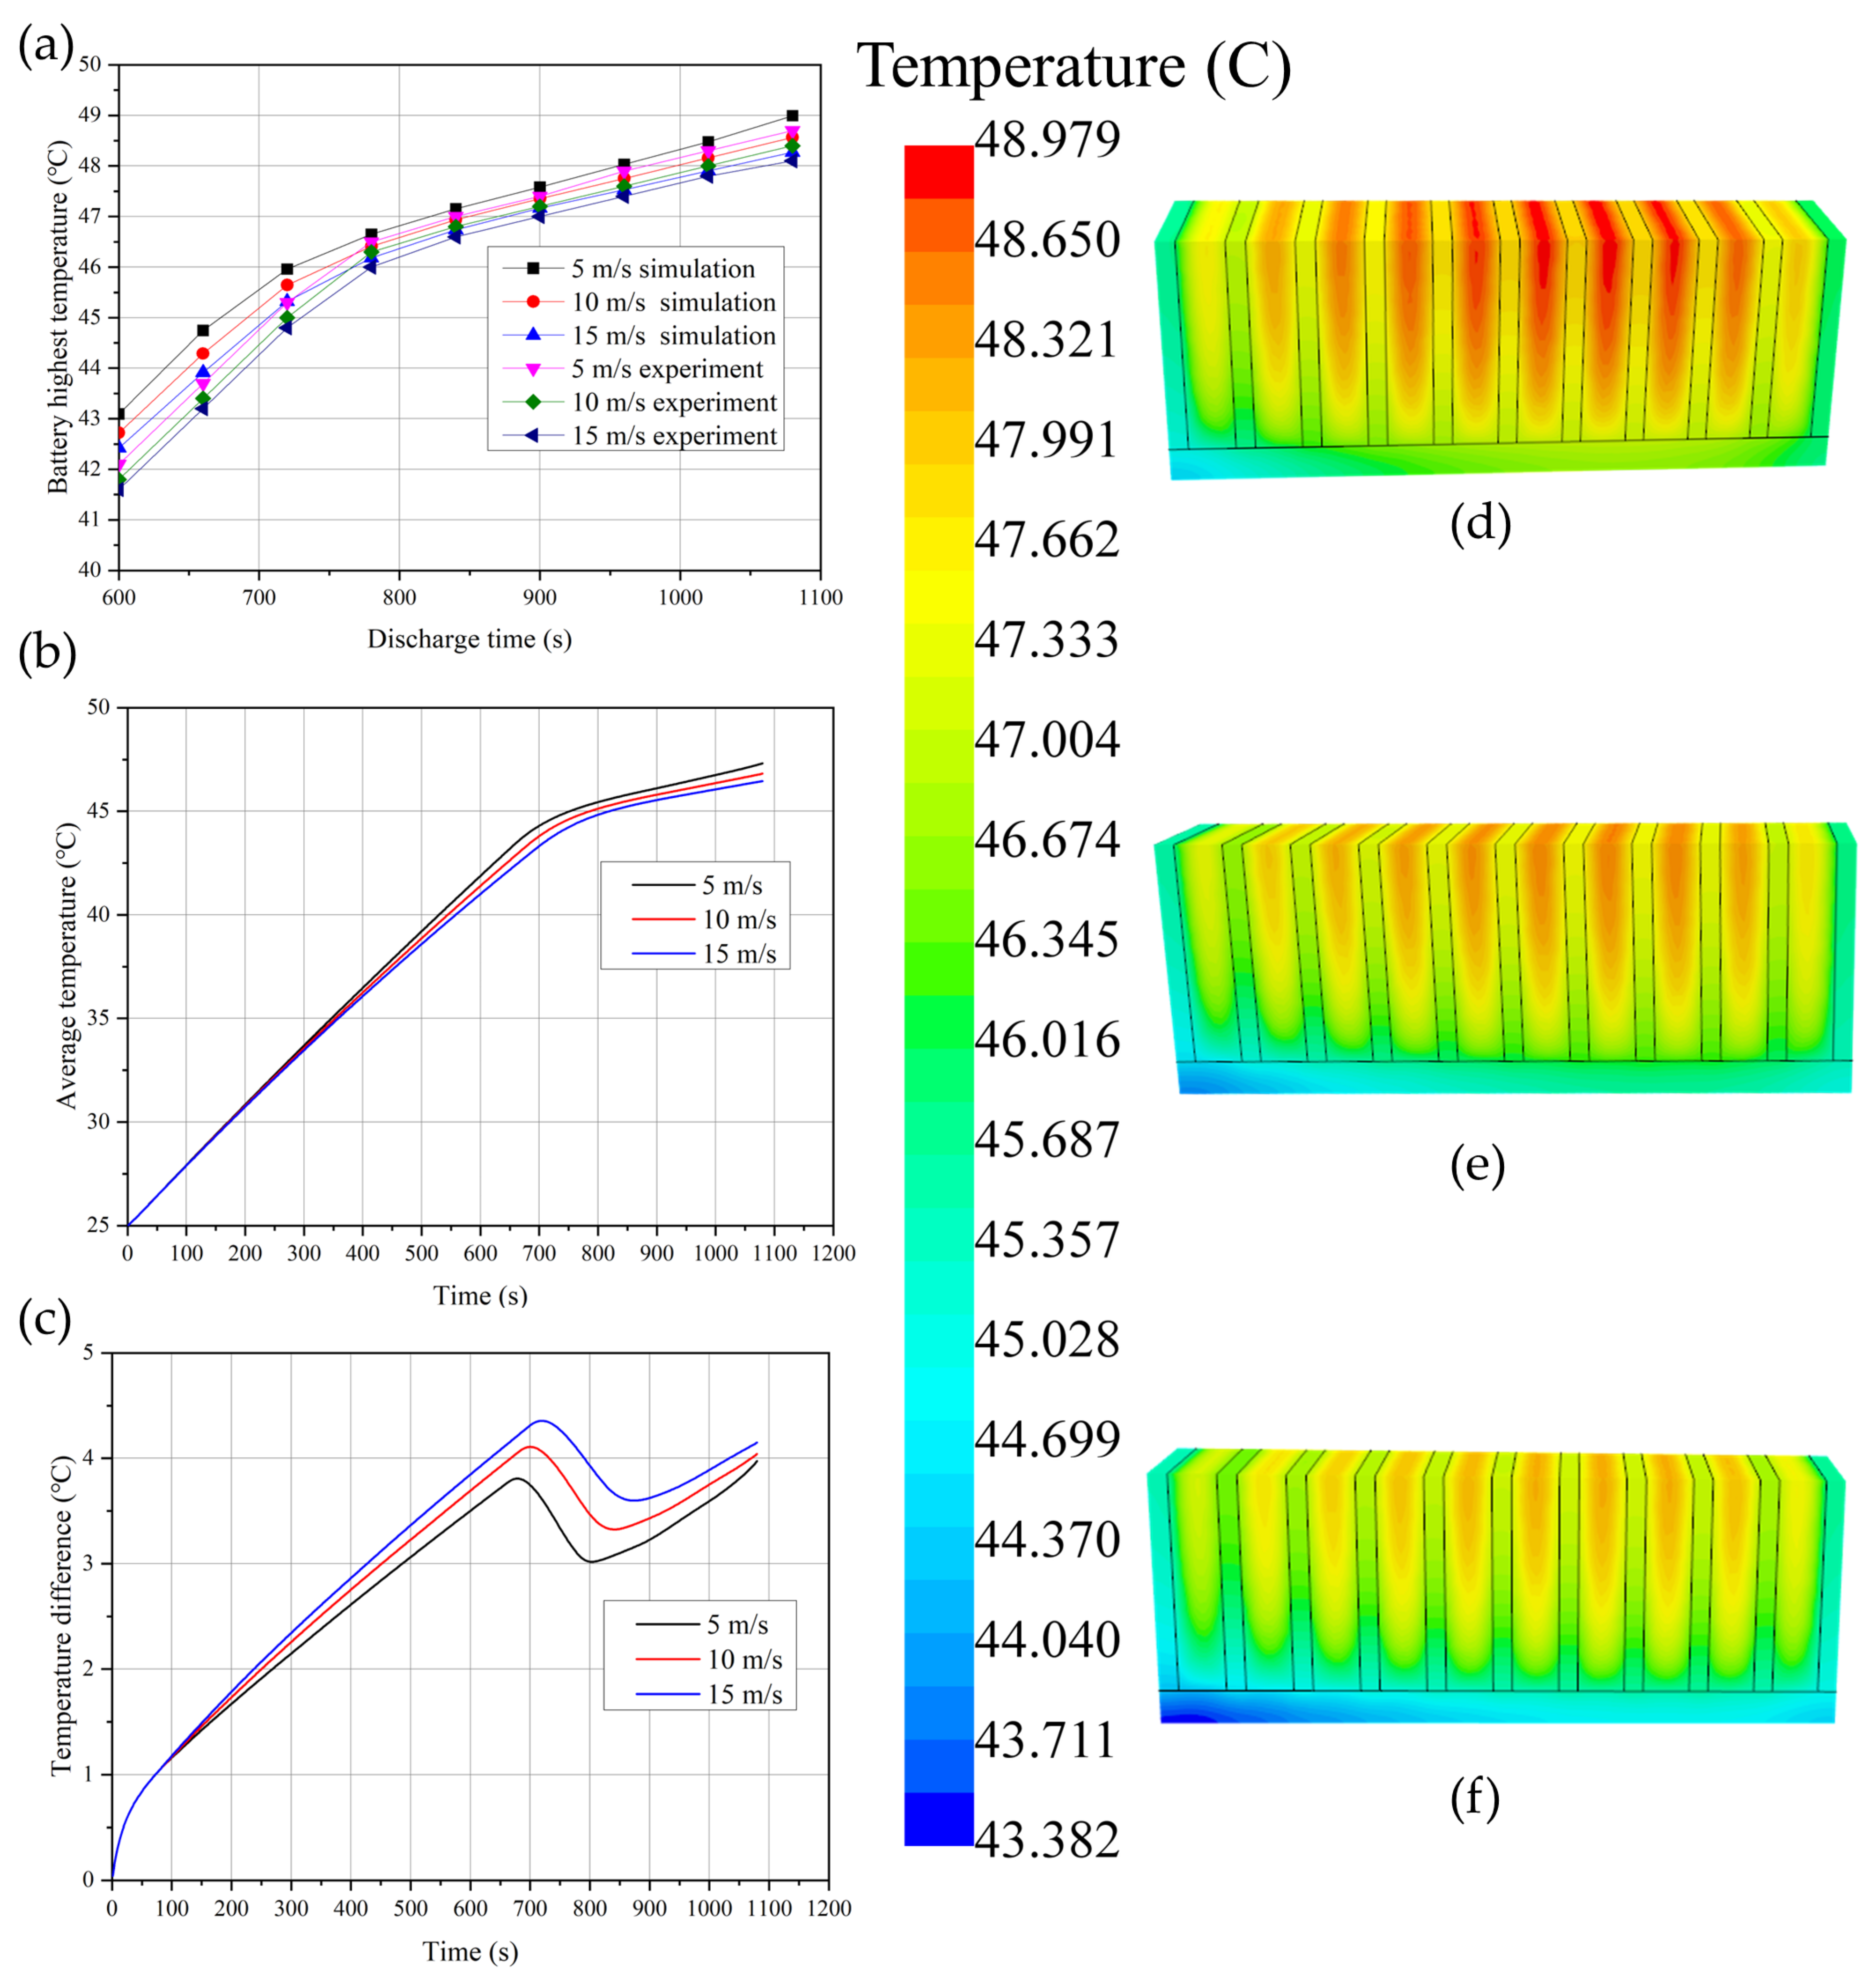
4.4. Phase-Change Materials PCM Container Coupled with Forced-Air Cooling

At a 3 C discharge rate, the maximum surface temperature of the PCM container cooling system exceeds the optimum temperature of 50 °C, and adding fins in the PCM container cannot reduce the temperature below 50 °C. Therefore, some heat can be taken away by forced-air cooling to control the maximum temperature of the battery in the optimum operating temperature range. Figure 12a is a temperature rise curve. Experiment and simulation results have the same trend; the maximum error is 2.21%.
It can be seen from Figure 12a–c that with the increase in wind speed, the maximum and average surface temperature of the battery pack decrease in the whole discharge process, but the temperature difference is enlarged. The maximum temperature drop at different wind speeds is not as large as the minimum temperature drop, which results in the maximum temperature difference of the battery pack increasing with the increase in wind speed. The maximum temperature of the battery is in the phase-change zone, so it is difficult to reduce the maximum temperature by increasing the wind speed, while the minimum temperature is not in the phase-change zone, so it is easier to reduce the minimum temperature by increasing the wind speed. As a result, the temperature difference increases with the wind speed. It also can be seen that the higher the wind speed is, the lower the phase-change temperature is, and the later the start point of the phase change is.
With the increase in wind speed, both the maximum temperature and the minimum temperature decrease, and the maximum temperature can be effectively controlled within 50 °C, and the maximum temperature difference can be controlled within 5 °C.
Compared with the 7-fin PCM cooling system without forced air cooling, the maximum temperature is reduced by 1.793 °C, 2.218 °C, and 2.515 °C, and the minimum temperature is reduced by 1.38 °C, 1.87 °C, and 2.274 °C, respectively. The maximum temperature difference of the battery pack is also less than 4.363 °C without air cooling.
Figure 12d–f are the temperature field diagrams of the PCM container coupled forced-air cooling system. The wind velocities are 5 m/s, 10 m/s, and 15 m/s, respectively. As can be seen, when forced-air cooling is added to the cooling system, the position of the highest temperature on the surface of the battery pack begins to shift towards the outlet of the duct, and the greater the wind speed, the greater the deviation. This is because of the forced-air convection effect. For a single cell, the higher the wind speed, the more the maximum temperature is concentrated at the top of the cell.
For the BTMS designed in this paper, the maximum temperature of the battery pack can be controlled within 50 °C, and the maximum temperature difference can be controlled within 5 °C under 5 m/s wind speed. When the wind speed is increased, although the maximum temperature on the surface of the battery pack can be reduced, the maximum temperature difference will be increased, and additional energy consumption will be increased. Therefore, the wind speed of 5 m/s is a more suitable choice.

5. Conclusions

A battery thermal management system coupled with a phase-change material (PCM) container and forced-air cooling is designed and investigated for different discharge rates. A multi-domain numerical model is built and validated with experiments. Different discharge currents, the number of PCM container fins, and airspeed are studied using numerical and experimental investigations. The maximum relative error of experiment and simulation results under various conditions is 3.19%. No leakage and precipitation were found during the experiment, and they were not considered in the simulation. The results show that non-fin PCM containers can effectively control the surface temperature of batteries in the optimum operating temperature range at 1 C and 2 C discharge rates, but at a 3 C discharge rate, the maximum surface temperature of batteries reached 51.6 °C, exceeding the optimum operating temperature range. Adding fins can reduce the maximum temperature, average temperature, and temperature difference, extend the phase-change temperature region, and improve the thermal consistency of the battery. A thermal resistance model analysis gives evidence of the enhanced heat transfer of fins. This method of abstracting models for analysis can also be used for the analysis of other thermal management systems. Furthermore, based on this structure, it is more valuable to use topology optimization to optimize the PCM cooling structure. For a PCM-coupled forced-air cooling system, the maximum temperature of the battery pack can be controlled within 50 °C, and the maximum temperature difference can be controlled within 5 °C under 5 m/s wind speed. When PCM is combined with other active thermal management systems, energy savings, and system benefit balance need to be considered. The novel hybrid BTMS using PCM and air-forced cooling with metal fins can improve battery temperature uniformity due to high thermal conductivity and have high mechanical stability to avoid thermal instability problems.

Author Contributions

Conceptualization, Y.Z.; methodology, Y.Z.; software, T.Z.; validation, S.Z., H.W., and S.L.; writing—original draft preparation, Y.Z.; writing—review and editing, S.Z.; visualization, Y.Y., Z.M., J.W., and X.Z.; project administration, Y.Z.; funding acquisition, Y.Z. All authors have read and agreed to the published version of the manuscript.

Funding

This work was supported by: the Special research projects for introducing the talents of Hebei Agricultural University (grant number YJ2020055) and the National Natural Science Foundation of China (grant number U1864213).

Data Availability Statement

The data presented in this study are available on request from the corresponding author.

Conflicts of Interest

The authors declare no conflict of interest.

References

  1. Jiang, X.; Chen, Y.; Meng, X.; Cao, W.; Liu, C.; Huang, Q.; Naik, N.; Murugadoss, V.; Huang, M.; Guo, Z. The Impact of Electrode with Carbon Materials on Safety Performance of Lithium-Ion Batteries: A Review. Carbon N. Y. 2022, 191, 448–470. [Google Scholar] [CrossRef]
  2. Xu, H.; Zhang, X.; Xiang, G.; Li, H. Optimization of Liquid Cooling and Heat Dissipation System of Lithium-Ion Battery Packs of Automobile. Case Stud. Therm. Eng. 2021, 26, 101012. [Google Scholar] [CrossRef]
  3. Yang, Y.; Chen, L.; Yang, L.; Du, X. Numerical Study of Combined Air and Phase Change Cooling for Lithium-Ion Battery during Dynamic Cycles. Int. J. Therm. Sci. 2021, 165, 106968. [Google Scholar] [CrossRef]
  4. Luo, J.; Zou, D.; Wang, Y.; Wang, S.; Huang, L. Battery Thermal Management Systems (BTMs) Based on Phase Change Material (PCM): A Comprehensive Review. Chem. Eng. J. 2022, 430, 132741. [Google Scholar] [CrossRef]
  5. Alipour, M.; Esen, E.; Varzeghani, A.R.; Kizilel, R. Performance of High Capacity Li-Ion Pouch Cells over Wide Range of Operating Temperatures and Discharge Rates. J. Electroanal. Chem. 2020, 860, 113903. [Google Scholar] [CrossRef]
  6. Wang, H.; Wang, S.; Feng, X.; Zhang, X.; Dai, K.; Sheng, J.; Zhao, Z.; Du, Z.; Zhang, Z.; Shen, K.; et al. An Experimental Study on the Thermal Characteristics of the Cell-To-Pack System. Energy 2021, 227, 120338. [Google Scholar] [CrossRef]
  7. Jaliliantabar, F.; Mamat, R.; Kumarasamy, S. Prediction of Lithium-Ion Battery Temperature in Different Operating Conditions Equipped with Passive Battery Thermal Management System by Artificial Neural Networks. Mater. Today Proc. 2022, 48, 1796–1804. [Google Scholar] [CrossRef]
  8. Zichen, W.; Changqing, D. A Comprehensive Review on Thermal Management Systems for Power Lithium-Ion Batteries. Renew. Sustain. Energy Rev. 2021, 139, 110685. [Google Scholar] [CrossRef]
  9. Zhang, X.; Li, Z.; Luo, L.; Fan, Y.; Du, Z. A Review on Thermal Management of Lithium-Ion Batteries for Electric Vehicles. Energy 2022, 238, 121652. [Google Scholar] [CrossRef]
  10. Wang, N.; Li, C.; Li, W.; Chen, X.; Li, Y.; Qi, D. Heat Dissipation Optimization for a Serpentine Liquid Cooling Battery Thermal Management System: An Application of Surrogate Assisted Approach. J. Energy Storage 2021, 40, 102771. [Google Scholar] [CrossRef]
  11. Zhang, J.; Shao, D.; Jiang, L.; Zhang, G.; Wu, H.; Day, R.; Jiang, W. Advanced Thermal Management System Driven by Phase Change Materials for Power Lithium-Ion Batteries: A Review. Renew. Sustain. Energy Rev. 2022, 159, 112207. [Google Scholar] [CrossRef]
  12. Galazutdinova, Y.; Al-Hallaj, S.; Grágeda, M.; Ushak, S. Development of the Inorganic Composite Phase Change Materials for Passive Thermal Management of Li-Ion Batteries: Material Characterization. Int. J. Energy Res. 2020, 44, 2011–2022. [Google Scholar] [CrossRef]
  13. Hassan, F.; Jamil, F.; Hussain, A.; Ali, H.M.; Janjua, M.M.; Khushnood, S.; Farhan, M.; Altaf, K.; Said, Z.; Li, C. Recent Advancements in Latent Heat Phase Change Materials and Their Applications for Thermal Energy Storage and Buildings: A State of the Art Review. Sustain. Energy Technol. Assess. 2022, 49, 101646. [Google Scholar] [CrossRef]
  14. Mohammed, A.G.; Elfeky, K.E.; Wang, Q. Thermal Management Evaluation of Li-Ion Battery Employing Multiple Phase Change Materials Integrated Thin Heat Sinks for Hybrid Electric Vehicles. J. Power Sources 2021, 516, 230680. [Google Scholar] [CrossRef]
  15. Zheng, Q.; Hao, M.; Miao, R.; Schaadt, J.; Dames, C. Advances in Thermal Conductivity for Energy Applications: A Review. Prog. Energy 2021, 3, 12002. [Google Scholar] [CrossRef]
  16. Kant, K.; Biwole, P.H.; Shamseddine, I.; Tlaiji, G.; Pennec, F.; Fardoun, F. Recent Advances in Thermophysical Properties Enhancement of Phase Change Materials for Thermal Energy Storage. Sol. Energy Mater. Sol. Cells 2021, 231, 111309. [Google Scholar] [CrossRef]
  17. Cheng, P.; Chen, X.; Gao, H.; Zhang, X.; Tang, Z.; Li, A.; Wang, G. Different Dimensional Nanoadditives for Thermal Conductivity Enhancement of Phase Change Materials: Fundamentals and Applications. Nano Energy 2021, 85, 105948. [Google Scholar] [CrossRef]
  18. Babu Sanker, S.; Baby, R. Phase Change Material Based Thermal Management of Lithium Ion Batteries: A Review on Thermal Performance of Various Thermal Conductivity Enhancers. J. Energy Storage 2022, 50, 104606. [Google Scholar] [CrossRef]
  19. Sanchez, P.S.; Ezquerro, J.M.; Porter, J.; Fernandez, J.J. The Effect of Thermocapillary Convection on PCM Melting in Microgravity: Results and Expectations. In Proceedings of the International Astronautical Congress, Paris, France, 18–22 September 2020. [Google Scholar]
  20. Jain, A.; Parhizi, M. Theoretical Analysis of Phase Change Heat Transfer and Energy Storage in a Spherical Phase Change Material with Encapsulation. Int. J. Heat Mass Transf. 2022, 185, 122348. [Google Scholar] [CrossRef]
  21. Wang, Y.; Wang, Z.; Min, H.; Li, H.; Li, Q. Performance Investigation of a Passive Battery Thermal Management System Applied with Phase Change Material. J. Energy Storage 2021, 35, 102279. [Google Scholar] [CrossRef]
  22. El  Idi, M.M.; Karkri, M.; Abdou  Tankari, M. A Passive Thermal Management System of Li-Ion Batteries Using PCM Composites: Experimental and Numerical Investigations. Int. J. Heat Mass Transf. 2021, 169, 120894. [Google Scholar] [CrossRef]
  23. Qian, Z.; Li, Y.; Rao, Z. Thermal Performance of Lithium-Ion Battery Thermal Management System by Using Mini-Channel Cooling. Energy Convers. Manag. 2016, 126, 622–631. [Google Scholar] [CrossRef]
  24. Hu, Y.; Choe, S.-Y.; Garrick, T.R. Measurement of Heat Generation Rate and Heat Sources of Pouch Type Li-Ion Cells. Appl. Therm. Eng. 2021, 189, 116709. [Google Scholar] [CrossRef]
  25. Bernardi, D.; Pawlikowski, E.; Newman, J. A General Energy Balance for Battery Systems. J. Electrochem. Soc. 1985, 132, 5–12. [Google Scholar] [CrossRef] [Green Version]
  26. Wu, W.; Wu, W.; Wang, S. Thermal Management Optimization of a Prismatic Battery with Shape-Stabilized Phase Change Material. Int. J. Heat Mass Transf. 2018, 121, 967–977. [Google Scholar] [CrossRef]
  27. Cheng, J.; Shuai, S.; Tang, Z.; changfa, T. Thermal Performance of a Lithium-Ion Battery Thermal Management System with Vapor Chamber and Minichannel Cold Plate. Appl. Therm. Eng. 2023, 222, 119694. [Google Scholar] [CrossRef]
Figure 1. Experimental setup.
Batteries 09 00153 g001
Figure 2. PCM container: (a) PCM container assembly; (b) PCM container inner structure.
Batteries 09 00153 g002
Figure 3. Temperature measurement point design.
Batteries 09 00153 g003
Figure 4. Battery module connection. The numbers in the top figure indicate the battery serial number and the numbers in the bottom figure indicate the PCM container serial number.
Batteries 09 00153 g004
Figure 5. (a) battery module: (a1) battery module without air-forced cooling, The upper number represents the battery serial number, the lower number represents the PCM container serial number. (a2) battery module with air-forced cooling; (b) heat transfer analysis model; (c) battery module mesh.
Batteries 09 00153 g005
Figure 6. Model validation results: temperature of simulation and experiments at different discharge rates, (a) 1 C; (b) 2 C; (c) 3 C; (d) Relative errors.
Batteries 09 00153 g006
Figure 7. Temperature rise curve of non-fins PCM container cooling system at different discharge rates: (a) maximum temperature; (b) average temperature; (c) temperature difference. Simulation result of temperature field diagram of the battery pack with a non-fin PCM container at the discharge time t: (d) 1C, t = 3240 s; (e) 2C, t = 1620 s; (f) 3C, t = 1080 s.
Batteries 09 00153 g007
Figure 8. Temperature curve of battery pack with a different number of fins and temperature field of a battery pack with PCM containers which have different quantities of fins. (a) maximum temperature; (b) average temperature; (c) temperature difference (d) 3-fin PCM container; (e) 5-fin PCM container; (f) 7-fin PCM container.
Batteries 09 00153 g008
Figure 9. Thermal resistance model of PCM container.
Batteries 09 00153 g009
Figure 10. Relationship between effective thermal conductivity and fin volume fraction of PCM container.
Batteries 09 00153 g010
Figure 11. Solid volume fraction of PCM distribution in plates with different fins at discharge end (3 C).
Batteries 09 00153 g011
Figure 12. The temperature rise curve of the PCM container coupling forced-air cooling system (a) maximum temperature; (b) average temperature; (c) temperature difference. Temperature field diagram of PCM container coupled forced-air cooling system (d) 5 m/s; (e) 10 m/s; (f) 15 m/s.
Batteries 09 00153 g012
Table 1. Parameters of Li-ion battery.
ParametersValue
Battery typeLithium iron phosphate
Voltage (V)3.2
Capacity (Ah)16
Size (mm)
Density (kg·m−3)
103 × 65 × 22
2000
Specific heat capacity(J·kg−1·K−1)1030
Thermal conductivity (x, y, z) (W·m−1·K−1)0.37/24/24
Equivalent internal resistance (mΩ)6
Maximum sustained discharge rate3 C
Table 2. Physical properties of paraffin.
ParametersValue
Paraffin type44#
SupplierSheng bang (China)
Chemical formulaC22H46
Thermal conductivity
(solid/liquid) (W·m−1·K−1)
0.29/0.21
Melting point (°C)44–46
Latent heat (J·kg−1)189,000
Specific heat capacity (J·kg−1·K−1)1770
Density (kg·m−3)910
Table 3. The model MAE and RMSE.
ErrorsDischarge RatesTMP1TMP3
MAE1 C0.440.46
2 C0.430.45
3 C0.380.40
RMSE1 C0.510.52
2 C0.500.50
3 C0.440.41
Disclaimer/Publisher’s Note: The statements, opinions and data contained in all publications are solely those of the individual author(s) and contributor(s) and not of MDPI and/or the editor(s). MDPI and/or the editor(s) disclaim responsibility for any injury to people or property resulting from any ideas, methods, instructions or products referred to in the content.

