Article

Simultaneous Strain and Temperature Discrimination in 18650 Li-ion Batteries Using Polarization-Maintaining Fiber Bragg Gratings

I3N and Department of Physics, University of Aveiro, Campus de Santiago, 3810-193 Aveiro, Portugal
*
Author to whom correspondence should be addressed.
Batteries 2022, 8(11), 233; https://doi.org/10.3390/batteries8110233
Submission received: 30 September 2022 / Revised: 2 November 2022 / Accepted: 5 November 2022 / Published: 10 November 2022
(This article belongs to the Special Issue Feature Papers to Celebrate the First Impact Factor of Batteries)

Abstract

:
In this work, a fiber Bragg grating (FBG) sensor network inscribed in a polarization-maintaining (PM) fiber is proposed to proceed with a multipoint simultaneous temperature and strain discrimination in different locations (positive and negative terminals, and middle) on a cylindrical Li-ion battery. The birefringence property of the PM fibers, together with FBG sensors, allowed such an application using only one fiber line fixed to the edges of the battery. The battery was subjected to two different charge/discharge cycles, one with nominal charging and discharging conditions (1.00 C and 1.13 C, respectively) and another with abusive conditions (1.88 C for charge and 2.39 C for discharge). The PM-FBG sensors registered maximum temperature and strain variations at the end of the abusive discharge process of the battery; the positive terminal achieved a 28.7 ± 0.3 °C temperature variation, while the center achieved 221 ± 10 με strain variation. The results indicate a different strain variation behavior in the middle location when compared to the negative and positive terminals, as well as a higher temperature variation in both terminals when compared to the middle location. The use of PM-FBG sensors successfully demonstrates their feasibility in locally tracking and discriminating strain and temperature shifts in a battery surface. To our knowledge, this is the first study using the application of PM-FBG sensors to monitor and discriminate critical safety parameters in Li-ion batteries.

Graphical Abstract

1. Introduction

Lithium-ion batteries (LiB) are currently widely used in several solutions regarding energy storage, portable energy supply, and automotive mobility. Since the beginning, LiBs have achieved a substantial improvement in their characteristics due to applications of discoveries in their construction [1,2]. Owing to thire high energy density, longer cycle life, and actual scalability, the application of LiBs in several projects regarding electrical mobility and remote power supply has been massively increased [3]. The most significant challenge in designing a LiB system is to ensure its inherent safety under normal and abusive operating conditions, which is essential to control key parameters such as temperature and strain variations [4]. High temperatures within the battery cell may damage an important battery component, i.e., the solid electrolyte interface layer, triggering uncontrolled exothermic reactions between the lithiated anode and the liquid electrolyte, leading to the rapidly and irreversible increase of internal temperature and, thus, inducing combustion or eventual explosion of the cell, compromising the battery safety [5]. Uncontrolled strain on the battery shell may lead the appearance of cracks and will expose the internal components battery to the oxygen, also compromising battery safety. Thus, due to the use of batteries with increasing capacity and energy density, the monitoring and control of strain and temperature variations with high precision and speed are mandatory.
Once the internal battery parameters are crucial to truly understand the state of the cell while submitted to charge/discharge cycles or during electric vehicle operation, they are essential to develop better approaches regarding the battery performance, lifetime, and safety. This fact motivated the INSTABAT project to research and develop smart batteries, and to develop new methodologies to sense critical parameters within the battery cells [6]. LiBs are monitored by a battery management system (BMS); however, currently, this system can only measure accessible external parameters such as voltage, current, and external temperature. As the control of internal parameters is critical to the safety of LiBs, the BMS can make approximations and predictions based on theoretical models, yet it cannot sense the temperature inside the battery [7]. This fact has led to several investigations regarding temperature sensing within the battery cell [8,9]. Generally, electronic sensors are used for this purpose; however, these devices present low endurance against the electrochemical harsh environment of LiBs, and their volume is too overwhelming for insertion into a battery cell with low invasiveness, leading to unreliable measurements and significant damage to the battery cell. An alternative measurement solution is the use of sensors based on optical fiber technology [10,11]. Optical fiber sensors (OFSs) started to be integrated into LiBs in 2013, improving the monitorization of parameters, such as temperature, strain, and pressure [3,12,13,14,15]. The tracking of these parameters enables real-time control of battery indicators such as the states of charge, discharge, health, power, energy, and safety (SoX) [16,17].
Among OFSs, fiber Bragg grating (FBG) sensors are currently highly rated and widely used to sense battery parameters. FBG sensors present many advantages, such as multiplexing and multipoint measurement possibilities, immunity to electromagnetic interference, small size/low invasiveness, greater precision, and faster response time when compared to usual electronic sensors, such as thermocouples, thermistors, and strain gauges [18].
In 2016, FBGs were integrated into LiB cells to perform temperature tracking during charge/discharge cycling tests. The authors claimed that the reduced dimensions and high chemical endurance make them an attractive choice to be embedded within LiBs [4].
Nascimento et al. integrated FBGs and thermocouples (TC) on the same LiB surface locations, aiming to compare their signal responses. The results revealed that the FBGs presented better performance in terms of response rate and rise time to temperature variations, making the optical sensors a better solution for real-time temperature tracking [19].
The same authors also developed a study regarding the thermal behavior on a surface of LiB, using an FBG network to detect the influence of different environmental conditions on battery performance. It was possible to verify critical areas of the battery where a sharp thermal gradient is originated; in these regions, a higher heat dissipation rate is required. Faster shifts in voltage tends to induce higher temperature variations on the LiB surface [20].
McTurk et al. also developed an internal temperature measurement using FBGs, using Li-plated Cu wire as a reference. The temperature in the cell core was higher than the surface of the battery shell at the end of a 1 C discharge step [14].
Yang et al. used FBGs integrated in LiBs to compare the performance against thermocouples, measuring temperature variations in real time while the batteries operated under different charge/discharge conditions. The FBG sensors exhibited a better thermal response when compared to the thermocouples [16].
FBGs are simultaneously sensitive to multiple external variations, suffering from large cross-sensitivity. This behavior can lead to an inaccurate measurement if the negligible external parameters are not kept constant or are not controlled by others sensor heads. The external temperature variation may interfere with strain measurement experiments if an accurate strategy is not elaborated [11].
In this way, there has been increasing interest in the development of efficient approaches to segregate multiple parameter stimulations in FBG sensor applications. The utilization of FBG sensors in two different parallel optical fiber lines, where one is submitted to strain and the other is in a strain-free situation, has already been applied to track and discriminate simultaneous strain and temperature in batteries [21]. However, recent studies regarding the application of the birefringent properties of polarization maintaining (PM) fibers revealed new possibilities to discriminate such parameters using only one optical fiber line. Nevertheless, PM optical fibers have not yet been applied to battery research.
In 2014, Li et al. used chemically etched FBGs in PANDA PM fiber to achieve temperature-independent refractive index sensing [22]. In 2017, Zhu et al. used PANDA-FBG sensors to measure a dynamic strain and temperature sensing system, using thermocouples and strain gauge sensors to better propagate the measurement errors [23]. In 2019, FBG sensors inscribed in a PM few-mode fiber were used to discriminate simultaneous temperature and strain variations [24]. In 2020, Guo et al. proposed and demonstrated a highly birefringent FBG fabricated by the inscription of a sawtooth stressor close to the optical fiber core; the sensor was capable of simultaneously measuring temperature and strain [25]. In 2022, Lu et al. developed a sensing probe based on a birefringent interferometer cascaded with a PM-FBG sensor; they experimentally demonstrated temperature, strain, and refractive index discrimination simultaneously using only one sensor head [26].
In this study, an exploratory application using birefringent optical fibers in battery sensing is demonstrated and discussed. Using only one PANDA optical fiber line, with three FBG sensors recorded on it, the simultaneous discrimination of external temperature and axial strain variations of an 18650 LiB, during different galvanostatic cycles, was performed. To our knowledge, this is the first time that the application of PM optical fiber sensors in batteries is reported.

2. Materials and Methods
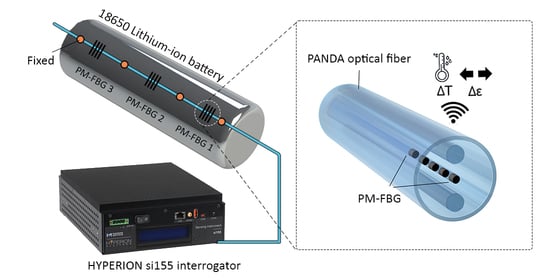
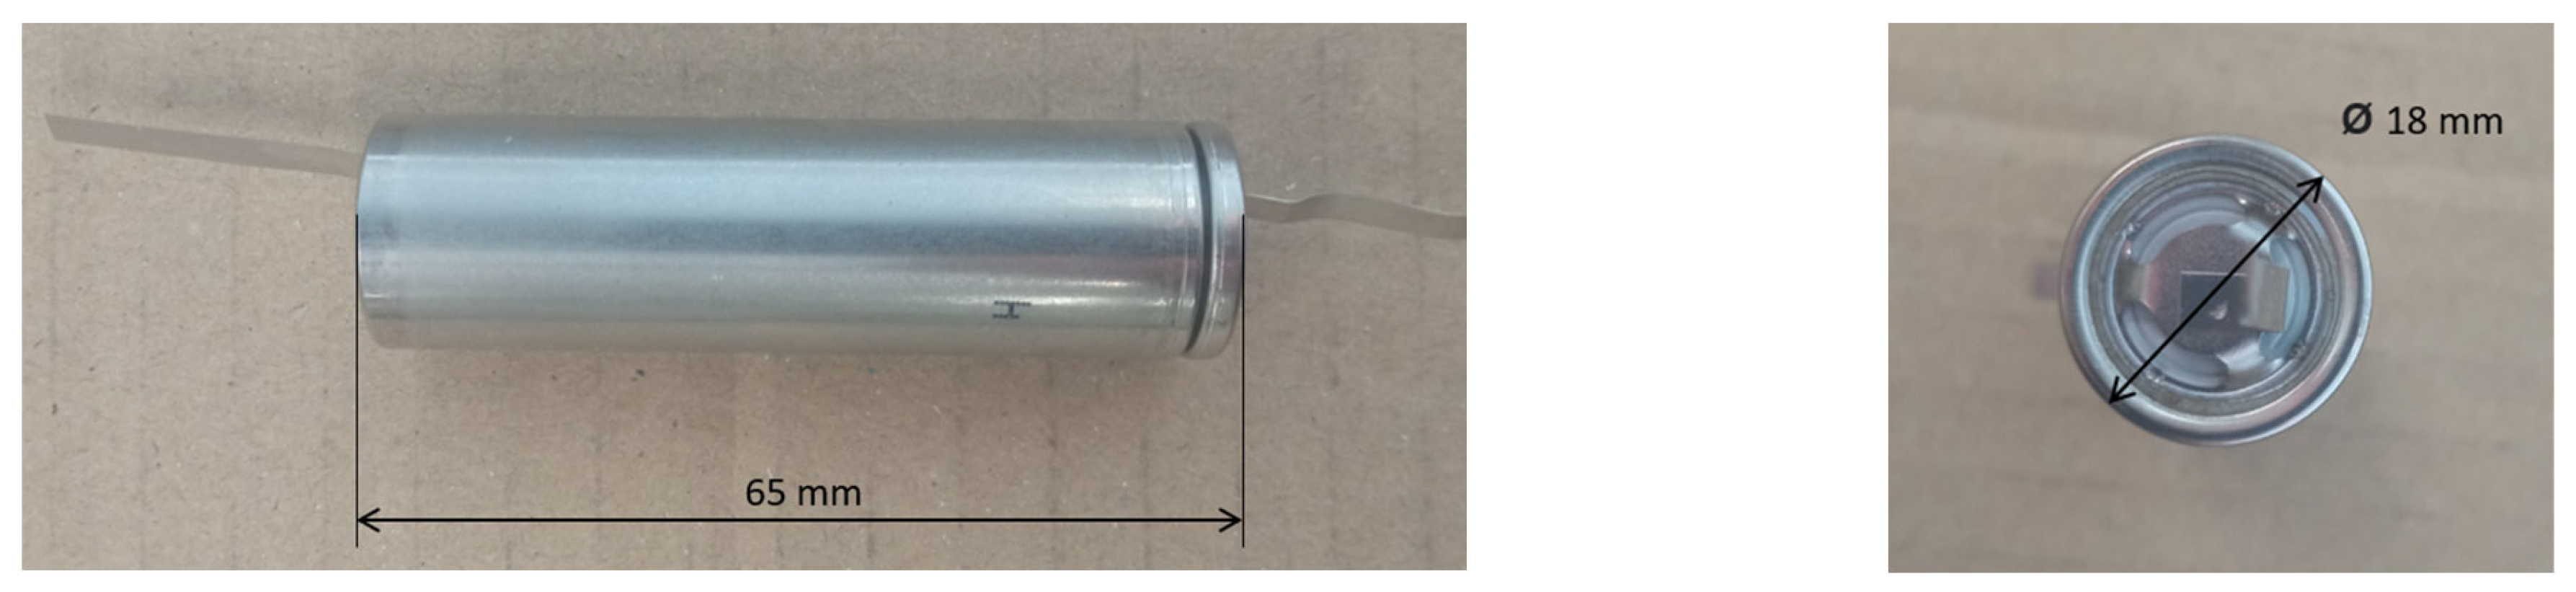
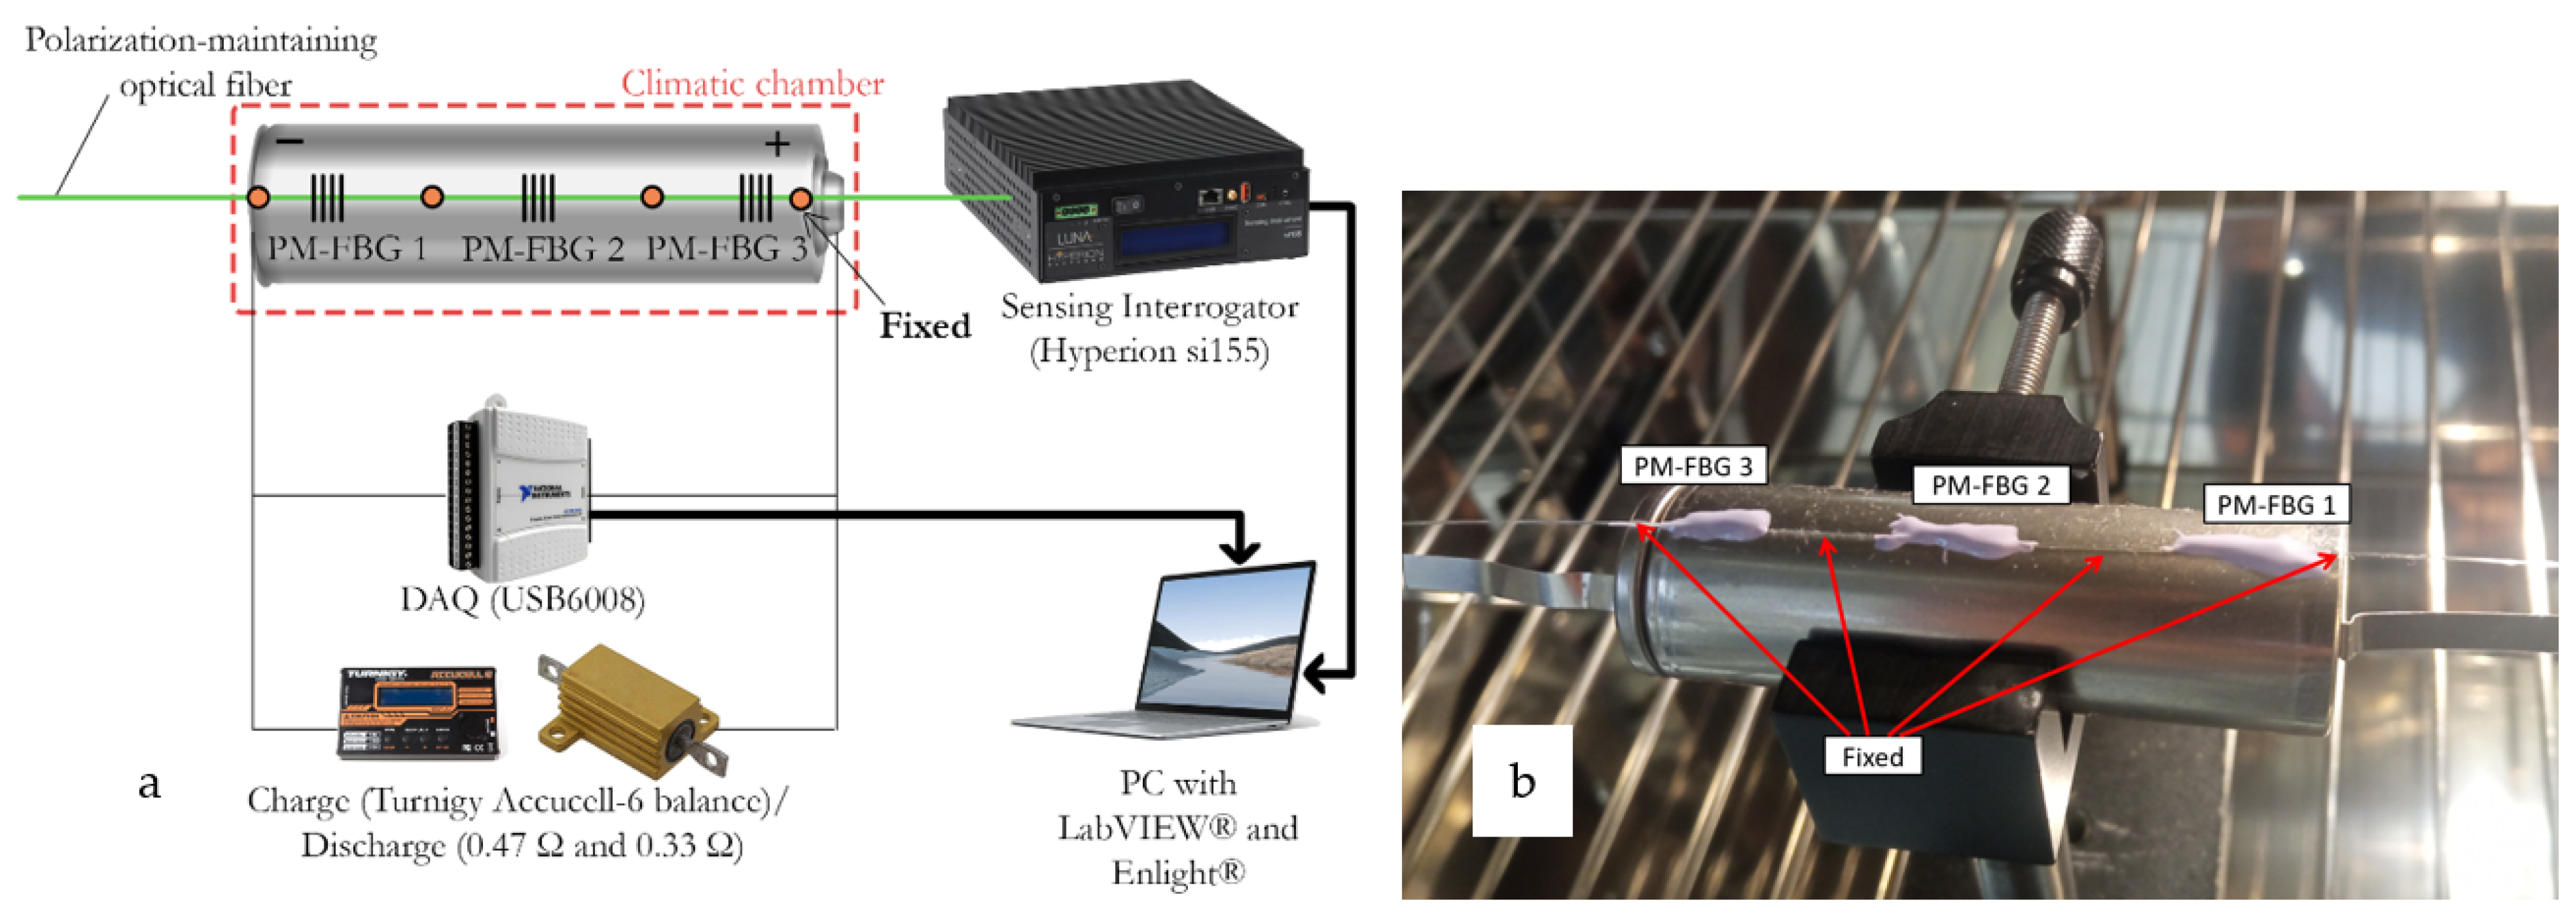
2.1. The Battery

For the experiment, a commercial INR18650 MH1 3200 mAh LiB (18 × 65 mm), manufactured by LG Chem company, with a nominal voltage of 3.63 V, was tested in charge and discharge cycles over different constant-current constant-voltage (CCCV) and open-circuit voltage conditions. To perform the tests, the polymeric protection of LiB was removed to disclose the aluminum surface of the battery, as shown in Figure 1.

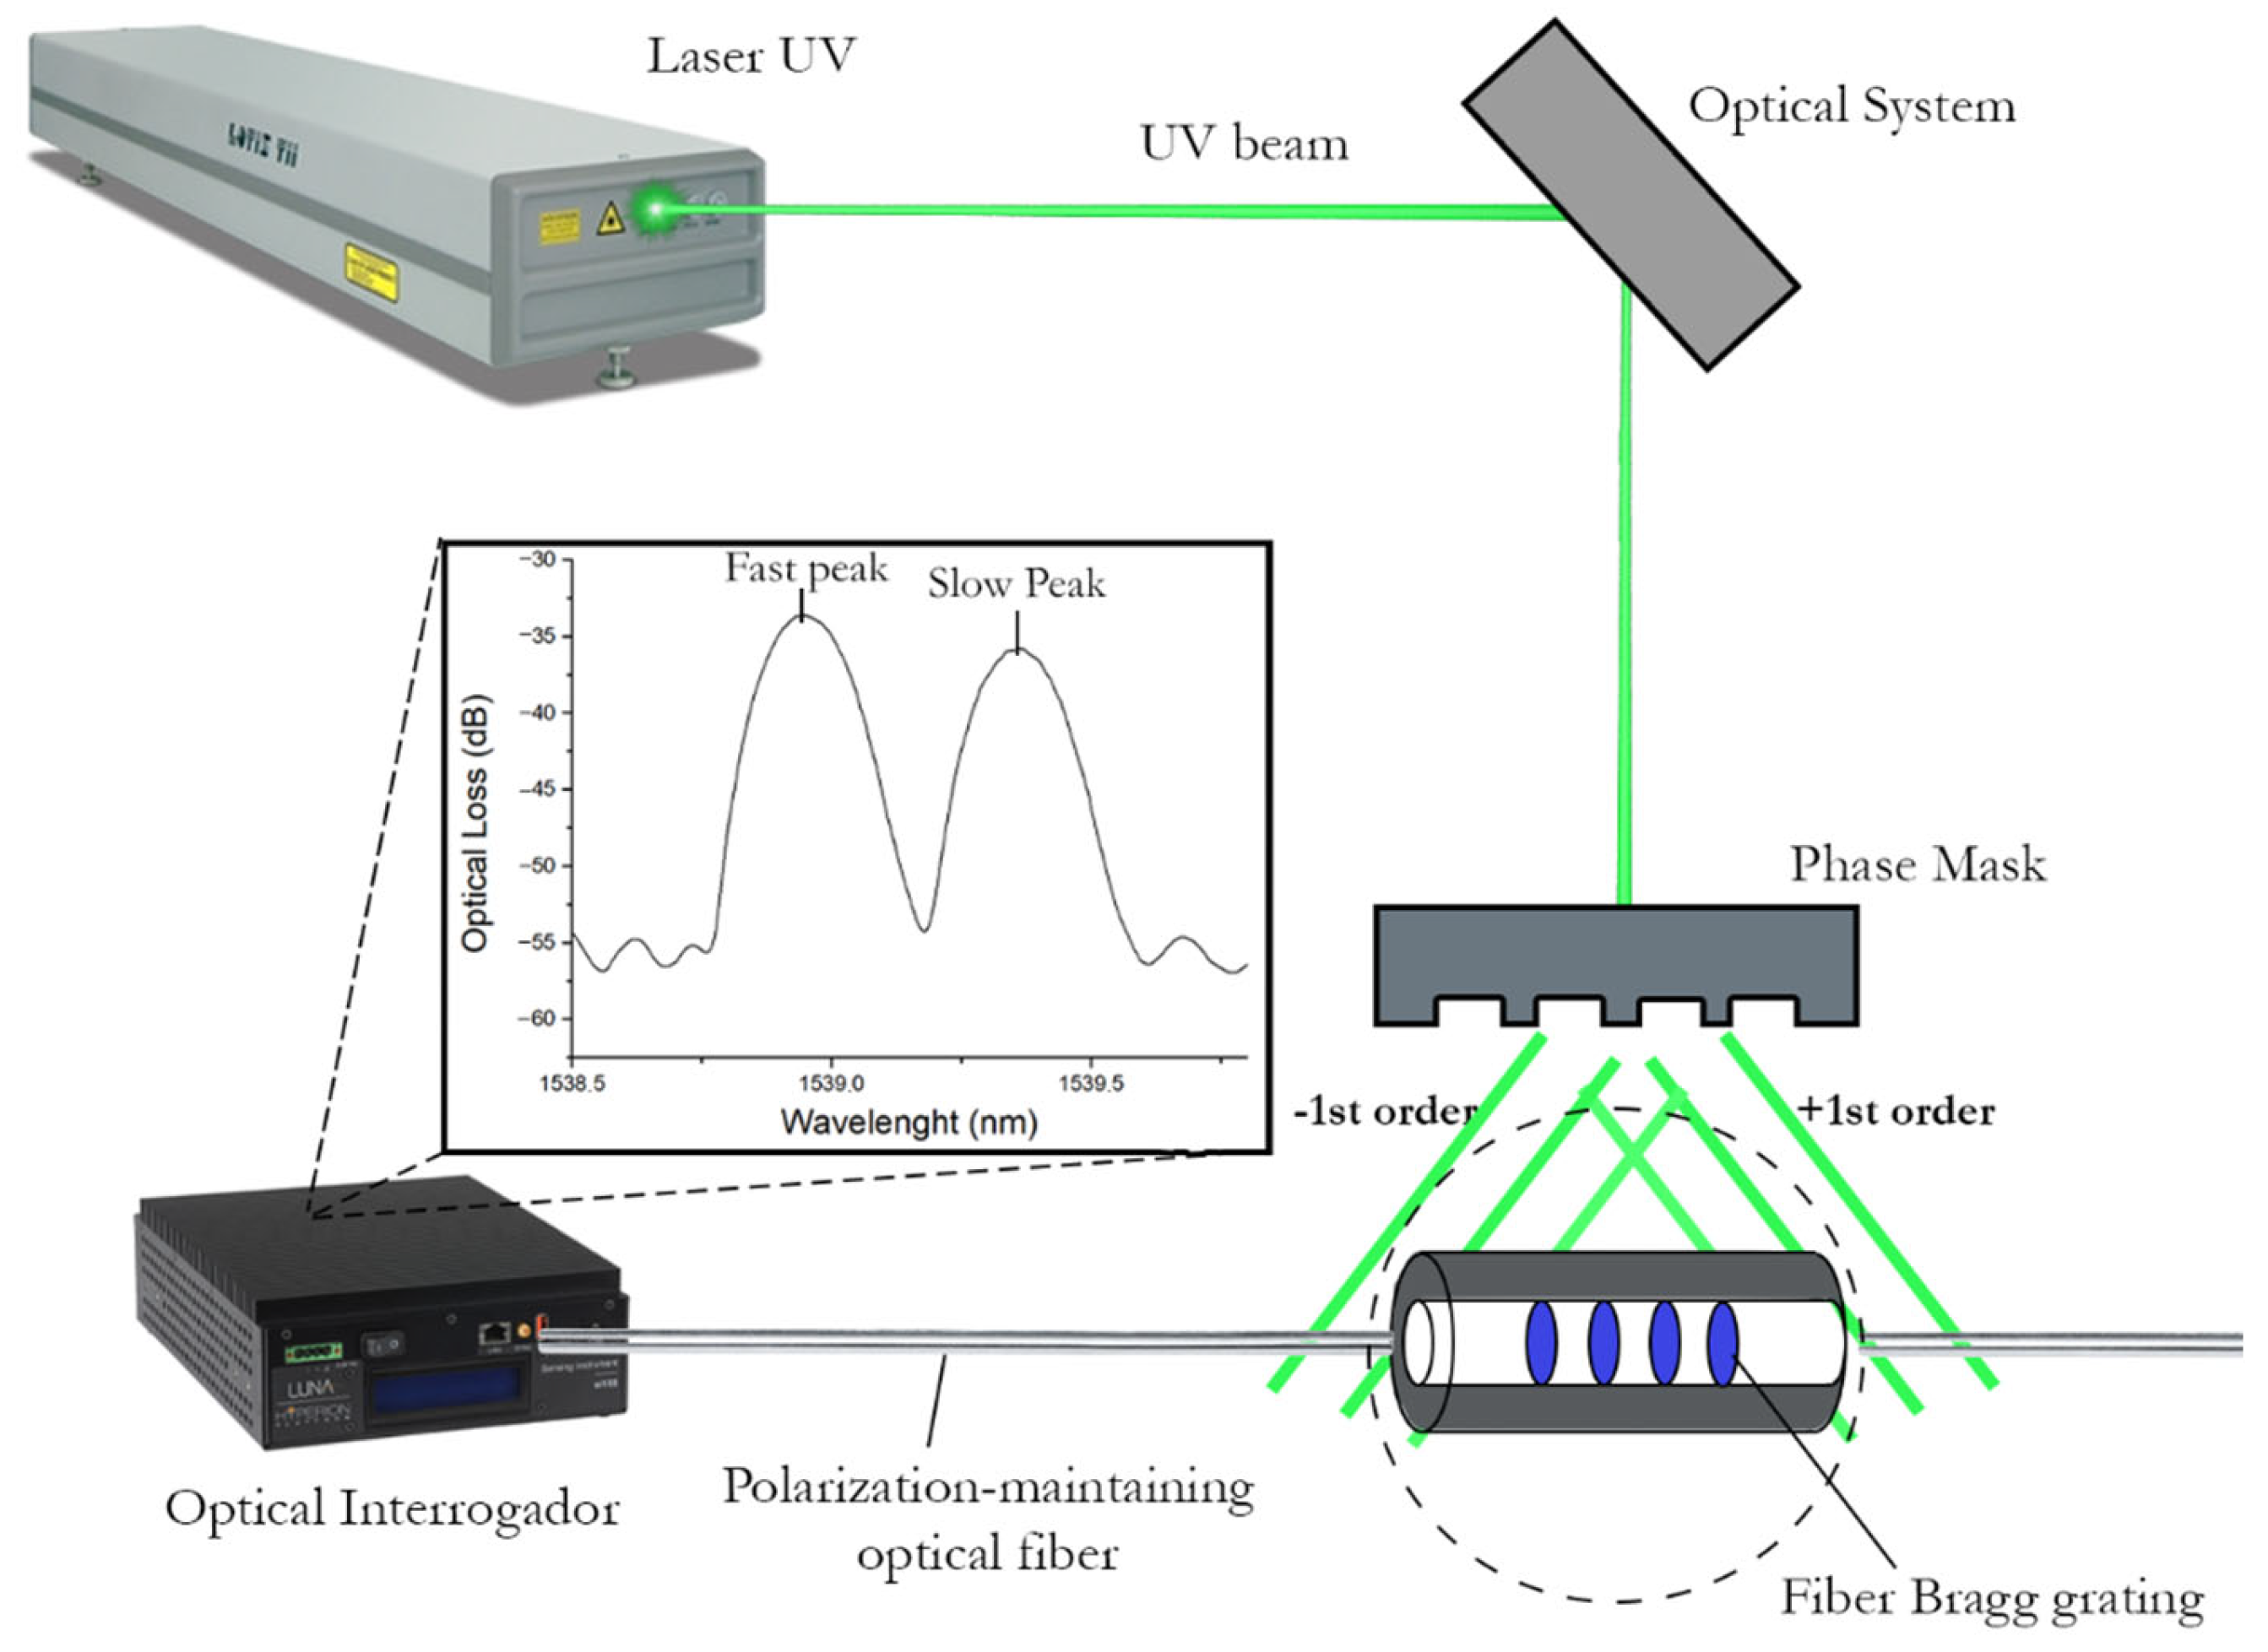
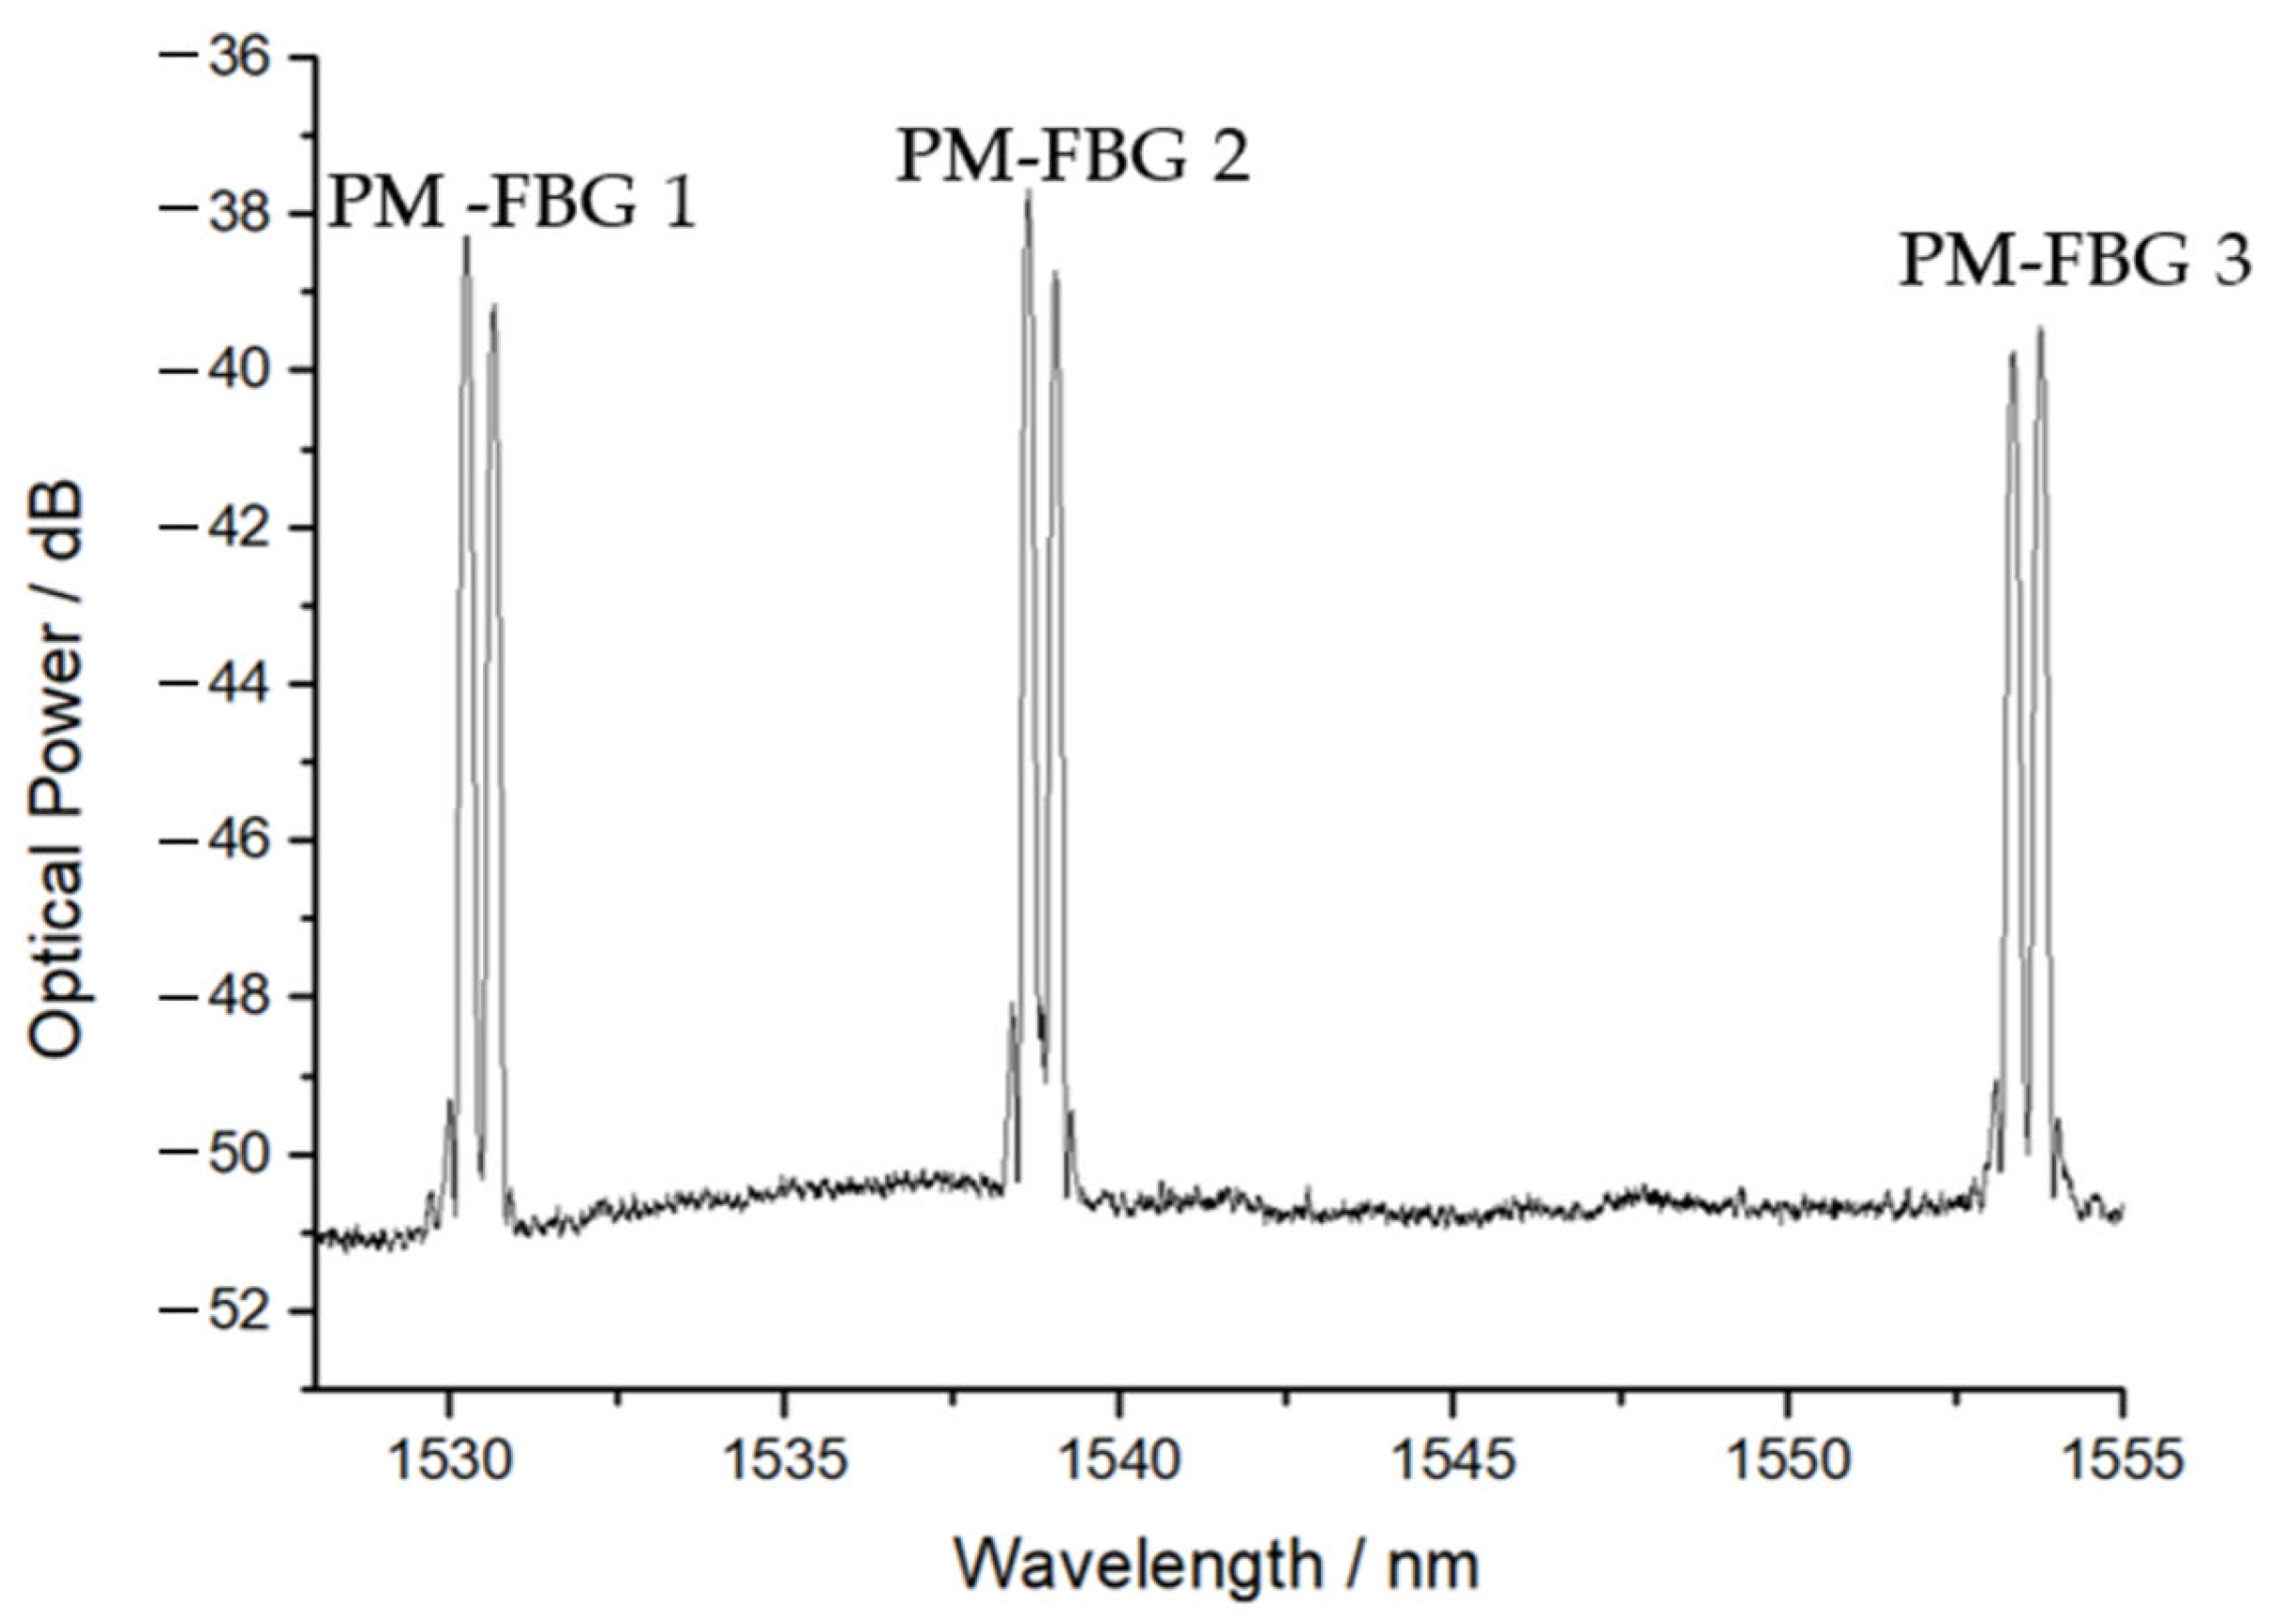
2.2. FBG Sensor Inscription

The FBGs were inscribed in a commercial photosensitive PANDA fiber (PS-PM980, Thorlabs Inc., Newton, MA, USA) with a birefringence index of 3.0 × 10⁻⁴. A phase mask method was used for the inscription step, using a pulsed Q-switched Nd:YAG laser system (LOTIS TII LS-2137U Laser, Minsk, Belarus) lasing at the fourth harmonic (@266 nm) and focusing the beam on the fiber with a plano-convex cylindrical lens (working length of 320 mm) [27]. The physical length of the inscribed FBGs was 8 mm. The inscription time of each FBG was around 180 s. An illustrative scheme of the inscription method is presented in Figure 2. The optical interrogator (Hyperion si155 Optical Sensing Instrument, Luna, VA, USA) was used to acquire the reflected signal of the FBG sensors while they were inscribed, and the optical system represented the lens and mirrors aggregated to direct the ultraviolet (UV) beam to the phase mask.
To track strain and temperature shifts at three different points of the battery, three FBGs (0.8 cm in length, spaced out 1.4 cm from each other) were inscribed in the PANDA fiber to employ a multipoint measurement setup. At room temperature, 20 °C, the Bragg wavelengths for fast and slow peaks were 1530.64 nm and 1531.05 nm (PM-FBG1), 1539.05 nm and 1539.46 nm (PM-FBG2), and 1553.19 nm and 1553.61 nm (PM-FBG3), respectively, in a strain-free situation. Accordingly, different phase masks were used to inscribe each PM-FBG sensor. Figure 3 shows the spectral response of all PM-FBGs designed, resulting in the PM optical fiber line sensing probe.
The PANDA fiber geometry induces anisotropic behavior of the effective refractive index along the fiber, originating two refractive index components ( n f and n s ) depending on the light polarization direction. Once the Bragg wavelength depends on the effective refractive index (Equation (1), where Λ B is the period of the FBG gratings), two Bragg wavelengths ( λ f and λ s ) reflections can be observed in the spectrum reading. The effective birefringence value (B) can be calculated using Equation (2) [28].
λ f , s = 2 n f , s Λ B ,
B = | n f n s | = | λ f λ s 2 Λ B | ,
where n f and n s are the effective indices for the slow and fast modes, respectively.

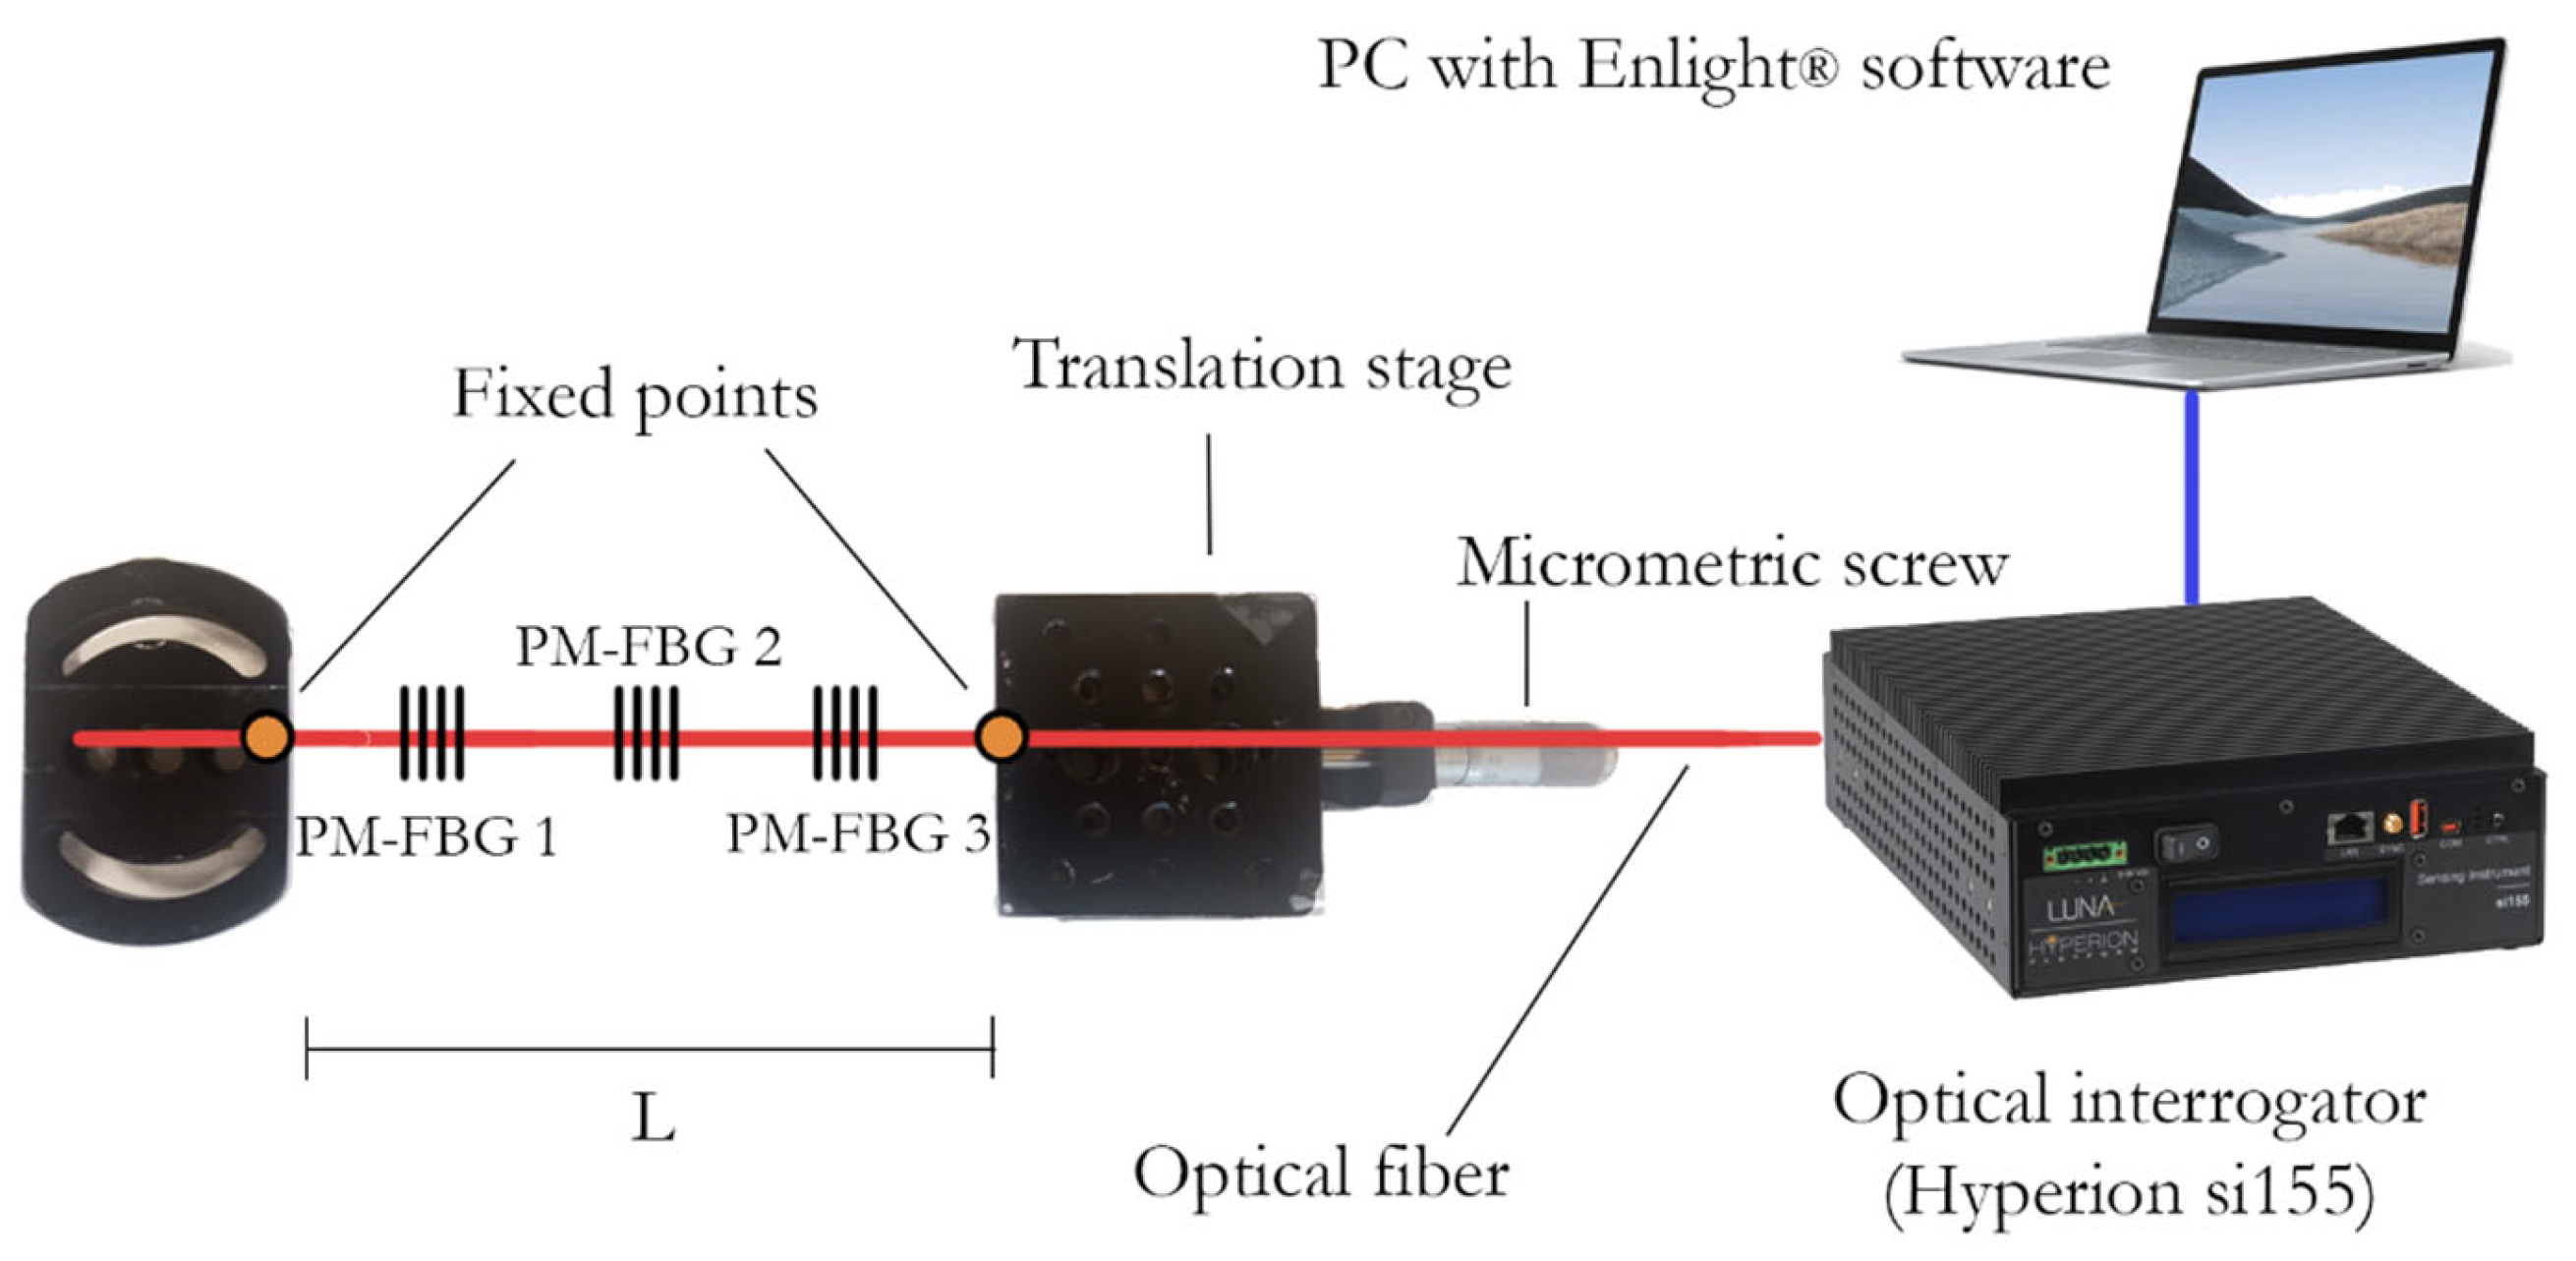
2.3. Strain and Temperature Calibrations

To proceed with the longitudinal strain calibration, a micrometric translation stage method was performed. For this, the fiber with all PM-FBG sensors was fixed with glue on the edges of a static base and to a translation stage, as shown in Figure 4. The initial length (L) was 345 mm, increasing in 0.05 mm steps up to 0.55 mm length variation.
To correlate the variation in length to strain, Equation (3) was used.
ε = δ L ,
where L is the initial length in mm, δ is the length variation in mm, and ε is the longitudinal strain applied to the fiber.
For the thermal calibration process, the optical fiber was already fixed to the battery cell surface with glue, subjecting the fiber and the PM-FBG sensors to thermal expansion/contractions, and allowing the detection of the real temperature sensitivity promoted by the sensitivity-increasing effect due to the thermal expansion coefficient of the aluminum alloy battery shell, during heating and cooling steps [30]. The fiber in the sensor’s regions was covered by a thermal paste to improve heat flow between the battery and the sensors. The temperature calibration was performed by changing the temperature between 25.0 and 50.0 °C, in 5 °C steps, during the heating and cooling processes. The climatic chamber (model LC64, from WeissTechnik, Supplylab, Lisbon, Portugal, with an operating range between −70 and 180 °C) was used for this proposal. The battery cell instrumented with the optical fiber was introduced in the climatic chamber and submitted to different temperatures; the optical interrogator provided the Bragg wavelength peaks relative to the temperature variation. A PC with the Enlight® software was used to proceed with the data visualization and data logging.

2.4. Experimental Cycling Tests

For the experimental tests, two different cycles were performed (normal and abusive conditions), each of them consisting of one consecutive discharge/charge cycle with a rest interval between each operation, for temperature stabilization under normal convection. The battery and the sensors were always kept in a constant-temperature environment at 20 °C. For the charging process, a commercial Turnigy Accucell-6 balance charger/discharger was used to guarantee two different charge currents at 1.00 C (normal condition) and 1.88 C (abusive condition). Due to the safety restrictions of the equipment, during this step, the current decreased over time. For the discharge processes, resistors of 1 Ω and 0.48 Ω were used to guarantee 1.13 C (normal condition) and 2.39 C (abusive condition) discharge rates, respectively, during the experiment. A 12 bit resolution data acquisition system (DAQ) (USB6008, National Instruments) provided the data acquirement of voltage in the battery’s terminals. A computer connected to the devices accomplished the data logging of the measurements, allowing real-time monitoring; the experimental setup is exemplified in Figure 5a.
The optical fiber with all sensors was attached to the battery surface after thermal characterization, and the distance between consecutive fixed points was 2 cm. The battery was always disposed of in the horizontal orientation, as shown in Figure 5b. The subsequent data processing was performed using a MATLAB® routine.

2.5. Temperature and Strain Discrimination

All PM-FBG sensitivities were essential to proceed with the simultaneous discrimination of temperature and strain. As shown in Equation (4), the K matrix was composed of the sensitivity constants to temperature and strain, where K f and K s represent the sensitivity of the fast and slow peaks, respectively, for both temperature (T) and strain (ε) [31].
( Δ λ f Δ λ s ) = ( K ε f K T f K ε s K T s ) ( Δ ε Δ T ) = K ( Δ ε Δ T ) ,   ( Δ ε Δ T ) = K 1 ( Δ λ f Δ λ s ) .
By proceeding with the calculation of the inverse matrix and multiplying it by Bragg wavelength of fast ( Δ λ f ) and slow ( Δ λ f ) peaks of each sensor, the result provided the discriminated strain ( Δ ε ) and temperature (ΔT) shifts.

3. Results

3.1. PM-FBG Temperature and Strain Discrimination

After the calibration processes, the sensitivities for fast and slow peaks of each PM-FBGs were determined and are described in Table 1. In this experimental configuration, higher temperature sensitivities were obtained due to the thermal expansion coefficient of the battery aluminum surface material, when compared to the sensitivity of a strain-free optical fiber [17].
Once the aluminum thermal expansion differed according to its thermal condition (material hysteresis), i.e., a cooling or heating situation, two different thermal sensitivities could be determined relative to each PM-FBG sensor. In this way, in this study, different inverse matrices were applied for the calculations of ΔT and Δε during the cycling tests, depending on if the last ΔT iterative derivative was positive (heating) or negative (cooling). However, to overcome this issue for real sensing applications, a mean value could also be determined between both heating and cooling sensitivities, although this last strategy may induce less accurate measurements. The mean errors associated with the ΔT and Δε measurements were calculated considering the standard deviation between the maximum and minimum fluctuations of the sensors signals acquired in the climatic chamber with a stabilized temperature (20.0 ± 0.3 °C) varying the strain values, and by varying the temperature with a fixed strain (500 ± 10 με). For these calculations and to increase the measurement accuracy, precise signal processing tolls based on data treatment FFT filters were used.
Accordingly, the K sensitivity matrix for each sensor, in both heating and cooling situations, and the respective determinants are shown in Table 2. For possible simultaneous measurement, the determinant value must be nonzero.

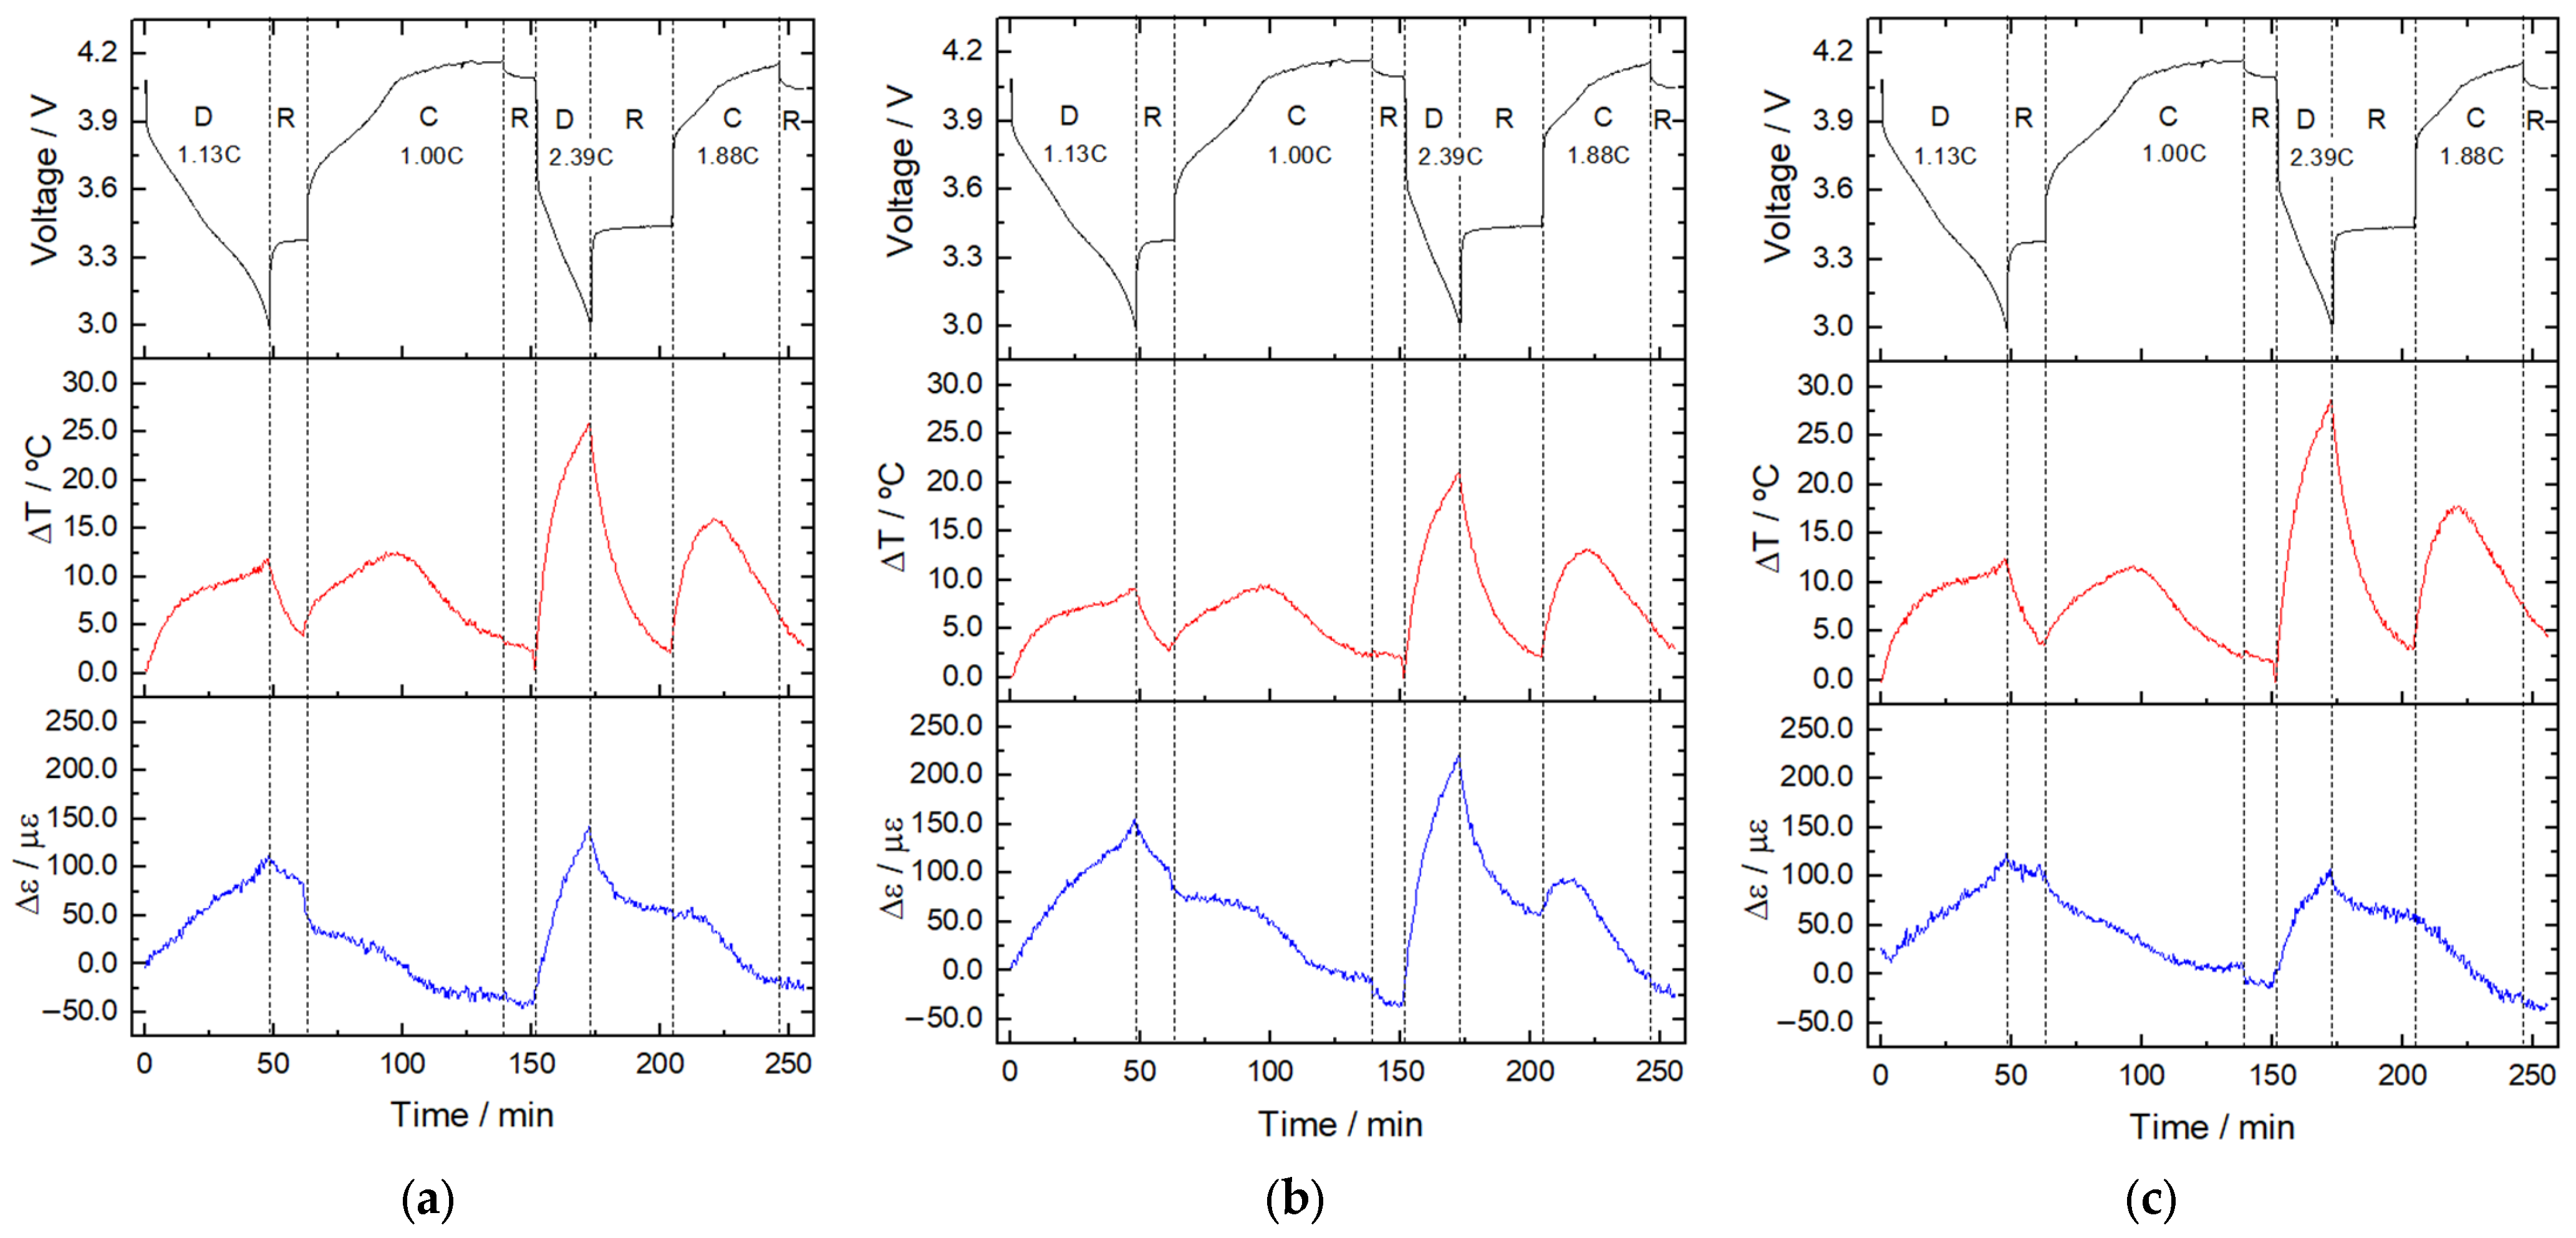
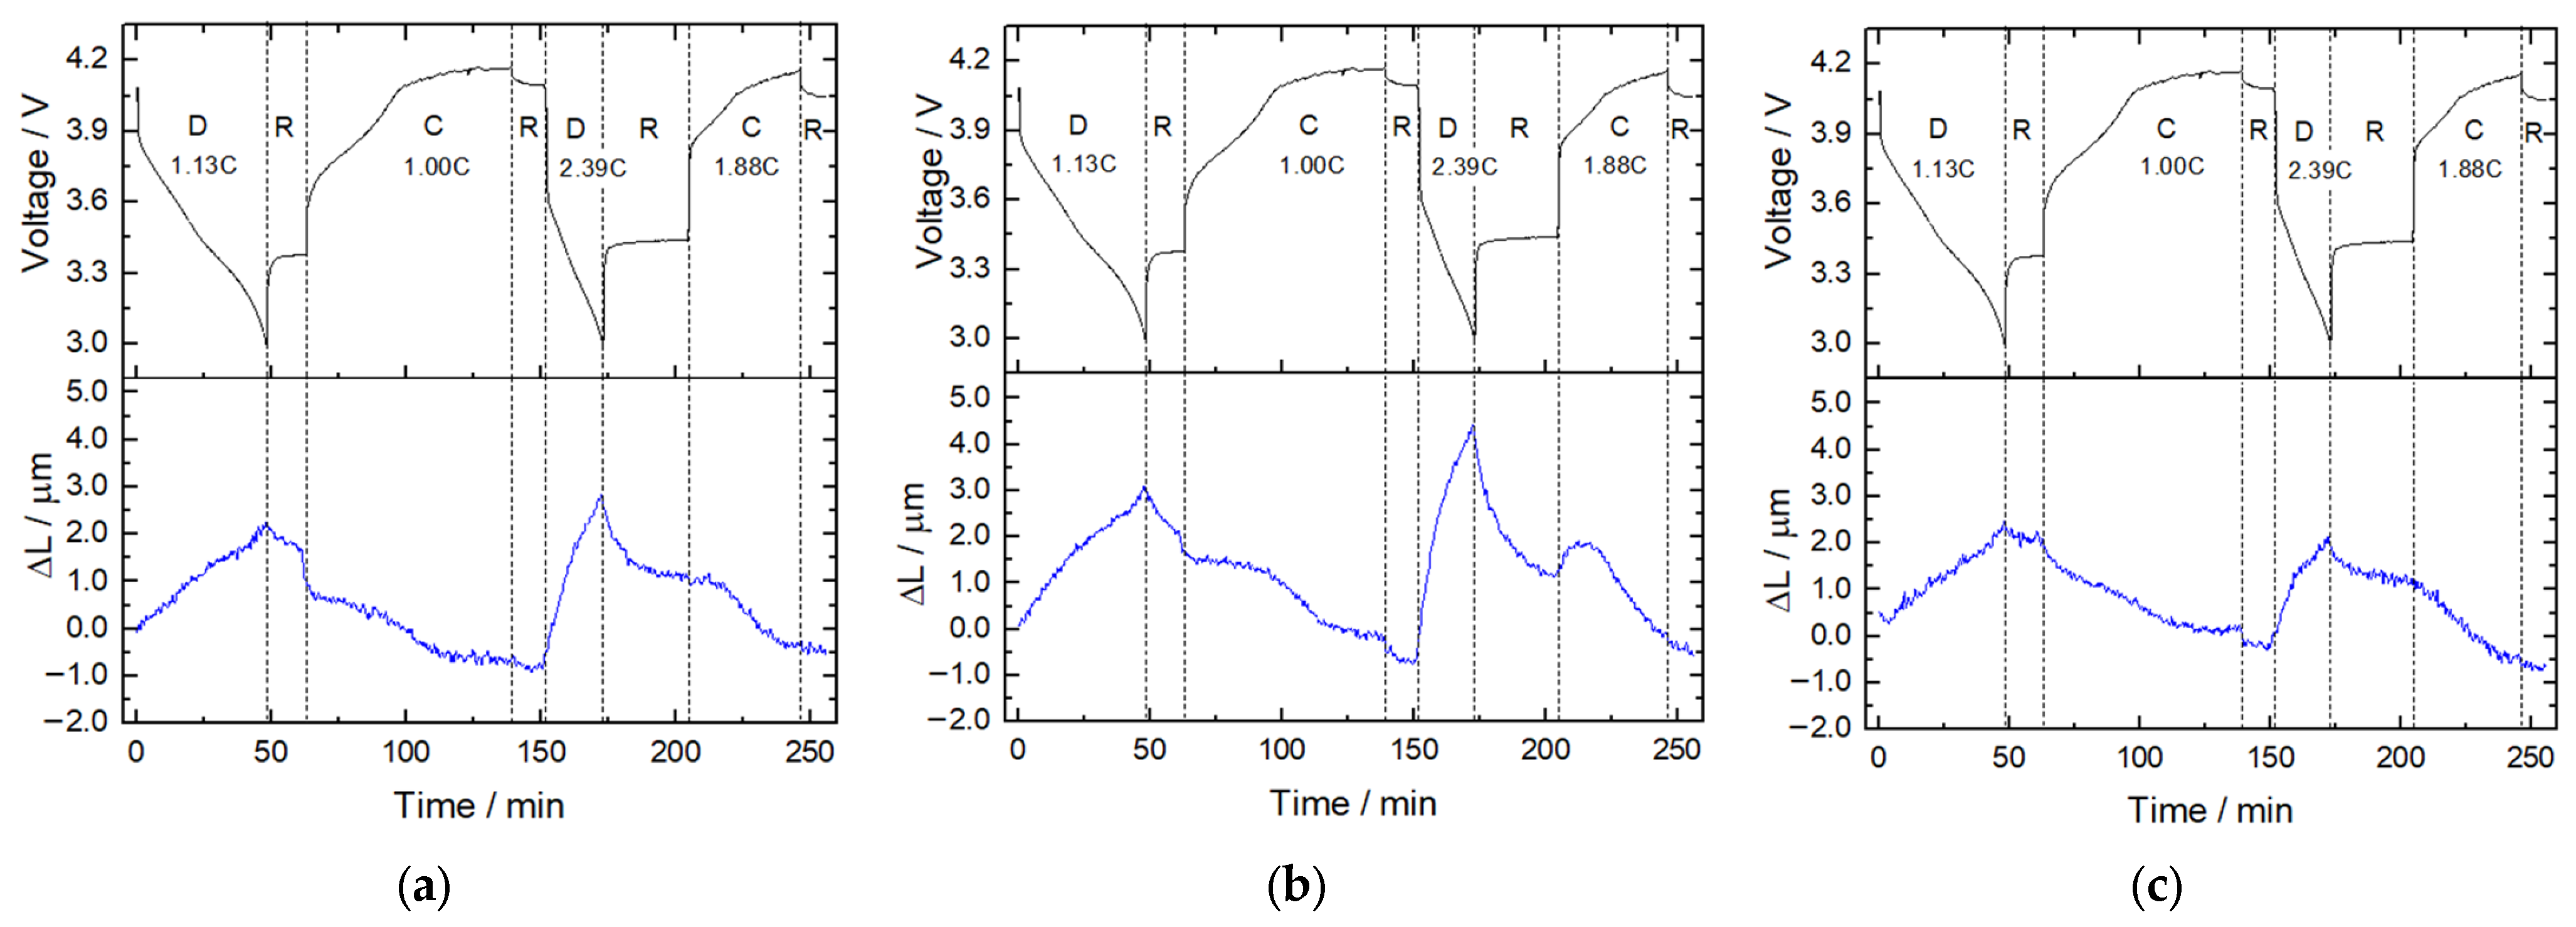
3.2. Experimental Results during Galvanostatic Cycling Tests

Figure 6 shows the temperature and strain variations over voltage performance at charge/discharge cycles for the PM-FBGs placed in positions close to negative terminal (PM-FBG1), middle of battery (PM-FBG 2), and positive terminal (PM-FBG 3). The different steps of the experiment are separated by dashed lines, where D, C, and R represents discharge, charge, and rest steps, respectively. Both charge and discharge processes presented greater temperature and strain variations when the battery was operated at higher C-rates. For both charge steps, the temperature increased in the first half of the process and then decreased until the end of the charge, due to the current adjustment charging mode of the charger used.
For the first cycle, under normal operating conditions, the temperature variation reached similar values during the charge and discharge processes and the negative terminal presented higher variations (12.5 ± 0.3 °C) when compared to the middle (9.5 ± 0.3 °C) and the positive terminal (12.2 ± 0.3 °C). In the final of the 1.13 C discharge, the middle of the battery presented higher strain variation (155 ± 10 με) if compared to the negative (113 ± 10 με) and positive (123 ± 10 με) terminals; otherwise, a contraction/relaxation was observed during the 1.00 C charge process. On the negative terminal (see Figure 6a), a sudden decrease in the strain was observed exactly when the charge step started, probably correlated with the Li-ion migration to the positive side of the battery. During the rest intervals, both temperature and strain variations were relieved. Despite the higher current rate in the terminals of the battery, the middle location presented higher strain variations, probably due the battery cylindrical shape, whereas the middle of the cylinder presented higher displacement freedom when compared to the terminals.
For the second cycle, under abnormal operating conditions, the temperature and deformation registered the most significative increases in the test. As shown in Figure 6c, at the end of abusive discharge, the positive terminal achieved the highest temperature variation (28.7 ± 0.3 °C vs. 21.0 ± 0.3 °C in the middle and 25.9 ± 0.3 °C in the negative terminal), due to the higher internal current flows on this region. On the other hand, in the middle, the highest strain variation was registered, 221 ± 10 με, vs. 143 ± 10 με in the negative and 107 ± 10 με in the positive terminals, respectively. After the beginning of the abusive charge, for almost 10 min, the middle location (see Figure 6b) also presented a positive strain shift, followed by a relaxation behavior, similar to the first charge cycle, in normal conditions, up to the end of this process.
Correlating the strain changes to deformation values of the battery is possible by multiplying it by the distance between the optical fiber fixed points, using Equation (3). In this way, the deformation measured in this experiment can be referent to the thermal expansion and contraction of the battery materials, as well as the lithium-ion flow during their operation, resembling breathing, in which there is an expansion during discharge and a contraction during charge. The higher relative deformation detected by the PM-FBG sensors was ~0.02 % at the end of the abusive discharge and in the middle location (see Figure 7).
The results obtained are in accordance with previous studies regarding battery cell strain behavior during charge/discharge cycles, using strain gauges placed in different spots of 18650 batteries [32]. In this way, future work regarding the application birefringent PM optical fibers in other battery configurations (pouch cells) may be approached using these types of sensors, enabling the simultaneous measurement of internal temperature and strain variations in different battery points or multi-stack layers.
The proposed approach promotes a noninvasive, multipoint, and real-time monitoring of battery cell safety parameters. Such a technique has no influence on the safety or performance of the battery cell, once neither the interior nor the battery housing is damaged by the optical sensors. Although the tests are based on a commercial battery operation, applying this technique in real commercial applications would require extra cost, mainly to promote the adequate interface for the integration of the optical data obtained in the BMS and to guarantee the standardization of measurements. The purpose of this application is to develop new and better approaches to acquire temperature and strain variation data for future estimations of battery safety parameters; therefore, it is not expected to apply this instrumentation setup to real commercial applications.
PM-FBG sensors may be embedded within battery cell materials to track internal strains variations; however, to provide a simultaneous measurement of temperature and strain within the cell, the optical fiber would have to be allocated during the manufacturing process of the jelly roll. However, we believe that such a sensing approach would be more useful when applied during the development stage of new battery designs (laboratory tests), before their commercialization, in order to evaluate their performance and safety limits. Later, it would be possible to correlate the internal parameter data to develop new thermal model algorithms.
The measurement range of optical fiber sensors is determined by the physical limits of the respective optical fiber where these types of sensors are inscribed. In this way, as the optical fiber used was a commercial silica fiber, a measurement range of −50 to 350 °C and up to 3000 με is expected for temperature and strain variations, respectively. In a thermal runaway event, the battery can achieve maximum temperatures on the order of 1000 °C; however, as it is triggered in a temperature range of 100–250 °C [33] and as the main objective of this sensing approach is to improve the safety through the early detection of the thermal runaway events, the PM-FBG sensors used are available to identify the first triggering stages of thermal runaway.

4. Conclusions

A simultaneous temperature and strain discrimination using FBG sensors recorded in PANDA fibers was studied in real time and during operation of an 18650 Li-ion battery, for the first time. Temperature calibration of the sensors was performed after being fixed in direct contact with the cylindrical battery surface. Voltage performance during different charge/discharge cycles, at 1.00 C (normal condition) and 1.88 C (abusive condition) for the charge step, and at 1.13 C (normal condition) and 2.39 C (abusive condition) for the discharge step, was evaluated to collect and analyze the temperature and longitudinal strain variations from the three PM-FBGs located in different zones of the battery (negative terminal, middle, and positive terminal). According to the results, the PM-FBG sensors located in the middle of the battery detected higher longitudinal strain variations, during the discharge process, in both cycles. Close to the positive terminal, in abusive conditions, higher temperature variations were monitored due to the higher current fluxes, and higher heat generation was simultaneously produced. Longitudinal deformation data indicated that the battery compensated for the extension suffered during discharge and for the contraction suffered during charging steps.

Author Contributions

All authors contributed equally. L.M. and M.N. conceptualized the experiments and analyzed the data. L.M., J.L.P., C.M. and M.N. discussed the results, as well as wrote and revised the document. L.M., J.L.P., C.M. and M.N. All authors have read and agreed to the published version of the manuscript.

Funding

The authors gratefully acknowledge the European Project “Innovative physical/virtual sensor platform for battery cell” (INSTABAT) (European Union’s Horizon 2020 research and innovation program under grant agreement No 955930), grant number BI/UI96/6642/2022, https://www.instabat.eu/. The authors also acknowledge the financial support within the scope of the project i3n, UIDB/50025/2020 and UIDP/50025/2020, financed by national funds through the FCT/MEC.

Institutional Review Board Statement

Not applicable.

Informed Consent Statement

Not applicable.

Data Availability Statement

Not applicable.

Conflicts of Interest

The authors declare no conflict of interest.

References

  1. Kataria, J.; Devi, P.; Rani, P. Importance of Structures and Interactisons in Ionic Liquid-Nanomaterial Composite Systems as a Novel Approach for Their Utilization in Safe Lithium Metal Batteries: A Review. J. Mol. Liq. 2021, 339, 116736. [Google Scholar] [CrossRef]
  2. AbdelHamid, A.A.; Mendoza-Garcia, A.; Ying, J.Y. Advances in and Prospects of Nanomaterials’ Morphological Control for Lithium Rechargeable Batteries. Nano Energy 2022, 93, 106860. [Google Scholar] [CrossRef]
  3. Su, Y.D.; Preger, Y.; Burroughs, H.; Sun, C.; Ohodnicki, P.R. Fiber Optic Sensing Technologies for Battery Management Systems and Energy Storage Applications. Sensors 2021, 21, 1397. [Google Scholar] [CrossRef] [PubMed]
  4. Novais, S.; Nascimento, M.; Grande, L.; Domingues, M.F.; Antunes, P.; Alberto, N.; Leitão, C.; Oliveira, R.; Koch, S.; Kim, G.T.; et al. Internal and External Temperature Monitoring of a Li-Ion Battery with Fiber Bragg Grating Sensors. Sensors 2016, 16, 1394. [Google Scholar] [CrossRef] [PubMed] [Green Version]
  5. Chombo, P.V.; Laoonual, Y. A Review of Safety Strategies of a Li-Ion Battery. J. Power Sources 2020, 478, 228649. [Google Scholar] [CrossRef]
  6. Amici, J.; Asinari, P.; Ayerbe, E.; Barboux, P.; Bayle-Guillemaud, P.; Behm, R.J.; Berecibar, M.; Berg, E.; Bhowmik, A.; Bodoardo, S.; et al. A Roadmap for Transforming Research to Invent the Batteries of the Future Designed within the European Large Scale Research Initiative BATTERY 2030+. Adv. Energy Mater. 2022, 12, 2102785. [Google Scholar] [CrossRef]
  7. Samanta, A.; Williamson, S.S. A Comprehensive Review of Lithium-Ion Cell Temperature Estimation Techniques Applicable to Health-Conscious Fast Charging and Smart Battery Management Systems. Energies 2021, 14, 5960. [Google Scholar] [CrossRef]
  8. Bandhauer, T.M.; Garimella, S.; Fuller, T.F. A Critical Review of Thermal Issues in Lithium-Ion Batteries. J. Electrochem. Soc. 2011, 158, R1. [Google Scholar] [CrossRef]
  9. Leung, P.K.; Moreno, C.; Masters, I.; Hazra, S.; Conde, B.; Mohamed, M.R.; Dashwood, R.J.; Bhagat, R. Real-Time Displacement and Strain Mappings of Lithium-Ion Batteries Using Three-Dimensional Digital Image Correlation. J. Power Sources 2014, 271, 82–86. [Google Scholar] [CrossRef] [Green Version]
  10. Grattan, K.T.V.; Sun, T. Fiber Optic Sensor Technology: An Overview. Sens. Actuators A Phys. 2000, 82, 40–61. [Google Scholar] [CrossRef]
  11. Rente, B.; Fabian, M.; Vidakovic, M.; Liu, X.; Li, X.; Li, K.; Sun, T.; Grattan, K.T.V. Lithium-Ion Battery State-of-Charge Estimator Based on FBG-Based Strain Sensor and Employing Machine Learning. IEEE Sens. J. 2021, 21, 1453–1460. [Google Scholar] [CrossRef]
  12. Nascimento, M.; Novais, S.; Ding, M.S.; Ferreira, M.S.; Koch, S.; Passerini, S.; Pinto, J.L. Internal Strain and Temperature Discrimination with Optical Fiber Hybrid Sensors in Li-Ion Batteries. J. Power Sources 2019, 410–411, 1–9. [Google Scholar] [CrossRef]
  13. Huang, J.; Albero Blanquer, L.; Bonefacino, J.; Logan, E.R.; Alves Dalla Corte, D.; Delacourt, C.; Gallant, B.M.; Boles, S.T.; Dahn, J.R.; Tam, H.Y.; et al. Operando Decoding of Chemical and Thermal Events in Commercial Na(Li)-Ion Cells via Optical Sensors. Nat. Energy 2020, 5, 674–683. [Google Scholar] [CrossRef]
  14. McTurk, E.; Amietszajew, T.; Fleming, J.; Bhagat, R. Thermo-Electrochemical Instrumentation of Cylindrical Li-Ion Cells. J. Power Sources 2018, 379, 309–316. [Google Scholar] [CrossRef]
  15. Nedjalkov, A.; Meyer, J.; Gräfenstein, A.; Schramm, B.; Angelmahr, M.; Schwenzel, J.; Schade, W. Refractive Index Measurement of Lithium Ion Battery Electrolyte with Etched Surface Cladding Waveguide Bragg Gratings and Cell Electrode State Monitoring by Optical Strain Sensors. Batteries 2019, 5, 30. [Google Scholar] [CrossRef] [Green Version]
  16. Yang, G.; Leitão, C.; Li, Y.; Pinto, J.; Jiang, X. Real-Time Temperature Measurement with Fiber Bragg Sensors in Lithium Batteries for Safety Usage. Measurement 2013, 46, 3166–3172. [Google Scholar] [CrossRef]
  17. Ee, Y.J.; Tey, K.S.; Lim, K.S.; Shrivastava, P.; Adnan, S.B.R.S.; Ahmad, H. Lithium-Ion Battery State of Charge (SoC) Estimation with Non-Electrical Parameter Using Uniform Fiber Bragg Grating (FBG). J. Energy Storage 2021, 40, 102704. [Google Scholar] [CrossRef]
  18. Han, G.; Yan, J.; Guo, Z.; Greenwood, D.; Marco, J.; Yu, Y. A Review on Various Optical Fibre Sensing Methods for Batteries. Renew. Sustain. Energy Rev. 2021, 150, 111514. [Google Scholar] [CrossRef]
  19. Nascimento, M.; Ferreira, M.S.; Pinto, J.L. Real Time Thermal Monitoring of Lithium Batteries with Fiber Sensors and Thermocouples: A Comparative Study. Measurement 2017, 111, 260–263. [Google Scholar] [CrossRef]
  20. Nascimento, M.; Ferreira, M.S.; Pinto, J.L. Temperature Fiber Sensing of Li-Ion Batteries under Different Environmental and Operating Conditions. Appl. Therm. Eng. 2019, 149, 1236–1243. [Google Scholar] [CrossRef]
  21. Nascimento, M.; Ferreira, M.S.; Pinto, J.L. Simultaneous Sensing of Temperature and Bi-Directional Strain in a Prismatic Li-Ion Battery. Batteries 2018, 4, 23. [Google Scholar] [CrossRef] [Green Version]
  22. Li, J.; Wang, H.; Sun, L.-P.; Huang, Y.; Jin, L.; Guan, B.-O. Etching Bragg Gratings in Panda Fibers for the Temperature-Independent Refractive Index Sensing. Opt. Express 2014, 22, 31917. [Google Scholar] [CrossRef] [PubMed] [Green Version]
  23. Zhu, M.; Murayama, H.; Wada, D. Self-Evaluation of PANDA-FBG Based Sensing System for Dynamic Distributed Strain and Temperature Measurement. Sensors 2017, 17, 2319. [Google Scholar] [CrossRef] [PubMed] [Green Version]
  24. Wang, C.; Huang, Z.; Li, G.; Zhang, S.; Zhao, J.; Zhao, N.; Cai, H.; Zhang, Y. Simultaneous Temperature and Strain Measurements Using Polarization-Maintaining Few-Mode Bragg Gratings. Sensors 2019, 19, 5221. [Google Scholar] [CrossRef] [PubMed] [Green Version]
  25. Guo, K.; He, J.; Shao, L.; Xu, G.; Wang, Y. Simultaneous Measurement of Strain and Temperature by a Sawtooth Stressor-Assisted Highly Birefringent Fiber Bragg Grating. J. Light. Technol. 2020, 38, 2060–2066. [Google Scholar] [CrossRef]
  26. Lu, L.; Xu, Y.; Dong, M.; Zhu, L. Birefringent Interferometer Cascaded with PM-FBG for Multi-Parameter Testing. IEEE Sens. J. 2022, 22, 338–343. [Google Scholar] [CrossRef]
  27. Min, R.; Pereira, L.; Paixão, T.; Woyessa, G.; André, P.; Bang, O.; Antunes, P.; Pinto, J.; Li, Z.; Ortega, B.; et al. Inscription of Bragg Gratings in Undoped PMMA MPOF with Nd:YAG Laser at 266 Nm Wavelength. Opt. Express 2019, 27, 38039. [Google Scholar] [CrossRef]
  28. He, J.; Xu, B.; Ju, S.; Hou, M.; Guo, K.; Xu, X.; Wang, Y.; Liu, S.; Wang, Y. Temperature-Insensitive Directional Transverse Load Sensor Based on Dual Side-Hole Fiber Bragg Grating. Opt. Express 2021, 29, 17700. [Google Scholar] [CrossRef]
  29. Mcmillen, B. Fiber Bragg Grating Sensors. In Handbook of Optical Sensors; CRC Press: Boca Raton, FL, USA, 2014; pp. 522–551. [Google Scholar] [CrossRef]
  30. Zhu, Z.; Chen, Y.; Zhang, Y. The Temperature Sensitivity of Fiber Bragg Gratings Embedded in an Al 6061 Matrix by Ultrasonic Welding. J. Intell. Mater. Syst. Struct. 2011, 22, 2173–2179. [Google Scholar] [CrossRef]
  31. Zhu, M.; Murayama, H.; Wada, D.; Kageyama, K. Dependence of Measurement Accuracy on the Birefringence of PANDA Fiber Bragg Gratings in Distributed Simultaneous Strain and Temperature Sensing. Opt. Express 2017, 25, 4000. [Google Scholar] [CrossRef]
  32. Vidal, D.; Leys, C.; Mathieu, B.; Guillet, N.; Vidal, V.; Borschneck, D.; Chaurand, P.; Genies, S.; de Vito, E.; Tulodziecki, M.; et al. Si–C/G Based Anode Swelling and Porosity Evolution in 18650 Casing and in Pouch Cell. J. Power Sources 2021, 514, 230552. [Google Scholar] [CrossRef]
  33. Feng, X.; Ouyang, M.; Liu, X.; Lu, L.; Xia, Y.; He, X. Thermal Runaway Mechanism of Lithium Ion Battery for Electric Vehicles: A Review. Energy Storage Mater. 2018, 10, 246–267. [Google Scholar] [CrossRef]
Figure 1. INR18650 MH1 3200 mAh battery cell.
Batteries 08 00233 g001
Figure 2. Illustrative scheme of FBG sensor inscription. The phase mask splits the UV beam into secondary beams, −1st order and +1st order, which interact with the optical fiber core, originating the gratings and the FBG sensor [29]. The birefringence property of the PM optical fibers induces two different propagation modes, resulting in two shifted Bragg wavelengths represented by the fast and slow peaks, as shown in the spectrum read of the optical interrogator.
Batteries 08 00233 g002
Figure 3. Spectrum response of the three PM-FBG sensors inscribed in the same PM optical fiber; six peaks were acquired using the optical interrogator and the fast and slow peaks of each PM-FBG sensor.
Batteries 08 00233 g003
Figure 4. Schematic of micrometric translation stage method. The PM fiber and the PM-FBG sensors were subjected to crescent strain steps, while the optical interrogator performed the Bragg wavelength variation measurement, allowing the correlation of strain variation and the Bragg wavelength shift.
Batteries 08 00233 g004
Figure 5. (a) Illustrative scheme of the experimental setup. (b) The optical fiber and the PM-FBG sensors fixed to the battery cell. The optical fiber was fixed to the battery after temperature calibration; thus, the experimental probe was in near-initial strain conditions.
Batteries 08 00233 g005
Figure 6. (a) Temperature and strain variations detected over voltage performance for (a) negative terminal (PM-FBG 1), (b) middle (PM-FBG 2), and (c) positive terminal (PM-FBG 3) of the battery.
Batteries 08 00233 g006
Figure 7. Deformation variation detected by the PM-FBG sensors over voltage signal for (a) negative terminal, (b) middle, and (c) positive terminal of the battery. Higher deformation variation was recorded in the middle location, at the end of abusive discharge, where a 0.02% variation occurred. The higher deformation registered in the charge steps were in the early beginning of such processes, presenting a lower relative displacement of 0.01%, also in the middle location. The battery terminals tended to present lower deformation values.
Batteries 08 00233 g007
Table 1. PM-FBG temperature and strain sensitivities obtained from the experimental calibrations.
Temperature [pm/°C]Strain [pm/με]
HeatingCooling
Sensors K T f K T s K T f K T s K ε f K ε s
FBG 122.1 ± 0.221.7 ± 0.223.3 ± 0.223.0 ± 0.21.201 ± 0.0051.211 ± 0.006
FBG 222.3 ± 0.221.7 ± 0.223.5 ± 0.223.0 ± 0.21.207 ± 0.0051.216 ± 0.006
FBG 322.5 ± 0.122.1 ± 0.223.7 ± 0.323.3 ± 0.31.215 ± 0.0051.225 ± 0.005
Table 2. Determinant values calculated from the matrixial method during heating and cooling steps.
HeatingCooling
SensorsK MatrixDeterminantK MatrixDeterminant
PM-FBG 1 K = ( 1.201 22.1 1.211 21.7 ) −0.701 K = ( 1.201 23.3 1.211 23.0 ) −0.593
PM-FBG 2 K = ( 1.207 22.3 1.216 21.7 ) −0.925 K = ( 1.207 23.5 1.216 23.0 ) −0.815
PM-FBG 3 K = ( 1.215 22.5 1.225 22.1 ) −0.711 K = ( 1.215 23.7 1.225 23.3 ) −0.723
Publisher’s Note: MDPI stays neutral with regard to jurisdictional claims in published maps and institutional affiliations.

