Article

Multi-Step Prediction of Typhoon Tracks Combining Reanalysis Image Fusion Using Laplacian Pyramid and Discrete Wavelet Transform with ConvLSTM

College of Information Technology, Shanghai Ocean University, Shanghai 201308, China
*
Author to whom correspondence should be addressed.
Axioms 2023, 12(9), 874; https://doi.org/10.3390/axioms12090874
Submission received: 30 June 2023 / Revised: 22 August 2023 / Accepted: 30 August 2023 / Published: 12 September 2023
(This article belongs to the Special Issue Advanced Computing Methods for Fuzzy Systems and Neural Networks)

Abstract

:
Typhoons often cause huge losses, so it is significant to accurately predict typhoon tracks. Nowadays, researchers predict typhoon tracks with the single step, while the correlation of adjacent moments data is small in long-term prediction, due to the large step of time. Moreover, recursive multi-step prediction results in the accumulated error. Therefore, this paper proposes to fuse reanalysis images at the similarly historical moment and predicted images through Laplacian Pyramid and Discrete Wavelet Transform to reduce the accumulated error. That moment is determined according to the difference in the moving angle at predicted and historical moments, the color histogram similarity between predicted images and reanalysis images at historical moments and so on. Moreover, reanalysis images are weighted cascaded and input to ConvLSTM on the basis of the correlation between reanalysis data and the moving angle and distance of the typhoon. And, the Spatial Attention and weighted calculation of memory cells are added to improve the performance of ConvLSTM. This paper predicted typhoon tracks in 12 h, 18 h, 24 h and 48 h with recursive multi-step prediction. Their MAEs were 102.14 km, 168.17 km, 243.73 km and 574.62 km, respectively, which were reduced by 1.65 km, 5.93 km, 4.6 km and 13.09 km, respectively, compared with the predicted results of the improved ConvLSTM in this paper, which proved the validity of the model.

1. Introduction

A typhoon is a kind of tropical cyclone. It is called a typhoon when the maximum wind near the tropical cyclone center reaches the 12th level, namely, over 32.7 m/s [1]. When a typhoon occurs, in addition to causing strong winds and heavy rain, it may also cause secondary disasters, such as floods and mudslides, and result in huge losses to people’s lives and property. For example, typhoon Lionrock that occurred in Japan in 2016 led to the death of 22 people after landing [2]. Typhoon Yolanda hit the Philippines in 2013, resulting in 6293 people’s deaths, 1061 people missing and 28,689 people injured, and also caused the loss of USD 904,680,000 [3]. Furthermore, because of global warming, the number of strong typhoons may increase further [4]. Therefore, it is important for the development of disaster prevention and mitigation work to accurately predict typhoon tracks. At present, researchers mainly predict typhoon tracks with single-step prediction and multi-step prediction.
Researchers have conducted a lot of work on typhoon tracks single-step prediction. Numerical prediction was used to predict typhoon tracks by researchers earliest. Hong Kong Observatory predicted typhoon tracks with AAMC-WRF (Asian Aviation Meteorological Centre -Weather Research and Forecast), which achieved a small predicted error [5]. Numerical prediction mainly uses atmospheric dynamics, numerical mathematics and so on. Although the method can achieve relatively high accuracy, the complexity of the formula is high, calculation is large, and the requirements for hardware are also relatively high. To reduce the difficulties of prediction, with the continuous development of Deep Learning, researchers have begun to predict typhoon tracks with Deep Learning methods. Therefore, researchers mainly choose LSTM (Long Short-Term Memory) and its variant models during their research, such as GRU (Gate Recurrent Unit), ConvLSTM (Convolutional LSTM) and so on. Jie Lian et al. considered the influence of meteorological factors on typhoon tracks, adopting coordinates of typhoon centers and meteorological data, and extracting underlying deep features of multi-dimensional datasets with AE (Auto-encoder) and prediction time series with GRU [6]. B. Tong et al. predicted tropical cyclone tracks and intensity in the short term with ConvLSTM on four kinds of tropical cyclone best track datasets [7]. But, ConvLSTM is mainly used for the prediction of time image series, and it is more suitable for extracting temporal and spatial features of time image series at the same time, with poor performance on features extraction of pure data. Furthermore, the influent area of typhoons is relatively large. In the research of Kazuaki Yasunaga et al., the maximum radius of the typhoon can be over 500 km [8]. It explains that the typhoon has spatial features, and predicting typhoon tracks only with best track datasets does not consider the spatial features of the typhoon. Therefore, there are researchers who predict typhoon tracks with satellite images and reanalysis images. Mario Rüttgers et al. adopted reanalysis images and satellite images marking typhoon centers and generated predicted images with GAN (Generative Adversarial Network) to achieve the predicted coordinates of the typhoon center at the next moment [9]. However, compared with ConvLSTM, generated images with GAN are more random. Xiaoguang Mei et al. proposed Spectral–spatial Attention Network, which added Spectral–spatial Attention to RNN (Recurrent Neural Network) and CNN (Convolutional Neural Networks) to achieve hyperspectral image classification and improve the abilities that the model learns for the correlation of the spectrums in the continuous spectrum and the significant features and spatial correlation between adjacent pixels [10]. Adding Spatial Attention to the model can help the model to extract more spatial features. In addition, compared with satellite images, reanalysis images not only reflect the temporal and spatial features of typhoons, but also reflect the influence of meteorological data on typhoons. So, this paper adopts reanalysis images and ConvLSTM to realize the typhoon tracks prediction in the process of research.
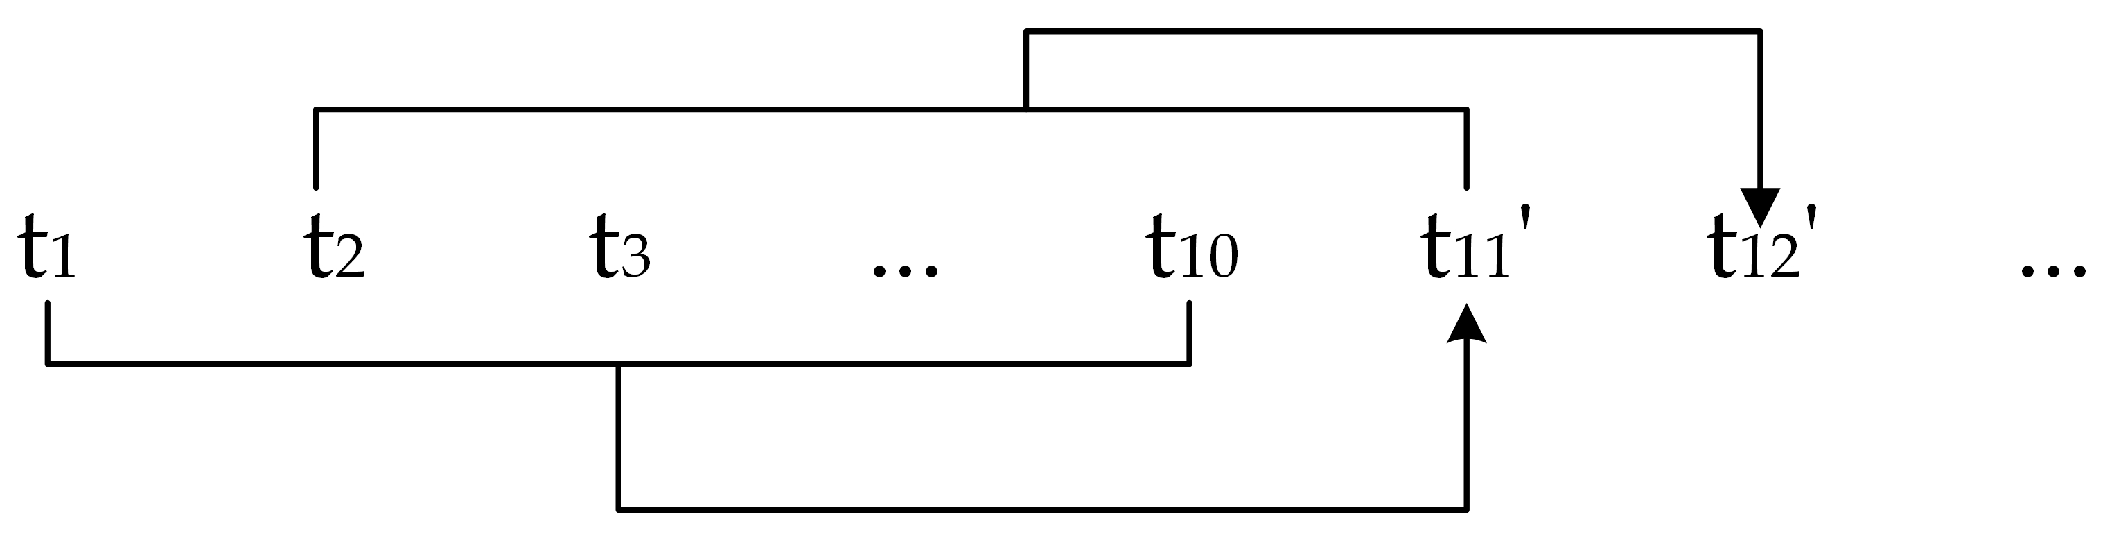
The method that predicts typhoon tracks with single-step time series is more suitable for short-term prediction in 3 h and 6 h. And, for long-term in the future, like predicting typhoon tracks in the next 12 h, 24 h and 72 h, steps of time series are large, with single-step prediction and correlation between data at two continuous moments being small, which results in the model having some difficulties learning temporal features. Because it is necessary for advanced arranging of disaster prevention and mitigation work to accurately predict typhoon tracks as early as possible, long-term prediction is also important in the research of typhoon tracks prediction. Therefore, when researching the problem of long-term prediction in the future, multi-step prediction is more suitable for predicting typhoon tracks with time series of short sampling time intervals to increase the correlation between data at continuous moments. Multi-step time series prediction includes a recursive multi-step prediction strategy, direct multi-step prediction strategy, direct-recursive hybrid strategy and multi-output strategy [11]. Chia-Yuan Chang et al. promoted that the multi-step prediction is the more common application in their research, and they recursively predicted extreme weather with the MCF (Markov conditional forward) model [12]. However, research studies of multi-step prediction in the field of typhoon tracks prediction are few at present. Some researchers predict cyclone intensity with multi-step prediction. For example, Ratneel Deo et al. multi-step predicted cyclone intensity in the South Pacific with Bayesian Neural Networks and the multi-output strategy [13]. Additionally, in other fields, researchers have performed much related research by multi-step prediction. Qichun Bing et al. predicted short-term traffic flow using Variational Mode Decomposition and LSTM with recursive the multi-step prediction strategy [14]. The recursive multi-step strategy involves adding predicted results at the current moment to time series to predict the next moment; so, it will cause the problem of accumulated error. Zhenhong Du et al. predicted chlorophyll a in the future with WNARNet (Wavelet Nonlinear Autoregressive network) and multi-step prediction, splitting time series with wavelet transform to simplify the complex time series, so as to reduce the accumulated error from multi-step prediction [15]. Feng Zhao et al. improved DTW (Dynamic Time Warping), proposing DMPSM (Dynamic Multi-perspective Personalized Similarity Measurement) to determine the historical stock series, which was similar to the predicted series, and using it to improve the results of multi-step prediction of the model in order to reduce the accumulated error [16].
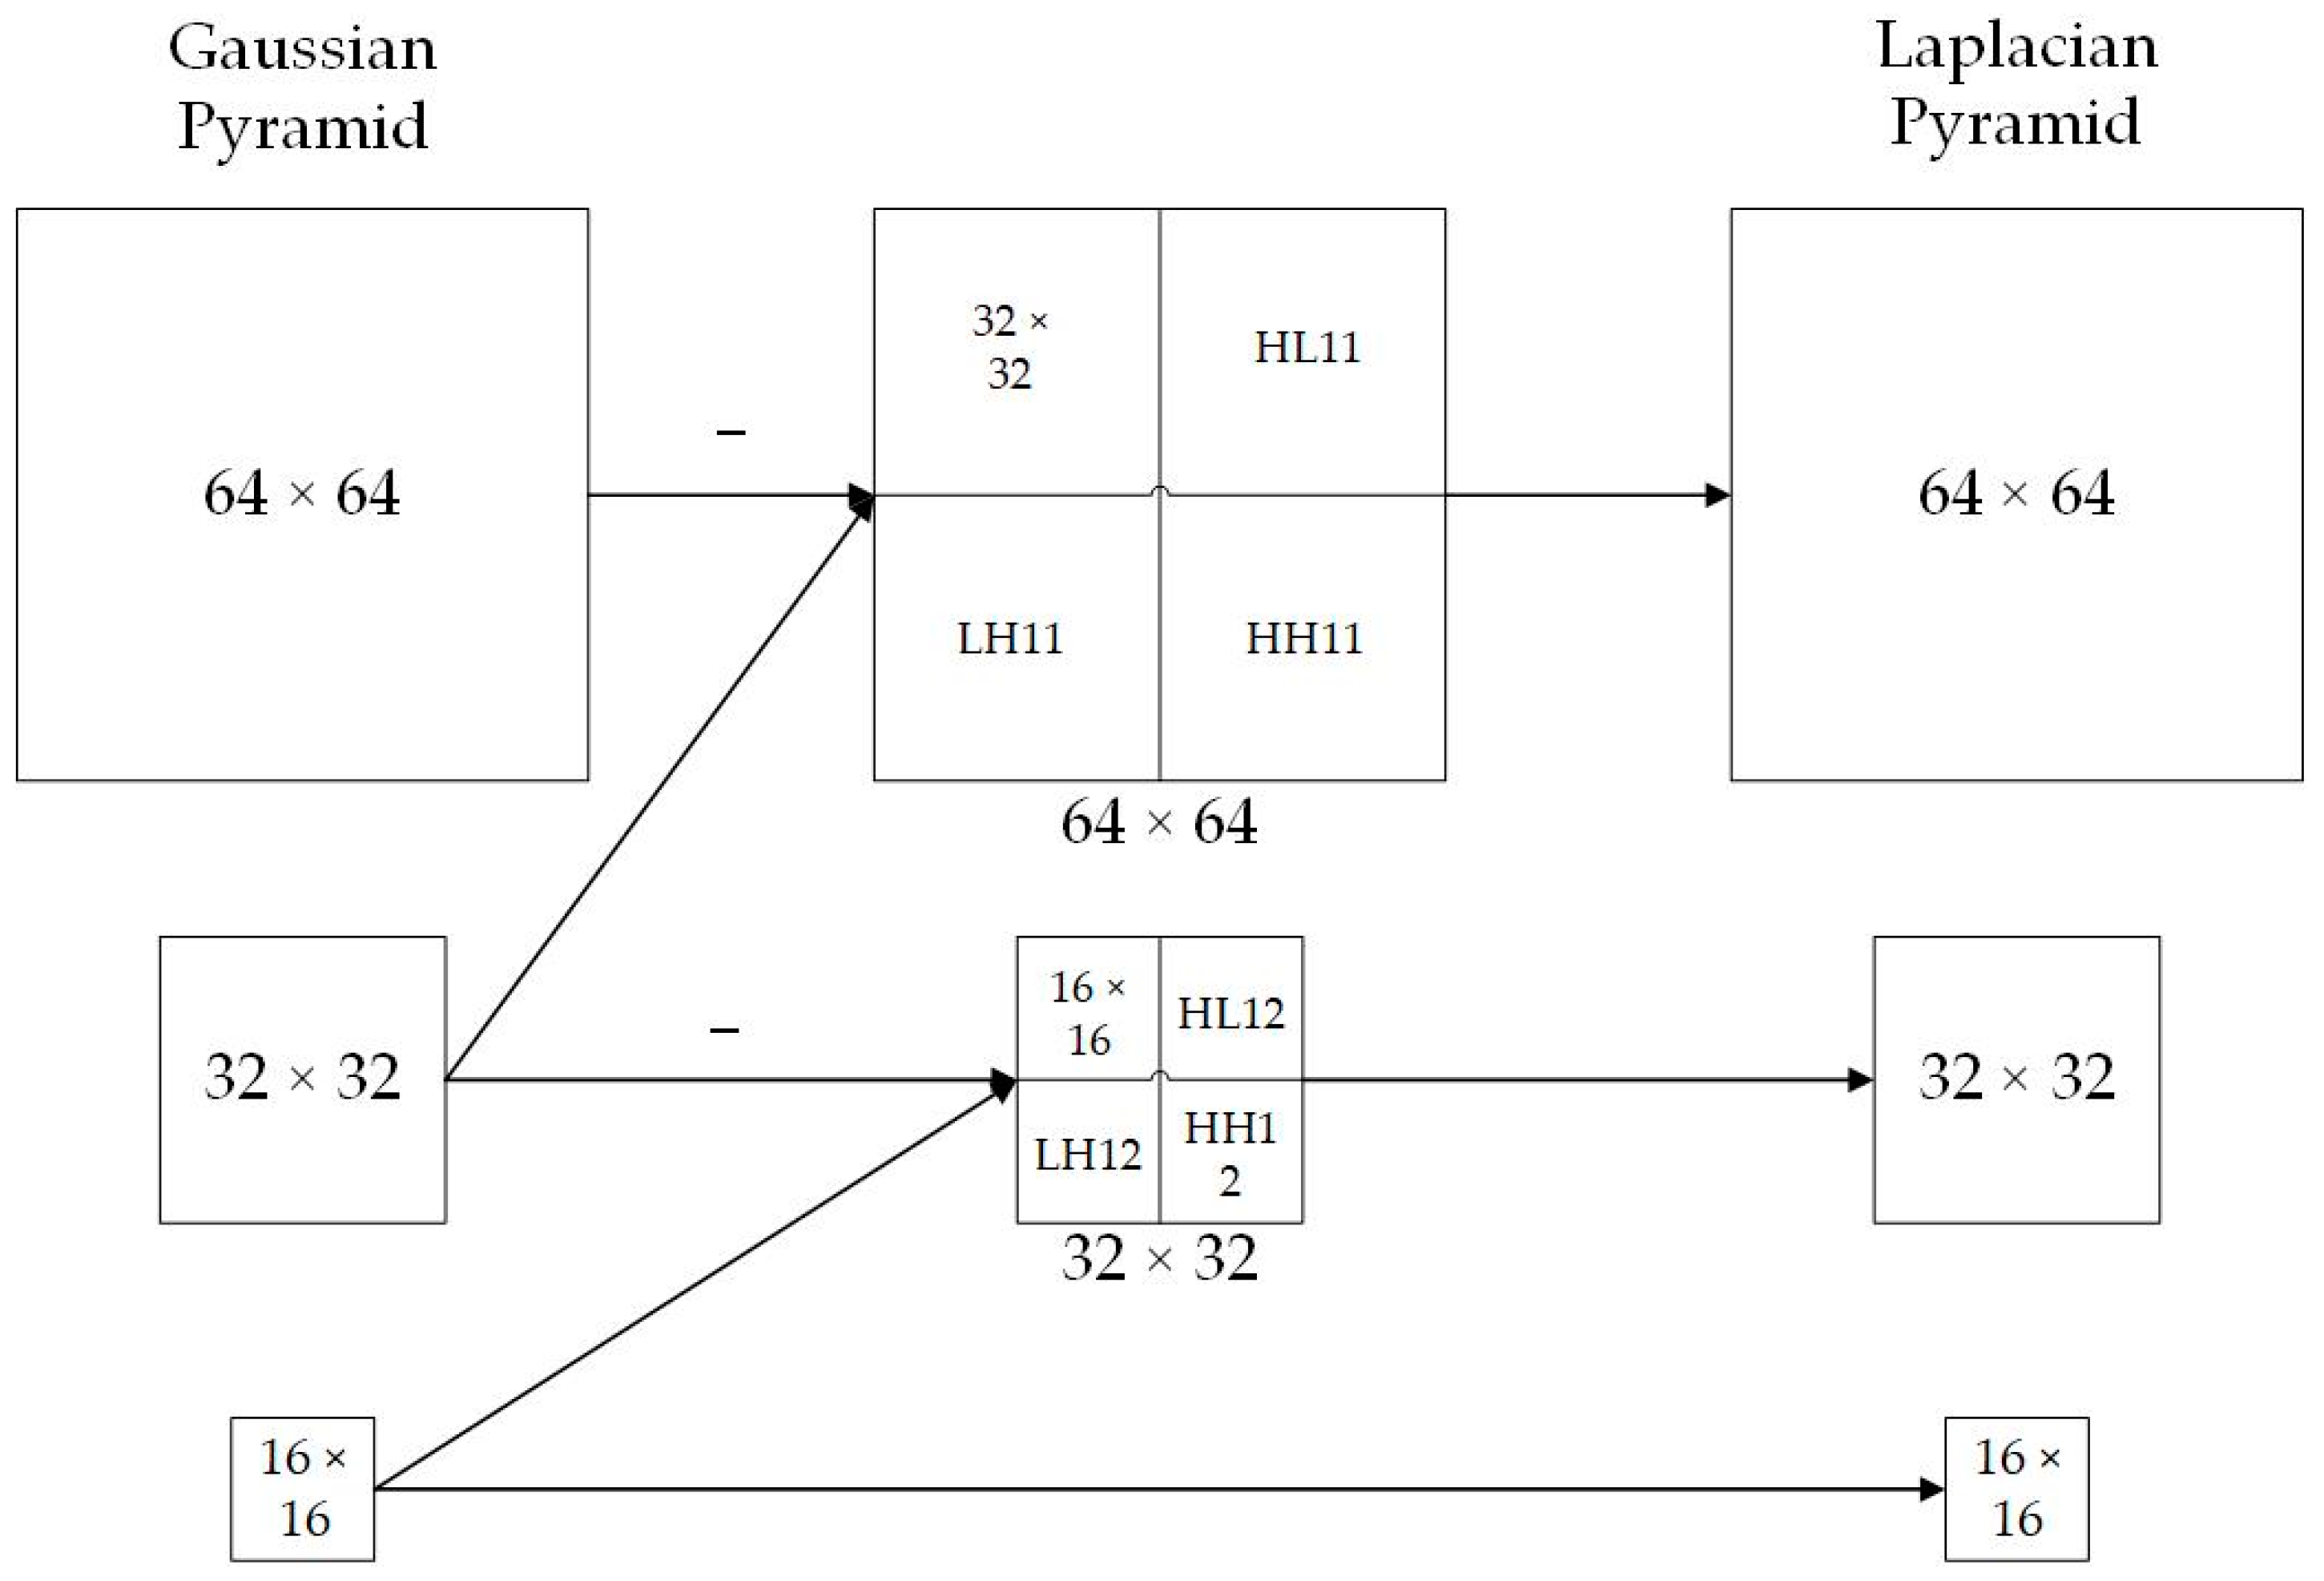
But, the Wavelet Transform and DTW mentioned above are more often applied to handle time series data, and less often applied to time series images. Therefore, to reduce the accumulated error created by recursive multi-step prediction, this paper determines historical reanalysis images, which are similar to predicted images, and then fuses predicted images with similarly historical reanalysis images to adjust the predicted images. Researchers have also conducted many research studies on image fusion. Run Mao et al. proposed Multi-directional Laplacian Pyramid to realize image fusion in order to solve the problem of the traditional Laplacian Pyramid image fusion algorithm, in which fused images are fuzzy and have a low contrast ratio [17]. Features of images in different sizes can be acquired by Laplacian Pyramid. Akansha Sharma et al. decomposed images into high-frequency and low-frequency images with DWT (Discrete Wavelet Transform) and then fused images using CNN in order to ensure the clearness and integrity of fused images [18]. DWT can decompose images to extract high-frequency and low-frequency features. So, this paper combines DWT and Laplacian Pyramid, so as to keep features of images as high as possible.
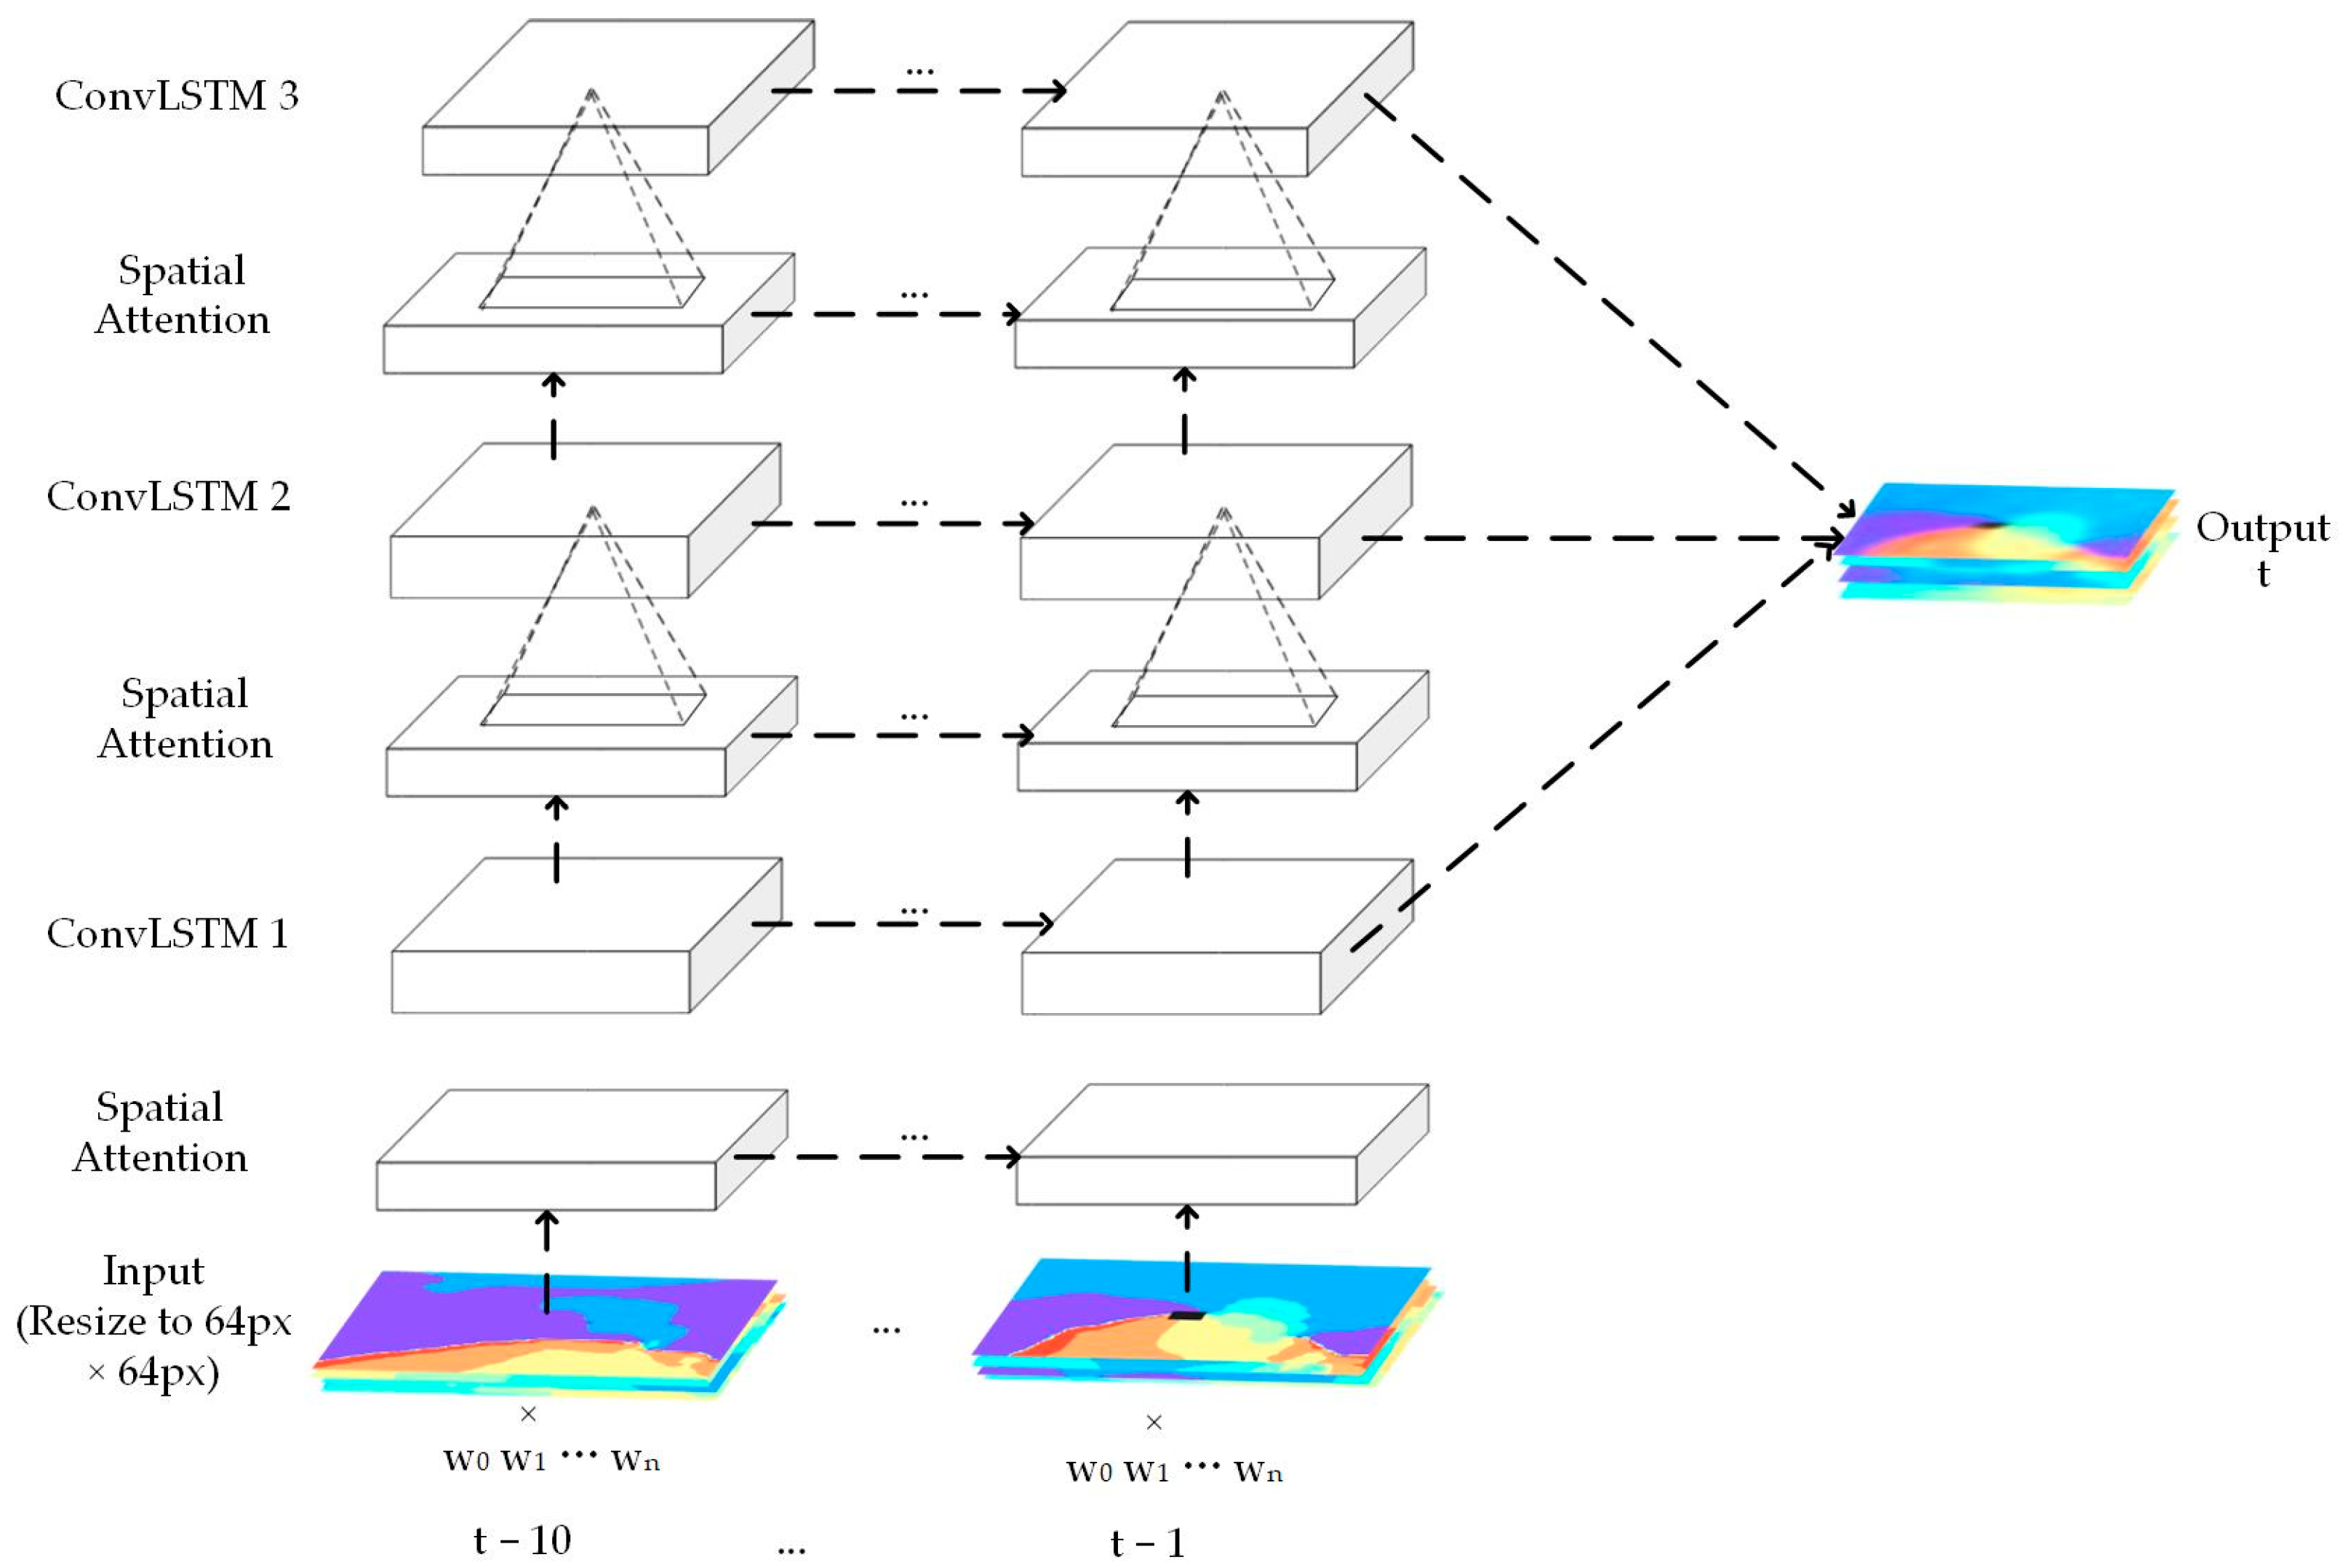
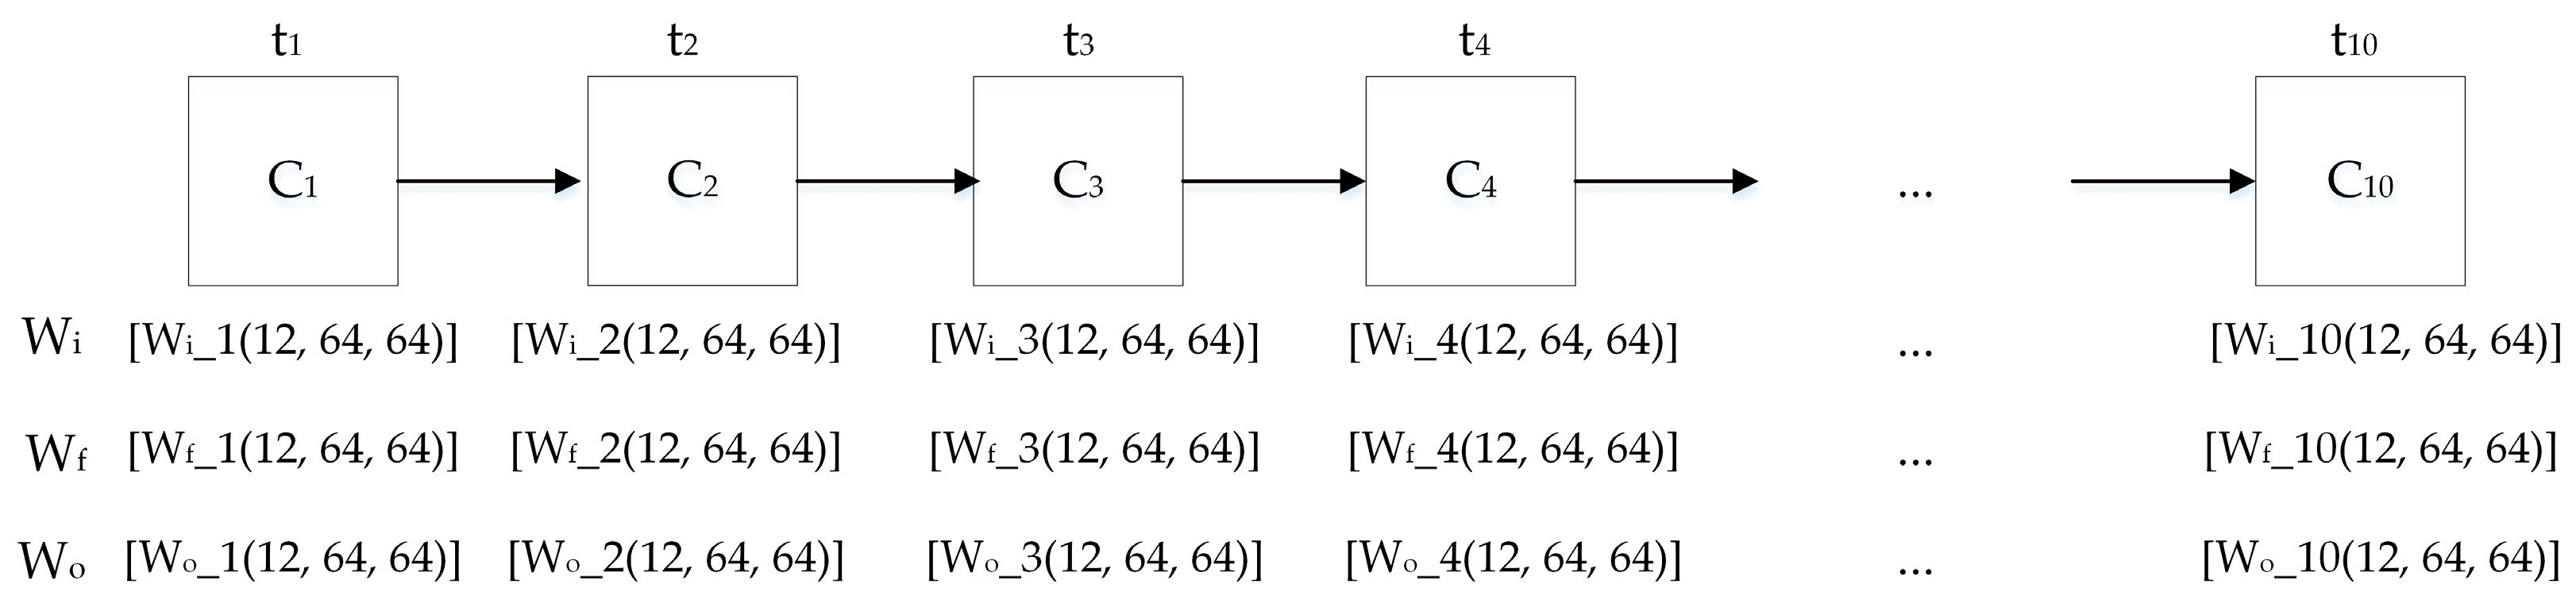
Through the above analysis of previous studies, this paper proposes weighted cascade reanalysis images of physical variables, which are input to ConvLSTM, according to the correlation between reanalysis data of physical variables and the moving angle and distance of the typhoon, in order to improve the proportion of reanalysis images of physical variables with a high correlation among input images. Meanwhile, Spatial Attention is added into ConvLSTM to improve the ability of the model to extract spatial features. The memory cells at the last two moments of ten moments in series are weighted and added, and every memory cell in the ConvLSTM unit is weighted, which is added to the gate unit calculation to improve the memory ability of the model in order to improve the predicted accuracy of the model. Moreover, this paper determines the historical moment that is similar to the predicted moment, according to the moving angle difference and absolute value of the moving distance difference of the typhoon at the predicted moment and historical moments; color histogram similarity between predicted images and reanalysis images at historical moments; and so on, fusing reanalysis images at the similarly historical moment and predicted images, in order to reduce the accumulated error resulting from recursive multi-step prediction to improve the predicted results. Regarding the method in this paper, by firstly combining CCA (Canonical Correlation Analysis) and GRA (Grey Relation Analysis), the physical variables group is selected with the highest correlation with the typhoon moving angle and distance, transferring its reanalysis data into reanalysis images marking the location of the typhoon center at the previous moment on images. The weights are set according to the correlation coefficient between every physical variable and the moving angle and distance of the typhoon, and reanalysis images are weighted cascaded, inputting to the ConvLSTM to achieve predicted images and calculating latitude and longitude coordinates of the typhoon center at the predicted moment according to the predicted images. To reduce the influence of the accumulated error on the predicted accuracy, the historical moment is determined that is similar to the predicted moment, according to the Euclidean distance of the pixel coordinates of marked points on the reanalysis images at historical moments and predicted images, the color histogram similarity between predicted images and reanalysis images at historical moments, the moving angle difference and absolute value of the moving distance difference of the typhoon at historical moments and the predicted moment, and the absolute value of the latitude difference and longitude difference of the typhoon centers at historical moment and the predicted moment. Predicted images and reanalysis images at the historical moment are fused by Wavelet Transform and Laplacian Pyramid, extracting coordinates of marked points on the fused images using the method of contour detection and the fitting minimum enclosing rectangle, and then eliminating marked points on fused images as much as possible. The new marked points representing the coordinates of the typhoon center at the previous moment are marked on the fused images, which are processed, to adjust the predicted images. The predicted latitude and longitude coordinates of the typhoon center of every physical variable are calculated through the relative position of the marked point on fused images and the center of the image, fitting them with a six-degree polynomial to achieve coordinates of the typhoon center at the predicted moment. The predicted images and latitude and longitude coordinates achieved from the above process are added into the time series of next step prediction to obtain reanalysis images and latitude and longitude coordinates of the typhoon center at the next moment through recursive multi-step prediction.
The structure of this paper is as follows: Section 2.1 introduces related theoretical research results. Section 2.2 introduces the established and optimized ConvLSTM and the improved method of multi-step prediction that this paper proposes. Section 2.3 introduces the establishment of the dataset in this paper, including the data acquirement and data process. Section 3 introduces the experimental results of this paper and the comparison with the work results of other researchers. Section 4 and Section 5 are the discussion and conclusion of this paper’s research, respectively.

2. Materials and Methods

2.1. Related Work

2.1.1. ConvLSTM

ConvLSTM was proposed by Xingjian Shi et al. initially to predict short-term rainfall intensity in the local area [19]. ConvLSTM is a variant of LSTM. Adding the convolution operation on the basis of LSTM can not only make the model learn the temporal features of images and matrix data, but also spatial features. The ConvLSTM model uses the convolution operation instead of the multiplication operation when performing the LSTM unit gate operation, as shown in Formulas (1)–(5), where “*” and “∘” represent the convolution operation and the Hadamard product operation, respectively [20].
i t = σ W x i X t + W h i H t 1 + W c i C t 1 + b i
f t = σ W x f X t + W h f H t 1 + W c f C t 1 + b f
C t = f t C t 1 + i t tanh W x c X t + W h c H t 1 + b c
o t = σ W x o X t + W h o H t 1 + W c o C t + b o
H t = o t tanh C t

2.1.2. Spatial Attention

Sanghyun Woo et al. proposed Spatial Attention, which calculates which part has important information through the spatial information of inner features [21]. The model can calculate the weight matrixes, which represent the important degree of features at some position, through Spatial Attention to strengthen the more important features and weaken the less important features. The calculation process of Spatial Attention is as follows [22]:
  • Firstly, F m p s R H × W × 1 and F a p s R H × W × 1 are obtained by operating maximum pooling and average pooling to input feature F R H × W × C along the channel direction, as shown in Formula (6) and (7).
    F m p s = M a x P o o l F
    F a p s = A v e r a g e P o o l F
  • Then, M s F R H × W × 1 , namely, the weight matrix, is obtained by cascading F m p s and F a p s , the convolution operation and the Sigmoid activation function operation, as shown in Formula (8),
    M s F = F σ f 7 × 7 F a p s ; F m p s
    where f 7 × 7 · means that it is the convolution operation, in which the kernel size is 7; and σ · represents the Sigmoid activation function.
  • Finally, the output features are calculated by Formula (9).
    F s = F M s F

2.1.3. Laplacian Pyramid

Laplacian Pyramid is an improvement of Gaussian Pyramid, which aims to preserve the lost high-frequency information of images in the process of convolution and the subsampling operation in Gaussian Pyramid [23]. Laplacian Pyramid consists of difference images between two adjacent layers of the Gaussian Pyramid, and the size of images in every layer is different, so the image in the next layer needs to be upsampled to be the same size as the image in the previous layer; the process of calculation is shown in Formula (10) [24],
L l = G l E X P A N D G l + 1
where l represents the number of pyramid layers ( 0 l N ); L l represents the image in the l layer of the Laplacian Pyramid; G l represents the image in the l layer of the Gaussian Pyramid; and the EXPAND function represents the image upsampling to enable the image to be the same size as the image in the previous layer, the setting L N = G N .

2.1.4. Discrete Wavelet Transform

Discrete Wavelet Transform can not only be used to deal with data series, but also image decomposition. A one-dimensional wavelet can decompose the discrete signal S = s 0 s 1 s 2 s q 1 with length q into a low-pass filtered subband L, including low-frequency features of the signal, and a high-pass filtered subband H, including high-frequency features of the signal [25]. The mathematical formula of Discrete Wavelet Transform is as shown in Formulas (11) and (12) [26],
W f j , k = + f t ψ j , k t d t
ψ j , k t = a 0 j / 2 ψ a 0 j t b 0 k
where a 0 and b 0 are constants, j is the decomposition level, and k is the time translation factor.
For a two-dimensional image, Discrete Wavelet Transform can also compress and decompose images. Firstly, a one-dimensional filter is applied to every row of the image and then every column of the image, which can achieve a low-frequency image and three high-frequency images, whose size is half of the original images, to realize decomposing images [27].

2.2. ConvLSTM Establishment and Prediction

The method of this paper firstly determines the physical variables group, which is most related to the typhoon moving angle and distance, with CCA and GRA, and then transfers the reanalysis data into reanalysis images, marking the location of the typhoon center at the previous moment on images. Spatial Attention and weighted calculation of memory cells are added into ConvLSTM in order to improve the abilities of extracting spatial features and memory ability, respectively. And, then, according to the correlation of physical variables, weighted cascaded reanalysis images are input to the improved ConvLSTM to obtain the preliminary predicted images. The predicted results of the typhoon center coordinates at the predicted moment that each physical variable corresponds to are calculated according to the relative position of the marked point and the image center and coordinates of the typhoon center at the previous moment, fitting them with a six-degree polynomial to obtain preliminary predicted results of latitude and longitude coordinates of the typhoon center at the predicted moment. The similarly historical moment is determined according to the Euclidean distance of pixel coordinates of marked points on reanalysis images at historical moments and predicted images, the color histogram similarity between predicted images and reanalysis images at historical moments, the moving angle difference and absolute value of the moving distance difference of the typhoon at historical moments and the predicted moment, and the absolute value of the latitude difference and longitude difference of typhoon centers at historical moments and the predicted moment. Predicted images and reanalysis images at the similarly historical moment are fused, extracting the pixel coordinates of marked points, and then eliminating the marked points after fusing as much as possible, remarking new marked points on fused images. Latitude and longitude coordinates of the typhoon center, which each physical variable corresponds to, are calculated according to coordinates of the new marked point, which each physical variable corresponds to, fitting them with a six-degree polynomial to obtain improved latitude and longitude coordinates of the typhoon center at the predicted moment, and fused images and the improved coordinates are as the input of next step, continuing to recursive multi-step prediction.

2.2.1. Correlation Analysis of Reanalysis Data

Typhoon tracks may be influenced by various physical factors together, so the physical variables group needs to be selected, which is most related to typhoon tracks from 11 physical factors in the ERA5 dataset by the correlation analysis method. Because there is not necessarily a direct correlation between the latitude and longitude coordinates of the typhoon tracks and the physical variables, this paper transfers latitudes and longitudes coordinates into the moving angle and distance of typhoons. The moving distance of a typhoon is the spherical distance d between coordinates of the typhoon center at the previous moment and coordinates of the typhoon center at the current moment, calculating with the Haversine Formula [28], as shown in Formula (13), where R is the radium of the Earth, whose value is 6371 km.
d = 2 sin 1 sin ( l a t 2 l a t 1 2 × π 180 ) 2 + cos ( l a t 1 × π 180 ) cos ( l a t 2 × π 180 ) sin ( l o n 2 l o n 1 2 × π 180 ) 2 × R
The calculation of the moving angle of the typhoon is that the location of the typhoon center at the previous moment is the origin, calculating the angle (0° angle < 360°) between the Northern Hemisphere longitude and the line of coordinates of the typhoon centers at two continuous moments, as shown in Figure 1.
Here, l a t d i s is the distance of typhoon centers at two continuous moments in the latitude direction, and l o n d i s is the distance of typhoon centers at two continuous moments in the longitude direction, whose calculation methods are as shown in Formulas (14) and (15), respectively:
l a t d i s = | l a t 2 l a t 1 | × 111.11
l o n d i s = cos l a t 1 π 180 × 111.11 × | l o n 2 l o n 1 |
where l a t 2 is the latitude coordinate of the typhoon center at the next moment, l a t 1 is the latitude coordinate of the typhoon center at the previous moment, l o n 2 is the longitude coordinate of the typhoon center at the next moment, l o n 1 is the longitude coordinate of the typhoon center at the previous moment.
The calculation of the moving angle of the typhoon is as shown in Formula (16):
a n g l e = 0 , l a t d i s = 0 , l o n d i s = 0 cos 1 l a t d i s d × 180 π , l a t d i s > 0 , l o n d i s > 0 90 , l a t d i s = 0 , l o n d i s > 0 cos 1 l o n d i s d × 180 π + 90 , l a t d i s < 0 , l o n d i s > 0 180 , l a t d i s < 0 , l o n d i s = 0 cos 1 l a t d i s d × 180 π + 180 , l a t d i s < 0 , l o n d i s < 0 270 , l a t d i s = 0 , l o n d i s < 0 cos 1 l o n d i s d × 180 π + 270 , l a t d i s > 0 , l o n d i s < 0
The values of physical variables at the previous moment and at the location of coordinates of the typhoon center at the next moment correspond to the moving angle and distance of typhoon centers at the next moment relative to the previous moment. The 11 physical variables are arranged and combined, with a total of 2046 combinations. The physical variables group is the independent variable of the correlation analysis, and the moving angle and distance of the typhoon are the dependent variable of the correlation analysis. Because the moving angle and distance of the typhoon are two-dimensional vectors, however, the dependent variable of the traditional correlation analysis is one-dimensional data; so, this paper first reduces the independent variables and the dependent variables to one dimension with CCA and then calculates the correlation between independent variables and dependent variables with GRA, determining the physical variables group with the highest correlation. The values of physical variables in the typhoon area of 1300 km × 1300 km, whose center is the typhoon center, are transferred into reanalysis images by Basemap as the input of the predicting model.

2.2.2. The Establishment and Optimization of ConvLSTM

ConvLSTM can extract temporal and spatial features of data, which are mainly used to predict time series images. In this paper, the reanalysis images series of physical variables are used as the input of the model, using reanalysis images at ten previous moments to predict the reanalysis images of physical variables at the next moment. In order to improve the ability of the model to extract spatial features, this paper adds Spatial Attention to the model on the basis of adding a convolutional layer. Furthermore, every reanalysis image with RGB channels is resized to 64 px × 64 px. The weight w 1 , w 2 , w 3 w n is set according to the correlation coefficient between the moving angle and distance of the typhoon and each physical variable in the physical variables group, where n is the number of physical variables in the physical variables group. The reanalysis images of physical variables are weighted cascaded to multi-channel images with weights w 1 , w 2 , w 3 w n to add the proportion of reanalysis images with higher correlation in the input images. Figure 2 shows the training process of the above improved ConvLSTM.
Furthermore, to improve the features extracting ability of the model for reanalysis images, a convolutional layer is added to each ConvLSTM unit, normalizing after every convolutional layer in order that the values of the input gate, forget gate and output gate of the gate units are not always 1. Figure 3 is the diagram of the ConvLSTM unit structure, and three ConvLSTM layers in the model this paper used consist of the above ConvLSTM units.
In the process of gate units calculation, to preserve more information in memory cells and improve the memory ability of the network, this paper adds the information of memory cells into the gate units calculation, according to the Formulas (1)–(5) in Section 2.1.1, and adds weight matrices to memory cells, as shown in Figure 4. The initial values of weight matrices are random numbers conforming to uniform distribution, ranging from [−1, 1) in order to partly activate and partly inhibit the information of memory cells and prevent the results of the multiplication of the memory cell and the weight matrixes from being too large or small to change the resulting value of the gate unit calculation. Meanwhile, the memory cells at the last two moments in every series are weighted and added in order to keep more memory information at the final predicted moment.
Additionally, this paper changes the original CE Loss (Cross Entropy Loss) to MSE Loss (Mean Squared Error Loss) in order to enable the model to be more suitable for the problem of time series prediction.
The pixel coordinates of marked points on images are obtained by transferring predicted images of each physical variable from RGB three-channel images into HSV three-channel images, and detecting contours and the fitting minimum enclosing rectangle on the V (Value) channel. If the marked points cannot be localized and recognized directly, images of the V channel will be enhanced by Histogram Equalization, detecting contours in the range of [4:60, 4:60] of the image. Corresponding latitude and longitude coordinates of the typhoon center at the predicted moment are obtained according to the pixel coordinates of marked points on the predicted images of each physical variable, as shown in Formulas (17) and (18), using a six-degree polynomial to fit the predicted latitude and longitude coordinates corresponding to predicted images of each physical variable in order to obtain the predicted values of latitude and longitude coordinates of the typhoon center at the next moment.
l a t p r e d = l a t p r e + ( y 32 ) × ( 11.8 ÷ 64 )
l o n p r e d = l o n p r e ( x 32 ) × 1300 111 × cos ( l a t p r e d × π 180 ) 64
where x , y is the coordinates of the marked point on the predicted image, l a t p r e d is the latitude coordinate of the typhoon center at the predicted moment, l o n p r e d is the longitude coordinate of the typhoon center at the predicted moment, l a t p r e is the latitude coordinate of the typhoon center at the previous moment, l o n p r e is the longitude coordinate of the typhoon center at the previous moment.

2.2.3. Fusion with Similar Images

In this paper, the historical moment that is similar to the predicted moment is determined using the moving angle and distance of typhoon centers at predicted and historical moments, the difference of latitude and the difference of longitude of typhoon centers at predicted and historical moments, the color histogram similarity between predicted images and reanalysis images at historical moments and the Euclidean distance of pixel coordinates of marked points.
There are some relations between the moving direction of the typhoon and the latitude coordinate of the typhoon center. Table 1 and Table 2 are the statistics of the relation between the value of the latitude coordinate of the typhoon at the current moment and the difference of latitude coordinates and the difference of longitude coordinates of typhoon centers at the current moment and at the previous moment in the dataset of this paper. It is determined that in the case of latitude coordinates of the typhoon center at the current moment > 15°, the number of typhoon moments with the difference of latitude coordinates of typhoon centers at the current moment and the previous moment 0° accounts for 89.56%, and in the case of latitude coordinates of the typhoon center at the current moment < 15°, the number of typhoon moments with the difference of longitude coordinates of typhoon centers at the current moment and the previous moment 0°accounts for 96.42%. Therefore, this paper first weeds out the typhoon moment that the difference of latitude coordinates of typhoon centers at the current moment and the previous moment < 0° when latitude coordinates of the typhoon center at the current moment > 15°, or the difference of longitude coordinates of typhoon centers at the current moment and the previous moment > 0° when latitude coordinates of the typhoon center at the current moment < 15.
Then, the historical moments meeting the following conditions are screened out: (1) the color histogram similarity between predicted images and reanalysis images at the historical moment >0.8; (2) the difference of the moving angle of the typhoon at the historical moment and the predicted moment < 30°; (3) the absolute difference of the moving distance of the typhoon at the historical moment and the predicted moment < 30 km; (4) the Euclidean distance of pixel coordinates of marked points on the predicted images and reanalysis images at the historical moment < 1.5 px; (5) the Euclidean distance of the difference of latitude coordinates and the difference of longitude coordinates of the predicted typhoon center and the typhoon center at the historical moment < 20°.
Historical moments are sorted according to the Euclidean distance of pixel coordinates of marked points on reanalysis images at historical moments and predicted images, the color histogram similarity between predicted images and reanalysis images at historical moments, the difference of moving angle of the typhoon at historical moments and at the predicted moment, the absolute value of the difference of the moving distance at historical moments and at the predicted moment and the absolute value of the difference of latitude coordinates and the absolute value of the difference of longitude coordinates of the typhoon center at the historical moment and the predicted typhoon center at the same time, with the difference from small to large and the similarity from large to small. The first historical moment is the similar historical moment determined.
The calculation of the moving angle is as shown in Formulas (19)–(25), where a n g l e _ p r e d is the moving angle of the typhoon center at the predicted moment, and a n g l e _ s i m i l a r is the moving angle of the typhoon center at the historical moment.
If a n g l e _ p r e d > 180 and a n g l e _ s i m i l a r < 180 , then
a n g l e _ d i f f 1 = 360 a n g l e _ p r e d + a n g l e _ s i m i l a r
a n g l e _ d i f f 2 = a b s a n g l e _ p r e d a n g l e _ s i m i l a r
a n g l e _ d i f f = m i n a n g l e _ d i f f 1 , a n g l e _ d i f f 2
Else, if a n g l e _ s i m i l a r > 180 and a n g l e _ p r e d < 180 , then
a n g l e _ d i f f 1 = 360 a n g l e _ s i m i l a r + a n g l e _ p r e d
a n g l e _ d i f f 2 = a b s a n g l e _ s i m i l a r a n g l e _ p r e d
a n g l e _ d i f f = m i n a n g l e _ d i f f 1 , a n g l e _ d i f f 2
Otherwise
a n g l e _ d i f f = a b s a n g l e _ p r e d a n g l e _ s i m i l a r
After, the reanalysis images at the similarly historical moment are fused with predicted images. The method of this paper uses Laplacian Pyramid when fusing reanalysis images at the similarly historical moment with predicted images. Laplacian Pyramid is on the basis of Gaussian Pyramid, which consists of the difference images of images in two layers of Gaussian Pyramid. But, the process establishment of Laplacian Pyramid may make images distorted and blurred. To preserve image information as much as possible, in the method of this paper, images are decomposed by Discrete Wavelet Transform before establishing Gaussian Pyramid, preserving the high-frequency images achieved by decomposition. When establishing Laplacian Pyramid to upsample images, the high-frequency images obtained by discrete wavelet decomposition are used for discrete wavelet reconstruction. Furthermore, to preserve the features of marked points on predicted images as much as possible, the pixel values are selected by using the V channel of the HSV color model, and if the number of selected pixel values is small, the V-channel image will be enhanced by Histogram Equalization, selecting pixel values again in the range of [4:60, 4:60] of images, remarking the marked point. Figure 5 is the process of establishing Laplacian Pyramid.
When fusing the difference images in each layer of Laplacian Pyramids, firstly, the gradient means are calculated that are in the neighborhood of 5 × 5 with every pixel center as the center in the image L A 0 and L B 0 , which are in the top layer (the layer where the size of images is smallest) of the Laplacian Pyramids established by reanalysis images at the similarly historical moment and predicted images, as shown in Formula (26).
G i , j = 1 5 × 5 × 3 1 3 k 5 m 5 Δ I x i , j 2 + Δ I y i , j 2 2
where Δ I x i , j is the first derivative of x direction in the neighborhood of 5 × 5, with i , j as the center in the image; Δ I y i , j is the first derivative of y direction in the neighborhood of 5 × 5, with i , j as the center in the image. Comparing the gradient means of every pixel point of two images in the top layer, the pixel values of the points in the images are selected whose gradient means are smaller, as shown in Formula (27).
L F 0 i , j = L A 0 i , j G L A i , j < G L B i , j L B 0 i , j G L A i , j G L B i , j
When fusing images in other layers of the Laplacian Pyramids, the absolute value of the sum of all pixel values in the neighborhood of 3 × 3, with the i , j as the center in images, is calculated, and pixel values of the points in the images are selected whose results are smaller, as shown in Formulas (28)–(30), where N is the layer N of the Laplacian Pyramid.
L A S N i , j = 1 3 k 3 m 3 L A N k , m
L B S N i , j = 1 3 k 3 m 3 L B N k , m
L F N i , j = L A N i , j L A S N i , j < L B S N i , j L B N i , j L A S N i , j L B S N i , j
After, fusing images in each layer of the new Laplacian Pyramid, the image contrast of images in the Laplacian Pyramid is adjusted. Upsampling the image in the previous layer and comparing the gray values of images in two adjacent layers, if the gray values of images in the previous layer are smaller than the gray values of images in the next layer, the pixel values of images in the previous layer will be taken; if the gray values of images in the previous layer are equal to the gray values of images in the next layer, the average of the pixel values of the images in two layers will be taken; otherwise, the pixel values of images in the next layer will be taken.

2.2.4. Multi-Step Prediction of Typhoon Tracks

When predicting typhoon tracks in the long term, recursive multi-step prediction is adopted, as shown in Figure 6, where t1–t10 are the truths at the first to tenth moments, and the predicted values begin from t11′. Predicting time series with the predicting model in Section 2.2.2, when predicting the coordinate location of the second and all subsequent predicted points, the improved predicted result at the previous moment is used to predict the result at the next moment. Determining the historical moment that is similar to the predicted moment, predicted images are fused with reanalysis images at the similarly historical moment by the method in Section 2.2.3. If a historical moment meeting the similar requirements cannot be determined, the reanalysis images are not used to improve the predicted results. Taking the fused images in the range of [4:60, 4:60], the pixel coordinates of the marked points of the typhoon center at the previous moment are extracted from the fused image by using the contour detection and fitting the minimum enclosing rectangle method. If the coordinates of marked points are not to be extracted directly, images will be enhanced by Contrast Limited Adaptive Histogram Equalization, setting the threshold. Pixel coordinates of marked points are extracted by setting the gray values as 0, and then detecting contours and fitting the minimum enclosing rectangle. Moreover, screening out the pixel points in fused images in which pixel values are smaller 10, if both pixel values that corresponded to the position of the predicted images with remarked points and reanalysis images at the similarly historical moment are not 0, the pixel values corresponded position of fused images will take the average; if the pixel values that corresponded to the position of reanalysis images at the similarly historical moment are 0, the pixel values corresponded position of fused images will take pixel values that corresponded to the position of predicted images with remarked points; if pixel values that corresponded to the position of the predicted images with remarked points are 0, the pixel values that corresponded to the position of fused images will take pixel values that corresponded to the position of reanalysis images at the similarly historical moment in order to reduce the influence of original marked points on continuous predicted results.
The position of the marked point on the fused image that is fused by the method in Section 2.2.3 is extracted, remarking it on the new fused image and calculating the latitude and longitude coordinates of the typhoon center corresponding to the remarked point in order to obtain the coordinates of the typhoon center at the next moment.

2.3. Datasets Establishment

2.3.1. Data of Typhoon Center Coordinates

The typhoon coordinates data used in this experiment are from the “Digital Typhoon” dataset of the Japan National Institute of Informatics. Data in this dataset include satellite images of the typhoon, latitude and longitude coordinates of the typhoon center, maximum weed speed, central pressure and so on [29]. The dataset used in this paper includes the latitude and longitude coordinates of typhoon centers of 169 typhoons that occurred in the Northwest Pacific from 2014 to 2022, with a time step of 6 h.

2.3.2. Reanalysis Data

The reanalysis dataset used in this experiment is from ERA5 hourly data on single levels from 1940 to present. Compared with the ERA-Interim database, which has also been widely used before, ERA5 is currently promoted and gradually replaces the ERA-Interim database, and its spatial resolution and temporal resolution are higher and updated more frequently [30]. The dataset of this paper uses reanalysis data from 11 commonly used variables in the Northwest Pacific from 2014 to 2022, which are 10 m u-component of wind, 10 m v-component of wind, 2 m dewpoint temperature, 2 m temperature, Mean sea level pressure, Mean wave direction, Mean wave period, Sea surface temperature, Significant height of combined wind waves and swell, Surface pressure and Total precipitation. The time step of data is 6 h, and the spatial resolution is 0.125° × 0.125°.

2.3.3. Data Processing

Because the data in the dataset will be partially missing, and if the typhoon sequence is too short, it cannot be predicted. Therefore, when the data are initially processed, these data missing and too short typhoon sequences are deleted, avoiding the impact of too short typhoon sequences on the accuracy of subsequent correlation analysis and other results.
In addition, the latitude and longitude coordinates of typhoon centers in the experimental dataset are accurate to 0.1°, and the spatial resolution of the reanalysis data is 0.125° × 0.125°. In order to make their spatial resolution the same, this paper performs linear interpolation on the reanalysis data during data preprocessing to make reanalysis data accurate to one decimal point. In order to transfer the reanalysis data into reanalysis images, this paper takes typhoon centers as the center points of the images, and intercepts the reanalysis data of each physical variable in the corresponding latitude and longitude range with the length and width of 1300 km.
After data processing, the size of the dataset in this paper includes a total of 136 typhoon processes in the training set of the ConvLSTM model, including 2685 typhoon sequences and 16,176 typhoon images, where each sequence includes 11 typhoon points, and the 11th moment is the true value; 34 typhoon processes in the single-step prediction test set, including 672 typhoon sequences and 4048 typhoon images; 34 typhoon processes in the multi-step prediction test set, including 1012 typhoon moments and 4048 typhoon images; and 135 typhoon processes in the dataset used to determine the similarly historical moment, including 3894 typhoon moments and 15,576 typhoon images.

3. Results

3.1. Experimental Environment

The experiment of this paper was conducted in the environment as shown in Table 3.
Furthermore, parameters of ConvLSTM adopted in this paper, which is designed and improved according to Section 2.2.2, were set as shown in Table 4.
Compared with the high cost and large calculation of numerical prediction methods, for example, the numerical model of South Korean that needs to run on a Cray XC40 supercomputer with 139,329 CPUs [9], the costs of equipment and the calculating complexity of our method are lower. In addition, the average predicted time of predicting typhoon tracks in 12 h, 18 h, 24 h and 48 h with our method was 12.63 s, 21.11 s, 28.96 s and 60.47 s, respectively, which was much faster than numerical prediction methods.

3.2. Model Evaluation Index

The MAE and RMSE are calculated by calculating the distance between the predicted latitude and longitude coordinates of the typhoon center and truth to evaluate the effect of the mode. Distance, namely, the absolute error, is calculated by the Haversine formula, dividing the total number of test series to obtain the MAE, and the RMSE is also calculated on the basis of the absolute error, as shown in Formulas (31)–(33).
E = 2 R sin 1 sin ( l a t r e a l l a t p r e d 2 × π 180 ) 2 + cos ( l a t p r e d × π 180 ) cos ( l a t r e a l × π 180 ) sin ( l o n r e a l l o n p r e d 2 × π 180 ) 2
M A E = 1 n i = 1 n E i
R M S E = 1 n i = 1 n E i 2

3.3. Experimental Results

This paper obtained that the physical variables group with the highest correlation with the typhoon moving angle and distance was the Mean wave direction, Mean wave period, Significant height of combined wind waves and swell and 10 m v-component of wind, according to the method of correlation analysis between reanalysis data and the typhoon moving angle and distance in Section 2.2.1 and the dataset of this paper. The reanalysis data of the physical variables group were transferred into reanalysis images with marked points, as shown in Figure 7.
Reanalysis images were weighted cascaded according to the correlation between four physical variables in the above physical variables group and the typhoon moving angle and distance, and input to ConvLSTM. The values of the correlation and weight are as shown in Table 5.
Moreover, this paper trained the model and predicted with a single step by changing the weights of memory cells at the last two moments in each series, achieving the error results as shown in Figure 8. The weight group achieving the smallest error was that where the weight of memory cells at the last two moments were 0.5 separately by comparing the predicted errors with different weights.
Through the improvement of the weighted calculation of the memory cells in ConvLSTM and the improvement of the detection and recognition algorithm of marked points, the multi-step prediction results have been greatly improved. Additionally, fusing reanalysis images at the historical moment that is similar to the predicted moment with predicted images can also reduce the accumulated error. Table 6 is the comparison of multi-step prediction results in 12 h of different models and methods in the improvement process of the method in this paper, where Model 1 is the model that uses ConvLSTM with weighted cascading reanalysis images and Spatial Attention and enhances predicted images with Histogram Equalization and recognizes the marked point by the method of contour detection and the fitting minimum enclosing rectangle; Model 2 is the model that adds weighted calculation of memory cells to ConvLSTM and enhances V-channel images of predicted images with Histogram Equalization and recognizes the marked point by the method of contour detection and the fitting minimum enclosing rectangle, on the basis of Model 1; Model 3 is the final method proposed in this paper that fuses reanalysis images at the similarly historical moment and predicted images to calculate the new predicted results in order to reduce the influence of the accumulated error on the predicted accuracy.
Moreover, predicted images obtained by predicting with recursive multi-step of the method in this paper were clear and close to the real picture shape. Shown in Figure 9 is the comparison of predicted images and real images at two steps in 12 h prediction of Typhoon IN-FA (202106) (at 18 o’clock on 22 July 2021 and at 0 o’clock on 23 July 2021) and Typhoon RAI (202122) (at 6 o’clock on 19 December 2021 and at 12 o’clock on 19 December 2021); at the pixel-level fusion of the predicted images and the reanalysis data images at the historical moment, fused images will have some color distortion problems.
The spherical distance between the predicted coordinates and the real coordinates of the typhoon center was also small. Figure 10 is the diagram of comparison between predicted tracks and real tracks in 12 h, 18 h, 24 h and 48 h of Typhoon CEMPAKA (202107), which occurred from 18 o’clock on 18 July 2021 to 0 o’clock on 25 July 2021. Figure 11 is the diagram of comparison between predicted tracks and real tracks in 12 h, 18 h, 24 h and 48 h of Typhoon KOMPASU (202118), which occurred from 3 o’clock on 8 October 2021 to 9 o’clock on 14 October 2021. In the two diagrams, the blue series is real tracks from the first moment to the tenth moment, the yellow series is real tracks at predicted moments and the red series is predicted tracks, and it can be seen that the gaps between the predicted paths and the real paths are small. The predicted errors of Typhoon CEMPAKA (202107) in 12 h, 18 h, 24 h and 48 h were 53.61 km, 94.4 km, 136.26 km and 355.85 km, respectively. And, the predicted errors of Typhoon KOMPASU (202118) in 12 h, 18 h, 24 h and 48 h were 85.41 km, 125.57 km, 157.95 km and 358.57 km, respectively.

3.4. Comparison with Results of Other Methods

In Table 7, the predicted errors of this paper are compared with those of other methods. It is determined that the multi-step prediction errors of this method are smaller.

4. Discussion

The results of this paper proved that the method of this paper could reduce the accumulated error of recursive multi-step prediction. However, if predicting with many steps, the error of multi-step prediction will still be large, such as predicting 48 h (8 steps). In the future, we will calculate the angles and the distances between the marked point and the center point on predicted images and real images separately in the training process and set the threshold of the difference of the angles and distances. If the difference values are over the range of the threshold, the value of loss will be increased and feedbacked to the network in order to improve the predicted accuracy of the model, and then will reduce the accumulated error of the recursive multi-step prediction. However, the ERA5 reanalysis data that we used have a latency of about 5 days. So, to predict typhoon tracks in real time, we can use real-time forecast date of ensemble products of ECMWF on the basis of our previous model. It is an open-data dataset with 0.4 degrees resolution and 6 h time steps, and contains some same physical variables with the reanalysis data. And, the historical data are not published. Although the real-time forecast data of more than the recent 3 days are disseminated with a latency of about 8 h, the real-time property of our method is better than the numerical prediction methods. Because, to predict the location of the typhoon center at the same moment, we do not need to predict typhoon tracks in the very long-term, but the numerical prediction methods need to predict in 5 days, and their accuracy is lower than the results of our method to predict in 12 h, 18 h and 24 h, as shown in Section 3.4. And, the average predicted time of our method is less.

5. Conclusions

This paper proposes the method that determines the historical moment that is similar to the predicted moment by calculating the difference of the moving angle of the typhoon and the absolute value of the difference of the moving distance of the typhoon at the predicted moment and the historical moment, the color histogram similarity between predicted images and reanalysis images at the historical moment and so on, and fuses predicted images and reanalysis images at the historical moment to obtain the fused images with remarked points, in order to reduce the accumulated error caused by multi-step prediction. Furthermore, the weighted calculation of memory cells and Spatial Attention are added into ConvLSTM to improve the ability of extracting spatial features and the memory ability of ConvLSTM. Meanwhile, reanalysis images are weighted cascaded and input to ConvLSTM, according to the correlation between reanalysis data of physical variables and the moving angle and distance of the typhoon in order to improve the proportion of reanalysis images with a high correlation in the input images to improve the accuracy of ConvLSTM. This paper selects the physical variables group most related to the typhoon moving angle and distance by CCA and GRA, forming reanalysis images with marked points. Weighted cascading the reanalysis images of physical variables according to correlation, time series images at ten moments are input to ConvLSTM to obtain predicted images corresponding to each physical variable, in order to calculate predicted coordinates of typhoon centers corresponding to each physical variable, and to achieve the final latitude and longitude coordinates of the typhoon center by fitting a six-degree polynomial. After, the historical moment that is similar to the predicted moment is determined according to the Euclidean distance of pixel coordinates of marked points on reanalysis images at historical moments and predicted images, the color histogram similarity between predicted images and reanalysis images at historical moments, the difference of the moving angle of the typhoon at the historical and predicted moments, the absolute value of the difference of the moving distance of the typhoon at historical and predicted moments and the Euclidean distance of the latitude difference and the longitude difference of typhoon centers at historical and predicted moments. The adjustment of predicted images is realized by fusing reanalysis images at the similarly historical moment and predicted images through Discrete Wavelet Transform and Laplacian Pyramid and remarking the marked points. At the same time, the latitude and longitude coordinates of the typhoon center corresponding to each physical variable are calculated according to the pixel coordinates of remarked points, and the final predicted latitude and longitude coordinates of the typhoon center are obtained by fitting a six-degree polynomial. Finally, using the recursive multi-step prediction, the fused images with remarked points are added to the image series of next step prediction, and the multi-step long-term prediction of typhoon tracks is realized by using the latitude and longitude coordinates of the typhoon center predicted at the previous step. The MAE of predicted results in 12 h, 18 h, 24 h and 48 h prediction obtained by experiment improved 1.65 km, 5.93 km, 4.6 km and 13.09 km, respectively, compared with the predicted results of Model 2 in Section 3.3, which proved that the method in this paper could improve the problem of the accumulated error of multi-step prediction.

Author Contributions

Data curation, Y.Y.; Methodology, M.X.; Project administration, P.L.; Writing—original draft, M.X.; Writing—review and editing, Z.W. and Z.Z.; Project administration, M.C.; Funding acquisition, M.C. All authors have read and agreed to the published version of the manuscript.

Funding

This research was funded by the Shanghai Science and Technology Innovation Plan Project, grant number 20dz1203800, and the Capacity Development for Local College Project, grant number 19050502100.

Data Availability Statement

Not applicable.

Conflicts of Interest

The authors declare no conflict of interest.

References

  1. Yuan, S.J.; Wang, C.; Mu, B.; Zhou, F.F.; Duan, W.S. Typhoon Intensity Forecasting Based on LSTM Using the Rolling Forecast Method. Algorithms 2021, 14, 83. [Google Scholar] [CrossRef]
  2. Heidarzadeh, M.; Iwamoto, T.; Takagawa, T.; Takagi, H. Field surveys and numerical modeling of the August 2016 Typhoon Lionrock along the northeastern coast of Japan: The first typhoon making landfall in Tohoku region. Nat. Hazards 2021, 105, 1–19. [Google Scholar] [CrossRef]
  3. Eadie, P. Typhoon Yolanda and post-disaster resilience: Problems and challenges. Asia Pac. Viewp. 2019, 60, 94–107. [Google Scholar] [CrossRef]
  4. Shimozono, T.; Tajima, Y.; Kumagai, K.; Arikawa, T.; Oda, Y.; Shigihara, Y.; Mori, N.; Suzuki, T. Coastal impacts of super typhoon Hagibis on Greater Tokyo and Shizuoka areas, Japan. Coast. Eng. J. 2020, 62, 129–145. [Google Scholar] [CrossRef]
  5. Hon, K. Tropical cyclone track prediction using a large-area WRF model at the Hong Kong Observatory. Trop. Cyclone Res. Rev. 2020, 9, 67–74. [Google Scholar] [CrossRef]
  6. Lian, J.; Dong, P.P.; Zhang, Y.P.; Pan, J.G. A Novel Deep Learning Approach for Tropical Cyclone Track Prediction Based on Auto-Encoder and Gated Recurrent Unit Networks. Appl. Sci. 2020, 10, 3965. [Google Scholar] [CrossRef]
  7. Tong, B.; Wang, X.; Fu, J.Y.; Chan, P.; He, Y. Short-term prediction of the intensity and track of tropical cyclone via ConvLSTM model. J. Wind Eng. Ind. Aerodyn. 2022, 226, 105026. [Google Scholar] [CrossRef]
  8. Yasunaga, K.; Miyajima, T.; Yamaguchi, M. Relationships between Tropical Cyclone Motion and Surrounding Flow with Reference to Longest Radius and Maximum Sustained Wind. Sola 2016, 12, 277–281. [Google Scholar] [CrossRef]
  9. Ruttgers, M.; Lee, S.; Jeon, S.; You, D. Prediction of a typhoon track using a generative adversarial network and satellite images. Sci. Rep. 2019, 9, 6057. [Google Scholar] [CrossRef]
  10. Mei, X.G.; Pan, e.; Ma, Y.; Dai, X.B.; Huang, J.; Fan, F.; Du, Q.D.; Zheng, H.; Ma, J.Y. Spectral–Spatial Attention Network for Hyperspectral Image Classification. Remote Sens. 2019, 11, 963. [Google Scholar] [CrossRef]
  11. Chandra, R.; Goyal, S.; Gupta, R. Evaluation of Deep Learning Models for Multi-Step Ahead Time Series Prediction. IEEE Access 2021, 9, 83105–83123. [Google Scholar] [CrossRef]
  12. Chang, C.Y.; Lu, C.W.; Wang, C.A.J. A Multi-Step-Ahead Markov Conditional Forward Model with Cube Perturbations for Extreme Weather Forecasting. In Proceedings of the 35th AAAI Conference on Artificial Intelligence, Online, 2–9 February 2021. [Google Scholar]
  13. Deo, R.; Chandra, R. Multi-Step-Ahead Cyclone Intensity Prediction with Bayesian Neural Networks. In Proceedings of the 16th Pacific Rim International Conference on Artificial Intelligence (PRICAI), Cuvu, Fiji, 26–30 August 2019. [Google Scholar]
  14. Bing, Q.C.; Shen, F.X.; Chen, X.F.; Zhang, W.J.; Hu, Y.R.; Qu, D.Y. A Hybrid Short-Term Traffic Flow Multistep Prediction Method Based on Variational Mode Decomposition and Long Short-Term Memory Model. Discret. Dyn. Nat. Soc. 2021, 2021, 4097149. [Google Scholar] [CrossRef]
  15. Du, Z.H.; Qin, M.J.; Zhang, F.; Liu, R.Y. Multistep-ahead forecasting of chlorophyll a using a wavelet nonlinear autoregressive network. Knowl.-Based Syst. 2018, 160, 61–70. [Google Scholar] [CrossRef]
  16. Zhao, F.; Gao, Y.T.; Li, X.N.; An, Z.Y.; Ge, S.Y.; Zhang, C.M. A similarity measurement for time series and its application to the stock market. Expert Syst. Appl. 2021, 182, 115217. [Google Scholar] [CrossRef]
  17. Mao, R.; Fu, X.S.; Niu, P.J.; Wang, H.Q.; Pan, J.; Li, S.S.; Liu, L. Multi-directional Laplacian Pyramid Image Fusion Algorithm. In Proceedings of the 3rd International Conference on Mechanical, Control and Computer Engineering (ICMCCE), Huhhot, China, 14–16 September 2018. [Google Scholar]
  18. Sharma, A.; Gupta, H.; Sharma, Y. Image Fusion with Deep Leaning using Wavelet Transformation. J. Emerg. Technol. Innov. Res. 2021, 8, 2826–2834. [Google Scholar]
  19. Shi, X.J.; Chen, Z.R.; Wang, H.; Yeung, D.Y.; Wong, W.K.; Woo, W.C. Convolutional LSTM Network: A Machine Learning Approach for Precipitation Nowcasting. In Proceedings of the 29th Annual Conference on Neural Information Processing Systems (NIPS), Montreal, QB, Canada, 7–12 December 2015. [Google Scholar]
  20. Moishin, M.; Deo, R.C.; Prasad, R.; Raj, N.; Abdulla, S. Designing Deep-Based Learning Flood Forecast Model With ConvLSTM Hybrid Algorithm. IEEE Access 2021, 9, 50982–50993. [Google Scholar] [CrossRef]
  21. Woo, S.H.; Park, J.; Lee, J.Y.; Kweon, I.S. CBAM: Convolutional Block Attention Module. In Proceedings of the 15th European Conference on Computer Vision (ECCV), Munich, Germany, 8–14 September 2018. [Google Scholar]
  22. Guo, C.L.; Szemenyei, M.; Fan, C.Q. SA-UNet: Spatial Attention U-Net for Retinal Vessel Segmentation. In Proceedings of the 25th International Conference on Pattern Recognition (ICPR), Online, 10–15 January 2021. [Google Scholar]
  23. Liu, F.Q.; Chen, L.H.; Lu, L.; Ahmad, A.; Jeon, G.; Yang, X.M. Medical image fusion method by using Laplacian pyramid and convolutional sparse representation. Concurr. Comput.-Pract. Exp. 2020, 32, e5632. [Google Scholar] [CrossRef]
  24. Wang, J.; Ke, C.; Wu, M.H.; Liu, M.; Zeng, C.Y. Infrared and visible image fusion based on Laplacian pyramid and generative adversarial network. KSII Trans. Internet Inf. Syst. 2021, 15, 1761–1777. [Google Scholar]
  25. Starosolski, R. Hybrid Adaptive Lossless Image Compression Based on Discrete Wavelet Transform. Entropy 2020, 22, 751. [Google Scholar] [CrossRef]
  26. Kambalimath, S.S.; Deka, P.C. Performance enhancement of SVM model using discrete wavelet transform for daily streamflow forecasting. Environ. Earth Sci. 2021, 80, 101. [Google Scholar] [CrossRef]
  27. Kanagaraj, H.; Muneeswaran, V. Image Compression Using HAAR Discrete Wavelet Transform. In Proceedings of the 5th International Conference on Devices, Circuits and Systems (ICDCS), Coimbatore, India, 5–6 March 2020. [Google Scholar]
  28. Mahmoud, H.; Akkari, N. Shortest Path Calculation: A Comparative Study for Location-Based Recommender System. In Proceedings of the World Symposium on Computer Applications and Research (WSCAR), Cairo, Egypt, 12–14 March 2016. [Google Scholar]
  29. Kitamoto, A. “Digital Typhoon” Typhoon Analysis Based on Artificial Intelligence Approach; Technical Report of Information Processing Society of Japan (IPSJ); CVIM123-8; Processing Society of Japan (IPSJ): Tokyo, Japan, 2000; pp. 59–66. [Google Scholar]
  30. Hersbach, H.; Bell, B.; Berrisford, P.; Hirahara, S.; Horányi, A.; Muñoz-Sabater, J.; Nicolas, J.; Peubey, C.; Radu, R.; Schepers, D.; et al. The ERA5 global reanalysis. Q. J. R. Meteorol. Soc. 2020, 146, 1999–2049. [Google Scholar] [CrossRef]
Figure 1. Typhoon moving angle diagram.
Axioms 12 00874 g001
Figure 2. The training process of improved ConvLSTM.
Axioms 12 00874 g002
Figure 3. ConvLSTM unit structure.
Axioms 12 00874 g003
Figure 4. The diagram of adding weight matrixes to memory cells in gate unit calculation.
Axioms 12 00874 g004
Figure 5. The process of establishing Laplacian Pyramid.
Axioms 12 00874 g005
Figure 6. The diagram of multi-step prediction.
Axioms 12 00874 g006
Figure 7. Reanalysis images of physical variables group with marked points (a) Mean wave direction (b) Mean wave period (c) Significant height of combined wind waves and swell (d) 10 m v-component of wind.
Axioms 12 00874 g007
Figure 8. The values of weights of memory cells at last two moments in each series (a) and the results diagram of single-step prediction (b).
Axioms 12 00874 g008
Figure 9. The comparison of predicted images and real images at two steps in 12 h prediction of Typhoon IN-FA (202106) (at 18 o’clock on 22 July 2021 and at 0 o’clock on 23 July 2021) ((a) Predicted images at first step; (c) Real images at first step; (b) Predicted images at second step; (d) Real images at second step) and Typhoon RAI (202122) (at 6 o’clock on 19 December 2021 and at 12 o’clock on 19 December 2021) ((e) Predicted images at first step; (g) Real images at first step; (f) Predicted images at second step; (h) Real images at second step).
Axioms 12 00874 g009
Figure 10. The diagram of comparisons between predicted tracks and real tracks in 12 h (a), 18 h (b), 24 h (c) and 48 h (d) of typhoon CEMPAKA (202107).
Axioms 12 00874 g010
Figure 11. The diagram of comparisons between predicted tracks and real tracks in 12 h (a), 18 h (b), 24 h (c) and 48 h (d) of typhoon KOMPASU (202118).
Axioms 12 00874 g011
Table 1. The statistics of the relation between the value of the latitude coordinate of the typhoon at the current moment and the difference of latitude coordinates of typhoon centers at the current moment and at the previous moment in the dataset.
The Difference of Latitude Coordinates of Typhoon Centers at Current and Previous Moments ≥0°The Difference of Latitude Coordinates of Typhoon Centers at Current and Previous Moments <0°Total Typhoon Moments
Latitude coordinates of the typhoon center at the current moment < 15°706 187893
Latitude coordinates of the typhoon center at the current moment > 15°35594153974
Latitude coordinates of the typhoon center at the current moment = 15°7411
Total typhoon moments42726064878
Table 2. The statistics of the relation between the value of the latitude coordinate of the typhoon at the current moment and the difference of longitude coordinates of typhoon centers at the current moment and at the previous moment in the dataset.
The Difference of Longitude Coordinates of Typhoon Centers at Current and Previous Moments >0°The Difference of Longitude Coordinates of Typhoon Centers at Current and Previous Moments ≤0°Total Typhoon Moments
Latitude coordinates of the typhoon center at the current moment < 15°32861893
Latitude coordinates of the typhoon center at the current moment > 15°171322613974
Latitude coordinates of the typhoon center at the current moment = 15°01111
Total typhoon moments174531334878
Table 3. Experimental environment.
Parameters and the Name of Equipment Version
GPUNVIDIA GeForce RTX 3060
epoch50
batch_size10
learning rate0.001
Table 4. Parameters of the model.
ParametersValues
Input dimension(batch_size, 12, 64, 64)
Kernel sizes(3 × 3)
Number of Gate units nodes12
Number of layers3
Table 5. The correlation between physical variables and typhoon moving angle and distance and their weights.
Physical VariablesThe Correlation with Typhoon Moving Angle and DistanceWeights
Mean wave direction0.68276366356680610.45
Mean wave period0.67097041030734490.15
Significant height of combined wind waves and swell0.66508770225711180.1
10 m v-component of wind0.67749759575167510.3
Table 6. The comparison of multi-step prediction results in 12 h of different models and methods in the improvement process of the method in this paper.
MethodsMAERMSE
Model1131.88186.59
Model2103.79130.80
Model3102.14127.77
Table 7. Comparison with results of other methods.
ModelsPredicted TimeMAE (km)RMSE (km)
Proposed method in this paper12 h102.14127.77
18 h168.17209.19
24 h243.73300.67
48 h574.62694.99
LSTM12 h245.78358.56
18 h318.02433.79
24 h488.36678.79
48 h1128.141555.05
GRU12 h358.38511.23
18 h330.41450.35
24 h376.63759.32
48 h575.67704.55
Model 2 in Section 3.312 h103.79130.80
18 h174.10225.32
24 h248.33314.62
48 h587.71705.22
Disclaimer/Publisher’s Note: The statements, opinions and data contained in all publications are solely those of the individual author(s) and contributor(s) and not of MDPI and/or the editor(s). MDPI and/or the editor(s) disclaim responsibility for any injury to people or property resulting from any ideas, methods, instructions or products referred to in the content.

