

Join Operation for Semantic Data Enrichment of Asynchronous Time Series Data


1
Department of Mathematics, Barcelona School of Building Construction, Universitat Politècnica de Catalunya-BarcelonaTECH, 08028 Barcelona, Spain
2
Department of Computer Science, Multimedia and Telecommunication, Universitat Oberta de Catalunya, 08018 Barcelona, Spain
*
Author to whom correspondence should be addressed.
Axioms 2023, 12(4), 349; https://doi.org/10.3390/axioms12040349
Submission received: 27 February 2023
/
Revised: 26 March 2023
/
Accepted: 29 March 2023
/
Published: 1 April 2023
(This article belongs to the Special Issue Application of Machine Learning and Optimization Methods in Engineering Mathematics)
Abstract
:In this paper, we present a novel framework for enriching time series data in smart cities by supplementing it with information from external sources via semantic data enrichment. Our methodology effectively merges multiple data sources into a uniform time series, while addressing difficulties such as data quality, contextual information, and time lapses. We demonstrate the efficacy of our method through a case study in Barcelona, which permitted the use of advanced analysis methods such as windowed cross-correlation and peak picking. The resulting time series data can be used to determine traffic patterns and has potential uses in other smart city sectors, such as air quality, energy efficiency, and public safety. Interactive dashboards enable stakeholders to visualize and summarize key insights and patterns.
Keywords:
join operation; data standardization; spatial data distribution; lagged cross-correlations; time series data; semantic data enrichment; Open Data Barcelona; Smart CityMSC:
62H11; 62M30; 62M10; 37M10; 68P05; 68P201. Introduction
In today’s data-driven world, the amount of data generated and collected is increasing at an exponential rate, making it difficult to make sense of it and extract valuable insights from large amounts of data. Since raw data cannot provide an accurate representation of the underlying information and its relationships to other data points, adding context and meaning to data is becoming increasingly important, because it helps to improve the accuracy and value of data analysis [1]. Enriching data with semantic information aids in the clarification of relationships between data points, the identification of patterns, and the extraction of insights that would, otherwise, be missed. In other words, semantic enrichment is the process of enhancing raw data with semantic annotations or metadata to make it more meaningful, machine-readable, and usable. Semantic enrichment aims to convert unstructured, or poorly structured, data into structured, semantically rich, data that humans and computers can easily understand, and process, leading to improved results in tasks, such as information retrieval, text classification, and sentiment analysis [2,3].
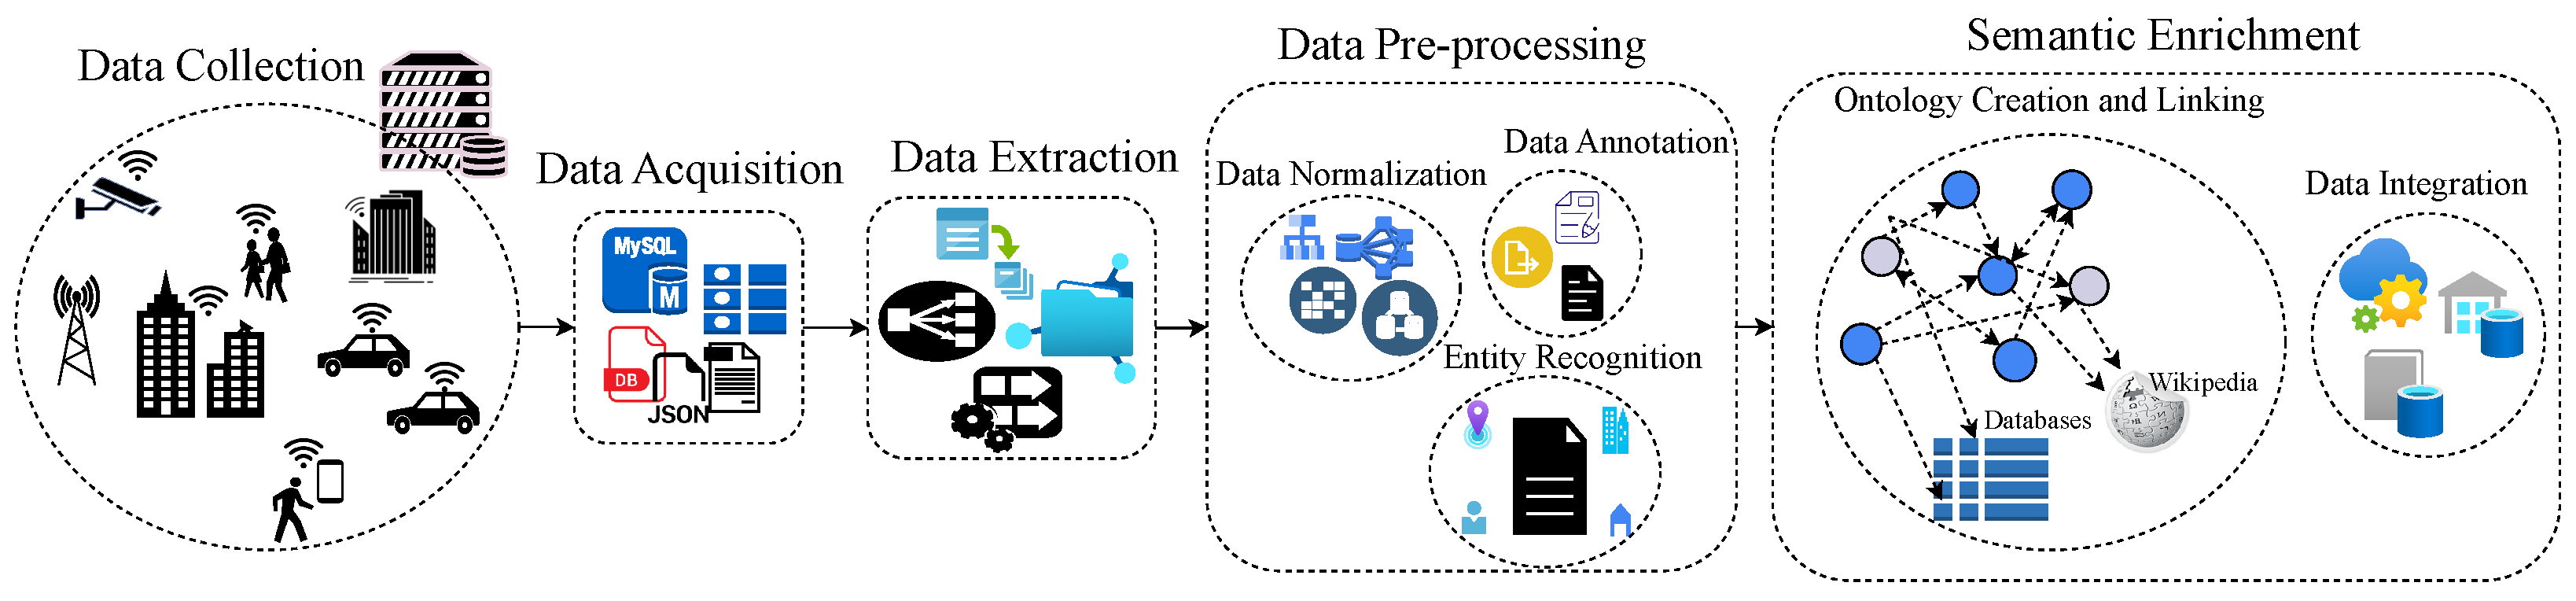
Figure 1 illustrates the comprehensive process of semantic data enrichment, which begins with the collection of raw data from various sources. Following that, the raw data must be acquired by accessing and importing it into a suitable data management system. After that, the pertinent data is extracted from the acquired dataset, utilizing an array of techniques, such as data mining, text analysis, etc. Following data extraction, the data preprocessing phase begins, which involves cleaning and normalizing the data, resulting in the organization of the extracted data into a standardized and consistent format. This standardization makes data comparison and analysis more straightforward. The normalized data is then supplemented with metadata or labels to provide additional information about the data type, structure, and semantics.
Subsequently, ontology languages are used to create a formal representation of the domain-specific concepts and relationships found in the enriched data. To provide a more comprehensive understanding of the data, the enriched data is linked with other relevant datasets, either within the same system or from external sources. The final step is to integrate the enriched data with existing data systems and applications, making it more accessible and useful to end-users.
Improving interoperability is another significant advantage of semantic data enrichment. When different systems and applications share a common understanding of the data being used, they can work more effectively together. This can result in better data exchange and more efficient data use, reducing the need for manual data entry and the risk of errors. For instance, Bouaicha and Ghemmaz [4] proposes a method for integrating and harmonizing data from various IoT sources in order to facilitate the exchange and processing of meteorological data. The approach makes use of semantic technologies to provide a common understanding of the data and to solve any semantic inconsistencies that may exist between various IoT sources. The authors conducted tests to determine the efficacy of the proposed solution and reported positive results. Additionally, semantic data enrichment can lead to increased data reuse. Organizations can reuse data more effectively by improving data quality and understanding. Bassier et al. [5] describes a process for transforming existing building geometry data into linked data, which is a form of semantic enrichment. The linked data contains additional information about the geometry of the building, making it more meaningful and usable for a variety of applications. The authors increase the value and reuse potential of the building geometry data by converting it to linked data. Furthermore, semantic data enrichment can be used in a variety of industries (i.e., healthcare, finance, logistics, manufacturing, telecommunications, government, etc.), to improve performance by providing a better understanding of data and the relationships between data points [6].
However, despite its numerous advantages, implementing semantic data enrichment is not without difficulties. Data quality, scalability, and security are three major challenges. To provide a clear understanding of the data, semantic annotations must be accurate, complete, and consistent. The process of identifying, extracting, and validating semantic annotations is time-consuming and resource-intensive, making improved data quality a difficult task. Another challenge is scalability, because, as the amount of data generated and collected grows, the ability to process and enrich large amounts of data in real-time becomes increasingly difficult. Even though sensitive information may be included in the enriched data, security is a challenge. Maintaining trust in data requires a delicate balance in ensuring the privacy and security of sensitive data while still allowing its use for analysis. Furthermore, smart cities can improve their data collection, management, and analysis by leveraging this technology. This data can then be used to improve the quality of life for citizens, increase efficiency and sustainability, and improve the overall functioning of the city. Semantic data enrichment is, thus, a critical component of the smart city ecosystem, serving as a foundation for advanced applications, such as traffic management, environmental monitoring, public safety, and many others [7,8].
Motivation and Context: Barcelona Smart City Research Project
With the rise of urbanization around the world, and the increasing demand for sustainable and efficient city transport and mobility operations, it has become essential for cities to develop projects that take into account new available technologies and possibilities opening up in the global market, such as services on-demand and online accessible products. Furthermore, zero-emission vehicles are increasingly common in cities (e.g.,: electric vehicles, unmanned aerial vehicles, autonomous vehicles, etc.) and new sensibilities from public institutions for sustainable, transparent, and effective development have created an urge from these entities to rethink and redevelop how public transportation, and its interaction with its users, is established.
Having all these needs as end goals, Barcelona City Council –Ajuntament de Barcelona– has been developing different initiatives that aim to meet the new needs that Barcelona’s citizens have inquired about over the past years. One of them is the Open Data Barcelona initiative [9], a project that started in 2010, and which fosters a “pluralistic digital economy” and develops a “new model of urban innovation based on the transformation and digital innovation of the public sector and the implication among companies, administrations, the academic world, organizations, communities, and people, with a clear public and citizen leadership”. The Open Data Barcelona service is transversal to several of the pillars of the city’s planning strategy, giving citizens access to all data available from the main administrative departments of the city council.
Another initiative taken by the city council is the Optimizing Carsharing and Ridesharing Mobility in Smart Sustainable Cities project within the Barcelona Science Plan 2020–2023 [10], which analyzes the possible impact that carsharing and ridesharing strategies can have in the Greater Barcelona Metropolitan area, together with intelligent systems that redistribute the available resources for optimal and sustainable performance, using mainly Open Data Barcelona assets for its development. These new strategies can directly impact the cost reduction of carsharing and ridesharing operations, an aspect that would have, indirectly, an impact on the final cost for citizens of many products and services. Moreover, its final aim is to promote universal user-friendly access to cost-effective transport and mobility options without compromising safety and security. Thus, these new strategies could reduce direct and indirect costs. In addition, these concepts and solutions facilitate new carsharing and ridesharing business models that contribute to more sustainable transport and mobility practices.
This project presents research findings that use different data sources, such as empirical time-series data and various algorithms, predictive models, and simulations, to simulate traffic flows in a city. However, these data sources may have heterogeneity in their definitions and structures, which can limit their interoperability and usefulness. To address this issue, this paper proposes a common framework that homogenizes and merges all available data sources into a single, semantically enriched database. The resulting database can be used to support real-time decision-making in city transport and mobility operations for carsharing and ridesharing. This paper introduces a new framework for enriching time series data quality in smart city applications. The framework supplements time series data with external data sources using semantic data processing techniques to improve data quality and provide contextual information. This paper also demonstrates the effectiveness of the proposed framework by using traffic density data from Open Data Barcelona in a case study in the context of Barcelona’s smart city.
The primary objective of this article is to present and develop an application of semantic technology in order to create a data semantic model that can effectively enrich time series data, specifically within the context of a smart city. By leveraging the semantic data model developed, several notable contributions are made by this article, which are outlined in detail below.
- The first contribution is the enhancement of data quality for asynchronous time series data, which is crucial for ensuring that accurate and reliable insights can be drawn from the information.
- Secondly, the article showcases the ability to integrate and unify data that originates from various, heterogeneous sources, thus facilitating a more comprehensive understanding of the smart city ecosystem.
- Another key aspect of this work is the increased availability of data, which can be used to support a wide range of smart city applications and initiatives aimed at improving urban living conditions. By making data more accessible, the article contributes to the advancement of smart city technologies and the development of innovative solutions to address the challenges faced by urban communities.
- Lastly, the article generates a methodology for handling all sorts of smart city data, making it possible for different actors and stakeholders involved in smart city applications to effectively utilize and benefit from the insights provided. This methodology ensures that the semantic data model can be applied to a broad range of scenarios and contexts, thereby increasing its overall value and impact.
Overall, the article emphasizes the importance of semantic technology in the context of smart cities and demonstrates its potential to significantly enhance the quality, availability, and utility of time series data. By doing so, the article contributes to ongoing efforts to harness the power of data and technology to create more sustainable, efficient, and livable urban environments.
The rest of the paper is organized as follows. We discuss related work on semantic data enrichment in Section 2. Next, in Section 3, we introduce our data semantic enrichment model and its implementation. To demonstrate the effectiveness of our approach, we present a case study and computational results in Section 4. In Section 5, we summarize our main findings. Finally, in Section 6, we conclude with an outlook on future research directions.
2. Related Work
The use of semantic technologies has received a lot of attention in recent years. In the context of the Internet of Things (IoT), Honti and Abonyi [11] summarized recent advances in the application of semantic sensor technologies, and investigates the various approaches and techniques used for the semantic enrichment of sensor data, as well as the field’s challenges and future directions. The review provides a comprehensive overview of the research in this area, emphasizing the significance of semantic sensor technologies in improving interoperability and data quality in IoT systems. Xhafa et al. [12] assessed the performance of an edge computing layer for IoT stream processing, with a particular emphasis on semantic data enrichment. The findings indicated that edge computing is a promising solution to improve the efficiency and effectiveness of semantic data enrichment by lowering latency and increasing data processing reliability. The study sheds light on the potential of edge computing in supporting the growth of IoT and improving the quality of semantic data across multiple domains. Chen et al. [13] investigated the design and implementation of a data infrastructure that supports urban analytics using semantics. To provide a comprehensive view of the urban environment, the authors propose a semantic-enabled infrastructure that integrates multiple data sources. The infrastructure makes use of ontologies to represent data relationships and provide a common understanding of the data. The authors describe the infrastructure’s implementation in practice and assess its effectiveness in supporting urban analytics tasks. They demonstrated that the semantic-enabled infrastructure could effectively integrate and analyze data from multiple sources, providing valuable insights for urban decision-making. In the field of semantic models for the analysis of data from IoT sensors, Zappatore et al. [14] proposed a system that extracts relevant data from IoT sensors using semantic models and then analyzes the data to infer relationships between environmental factors and human well-being. According to the study, the use of semantic models can lead to a more accurate and efficient analysis of IoT sensor data and valuable insights into how environmental factors impact human health and well-being.
Additionally, Buchmann and Karagiannis [15] discusses a method for transforming diagrammatic conceptual models into a more semantically rich Web of Data representation. The authors presented a pattern-based approach for converting these models into a format that computers can better understand and process, allowing for easier integration and interoperability between various data sources on the web. This approach aims to improve web data interoperability and make it easier for computers to understand and process information.
To facilitate the integration of multiple data sources in smart cities, Djenouri et al. [16] proposed a method for matching different ontologies. To match ontologies and resolve semantic mismatches between them, the method employs a combination of techniques, such as semantic similarity, instance-based matching, and domain knowledge. The authors assessed the proposed method’s performance in a case study involving the integration of multiple data sources for smart city applications. Xu et al. [17] proposed a system for annotating data in the IoT ecosystem that uses both domain-specific and general ontologies, as well as a hybrid approach to semantic annotation. According to the study, using semantic annotations can improve the efficiency and accuracy of data processing in IoT ecosystems, as well as the interoperability of different IoT devices. Xue et al. [18] describe recent advances in the semantic enrichment of building and city information models. The authors investigated the various approaches and techniques used for semantic enrichment, as well as the field’s challenges and future directions. The review spanned ten years and provides an in-depth look at the research in this field. The findings showed that semantic enrichment has been widely adopted in the field of building and city information modeling, resulting in improved data interoperability, data quality, and data usability. According to the authors, semantic enrichment continues to play an important role in the development of smart cities and the built environment.
The application of semantic technologies is not limited to these sectors, as similar studies have been conducted in the field of semantic sensor technologies, wherein Amato et al. [19] proposed a semantically enriched data model for improving sensor network interoperability. The authors presented a semantic enrichment technique that combines metadata with raw data to make it more meaningful and machine-readable. The method relies on ontologies and vocabularies to represent the meaning and relationships between data elements. The authors evaluated the proposed approach’s performance in a real-world scenario and demonstrated that it can effectively improve sensor network interoperability. The study provides valuable insights into the potential of semantic enrichment for improving data quality in sensor networks and offers a promising solution for overcoming data interoperability challenges in this domain. Furthermore, Jiang et al. [20] discuss the use of neural networks to represent computer code in an hierarchical, semantically-aware manner. The authors proposed a method for improving computer code representation in order to better capture its meaning and structure. This is accomplished by incorporating semantic information into the code representation, which allows the neural network to comprehend the relationships between various parts of the code. The resulting code representation is hierarchical, allowing for the effective representation of complex code structures, and it can be used for tasks like code summarizing, completion, and search. The authors assessed their method and demonstrated that it outperformed existing methods in a variety of tasks.
Ataei Nezhad et al. [21] presented a secure IoT data aggregation method that utilizes an authentication mechanism to ensure data integrity and confidentiality. The proposed methodology uses a two-tier architecture, in which data is aggregated locally by trusted nodes before being sent to a central aggregator for processing. The authentication mechanism is built on a symmetric key encryption scheme that ensures secure communication between nodes, while also preventing unauthorized data access. The authors also conducted simulation experiments to evaluate the proposed method’s performance and compared it to other existing methods, demonstrating its effectiveness in terms of data accuracy, security, and energy efficiency. Iatrellis et al. [22] proposed a new approach to managing smart city-related competencies that makes use of cloud computing and semantic web technologies. The authors discuss the increasing complexity of smart cities necessitating a more efficient method of managing competencies across multiple domains and stakeholders. They describe a system that uses a cloud-based platform to integrate competency management, learning management, and assessment tools, all while utilizing semantic web technologies to ensure interoperability and accuracy. The system is intended to be flexible, adaptable, and scalable, and the authors believe it has the potential to revolutionize the way we manage competencies in smart city contexts.
Furthermore, Ribeiro and Braghetto [23] provides a scalable data integration architecture for smart cities, which allows for the integration of heterogeneous data from various sources. The architecture is composed of three layers: data collection, data processing, and data analysis. According to the authors, the proposed architecture can address the challenges associated with integrating and analyzing large amounts of data generated by smart city systems. The article also includes a case study that used real-world data from a smart city project to assess the performance of the proposed architecture. The study’s findings showed that the proposed architecture is effective and scalable for integrating and analyzing data from multiple sources. The authors in Tao [24] proposed a framework based on semantic ontologies for modeling, retrieval, and inference of incomplete mobile trajectory data. To represent domain knowledge and improve the accuracy of trajectory data analysis, the framework employs semantic ontology. It also uses a probabilistic model to handle missing data in trajectories and a graph-based retrieval method to search for trajectory similarity. The experimental results showed that the proposed framework is effective and efficient in dealing with incomplete trajectory data and improving trajectory retrieval accuracy.
Psyllidis et al. [25] described a platform for urban analytics and the integration of semantic data in city planning. The platform aims to facilitate collaboration among various stakeholders involved in urban planning by providing tools for collecting, analyzing, and visualizing data from various sources in an intuitive and interactive manner. The platform makes data from various domains accessible to both experts and non-experts by utilizing semantic technologies. According to the authors, this platform can help cities become more responsive to their citizens’ needs and more sustainable in the long run.
The authors in Costa and Santos [26] proposed SusCity, a big data warehousing approach for smart cities that aims to address the challenges of managing and analyzing the large and diverse data generated by smart city systems. The approach is built on a three-layer architecture that includes a data ingestion layer, a data warehousing layer, and an analytics layer. The data ingestion layer includes tools for data collection, cleansing, and transformation, whereas the data warehousing layer includes a data model and storage system optimized for big data. The analytics layer includes data analysis and visualization tools, as well as machine learning algorithms for predictive analytics.
Table 1 summarizes the various approaches of the reviewed literature, as well as the area of study and specific methods used.
Despite the extensive research conducted in this field, none of the papers discussed have addressed the issue of combining asynchronous spatial data collected from different coordinates and moments in time. This problem can arise when dealing with the geographical, physical, and logistical complexities involved in smart city monitoring. However, our paper introduces an innovative approach that incorporates information from external sources through semantic data enrichment to augment smart city time series data. Our technique effectively unifies multiple data sources into a consistent time series, addressing challenges such as data quality, context, and time gaps.
3. Data Semantic Enrichment Model and Implementation
3.1. Model
In this section, we provide a detailed description of the model used to associate an initial set of values with the closest available measurements based on geographical proximity and minimum difference in timestamps, while considering the availability of additional data. This model is designed to provide an accurate representation of the predefined conditions in different sections of a city, based on the closest measurements available. In the following section, we describe the model in detail, including the inputs, outputs, and the development of the data enrichment process.
3.1.1. Input
Let C be the set of sections of the city, and let T be the set of timestamps. For each section , let be a dataset of initial values for c at different timestamps . Let S be a set of geographic locations associated with each dataset . For each timestamp , let be a set of measurements taken at different locations at time t. Each measurement has a geographic location and a timestamp , and may be associated with additional data that is available only at .
3.1.2. Output
For each section and timestamp , find the closest measurement in to the initial values dataset , based on both geographical proximity and minimum difference on timestamps. If additional data is available for , associate it with the corresponding initial dataset value in .
3.1.3. Semantic Data Model
For each section and timestamp , we can compute the closest measurement in as follows:
- STEP 1.
- Compute the geographic distances between each location associated with and each location in :where is the geographical distance between s and .
- STEP 2.
- Find the measurement that minimizes the sum of the geographic distance and the absolute time difference with :In other words, we find the measurement m in that has the minimum sum of geographic distance with and the absolute time difference with the closest measurement in to t. The closest measurement in to t is obtained by computing the minimum time difference between all pairs of measurements in .
- STEP 3.
- If additional data is available for , associate it with the corresponding initial set value in :
In other words, if additional data is not available for , we simply associate the initial dataset value from the closest measurement in to . Otherwise, we associate both the initial set value and the additional data .
3.2. Implementation
The implementation of our proposed methodology involves the use of an algorithm that associates initial dataset values with measurements and additional data, considering both geographical proximity and the availability of additional data. The algorithm aims to find the closest measurement to each section of the city and associates it with the corresponding initial dataset value. By implementing this algorithm, we can efficiently associate traffic density values with the closest and most relevant measurements, while ensuring the accuracy and reliability of the results.
Algorithm 1 associates the initial values with measurements and additional data, as depicted on the Figure 2, by first looping through each section of the city and each dataset, and finding the closest measurement in the dataset to the section of the city based on geographical proximity and the minimum time difference between the measure and the subset . The closest measurement is identified as the one with the shortest distance to the section of the city. Once the closest measurement is identified, the algorithm checks if there is any additional data available for the measurement in the corresponding dataset. If additional data is available, the algorithm associates the traffic density value for the section of the city with the corresponding measurement and additional data.
| Algorithm 1: The methodology for associating initial geographical values in time with asynchronous measurements and additional data |
 |
Following Algorithm 1, we can estimate the complexity cost by analyzing each of the steps defined and their implications. That is:
- Initializing geographical coordinates for each initial section has a computational cost of .
- The computation of the distance between each location associated with and each location in , following the definition of the step where we have two sets of locations, requires iterating over them. This step has a time complexity of .
- Finding the measurement that minimizes the sum of geographic distances and absolute time differences involves finding minimum values across data points. This step in the worst-case complexity is .
- If additional data is available for a measurement, we need to associate it with its corresponding initial dataset value. This step incurs an extra cost if there exist additional data; otherwise, it adds no extra computational expense. The association process requires constant time which can be achieved using hash tables or similar structures.
Therefore, the overall running time can be expressed as:
where:
- n: represents the input size.
- : denotes number of sections in city C.
- : denotes number of locations within timestamp set.
- : denotes evaluation of all possible pairs from measurements at given timestamps t.
Figure 2.
Graphical representation of the flow on the Algorithm 1 for a given dataset with two different measure stations and a section s.
Figure 2.
Graphical representation of the flow on the Algorithm 1 for a given dataset with two different measure stations and a section s.

The implementation of Algorithm 1 is performed in Python using the libraries pandas and geopandas (see Code Listing A1) in Appendix A. pandas is a popular data manipulation library that provides data structures and functions to work with time-series data, as well as tools for data cleaning, exploration, and visualization. On the other hand, geopandas extends the functionality of pandas by adding support for geospatial data, which is essential for analyzing and visualizing the spatial distribution of traffic density and pollution. The main reasons behind the usage of pandas as the main library for data manipulation and structuring are the following:
- Efficient data manipulation: Pandas provides efficient data structures like DataFrame and Series, making it easy to manipulate large datasets.
- Time-series support: Pandas offers built-in functionality for handling time-series data, which is useful for analyzing temporal patterns in data.
- Data cleaning and exploration: Pandas provides tools for handling missing data, filtering, and transforming data, which are essential for preparing datasets for analysis.
- Visualization: Pandas integrates with popular visualization libraries, allowing for easy creation of plots and charts to explore data patterns.
- Geospatial data handling: Geopandas extends pandas by adding support for geospatial data types, which is crucial when working with spatial information like coordinates and geometries.
- Spatial analysis: Geopandas offers spatial operations and functions that enable the analysis of spatial relationships, distances, and intersections between geospatial objects.
- Geospatial visualization: Geopandas integrates with visualization libraries to create maps and other spatial visualizations, which help in understanding spatial patterns and distributions.
Using these libraries, we were able to preprocess and analyze the original collected data by cleaning, merging, and organizing it in a way that made it easier to work with. The data was then transformed into a format that could be used to generate maps, graphs, and other visualizations that aided in handling the data for geographical distances. The use of Python and the pandas and geopandas libraries provided the necessary tools to generate a comprehensive dataset that covered variations on data availability, while also considering asynchronous data collection and different geographical points for the measurements.
The asynchronous_join, as shown at Code Listing function A1 in Appendix A. performs an asynchronous geospatial join operation between an initial dataset and an extra dataset using the methodology described above. The function finds the station with the minimum combined distance, in terms of both geographic distance and time difference, from each location in the initial dataset, and extracts the desired measure and any additional measures from the selected station.
For this code implementation we defined the following inputs and outputs and analyzed its overall performance.
3.2.1. Inputs
The correct function of this implementation needs a set of variables with a predefined structure:
- initial_dataset: A pandas DataFrame containing the initial dataset to join. It should be structured accordingly with the following description of parameters:
- –
- Column Coordinates: Column with GeoPandas geometry objects.
- –
- Column Timestamp: Column with datetime objects representing timestamps.
- extra_dataset: A GeoDataFrame containing the extra dataset to join. It should be structured accordingly with the following description of parameters:
- –
- Column Coordinates: Column with GeoPandas geometry objects representing spaces with real coordinates
- –
- Column Timestamp: Column with datetime objects representing timestamps.
- –
- Columns for measurements: One or more columns with structured values that are associated with the two previous columns.
- measure: A string representing the measure to extract from the GeoDataFrameextra_dataset. It should match the name of the column being extracted.
- extra_values: A Boolean, indicating whether to extract additional measures from the GeoDataFrame extra_dataset.
- names_extra_measures: A list of strings representing the additional measures to extract from the GeoDataFrame extra_dataset. They have to match the name of the columns being extracted.
3.2.2. Outputs
The expected output of this implementation is a GeoDataFrame containing the joined data in the following structure:
- Column original_index: indices from the original dataset are stored here to make it easier to perform joins with other data.
- Column section: Column with GeoPandas geometry objects.
- Column timestamp: Column with datetime objects representing timestamps.
- Column geography: Column with GeoPandas geometry objects representing spaces with real coordinates.
3.3. Computational Complexity and Performance
We denote n as the number of rows in the input variable and m as the number of rows in the input variable. Since the initial definition of the algorithm contains nested loops that search for the closest measuring station and timestamp for each point in the initial dataset, the computational complexity is defined as . This means that the running time increases significantly as the size of the dataset grows.
Due to this limitation on scalability, improvements were made on the final implementation bringing the complexity down to , with the use of two main improvements that sped up the search for the closest station and timestamp shown at Code Listing A2, in Appendix A. This resulted in a significant improvement in performance, especially for large datasets.
The asyncronous_join function has a loop that iterates over every point in the initial dataset, having a size proportional to n. For each point, the function must calculate the distance to every point in the extra dataset, which has a size proportional to m. The calculation of normalized distances between the initial point and every point in the extra dataset has a time complexity of , as it must loop over every point in the extra dataset. Similarly, the normalization of the timestamps has a time complexity of as it also must loop over every point in the extra dataset. After normalization, the function must combine the two measures into a single distance value for each point in the extra dataset. This operation has a time complexity of , as it involves element-wise addition of two arrays of length m. Finally, the function must find the point in the extra dataset that has the minimum combined distance from the current initial point. This operation has a time complexity of , as it must loop over every point in the extra dataset to find the minimum distance.
Therefore, the total time complexity of the asynchronous_join() function is . This is because for every point in the initial dataset, the function must perform calculations to find the point in the extra dataset with the minimum distance. Any other computational improvement had to be discarded, since the complexity of the possible geographical references could not be supported by the definition of the implementation.
In terms of space complexity, the function creates a new GeoDataFrame to store the output, which has a size proportional to n. Additionally, the function creates a spatial index for the extra dataset, which has a size proportional to m. With this, we can state that the total space complexity of the function is .
4. Case Study: From Time Series Data to Semantically Enriched Data
The growth of urban areas has brought about a significant increase in the number of vehicles on the roads, resulting in an unprecedented level of traffic congestion. As a result, it has become increasingly important for city planners and transportation authorities to gain insights into traffic patterns and trends, in order to optimize traffic flow and reduce congestion. In this case study, we explore the use of an algorithm for associating traffic density values with measurements and additional data, as a means of moving from time series data to semantically enriched data. By applying this algorithm to a real-world dataset, we aim to demonstrate the potential of this approach in improving the accuracy and reliability of traffic analysis, and in supporting the development of more effective traffic management strategies.
4.1. Challenges of the Real Life Problem of Car Traffic in the City
In order to study alternatives to car traffic in the city of Barcelona, the Optimizing Carsharing and Ridesharing Mobility in Smart Sustainable Cities project [9] requires geographical data with a timestamp component, like traffic density and air pollution, among others. Consequently, the need to study the relationship between these variables led to the demand for datasets that provide a comprehensive understanding of the issue. However, generating such datasets comes with two main challenges that can impede the research process.
The first challenge faced when generating a dataset about traffic density, pollution, and other variables is the asynchronous data collection. Traffic density and pollution are collected at different times and depend on physical devices that measure the data in an open environment, making them susceptible to damage and downtime. As a result, generating a comprehensive dataset that covers these variations requires a robust data collection method that captures the fluctuations in traffic density and pollution levels, while accounting for the unavailability and potential downtime of the measuring devices. The method defined above includes a predefined merge structure that allows the data to be paired with a logic that considers these external situations to ensure the accuracy and completeness of the resulting dataset.
The other significant challenge in generating these homogeneous datasets is the different geographical points for the measurements. Each measurement is taken from different locations, making it necessary to collect data from different geographical points, generating a logic that decides which data better represents the reality for each section of the city. Standardized protocols can help ensure that data is collected consistently and in a compatible format, making integration and management more straightforward.
4.2. Definition of Requirements and State of the Original Data
The motivation behind this case study was driven by the need for traffic-related data from the Open Data Barcelona portal, as well as the need to study relevant time series data with different coordinate ranges and periodicity of measure, all of which are included within the same source. In particular, the data requires a comprehensive analysis of traffic flow in Barcelona, along with additional measures, such as pollution levels and alternative transportation capacities.
To facilitate an in-depth analysis of different sections of the city, it is essential to incorporate geographic filters for all the data provided. This enables the study of individual neighborhoods, streets, and other relevant city subdivisions, enabling more targeted and effective urban planning strategies.
One of the main challenges in working with Open Data Barcelona is the lack of standardization in the original data. Some datasets, particularly those that rely on a limited number of measuring stations spread across the city, often include two columns labeled ’Longitude’ and ’Latitude’ that indicate the location of the measurements. Other datasets may relate to specific sections of streets or districts within the city, and may not contain direct geographic data. In these cases, additional preprocessing may be necessary to add geographic data to the dataset. The heterogeneous presentation of the data can make it difficult for the public to access the information, as well as hinder efforts to interconnect and create a comprehensive picture of the city. This challenge underscores the importance of preprocessing the data to ensure standardization and consistency, enabling more effective data analysis and visualization.
4.3. Preprocessing, Feature Engineering and Standardization
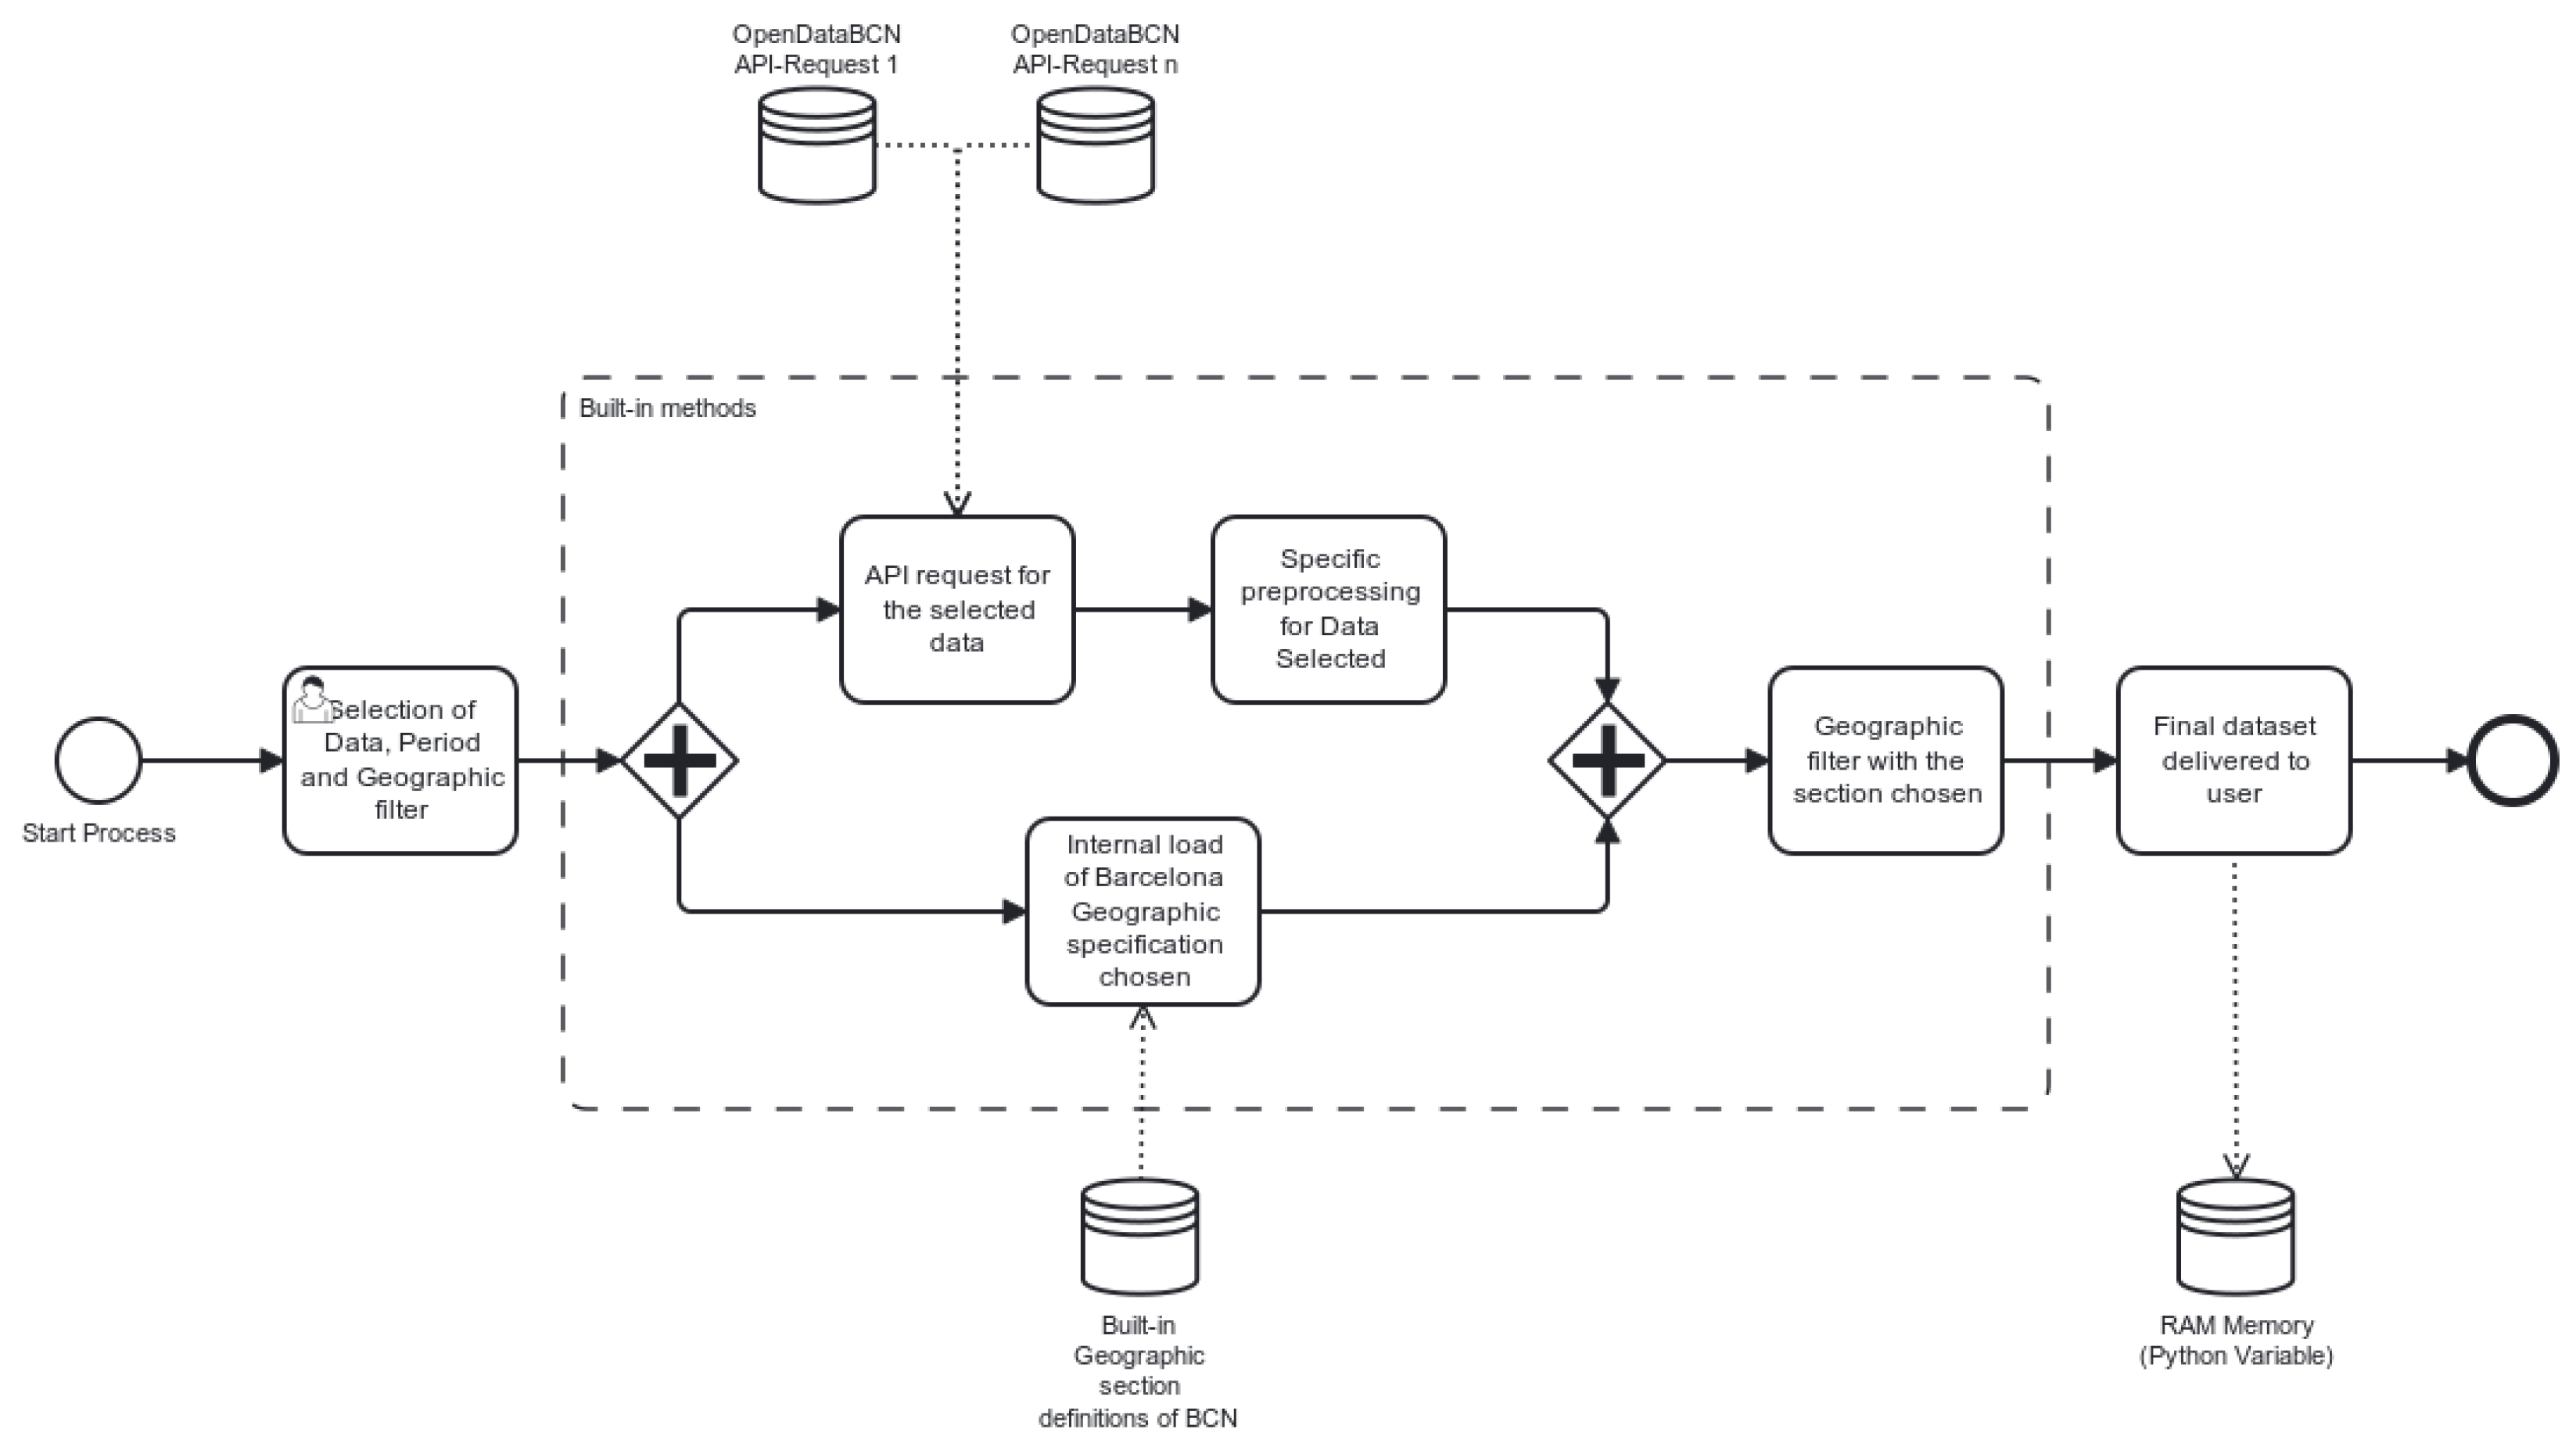
A preprocessing method is defined with the ultimate goal of standardization and interoperability, with the adoption of time and space filters, and it involves several key steps (see processing workflow in Figure 3).
In the first step, the user selects a dataset of interest from the Open Data Barcelona portal, specifying a specific time and geographic range. Subsequently, built-in methods request the data through an API, returning the raw dataset in its original form. It is important to emphasize that each chosen dataset requires a unique preprocessing and cleaning method due to the differences in data sources and structures.
To ensure the necessary treatment for each dataset, we developed a modular approach that involves the removal of invalid and redundant data, identification and elimination of duplicate entries, and standardization of geographical and temporal properties. Special emphasis was given to generating GeoPandasDataframes with geometries derived from the coordinates provided in the original data, which could be Points, Linestrings, or Polygons, depending on the nature of the data. Moreover, after cleaning and standardizing the data, we restructured the initial dataset to ensure that the data was presented in a consistent format for further analysis.
Finally, this method employed built-in predefinitions of different sections of the city to extract the selected period and section of data chosen by the user. This facilitated targeted analysis of specific neighborhoods, streets, and other relevant city subdivisions. In summary, the proposed preprocessing method plays a crucial role in enabling the analysis of Open Data Barcelona datasets by providing clean and standardized data that is readily available for further exploration and analysis.
4.4. Open Data Barcelona Data Selection and Geographic Sections Definition
In Table 2 we present the datasets included in the case study for the asynchronous join process. The table includes information on the number of different geographical locations contained in each dataset, their geographic definitions, and the types of information that can be retrieved from them. Additionally, the estimated update rate and periodicity in which the data was updated was in accordance with what Open Data Barcelona stated in each dataset metadata.
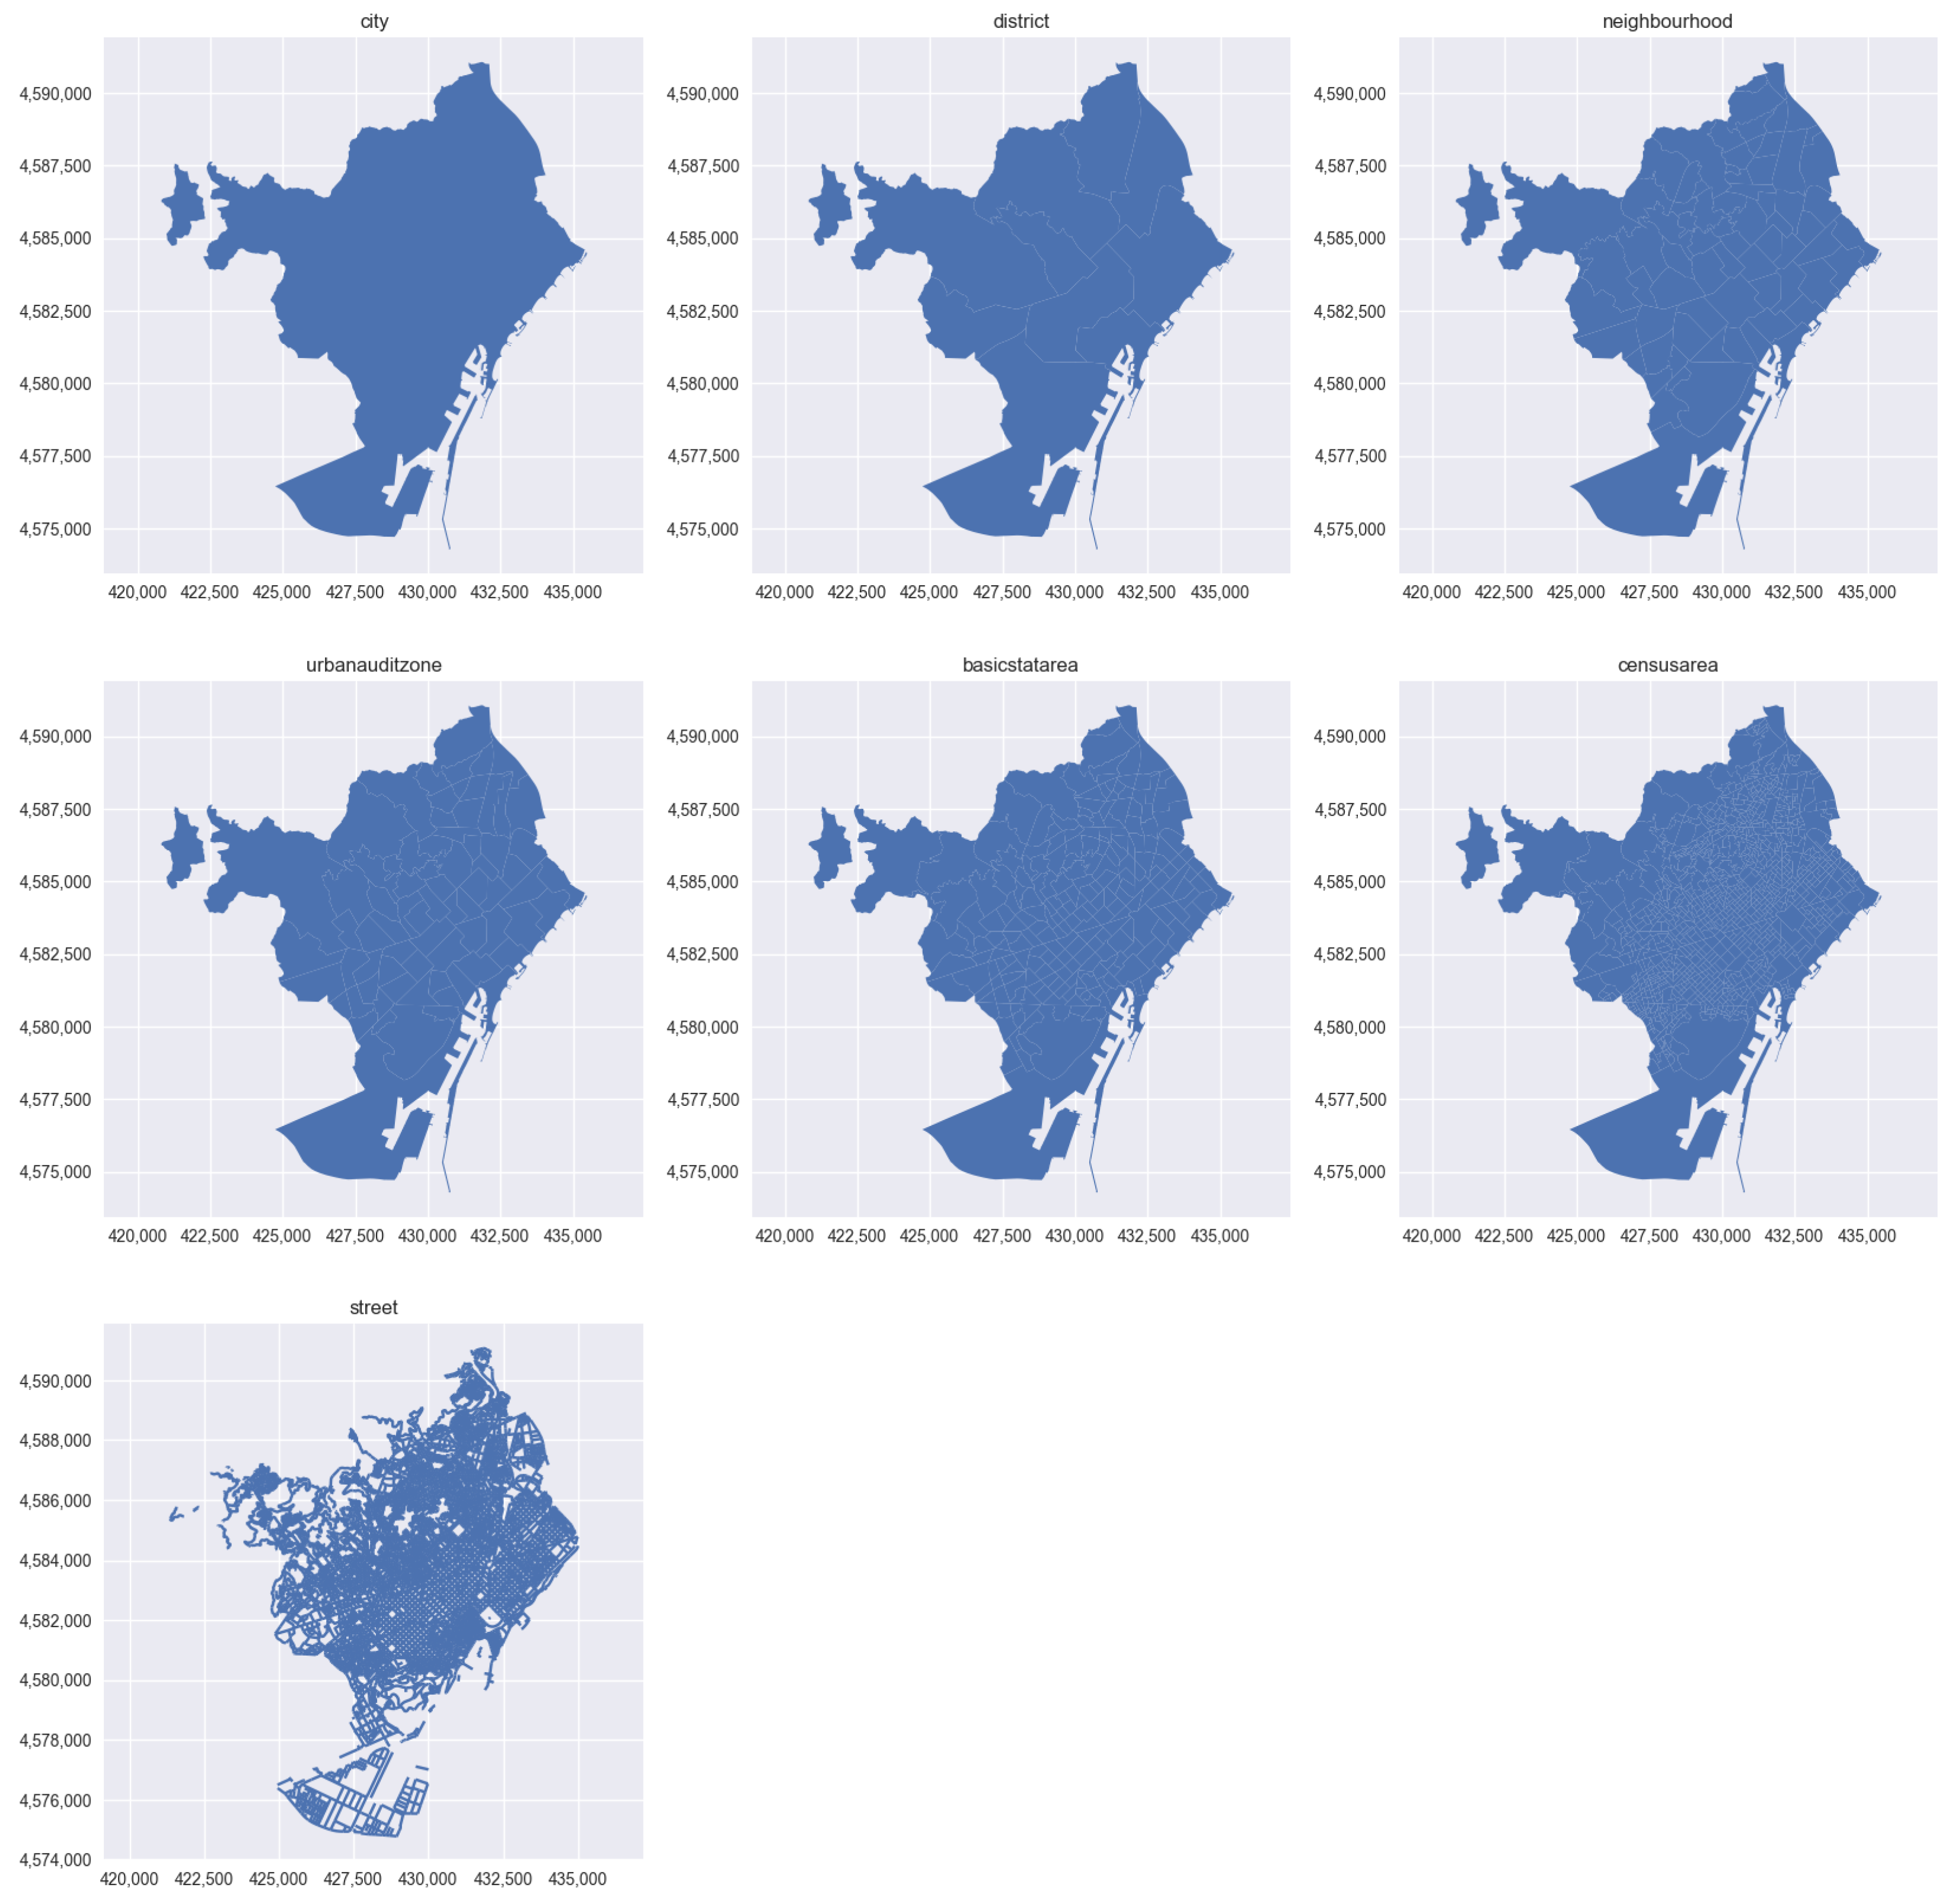
To establish the formal definitions for the geographic filter, we referred to the definitions provided by the Barcelona City Council—Ajuntament de Barcelona, which are made available to the final user as a parameter for geographic filtering. These definitions are illustrated in Figure 4, and can be narrowed down to:
- city: This filter includes the entire city of Barcelona. This is the largest geographic area and encompasses all of the neighborhoods and districts within the city.
- district: Barcelona city is divided into 10 administrative districts, for which some data is only available on this division.
- neighbourhood: Each district in Barcelona city is further subdivided into neighborhoods.
- urbanauditzone: The Urban Audit project is a European-wide initiative that aims to provide comparative urban statistics. This filter allows focus to be directed on data from specific zones defined by the Urban Audit project.
- basicstatarea: These areas are used by the Barcelona City Council for statistical purposes only, and there are 233 different areas. This filter allows focus to be directed on data from a specific area that is relevant to the statistical analysis being performed.
- censusarea: These areas are defined by the Spanish National Institute of Statistics (INE) for census purposes. This filter allows focus to be directed on data from a specific area that is relevant to the census analysis being performed.
- street: This filter allows focus to be directed on data from specific street segments within the Barcelona city. This can be useful for analyzing data that is related to traffic patterns, foot traffic, and other street-level activities.
4.5. Computational Results
In this section, we present the computational results obtained from using the methodologies and implementations discussed in this study, including the asynchronous_join method, to merge the selected data into a homogeneous time series for the different street sections in Barcelona, while keeping the original objective of providing a comprehensive view of the traffic data in Barcelona and presenting unified time series data that incorporate the information from all three data sources.
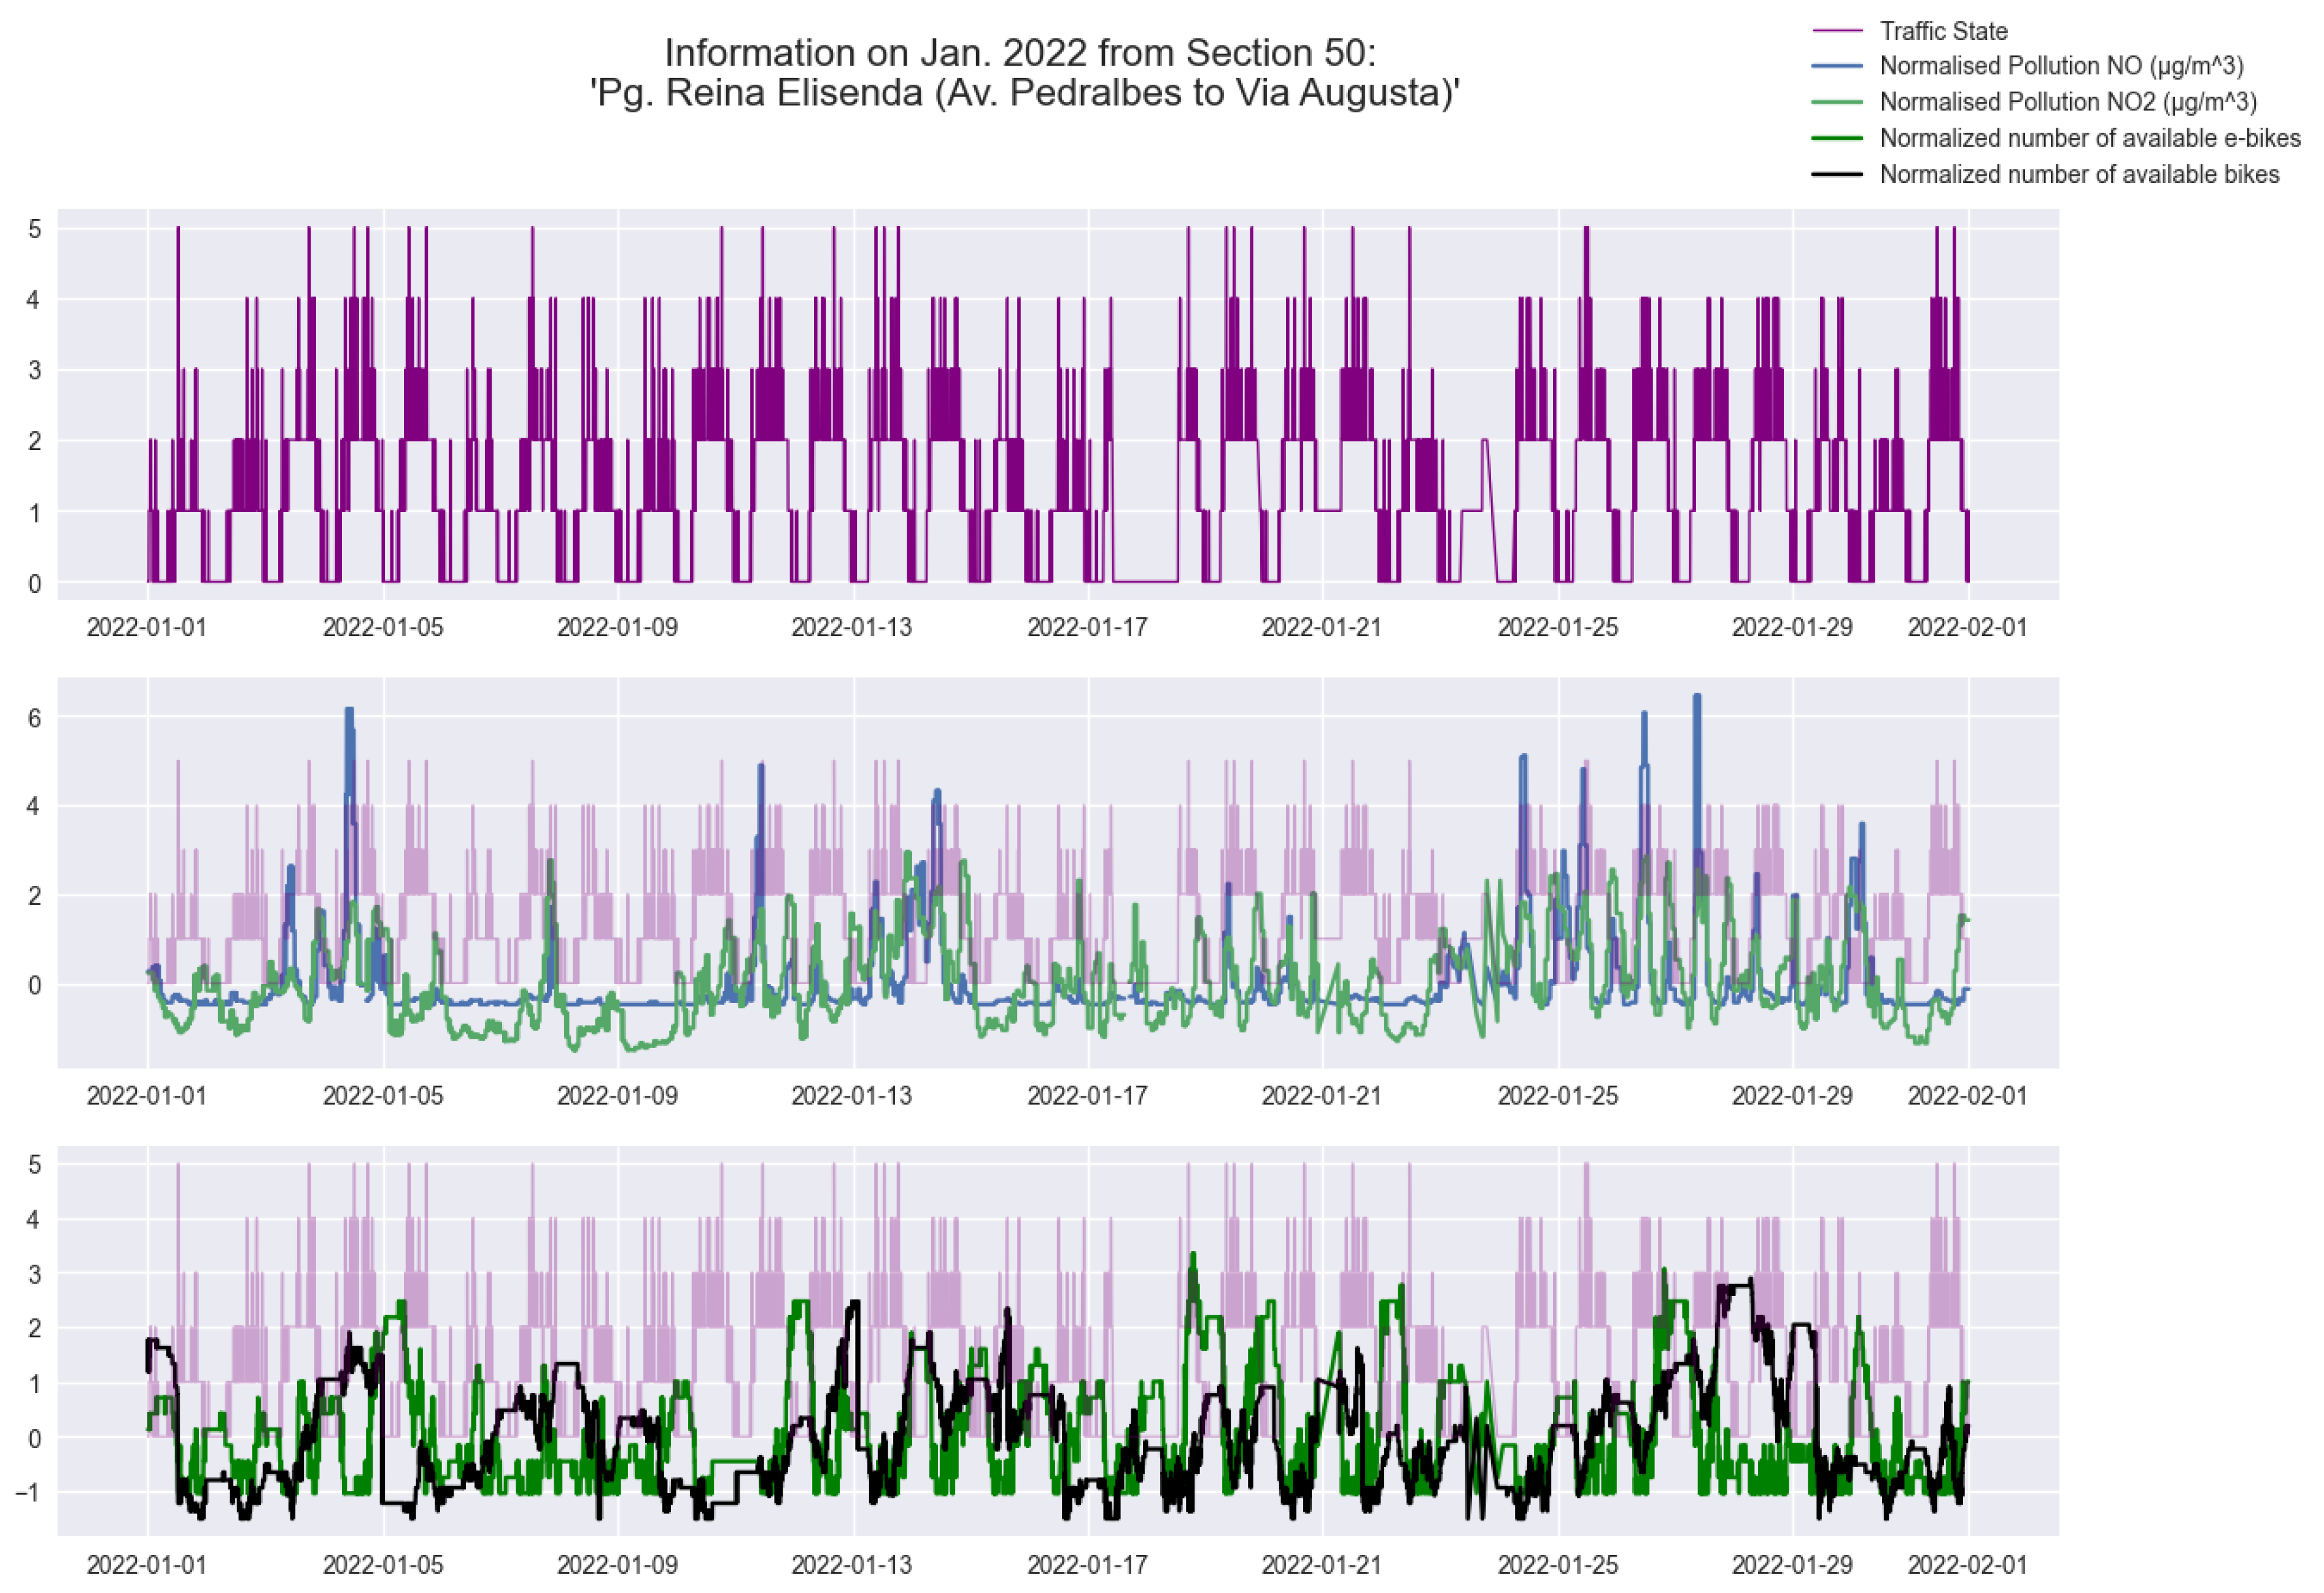
Combining data from different sources provides a broader perspective of the city’s traffic and helps in identifying trends and patterns that may not have been apparent in individual datasets, as shown in Figure 5. The resulting time series provides a valuable resource for analyzing and understanding the traffic patterns in Barcelona. For example, correlations between certain pollution levels and areas of the city that are more prone to traffic congestion can now be evaluated, along with tracking changes in traffic patterns over time based on the availability of other methods of public transportation.
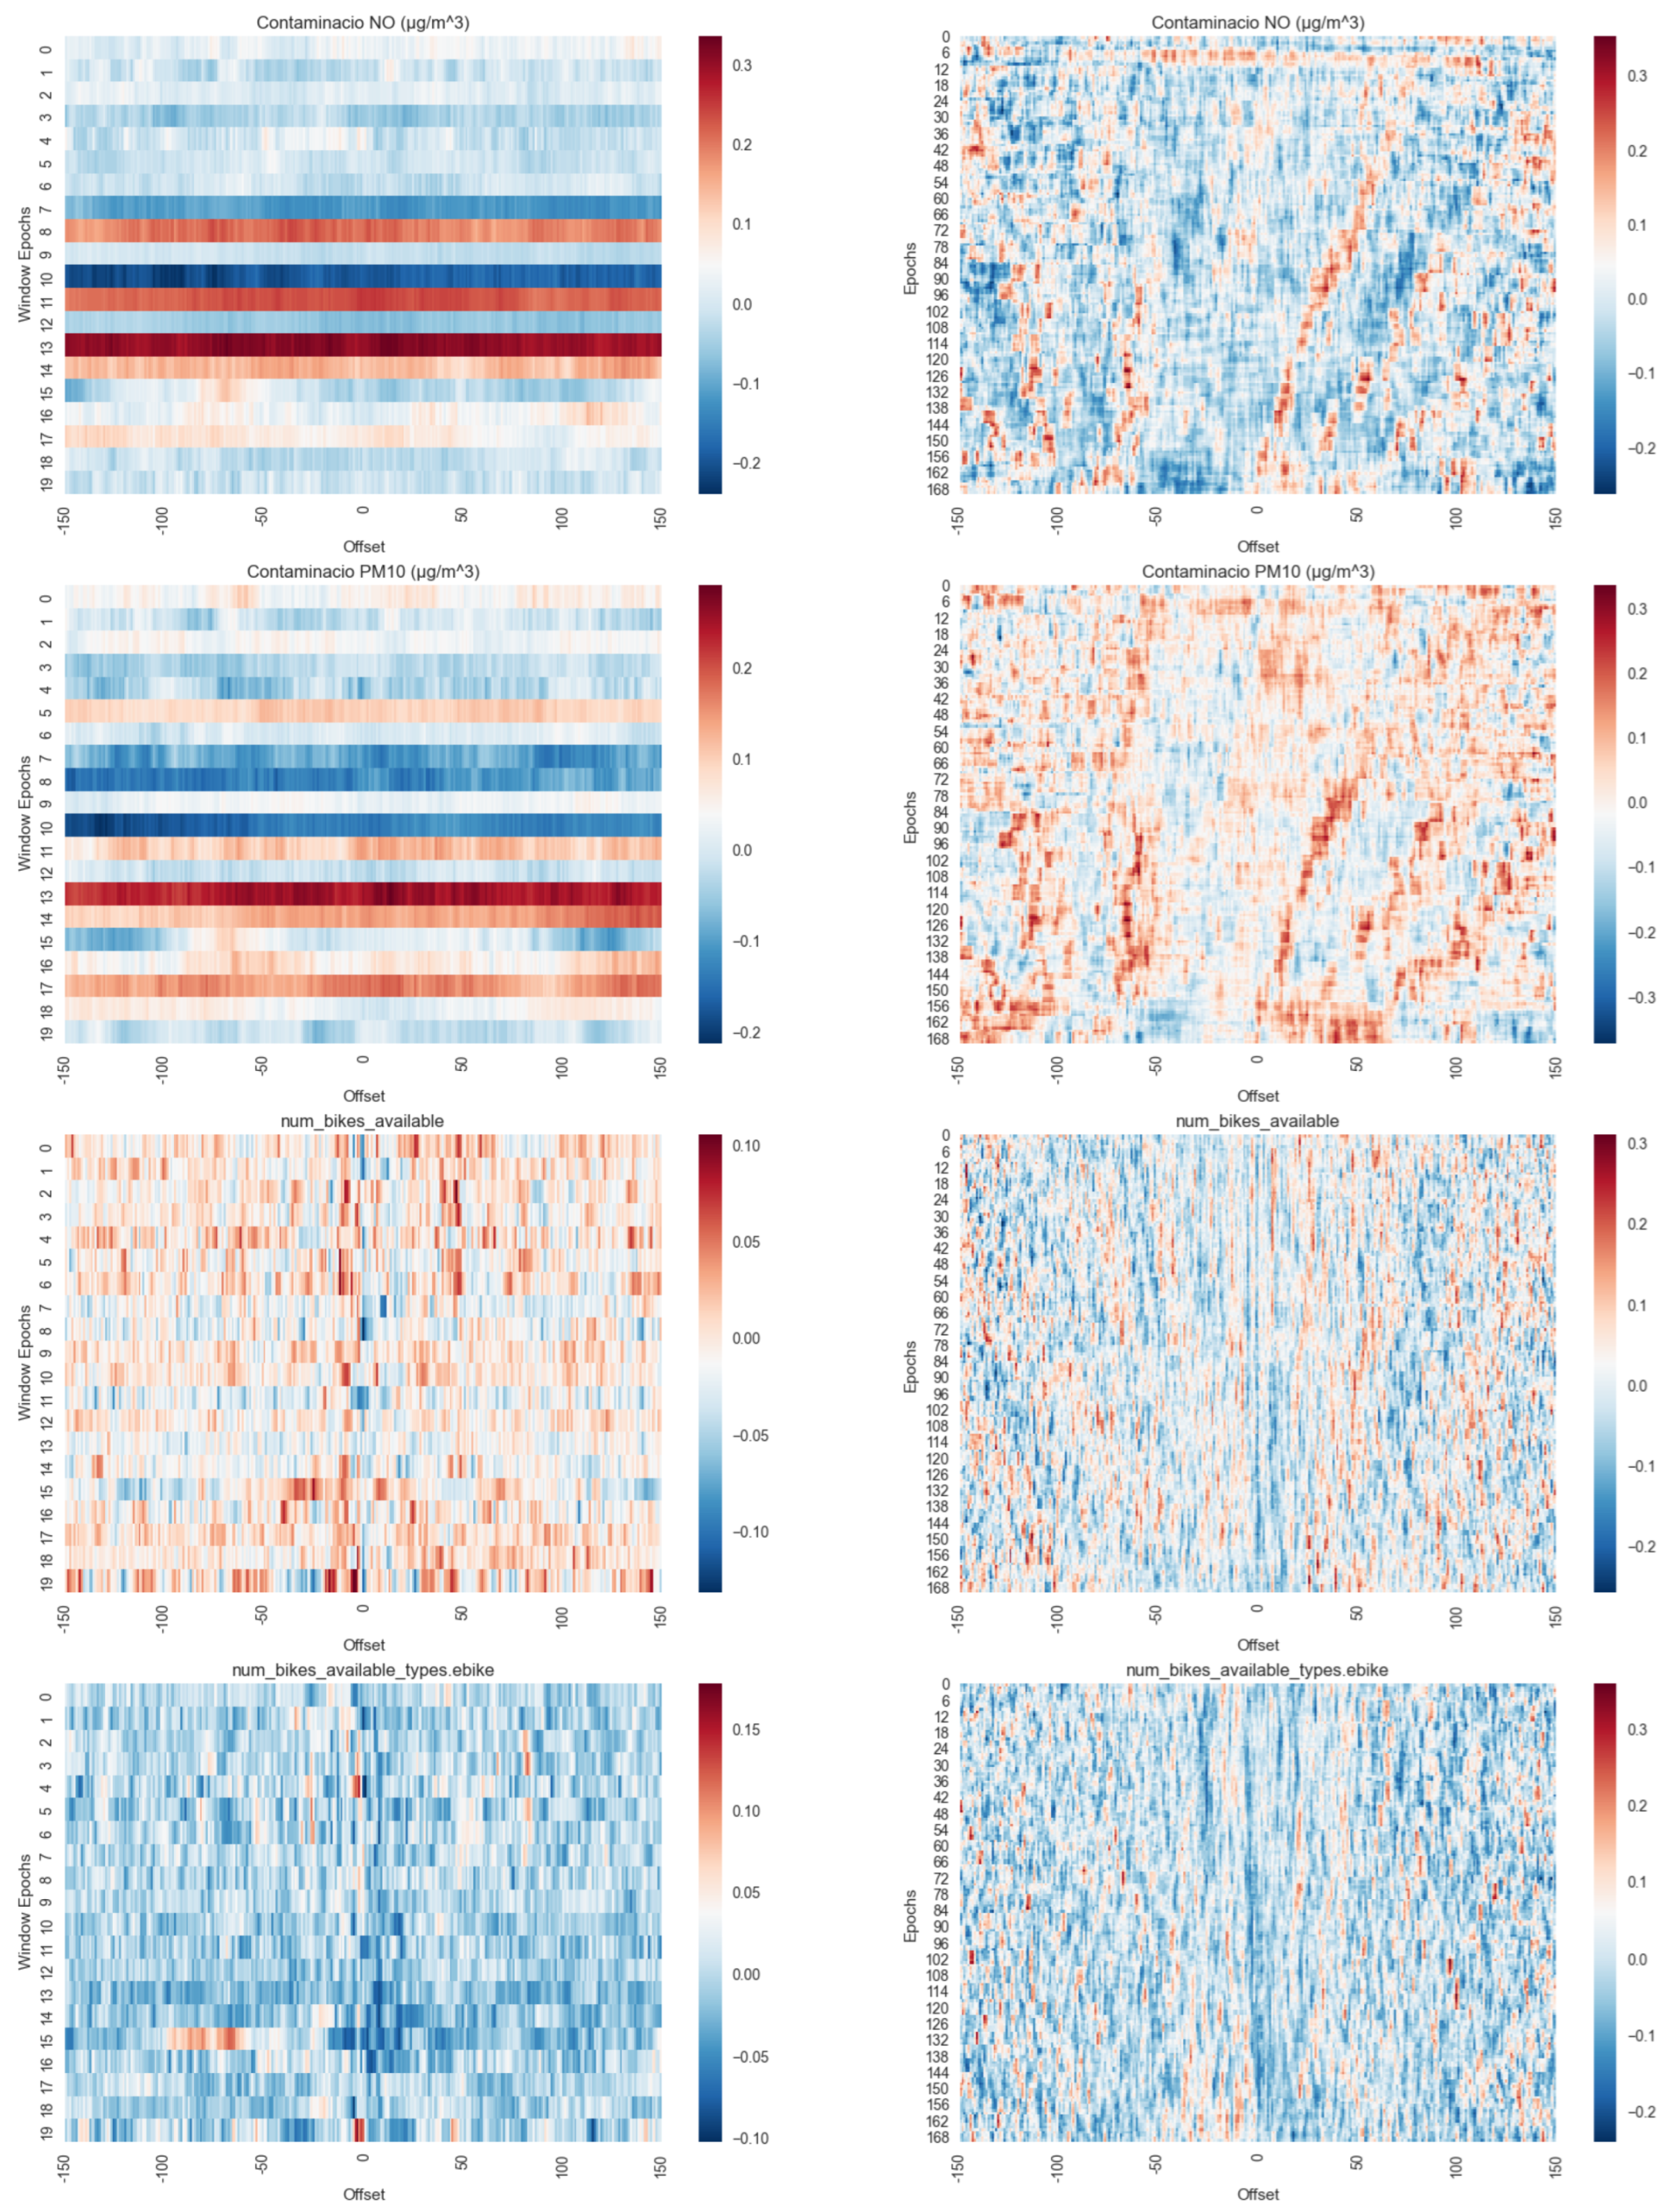
One significant advantage of the proposed methodology is that it enables the application of more advanced analysis methods, like windowed cross-correlation [27], a time series analysis technique used to identify correlations and time lags between different time series data points. With this kind of tool now available, users can identify time lags between two time series that came from different sources. For example, Figure A1, in Appendix B, displays the windowed cross-correlation and its rolling variate between traffic density and pollution levels over time. It is possible to identify the effects of different dimensions in which the original data was defined on the resulting dataset. In sources with a less frequent update rate, the results show a more static output than their counterparts.
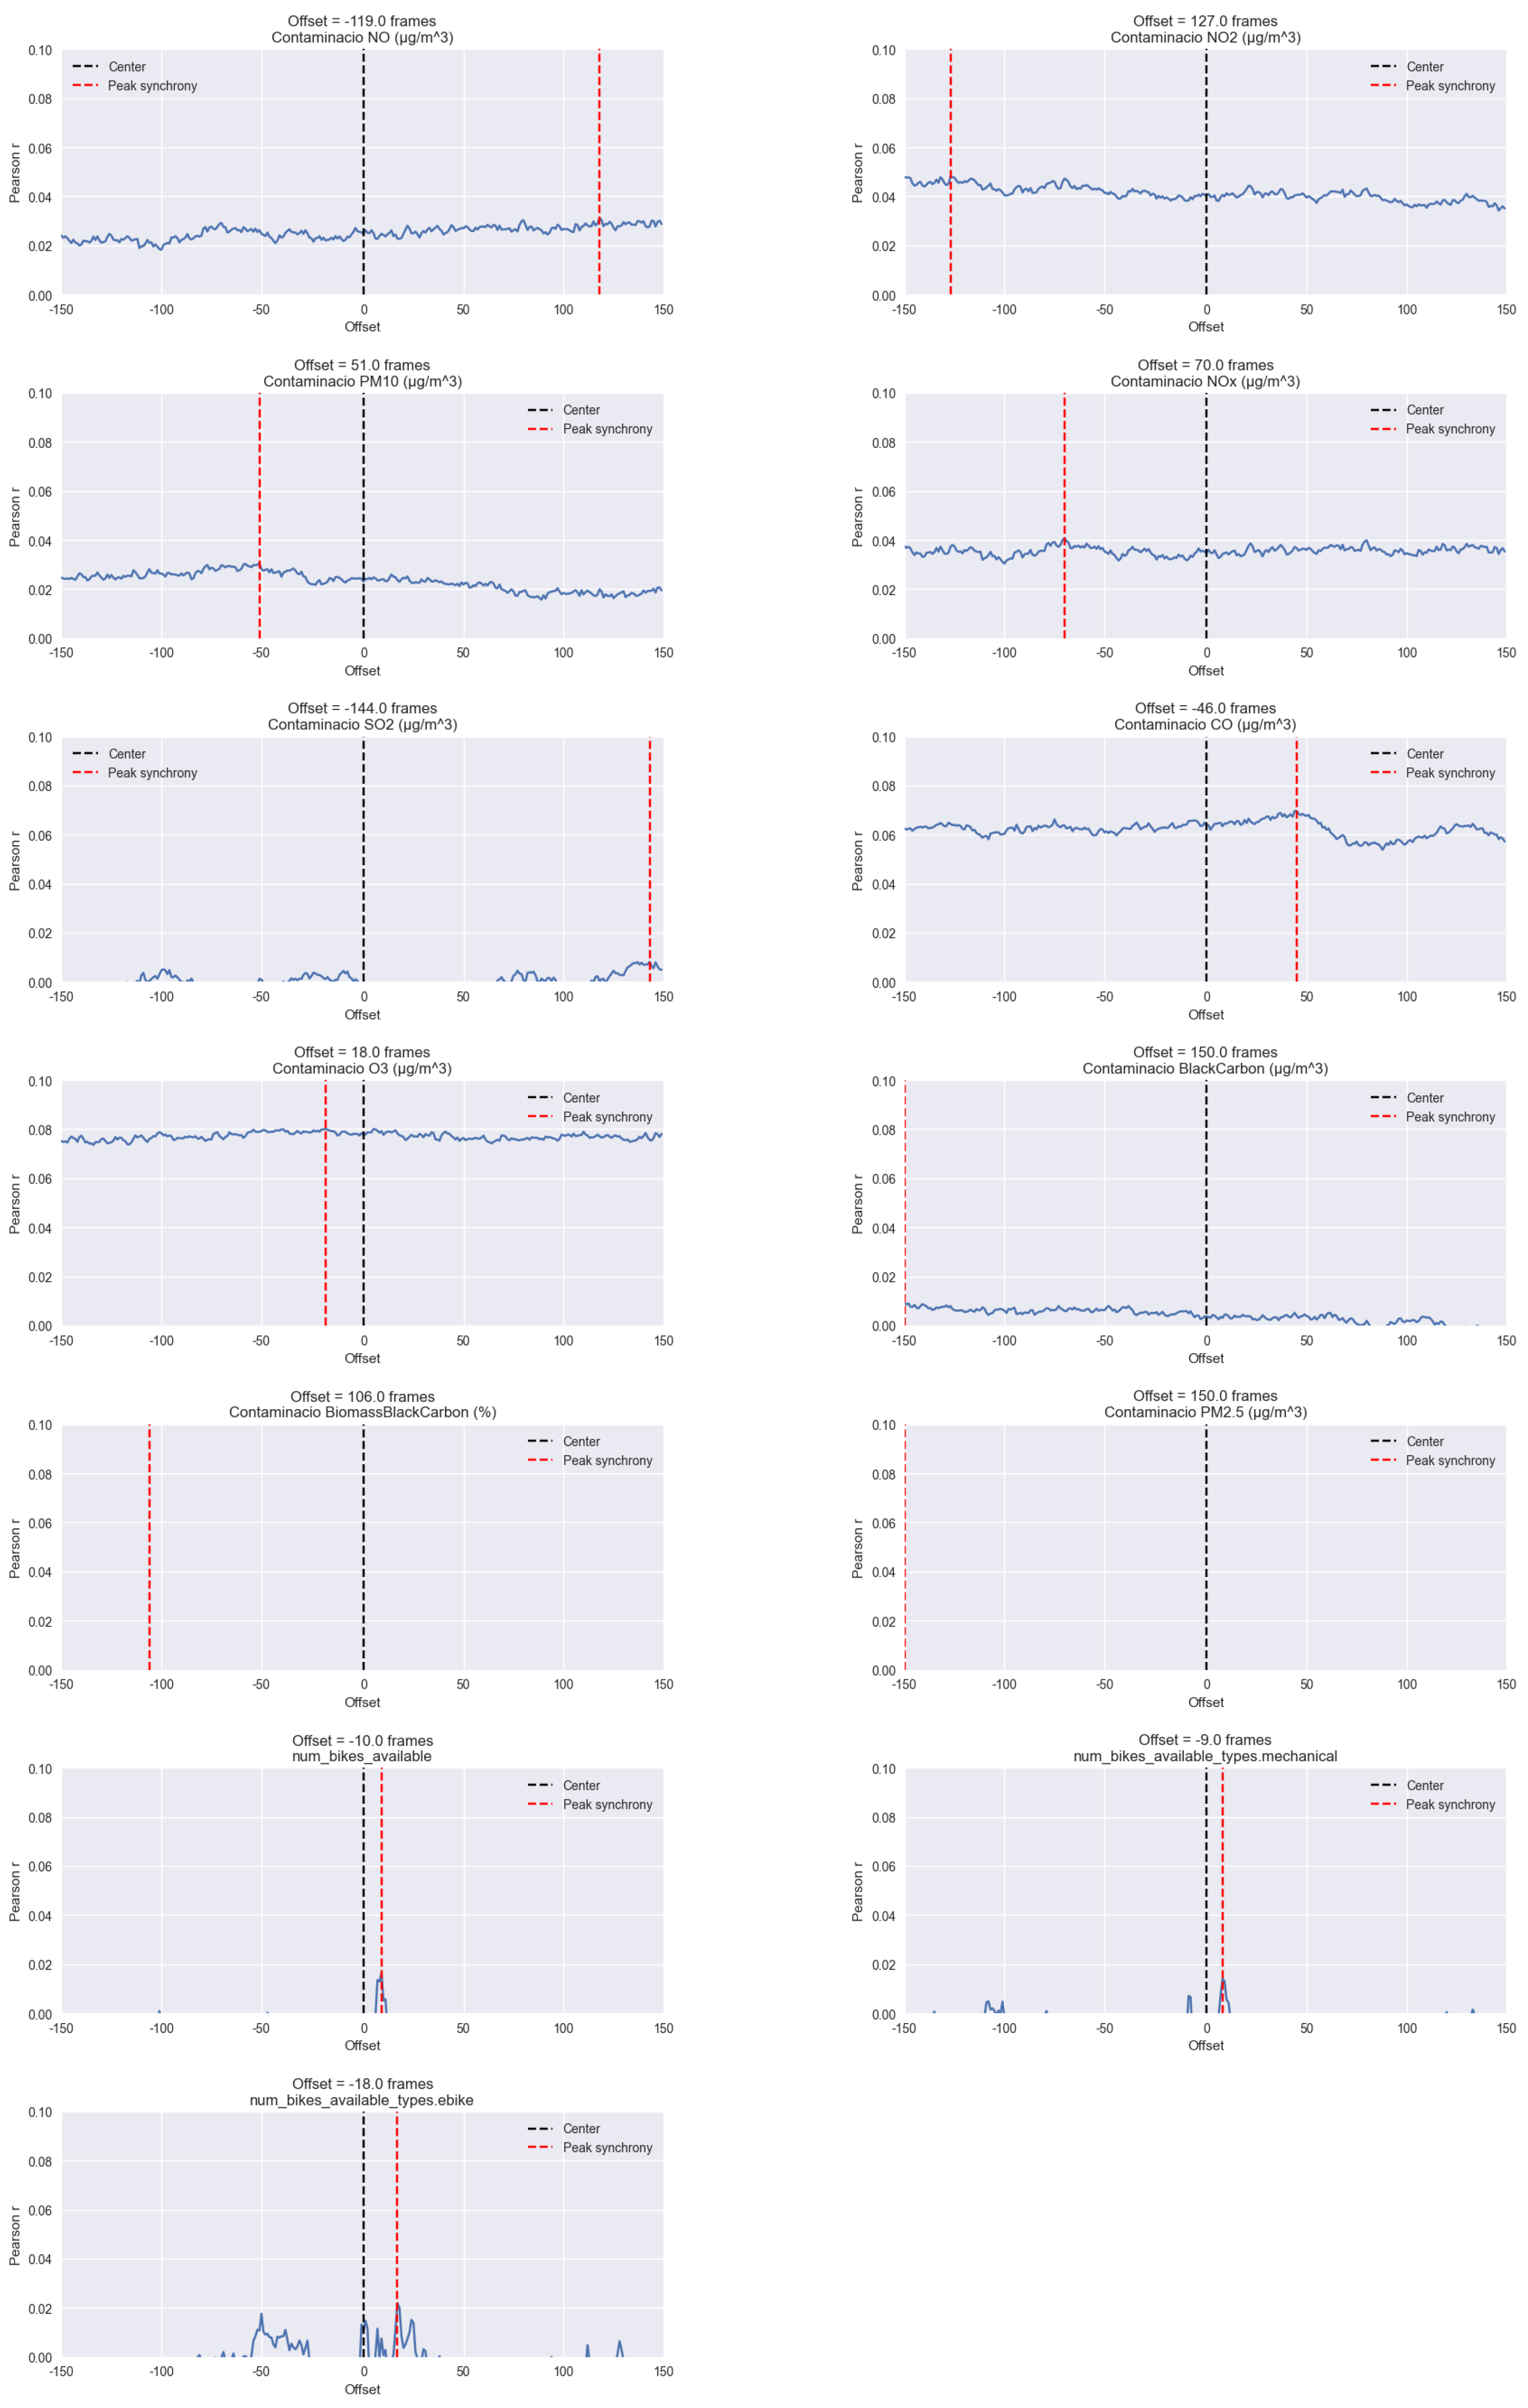
With the proposed methodology, it is also possible to perform another time series analysis technique to identify correlations, like peak picking data points from different sources. This enables users to identify local maxima in their time series correlation by the changes in the offsets. For example, one could calculate the Pearson correlation between traffic density and pollution levels over time, as shown in Figure A2 in Appendix B. By doing so, it would be possible to determine the strength of the relationship between the two variables and potentially identify periods and offsets of high correlation, or even discard correlations.
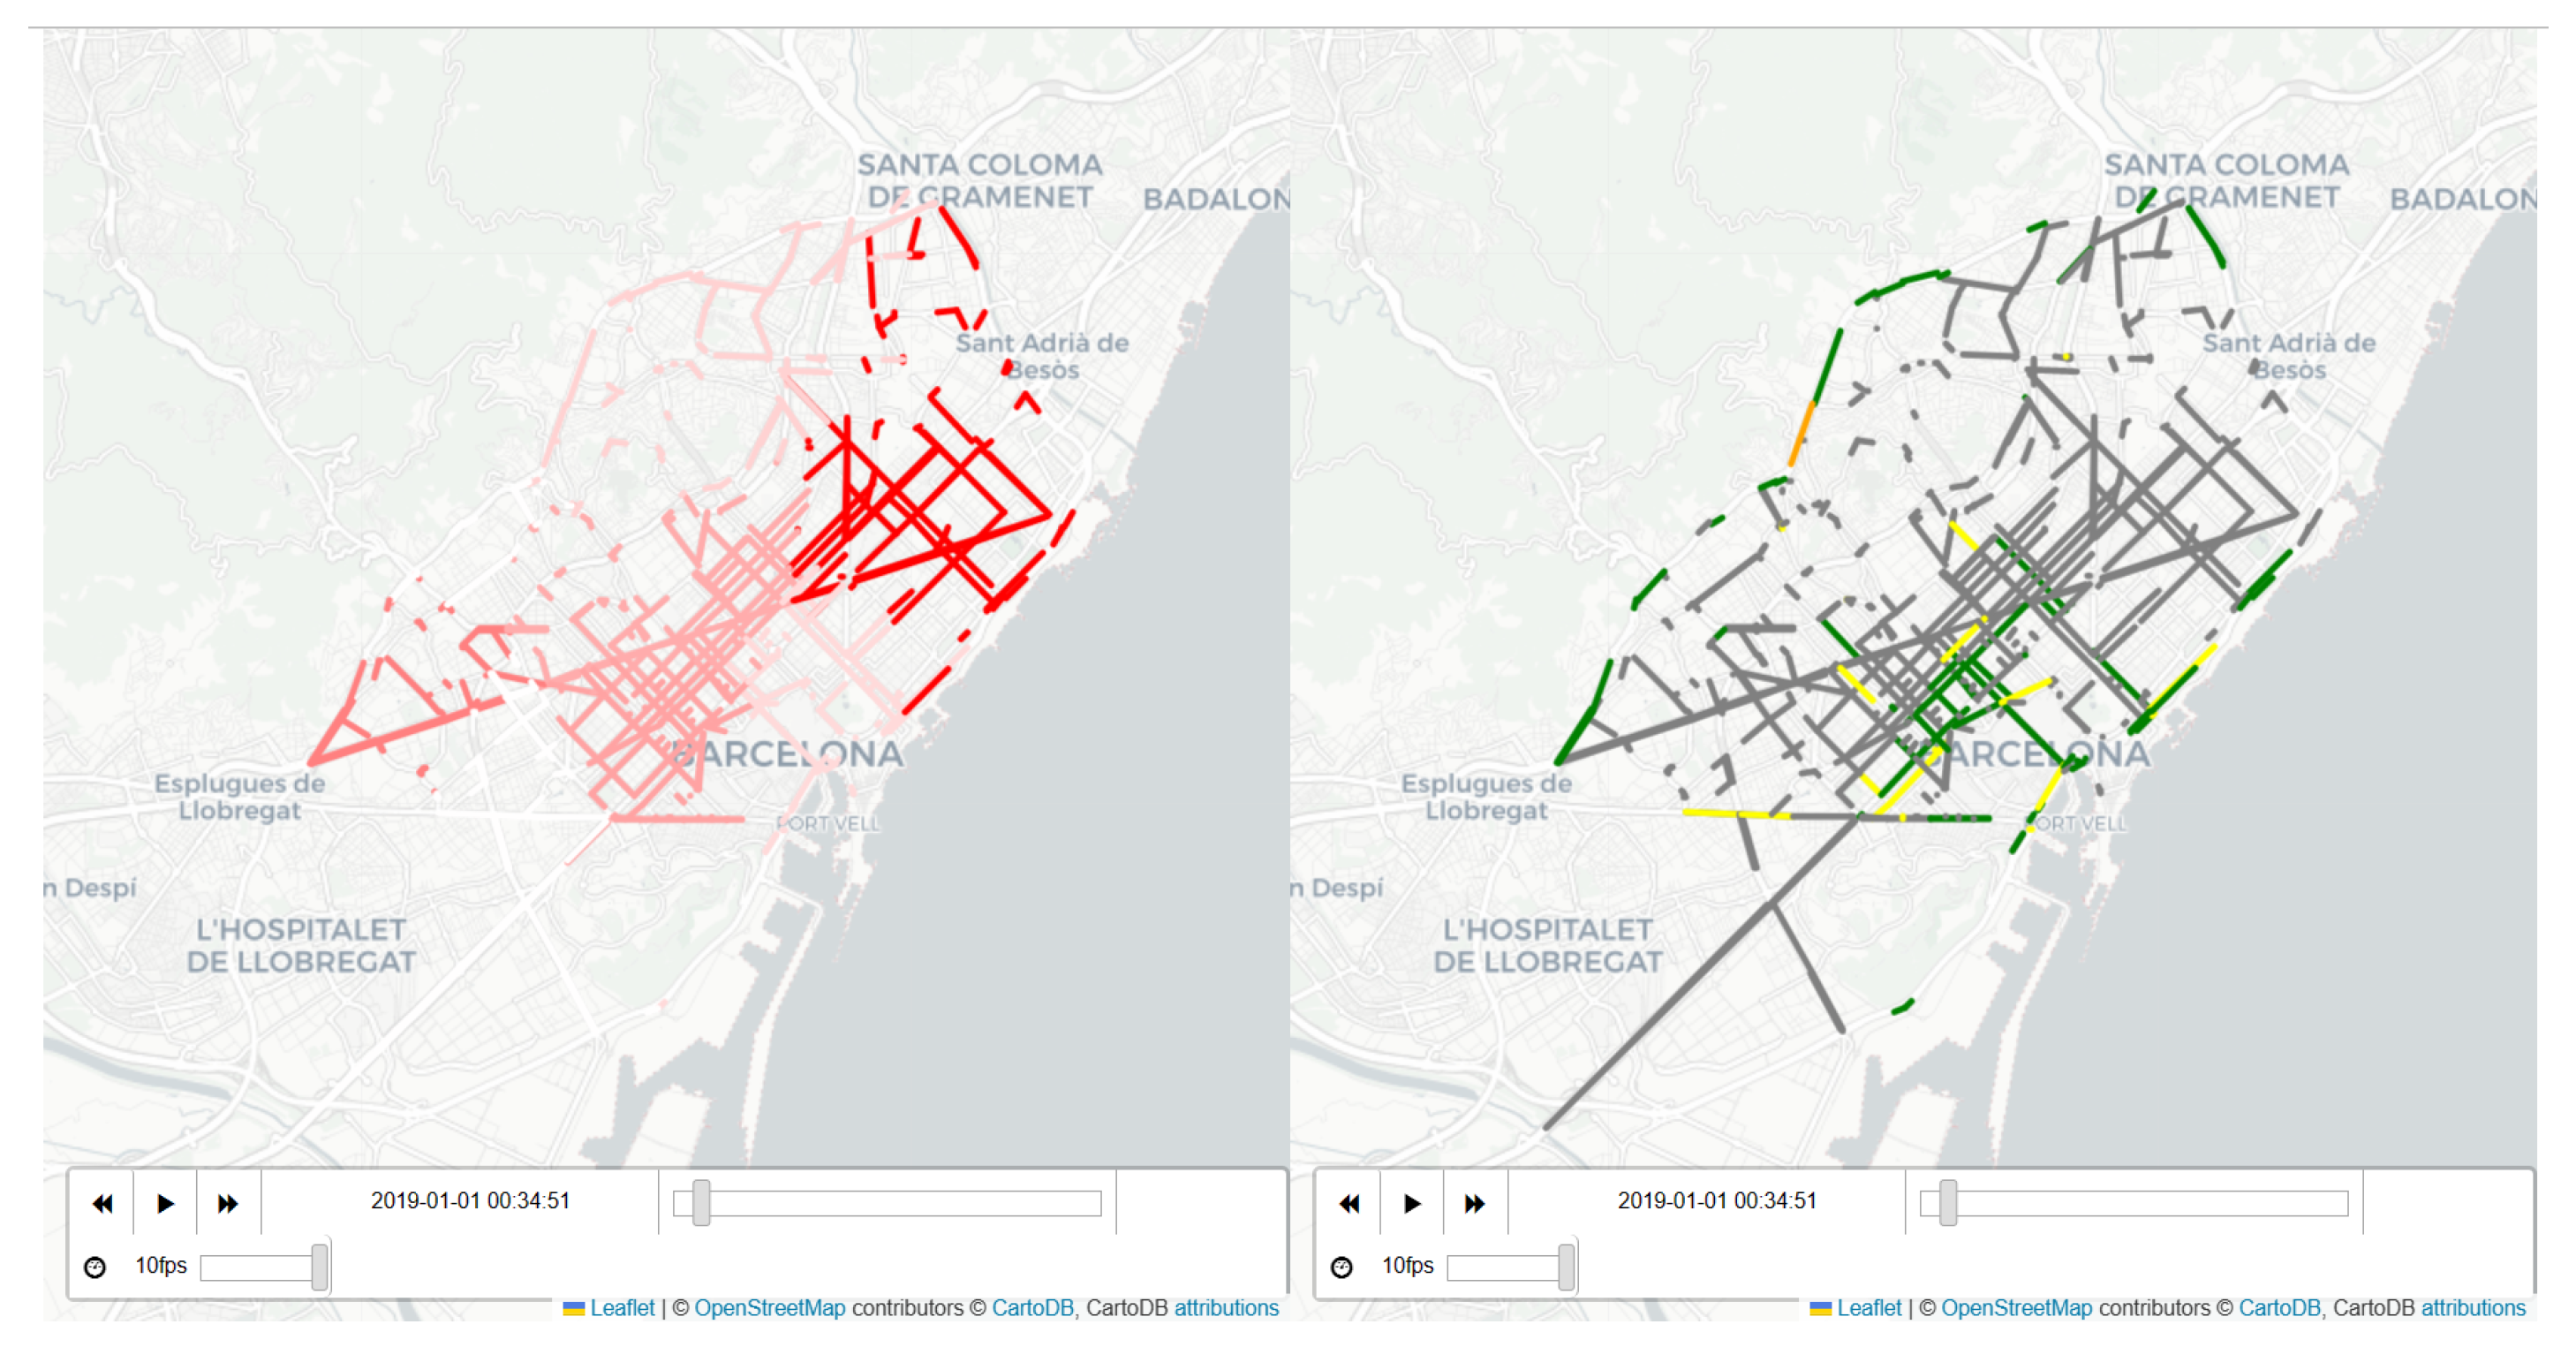
The use of asynchronous_join also allows for the creation of interactive dashboards that can be used to display the time series data in a more comprehensible format with compatibility between geopandas packages and folium, a Python library for creating interactive maps and visualizations using Leaflet.js. These dashboards can provide visualizations and summaries of the key insights and patterns identified in the data, making it easier for stakeholders to understand and act upon the information. An example can be observed in Figure 6, where pollution data and traffic density data are shown on a synchronous interactive display code, whereby a dashboard displays real-time pollution data from multiple monitoring stations across a city and represents them in the closer street sections, so they provide a better understanding of the original issue.
Overall, the use of the asynchronous_join method, along with other methodologies presented in this study, allows us to merge data from multiple sources into a unified time series, providing a comprehensive view of traffic data in Barcelona. This approach enables the identification of trends and patterns in the data, and provides a valuable resource for developing more advanced analyses and predictive models.
5. Summative Evaluation
The use of semantic data enrichment, merging and processing techniques, such as asynchronous_join, have proven to be powerful tools for enriching, homogenizing and merging different and multiple data sources into a unified time series. A more comprehensive view of the data can be achieved that enables identification of patterns and trends that may not have been visible in individual datasets.
In the case of traffic data in Barcelona city, merging data from multiple sources allowed us to identify correlations between traffic density and pollution levels, as well as to identify patterns in the availability of public bicycles and traffic congestion. By applying time series analysis techniques, such as windowed cross-correlation and peak picking, it is possible to go further and explore the correlations and patterns, providing valuable insights for city officials and other stakeholders. The use of interactive dashboards and visualizations can also facilitate communication of the insights, making it easier for stakeholders to understand and act upon the information. This has potential benefits for urban planning, infrastructural development, and public health policies.
It should be noted, however, that the process of merging data from multiple sources does not come without challenges. One significant challenge is the lack of synchronization between datasets. This might result in missing data, outliers, and other inconsistencies that can affect the accuracy of the results. The use of data cleaning and processing techniques, as well as careful selection of compatible datasets, is crucial to mitigate these issues.
In summary, the integration of data from multiple sources through techniques such as asynchronous_join, provides a powerful tool for analyzing and understanding complex phenomena, such as traffic patterns in urban areas. By leveraging time series analysis techniques and interactive dashboards, we can obtain valuable insights and communicate these insights effectively to stakeholders. However, care must be taken to address the challenges of data synchronization and cleaning to ensure the accuracy and reliability of the results.
6. Conclusions and Future Works
In this article, we proposed a semantically based enrichment methodology for merging data from multiple sources even when the original data collection datasets are not synchronized. We started by discussing a methodology that effectively merges these different datasets from multiple sources by creating a unified time series. We explained how this method works by identifying the geospatial and temporal similarities between datasets. We applied the methodology to different datasets from the Barcelona city public data service, like traffic densities, public bicycle availability, and pollution monitoring stations to create a unified time series that provides a comprehensive view of traffic patterns in the city. We also discussed how combining data from different sources enables us to identify correlations and patterns that may not have been apparent in individual datasets. The obtained computational results showed the usefulness of the proposed approach to analyze complex datasets, and to identify trends and patterns, while the creation of interactive dashboards to display the time series data in a more comprehensible format can support stakeholders (urban planners, policymakers, etc.) in understanding and acting upon the information. The proposed approach can be applied to a wide range of fields where data from multiple sources needs to be merged and analyzed, such as healthcare, finance, and environmental studies. Furthermore, while this approach has been applied specifically to traffic patterns and pollution levels in Barcelona, it has the potential to be utilized in other domains and cities with multiple sources of data. For instance, this method could be employed to study public transportation usage and its relationship to urban development, or to investigate patterns of energy consumption and their associations with climate change.
Although the asynchronous geospatial join function presented has a number of strengths, there are also several potential weaknesses to consider.
One potential weakness is the reliance on Euclidean distance as a measure of proximity between points. While this is a common approach in geospatial analysis, it may not always be the most appropriate measure, particularly when dealing with datasets that span large geographic areas or have complex spatial structures. In these cases, other distance measures, such as geodesic distance or network distance, may be more appropriate.
Another potential weakness is the assumption that the time difference between two points is proportional to the distance between them. While this may be a reasonable assumption in some cases, it may not hold true in all situations. For example, the relationship between distance and travel time may vary depending on factors such as mode of transportation, traffic conditions, and topography.
Future work could explore the use of alternative distance measures and time normalization techniques to improve the accuracy of the function. Additionally, incorporating uncertainty measures and error propagation into the geospatial join operation could improve the reliability of the results.
Another direction for future work could be the integration of machine learning algorithms into the geospatial join process. For example, clustering algorithms could be used to group similar points together before performing the geospatial join operation, or regression models could be used to predict missing values or correct errors in the input datasets.
Overall, while the asynchronous geospatial join function presented has its strengths, there are also potential weaknesses to consider and areas for future research and improvement.
Author Contributions
Conceptualization, F.X. and C.S.; methodology, E.G. and F.X.; implementation, E.G.; validation, F.X. and C.S.; literature review, E.G. and M.P.; writing—original draft preparation, E.G., M.P. and F.X; writing—review and editing, E.G., F.X. and C.S.; supervision, F.X. and C.S. All authors have read and agreed to the published version of the manuscript.
Funding
This work was partially funded by the Spanish Ministry of Science (PID2019-111100RB-C21 /AEI/ 10.13039/501100011033), as well as by the Barcelona City Council and Fundació “la Caixa” under the framework of the Barcelona Science Plan 2020-2023 (grant 21S09355-001).
Institutional Review Board Statement
Not applicable.
Informed Consent Statement
Not applicable.
Data Availability Statement
The data used in this study were obtained from Open Data Barcelona.
Acknowledgments
This research was supported by Departament de Recerca i Universitats de la Generalitat de Catalunya (Spain) (2021 SGR 01421 (GRBIO)).
Conflicts of Interest
The authors declare no conflict of interest.
Appendix A. Python Code
Listing A1. Python code for the implementation of the Algorithm 1.
import geopandas as gpd
import numpy as np
def asynchronous_join(initial_dataset, extra_dataset, measure, extra_values=
False, names_extra_measures=None):
"""
A function that performs an asynchronous geospatial join operation
between an
initial dataset and an extra dataset using a specified measure.
"""
if names_extra_measures is None:
names_extra_measures = [’’]
# Create a spatial index for the extra dataset
extra_dataset_sindex = extra_dataset.sindex
# Create a GeoDataFrame to store the output
output_columns = gpd.GeoDataFrame(columns=[’original_index’, measure, ’
geometry’], geometry=’geometry’)
output_columns = output_columns.set_crs(epsg=4326)
for i in range(len(initial_dataset)):
# Get the current location
location = initial_dataset.iloc[i]
# Calculate the normalized distances and time differences between the
current location and all
stations
normalized_distances = calculate_normalized_distances(extra_dataset.
geometry.iloc[:].values[i],
extra_dataset.geometry.x.iloc[
:].values[i], extra_dataset.
geometry.y.iloc[:].values[i])
normalized_timestamps = normalize_timestamps(extra_dataset.timestamp.
values - location.timestamp)
# Find the station with the minimum combined distance
combined_distance = normalized_distances + normalized_timestamps
selected_station_index = np.argmin(combined_distance)
selected_station_data = extra_dataset.iloc[selected_station_index]
# Extract the desired measure and any additional measures from the
selected station
output_columns.loc[i] = [i, selected_station_data[measure],
selected_station_data[’
geometry’]]
# Extract additional measures, if requested
if extra_values:
for extra_measure in names_extra_measures:
output_columns.loc[i, extra_measure] = selected_station_data[extra_measure]
return output_columns
Listing A2. Auxiliary Python methods for performance improvement.
def normalize_timestamps(timestamps):
"""
A function that normalizes a series of timestamps to the range [0, 1].
"""
min_ts, max_ts = timestamps.min(), timestamps.max()
return (timestamps - min_ts) / (max_ts - min_ts)
@jit(nopython=True)
def calculate_normalized_distances(geometry, x, y):
"""
A JIT-compiled function that calculates the normalized distance between
two arrays of points, lines, or polygons using Euclidean distance.
"""
if geometry.type == ’Point’:
min_x, max_x, min_y, max_y = np.min(x), np.max(x), np.min(y), np.max(
y)
distance_x = (x - min_x) / (max_x - min_x)
distance_y = (y - min_y) / (max_y - min_y)
return np.sqrt(distance_x ** 2 + distance_y ** 2)
elif geometry.type == ’LineString’ or geometry.type == ’MultiLineString’:
distances = []
for i in range(len(x)):
distances.append(np.sum(np.sqrt(np.sum(np.diff(np.vstack((x[i], y
[i])).T, axis=0) ** 2,
axis=1))))
min_distance = np.min(distances)
max_distance = np.max(distances)
return (distances - min_distance) / (max_distance - min_distance)
elif geometry.type == ’Polygon’ or geometry.type == ’MultiPolygon’:
distances = []
for i in range(len(x)):
poly = geometry.buffer(0.00001) # buffer to ensure polygons are
valid
dist = poly.exterior.distance(Point(x[i], y[i]))
distances.append(dist)
min_distance = np.min(distances)
max_distance = np.max(distances)
return (distances - min_distance) / (max_distance - min_distance)
Appendix B. Computational Results
Figure A1.
Windowed Time Lagged Cross Correlation (Right) and Rolling Windowed Time Lagged Cross Correlation (Left) for a subset of variables compared to traffic density.
Figure A1.
Windowed Time Lagged Cross Correlation (Right) and Rolling Windowed Time Lagged Cross Correlation (Left) for a subset of variables compared to traffic density.

Figure A2.
Overall lagged cross-correlations for different variables in the resulting dataset compared to traffic density.
Figure A2.
Overall lagged cross-correlations for different variables in the resulting dataset compared to traffic density.

References
- Azad, S.A.; Wasimi, S.; Ali, A.S. Business data enrichment: Issues and challenges. In Proceedings of the 2018 5th Asia-Pacific World Congress on Computer Science and Engineering (APWC on CSE), Nadi, Fiji, 10–12 December 2018; pp. 98–102. [Google Scholar]
- Clarke, M.; Harley, P. How smart is your content? Using semantic enrichment to improve your user experience and your bottom line. Science 2014, 37, 41. [Google Scholar]
- Belsky, M.; Sacks, R.; Brilakis, I. Semantic enrichment for building information modeling. Comput. Aided Civ. Infrastruct. Eng. 2016, 31, 261–274. [Google Scholar] [CrossRef]
- Bouaicha, S.; Ghemmaz, W. A Semantic Interoperability Approach for Heterogeneous Meteorology Big IoT Data. In Proceedings of the 12th International Conference on Information Systems and Advanced Technologies “ICISAT 2022” Intelligent Information, Data Science and Decision Support System; Springer: Berlin/Heidelberg, Germany, 2023; pp. 214–225. [Google Scholar]
- Bassier, M.; Bonduel, M.; Derdaele, J.; Vergauwen, M. Processing existing building geometry for reuse as Linked Data. Autom. Constr. 2020, 115, 103180. [Google Scholar] [CrossRef]
- Palavalli, A.; Karri, D.; Pasupuleti, S. Semantic internet of things. In Proceedings of the 2016 IEEE Tenth International Conference on Semantic Computing (ICSC), Laguna Hills, CA, USA, 4–6 February 2016; pp. 91–95. [Google Scholar]
- Zhang, L.; Liu, K. Semantic Modeling for Supporting Planning Decision Making toward Smart Cities. In Proceedings of the Construction Research Congress 2022, Arlington, VA, USA, 9–12 March 2022; pp. 272–280. [Google Scholar]
- Božić, B.; Winiwarter, W. A showcase of semantic time series processing. Int. J. Web Inf. Syst. 2013, 9, 117–141. [Google Scholar] [CrossRef]
- Ajuntament de Barcelona. Open Data BCN. Available online: https://opendata-ajuntament.barcelona.cat/en/open-data-bcn (accessed on 13 February 2023).
- Ajuntament de Barcelona. Barcelona Science Plan 2020–2023. Available online: https://www.barcelona.cat/barcelonaciencia/en/who-we-are/city-science-and-knowledge/barcelona-science-plan-2020-2023 (accessed on 13 February 2023).
- Honti, G.M.; Abonyi, J. A review of semantic sensor technologies in internet of things architectures. Complexity 2019, 2019, 6473160. [Google Scholar] [CrossRef] [Green Version]
- Xhafa, F.; Kilic, B.; Krause, P. Evaluation of IoT stream processing at edge computing layer for semantic data enrichment. Future Gener. Comput. Syst. 2020, 105, 730–736. [Google Scholar] [CrossRef]
- Chen, Y.; Sabri, S.; Rajabifard, A.; Agunbiade, M.E.; Kalantari, M.; Amirebrahimi, S. The design and practice of a semantic-enabled urban analytics data infrastructure. Comput. Environ. Urban Syst. 2020, 81, 101484. [Google Scholar] [CrossRef]
- Zappatore, M.; Longo, A.; Martella, A.; Di Martino, B.; Esposito, A.; Gracco, S.A. Semantic models for IoT sensing to infer environment–wellness relationships. Future Gener. Comput. Syst. 2023, 140, 1–17. [Google Scholar] [CrossRef]
- Buchmann, R.A.; Karagiannis, D. Pattern-based transformation of diagrammatic conceptual models for semantic enrichment in the Web of Data. Procedia Comput. Sci. 2015, 60, 150–159. [Google Scholar] [CrossRef] [Green Version]
- Djenouri, Y.; Belhadi, H.; Akli-Astouati, K.; Cano, A.; Lin, J.C.W. An ontology matching approach for semantic modeling: A case study in smart cities. Comput. Intell. 2022, 38, 876–902. [Google Scholar] [CrossRef]
- Xu, Y.; Xiao, W.; Yang, X.; Li, R.; Yin, Y.; Jiang, Z. Towards effective semantic annotation for mobile and edge services for Internet-of-Things ecosystems. Future Gener. Comput. Syst. 2023, 139, 64–73. [Google Scholar] [CrossRef]
- Xue, F.; Wu, L.; Lu, W. Semantic enrichment of building and city information models: A ten-year review. Adv. Eng. Inform. 2021, 47, 101245. [Google Scholar] [CrossRef]
- Amato, F.; Casola, V.; Gaglione, A.; Mazzeo, A. A semantic enriched data model for sensor network interoperability. Simul. Model. Pract. Theory 2011, 19, 1745–1757. [Google Scholar] [CrossRef]
- Jiang, Y.; Su, X.; Treude, C.; Wang, T. Hierarchical semantic-aware neural code representation. J. Syst. Softw. 2022, 191, 111355. [Google Scholar] [CrossRef]
- Ataei Nezhad, M.; Barati, H.; Barati, A. An Authentication-Based Secure Data Aggregation Method in Internet of Things. J. Grid Comput. 2022, 20, 29. [Google Scholar] [CrossRef] [PubMed]
- Iatrellis, O.; Panagiotakopoulos, T.; Gerogiannis, V.C.; Fitsilis, P.; Kameas, A. Cloud computing and semantic web technologies for ubiquitous management of smart cities-related competences. Educ. Inf. Technol. 2021, 26, 2143–2164. [Google Scholar] [CrossRef]
- Ribeiro, M.B.; Braghetto, K.R. A Scalable Data Integration Architecture for Smart Cities: Implementation and Evaluation. J. Inf. Data Manag. 2022, 13. [Google Scholar] [CrossRef]
- Tao, M. Semantic ontology enabled modeling, retrieval and inference for incomplete mobile trajectory data. Future Gener. Comput. Syst. 2023, 145, 1–11. [Google Scholar] [CrossRef]
- Psyllidis, A.; Bozzon, A.; Bocconi, S.; Titos Bolivar, C. A platform for urban analytics and semantic data integration in city planning. In Proceedings of the Computer-Aided Architectural Design Futures. The Next City-New Technologies and the Future of the Built Environment: 16th International Conference, CAAD Futures 2015, São Paulo, Brazil, 8–10 July 2015; Selected Papers 16. Springer: Berlin/Heidelberg, Germany, 2015; pp. 21–36. [Google Scholar]
- Costa, C.; Santos, M.Y. The SusCity big data warehousing approach for smart cities. In Proceedings of the 21st International Database Engineering & Applications Symposium, Bristol, UK, 12–14 July 2017; pp. 264–273. [Google Scholar]
- Boker, S.; Xu, M.; Rotondo, J.; King, K. Windowed cross-correlation and peak picking for the analysis of variability in the association between behavioral time series. Psychol. Methods 2002, 7, 338–355. [Google Scholar] [CrossRef] [PubMed]
Figure 1.
Semantic Data Enrichment.

Figure 3.
Preprocessing flow diagram designed for the use case.

Figure 4.
Geographic sections defined for Barcelona city.

Figure 5.
Comparison of three time series: original traffic density (top), generated normalized NO/NO pollution (middle), and generated normalized public bike availability in Barcelona (bottom).
Figure 5.
Comparison of three time series: original traffic density (top), generated normalized NO/NO pollution (middle), and generated normalized public bike availability in Barcelona (bottom).

Figure 6.
Dashboard for interactivemaps and visualizations. (Right) NO Pollution rates (g/m). (Left) Traffic Density (scalar scale).
Figure 6.
Dashboard for interactivemaps and visualizations. (Right) NO Pollution rates (g/m). (Left) Traffic Density (scalar scale).


Table 1.
Summarized reviewed work.
| Article | Year | Area of Study | Methods | Contributions |
|---|---|---|---|---|
| [11] | 2019 | IoT, & Semantic sensor technologies | Literature review | Semantic sensor technologies improve interoperability and data quality in IoT systems. |
| [12] | 2020 | IoT, & Edge computing | Experimental study | Edge computing is a promising solution for improving the efficiency and effectiveness of semantic data enrichment. |
| [13] | 2020 | Urban Analytics & Semantic-enabled infrastructure | Case study | Semantic-enabled infrastructure can effectively integrate and analyze data from multiple sources, providing valuable insights for urban decision-making. |
| [14] | 2023 | IoT & Semantic models for data analysis | System proposal | Semantic models can lead to a more accurate and efficient analysis of IoT sensor data and valuable insights into how environmental factors impact human well-being. |
| [15] | 2015 | Web of Data & Diagrammatic conceptual models | Pattern-based approach | Pattern-based approach improves web data interoperability. |
| [16] | 2020 | Smart cities & Ontology matching | Case study | Proposed method effectively matches ontologies and resolves semantic mismatches between them. |
| [17] | 2023 | IoT & Semantic annotation | System proposal | Semantic annotations can improve the efficiency and accuracy of data processing in IoT ecosystems and the interoperability of different IoT devices. |
| [18] | 2021 | Building and city information modeling & Semantic enrichment | Literature review | Semantic enrichment improves data interoperability, data quality, and data usability. |
| [19] | 2021 | Semantic sensor technologies & Semantically enriched data model | Experimental study | Semantically enriched data model effectively improves sensor network interoperability. |
| [20] | 2022 | Hierarchical & semantically-aware code representation | System proposal | Incorporating semantic information into code representation improves comprehension of code structure. |
| [21] | 2022 | IoT | Authentication-based secure data aggregation | Proposed a two-tier architecture for secure data aggregation in IoT using symmetric key encryption. |
| [22] | 2021 | Smart Cities | Cloud-based platform, Semantic web technologies, Competency management, Learning management, Assessment tools | Proposed system is flexible, adaptable, and scalable, and has the potential to revolutionize the way we manage competencies in smart city contexts. |
| [23] | 2022 | Smart Cities | Scalable data integration architecture, Three-layer architecture for data collection, processing, and analysis, Case study using real-world data | Proposed architecture is effective and scalable for integrating and analyzing data from multiple sources. |
| [24] | 2023 | Mobile Trajectory Data | Semantic ontology, Probabilistic model for handling missing data, Graph-based retrieval method | Proposed framework is effective and efficient in dealing with incomplete trajectory data and improving trajectory retrieval accuracy. |
| [25] | 2015 | Urban Analytics | Platform for urban analytics and integration of semantic data in city planning | Platform facilitates collaboration among various stakeholders involved in urban planning by providing tools for collecting, analyzing, and visualizing data. |
| [26] | 2017 | Smart Cities | Big data warehousing approach, Three-layer architecture for data ingestion, warehousing, and analytics, Machine learning algorithms for predictive analytics | Approach addresses the challenges of managing and analyzing the large and diverse data generated by smart city systems. |
Table 2.
Datasets used in the case study.
| Dataset | Geographical Locations | Information | Periodicity |
|---|---|---|---|
| Traffic Density (Geographic definition: Lines) | 534 sections of streets defined in the city map of Barcelona | Traffic Density values and Initial Locations in a categorical internal system (from no traffic to jam). | Every 15 min (when there is data available) |
| Pollutants (Geographic definition: Points) | Eight pollution sensors coordinates (points) spread out on Barcelona city | Pollutant Values:
| Every hour (when there is data available) |
| Public Bike Availability (Geographic definition: Points) | 519 public bike system stations | Bike availability number by type:
| Every 20 to 40 s (when there is data available) |
Disclaimer/Publisher’s Note: The statements, opinions and data contained in all publications are solely those of the individual author(s) and contributor(s) and not of MDPI and/or the editor(s). MDPI and/or the editor(s) disclaim responsibility for any injury to people or property resulting from any ideas, methods, instructions or products referred to in the content. |
© 2023 by the authors. Licensee MDPI, Basel, Switzerland. This article is an open access article distributed under the terms and conditions of the Creative Commons Attribution (CC BY) license (https://creativecommons.org/licenses/by/4.0/).
Share and Cite
MDPI and ACS Style
Garcia, E.; Peyman, M.; Serrat, C.; Xhafa, F. Join Operation for Semantic Data Enrichment of Asynchronous Time Series Data. Axioms 2023, 12, 349. https://doi.org/10.3390/axioms12040349
AMA Style
Garcia E, Peyman M, Serrat C, Xhafa F. Join Operation for Semantic Data Enrichment of Asynchronous Time Series Data. Axioms. 2023; 12(4):349. https://doi.org/10.3390/axioms12040349
Chicago/Turabian StyleGarcia, Eloi, Mohammad Peyman, Carles Serrat, and Fatos Xhafa. 2023. "Join Operation for Semantic Data Enrichment of Asynchronous Time Series Data" Axioms 12, no. 4: 349. https://doi.org/10.3390/axioms12040349
Note that from the first issue of 2016, this journal uses article numbers instead of page numbers. See further details here.