Article

Characterization of Positive Cloud to Ground Flashes Observed in Indonesia

1
Department of Electrical Engineering, Andalas University, Padang 25163, Indonesia
2
Department of Electrical, Electronic and Computer Engineering, Gifu University, 1-1 Yanagido, Gifu 501-1193, Japan
*
Author to whom correspondence should be addressed.
Atmosphere 2017, 8(1), 4; https://doi.org/10.3390/atmos8010004
Submission received: 31 October 2016 / Revised: 23 December 2016 / Accepted: 31 December 2016 / Published: 5 January 2017

Abstract

:
The characteristics of 77 electric field changes of positive cloud to ground (CG) flashes in the tropics of Indonesia were investigated. It was found that the arithmetic mean (AM) and geometric mean (GM) values for 0%–100% and 10%–90% rise time were 12.7 μs, 11.9 μs and 6.1 μs, 5.8 μs, respectively. The percentages of single, double, and triple strokes of lightning flashes were 83% (64 cases), 16% (12 cases), and 1% (1 case), respectively. The AM and GM of the interstroke intervals and the return stroke (RS) amplitude ratios were 163.9 ms, 0.29, and 13.3 ms, 0.26, respectively. Furthermore, it was also found that 7 (9%) of 77 positive CG flashes had double peak return stroke waveforms with AM and GM values for 0%–100% and 10%–90% rise time of subsequent return strokes that were 6.7 μs, 6.4 μs and 4.1 μs, 4 μs, respectively. We inferred that these double peaks are produced by two ground terminations with a time interval varying from 7 to 560 μs.

1. Introduction

Downward positive cloud to ground (CG) flashes constitute only about 10% of all ground flashes [1]. Information about positive CG lightning flashes remains scarce in the literature compared to its counterpart, negative CG lightning flashes. However, positive lightning flashes may lead to more damage to electric power and telecommunication systems than negative lightning flashes. Further, they have properties that are different from those of negative lightning flashes, such as high peak current, and differences in the number of strokes per flash, continuing current, charge transfer, leader propagation, and branch patterns [2,3,4,5]. Generally, a downward leader has many branches. The main leader branch usually induces an upward leader from the ground and eventually produces a return stroke to ground termination. For negative CG flashes, several researchers have reported that the downward leaders with many branches are able to produce different ground terminations, which are separated by several tens to hundreds of meters [6,7,8,9,10,11,12]. Two ground terminations of a stroke occurring within several microseconds with a separation distance of hundreds of meters are difficult to identify by a lightning location system [13]. To identify strokes producing multiple ground terminations, return stroke parameters such as rise time, interstroke interval, and amplitude ratio need to be examined.
This paper reports an investigation of return stroke characteristics of positive CG lightning flashes, such as rise time, number of return stroke, interstroke interval and subsequent to first return stroke amplitude ratio in the tropics of Indonesia. Comparison of our observation results with those from the limited number of previous studies in other geographic regions is provided. In addition, this paper also reports on the electric field waveforms of the positive CG return strokes that have multiple ground terminations. As far as we know, there has been no report in the literature about the multiple terminations of positive return strokes produced by one downward leader with several branches.

2. Instrumentation and Data

The data analyzed in this study were recorded on 31 thunderstorm days from May to October, 2014, which produced 77 positive CG flashes. Our measurement station at the Lightning Station in Padang was located on the roof of the four-story Electrical Engineering Building at the Andalas University (−0.98° N and 100.3° E) at an altitude of about 311 m above sea level and 13 km away from Padang Beach at the Indian Ocean. The measurement system was designed to record broadband electric field changes. All waveforms were sensed by a circular flat-plate parallel antenna (E) that was connected to buffer electronics and digitized with a 12-bit digitizing oscilloscope with a sampling rate of 1 MS/s and 32 Megabyte of memory. The record length was 1 s including a pretrigger time of 400 ms. The instrumentation decay time constant was 100 ms for the electric field antenna. The oscilloscope trigger level was ±1.5 V in exiting window trigger mode to capture signals of both polarities. The measurement system used in this study was similar to that used by Hazmi et al. [14].

3. Results and Discussion
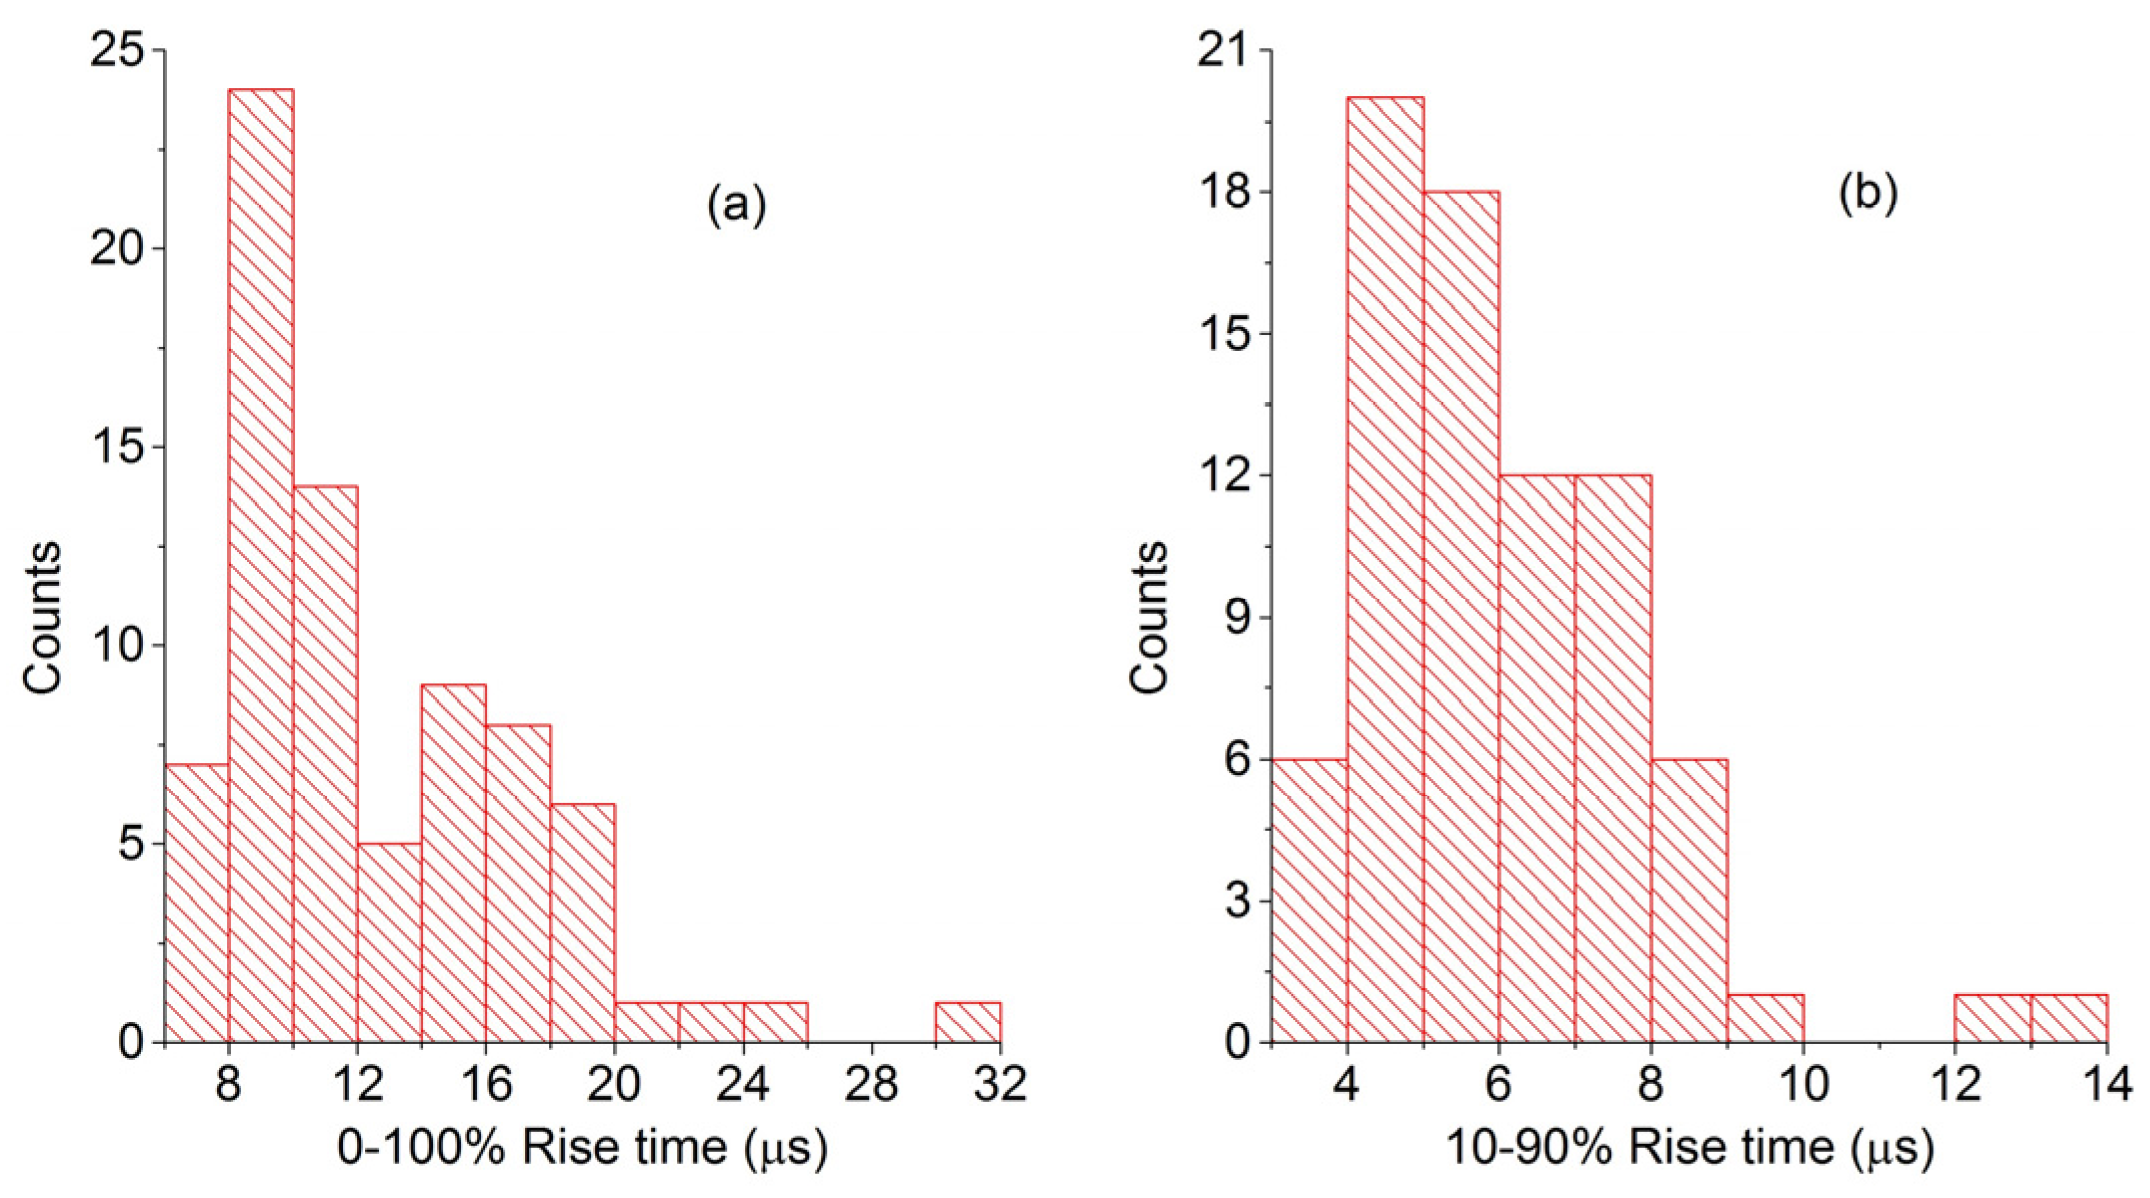
In this study, we used the physics sign convention to analyze the characteristics of positive CG flashes such as rise time, number of stroke, interstroke interval, and stroke amplitude ratio.

3.1. Rise Time

The rise time is the time interval that relates to the values of 0%–100% and 10%–90% of the peak amplitude of the electric field change. Our arithmetic mean (AM) and geometric mean (GM) values for 0%–100% and 10%–90% rise time were 12.7 μs, 11.9 μs, and 6.1 μs, 5.8 μs, respectively, within the range of 6–31.5 μs and 3.4–13.2 μs, respectively. The rise time distribution of the return strokes is displayed in Figure 1. Qie et al. [10] reported that the 10%–90% rise time values varied from 2.4 to 16.4 μs in Da Hinggan Ling, China. Table 1 shows that other authors reported that the AM 10%–90% rise times of first return strokes recorded in Japan [15], Sweden [16], Brazil [17], and Da Hinggan Ling [5] in summer were 6.7 μs, 6.2 μs, 5.7 μs, and 7.77 μs, respectively. Compared to other locations, our AM 10%–90% rise time was longer than that recorded in Brazil and shorter than at other locations.

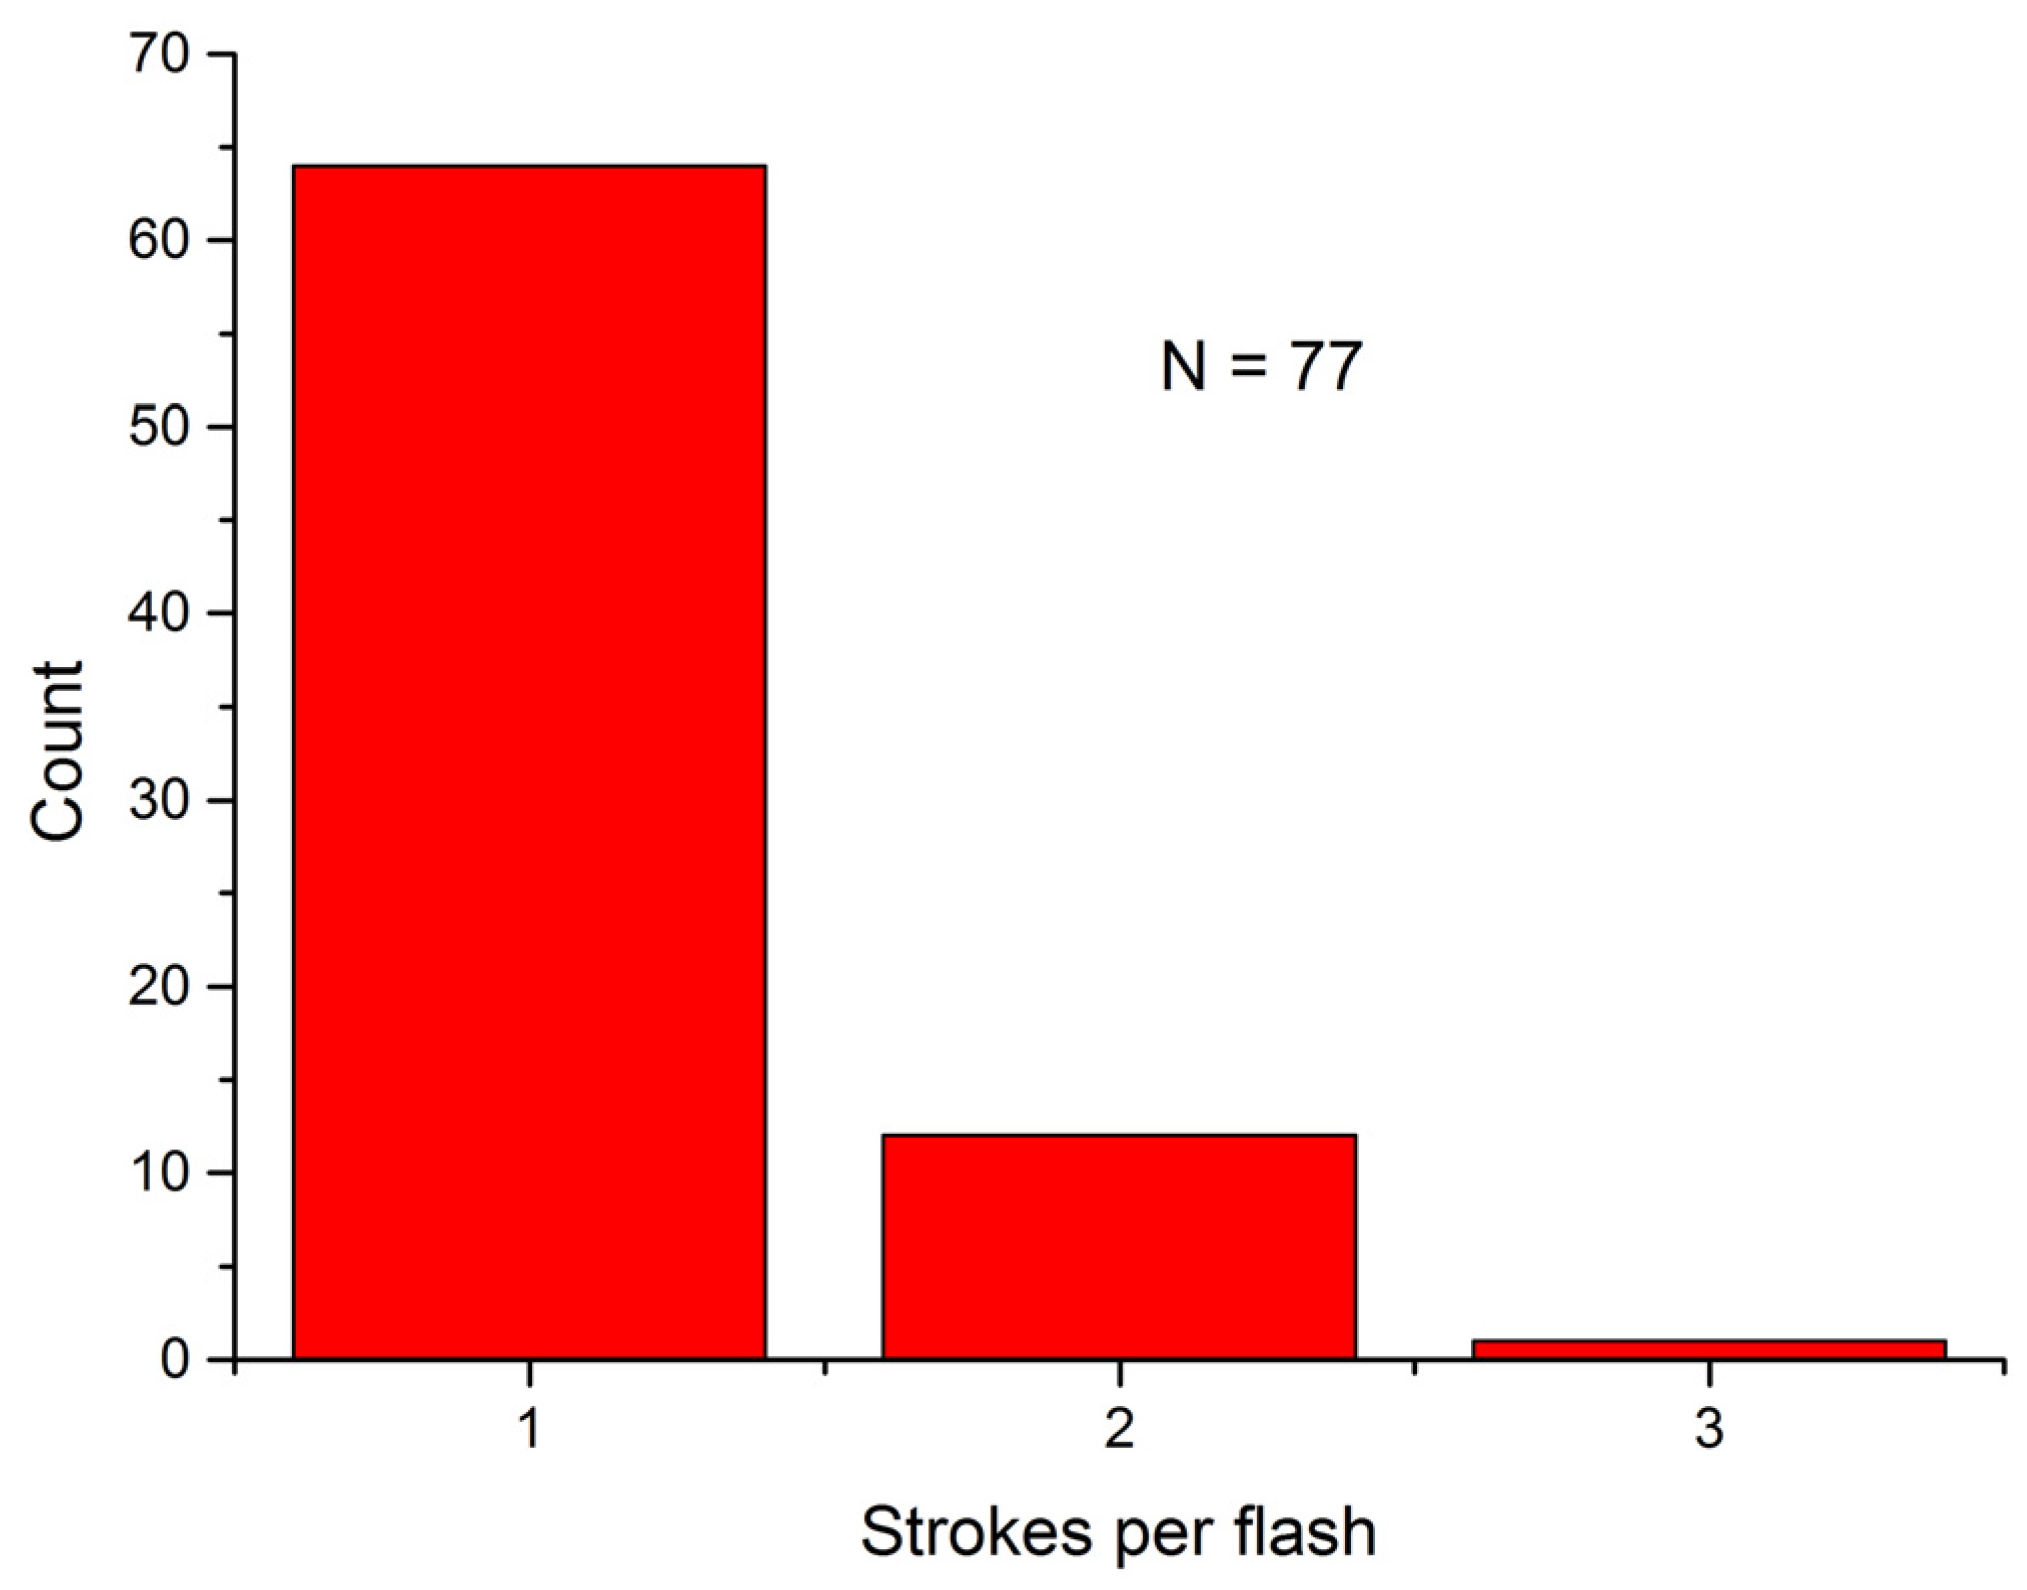
3.2. Number of Strokes

One of the return stroke electric field waveforms of two return strokes, marked RS1 and RS2, preceded by preliminary breakdown (PB) recorded in Indonesia is shown in Figure 2. Table 2 provides a comparison with other research studies at different locations with variations in latitude. This study revealed that the percentage of single, double, and triple strokes of lightning flashes in Indonesia was 83% (64 cases), 16% (12 cases), and 1% (1 case), respectively. The distribution of the number of strokes per flash in Indonesia is displayed in Figure 3. In this study, the average number of strokes per flash was 1.18. The AM values reported by Fleenor et al. [18], Saba et al. [3], Nag et al. [4], Qie et al. [5], and Baharuddin et al. [19] were 1.04, 1.2, 1.2, 1.06, and 1.5, respectively. All observation results showed that the AM values of stroke per flash for different locations are almost identical to each other.

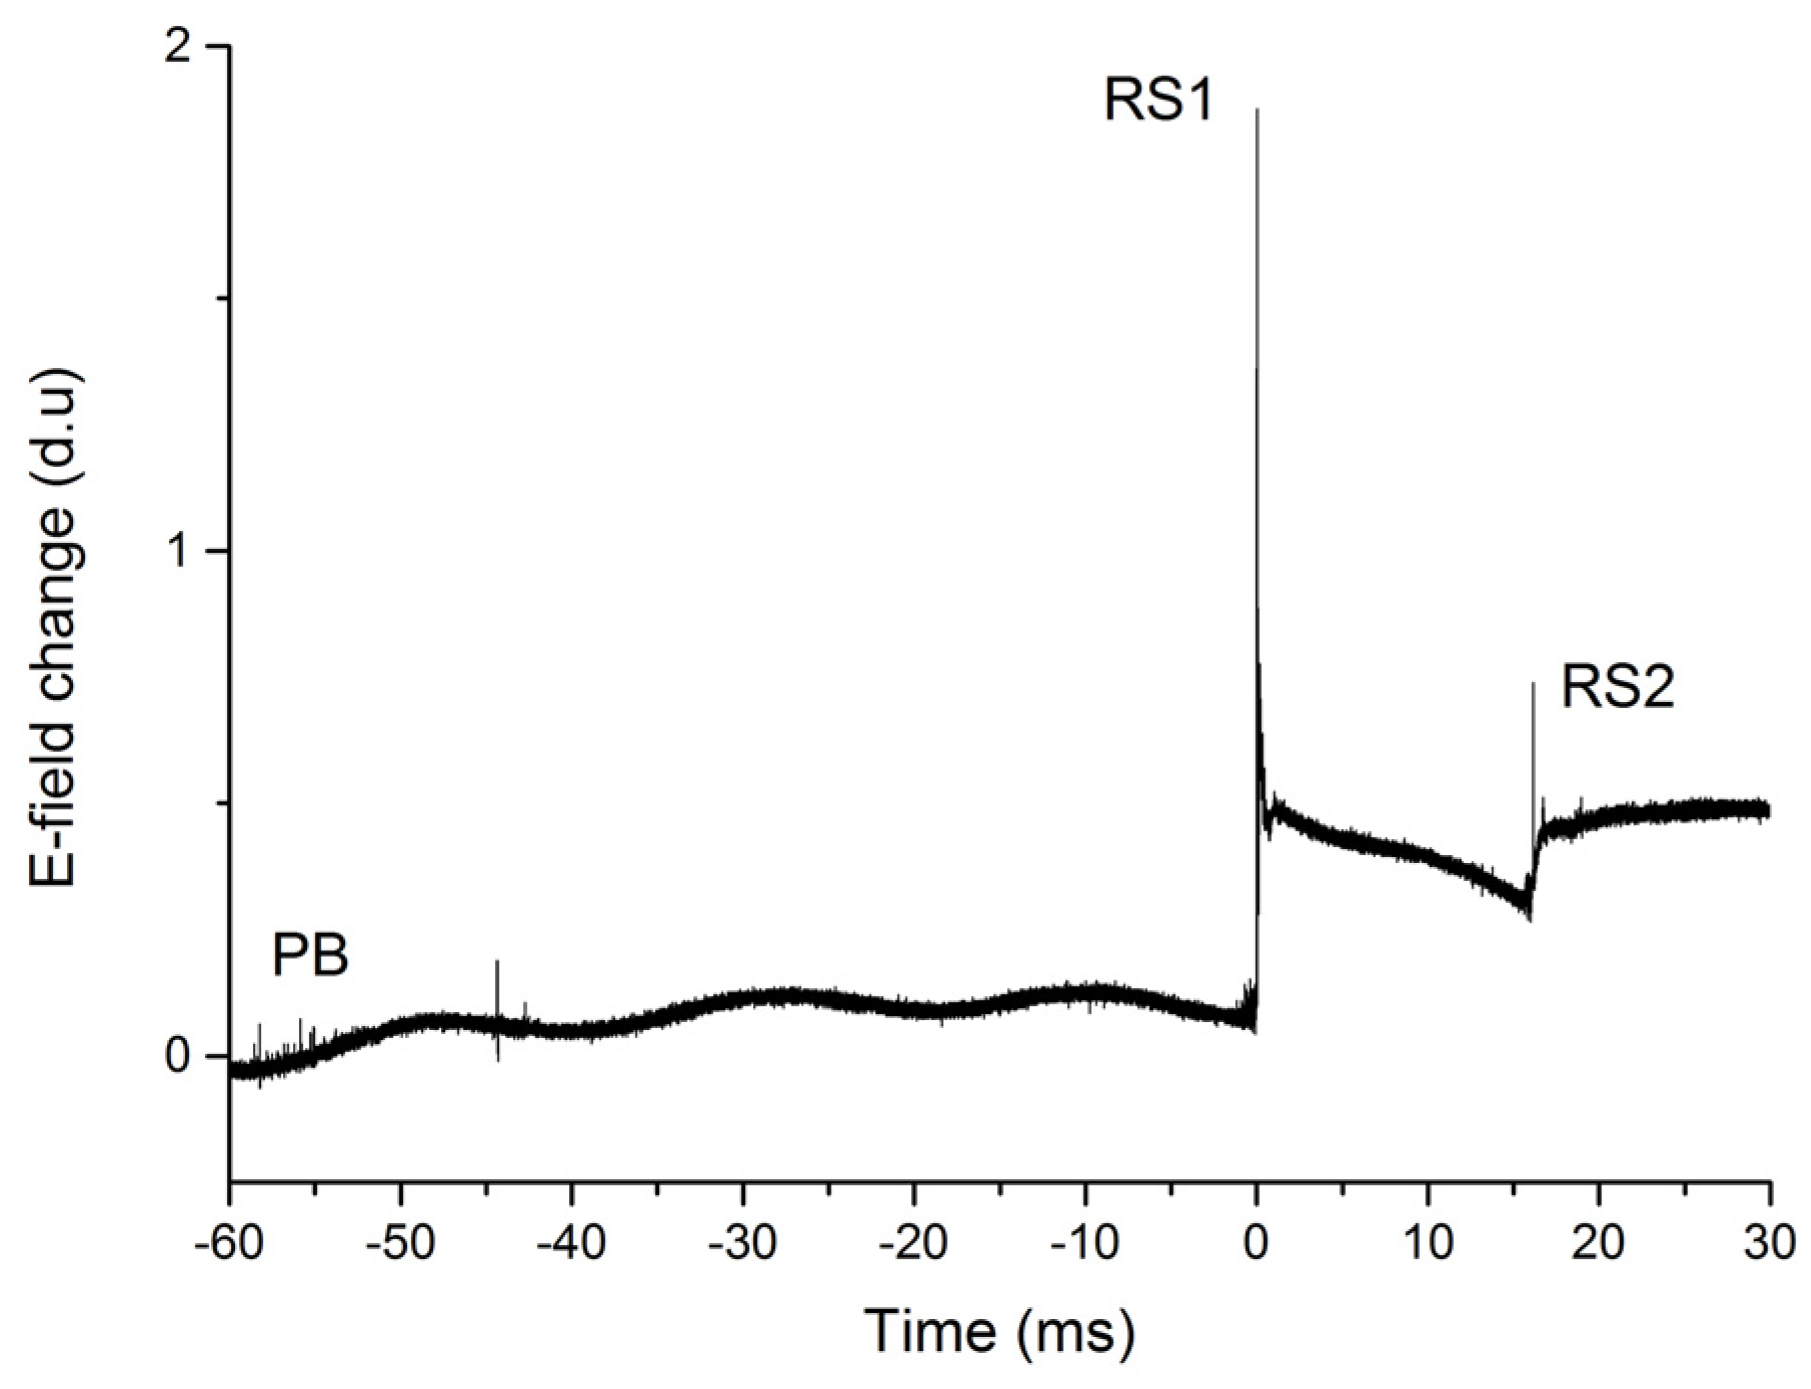
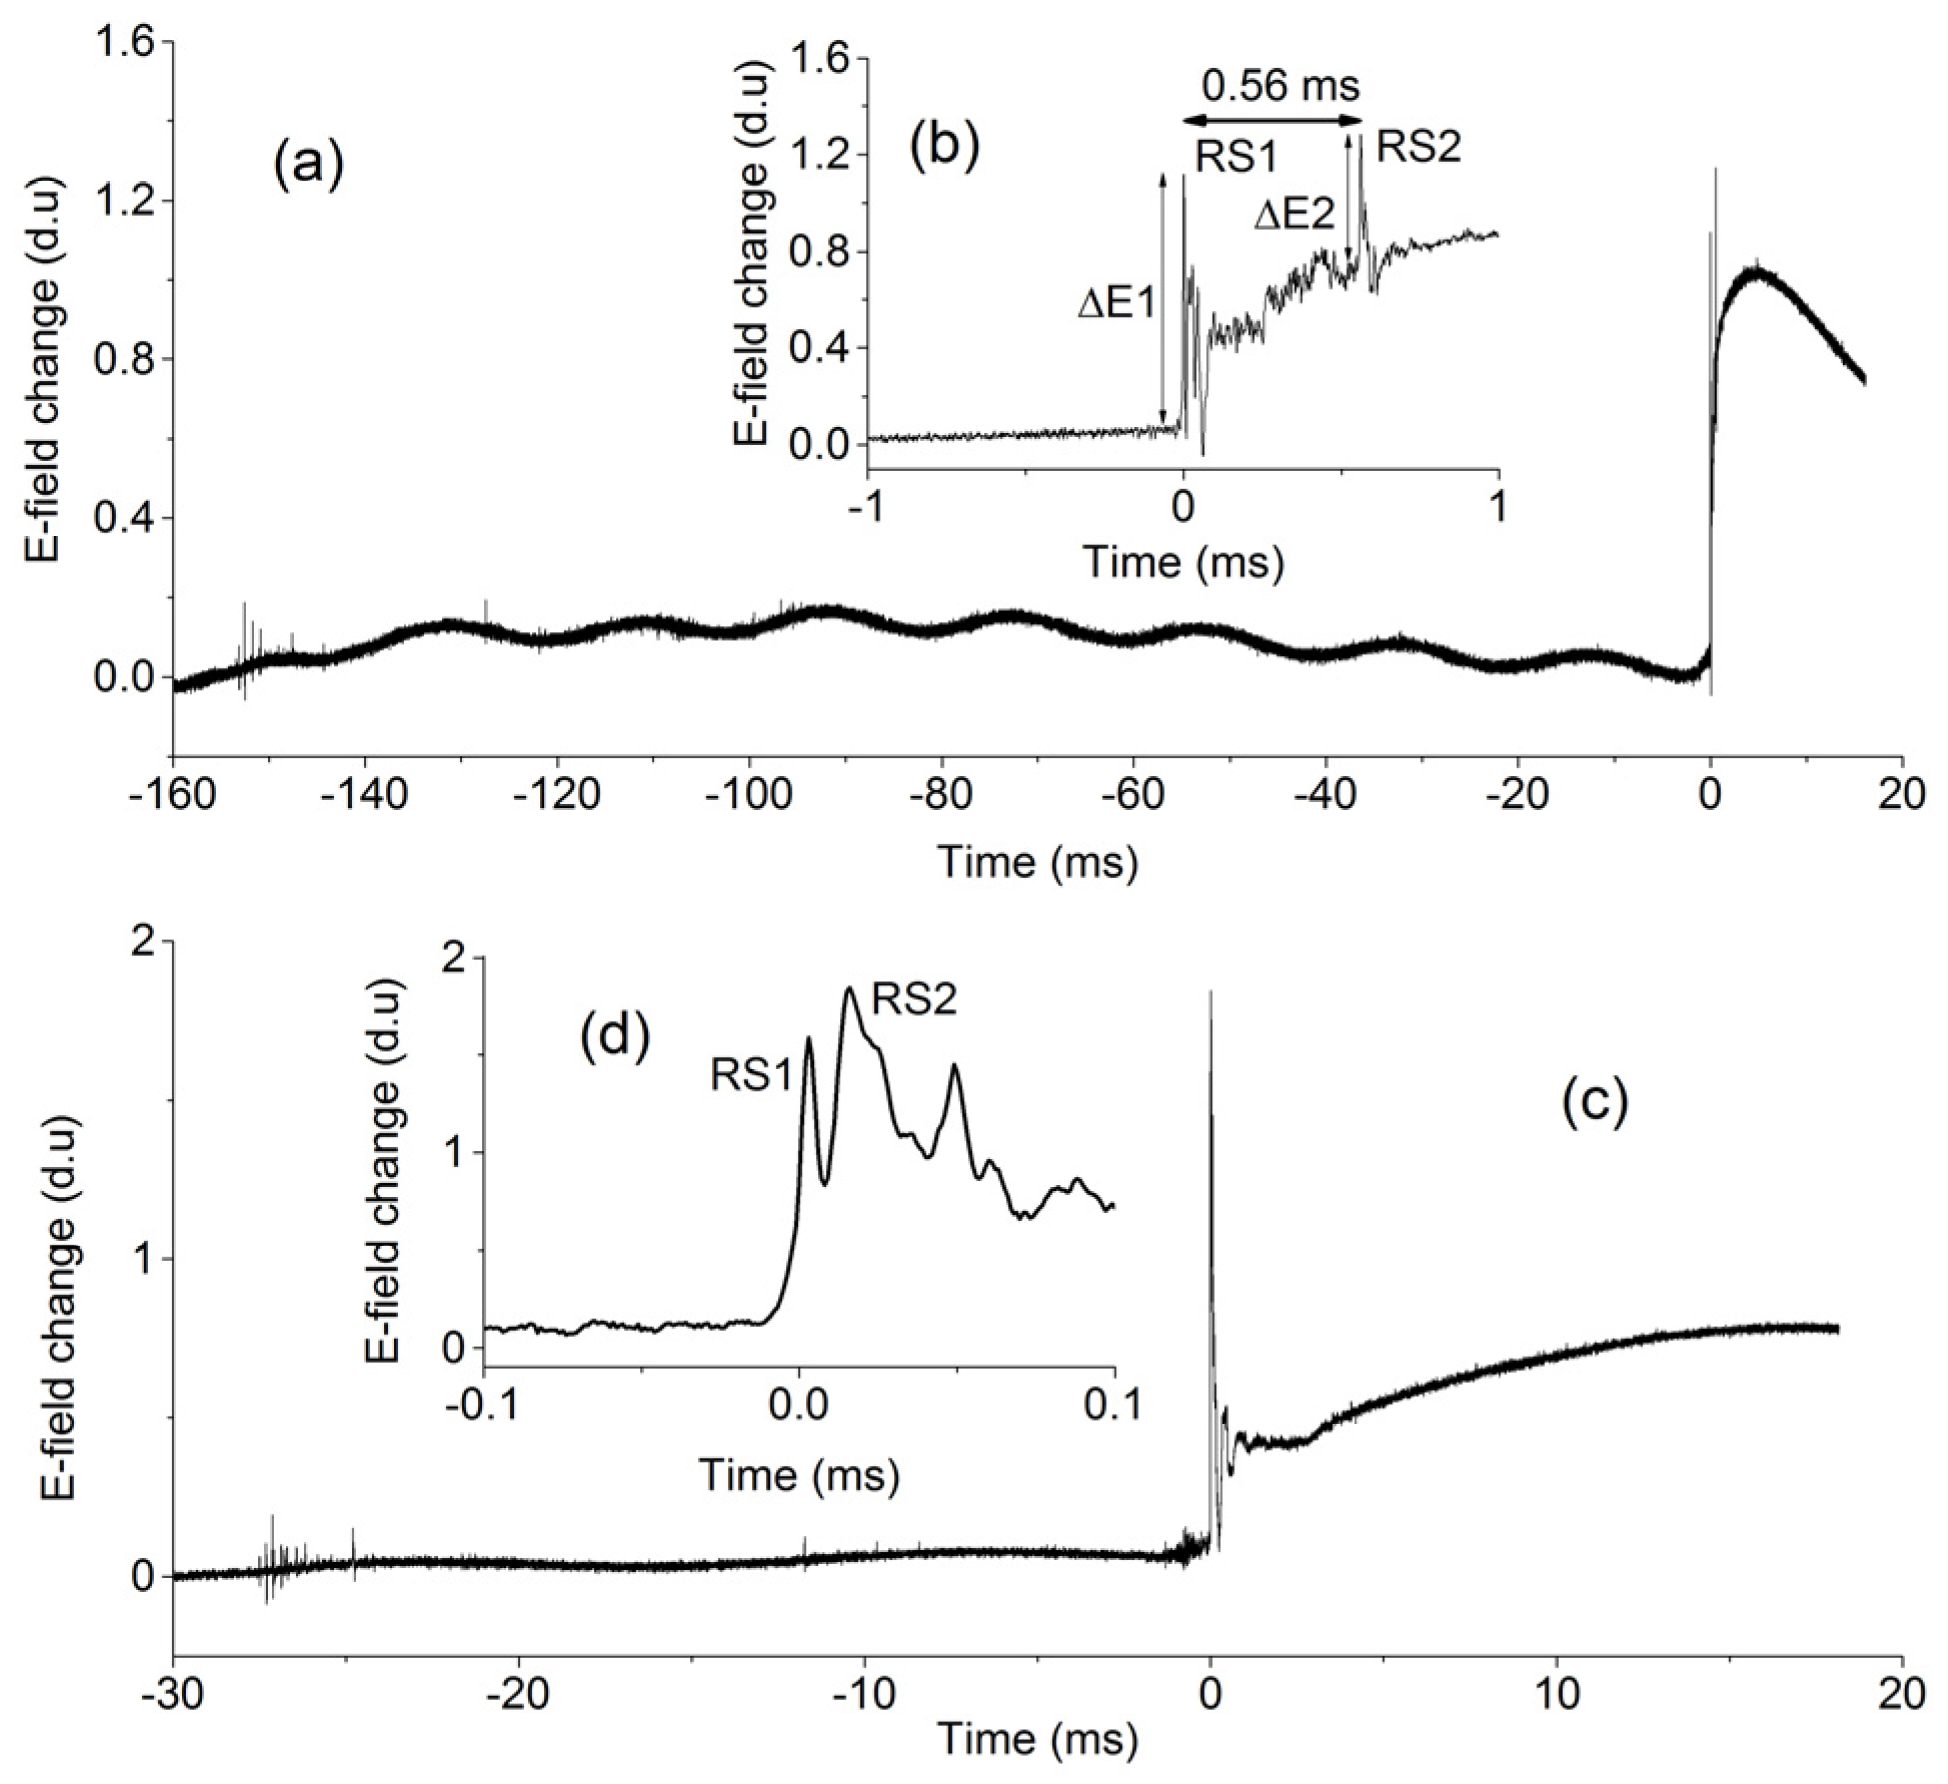
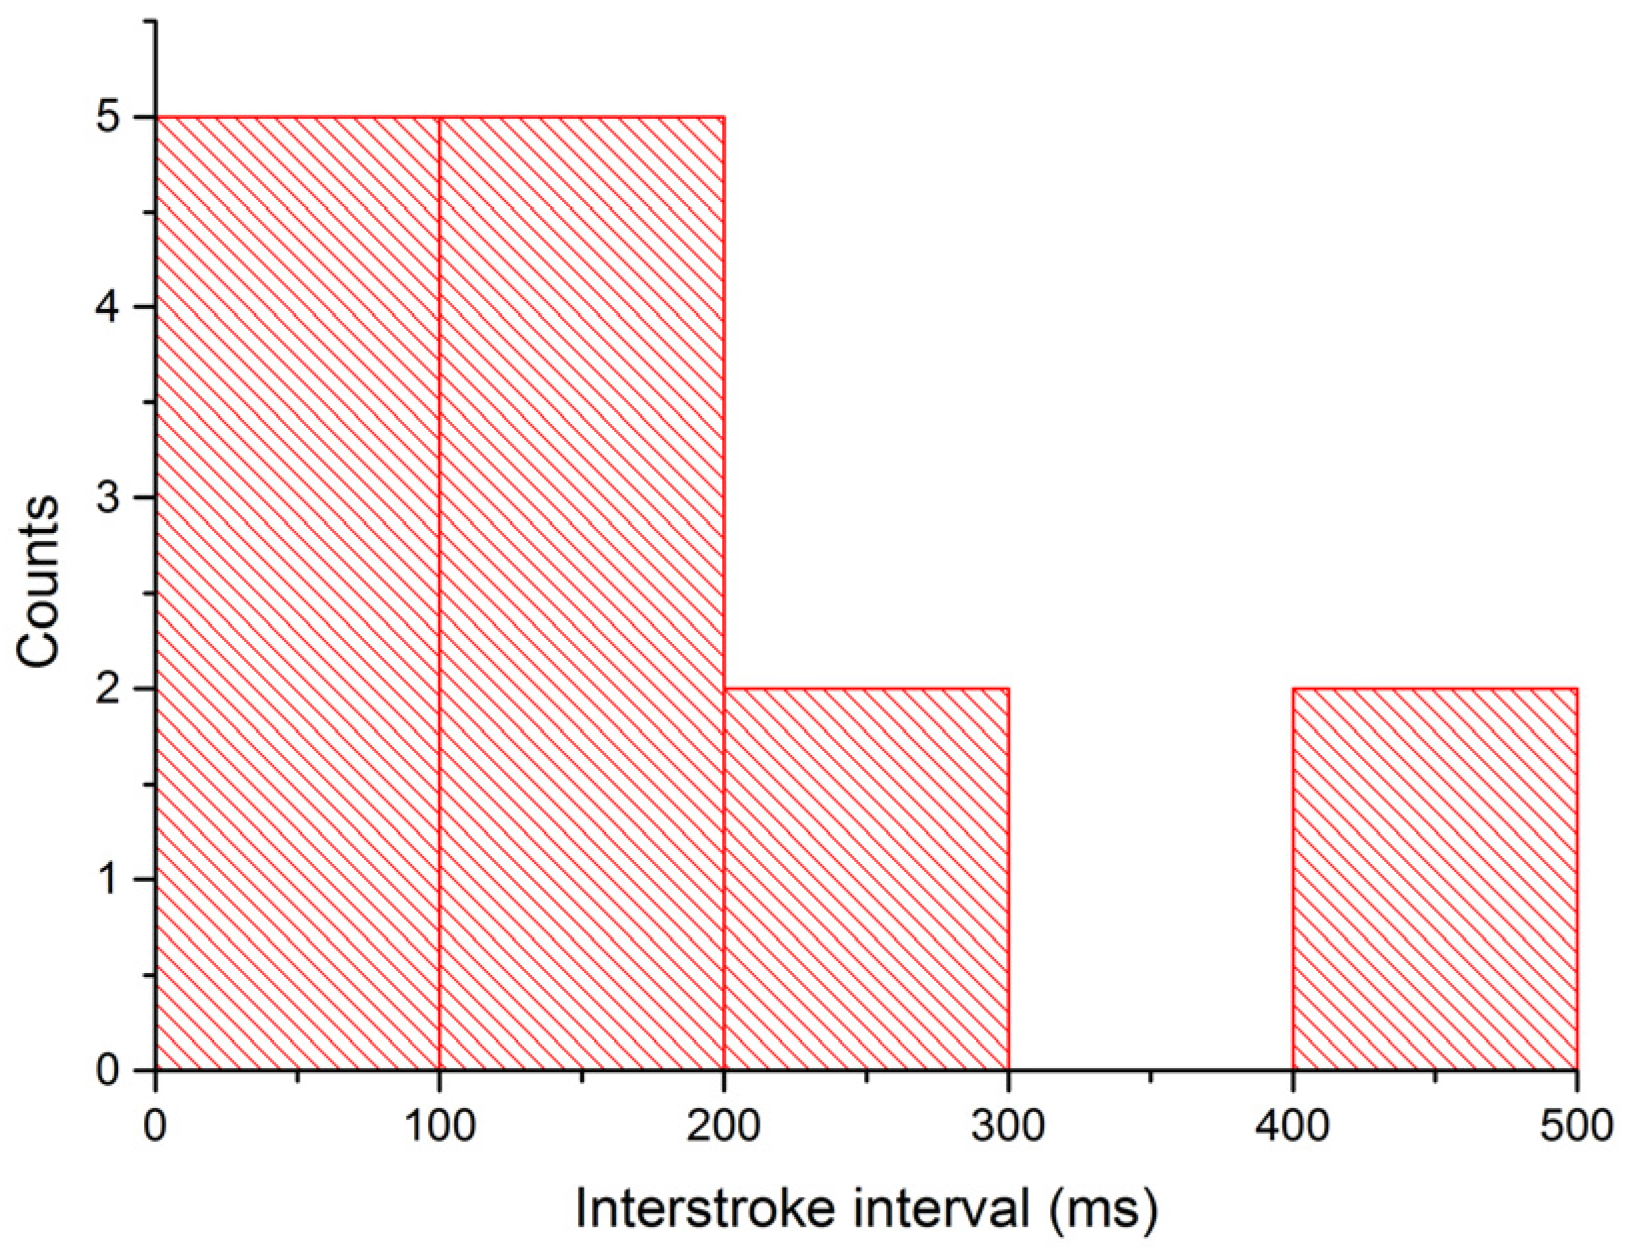
3.3. Interstroke Interval

The interstroke interval is one of the most important parameters of positive ground flash characteristics. In this study, we analyzed 91 strokes of 77 positive CG flashes. Figure 2 shows multiple stroke to ground created interstroke intervals and Figure 4 displays a single stroke showing a double waveform of return stroke to ground with a very short time interval. Table 2 and Table 3 display interstroke and time interval of strokes in positive CG flashes within 1 s. The obtained results showed that the AM and GM, and minimum and maximum interstroke intervals were 163.9 ms, 113.3 ms, 16 ms, and 458 ms, respectively. For comparison, the minimum value found by Saba et al. [3], Nag et al. [4], Qie et al. [5], and Baharuddin et al. [19] were 14, 8.5, 6.46, and 2.9 ms, respectively. The interstroke interval distribution of the return strokes is displayed in Figure 5. Our minimum value was higher than from other locations. In addition, Hazmi et al. [20] measured an AM time interval of negative CG flashes in Indonesia of 55.34 ms. This indicates that the time intervals of positive CG flashes in Indonesia are different from those of negative CG flashes.
Furthermore, 7 (9%) of 77 positive CG flashes had double peak return stroke waveforms based on the electric field antenna measurements. Typical double peak electric field waveforms of two return strokes are shown in Figure 4. In this study, due to the absence of auxiliary data sources such as high speed camera, TV, and very high frequency (VHF) lightning location, in order to identify the double electric field showing two fast rising waveforms, the two terminations return strokes were analyzed using very common return stroke parameters (i.e., time interval, stroke amplitude ratio and rise time), as shown in Table 3. From Table 3, the time interval between two terminations return strokes varied from 7 μs to 560 μs with AM and GM values at about 101 μs and 18 μs, respectively. Making a comparison with negative CG flashes, several authors [6,8,9,10,21,22] found that the time interval between branches in negative CG flashes varied from 4 μs to 5 ms, as shown in Table 4. Additionally, the ratio of the electric field change (ΔE2) of the subsequent termination return stroke to the electric field change (ΔE1) of the first termination return stroke varied from 0.19 to 0.71. Our ratio values showed that the amplitude of the first termination return stroke was higher than that of the subsequent termination return stroke. Our AM and GM values for 0%–100% and 10%–90% rise time for the first termination return stroke were 13.24 μs, 12.92 μs and 5.96 μs, 5.79 μs, respectively. Meanwhile, the AM and GM values for 0%–100% and 10%–90% rise time of the subsequent termination return stroke were 6.7 μs, 6.4 μs and 4.1 μs, 4 μs, respectively.
For comparison, Qie et al. [5] found in China that the AM for 0%–100% rise time of the first and subsequent return strokes were 13.96 μs and 6.6 μs, respectively. Our observation results for the double peak waveforms indicated that the rise times of the first and subsequent termination return strokes were similar to the observation results as reported by Qie et al. [5]. We speculate that the very short time interval (smaller than 1 ms) indicates that the single stroke induced two terminations on the ground simultaneously. This rare occurrence may be produced by a same-stepped leader with many branches that creates two different terminations on the ground. Further study is needed to get a better understanding of double waveform return strokes of positive CG flashes using an electric field antenna, a high speed camera, and a VHF lightning imaging system simultaneously.

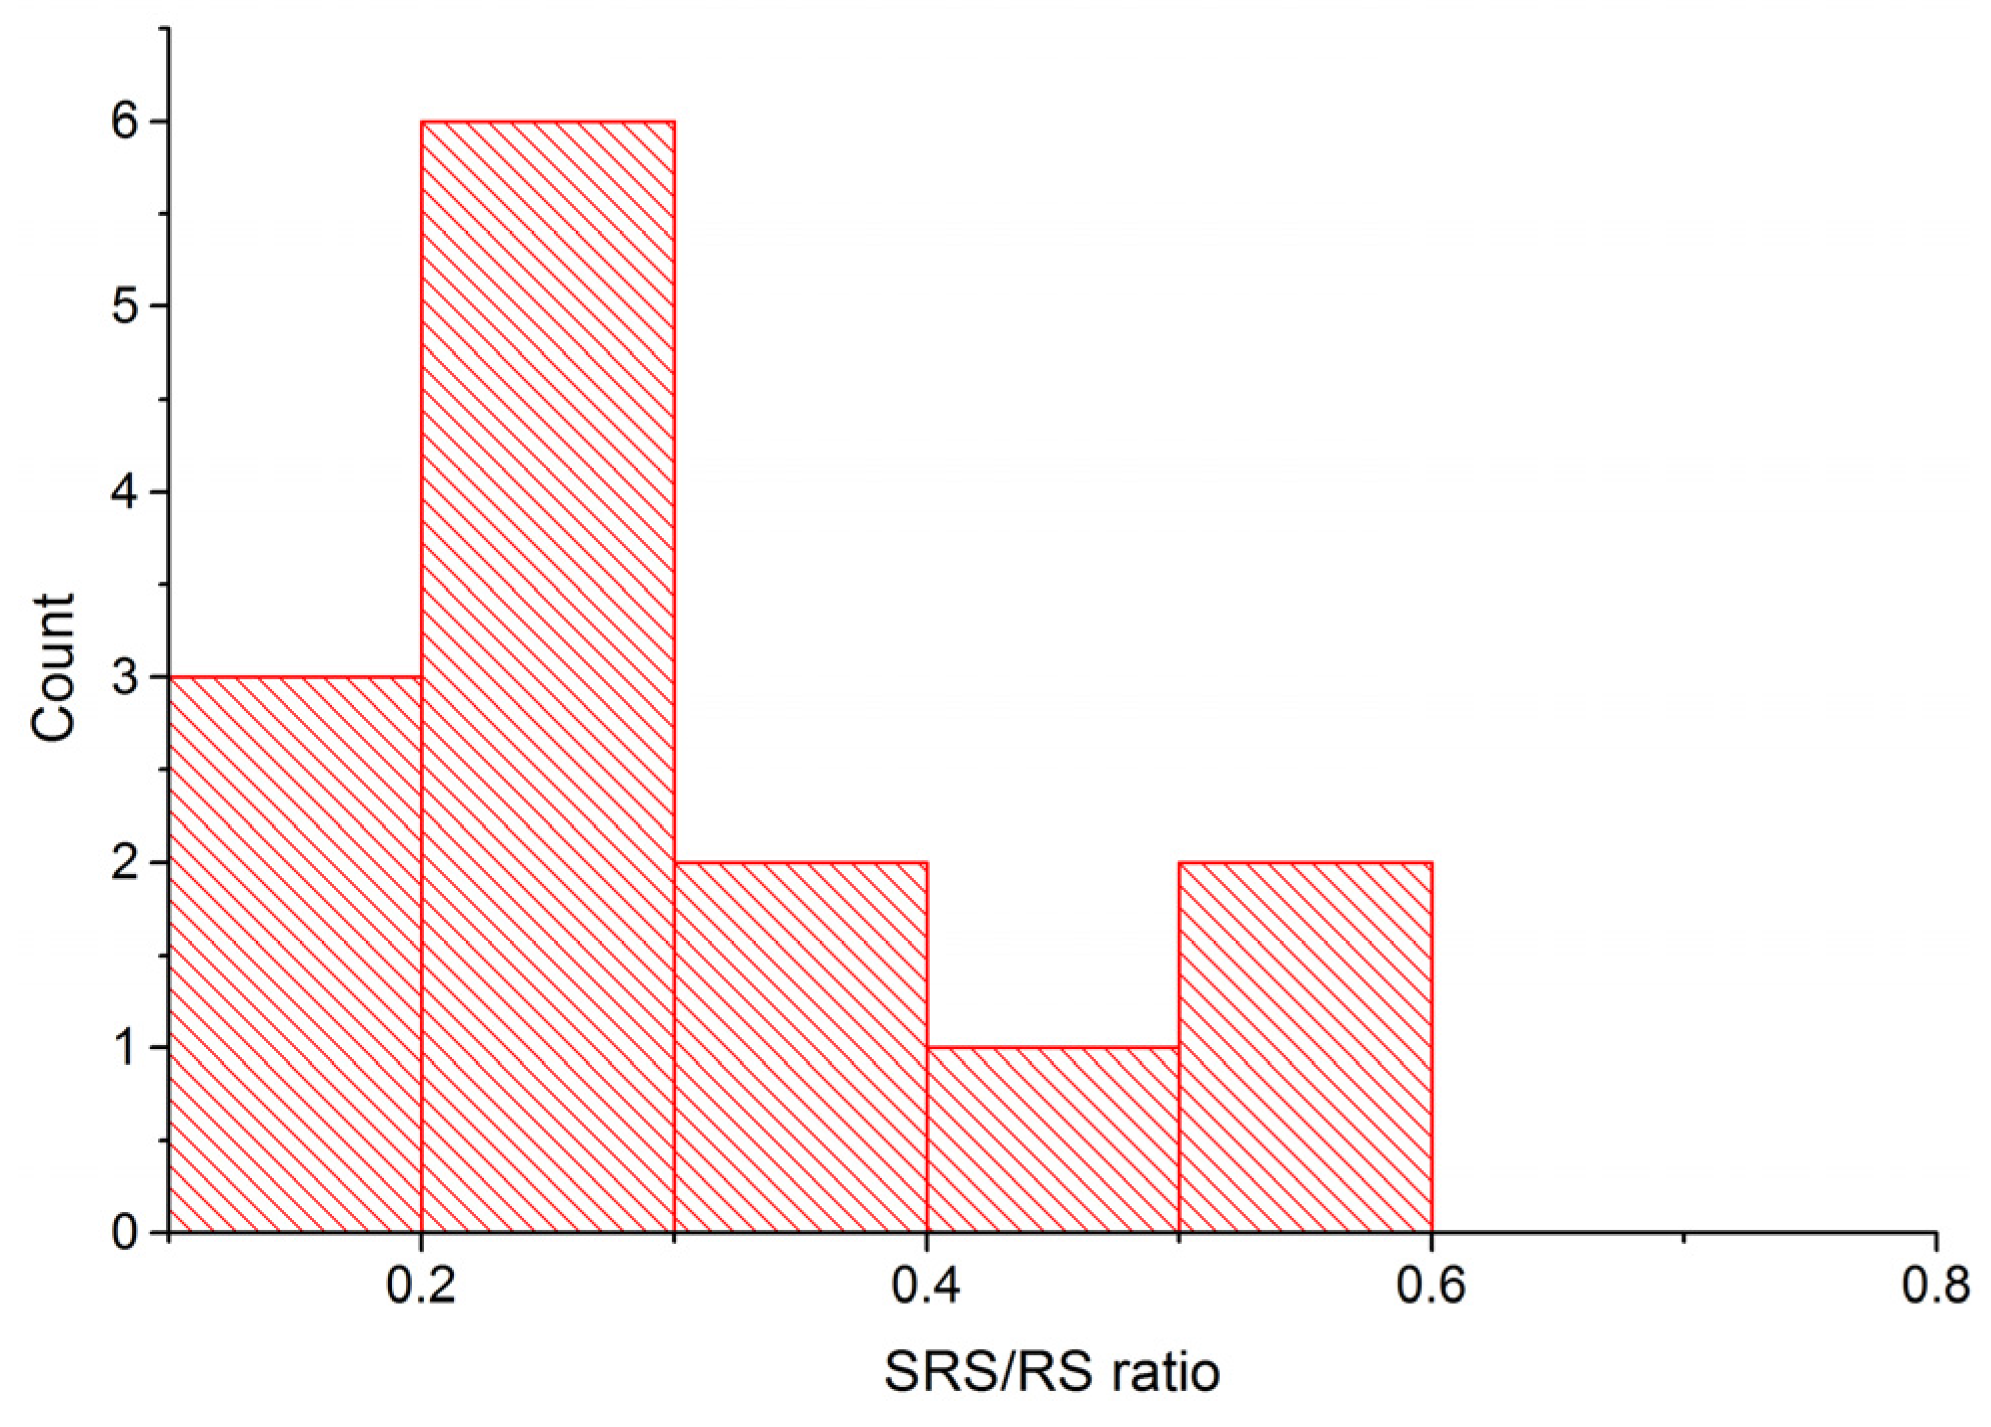
3.4. Return Stroke Amplitude Ratio

The most important parameter of electric field radiation is return stroke amplitude. Generally, the first return stroke electric field peak is a factor of 2–3 larger compared to that of the subsequent return stroke [11,19]. The summary of the electric field peak ratios of subsequent return stroke to first return stroke (SRS/RS) are displayed in Table 5. In this study, 14 subsequent return stroke electric fields were analyzed. Our AM, GM, and SD values of the electric field amplitude ratio obtained were 0.29, 0.26, and 0.13, respectively. Meanwhile, the minimum, median, and maximum values of the electric field amplitude ratio were 0.11, 0.25, and 0.53, respectively. Figure 6 shows the distribution of the electric field amplitude ratios. We did not find that subsequent return strokes were larger than the first return strokes. This has also been reported in a previous study by Baharudin et al. [19], where, in Sweden, they found AM, SD, GM, minimum, median, and maximum values of 0.48, 0.36, 0.36, 0.05, 0.52, and 3.7, respectively. The subsequent to first return stroke amplitude ratio distribution is shown in Figure 6. Compared with the values reported by Baharudin et al., our AM and GM values were smaller. Further, our minimum and maximum values were in the range as reported by Baharudin et al. In addition, a previous study of negative CG flashes reported by Hazmi et al. [20], conducted at the same location, found AM, SD, GM, minimum, and maximum values of 0.36, 0.27, 0.3, 0.05, and 2.97, respectively. It was found that 2% of subsequent return strokes were larger than the first return strokes in the negative CG flashes. Compared with the values reported by Hazmi et al., our AM and GM values were quite similar. Thus, these observation results were found to be in good agreement with the previous study. The differences may be due to limited data and different thunderstorm types between the two locations.

4. Conclusions

Return stroke parameters such as stroke rise time, number of strokes, interstroke interval, and stroke amplitude ratio were examined. It was found that the AM and GM values for 0%–100% and 10%–90% rise time were 12.7 μs, 11.9 μs and 6.1 μs, 5.8 μs, respectively. The percentages of single, double, and triple strokes of lightning flashes were 83%, 16%, and 1%, respectively. The AM and GM values of the interstroke intervals and the RS amplitude ratios were 163.9 ms, 0.29 and 13.3 ms, 0.26, respectively. We also found that 7 (9%) of 77 positive CG flashes had double peak return stroke waveforms with AM and GM values for 0%–100% and 10%–90% rise time of the subsequent return stroke at 6.7 μs, 6.4 μs and 4.1 μs, 4 μs, respectively. The AM and GM values for the time interval between the return strokes of two simultaneous terminations produced by the same stepped leader were 101 μs and 18 μs, respectively, with time variation from 7 μs to 560 μs. The information about multiple ground terminations is very useful for lightning protection and detection in order to minimize the risk of lightning strokes to grounded objects and properties. Each new ground termination may cause damage to properties, structures, or people. Further research is needed to investigate this issue.

Acknowledgments

This work was supported by International Research Collaboration and Scientific Publication grant with No. 04/H.16/KLN-PI/LPPM/2016, Indonesia. Thanks go to our student members of the High Voltage Laboratory (Tony Febriansyah and Rama Danil Fitra) for their help in carrying out the initial data analysis.

Author Contributions

Ariadi Hazmi selected and examined the data, and prepared the manuscript. Primas Emeraldi and Muhammad Imran Hamid operated and maintained the instruments in the project and contributed to the discussion of the results. Nobuyuki Takagi provided the facilities and recommendation on the project, and contributed to the discussion of the results. Daohong Wang participated in data analysis, contributed to the discussion of the results, and drafted the manuscript.

Conflicts of Interest

The authors declare no conflict of interest.

References

  1. Rakov, V.A.; Uman, M.A. Lightning: Physics and Effects; Cambridge University Press: New York, NY, USA, 2003. [Google Scholar]
  2. Berger, K. Novel observations on lightning discharges: Results of research on Mount San Salvatore. J. Frankl. Inst. 1967, 283, 478–525. [Google Scholar] [CrossRef]
  3. Saba, M.M.F.; Schulz, W.; Warner, T.A.; Campos, L.Z.S.; Schumann, C.; Krider, E.P.; Cummins, K.L.; Orville, R.E. High-speed video observations of positive lightning flashes to ground. J. Geophys. Res. 2010, 115, D24201. [Google Scholar] [CrossRef]
  4. Nag, A.; Rakov, V.A. Positive lightning: An overview, new observations, and inferences. J. Geophys. Res. 2012, 117, D08109. [Google Scholar] [CrossRef]
  5. Qie, X.; Wang, Z.; Wang, D.; Liu, M.; Xuan, Y. Characteristics of positive cloud-to-ground lightning in Da Hinggan Ling forest region at relatively high latitude, northeastern China. J. Geophys. Res. Atmos. 2013, 118, 13393–13404. [Google Scholar] [CrossRef]
  6. Rakov, V.A.; Uman, M.A. Origin of lightning electric field signatures showing two return-stroke waveforms separated in time by a millisecond or less. J. Geophys. Res. 1994, 99, 8157–8165. [Google Scholar] [CrossRef]
  7. Willett, J.C.; Levine, D.M.; Idone, V.P. Lightning-channel morphology revealed by return-stroke radiation-field wave-forms. J. Geophys. Res. 1995, 100, 2727–2738. [Google Scholar] [CrossRef]
  8. Ballarotti, M.G.; Saba, M.M.F.; Pinto, O., Jr. High-speed camera observations of negative ground flashes on a millisecond-scale. Geophys. Res. Lett. 2005, 32, L23802. [Google Scholar] [CrossRef]
  9. Qie, X.; Kong, X. Progression features of a stepped leader process with four grounded leader branches. Geophys. Res. Lett. 2007, 34, L06809. [Google Scholar] [CrossRef]
  10. Guo, C.; Krider, E.P. The optical and radiation field signatures produced by lightning return strokes. J. Geophys. Res. 1982, 87, 8913–8922. [Google Scholar] [CrossRef]
  11. Takagi, N.; Watanabe, T.; Arima, I.; Ito, H.; Kawasaki, Z.-I.; Nakano, M.; Takeuti, T.; Kinosita, H.; Suzuki, M.; Saikawa, Y. Lightning flash with multiple strikes to ground. Trans. IEE Jpn. 1991, 111, 93–98. (In Japanese) [Google Scholar]
  12. Wang, D.; Takagi, N.; Watanabe, T.; Rakov, V.A.; Uman, M.A. Luminosity waves in branched channels of two negative lightning flashes. J. Atmos. Electr. 2000, 20, 91–97. [Google Scholar]
  13. Stall, C.; Cummins, K.L.; Krider, E.P.; Cramer, J. Detecting multiple ground contacts in cloud-to-ground lightning flashes. J. Atmos. Ocean. Technol. 2009, 26, 2392–2402. [Google Scholar] [CrossRef]
  14. Hazmi, A.; Hendri, Z.; Mulyadi, S.; Tesal, D.; Wang, D.; Takagi, N. Characteristics of electric field change preceding negative first return stroke produced by preliminary breakdown. In Proceedings of the 2013 IEEE International Conference on Information Technology and Electrical Engineering (ICITEE), Yogyakarta, Indonesia, 7–8 October 2013; pp. 322–325. [CrossRef]
  15. Hojo, J.; Ishii, M.; Kawamura, T.; Suzuki, F.; Funayama, R. The fine structure in the field change produced by positive ground strokes. J. Geophys. Res. 1985, 90, 6139–6143. [Google Scholar] [CrossRef]
  16. Cooray, V. A novel method to identify the radiation fields produced by positive return strokes and their submicrosecond structure. J. Geophys. Res. 1986, 91, 7907–7911. [Google Scholar] [CrossRef]
  17. Schumann, C.; Saba, M.M.F.; Da Silva, R.B.G.; Schulz, W. Electric fields changes produced by positives cloud-to-ground lightning flashes. J. Atmos. Sol. Terr. Phys. 2013, 92, 37–42. [Google Scholar] [CrossRef]
  18. Fleenor, S.A.; Biagi, C.J.; Cummins, K.L.; Krider, E.P.; Shao, X.M. Characteristics of cloud-to-ground lightning in warm-season thunderstorms in the Central Great Plains. Atmos. Res. 2009, 91, 333–352. [Google Scholar] [CrossRef]
  19. Baharudin, Z.A.; Cooray, V.; Rahman, M.; Hettiarachchi, P.; Ahmad, N.A. On the characteristics of positive lightning ground flashes in Sweden. J. Atmos. Sol. Terr. Phys. 2016, 138–139, 106–111. [Google Scholar] [CrossRef]
  20. Hazmi, A.; Emeraldi, P.; Hamid, M.I.; Takagi, N. Some characteristics of multiple stroke negative cloud to ground lightning flashes in Padang. Int. J. Electr. Eng. Inform. 2016, 2, 438–450. [Google Scholar] [CrossRef]
  21. Kong, X.Z.; Qie, X.S.; Zhao, Y.; Zhang, T. Characteristics of negative lightning flashes presenting multiple-ground terminations on a millisecond-scale. Atmos. Res. 2009, 91, 381–386. [Google Scholar] [CrossRef]
  22. Sun, Z.; Qie, X.; Liu, M.; Jiang, R.; Wang, Z.; Zhang, H. Characteristics of a negative lightning with multiple-ground terminations observed by a VHF lightning location system. J. Geophys. Res. Atmos. 2016, 121, 413–426. [Google Scholar] [CrossRef]
Figure 1. Histogram of rise time: (a) Distribution of 0%–100% rise time; (b) Distribution of 10%–90% rise time.
Atmosphere 08 00004 g001
Figure 2. Typical multiple strokes of positive cloud to ground (CG) electric field waveform.
Atmosphere 08 00004 g002
Figure 3. Distribution of strokes per flash.
Atmosphere 08 00004 g003
Figure 4. Typical double electric field waveform (a,b); expanded positive CG electric field waveform with very short time interval (c,d).
Atmosphere 08 00004 g004
Figure 5. Interstroke interval histogram for 27 strokes of 13 positive CG flashes.
Atmosphere 08 00004 g005
Figure 6. Distribution of subsequent return stroke to first return stroke (SRS/RS) ratio.
Atmosphere 08 00004 g006
Table 1. Summary of rise time of return stroke waveform characteristics. AM, arithmetic mean; GM, geometric mean.
AuthorsLocationSample Size0%–100% Rise Time (μs)10%–90% Rise Time (μs)
AMGMRangeAMGMRange
This studyIndonesia7712.711.96–31.56.15.83.4–13.2
Hojo et al. [15]Tokyo44---6.7--
Cooray [16]Sweden15---6.2--
208.9-----
Schumann et al. [17]Brazil729.58.9-5.75.2-
Qie et al. [5]Da Hinggan Ling19613.9613.18-7.777.272.4–16.4
Table 2. Comparison of positive CG multiple strokes.
AuthorsLocationSample SizeSingle Stroke Ratio (%)Average Number of Stroke Per FlashInterstroke Interval (ms)
AMGMRange
This studyIndonesia77831.18163.9113.316–458
Fleenor et al. [18]America204961.04-27-
Saba et al. [3]Austria, Brazil, and US103811.2-9414–406
Nag et al. [4]Florida53811.277548.5–201
Qie et al. [5]Da Hinggan Ling18594.591.0697.8364.26.46–290.73
Baharuddin [19]Sweden107631.5116702.9–518
Table 3. Summary of very short interstroke interval characteristics.
No.DateLocal Time (hh:mm:ss)Time Interval (µs)ΔE2/ΔE1Rise Time (µs)
FirstFirstSecondSecond
0%–100%10%–90%0%–100%10%–90%
1.09/05/201422:09:51130.6816.047.6884.6
2.09/05/201422:35:495600.5312.885.6311.075.82
3.09/05/201422:48:2280.3511.944.6442.74
4.12/08/201419:12:10100.4714.977.9363.9
5.24/09/201420:59:43130.3615.986.1585.54
6.25/09/20144:18:1590.717.863.7553
7.25/09/20149:52:4870.1912.985.9453.37
Table 4. The summary of very short time interval of two terminations return stroke.
AuthorsMethodTime Interval (µs)
This study aElectric field antenna7–560
Guo and Krider [10]Electric field antenna and optic46–110
Rakov and Uman [6]Electric field antenna and TV 15–3300
Ballarotti et al. [8]Electric field antenna and high speed camera31–5000
Qie and Kong [9]Electric field antenna and high speed camera4–10
Kong [21]Electric field antenna and high speed camera4–486
Sun et al. [22]Electric field antenna and VHF lightning location1500–2700
a Positive CG.
Table 5. Stroke amplitude ratio.
AuthorNumber of Subsequent StrokeMeanSDGMMinimumMedianMaximum
This study140.290.130.260.110.250.53
Baharudin et al. [19]530.480.360.360.050.523.7
Hazmi et al. [20] a5230.360.270.30.05-2.97
a Indonesia, negative CG strokes.

