

Cloud Characteristics in South China Using Ka-Band Millimeter Cloud Radar Datasets
by
 and
and
Haowen Li
1,2,
Chengyan Mao
1,
Huaiyu Li
2,*,
Jieyi Li
3,
Binghong Chen
2,
Lin Zeng
2,
Jiawen Zheng
2 and
Mingtuan Liu
3 1
Quzhou Meteorological Bureau, Quzhou 324000, China
2
Guangzhou Meteorological Observatory, Guangzhou 511430, China
3
Guangzhou Emergency Early Warning Information Release Center, Guangzhou 511430, China
*
Author to whom correspondence should be addressed.
Atmosphere 2024, 15(4), 486; https://doi.org/10.3390/atmos15040486
Submission received: 23 February 2024
/
Revised: 28 March 2024
/
Accepted: 9 April 2024
/
Published: 15 April 2024
(This article belongs to the Special Issue Cloud Remote Sensing: Current Status and Perspective)
Abstract
:In this study, we investigate the seasonal and diurnal variations in cloud occurrence frequency, as well as cloud vertical structure (CVS) characteristics under different seasons and precipitation intensities over the Guangzhou region in South China, based on the analysis of millimeter-wave cloud radar (MMCR) and ground automatic weather station rainfall observations from May 2019 to August 2021. The results showed that the occurrence frequency of clouds exhibits a bimodal distribution throughout the year, with peaks in March to June and October, reaching its highest occurrence in May at approximately 80% and its lowest from December to February at around 40%. Additionally, there are distinct diurnal variations in occurrence frequency, with the lowest rates occurring around 0005 LST, rapidly increasing after 0006 LST, and peaking during the afternoon to evening hours. Cloud top height (CTH) shows bimodal distributions during the pre-flood and post-flood seasons. The most frequently occurring range of CTH during the pre-flood season is below 3 km, accounting for approximately 43%, while during the post-flood season, it ranges from 11 to 14 km, constituting about 37%. For precipitation clouds, CTH can extend beyond 12 km, with the radar reflectivity decreasing gradually with increasing height. The highest frequencies of radar echoes are observed below 2 km and between 4 and 7 km, exhibiting clear diurnal variations, with echoes mainly below 2 km and between 4 to 6 km during the early morning, intensifying and shifting to higher altitudes during the day and reaching their maximum below 4 km during the afternoon to nighttime hours, while both the frequency and intensity increase in the height range of 4 to 12 km. Vertical profiles of radar reflectivity and cloud ice/liquid water content (IWC/LWC) exhibit similar trends under different precipitation intensities. The main differences are observed below 4 km, where both radar reflectivity and IWC/LWC generally increase with increasing precipitation intensity. These findings contribute to a better understanding of cloud characteristics in the South China region, enhance the accuracy of model simulations, and provide a scientific basis for accurate forecasting and warning of meteorological disasters.
1. Introduction
With the increasing attention to climate change and the global climate system, research on the characteristics of clouds has become increasingly important. Clouds play a crucial role in regulating the Earth’s energy balance, influencing climate and precipitation distribution, and participating in atmospheric chemistry [1,2,3,4]. The microphysical characteristics of clouds have a significant impact on the lifecycle of mesoscale convective systems (MCS) and macroscopic properties such as precipitation. Long-lived MCSs produce 2–3 times more precipitation than short-lived ones, and cloud microphysical characteristics have a very important influence on extreme precipitation [5]. The cloud vertical structure (CVS) can affect atmospheric thermodynamics, dynamics, and water circulation, and can also influence large-scale atmospheric circulation through radiative forcing and latent heat release [6]. Furthermore, cloud statistics are essential for both scheduling observation time for land-based astronomical telescopes and identifying suitable locations for telescope construction [7]. Therefore, monitoring and understanding clouds are of great significance for predicting climate change, improving weather forecasting, coping with extreme weather events, and enhancing astronomical observation.
Currently, there are various methods of cloud detection. Radio sounding can penetrate cloud layers for direct detection, providing accurate vertical profiles of atmospheric elements such as temperature and humidity. This helps in reflecting cloud information at different altitudes, aiding in the study of cloud vertical distribution and structure [8]. Research based on 11 years of radio sounding observations from the Gadanki station in India has found that the vertical structure of clouds, including clouds’ top and bottom heights, cloud layer thickness, and the vertical distribution of multiple cloud layers, can affect large-scale atmospheric circulation by altering adiabatic heating gradients and latent heat release [9]. Analysis of multi-layer cloud structures, cloud top heights, and cloud occurrence rates using 20 years of global sounding data indicates a close relationship between changes in CVS and the positions of subtropical divergence zones and monsoon systems [10]. Analysis of CVS over the Indian Gangetic Plain based on radiosonde and satellite data indicates a significant increase in the frequency of multi-layer clouds during the monsoon season. Additionally, although aerosol-induced heating suppresses the formation of convective clouds over urban clusters, aerosols can trigger convective cloud formation when there is sufficient moisture to form cloud layers [11]. However, radio sounding typically occurs only twice a day, with lower temporal resolution compared to satellites and radars. Balloon drift is influenced by weather conditions such as wind speed and direction, which may affect the accuracy and reliability of data collection [12,13].
Satellites, with their wide coverage and ability of continuous monitoring, are one of the main means of observing clouds [14,15,16]. CloudSat satellite can observe the vertical distribution of clouds, cloud thickness, and the microphysical structure inside clouds, and can differentiate between different types of clouds such as cumulus, stratiform, and convective clouds, making it an important tool for studying cloud vertical structure and evolution [17,18]. CALIPSO is equipped with advanced lidar, which provides high-vertical-resolution cloud structure information, allowing for accurate measurements of cloud top and bottom heights, as well as cloud vertical distribution. This system can even observe cloud structures within dense cloud layers [19,20]. Research based on the new CERES-CloudSat-CALIPSO-MODIS (CCCM) RelD1 dataset indicates significant differences in the vertical structures of clouds of different types. The average coverage of single-layer clouds is nearly four times that of multi-layer clouds. Four types of CVS lead to warming, while eight types lead to cooling [21]. The particle radius and optical thickness of low clouds are well correlated with the columnar number concentration of aerosol particles, and there is a positive correlation between cloud optical thickness and cloud coverage with aerosol column number concentration [22]. However, satellites also have limitations, such as low spatial resolution and the inability to obtain data beneath thick cloud layers [23].
To obtain more accurate detection data, it has become increasingly popular to integrate multiple data sources for comprehensive cloud detection. Results from comparative analyses of different observation data show high consistency between radiosonde- and ground-based remote sensing products [24,25,26]. Ground-based remote sensing detection devices such as lidars, ceilometers, and MMCRs are being increasingly utilized [27,28,29]. MMCRs have high temporal and spatial resolutions, enabling the capture of small-scale cloud structures and variations and continuously acquiring high-precision CVS information [30]. Research based on observations from Ka-band millimeter-wave cloud radar (MMCR) and disdrometers in Xinjiang indicates significant diurnal variations in clouds and precipitation. The most dramatic changes in the physical parameters of precipitation occur in the afternoon to evening, accompanied by lower cloud top and bottom heights and a higher number of cloud layers, mainly due to the influence of wind- and terrain-related temperatures [31]. Studies on the microphysical characteristics of low-level liquid clouds at the Nam Co station on the Qinghai–Xizang Plateau indicate a single-mode distribution of the cloud droplet effective radius, with the most frequent value around 5–7 μm. The distribution of cloud ice/liquid water content (IWC/LWC) also exhibits a single-peak shape, with the most frequent value below 0.2 g m−3. Both the cloud droplet effective radius and the LWC increase with height [32].
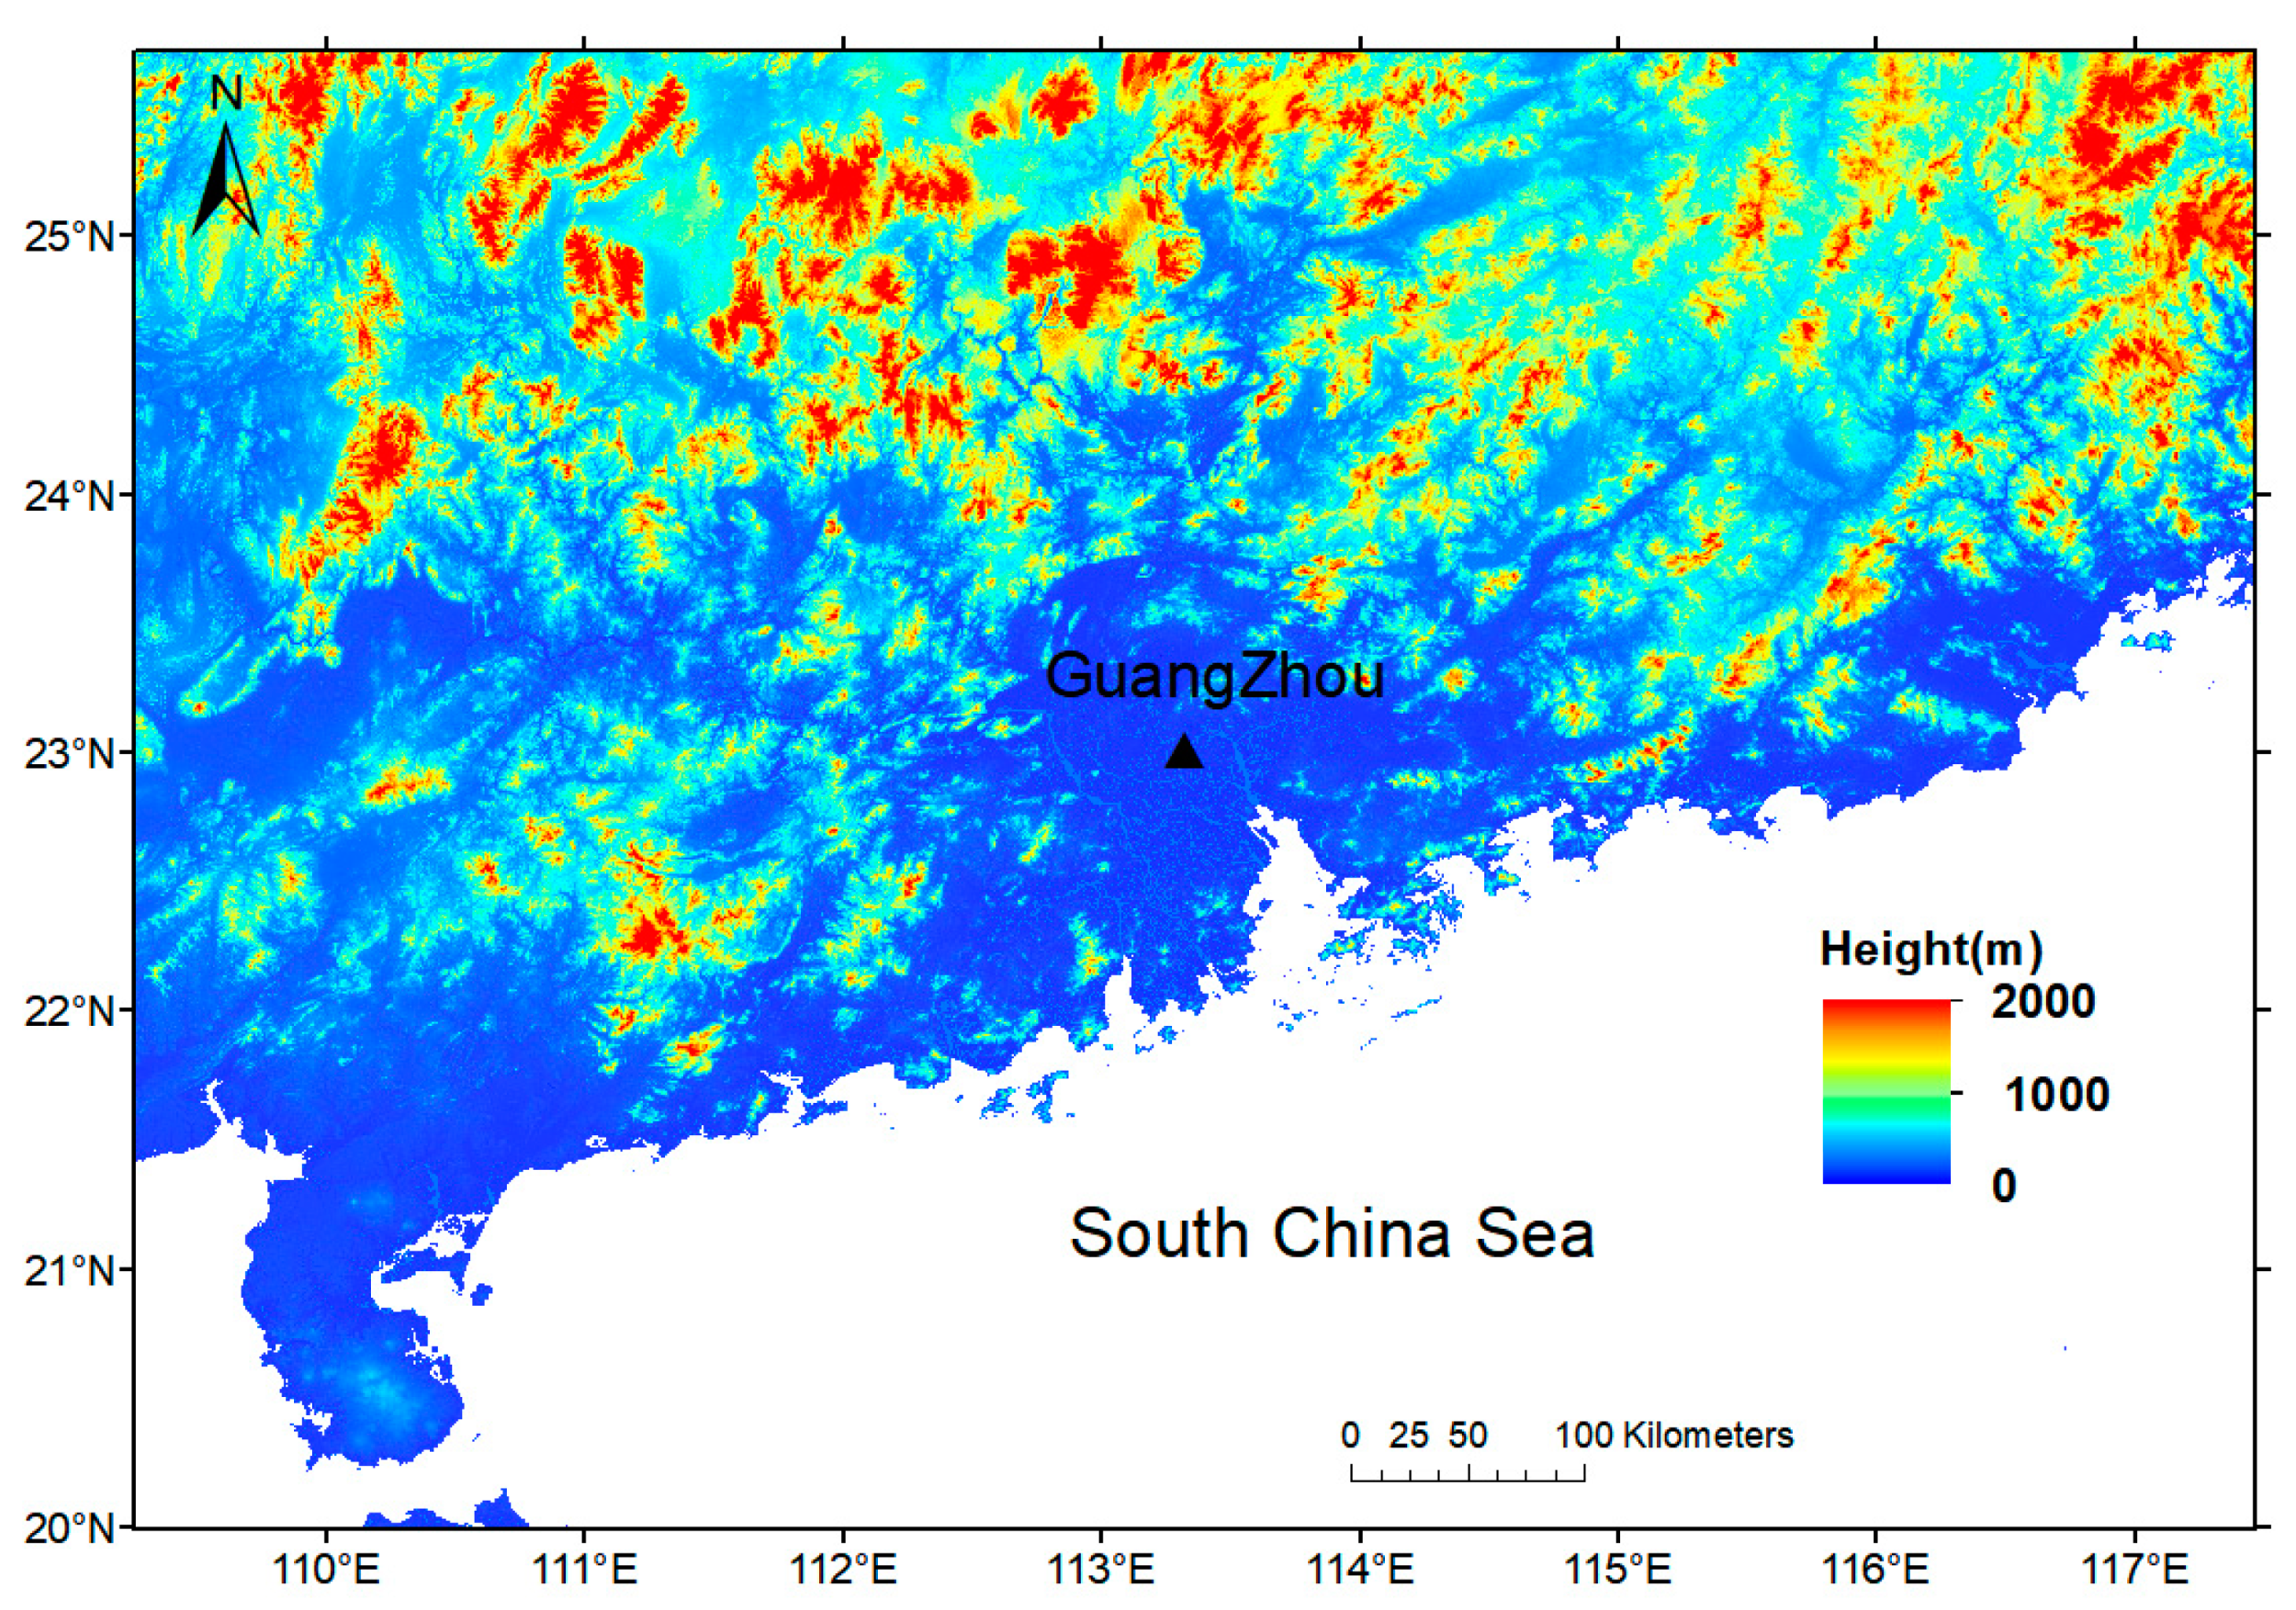
Guangzhou, as an important city in South China, belongs to the subtropical monsoon climate zone, where typhoons, heavy rains, and other severe convective weather events occur frequently [33,34,35]. Studying the vertical structure and microphysical characteristics of clouds in the Guangzhou area is of great significance for gaining an in-depth understanding of the weather and climate characteristics in South China and improving the accuracy and timeliness of weather forecasting. Although there have been some studies on the characteristics of clouds in South China, there is still a lack of long-term research on cloud characteristics, mainly due to the limited relevant detection data. In 2019, a Ka-band MMCR was deployed at the Guangzhou Weather Observatory (GZWO; 113°19′12″ E, 23°0′36″ N, 42 m above sea level) to enhance the understanding of cloud characteristics and its relationship with precipitation in South China.
The aim of this study is to conduct systematic observations and analysis of clouds characteristics in the South China region using long-term millimeter-wave cloud radar data. It involves comparative studies of cloud characteristics during different seasons, exploring the relationship between clouds and precipitation, and conducting in-depth research on key parameters such as cloud vertical structure. Apart from the introduction, this paper is primarily divided into the following sections: Section 2 will introduce the data and research methods used, including quality control and analysis methods for millimeter-wave cloud radar data. In Section 3, we will present the results of relevant analyses, such as seasonal variations and diurnal variations in cloud occurrence frequency. Additionally, we will discuss the distribution characteristics of cloud top heights (CTHs) during the flood season, as well as the vertical structure characteristics of clouds under different seasons and precipitation intensities. In the final section, we will provide a summary of the findings presented in the preceding sections. Through these analyses and discussions, this study aims to deepen our understanding of clouds in the South China region and their implications for the weather and the climate.
2. Data and Methods
2.1. Data and Quality Control
The MMCR is deployed at the Guangzhou Weather Observatory (GZWO), which also hosts rain gauge observations. The MMCR is of the HMB-KPS Ka-band radar type, with a detection height ranging from 120 m to 20 km. The observation mode is fixed at a 90° elevation angle observation, with a frequency of 35 GHz, a spatial resolution of 30 m, and a temporal resolution of 1 min. This setup allows for the retrieval of reflectivity intensity, cloud liquid water content (LWC), and other products at different heights. The time resolution of the rain gauge at the ground automatic station is 5 min, and the observed accuracy is 0.1 mm. The data cover the period from May 2019 to August 2021, with all times presented in local standard time (LST) for this study. The experimental location of GZWO is shown in Figure 1.
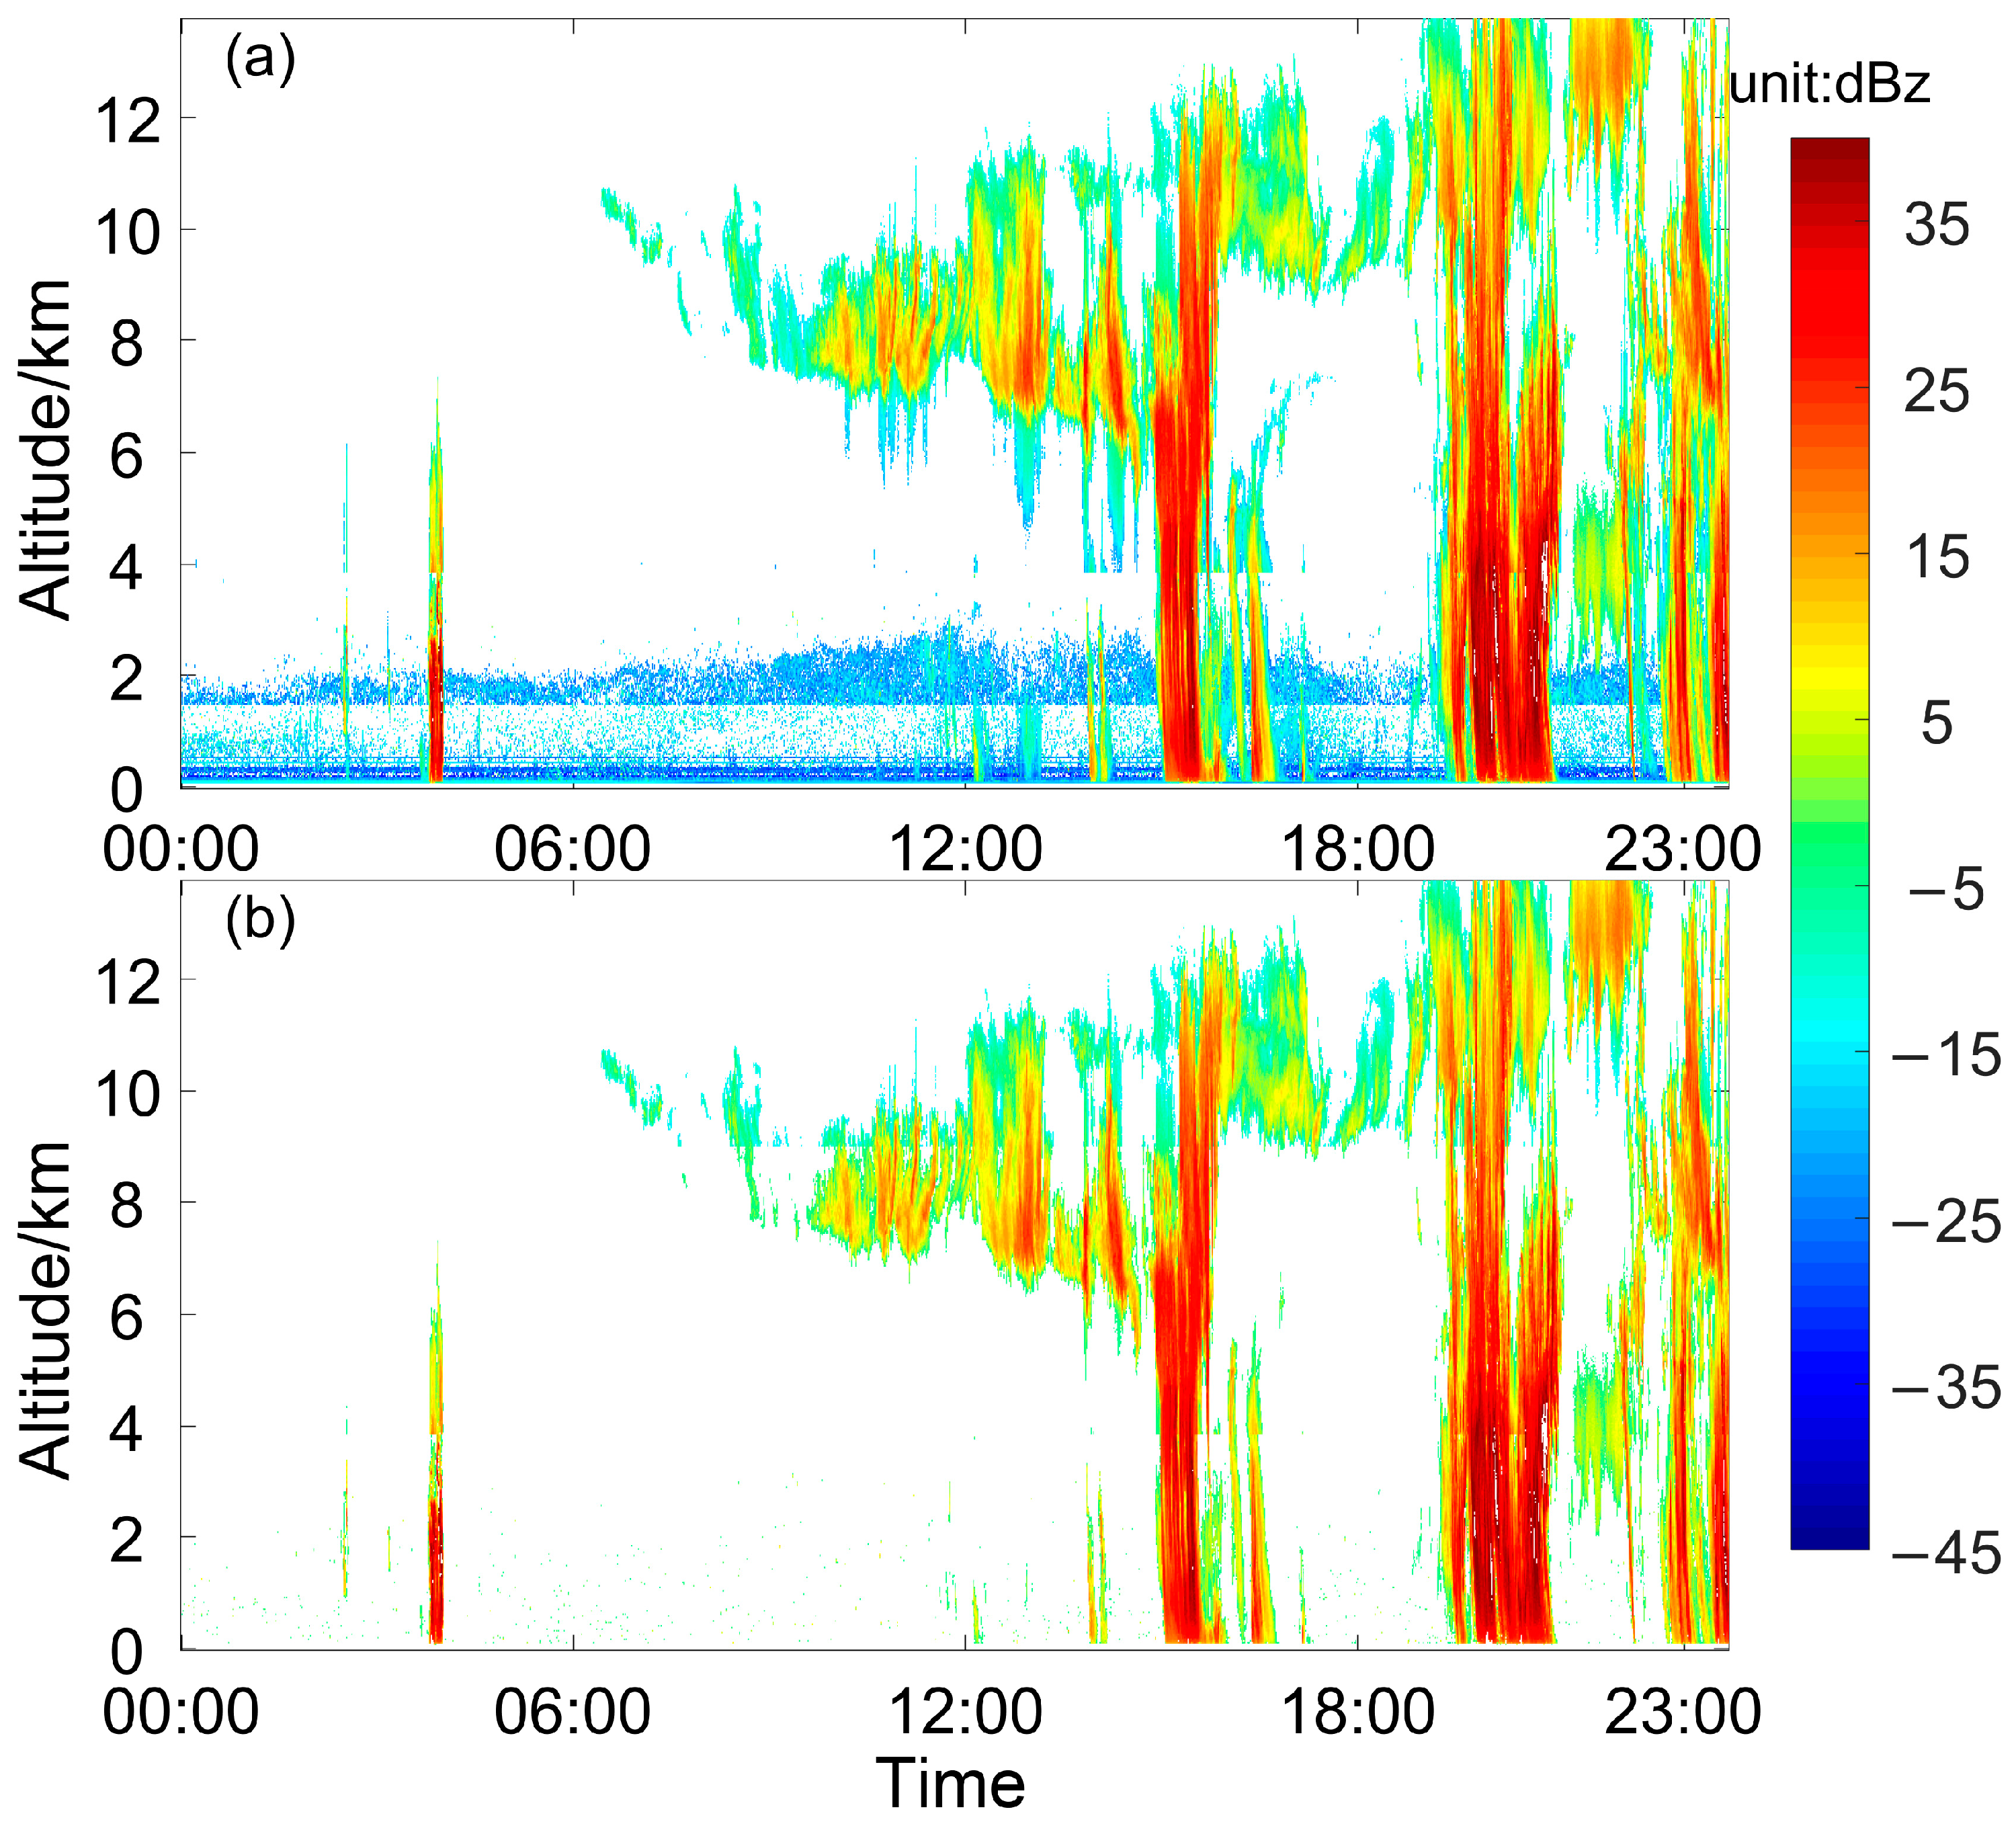
Compared to weather radars operating in the centimeter waveband, MMCRs operating in the millimeter waveband are more susceptible to interference from non-meteorological targets such as insects, aerosols, and other targets, resulting in non-meteorological echoes. Data analysis revealed that in the lower atmosphere of the Guangzhou region, particularly below 3 km altitude, continuous non-meteorological echoes are often present. Therefore, we conducted quality control on the data to effectively control non-meteorological echoes. We employed a technique known as the “Z-LDR double-threshold” to filter out non-meteorological echoes. This approach relies on the observed disparity in Z and LDR distributions between non-meteorological targets, clouds, and precipitation. Specifically, non-meteorological echoes often display a significant LDR alongside a relatively small Z, whereas cloud and precipitation echoes typically exhibit a smaller LDR across a wider range of Z values. Utilizing research findings from the Longmen Weather Observatory, situated approximately 120 km away from GZWO, we established Z and LDR thresholds at −8 dBZ and −14 dB, respectively. Under these criteria, any radar range gate displaying a Z value below −8 dBZ and an LDR value exceeding −14 dB can be identified as non-meteorological and subsequently filtered out. By employing the “Z-LDR double-threshold” method, we successfully eliminated most non-meteorological echoes within the LDR field. However, a small portion of scattered non-meteorological echoes persisted in other radar moments characterized by larger LDR values [36,37]. Figure 2 shows the MMCR reflectivity data before and after quality control on 20 May 2020. Before quality control, continuous radar echoes were present near the ground and at a 2 km altitude. These echoes were caused by non-meteorological targets. Therefore, these echo data were treated as noise and removed during quality control.
2.2. Normalized Contoured Frequency by Altitude Diagrams
Contoured frequency by altitude diagram (CFAD) plots can effectively display the distribution frequency of radar reflectivity intensity at different heights [38]. However, when data samples at certain sampling points are insufficient, particularly large values may occur. To address this issue, an improved standardization method, known as Normalized CFAD (NCFAD), is increasingly being utilized [39]. In this study, NCFAD is employed to showcase the frequency distribution of radar echoes in the vertical direction. The calculation formula for NCFAD is as follows:
where NZ(i,j) represents the number of observed samples at the j-th dBZ value at the i-th height. In this study, the height sampling interval is set to 300 m, and the statistical interval for radar echo intensity is set to 1 dBZ. Furthermore, to mitigate the interference from non-meteorological echoes, data below 300 m above ground level (AGL) and with intensities less than −40 dBZ (clear sky) are excluded [40]. For precipitation clouds, they are defined as clouds corresponding to hourly precipitation exceeding 0.1 mm, with precipitation data obtained from rain gauges at the GZWO.
3. Results
In the following subsections, the seasonal and diurnal variations in cloud occurrence frequency are investigated. Subsequently, the vertical structure characteristics of clouds under different seasons and precipitation intensities are discussed.
3.1. Occurrence Frequency Variation
3.1.1. Seasonal Variation of Cloud Occurrence Frequency
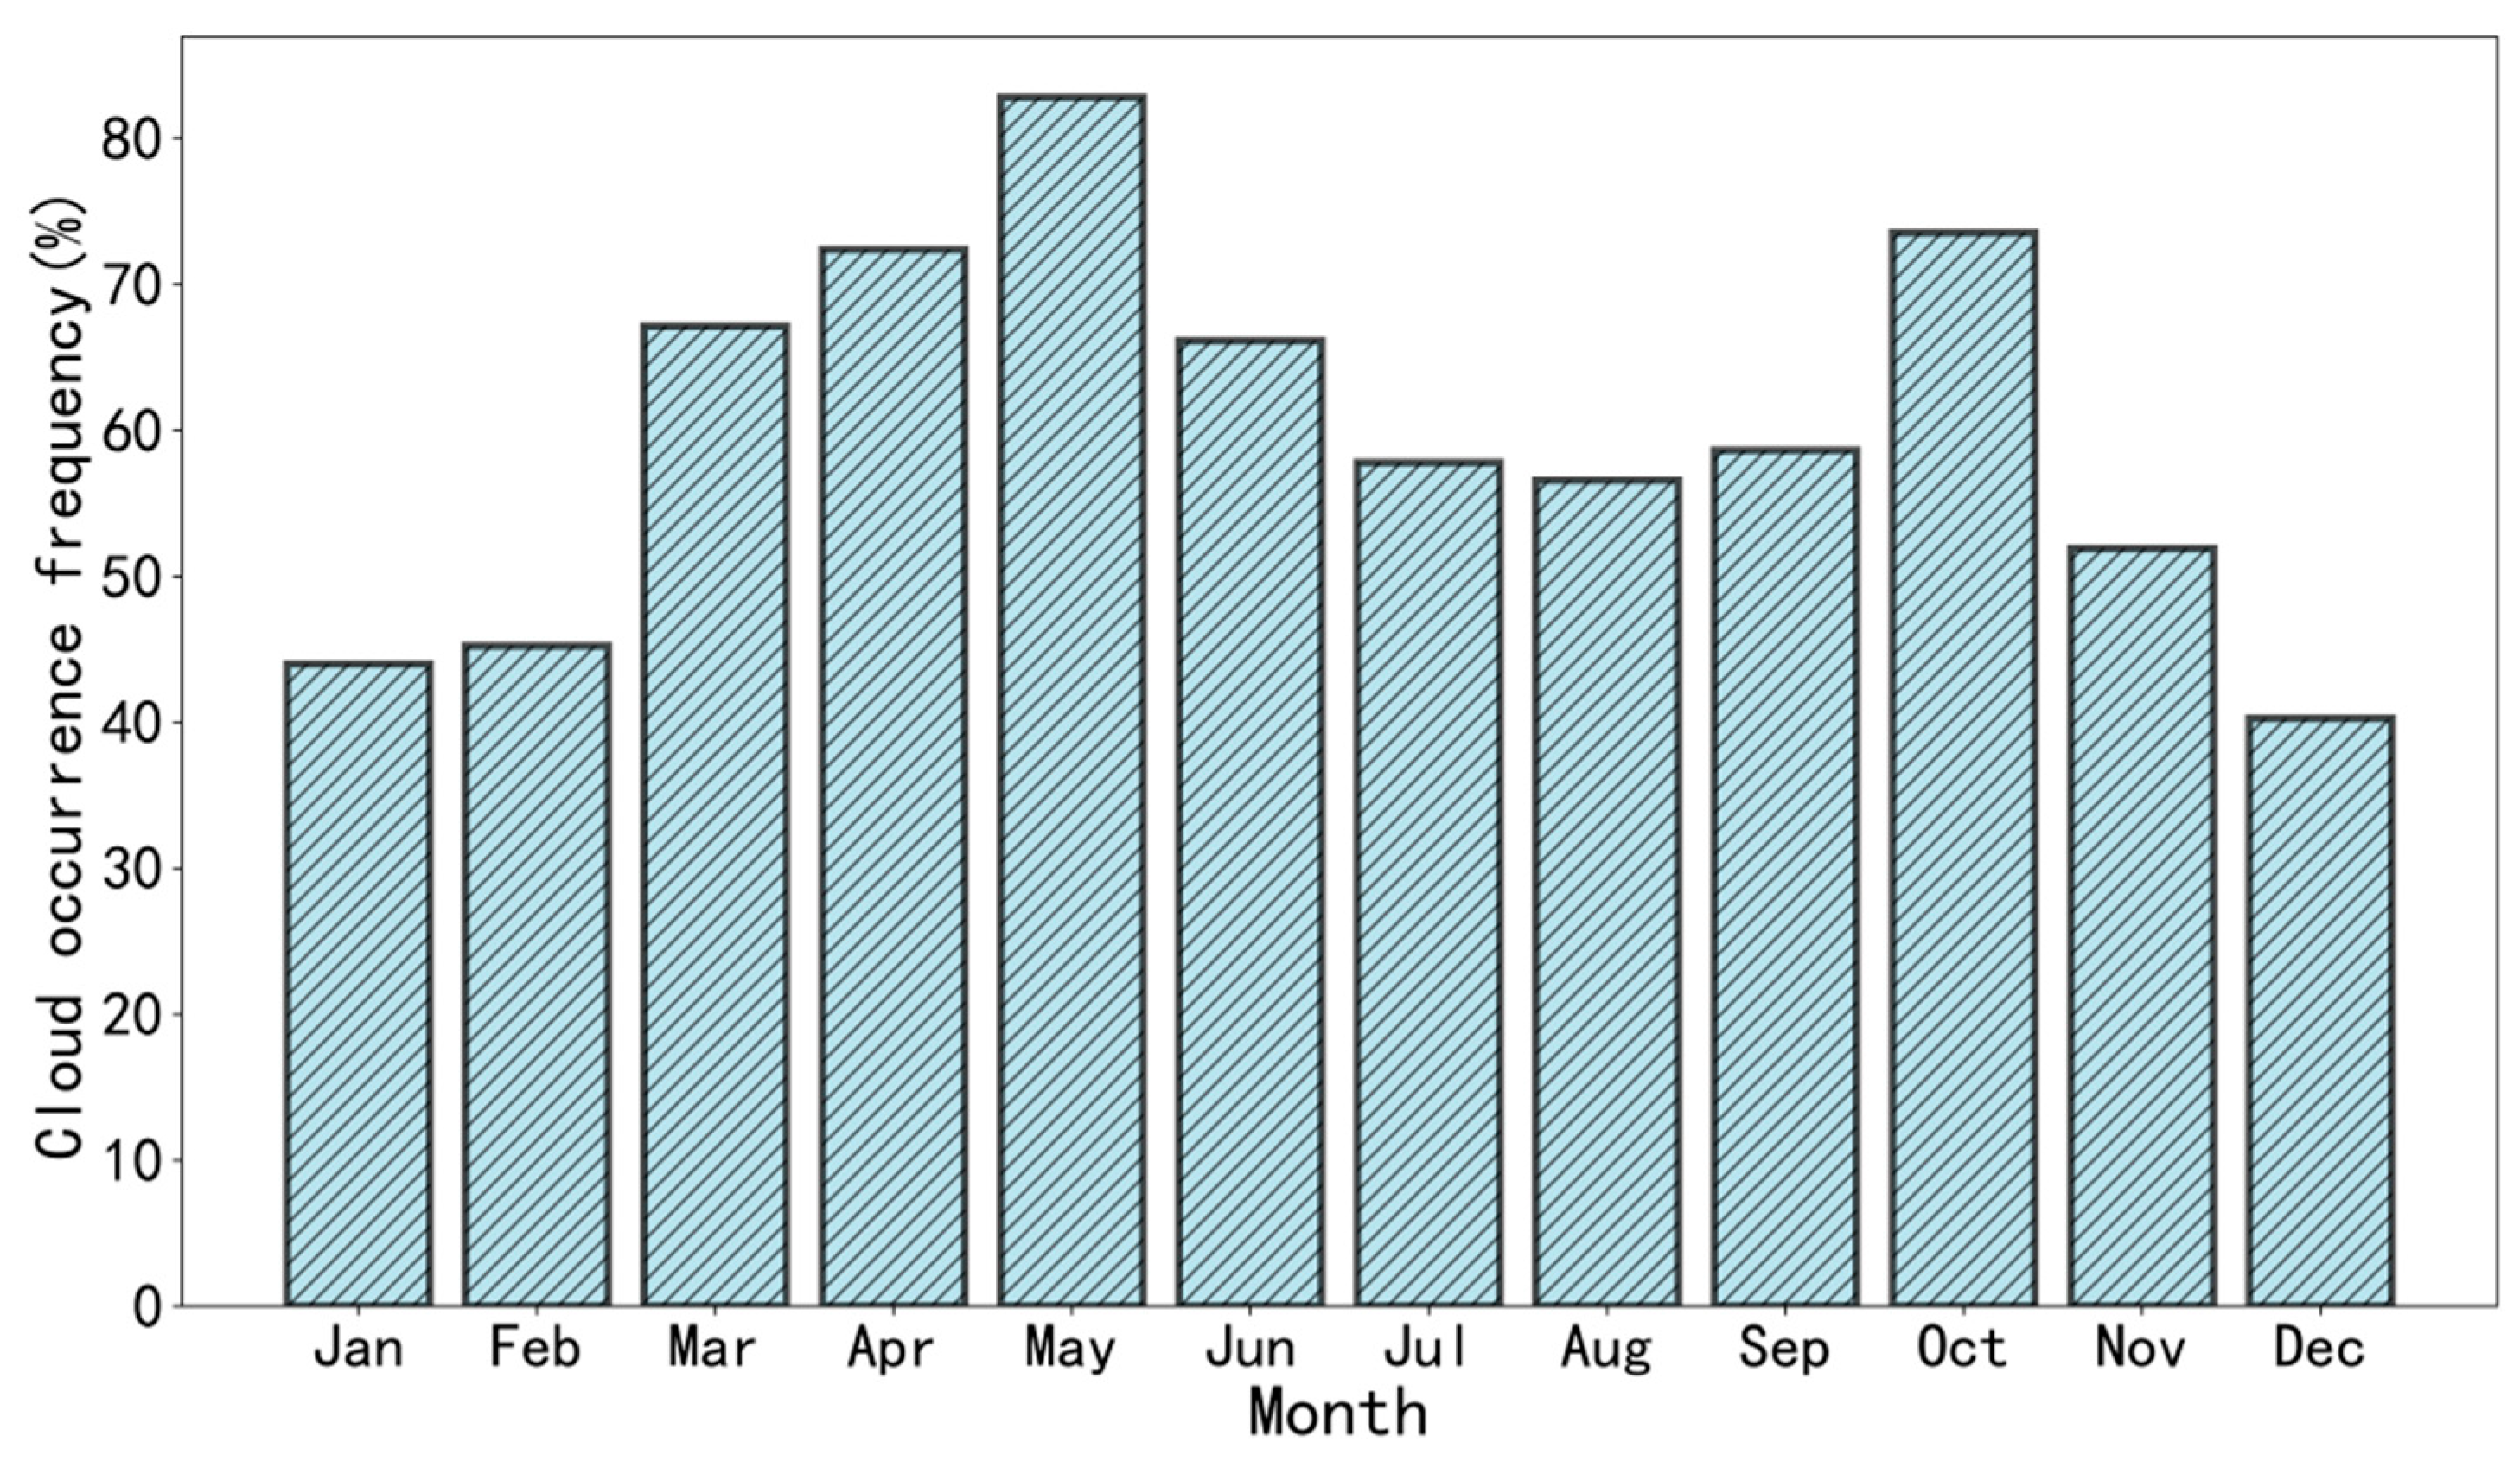
Clouds play a crucial role in the Earth’s radiation balance, water cycle, and greenhouse effect. Among them, the occurrence frequency of clouds is a significant factor that exhibits considerable variation across different seasons. In the South China region, the flood season spans from April to September, comprising two distinct stages: the pre-flood season from April to June and the post-flood season from July to September. The non-flood season occurs from October to February of the following year. Figure 3 illustrates the monthly cloud occurrence frequency at the GZWO. The cloud occurrence frequency varies significantly across different seasons, ranging from around 40% to 80%. It exhibits a quasi-bimodal distribution, with peaks occurring in March to June and October. The highest occurrence frequency is observed in May, reaching around 80%, while the lowest occurs from December to February of the following year, hovering around 40%. These results are similar to findings based on data from 51 ground-based meteorological stations in South China. A slight difference is that the cloud occurrence rate based on ground-based meteorological stations is higher from December to February of the following year. This difference may be attributed to variances in the study area and the time period of the data [41]. From March onwards, the transition from the non-flood season to the flood season in South China begins, with the strengthening of southerly winds. April to June marks the peak of the South China summer monsoon period, bringing ample moisture and energy, and thus providing favorable conditions for cloud formation and a noticeable increase in cloud occurrence frequency. In contrast, the occurrence frequency during July to September is lower (around 60%) compared to April to June, possibly due to the influence of the subtropical high-pressure system over the western Pacific Ocean during the post-flood season, leading to drier atmospheric conditions. October serves as a transitional period from the flood season to the non-flood season in South China, with relatively favorable humidity conditions in the atmosphere, possibly contributing to the relatively higher cloud occurrence frequency, aided by the influence of cold air masses.
3.1.2. Diurnal Variation of Cloud Occurrence Frequency
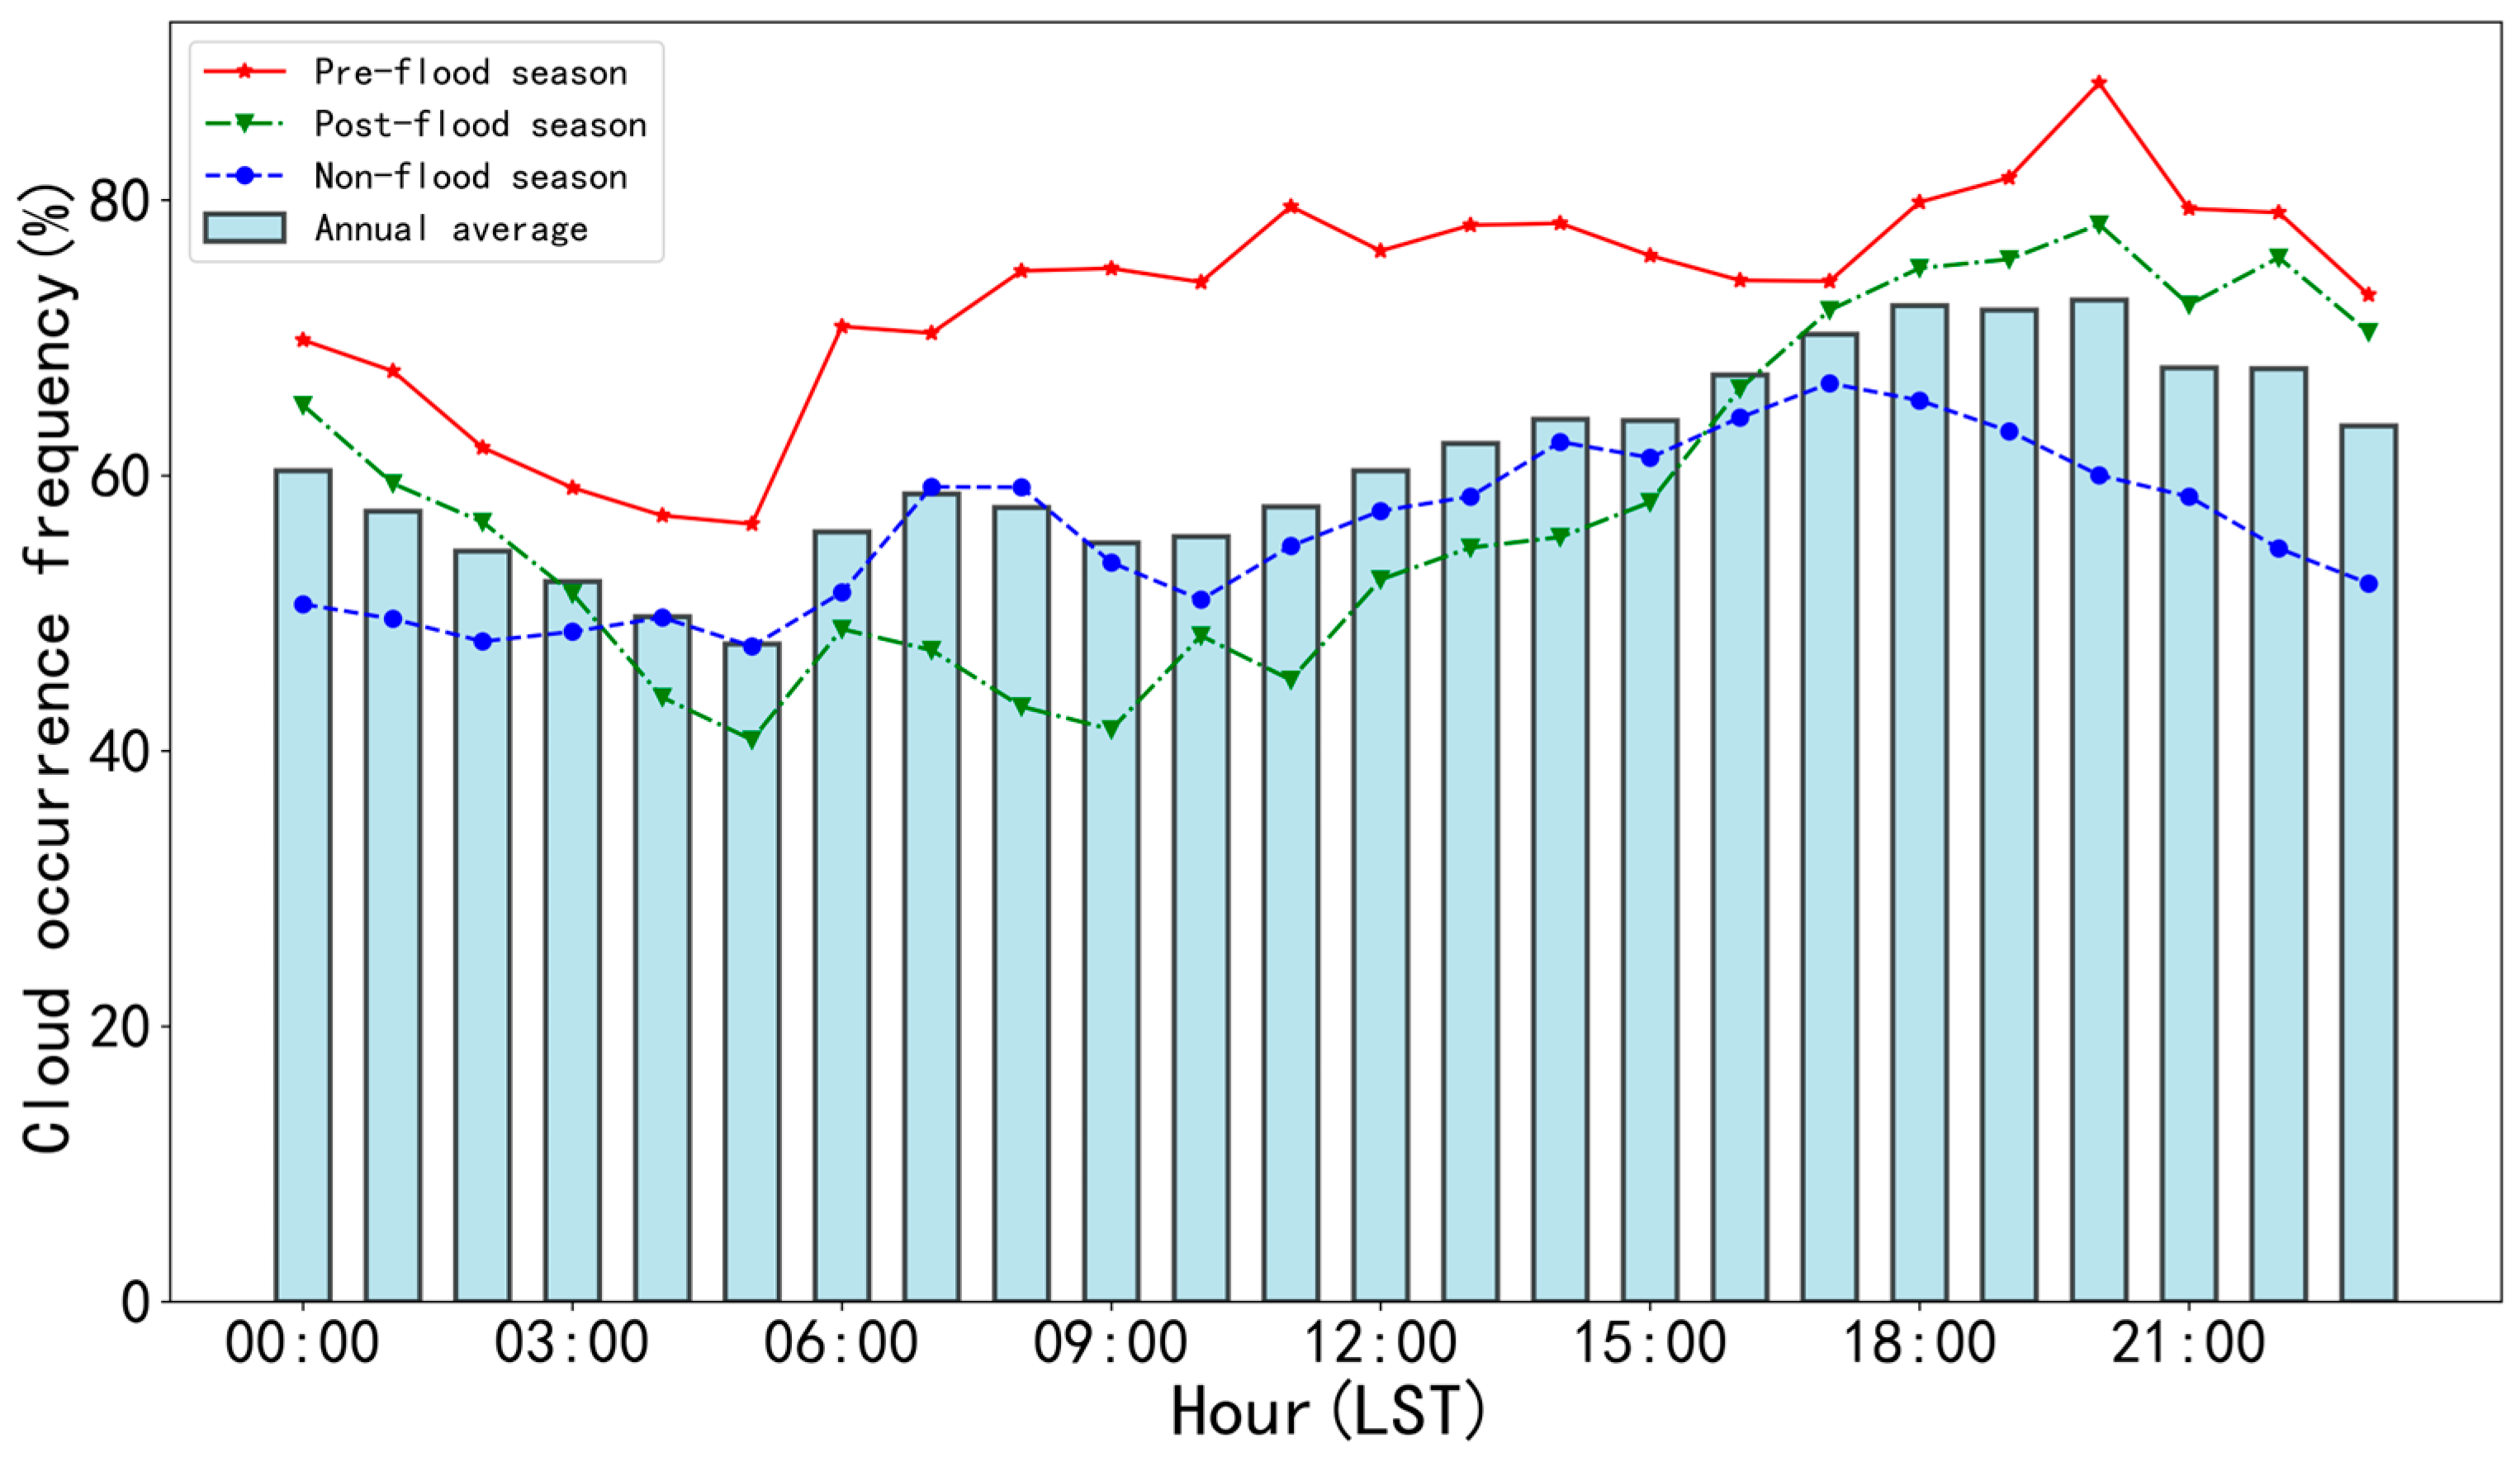
The diurnal variation of clouds reflects the thermal and dynamic processes in the atmosphere, playing a crucial role in weather prediction models. Figure 4 depicts the diurnal variation of cloud occurrence frequency at GZWO across different seasons, with differently colored lines representing distinct seasons, while bars denote the annual average. Cloud occurrence frequency exhibits pronounced diurnal characteristics throughout various seasons. The lowest cloud occurrence frequency is typically observed around 0005 LST, gradually increasing after 0006 LST and peaking during the afternoon to evening hours. This is generally consistent with the findings derived from continuous satellite observations of cloud data spanning from 2005 to 2008. In the eastern region of South China, the incidence of warm clouds notably escalates from the early morning hours, whereas the occurrence of cold clouds and mid-level clouds reaches the peak from the afternoon to the evening [42].This diurnal pattern primarily arises due to the relative atmospheric stability following nocturnal cooling, as well as increasing solar radiation post-sunrise leading to surface heating and enhanced evaporation of moisture, fostering convective activity that is conducive to cloud formation and growth.
There are discernible differences in diurnal variation among different seasons. During the post-flood and non-flood seasons, there is a temporary decrease in the cloud occurrence frequency in the morning, followed by a subsequent increase in the afternoon. In contrast, during the pre-flood season, the cloud occurrence frequency remains relatively high throughout the morning, likely influenced by monsoonal moisture transport. Moreover, both the pre-flood and post-flood seasons exhibit significant increases in cloud occurrence frequency around 0016–0017 LST, reaching peak values of 70–80% around 0020 LST. In contrast, during the non-flood season, the cloud occurrence frequency peaks around 0017 LST at approximately 65% before rapidly declining and maintaining a relatively stable level during the night. Additionally, there are differences in the amplitude of diurnal variation in cloud occurrence frequency among different seasons, with the post-flood season exhibiting the highest amplitude and the non-flood season showing the lowest, which is primarily attributed to variations in solar radiation intensity across different seasons.
3.2. Flood Season Cloud Characteristics
Clouds play a crucial role in precipitation, where their type influences precipitation intensity and their structure determines the type and distribution of precipitation. Therefore, we selected cloud samples from the flood season (April to September) during the observation period and conducted an analysis of the vertical structure under different seasons and rain intensities.
3.2.1. Frequency Distribution of Cloud Top Height during Flood Seasons
Cloud top height (CTH) reflects the vertical motion of the atmosphere. Studying CTH helps us to understand the vertical motion and thermodynamic structure of the atmosphere. By monitoring and analyzing changes in CTH, we can more accurately predict the occurrence and development trends of weather phenomena such as precipitation and severe convection. To investigate the variation patterns of cloud top heights, we computed the distribution of cloud top heights across different seasons. In cases of multiple cloud layers, the altitude of the highest layer’s cloud top is selected as the definitive cloud top height. Figure 5 shows the frequency distribution of CTHs at the GZWO during different seasons. As is evident from the figure, both the pre-flood and post-flood seasons exhibit a bimodal distribution of cloud top heights, with two peaks below 3 km and between 12 and 14 km. During the pre-flood season, the frequency of CTH below 3 km reaches around 43%. This is primarily attributed to the influence of the East Asian monsoon during this period. The abundant moisture transported by the monsoon leads to increased humidity, resulting in lower lifting condensation levels in the atmosphere. Consequently, cloud heights are relatively lower during this period, which aligns well with previous observations [37,43]. The frequency of CTH above 7 km increases with increasing altitude, reaching a secondary peak between 12 and 14 km. This is primarily attributed to the influence of frequent, intense convection events during this period in South China. Previous studies have indicated that, during intense convective events, cloud heights significantly increase [40].
In contrast, during the post-flood season, although there is also a peak frequency of CTH below 3 km, it occurs much less frequently compared to the pre-flood season, at around 16%. The most frequent occurrence of CTH during the post-flood season is observed between 11–14 km, accounting for approximately 37%. This is mainly attributed to the significant transition of atmospheric circulation patterns over South China during the post-flood season. During this period, South China is primarily influenced by the western Pacific subtropical high, resulting in hot weather and a noticeable increase in temperature. The atmospheric humidity decreases, leading to a higher lifting condensation level and overall higher cloud heights compared to the pre-flood season. Additionally, the frequent occurrence of convective activities in the afternoon during the post-flood season contributes to higher CTHs.
3.2.2. Precipitation Cloud Vertical Structure and Seasonal Variation
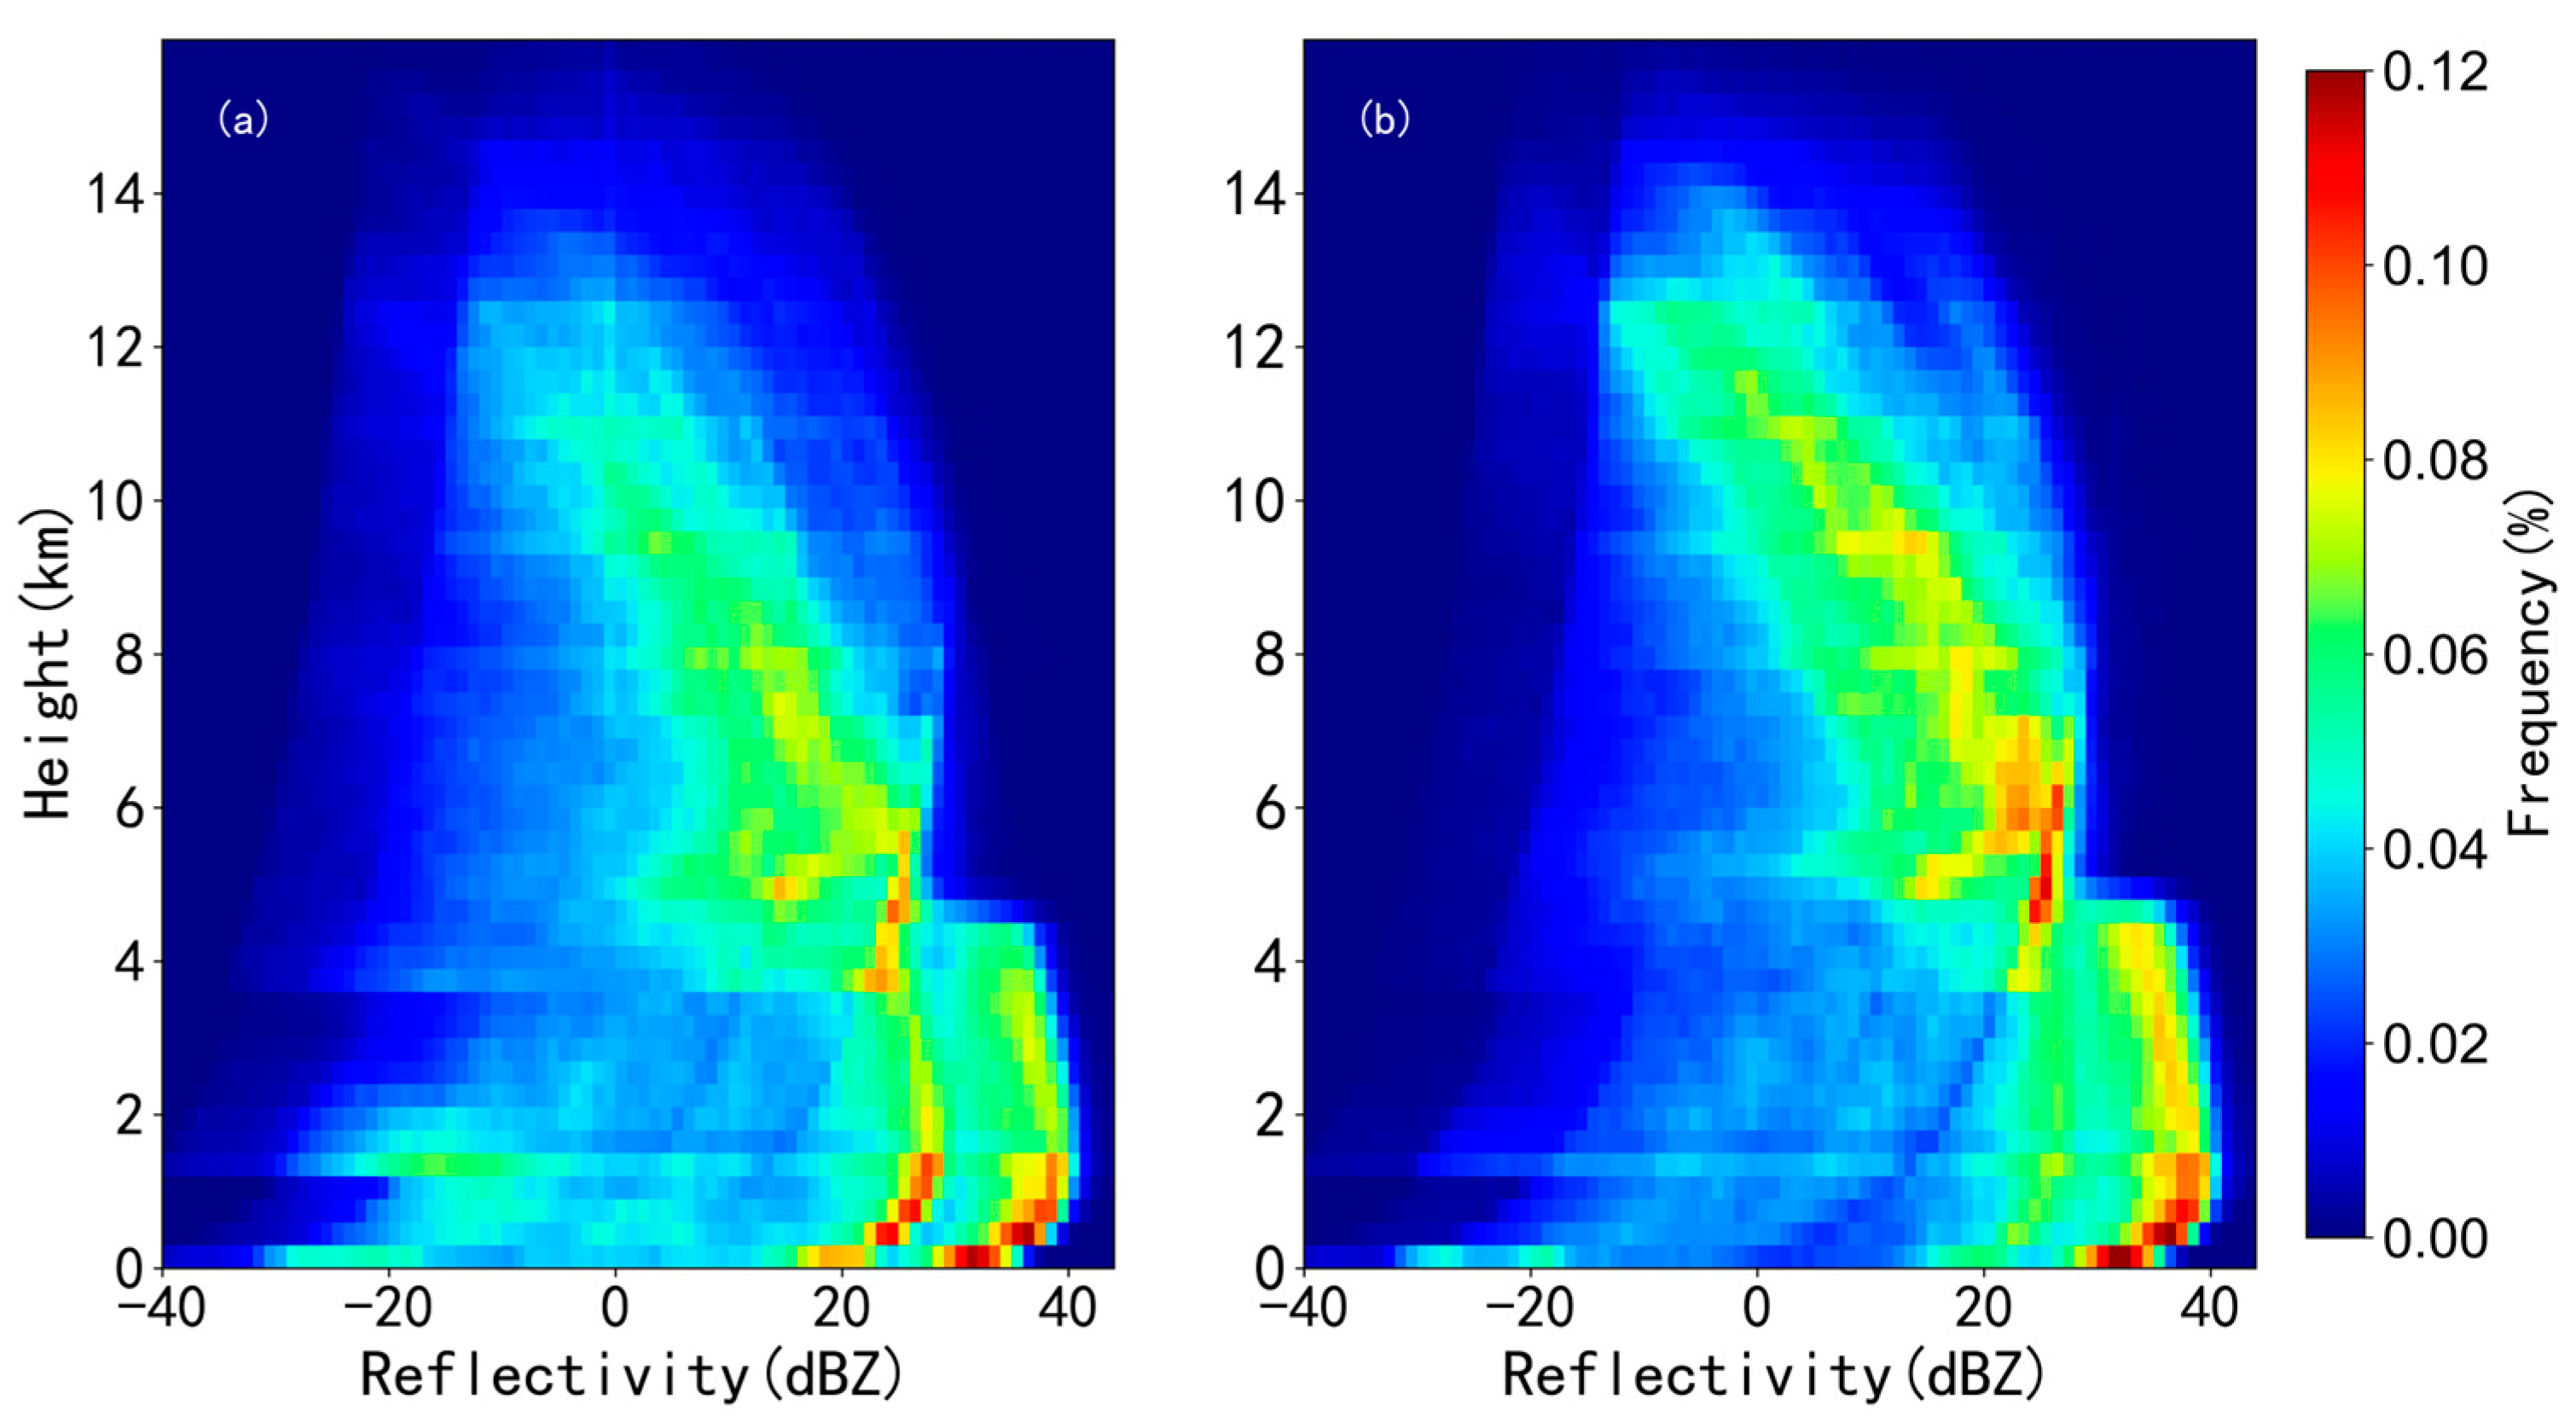
The vertical structure of clouds has a significant impact on the formation, intensity, and duration of precipitation. Therefore, we selected observational data of precipitation clouds during the study period and analyzed the vertical structural characteristics of precipitation clouds in different seasons. Figure 6 shows the NCFAD diagram of the reflectivity of precipitation clouds in different seasons. The CTH of precipitation clouds can reach above 12 km, and the reflectivity generally decreases with increasing altitude (Figure 5a). The reflectivity decreases gradually from around 40 dBZ to below −20 dBZ as the altitude increases. The higher reflectivity values mainly occur below 4 km. In both the pre-flood and post-flood seasons, the most frequent occurrence of precipitation cloud echoes is in the altitude range below 2 km, with reflectivity between 20–40 dBZ. This may be related to the phenomenon of significant ground echoes caused by rainfall during precipitation. Additionally, there is a high-frequency echo zone around 25 dBZ at altitudes of 4–7 km, indicating favorable temperature and humidity conditions at this altitude for cloud formation and precipitation occurrence. This may also be due to the frequent occurrence of strong convective activities at this altitude. There is a sudden change in reflectivity around an altitude of 4.5 km, possibly related to the bright band phenomenon or variations in the observation mode of the radar at different altitudes, leading to errors and sensitivity changes in the observed reflectivity [44].
There are some differences in the vertical structure of precipitation clouds between the pre-flood and post-flood seasons. In the pre-flood season, there are two high-frequency zones below 2 km, while in the post-flood season, there is only one high-frequency zone between 30 and 40 dBZ below 2 km. The occurrence frequency of echoes in the 4–7 km altitude range during the post-flood season is higher compared to the pre-flood season. Additionally, the frequency of echoes below 20 dBZ in the pre-flood season is higher compared to the post-flood season. Overall, the extension height and reflectivity of cloud echoes in the pre-flood season are generally lower than those in the post-flood season, mainly due to differences in precipitation types between the two seasons [45].
3.2.3. Diurnal Variation in Precipitation Cloud Vertical Structure
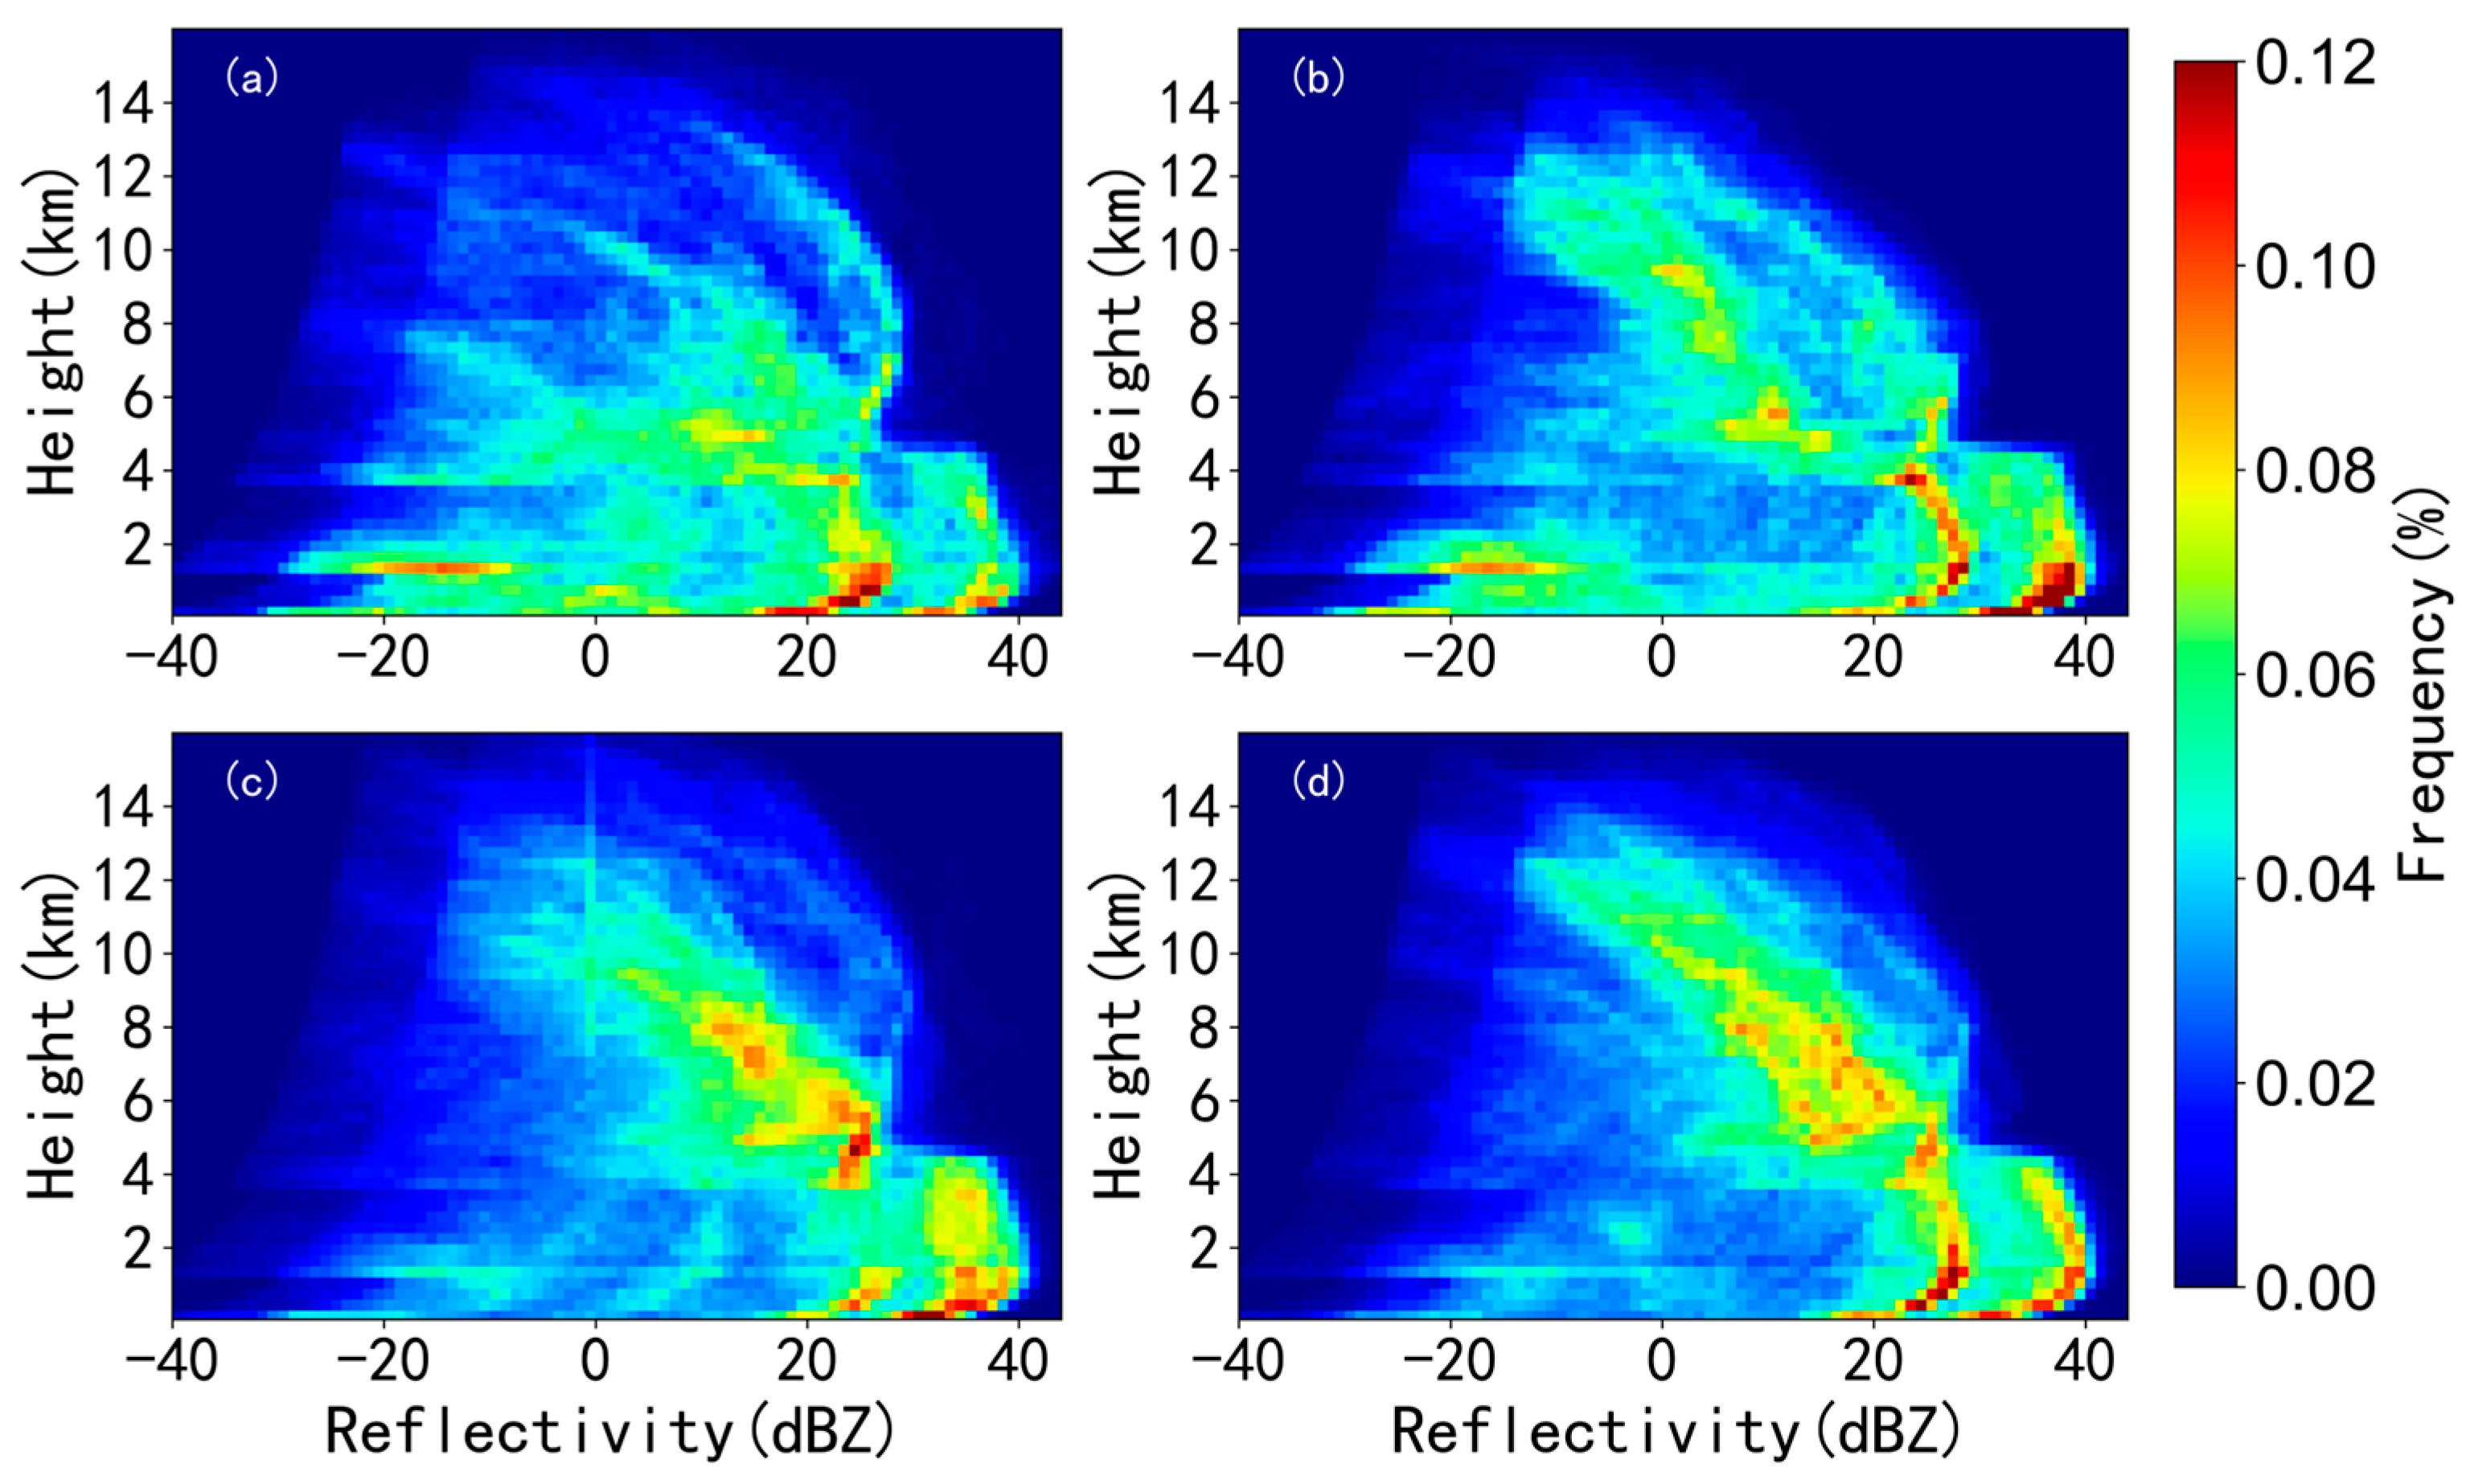
The diurnal variation in the vertical structure of precipitation clouds was investigated by statistically analyzing the CVS features at intervals of 6 h. Figure 7 illustrates the diurnal variation in precipitation clouds during the pre-flood season at the GZWO. The vertical structure of precipitation clouds exhibits distinct diurnal variations. From 0000 to 0600 LST, echoes mainly appear in the near-surface layer below 2 km and at altitudes of 4–6 km, with echo intensities ranging from −20 dBZ to 40 dBZ. Between 0700 and 1200 LST, the frequency of echoes above 6 km noticeably increases, while the overall echo intensity below 4 km gradually increases. During 1300–1800 LST, the echo intensity further increases, with echo intensities below 4 km mostly exceeding 20 dBZ, and the frequency of echoes between 4 and 8 km also significantly rises. From 1900 to 2400 LST, the frequency of echoes with intensities exceeding 20 dBZ below 4 km continues to increase, and two high-frequency intervals appear below 2 km. Overall, from early morning to night, both the echo intensity and cloud altitude gradually increase, likely due to the strengthening of convection after sunrise as a result of ground heating by solar radiation and the pulsation of the monsoon.
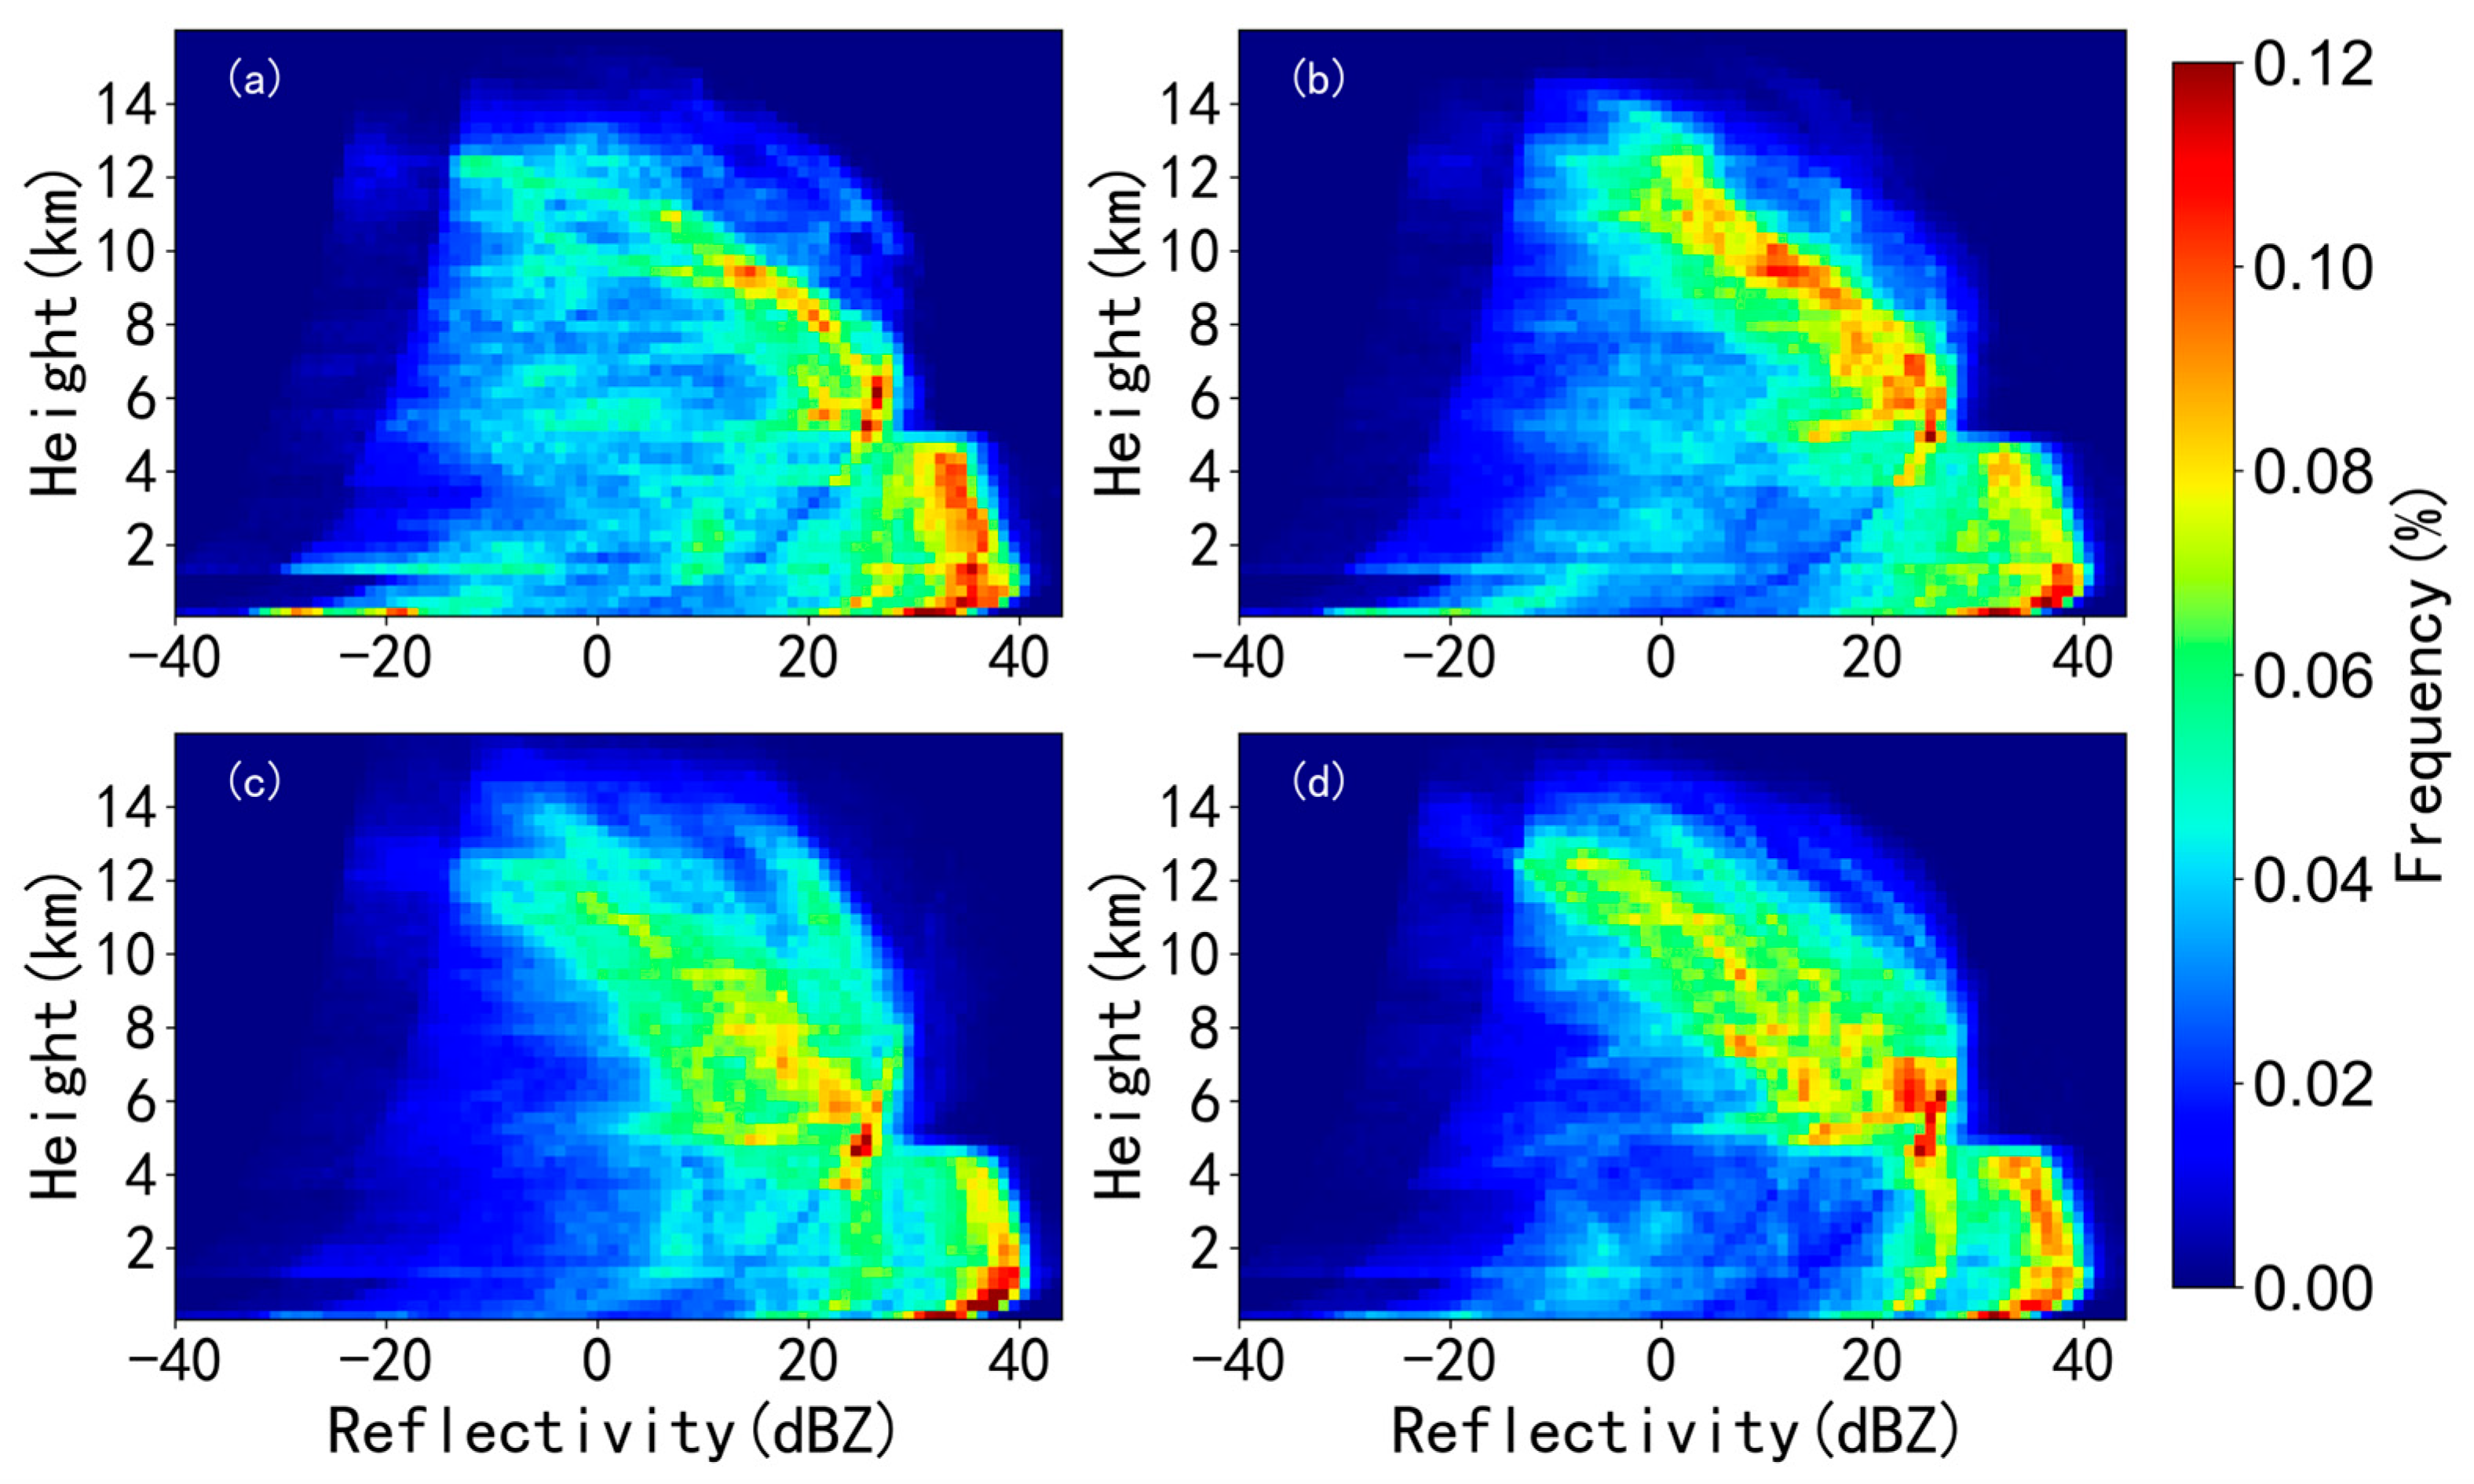
Figure 8 illustrates the diurnal variation in the vertical structure of precipitation clouds during the post-flood season. The vertical structure of precipitation clouds during the post-flood season exhibits similar diurnal variation characteristics to that observed during the pre-flood season, but there are also some differences. Most of the precipitation cloud echo intensities during the post-flood season are above 0 dBZ, with the majority of echo intensities below 4 km being above 30 dBZ. Unlike the pre-flood season, there is no high-frequency zone between −20 and 10 dBZ below 2 km during 0000–0600 LST, and as time progresses, the frequency of occurrence of echoes in the zone below 10 dBZ decreases, while those above 20 dBZ increase. The echo intensities gradually strengthen overall. During 0700–1200 LST in the post-flood season, there is a high-frequency zone at 8–10 km, with a higher occurrence frequency compared to the period of afternoon to evening. The echo heights during the post-flood season are overall notably higher, with a higher occurrence frequency above 4 km compared to the pre-flood season. This is primarily due to the stronger solar radiation and higher overall atmospheric temperatures during the post-flood season, along with higher convective development heights.
3.2.4. Cloud Vertical Structure (CVS) under Different Precipitation Intensities
The intensity of precipitation is closely related to CVS; intense precipitation often accompanies the dramatic vertical development of clouds. To better understand the relationship between precipitation intensity and CVS, we classified precipitation clouds into three categories based on hourly rainfall intensity [44,46]. Figure 9 shows the vertical profiles of cloud reflectivity under different rainfall intensities, where several profiles represent the 25th to 95th percentiles of reflectivity at different heights. Vertical profiles of clouds under different rainfall intensities exhibit similar trends. Above 5 km, the reflectivity decreases gradually, while between 4 and 5 km, the reflectivity rapidly increases with decreasing altitude, indicating strong collision and coalescence growth of cloud droplets. Between 2 and 4 km, the reflectivity reaches a peak and remains relatively constant, suggesting that cloud droplets have grown to a sufficient size, and precipitation begins to form as raindrops start to fall. This may also be related to factors such as the terminal velocity of raindrops and upward air currents [40]. Although the overall trend is consistent, there are significant differences in the vertical profiles among different rainfall intensities, particularly below 4 km. For precipitation clouds with hourly rainfall intensity between 0.1–9.9 mm h−1, one-quarter of the reflectivity values are below 0 dBZ. As the rainfall intensity gradually increases to 10–19.9 mm h−1 and 20–30 mm h−1, the corresponding values gradually increase to 5 and 15 dBZ, respectively. Overall, as the rainfall intensity increases, the reflectivity below 4 km tends to increase, which is consistent with previous studies on precipitation clouds [47]. However, there is no significant difference in the maximum reflectivity among different rainfall intensities; the 95th percentile of maximum reflectivity under all three rainfall intensities is approximately 40 dBZ. This may be because raindrops in the lower atmosphere have already formed into large raindrops, which are more likely to attenuate radar microwave signals, thereby maintaining the detected reflectivity signal strength.
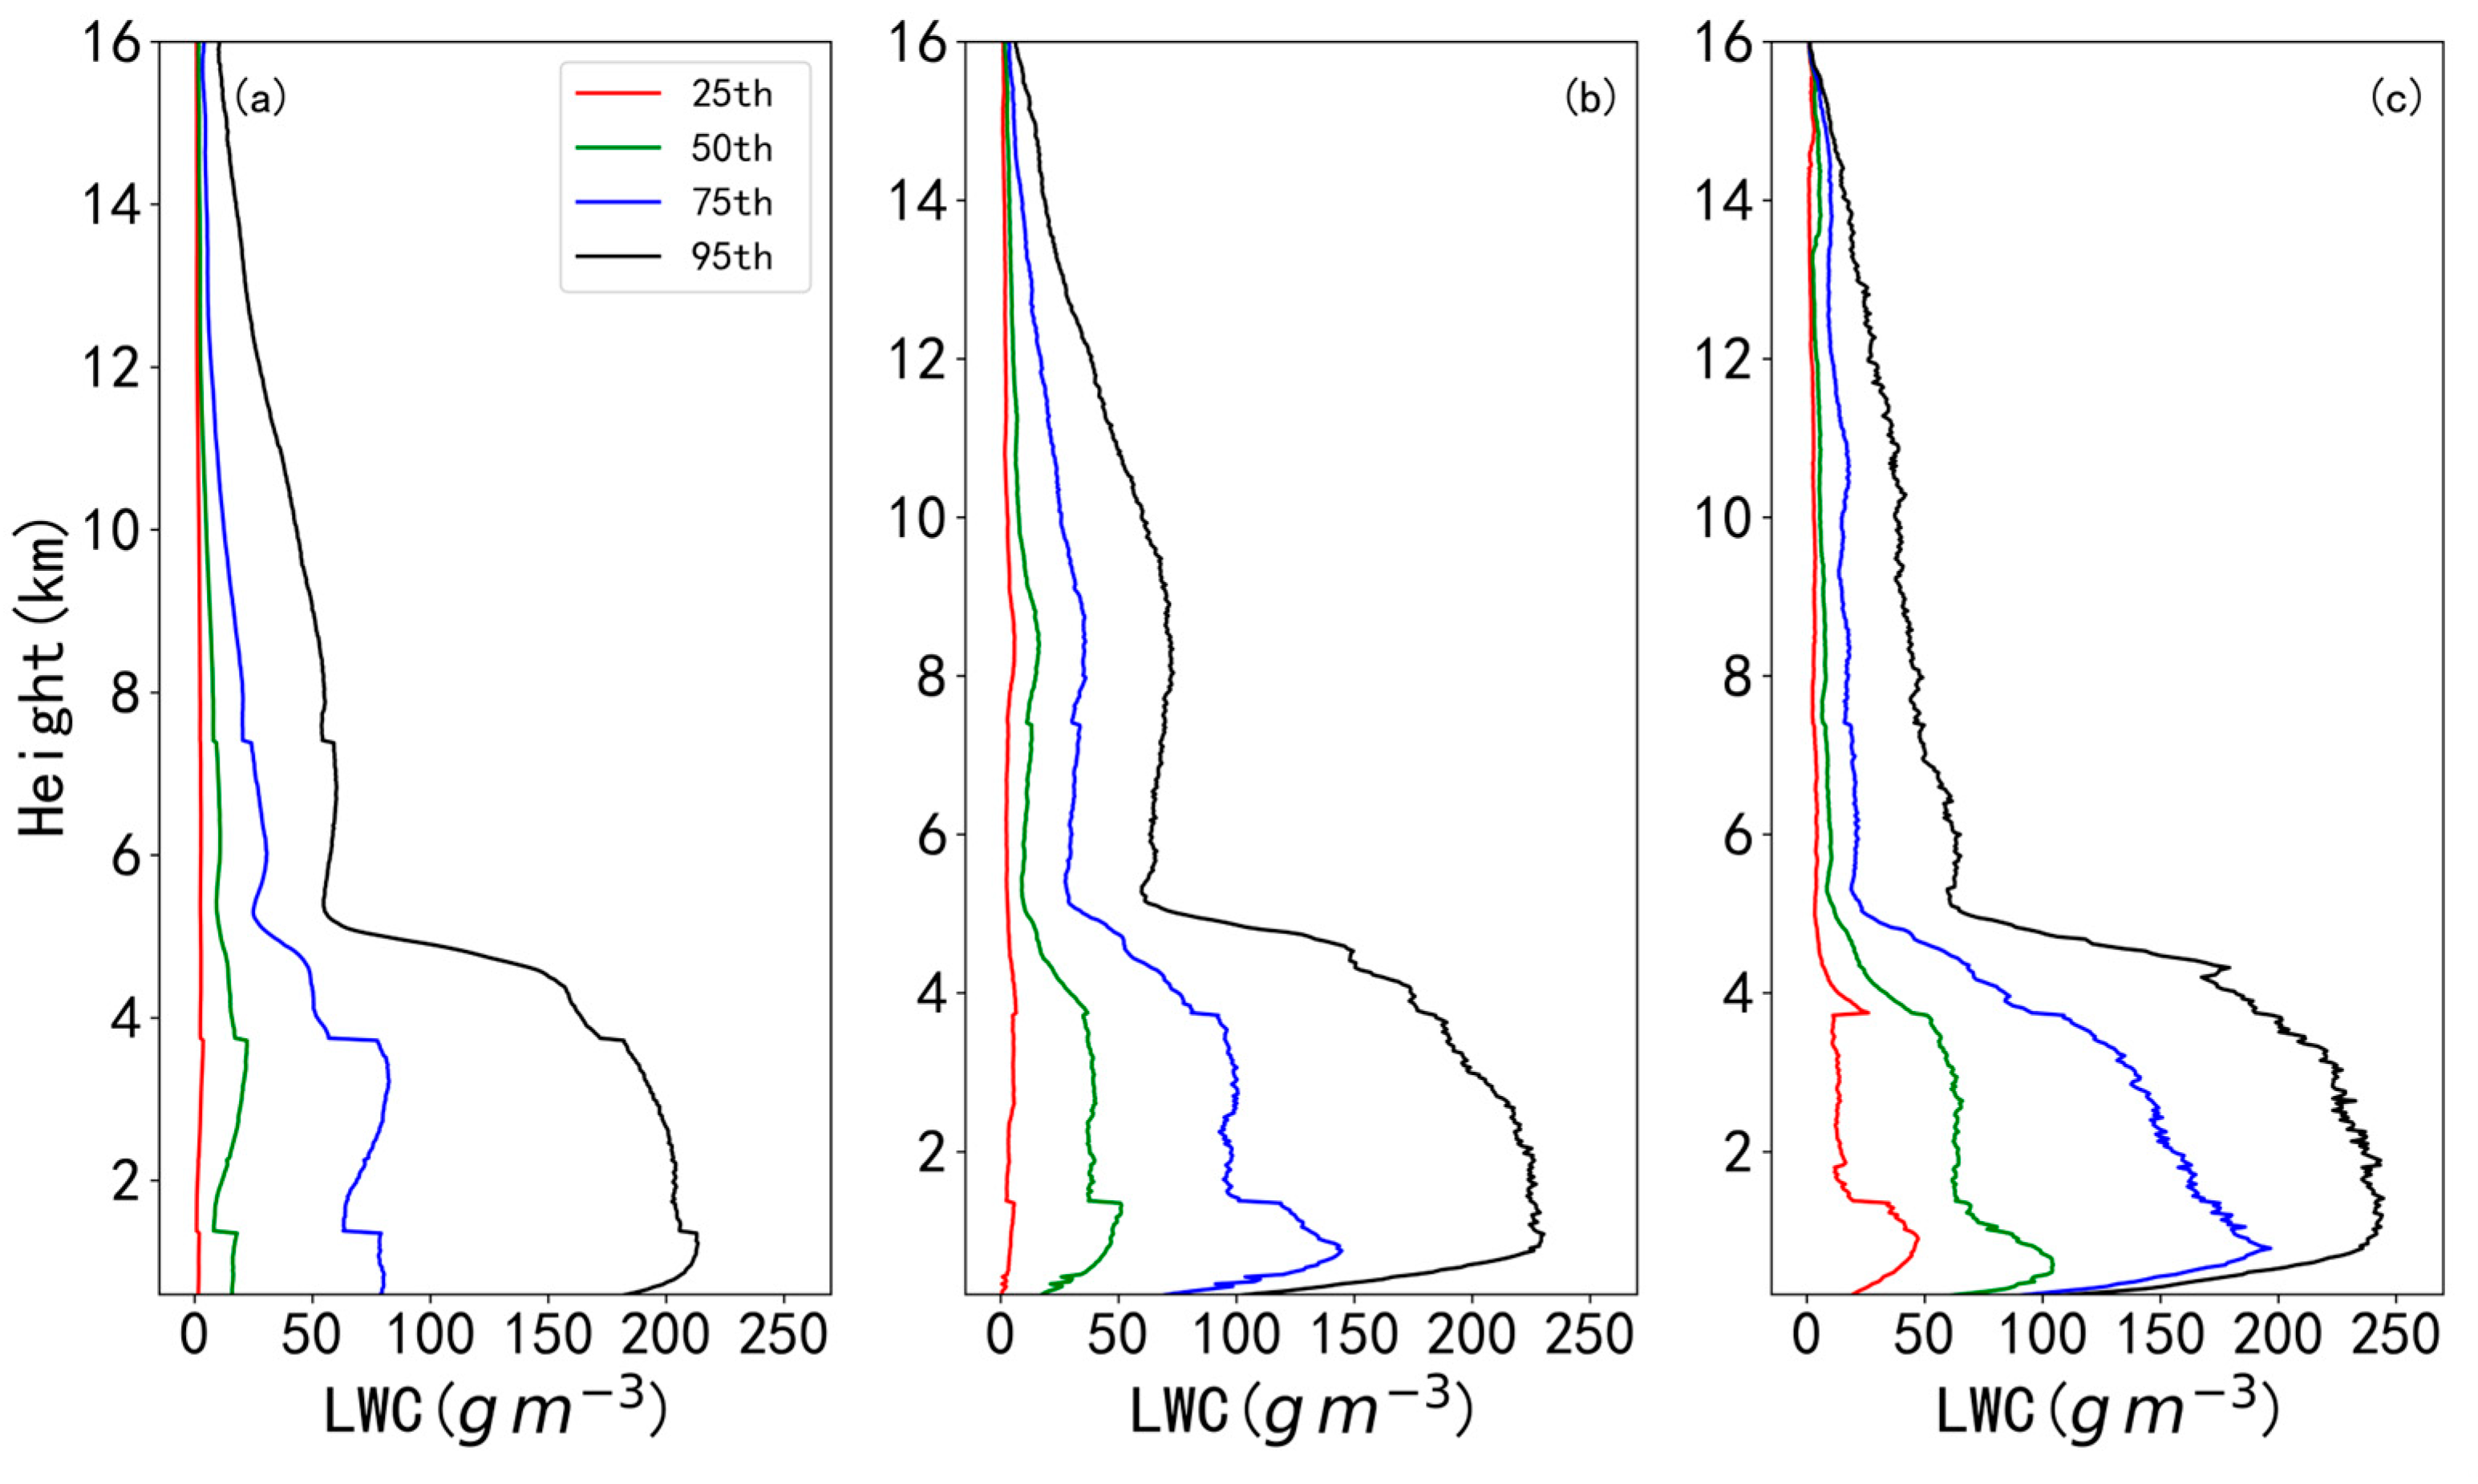
In addition to reflectivity, IWC/LWC is also an important indicator of precipitation potential within cloud clusters. Regions with higher IWC/LWC often indicate sufficient moisture, which is conducive to the condensation of raindrops and the precipitation process. Based on previous research, the altitude at which the temperature reaches zero degrees Celsius in the atmosphere varies between 4 and 5 km. Therefore, the region below 4 km is typically associated with LWC, while that above 5 km is characterized by a mixture of liquid and ice, with ice dominating above 11 km [37,48,49]. Figure 10 presents the profiles of IWC/LWC under different precipitation intensities. The vertical distribution of IWC/LWC exhibits a general pattern of higher values in the lower layers and decreasing values at higher altitudes. IWC/LWC values are larger below 4 km and decrease rapidly with increasing altitude between 4 and 5 km of height. This phenomenon can be attributed to the melting layer, where ice crystals begin to melt into liquid droplets. This melting process can lead to changes in the particle size distribution and phase state, consequently causing significant changes in radar reflectivity and other parameters at this altitude. Therefore, noticeable gradients are observed at the 4–5 km altitude; a similar phenomenon can be found in Figure 6, Figure 7, Figure 8 and Figure 9. For precipitation clouds with rainfall intensities ranging from 0.1 to 9.9 mm h−1, approximately half of the LWC values are below 10 g m−3; as the rainfall intensity increases to 10–19.9 mm h−1 and 20–30 mm h−1, around half of the LWC values are greater than 50 or 60 g m−3. Additionally, unlike the situation in which the maximum reflectivity values remain almost the same under different precipitation intensities, as seen in Figure 8, the maximum LWC values corresponding to different precipitation intensities exhibit some differences. The 95th-percentile LWC values for precipitation intensities ranging from 0.1 to 9.9, 10 to 19.9, and 20 to 30 mm h−1 are 210, 230, and 245 g m−3, respectively. This indicates that, in terms of precipitation extremes, LWC may be more indicative than reflectivity intensity.
4. Conclusions
Based on the millimeter-wave cloud radar (MMCR) and ground automatic weather station precipitation observation data from May 2019 to August 2021, we conducted an analysis of the seasonal and diurnal variations in cloud occurrence frequency in the Guangzhou area of South China, as well as the vertical structure characteristics of clouds under different seasons and precipitation intensities. The main research findings are as follows.
The seasonal variation in cloud occurrence frequency is significant, ranging from 40% to 80%. There is a bimodal distribution throughout the year, with peaks in March to June and October, reaching the highest occurrence frequency of about 80% in May and the lowest occurrence frequency of about 40% from December to February of the following year. Additionally, cloud occurrence frequency also exhibits distinct diurnal variations, with the lowest occurrence frequency around 0005 LST, rapidly increasing after 0006 LST, and peaking in the afternoon to evening. The peak occurrence frequency during the flood season is mainly around 0020 LST, while during the non-flood season, it is around 0017 LST.
Cloud top heights (CTHs) show a bimodal distribution during both the pre-flood and post-flood seasons. The high-frequency distribution intervals for cloud top heights are below 3 km and around 11–14 km. During the pre-flood season, the most frequent cloud top height interval is below 3 km, accounting for approximately 43%, with a slow increase in frequency above 7 km and reaching a secondary peak around 12–14 km. In contrast, during the post-flood season, the highest frequency interval for cloud top heights is around 11–14 km, accounting for approximately 37%, while the frequency of the secondary peak below 3 km is about 16%.
Precipitation clouds can reach heights exceeding 12 km, with the reflectivity intensity gradually decreasing from above 40 dBZ to below −20 dBZ as the altitude increases. High-frequency occurrences are observed below 2 km and between 4 and 7 km altitude levels. The vertical structure of precipitation clouds exhibits distinct diurnal variations, with the reflectivity intensity gradually increasing and heights rising from early morning to nighttime. During the period from 0000 to 0600 LST, echoes mainly appear at altitudes below 2 km and between 4 and 6 km, with the reflectivity intensity ranging from −20 dBZ to 40 dBZ. Subsequently, cloud layers develop above 6 km, while the reflectivity intensity below 4 km intensifies. In the afternoon to nighttime, the reflectivity intensity below 4 km reaches its peak (mostly above 20 dBZ), while the frequency and intensity increase noticeably between 4 and 12 km altitudes. Regarding seasonal variations, the vertical extent and intensity of precipitation cloud echoes during the post-flood season are generally higher compared to the pre-flood season.
Under different precipitation intensities, the profiles of cloud reflectivity and cloud ice/liquid water content (IWC/LWC) exhibit roughly similar trends. Above 5 km altitude, they show a gradual decrease. However, between 4 and 5 km altitude, they rapidly increase as the altitude decreases. At 2–4 km altitude, the reflectivity intensity reaches a maximum and then remains relatively constant. The differences in profiles among different precipitation intensities primarily lie below 4 km altitude, where both reflectivity intensity and LWC increase overall with increasing precipitation intensity. For clouds with precipitation intensities ranging from 0.1 to 9.9 mm h−1, 10 to 19.9 mm h−1, and 20 to 30 mm h−1, the corresponding 95th percentile values of IWC/LWC are 210 g m−3, 230 g m−3, and 245 g m−3, respectively. Meanwhile, the 95th percentile values of maximum reflectivity intensity are consistently around 40 dBZ.
This study analyzed cloud characteristics in the Guangzhou region based on data from MMCR spanning over two years. The findings are expected to provide a more comprehensive understanding of cloud features in South China and to serve as a scientific basis for accurate forecasting and warning of meteorological disasters. However, due to the limited duration of cloud radar data used in this study and the analysis, which was based only on reflectivity and LWC, future research could explore clouds’ microphysical characteristics based on additional physical quantities, such as particle radius and particle number concentration. Moreover, investigations involving dynamic process analysis related to vertical velocity could further explore the characteristics of clouds in the South China region.
Author Contributions
Conceptualization, H.L. (Haowen Li) and C.M.; methodology, J.L.; software, M.L.; validation, B.C.; formal analysis, L.Z.; investigation, H.L. (Huaiyu Li); resources, J.Z.; data curation, H.L. (Haowen Li); writing—original draft preparation, H.L. (Haowen Li); writing—review and editing, C.M.; visualization, H.L. (Haowen Li); supervision, J.L.; project administration, H.L. (Huaiyu Li); funding acquisition, H.L. (Huaiyu Li). All authors have read and agreed to the published version of the manuscript.
Funding
This study was jointly supported by the Guangzhou Fundamental and Applied Basic Research Project (202201011093), Natural Science Foundation of Guangdong Province (2022A1515011346), Guangzhou Science and Technology Plan Project (2023B04J0631 and 2023B04J0667) and Key-Area Research and Development Program of Guangdong Province (2020B1111200001).
Institutional Review Board Statement
Not applicable.
Informed Consent Statement
Not applicable.
Data Availability Statement
The data presented in this study are available upon request from the corresponding author. The data are not publicly available due to privacy.
Acknowledgments
We would like to acknowledge the reviewers and editor for their helpful comments and suggestions.
Conflicts of Interest
The authors declare no conflicts of interest.
References
- Ramanathan, V.; Cess, R.D.; Harrison, E.F.; Minnis, P.; Barkstrom, B.R.; Ahmad, E.; Hartmann, D. Cloud-Radiative Forcing and Climate: Results from the Earth Radiation Budget Experiment. Science 1989, 243, 57–63. [Google Scholar] [CrossRef] [PubMed]
- Vaideanu, P.; Ionita, M.; Voiculescu, M.; Rimbu, N. Deconstructing Global Observed and Reanalysis Total Cloud Cover Fields Based on Pacific Climate Modes. Atmosphere 2023, 14, 456. [Google Scholar] [CrossRef]
- Norris, J.R.; Allen, R.J.; Evan, A.T.; Zelinka, M.D.; O’Dell, C.W.; Klein, S.A. Evidence for Climate Change in the Satellite Cloud Record. Nature 2016, 536, 72. [Google Scholar] [CrossRef] [PubMed]
- Ravi Kiran, V.; Rajeevan, M.; Gadhavi, H.; Rao, S.V.B.; Jayaraman, A. Role of Vertical Structure of Cloud Microphysical Properties on Cloud Radiative Forcing over the Asian Monsoon Region. Clim. Dyn. 2015, 45, 3331–3345. [Google Scholar] [CrossRef]
- Feng, Z.; Leung, L.R.; Houze, R.A., Jr.; Hagos, S.; Hardin, J.; Yang, Q.; Han, B.; Fan, J. Structure and Evolution of Mesoscale Convective Systems: Sensitivity to Cloud Microphysics in Convection-Permitting Simulations Over the United States. J. Adv. Model. Earth Syst. 2018, 10, 1470–1494. [Google Scholar] [CrossRef]
- Dong, X.; Minnis, P.; Xi, B. A Climatology of Midlatitude Continental Clouds from the ARM SGP Central Facility: Part I: Low-Level Cloud Macrophysical, Microphysical, and Radiative Properties. J. Clim. 2005, 18, 1391–1410. [Google Scholar] [CrossRef]
- Ye, Q.-Z. Forecasting Cloud Cover and Atmospheric Seeing for Astronomical Observing: Application and Evaluation of the Global Forecast System. Publ. Astron. Soc. Pac. 2011, 123, 113–124. [Google Scholar] [CrossRef]
- Fujiwara, M.; Sugidachi, T.; Arai, T.; Shimizu, K.; Hayashi, M.; Noma, Y.; Kawagita, H.; Sagara, K.; Nakagawa, T.; Okumura, S.; et al. Development of a Cloud Particle Sensor for Radiosonde Sounding. Atmos. Meas. Tech. 2016, 9, 5911–5931. [Google Scholar] [CrossRef]
- Narendra Reddy, N.; Venkat Ratnam, M.; Basha, G.; Ravikiran, V. Cloud Vertical Structure over a Tropical Station Obtained Using Long-Term High-Resolution Radiosonde Measurements. Atmos. Chem. Phys. 2018, 18, 11709–11727. [Google Scholar] [CrossRef]
- Wang, J.; Rossow, W.B.; Zhang, Y. Cloud Vertical Structure and Its Variations from a 20-Yr Global Rawinsonde Dataset. J. Clim. 2000, 13, 3041–3056. [Google Scholar] [CrossRef]
- Sharma, S.; Dass, A.; Mishra, A.K.; Singh, S.; Kumar, K. A Decadal Climatology of Cloud Vertical Structure over the Indo-Gangetic Plain Using Radiosonde and Radar Observations. Atmos. Res. 2022, 266, 105949. [Google Scholar] [CrossRef]
- Guo, J.; Miao, Y.; Zhang, Y.; Liu, H.; Li, Z.; Zhang, W.; He, J.; Lou, M.; Yan, Y.; Bian, L.; et al. The Climatology of Planetary Boundary Layer Height in China Derived from Radiosonde and Reanalysis Data. Atmos. Chem. Phys. 2016, 16, 13309–13319. [Google Scholar] [CrossRef]
- Luo, H.; Han, Y.; Dong, L.; Xu, D.; Ma, T.; Liao, J. Robust Variation Trends in Cloud Vertical Structure Observed from Three-Decade Radiosonde Record at Lindenberg, Germany. Atmos. Res. 2023, 281, 106469. [Google Scholar] [CrossRef]
- Geer, A.J.; Baordo, F.; Bormann, N.; Chambon, P.; English, S.J.; Kazumori, M.; Lawrence, H.; Lean, P.; Lonitz, K.; Lupu, C. The Growing Impact of Satellite Observations Sensitive to Humidity, Cloud and Precipitation. Q. J. R. Meteorol. Soc. 2017, 143, 3189–3206. [Google Scholar] [CrossRef]
- Zhang, J.; Li, Z.; Chen, H.; Cribb, M. Validation of a Radiosonde-Based Cloud Layer Detection Method against a Ground-Based Remote Sensing Method at Multiple ARM Sites. J. Geophys. Res. Atmos. 2013, 118, 846–858. [Google Scholar] [CrossRef]
- Yang, P.; Hioki, S.; Saito, M.; Kuo, C.-P.; Baum, B.A.; Liou, K.-N. A Review of Ice Cloud Optical Property Models for Passive Satellite Remote Sensing. Atmosphere 2018, 9, 499. [Google Scholar] [CrossRef]
- Sassen, K.; Wang, Z. Classifying Clouds around the Globe with the CloudSat Radar: 1-Year of Results. Geophys. Res. Lett. 2008, 35, L04805. [Google Scholar] [CrossRef]
- Li, J.; Huang, J.; Stamnes, K.; Wang, T.; Lv, Q.; Jin, H. A Global Survey of Cloud Overlap Based on CALIPSO and CloudSat Measurements. Atmos. Chem. Phys. 2015, 15, 519–536. [Google Scholar] [CrossRef]
- Hu, Y.; Winker, D.; Vaughan, M.; Lin, B.; Omar, A.; Trepte, C.; Flittner, D.; Yang, P.; Nasiri, S.L.; Baum, B.; et al. CALIPSO/CALIOP Cloud Phase Discrimination Algorithm. J. Atmos. Ocean. Technol. 2009, 26, 2293–2309. [Google Scholar] [CrossRef]
- Choudhury, G.; Tesche, M. Estimating Cloud Condensation Nuclei Concentrations from CALIPSO Lidar Measurements. Atmos. Meas. Tech. 2022, 15, 639–654. [Google Scholar] [CrossRef]
- Luo, H.; Quaas, J.; Han, Y. Examining Cloud Vertical Structure and Radiative Effects from Satellite Retrievals and Evaluation of CMIP6 Scenarios. Atmos. Chem. Phys. 2023, 23, 8169–8186. [Google Scholar] [CrossRef]
- Sekiguchi, M.; Nakajima, T.; Suzuki, K.; Kawamoto, K.; Higurashi, A.; Rosenfeld, D.; Sano, I.; Mukai, S. A Study of the Direct and Indirect Effects of Aerosols Using Global Satellite Data Sets of Aerosol and Cloud Parameters. J. Geophys. Res. Atmos. 2003, 108, 4699. [Google Scholar] [CrossRef]
- Guo, J.; Liu, H.; Wang, F.; Huang, J.; Xia, F.; Lou, M.; Wu, Y.; Jiang, J.H.; Xie, T.; Zhaxi, Y.; et al. Three-Dimensional Structure of Aerosol in China: A Perspective from Multi-Satellite Observations. Atmos. Res. 2016, 178–179, 580–589. [Google Scholar] [CrossRef]
- Zhang, J.; Li, Z.; Chen, H.; Yoo, H.; Cribb, M. Cloud Vertical Distribution from Radiosonde, Remote Sensing, and Model Simulations. Clim. Dyn. 2014, 43, 1129–1140. [Google Scholar] [CrossRef]
- Liu, C.-Y.; Chiu, C.-H.; Lin, P.-H.; Min, M. Comparison of Cloud-Top Property Retrievals from Advanced Himawari Imager, MODIS, CloudSat/CPR, CALIPSO/CALIOP, and Radiosonde. J. Geophys. Res. Atmos. 2020, 125, e2020JD032683. [Google Scholar] [CrossRef]
- Utrillas, M.P.; Marín, M.J.; Estellés, V.; Marcos, C.; Freile, M.D.; Gómez-Amo, J.L.; Martínez-Lozano, J.A. Comparison of Cloud Amounts Retrieved with Three Automatic Methods and Visual Observations. Atmosphere 2022, 13, 937. [Google Scholar] [CrossRef]
- Guyot, A.; Protat, A.; Alexander, S.P.; Klekociuk, A.R.; Kuma, P.; McDonald, A. Detection of Supercooled Liquid Water Containing Clouds with Ceilometers: Development and Evaluation of Deterministic and Data-Driven Retrievals. Atmos. Meas. Tech. 2022, 15, 3663–3681. [Google Scholar] [CrossRef]
- Yuan, Y.; Di, H.; Liu, Y.; Yang, T.; Li, Q.; Yan, Q.; Xin, W.; Li, S.; Hua, D. Detection and Analysis of Cloud Boundary in Xi’an, China, Employing 35 GHz Cloud Radar Aided by 1064 Nm Lidar. Atmos. Meas. Tech. 2022, 15, 4989–5006. [Google Scholar] [CrossRef]
- Borg, L.A.; Holz, R.E.; Turner, D.D. Investigating Cloud Radar Sensitivity to Optically Thin Cirrus Using Collocated Raman Lidar Observations. Geophys. Res. Lett. 2011, 38, L05807. [Google Scholar] [CrossRef]
- Zhou, R.; Wang, G.; Zhaxi, S. Cloud Vertical Structure Measurements from a Ground-Based Cloud Radar over the Southeastern Tibetan Plateau. Atmos. Res. 2021, 258, 105629. [Google Scholar] [CrossRef]
- Zeng, Y.; Yang, L.; Zhang, Z.; Tong, Z.; Li, J.; Liu, F.; Zhang, J.; Jiang, Y. Characteristics of Clouds and Raindrop Size Distribution in Xinjiang, Using Cloud Radar Datasets and a Disdrometer. Atmosphere 2020, 11, 1382. [Google Scholar] [CrossRef]
- Zhao, C.; Liu, L.; Wang, Q.; Qiu, Y.; Wang, Y.; Wu, X. MMCR-Based Characteristic Properties of Non-Precipitating Cloud Liquid Droplets at Naqu Site over Tibetan Plateau in July 2014. Atmos. Res. 2017, 190, 68–76. [Google Scholar] [CrossRef]
- Chen, Z.; Yin, L.; Chen, X.; Wei, S.; Zhu, Z. Research on the Characteristics of Urban Rainstorm Pattern in the Humid Area of Southern China: A Case Study of Guangzhou City. Int. J. Climatol. 2015, 35, 4370–4386. [Google Scholar] [CrossRef]
- Ye, L.; Liu, X.; Pu, Y.; Li, H.; Xia, F.; Xu, B. Contrasts in the Evolution and Microphysical Features of Two Convective Systems during a Heavy Rainfall Event along the Coast of South China. Atmosphere 2022, 13, 1549. [Google Scholar] [CrossRef]
- Shahi, N.K.; Rai, S.; Sahai, A.K. The Relationship between the Daily Dominant Monsoon Modes of South Asia and SST. Theor. Appl. Climatol. 2020, 142, 59–70. [Google Scholar] [CrossRef]
- Zheng, J.; Liu, L.; Zeng, Z.; Xie, X.; Wu, J.; Feng, K. Ka-Band Millimeter Wave Cloud Radar Data Quality Control. J. Infrared Millim. Waves 2016, 35, 748–757. (In Chinese) [Google Scholar]
- Zheng, J.; Liu, L.; Chen, H.; Gou, Y.; Che, Y.; Xu, H.; Li, Q. Characteristics of Warm Clouds and Precipitation in South China during the Pre-Flood Season Using Datasets from a Cloud Radar, a Ceilometer, and a Disdrometer. Remote Sens. 2019, 11, 3045. [Google Scholar] [CrossRef]
- Yuter, S.E. Three-Dimensional Kinematic and Microphysical Evolution of Florida Cumulonimbus. Part II: Frequency Distributions of Vertical Velocity, Reflectivity, and Differential Reflectivity. Mon. Weather. Rev. 1995, 123, 1921–1940. [Google Scholar] [CrossRef]
- Guo, J.; Liu, H.; Li, Z.; Rosenfeld, D.; Jiang, M.; Xu, W.; Jiang, J.H.; He, J.; Chen, D.; Min, M.; et al. Aerosol-Induced Changes in the Vertical Structure of Precipitation: A Perspective of TRMM Precipitation Radar. Atmos. Chem. Phys. 2018, 18, 13329–13343. [Google Scholar] [CrossRef]
- Zhang, Y.; Zhou, Q.; Lv, S.; Jia, S.; Tao, F.; Chen, D.; Guo, J. Elucidating Cloud Vertical Structures Based on Three-Year Ka-Band Cloud Radar Observations from Beijing, China. Atmos. Res. 2019, 222, 88–99. [Google Scholar] [CrossRef]
- Fu, C.; Dan, L.; Lin, X.; Yang, F. Long-Term Change of Total Cloud Cover and Its Possible Reason over South China during 1960–2012. Atmos. Sci. Lett. 2019, 20, e943. [Google Scholar] [CrossRef]
- Chen, H.; Yu, R.; Wu, B. FY-2C-derived Diurnal Features of Clouds in the Southern Contiguous China. J. Geophys. Res. 2012, 117, D18101. [Google Scholar] [CrossRef]
- Zhang, Y.; Zhang, L.; Guo, J.; Feng, J.; Cao, L.; Wang, Y.; Zhou, Q.; Li, L.; Li, B.; Xu, H.; et al. Climatology of Cloud-Base Height from Long-Term Radiosonde Measurements in China. Adv. Atmos. Sci. 2018, 35, 158–168. [Google Scholar] [CrossRef]
- Zhang, J.; Yang, L.; Liu, F.; Li, J.; Zhou, Y. Macro-Micro Physical Characteristics of Rainfall Clouds in the West Tianshan Mountains Based on Ka-Band Cloud Radar. Chin. J. Atmos. Sci. 2023, 47, 756–768. (In Chinese) [Google Scholar] [CrossRef]
- Li, Z.; Lau, W.K.-M.; Ramanathan, V.; Wu, G.; Ding, Y.; Manoj, M.G.; Liu, J.; Qian, Y.; Li, J.; Zhou, T.; et al. Aerosol and Monsoon Climate Interactions over Asia. Rev. Geophys. 2016, 54, 866–929. [Google Scholar] [CrossRef]
- Zhong, M.; Xiao, A.; Xu, G. Study on Probability Forecast Method about Graded Short-Term Heavy Rain Based on CMA-MESO. J. Arid. Meteorol. 2022, 40, 700–709. (In Chinese) [Google Scholar] [CrossRef]
- Xu, W.; Zipser, E.; Liu, C. Rainfall Characteristics and Convective Properties of Mei-Yu Precipitation Systems over South China, Taiwan, and the South China Sea. Part I: TRMM Observations. Mon. Weather. Rev. 2009, 137, 4261–4275. [Google Scholar] [CrossRef]
- He, J.; Zheng, J.; Zeng, Z.; Che, Y.; Zheng, M.; Li, J. A Comparative Study on the Vertical Structures and Microphysical Properties of Stratiform Precipitation over South China and the Tibetan Plateau. Remote Sens. 2021, 13, 2897. [Google Scholar] [CrossRef]
- Sukanya, P.; Kalapureddy, M.C.R. Cloud Microphysical Profile Differences Pertinent to Monsoon Phases: Inferences from a Cloud Radar. Meteorol. Atmos. Phys. 2019, 131, 1723–1738. [Google Scholar] [CrossRef]
Figure 1.
Experimental location of the Guangzhou Weather Observatory (GZWO; 113°19′12″ E, 23°0′36″ N, 42 m above sea level).
Figure 1.
Experimental location of the Guangzhou Weather Observatory (GZWO; 113°19′12″ E, 23°0′36″ N, 42 m above sea level).

Figure 2.
The time-height cross section of MMCR-observed radar reflectivity before (a) and after (b) quality control at GZWO on 20 May 2020.
Figure 2.
The time-height cross section of MMCR-observed radar reflectivity before (a) and after (b) quality control at GZWO on 20 May 2020.

Figure 3.
Cloud occurrence frequency in each month, as observed by MMCR in GZWO during the observation period.
Figure 3.
Cloud occurrence frequency in each month, as observed by MMCR in GZWO during the observation period.

Figure 4.
Diurnal variation of cloud occurrence frequency in different seasons.

Figure 5.
Histogram of CTHs as observed by MMCR installed at GZWO for the period of 2019 to 2021 for (a) pre-flood season and (b) post-flood season.
Figure 5.
Histogram of CTHs as observed by MMCR installed at GZWO for the period of 2019 to 2021 for (a) pre-flood season and (b) post-flood season.

Figure 6.
Normalized contoured frequency by altitude diagram (NCFAD) for precipitating clouds in (a) pre-flood season and (b) post-flood season.
Figure 6.
Normalized contoured frequency by altitude diagram (NCFAD) for precipitating clouds in (a) pre-flood season and (b) post-flood season.

Figure 7.
Normalized contoured frequency by altitude diagram (NCFAD) for precipitating clouds in pre-flood season during (a) 0000–0600 LST; (b) 0700–1200 LST; (c) 1300–1800 LST; (d) 1900–2400 LST.
Figure 7.
Normalized contoured frequency by altitude diagram (NCFAD) for precipitating clouds in pre-flood season during (a) 0000–0600 LST; (b) 0700–1200 LST; (c) 1300–1800 LST; (d) 1900–2400 LST.

Figure 8.
Normalized contoured frequency by altitude diagram (NCFAD) for precipitating clouds in post-flood season during (a) 0000–0600 LST; (b) 0700–1200 LST; (c) 1300–1800 LST; (d) 1900–2400 LST.
Figure 8.
Normalized contoured frequency by altitude diagram (NCFAD) for precipitating clouds in post-flood season during (a) 0000–0600 LST; (b) 0700–1200 LST; (c) 1300–1800 LST; (d) 1900–2400 LST.

Figure 9.
Profiles of cloud radar reflectivity under different precipitation intensities: (a) 0.1–9.9 mm h−1; (b) 10–19.9 mm h−1; (c) 20–30 mm h−1.
Figure 9.
Profiles of cloud radar reflectivity under different precipitation intensities: (a) 0.1–9.9 mm h−1; (b) 10–19.9 mm h−1; (c) 20–30 mm h−1.

Figure 10.
Profiles of cloud ice/liquid water content (IWC/LWC) under different precipitation intensities: (a) 0.1–9.9 mm h−1; (b) 10–19.9 mm h−1; (c) 20–30 mm h−1.
Figure 10.
Profiles of cloud ice/liquid water content (IWC/LWC) under different precipitation intensities: (a) 0.1–9.9 mm h−1; (b) 10–19.9 mm h−1; (c) 20–30 mm h−1.

Disclaimer/Publisher’s Note: The statements, opinions and data contained in all publications are solely those of the individual author(s) and contributor(s) and not of MDPI and/or the editor(s). MDPI and/or the editor(s) disclaim responsibility for any injury to people or property resulting from any ideas, methods, instructions or products referred to in the content. |
© 2024 by the authors. Licensee MDPI, Basel, Switzerland. This article is an open access article distributed under the terms and conditions of the Creative Commons Attribution (CC BY) license (https://creativecommons.org/licenses/by/4.0/).
Share and Cite
MDPI and ACS Style
Li, H.; Mao, C.; Li, H.; Li, J.; Chen, B.; Zeng, L.; Zheng, J.; Liu, M. Cloud Characteristics in South China Using Ka-Band Millimeter Cloud Radar Datasets. Atmosphere 2024, 15, 486. https://doi.org/10.3390/atmos15040486
AMA Style
Li H, Mao C, Li H, Li J, Chen B, Zeng L, Zheng J, Liu M. Cloud Characteristics in South China Using Ka-Band Millimeter Cloud Radar Datasets. Atmosphere. 2024; 15(4):486. https://doi.org/10.3390/atmos15040486
Chicago/Turabian StyleLi, Haowen, Chengyan Mao, Huaiyu Li, Jieyi Li, Binghong Chen, Lin Zeng, Jiawen Zheng, and Mingtuan Liu. 2024. "Cloud Characteristics in South China Using Ka-Band Millimeter Cloud Radar Datasets" Atmosphere 15, no. 4: 486. https://doi.org/10.3390/atmos15040486
Note that from the first issue of 2016, this journal uses article numbers instead of page numbers. See further details here.