
Biomass Combustion in Boiler: Environmental Monitoring of Sugar Markers and Pollutants
 , , , ,
  ,
,  , , and
Abstract
:1. Introduction
- -
- The chemical and physical characterization of incoming biomass;
- -
- The combustion and stack monitoring of CO, CO2, NOx, SO2, TOC, PM, PM10, PM2.5, metals, VOC, and sugars;
- -
- The sampling and analysis of environmental PM.
2. Materials and Methods
2.1. Biomass Composition
2.2. Experimental Tests and Biomass Combustion Plant
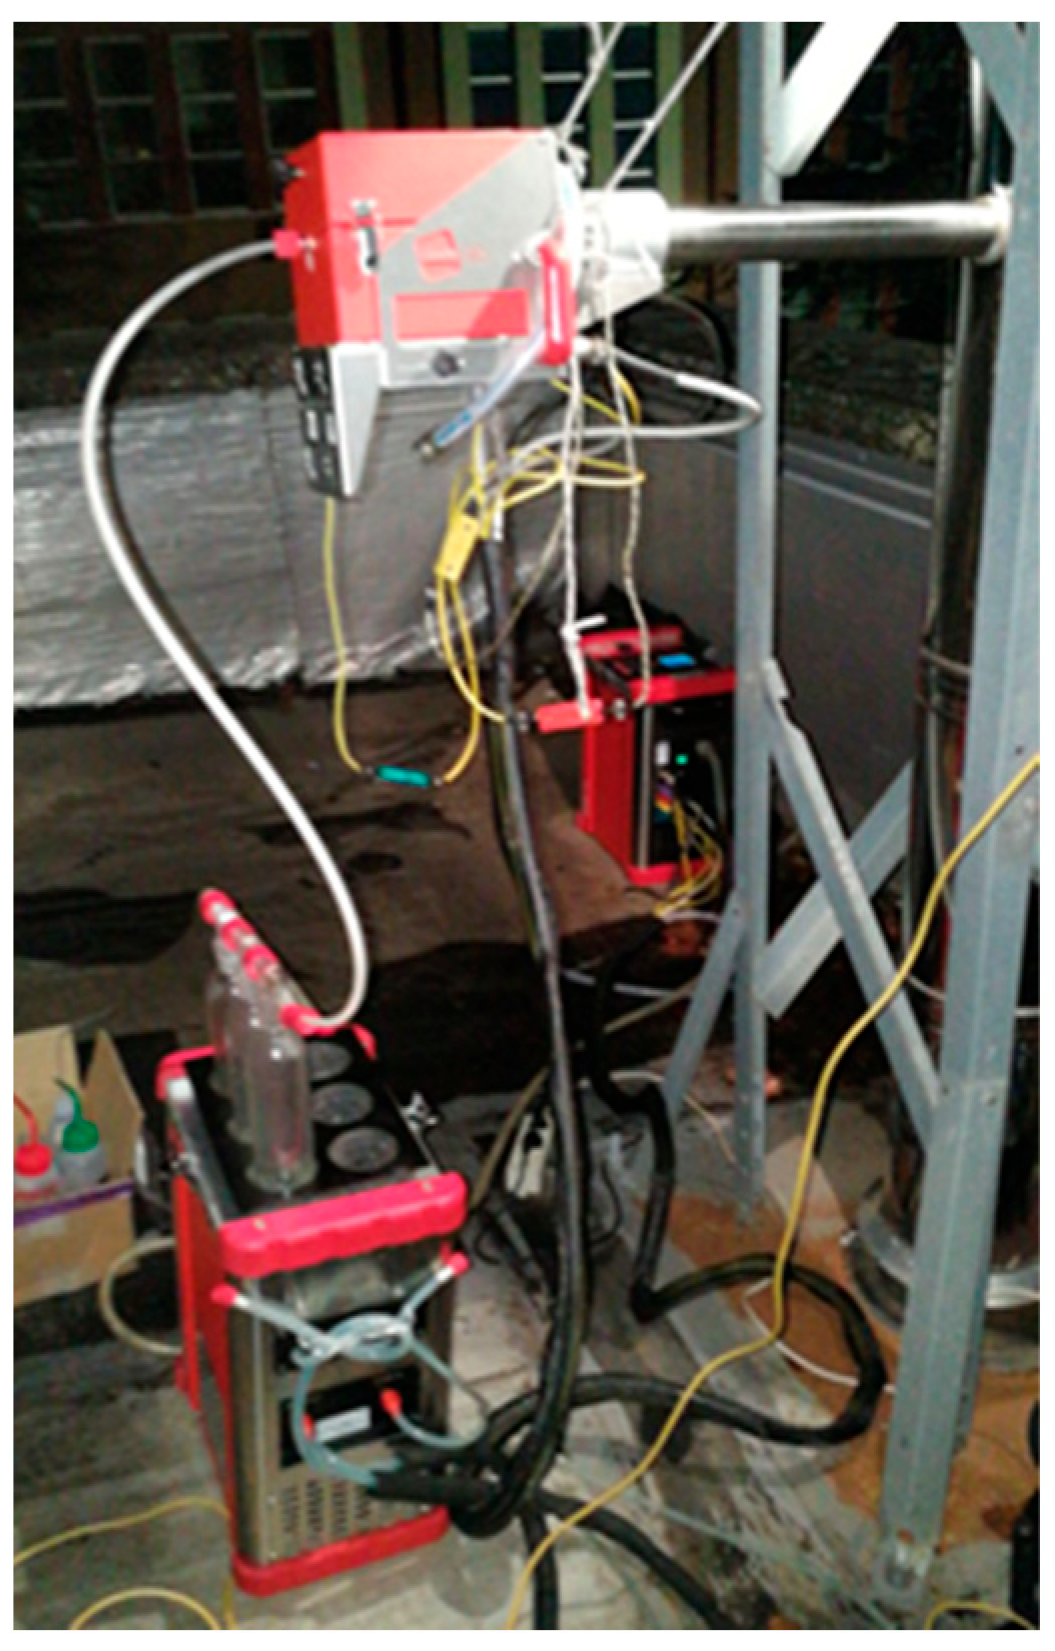
2.3. Emission Sampling and Characterization
2.3.1. Sampling and Determination of Macropollutants
2.3.2. Sampling and Determination of Volatile Organic Compounds (VOCs)
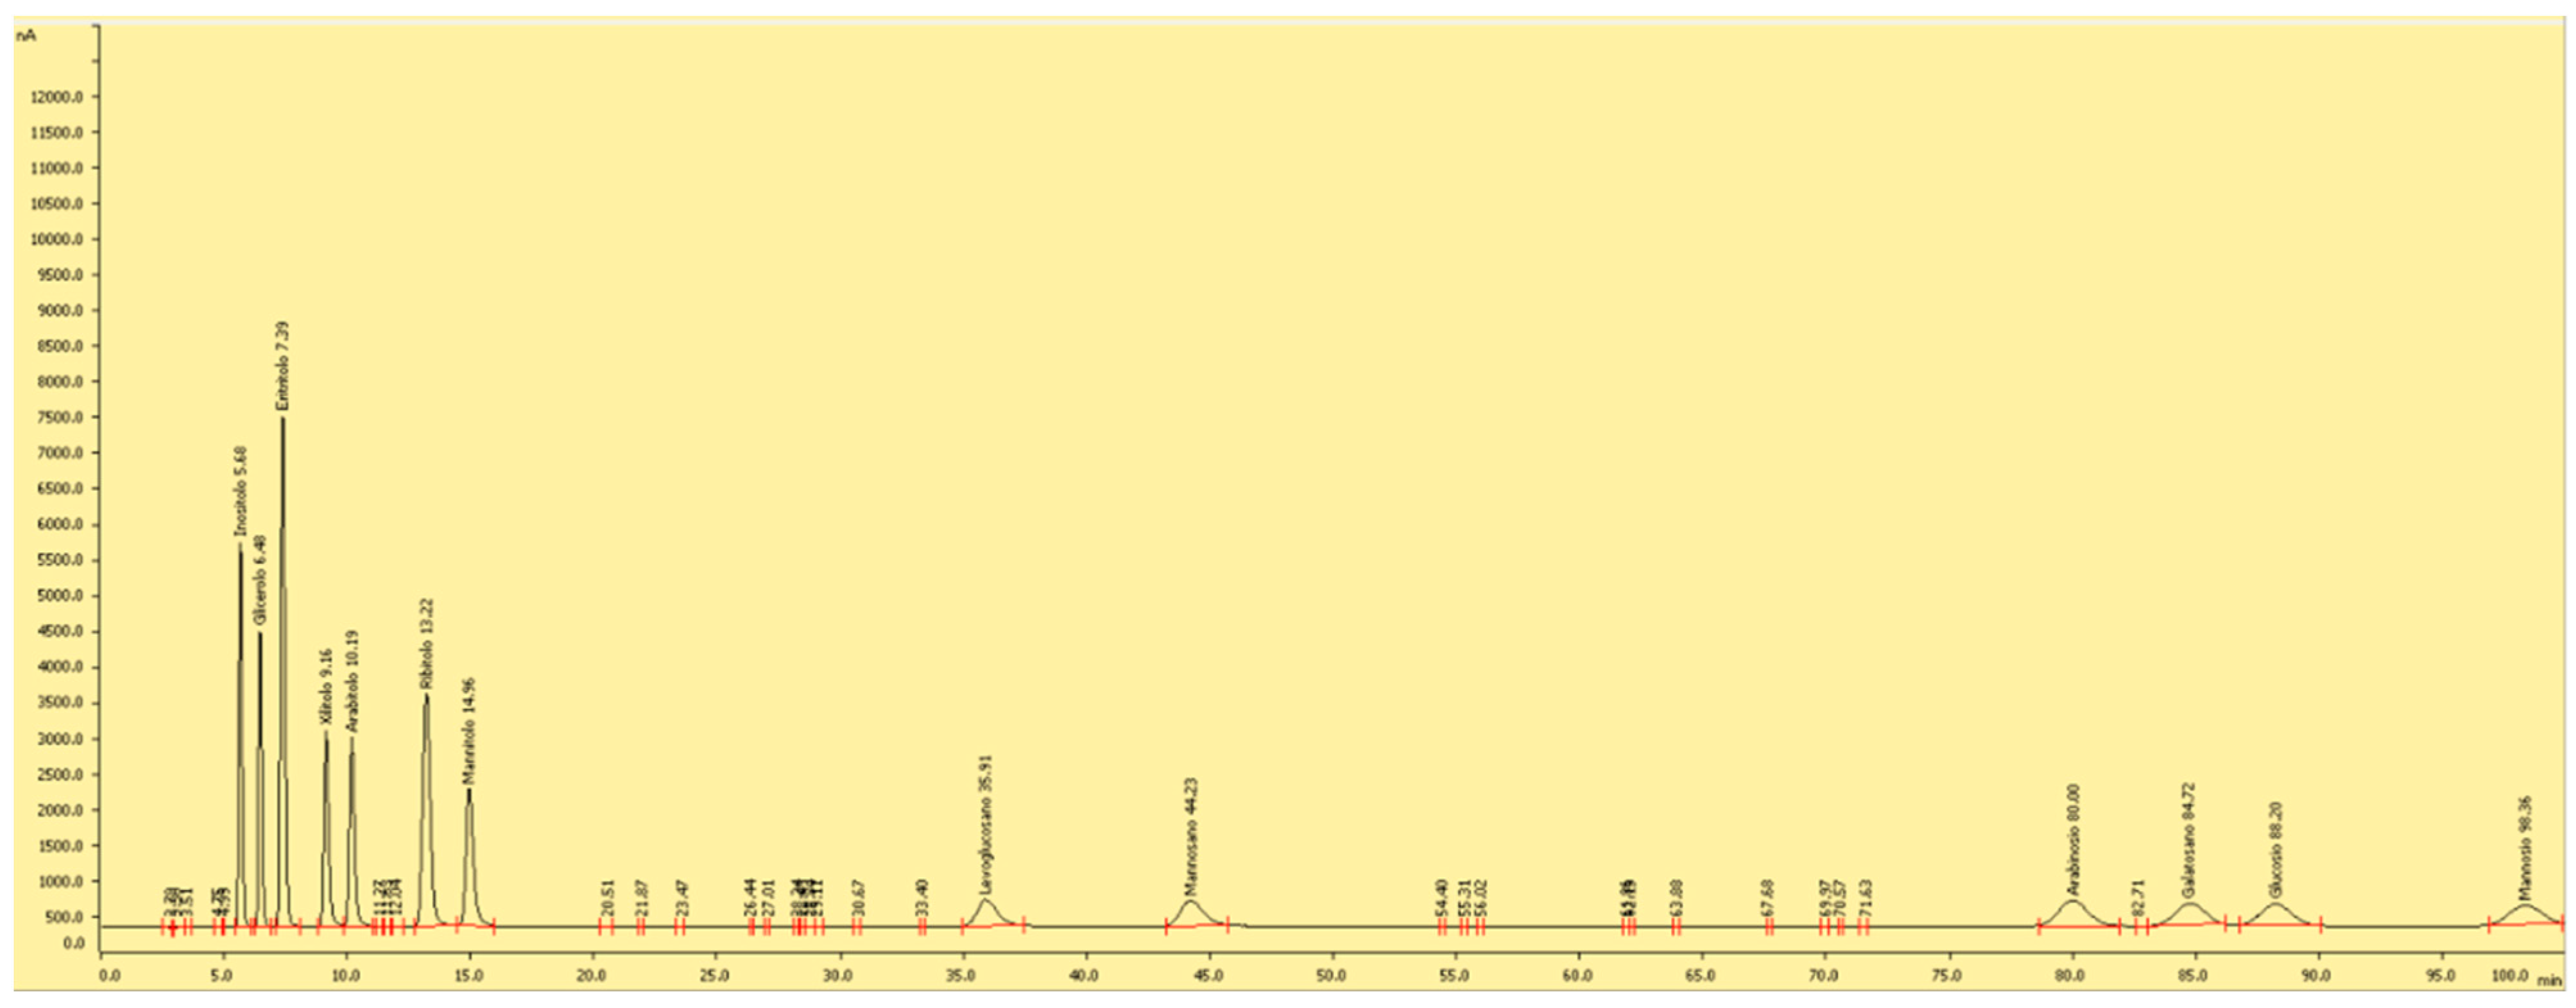
2.3.3. Methods for Sampling and Determining Fixed-Source Sugars
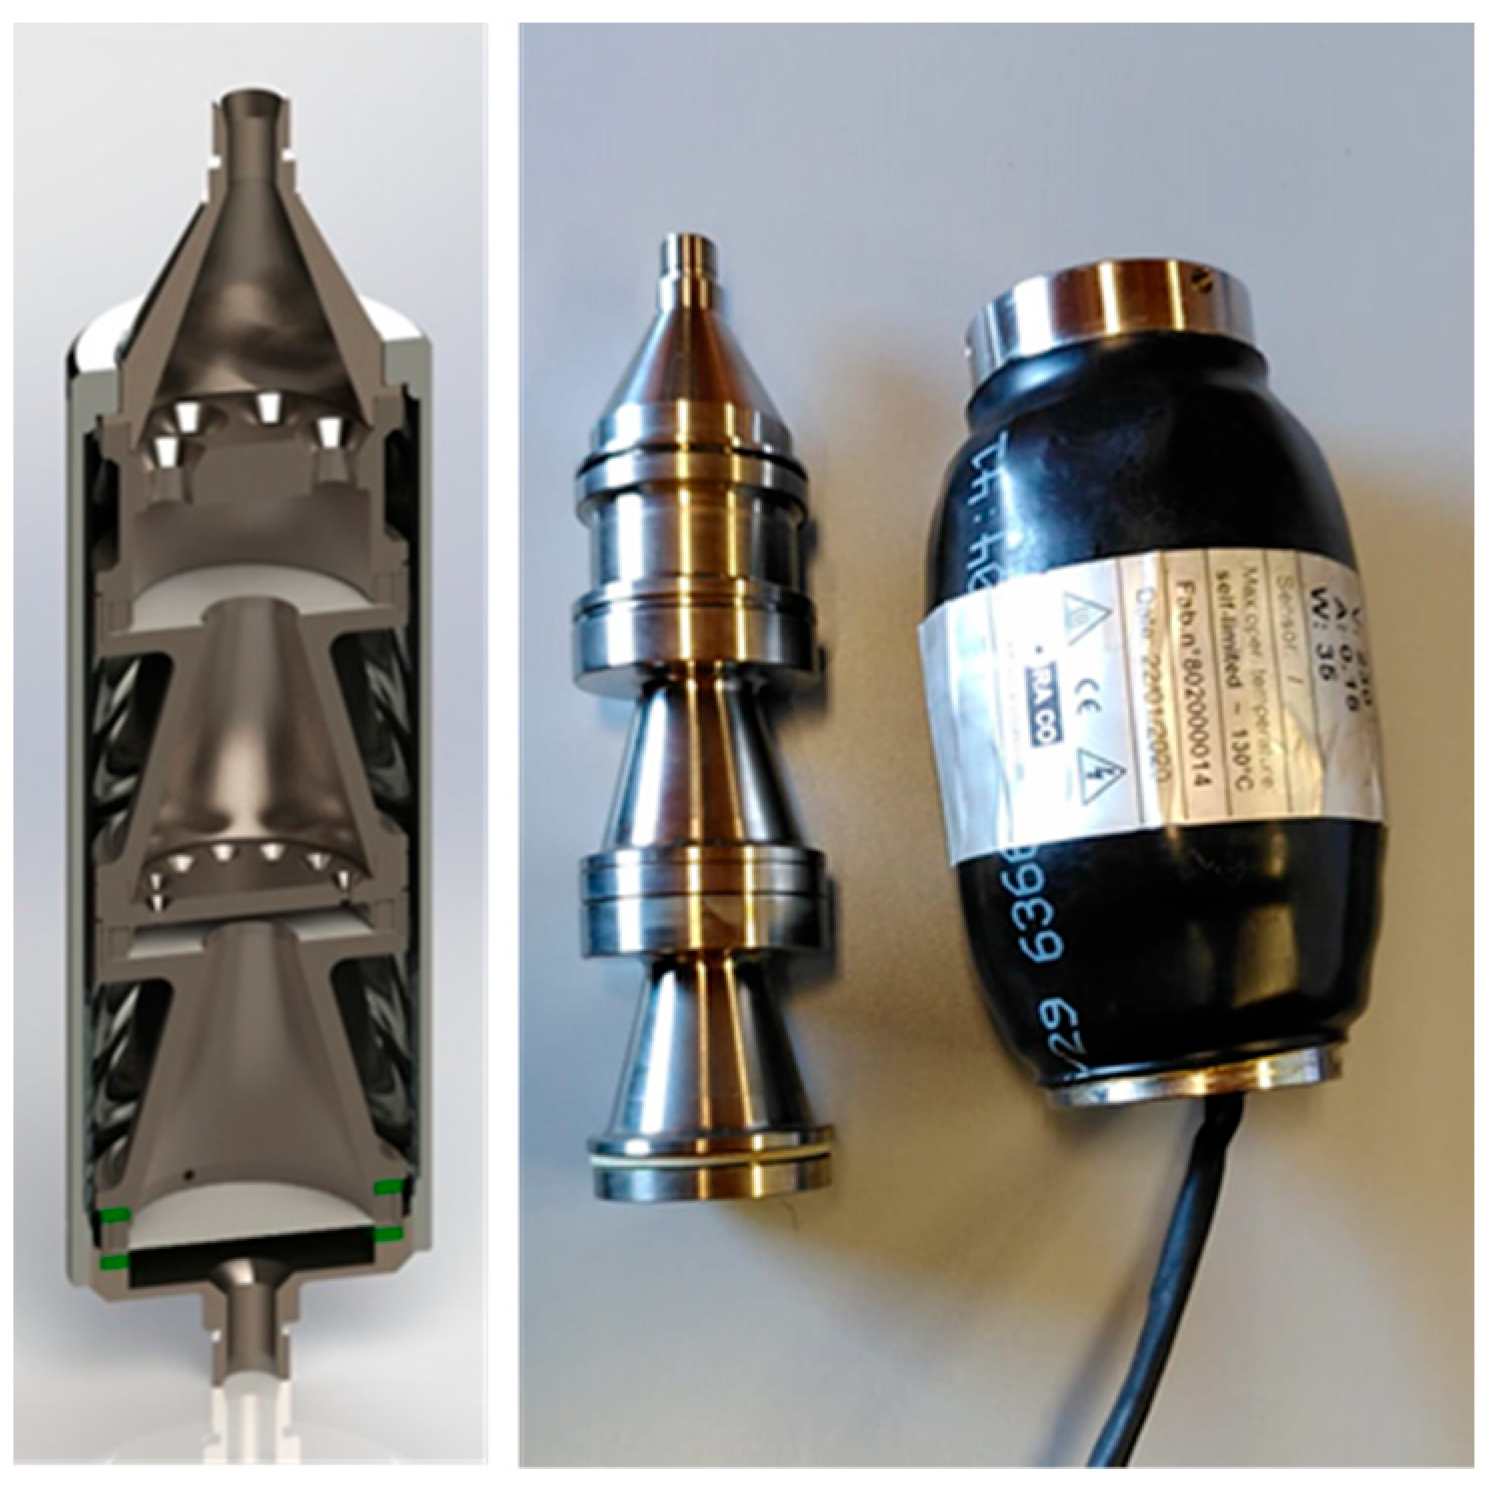
2.3.4. Sampling and Determination of Metals
3. Results and Discussion
3.1. Biomass Characterization
3.2. Emission Characterization
3.2.1. Macropollutant Emissions
3.2.2. VOC Emission
- -
- The best combustion conditions (Table 4) resulting in a lower probability of incomplete combustion products production (including VOC).
- -
- Some of the produced VOCs adsorb at the PM which is captured by the multicyclone.
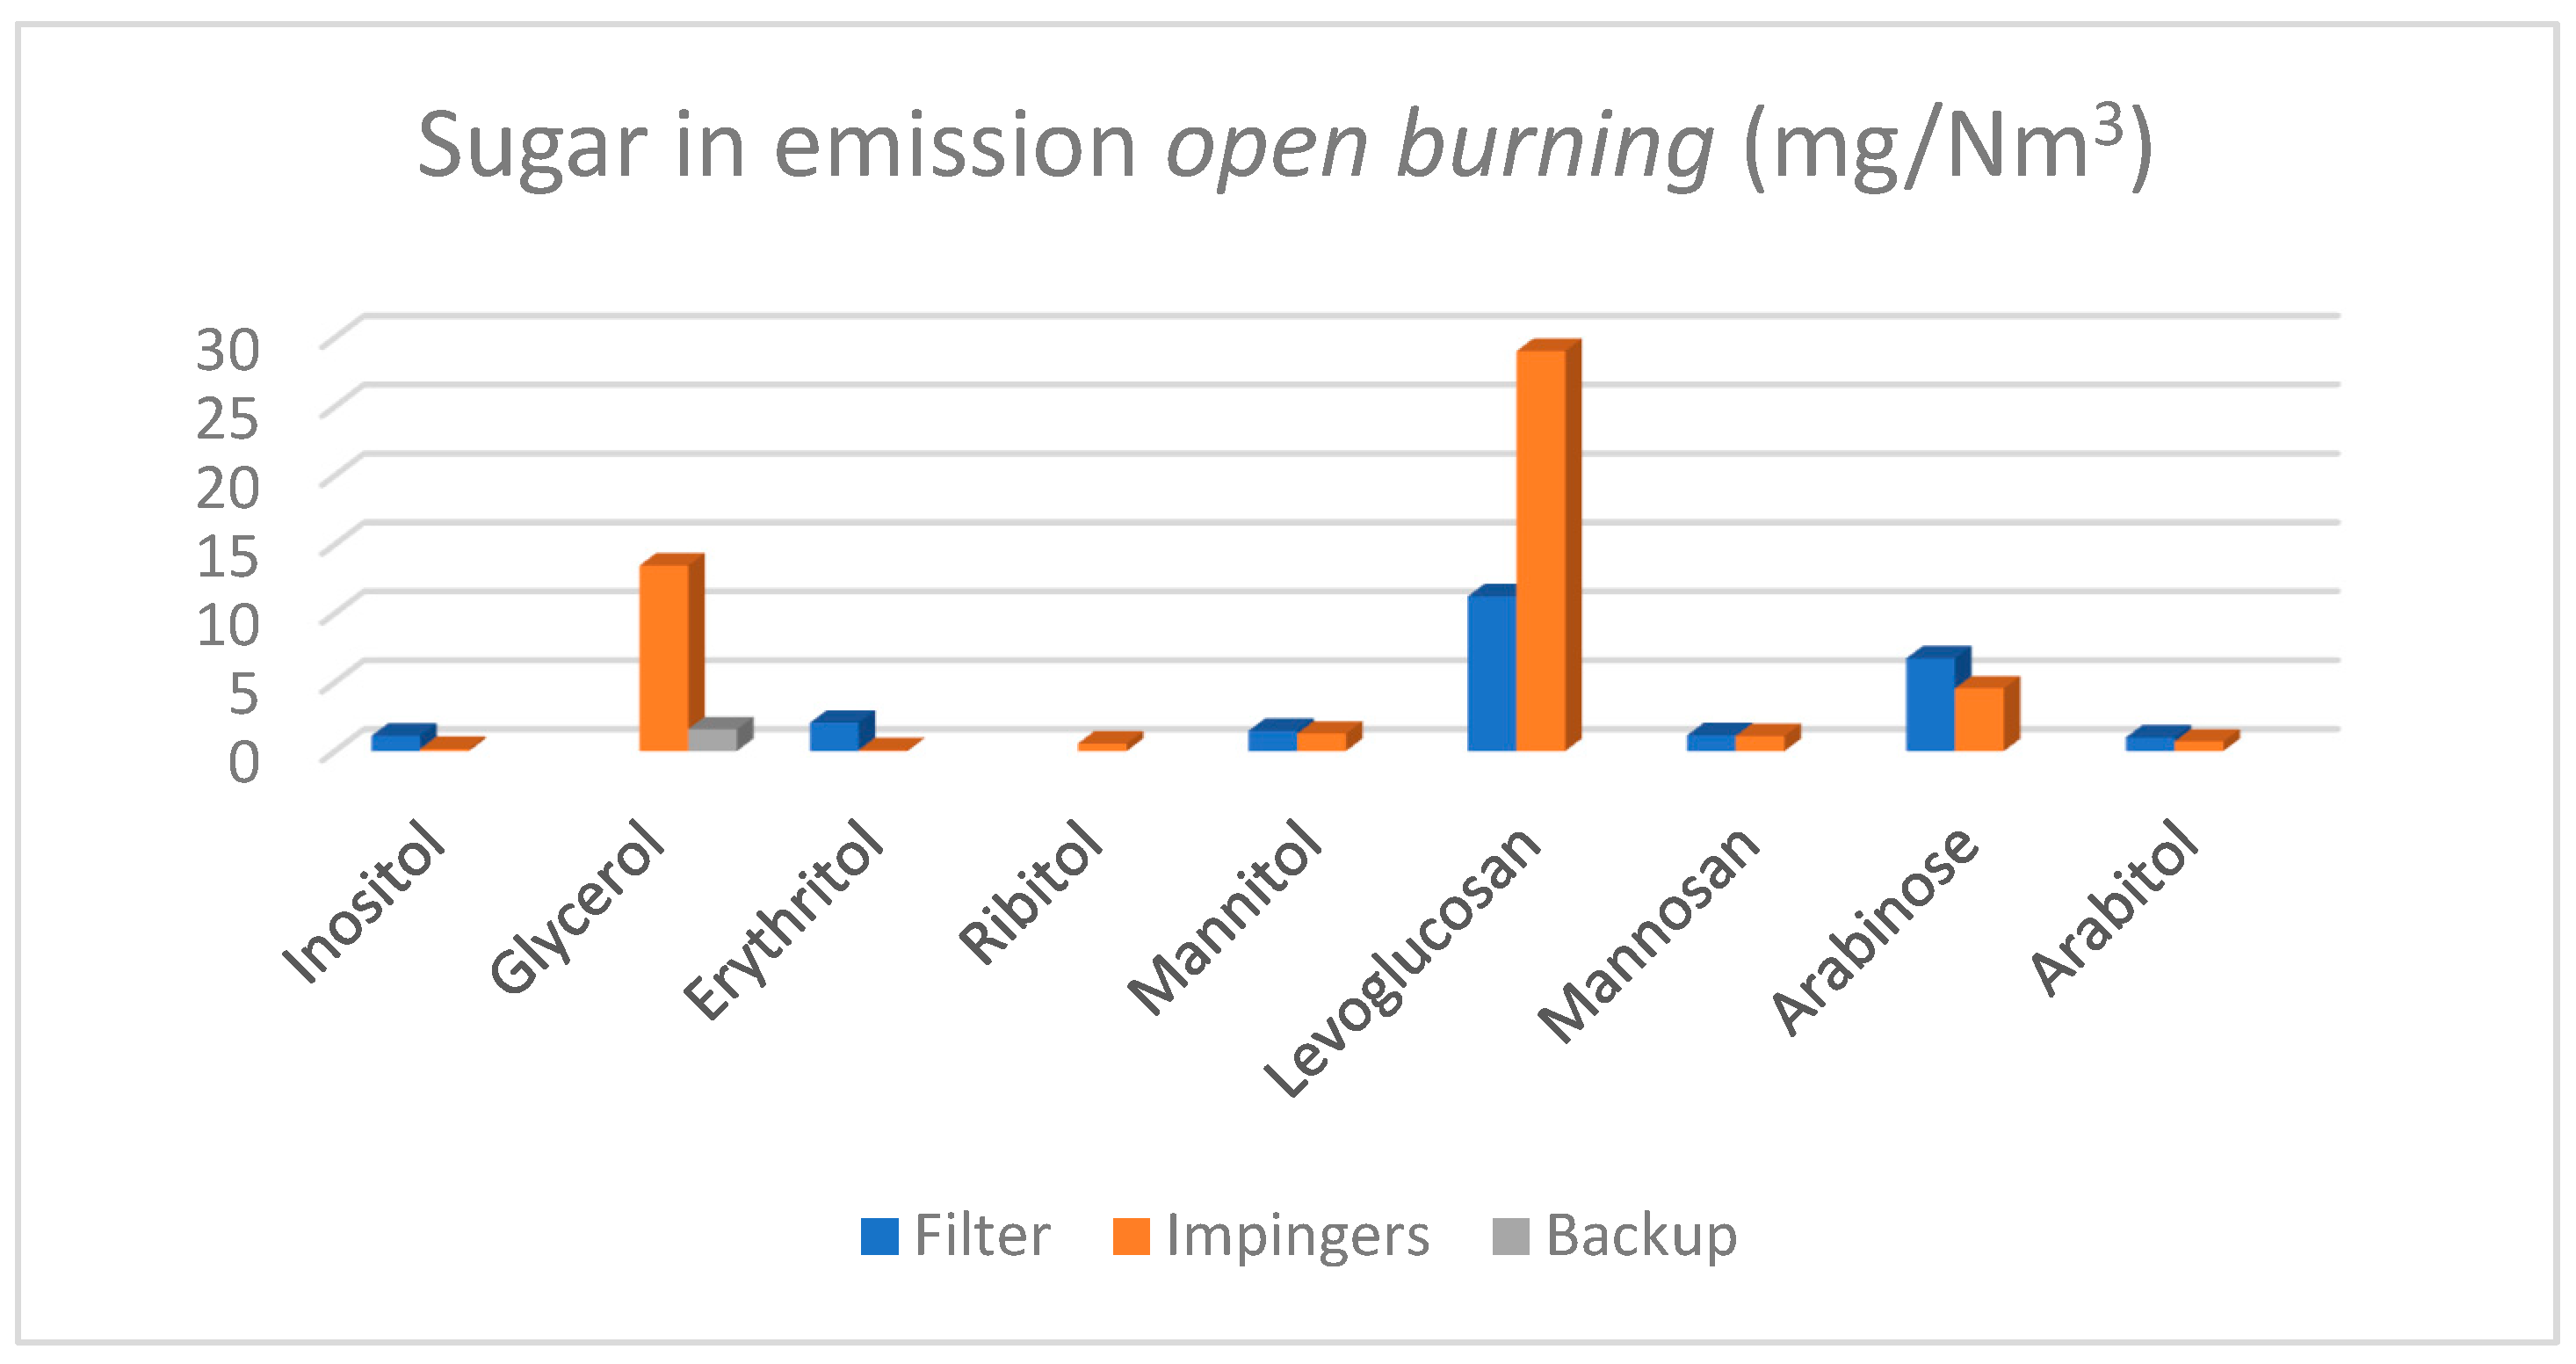
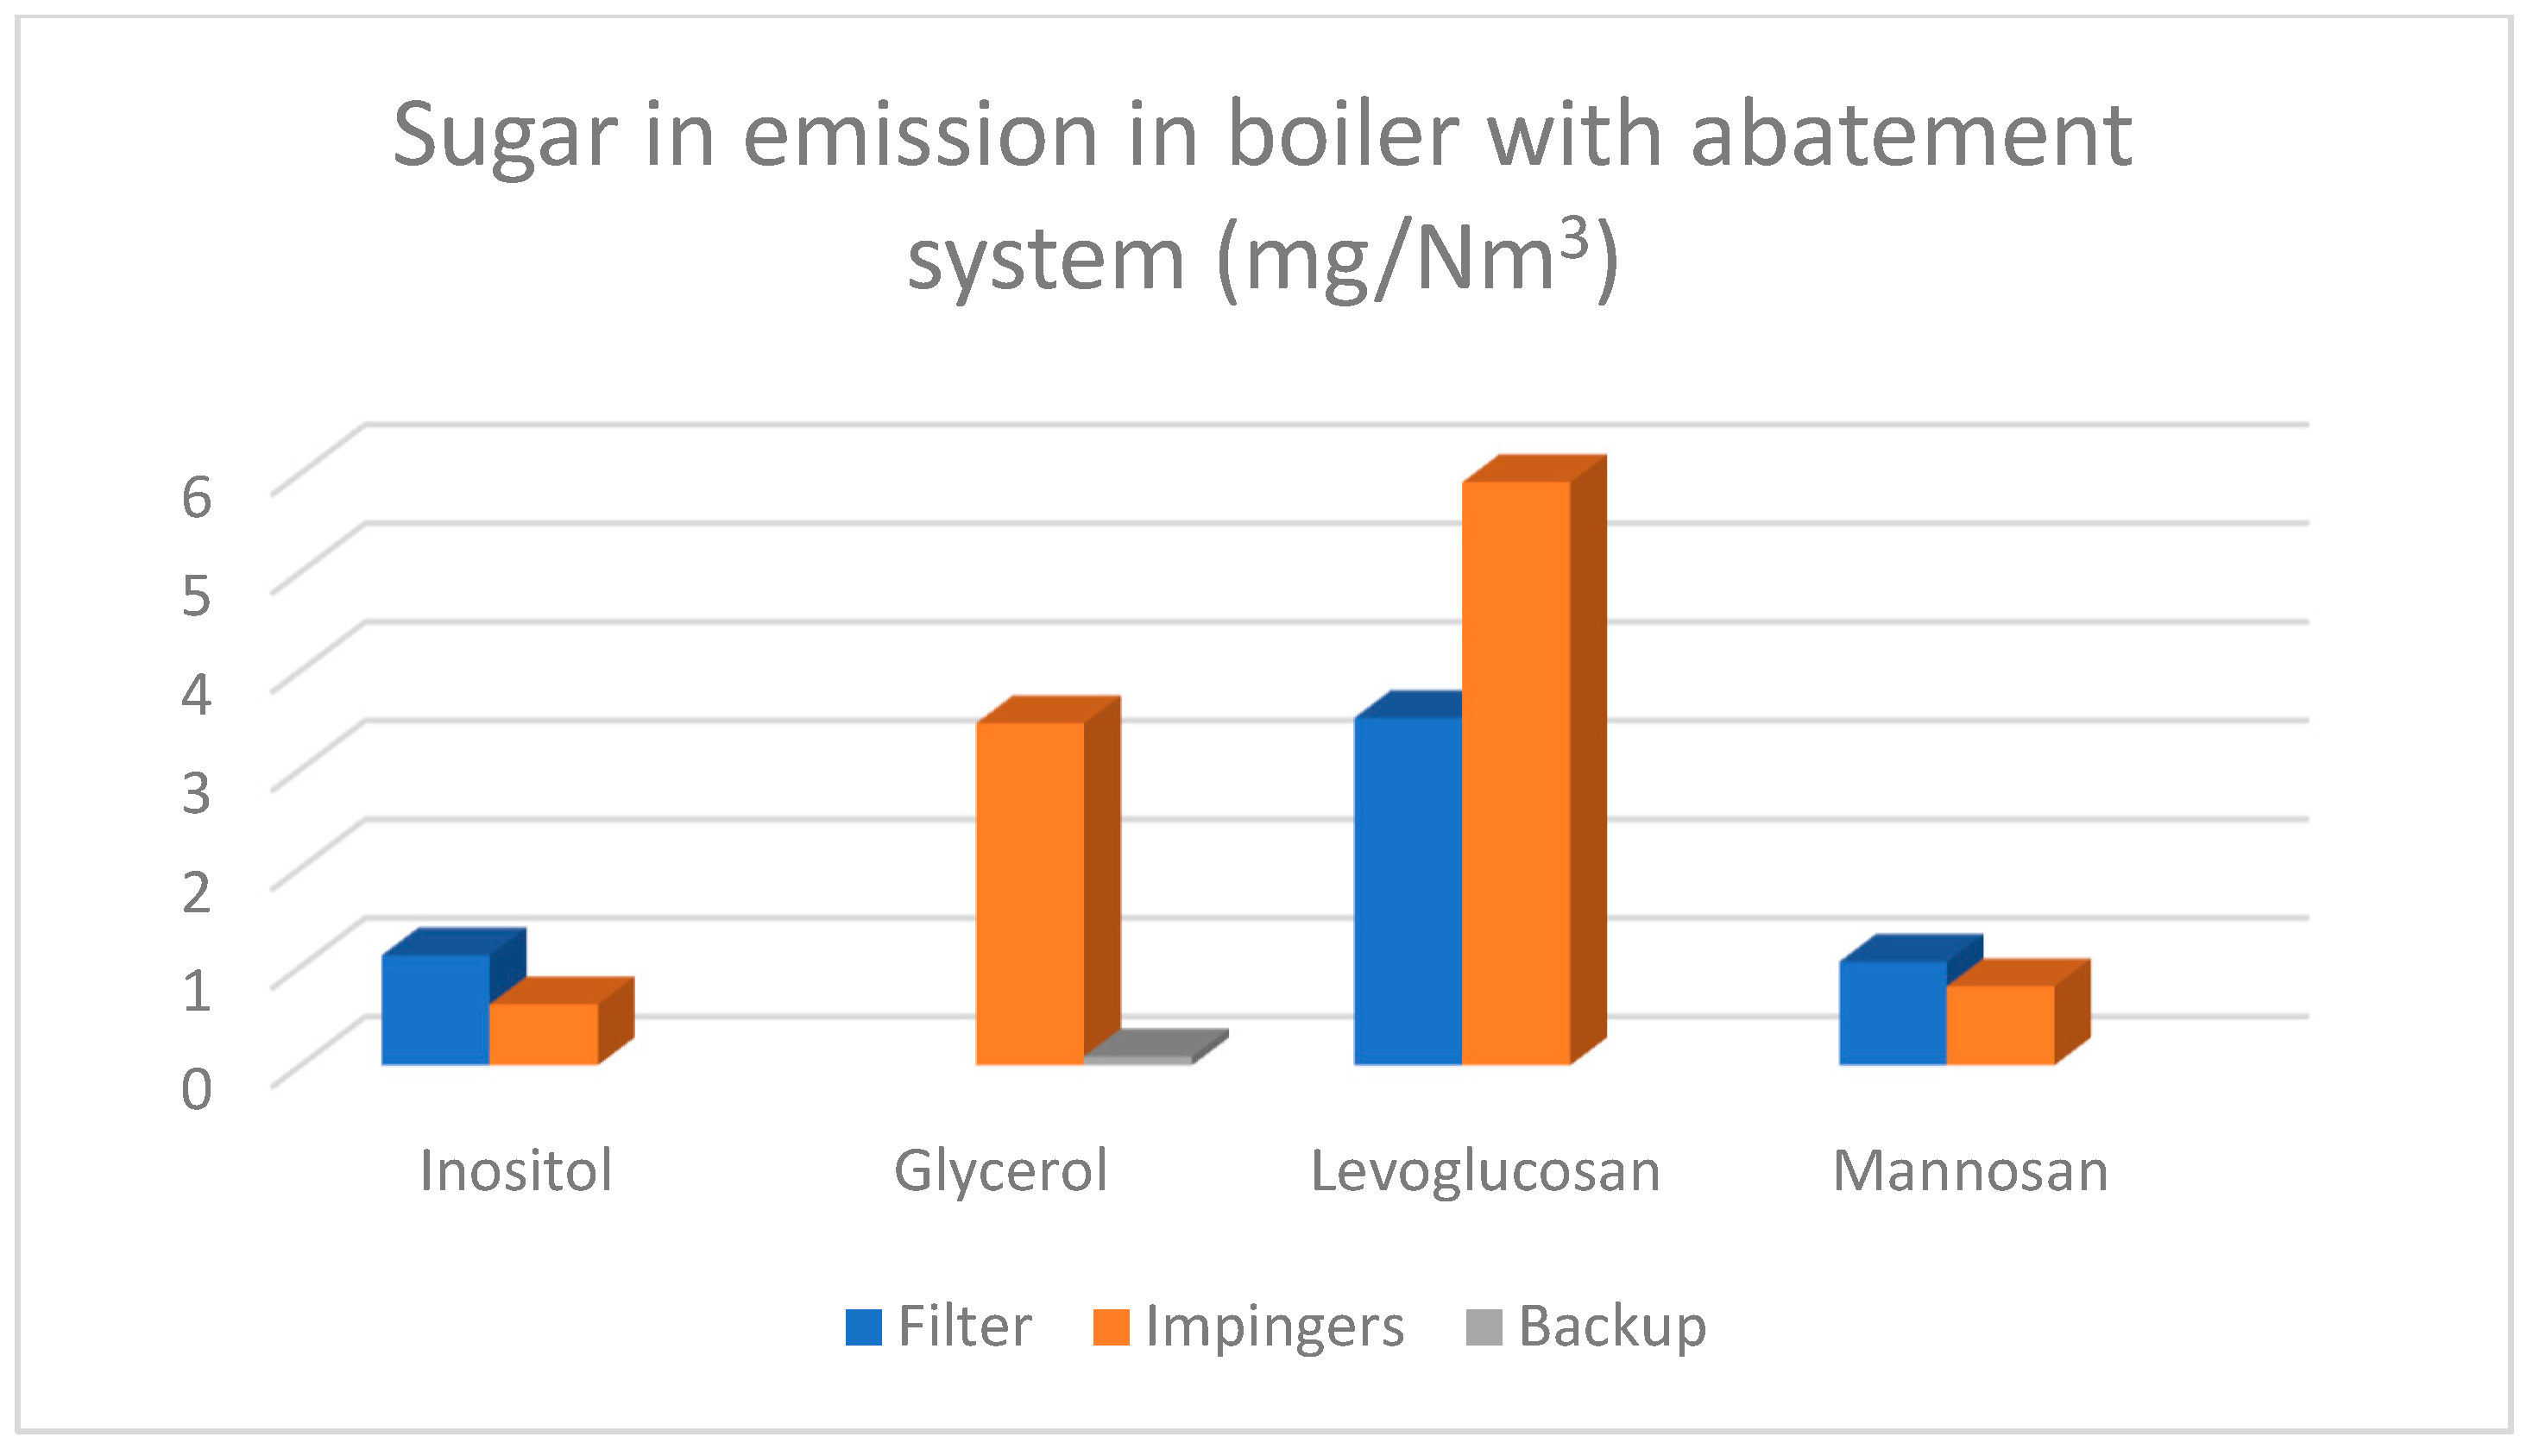
3.2.3. Sugar Emission
3.2.4. PM Emission
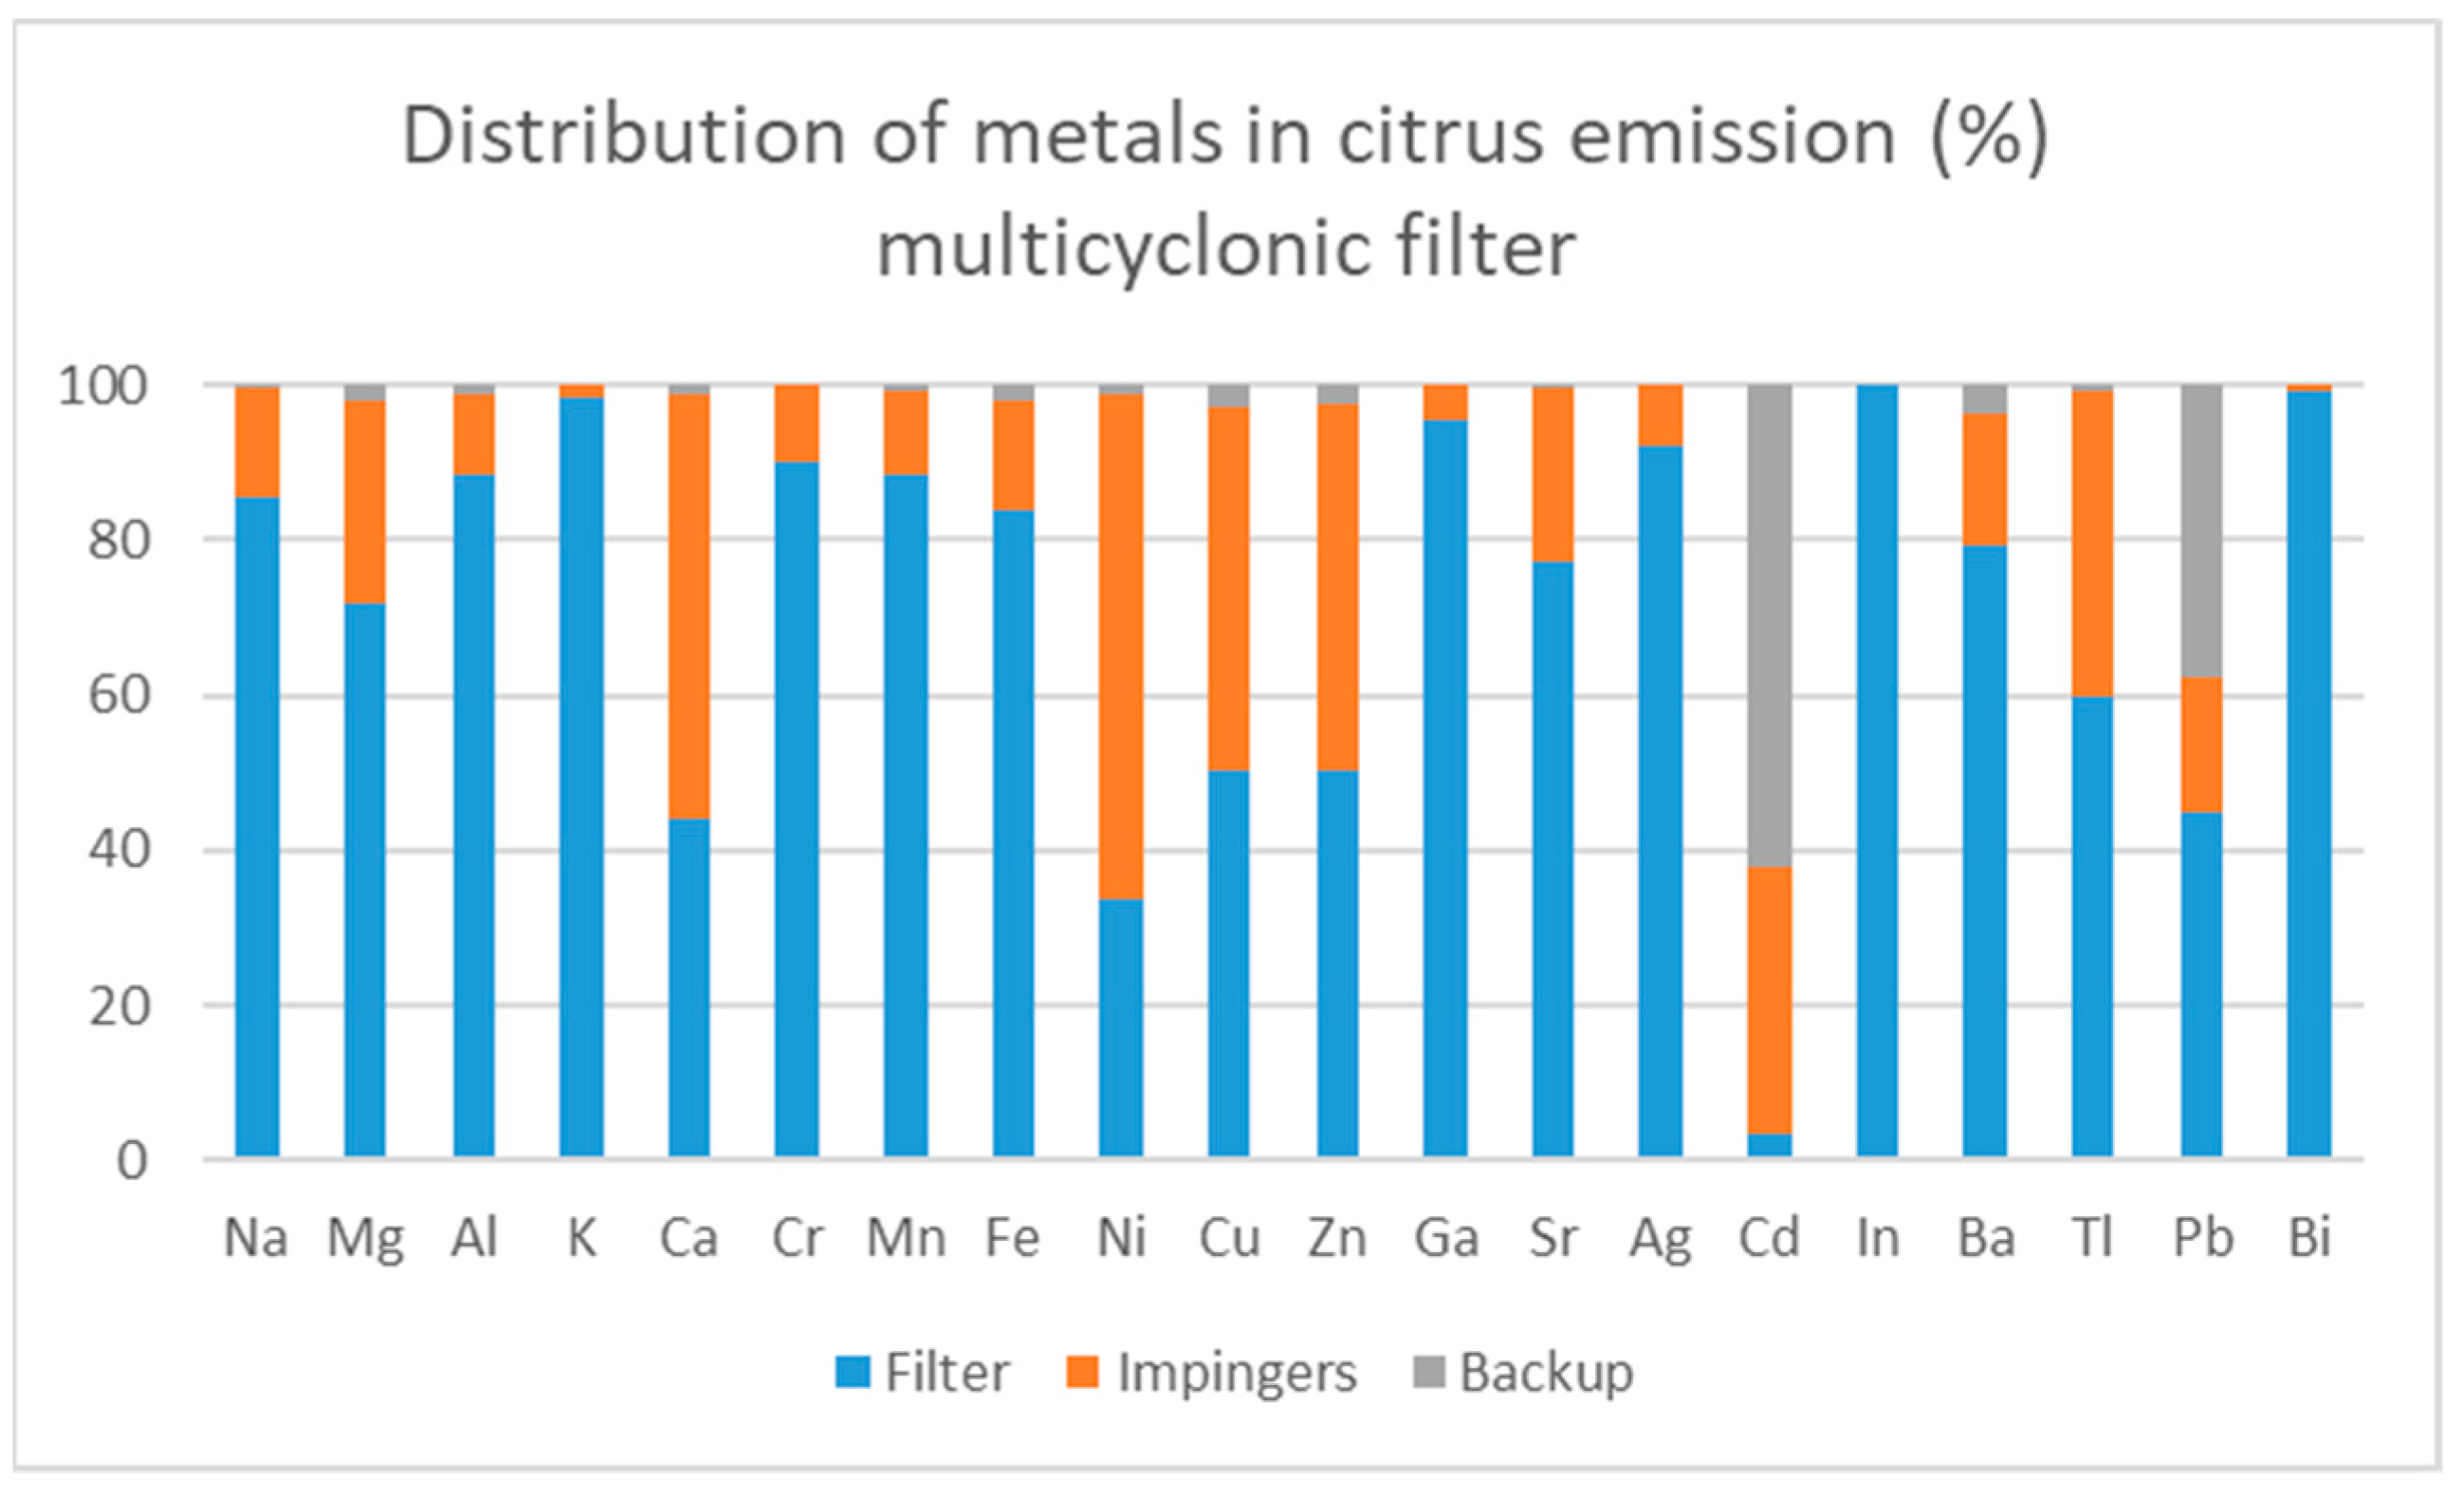
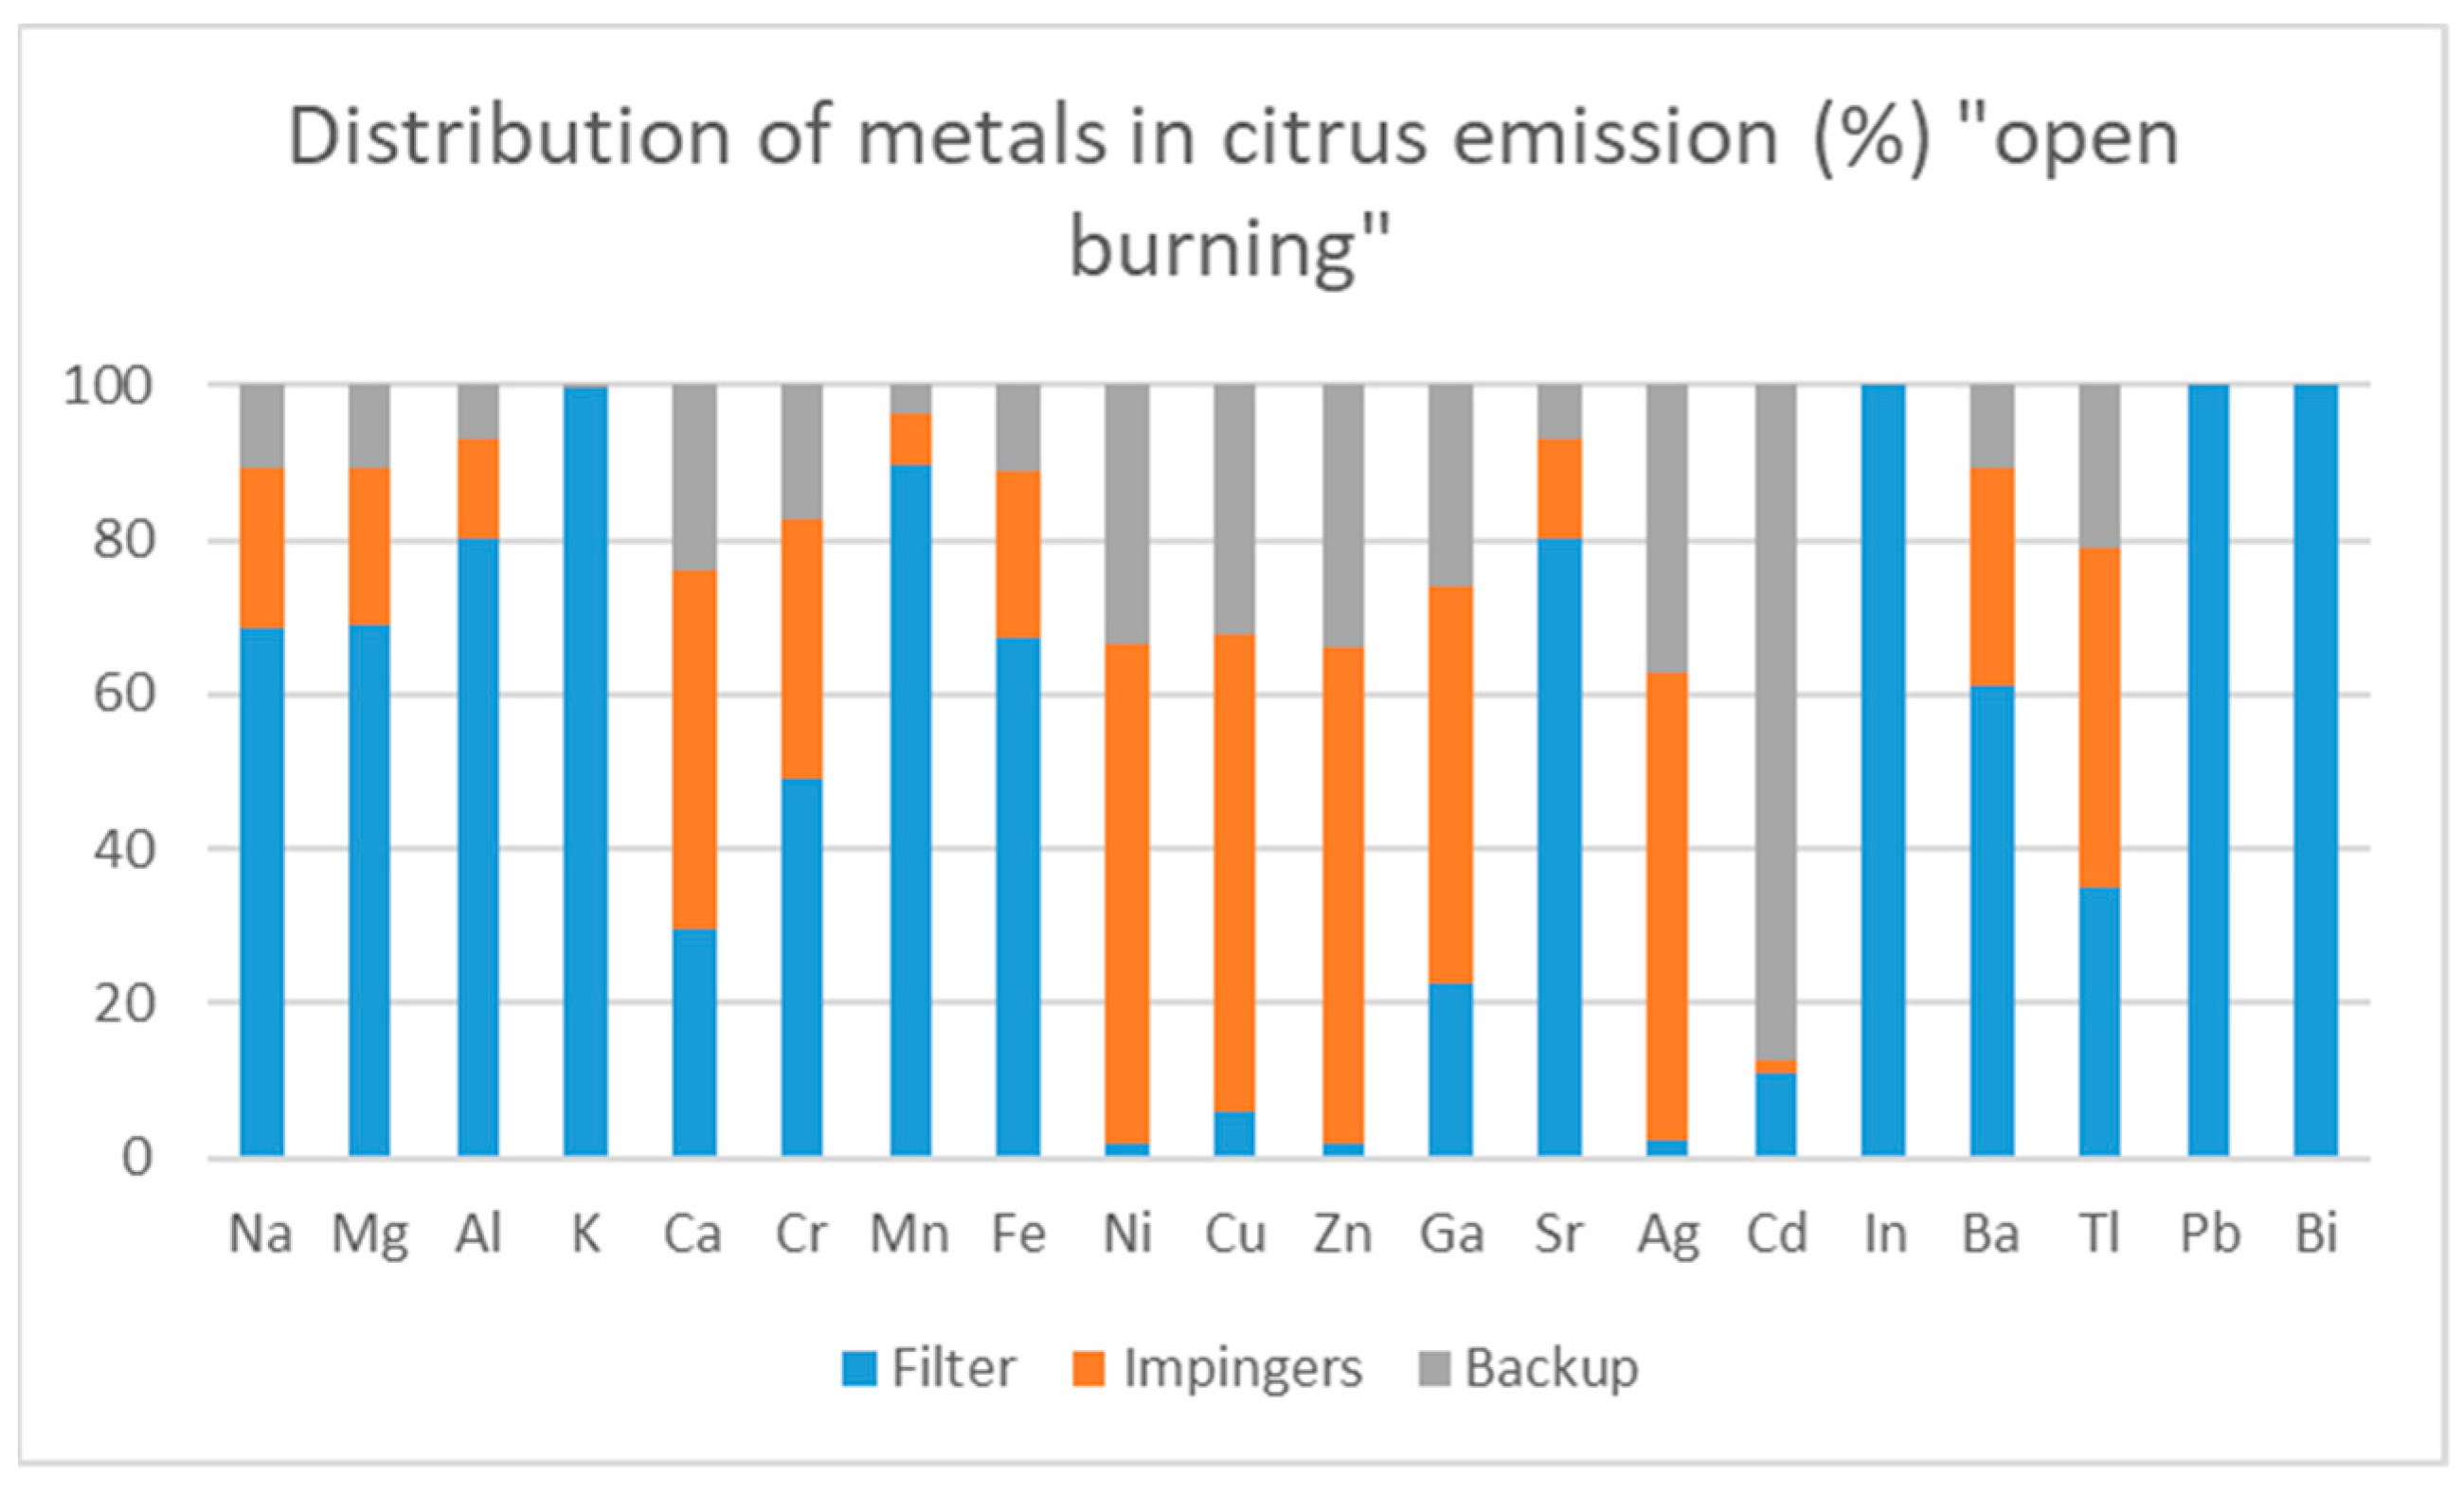
3.2.5. Metal Emission
4. Conclusions
Author Contributions
Funding
Institutional Review Board Statement
Informed Consent Statement
Data Availability Statement
Acknowledgments
Conflicts of Interest
References
- Maschio, S.; Tonello, G.; Piani, L.; Furlani, E. Fly and Bottom Ashes from Biomass Combustion as Cement Replacing Components in Mortars Production: Rheological Behaviour of the Pastes and Materials Compression Strength. Chemosphere 2011, 85, 666–671. [Google Scholar] [CrossRef] [PubMed]
- Crutzen, P.J.; Heidt, L.E.; Krasnec, J.P.; Pollock, W.H.; Seiler, W. Biomass Burning as a Source of Atmospheric Gases CO, H2, N2O, NO, CH3Cl and COS. Nature 1979, 282, 253–256. [Google Scholar] [CrossRef]
- Lemieux, P.M.; Lutes, C.C.; Santoianni, D.A. Emissions of Organic Air Toxics from Open Burning: A Comprehensive Review. Prog. Energy Combust. Sci. 2004, 30, 1–32. [Google Scholar] [CrossRef]
- Urbanski, S.P.; Hao, W.M.; Nordgren, B. The Wildland Fire Emission Inventory: Western United States Emission Estimates and an Evaluation of Uncertainty. Atmos. Chem. Phys. 2011, 11, 12973–13000. [Google Scholar] [CrossRef]
- Hobbs, P.V.; Sinha, P.; Yokelson, R.J.; Christian, T.J.; Blake, D.R.; Gao, S.; Kirchstetter, T.W.; Novakov, T.; Pilewskie, P. Evolution of Gases and Particles from a Savanna Fire in South Africa. J. Geophys. Res. Atmos. 2003, 108, 8485. [Google Scholar] [CrossRef]
- Rosenfeld, D. TRMM Observed First Direct Evidence of Smoke from Forest Fires Inhibiting Rainfall. Geophys. Res. Lett. 1999, 26, 3105–3108. [Google Scholar] [CrossRef]
- Van Der Werf, G.R.; Randerson, J.T.; Giglio, L.; Collatz, G.J.; Mu, M.; Kasibhatla, P.S.; Morton, D.C.; Defries, R.S.; Jin, Y.; Van Leeuwen, T.T. Global Fire Emissions and the Contribution of Deforestation, Savanna, Forest, Agricultural, and Peat Fires (1997–2009). Atmos. Chem. Phys. 2010, 10, 11707–11735. [Google Scholar] [CrossRef]
- Paris, E.; Carnevale, M.; Vincenti, B.; Palma, A.; Guerriero, E.; Borello, D.; Gallucci, F. Evaluation of VOCs Emitted from Biomass Combustion in a Small CHP Plant: Difference between Dry and Wet Poplar Woodchips. Molecules 2022, 27, 955. [Google Scholar] [CrossRef] [PubMed]
- Andreae, M.O.; Merlet, P. Emission of Trace Gases and Aerosols from Biomass Burning. Glob. Biogeochem. Cycles 2001, 15, 955–966. [Google Scholar] [CrossRef]
- Marlier, M.E.; Defries, R.S.; Voulgarakis, A.; Kinney, P.L.; Randerson, J.T.; Shindell, D.T.; Chen, Y.; Faluvegi, G. El Niño and Health Risks from Landscape Fire Emissions in Southeast Asia. Nat. Clim. Chang. 2013, 3, 131–136. [Google Scholar] [CrossRef]
- Vallero, D.A. Fundamentals of Air Pollution; Elsevier Inc.: Amsterdam, The Netherlands, 2007; ISBN 9780123736154. [Google Scholar]
- Migo-Sumagang, M.V.P.; Van Hung, N.; Detras, M.C.M.; Alfafara, C.G.; Borines, M.G.; Capunitan, J.A.; Gummert, M. Optimization of a Downdraft Furnace for Rice Straw-Based Heat Generation. Renew. Energy 2020, 148, 953–963. [Google Scholar] [CrossRef]
- Mason, S.A.; Field, R.J.; Yokelson, R.J.; Kochivar, M.A.; Tinsley, M.R.; Ward, D.E.; Hao, W.M. Complex Effects Arising in Smoke Plume Simulations Due to Inclusion of Direct Emissions of Oxygenated Organic Species from Biomass Combustion. J. Geophys. Res. Atmos. 2001, 106, 12527–12539. [Google Scholar] [CrossRef]
- Ward, D.S.; Kloster, S.; Mahowald, N.M.; Rogers, B.M.; Randerson, J.T.; Hess, P.G. The Changing Radiative Forcing of Fires: Global Model Estimates for Past, Present and Future. Atmos. Chem. Phys. 2012, 12, 10857–10886. [Google Scholar] [CrossRef]
- Campos Braga, R.; Rosenfeld, D.; Weigel, R.; Jurkat, T.; Andreae, M.O.; Wendisch, M.; Pöschl, U.; Voigt, C.; Mahnke, C.; Borrmann, S.; et al. Further Evidence for CCN Aerosol Concentrations Determining the Height of Warm Rain and Ice Initiation in Convective Clouds over the Amazon Basin. Atmos. Chem. Phys. 2017, 17, 14433–14456. [Google Scholar] [CrossRef]
- Cecchini, M.A.; MacHado, L.A.T.; Andreae, M.O.; Martin, S.T.; Albrecht, R.I.; Artaxo, P.; Barbosa, H.M.J.; Borrmann, S.; Fütterer, D.; Jurkat, T.; et al. Sensitivities of Amazonian Clouds to Aerosols and Updraft Speed. Atmos. Chem. Phys. 2017, 17, 10037–10050. [Google Scholar] [CrossRef]
- Hamilton, D.S.; Hantson, S.; Scott, C.E.; Kaplan, J.O.; Pringle, K.J.; Nieradzik, L.P.; Rap, A.; Folberth, G.A.; Spracklen, D.V.; Carslaw, K.S. Reassessment of Pre-Industrial Fire Emissions Strongly Affects Anthropogenic Aerosol Forcing. Nat. Commun. 2018, 9, 3182. [Google Scholar] [CrossRef]
- Thornhill, G.D.; Ryder, C.L.; Highwood, E.J.; Shaffrey, L.C.; Johnson, B.T. The Effect of South American Biomass Burning Aerosol Emissions on the Regional Climate. Atmos. Chem. Phys. 2018, 18, 5321–5342. [Google Scholar] [CrossRef]
- Wiedinmyer, C.; Akagi, S.K.; Yokelson, R.J.; Emmons, L.K.; Al-Saadi, J.A.; Orlando, J.J.; Soja, A.J. The Fire INventory from NCAR (FINN): A High Resolution Global Model to Estimate the Emissions from Open Burning. Geosci. Model Dev. 2011, 4, 625–641. [Google Scholar] [CrossRef]
- Guenther, A.; Karl, T.; Harley, P.; Wiedinmyer, C.; Palmer, P.I.; Geron, C. Estimates of Global Terrestrial Isoprene Emissions Using MEGAN (Model of Emissions of Gases and Aerosols from Nature). Atmos. Chem. Phys. 2006, 6, 3181–3210. [Google Scholar] [CrossRef]
- Bond, T.C.; Streets, D.G.; Yarber, K.F.; Nelson, S.M.; Woo, J.H.; Klimont, Z. A Technology-Based Global Inventory of Black and Organic Carbon Emissions from Combustion. J. Geophys. Res. Atmos. 2004, 109, 1–43. [Google Scholar] [CrossRef]
- Nussbaumer, T.; Braun, C.; Burtscher, H.; Livbjerg, H.; Jokiniemi, J.; Ebert, F.; Tullin, C.; Baxter, L.L.; Ehrlich, C.; Oser, M.; et al. Aerosols from Biomass Combustion; IEA Bioenergy: Paris, France, 2001; ISBN 3908705002. [Google Scholar]
- Chen, H.; Yin, S.; Li, X.; Wang, J.; Zhang, R. Analyses of Biomass Burning Contribution to Aerosol in Zhengzhou during Wheat Harvest Season in 2015. Atmos. Res. 2018, 207, 62–73. [Google Scholar] [CrossRef]
- Wan, X.; Kang, S.; Li, Q.; Rupakheti, D.; Zhang, Q.; Guo, J.; Chen, P.; Tripathee, L.; Rupakheti, M.; Panday, A.K.; et al. Organic Molecular Tracers in the Atmospheric Aerosols from Lumbini, Nepal, in the Northern Indo-Gangetic Plain: Influence of Biomass Burning. Atmos. Chem. Phys. 2017, 17, 8867–8885. [Google Scholar] [CrossRef]
- Zhang, Y.; Obrist, D.; Zielinska, B.; Gertler, A. Particulate Emissions from Different Types of Biomass Burning. Atmos. Environ. 2013, 72, 27–35. [Google Scholar] [CrossRef]
- Saarnio, K.; Teinilä, K.; Aurela, M.; Timonen, H.; Hillamo, R. High-Performance Anion-Exchange Chromatography–Mass Spectrometry Method for Determination of Levoglucosan, Mannosan, and Galactosan in Atmospheric Fine Particulate Matter. Anal. Bioanal. Chem. 2010, 398, 2253–2264. [Google Scholar] [CrossRef] [PubMed]
- Saarnio, K.; Teinilä, K.; Saarikoski, S.; Carbone, S.; Gilardoni, S.; Timonen, H.; Aurela, M.; Hillamo, R. Online Determination of Levoglucosan in Ambient Aerosols with Particle-into-Liquid Sampler – High-Performance Anion-Exchange Chromatography – Mass Spectrometry (PILS-HPAEC-MS). Atmos. Meas. Tech. 2013, 6, 2839–2849. [Google Scholar] [CrossRef]
- Vincenti, B.; Paris, E.; Carnevale, M.; Palma, A.; Guerriero, E.; Borello, D.; Paolini, V.; Gallucci, F. Saccharides as Particulate Matter Tracers of Biomass Burning: A Review. Int. J. Environ. Res. Public Health 2022, 19, 4387. [Google Scholar] [CrossRef]
- Puxbaum, H.; Caseiro, A.; Sánchez-Ochoa, A.; Kasper-Giebl, A.; Claeys, M.; Gelencsér, A.; Legrand, M.; Preunkert, S.; Pio, C.A. Levoglucosan Levels at Background Sites in Europe for Assessing the Impact of Biomass Combustion on the European Aerosol Background. J. Geophys. Res. Atmos. 2007, 112, D23S05. [Google Scholar] [CrossRef]
- Schkolnik, G.; Rudich, Y. Detection and Quantification of Levoglucosan in Atmospheric Aerosols: A Review. Anal. Bioanal. Chem. 2006, 385, 26–33. [Google Scholar] [CrossRef] [PubMed]
- Caseiro, A.; Marr, I.L.; Claeys, M.; Kasper-Giebl, A.; Puxbaum, H.; Pio, C.A. Determination of Saccharides in Atmospheric Aerosol Using Anion-Exchange High-Performance Liquid Chromatography and Pulsed-Amperometric Detection. J. Chromatogr. A 2007, 1171, 37–45. [Google Scholar] [CrossRef]
- Piot, C.; Jaffrezo, J.L.; Cozic, J.; Pissot, N.; El Haddad, I.; Marchand, N.; Besombes, J.L. Quantification of Levoglucosan and Its Isomers by High Performance Liquid Chromatography-Electrospray Ionization Tandem Mass Spectrometry and Its Applications to Atmospheric and Soil Samples. Atmos. Meas. Tech. 2012, 5, 141–148. [Google Scholar] [CrossRef]
- Giannoni, M.; Martellini, T.; Del Bubba, M.; Gambaro, A.; Zangrando, R.; Chiari, M.; Lepri, L.; Cincinelli, A. The Use of Levoglucosan for Tracing Biomass Burning in PM2.5 Samples in Tuscany (Italy). Environ. Pollut. 2012, 167, 7–15. [Google Scholar] [CrossRef]
- Yan, C.; Zheng, M.; Sullivan, A.P.; Shen, G.; Chen, Y.; Wang, S.; Zhao, B.; Cai, S.; Desyaterik, Y.; Li, X.; et al. Residential Coal Combustion as a Source of Levoglucosan in China. Environ. Sci. Technol. 2018, 52, 1665–1674. [Google Scholar] [CrossRef] [PubMed]
- Sheesley, R.J.; Mieritz, M.; DeMinter, J.T.; Shelton, B.R.; Schauer, J.J. Development of an In Situ Derivatization Technique for Rapid Analysis of Levoglucosan and Polar Compounds in Atmospheric Organic Aerosol. Atmos. Environ. 2015, 123, 251–255. [Google Scholar] [CrossRef]
- Paris, E.; Carnevale, M.; Guerriero, E.; Palma, A.; Vincenti, B.; Khalid, A.; Rantica, E.; Proto, A.R.; Gallucci, F. Fixed Source Monitoring System for Marker Emission During Biomass Combustion. SSRN Electron. J. 2022, 208, 597–603. [Google Scholar] [CrossRef]
- Dai, J.; Grace, J.R. Biomass Screw Feeding with Tapered and Extended Sections. Powder Technol. 2008, 186, 56–64. [Google Scholar] [CrossRef]
- Dai, J.; Cui, H.; Grace, J.R. Biomass Feeding for Thermochemical Reactors. Prog. Energy Combust. Sci. 2012, 38, 716–736. [Google Scholar] [CrossRef]
- Colantoni, A.; Paris, E.; Bianchini, L.; Ferri, S.; Marcantonio, V.; Carnevale, M.; Palma, A.; Civitarese, V.; Gallucci, F. Spent Coffee Ground Characterization, Pelletization Test and Emissions Assessment in the Combustion Process. Sci. Rep. 2021, 11, 5199. [Google Scholar] [CrossRef] [PubMed]
- Proto, A.R.; Palma, A.; Paris, E.; Papandrea, S.F.; Vincenti, B.; Carnevale, M.; Guerriero, E.; Bonofiglio, R.; Gallucci, F. Assessment of Wood Chip Combustion and Emission Behavior of Different Agricultural Biomasses. Fuel 2021, 289, 119758. [Google Scholar] [CrossRef]
- Paris, E.; Gallucci, F.; Carnevale, M.; Khalid, A.; Paolini, V.; Guerriero, E. Evaluation of the Vocs Emitted by the Combustion of Rice Straw. In Proceedings of the European Biomass Conference and Exhibition Proceedings, Lisbon, Portugal, 27–30 May 2019. [Google Scholar]
- Paris, E.; Avino, P.; Guerriero, E.; Vincenti, B.; Palma, A.; Carnevale, M.; Benedetti, P.; Torre, M.; Gallucci, F. Activated Porous Carbon Fiber: New Adsorbent for Sampling and Analysis by Thermal Desorption of Siloxanes in Biogas and Biomethane. Int. J. Environ. Res. Public Health 2022, 19, 10890. [Google Scholar] [CrossRef]
- Chu, D.; Xue, L.; Zhang, Y.; Kang, L.; Mu, J. Surface Characteristics of Poplar Wood with High-Temperature Heat Treatment: Wettability and Surface Brittleness. Bioresources 2016, 11, 6948–6967. [Google Scholar] [CrossRef]
- Gallucci, F.; Pari, L.; Longo, L.; Carnevale, M.; Santangelo, E.; Colantoni, A.; Paolini, V.; Guerriero, E.; Tonolo, A. Assessment of Organic Micropollutants (Pcdd/Fs and Pcbs) from Biomass Combustion in a Small Chp Facility. In Proceedings of the European Biomass Conference and Exhibition Proceedings, ETA-Florence Renewable Energies. Copenhagen, Denmark, 14–18 May 2018; Volume 2018, pp. 606–609. [Google Scholar]
- Carnevale, M.; Paris, E.; Palma, A.; Vincenti, B.; Salerno, M.; Manganiello, R.; Guerriero, E.; Perilli, M.; Colantoni, A.; Proto, A.R.; et al. Characterization of Emissions from Combustion of Olive Wood Chips. In Proceedings of the European Biomass Conference and Exhibition Proceedings, Online, 26–29 April 2021; pp. 577–580. [Google Scholar]
- Vassilev, S.V.; Baxter, D.; Andersen, L.K.; Vassileva, C.G.; Morgan, T.J. An Overview of the Organic and Inorganic Phase Composition of Biomass. Fuel 2012, 94, 1–33. [Google Scholar] [CrossRef]
- Arvelakis, S.; Gehrmann, H.; Beckmann, M.; Koukios, E.G. Effect of Leaching on the Ash Behavior of Olive Residue during Fluidized Bed Gasification. Biomass Bioenergy 2002, 22, 55–69. [Google Scholar] [CrossRef]
- Glarborg, P.; Miller, J.A.; Ruscic, B.; Klippenstein, S.J. Modeling Nitrogen Chemistry in Combustion. Prog. Energy Combust. Sci. 2018, 67, 31–68. [Google Scholar] [CrossRef]
- Zdráhal, Z.; Oliveira, J.; Vermeylen, R.; Claeys, M.; Maenhaut, W. Improved Method for Quantifying Levoglucosan and Related Monosaccharide Anhydrides in Atmospheric Aerosols and Application to Samples from Urban and Tropical Locations. Environ. Sci. Technol. 2002, 36, 747–753. [Google Scholar] [CrossRef]
- Simoneit, B.R.T.; Elias, V.O. Detecting Organic Tracers from Biomass Burning in the Atmosphere. Mar. Pollut. Bull. 2001, 42, 805–810. [Google Scholar] [CrossRef]
- Fraser, M.P.; Lakshmanan, K. Using Levoglucosan as a Molecular Marker for the Long-Range Transport of Biomass Combustion Aerosols. Environ. Sci. Technol. 2000, 34, 4560–4564. [Google Scholar] [CrossRef]
- Simoneit, B.R.T.; Schauer, J.J.; Nolte, C.G.; Oros, D.R.; Elias, V.O.; Fraser, M.P.; Rogge, W.F.; Cass, G.R. Levoglucosan, a Tracer for Cellulose in Biomass Burning and Atmospheric Particles. Atmos. Environ. 1999, 33, 173–182. [Google Scholar] [CrossRef]


| Sampling and Combustion Conditions | ||
|---|---|---|
| Open Burning Simulation | Boiler with Abatement System | |
| Flue gas velocity at stack [m/s] | 3.60 | 3.35 |
| Stack temperature [°C] | 218.52 | 142.46 |
| Stack pressure [kPa] | 102.96 | 110.96 |
| Velocity at nozzle [m/s] | 3.567 | 3.353 |
| Filter box temperature [°C] | 130.7 | 129.8 |
| Outlet temperature [°C] | 99.3 | 95.6 |
| Ambient pressure [kPa] | 102.86 | 100.98 |
| Operative Parameters | |
|---|---|
| Carrier gas | He |
| Column | DB 502.2 |
| Flow | 1.2 mL/min |
| Mode (GC) | Constant Flow |
| Oven ramp | 35 °C (5 min) + 5 °C/min to 230 (5 min) |
| Ion source | EI |
| Inlet | 200 °C |
| MS source | 230 °C |
| MSD transfer line | 240 °C |
| Mode (MS) | Full Scan 35–450 m/z |
| Citrus Pruning | |
|---|---|
| Moisture content % | 10.19 |
| Ash % | 4.95 |
| HHV [MJ/kg] | 17.75 |
| LHV [MJ/kg] | 16.59 |
| C % | 46.69 |
| H % | 5.58 |
| N % | 0.44 |
| Metal content [mg/kg] | |
| Na | 13.33 |
| Mg | 21.73 |
| Al | 6.28 |
| K | 239.82 |
| Ca | 155.01 |
| Cr | 0.03 |
| Mn | 0.24 |
| Fe | 3.97 |
| Ni | 0.06 |
| Cu | 0.21 |
| Zn | 0.25 |
| Ga | 0.05 |
| Sr | 5.39 |
| Ag | 0.001 |
| Cd | 0.001 |
| In | 0.0004 |
| Ba | 0.91 |
| Tl | 0.001 |
| Pb | 0.01 |
| Bi | 0.02 |
| Compound | Open Burning Test | Boiler with Abatement System |
|---|---|---|
| CO [mg/Nm3] | 1132.418 | 587.88 |
| NOx [mg/Nm3] | 528.12 | 473.70 |
| SO2 [mg/Nm3] | 38.03 | 39.76 |
| TOC [mg/Nm3] | 35.26 | 47.19 |
| CO2 [%] | 6.55 | 4.62 |
| VOCs [mg/Nm3] | Open Burning | Boiler with Abatement System |
|---|---|---|
| Propene | 0.72 | 0.21 |
| Methane, chloro- | 1.03 | 2.11 |
| Methane, dimethoxy- | 0.02 | <LOQ |
| 2-Butanone | <LOQ | <LOQ |
| Benzene | 4.13 | 1.75 |
| Toluene | 0.57 | 0.48 |
| Benzene, chloro-1 | 0.10 | 0.05 |
| Ethylbenzene | 0.11 | 0.03 |
| m,p-Xylene | 0.22 | 0.21 |
| o-Xylene | 0.08 | 0.18 |
| D-Limonene | 0.26 | 0.09 |
| Undecane | 0.55 | 0.47 |
| Cyclododecane | 0.82 | 0.20 |
| ∑VOC | 8.61 | 5.78 |
| [mg/Nm3] | Open Burning | Boiler with Abatement System | ||||
|---|---|---|---|---|---|---|
| Filter | Impinger | Backup | Filter | Impinger | Backup | |
| Inositol | 1.11 | 0.16 | <LOQ | 1.12 | 0.32 | <LOQ |
| Glycerol | <LOQ | 13.46 | 1.58 | <LOQ | 3.47 | 0.09 |
| Erythritol | 2.06 | 0.07 | <LOQ | <LOQ | <LOQ | <LOQ |
| Ribitol | <LOQ | 0.55 | <LOQ | <LOQ | <LOQ | <LOQ |
| Mannitol | 1.47 | 1.27 | <LOQ | <LOQ | <LOQ | <LOQ |
| Levoglucosan | 11.23 | 29.03 | <LOQ | 3.52 | 5.91 | <LOQ |
| Mannosan | 1.14 | 1.1 | <LOQ | 1.05 | 0.80 | <LOQ |
| Arabinose | 6.74 | 4.55 | <LOQ | <LOQ | <LOQ | <LOQ |
| Arabitol | 0.99 | 0.69 | <LOQ | <LOQ | <LOQ | <LOQ |
| Day | Total Sugars [mg/Nm3] | K [g/Nm3] | K/∑Sugars [g/mg] |
|---|---|---|---|
| 1 | 0.015 | 386.99 | 26.55 |
| 2 | 0.026 | 207.83 | 8.07 |
| 3 | 0.007 | 64.05 | 9.80 |
| PM Fractions | Citrus Pruning [mg/Nm3] | Citrus Pruning [% w/w?] |
|---|---|---|
| PM10 | 5.3 | 2.5 |
| 2.5 < PM < 10 | 38.5 | 18.0 |
| PM2.5 | 170.2 | 79.5 |
| PM Fractions | Citrus Pruning [mg/Nm3] | Citrus Pruning [% w/w?] |
|---|---|---|
| PM10 | 0.95 | 1.48 |
| 2.5 < PM < 10 | 2.39 | 3.73 |
| PM2.5 | 61.06 | 94.79 |
| TSP | Open Burning [mg/Nm3] | Boiler with Abatement System [mg/Nm3] |
|---|---|---|
| PM | 103.05 | 83.10 |
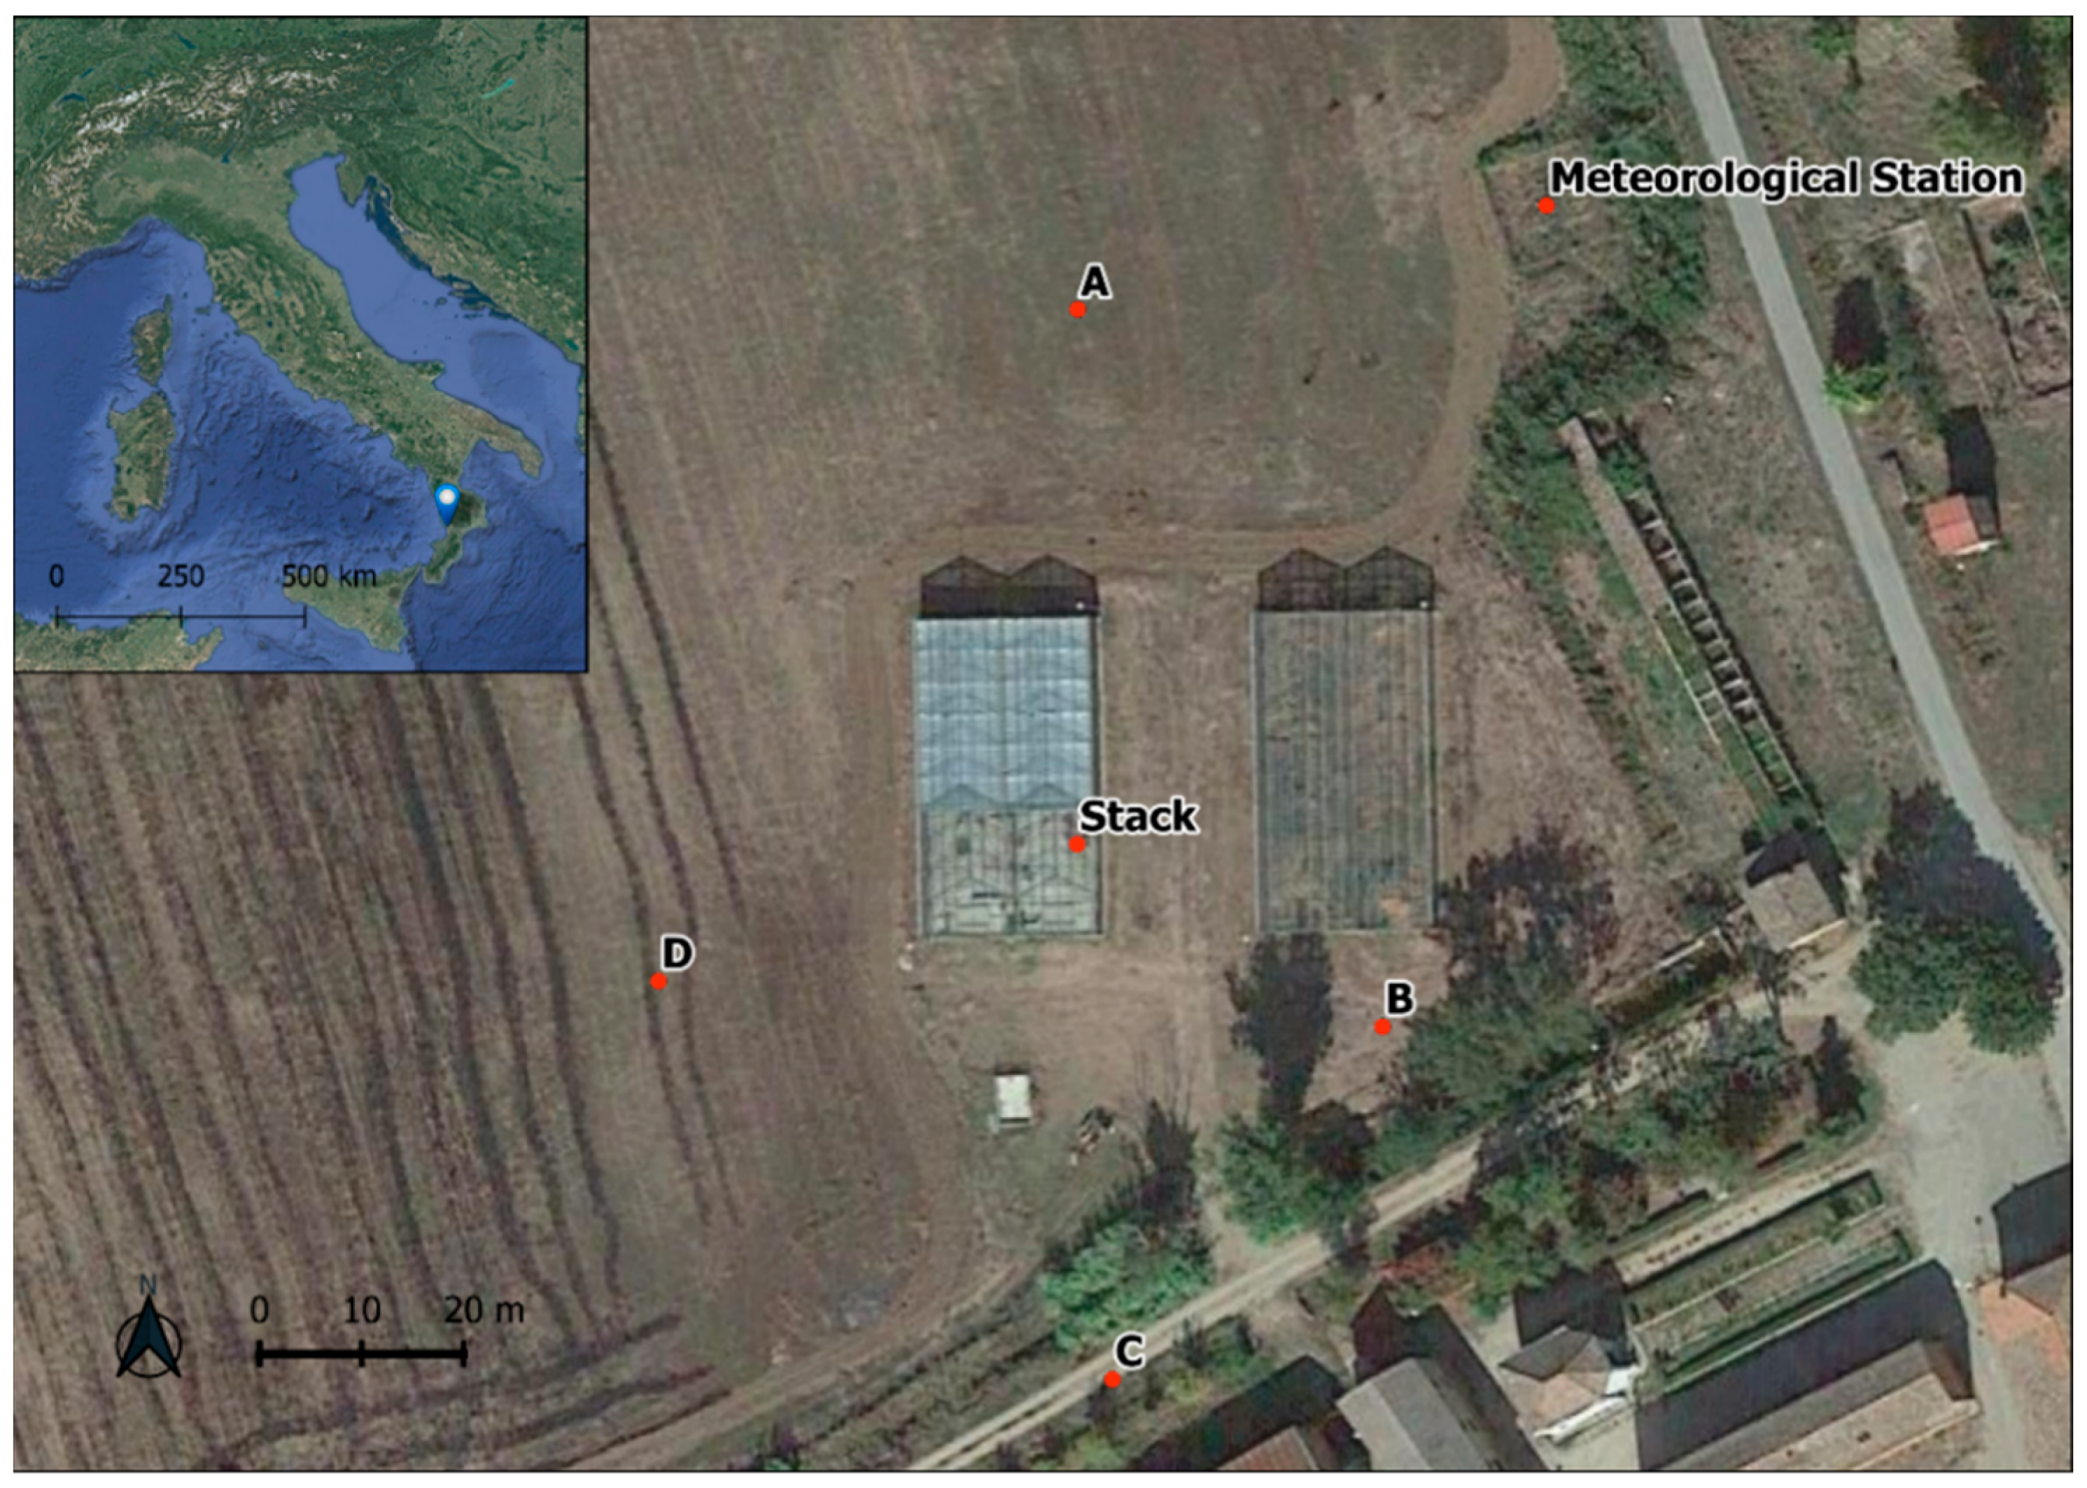
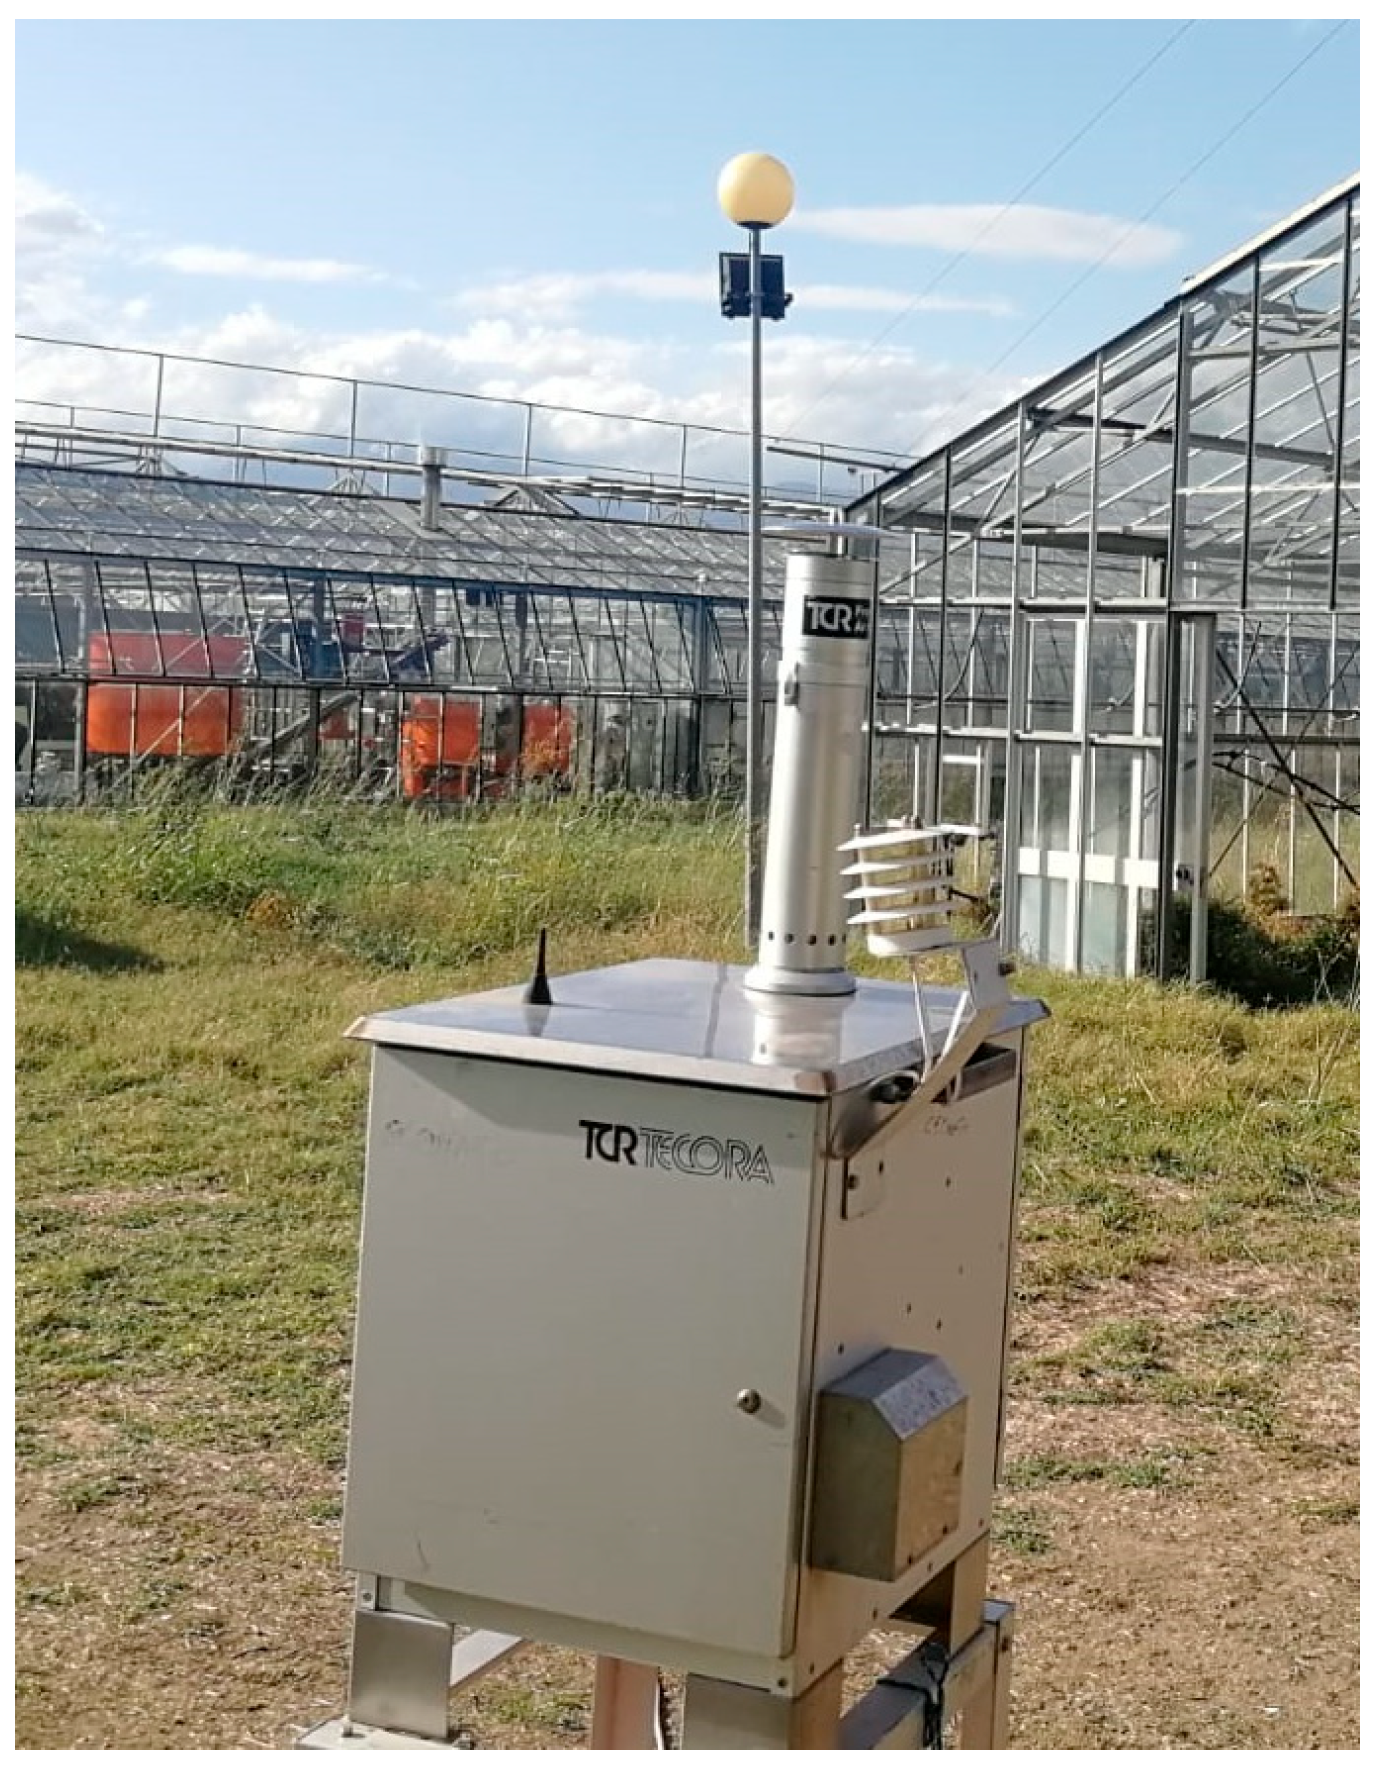
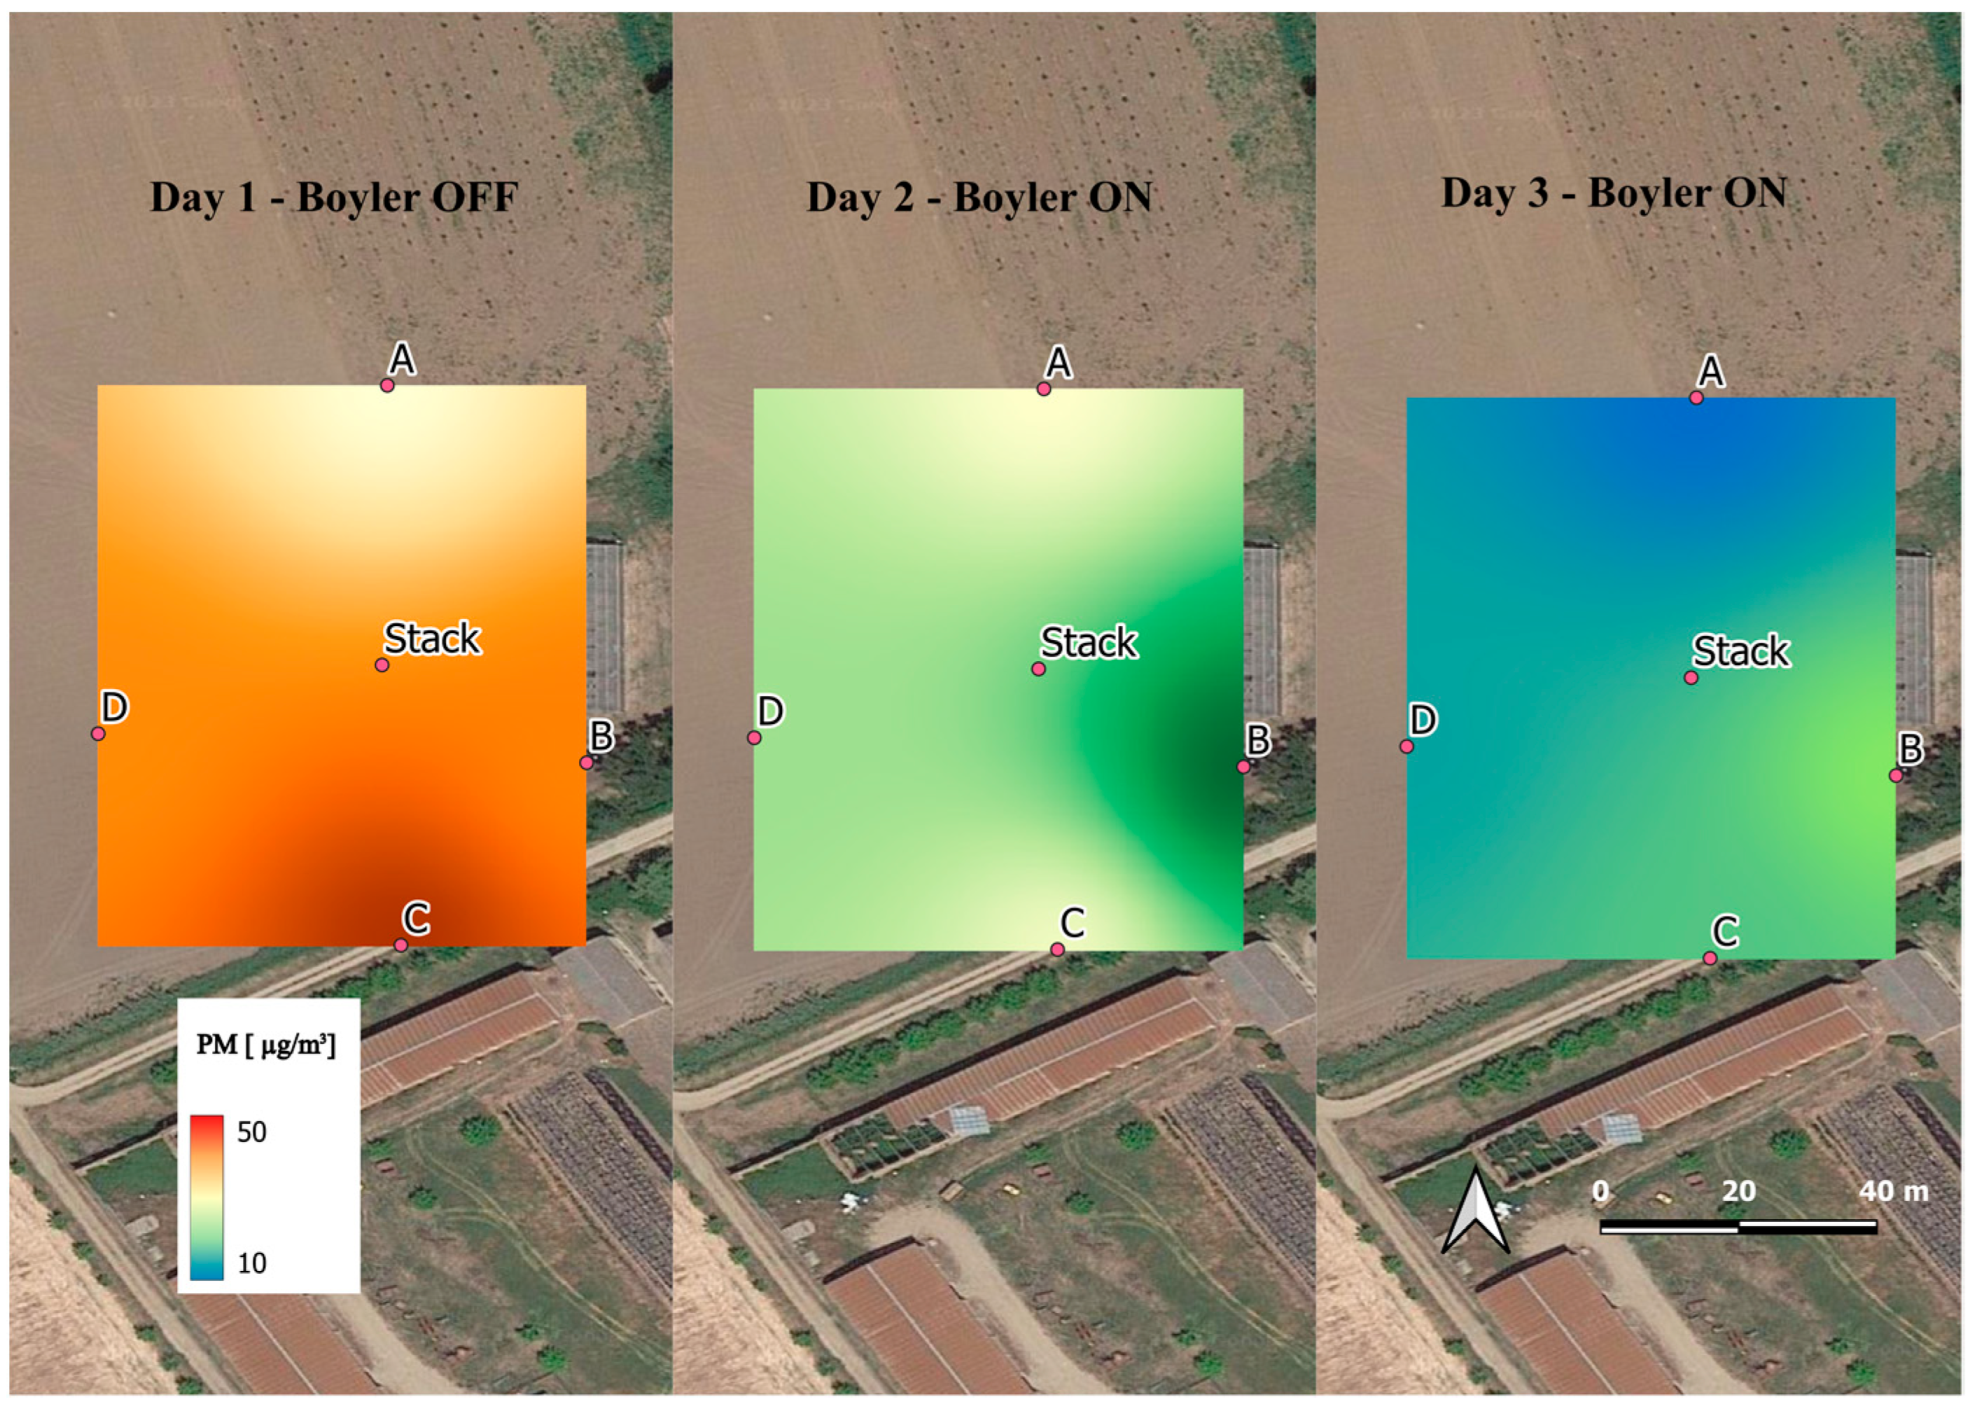
| Sampling Period | Air Temperature [°C] | Precipitations [mm] | Moisture [%] | Soil Temperature [°C] | Wind Direction |
|---|---|---|---|---|---|
| 4th October 2020 | |||||
| Day | 27.8 | 0 | 43.09 | 20.58 | NW |
| Night | 18.73 | 0 | 77.9 | 20.92 | NW |
| 5th October 2020 | |||||
| Day | 26.04 | 0 | 48.28 | 20.62 | NW—SW |
| Night | 22 | 0 | 62.4 | 20.9 | SW—N |
| 6th October 2020 | |||||
| Day | 24.29 | 0 | 54.42 | 20.82 | NW |
| Night | 19.13 | 0 | 65.8 | 20.98 | SW |
| Citrus pruning combustion in boiler with abatement system | ||||||||||
|---|---|---|---|---|---|---|---|---|---|---|
| [mg/Nm3] | Na | Mg | Al | K | Ca | Cr | Mn | Fe | Ni | Cu |
| PM filter | 5.50 | 0.73 | 3.59 | 110.10 | 0.99 | 0.01 | 0.10 | 1.78 | 3 × 10⁻³ | 0.05 |
| Impingers | 0.89 | 0.26 | 0.42 | 1.76 | 1.23 | 1 × 10⁻³ | 0.01 | 0.30 | 6 × 10⁻³ | 0.05 |
| Backup | 0.03 | 0.02 | 0.04 | 0.03 | 0.02 | <LOQ | 8 × 10⁻⁴ | 0.04 | 1 × 10⁻⁴ | 3 × 10⁻³ |
| [mg/Nm3] | Zn | Ga | Sr | Ag | Cd | In | Ba | Tl | Pb | Bi |
| PM filter | 0.33 | 6 × 10⁻³ | 0.06 | 5 × 10⁻⁴ | 3 × 10⁻⁴ | 1 × 10⁻⁴ | 0.07 | 1 × 10⁻³ | 0.07 | 0.18 |
| Impingers | 0.31 | 3 × 10⁻⁴ | 0.02 | 4 × 10⁻⁵ | 3 × 10⁻³ | <LOQ | 0.01 | 7 × 10⁻⁴ | 0.03 | 2 × 10⁻³ |
| Backup | 0.01 | <LOQ | 4 × 10⁻⁴ | <LOQ | 5 × 10⁻³ | <LOQ | 3 × 10⁻³ | 2 × 10⁻⁵ | 0.06 | <LOQ |
| Citrus pruning combustion in boiler without abatement system (Open Burning) | ||||||||||
| [mg/Nm3] | Na | Mg | Al | K | Ca | Cr | Mn | Fe | Ni | Cu |
| PM filter | 4.00 | 1.86 | 4.51 | 351.90 | 1.05 | 0.06 | 0.23 | 2.78 | 9E-04 | 2E-03 |
| Impingers | 1.20 | 0.55 | 0.73 | 0.74 | 1.66 | 0.04 | 0.02 | 0.89 | 0.03 | 0.02 |
| Backup | 0.62 | 0.29 | 0.38 | 0.38 | 0.85 | 0.02 | 0.01 | 0.45 | 0.01 | 0.01 |
| [mg/Nm3] | Zn | Ga | Sr | Ag | Cd | In | Ba | Tl | Pb | Bi |
| PM filter | 0.01 | 1 × 10⁻³ | 0.03 | 3 × 10⁻³ | 4 × 10⁻⁴ | 5 × 10⁻⁵ | 9 × 10⁻⁴ | 2 × 10⁻³ | 2 × 10⁻⁵ | 0.02 |
| Impingers | 0.17 | 3 × 10⁻³ | 0.01 | 0.09 | 5 × 10⁻⁵ | <LOQ | 4 × 10⁻⁴ | 3 × 10⁻³ | <LOQ | <LOQ |
| Backup | 0.09 | 1 × 10⁻³ | 2 × 10⁻³ | 0.05 | 3 × 10⁻³ | <LOQ | 2 × 10⁻⁴ | 1 × 10⁻³ | <LOQ | <LOQ |
| [ng/Nm3] | Na | Mg | Al | K | Ca | Cr | Mn | Fe | Ni | Cu |
|---|---|---|---|---|---|---|---|---|---|---|
| A1 | 747.30 | 152.40 | 1.51 | 489.987 | 109.70 | 0.10 | 2.12 | 1.84 | 0.23 | 0.48 |
| A2 | 867.27 | 199.42 | 2.38 | 344.55 | 175.05 | 0.13 | 3.11 | 2.71 | 0.34 | 0.71 |
| A3 | 504.30 | 72.76 | 0.19 | 107.73 | 10.38 | 0.05 | 0.56 | 0.47 | 0.06 | 0.12 |
| B1 | 1122.17 | 226.48 | 25.18 | 301.16 | 362.76 | 0.13 | 9.76 | 8.37 | 0.29 | 1.22 |
| B2 | 681.73 | 126.88 | 1.48 | 103.37 | 100.53 | 0.11 | 3.10 | 2.50 | 0.19 | 0.03 |
| B3 | 1105.50 | 106.60 | 0.23 | 63.65 | 16.32 | 0.05 | 0.81 | 0.03 | 0.07 | 0.07 |
| C1 | 4608.35 | 404.65 | 19.81 | 397.91 | 461.84 | 0.13 | 10.42 | 8.67 | 0.52 | 2.06 |
| C2 | 1494.04 | 204.44 | 11.54 | 220.74 | 187.15 | 0.18 | 4.84 | 6.14 | 0.15 | 0.13 |
| C3 | 612.26 | 87.54 | 0.31 | 49.73 | 12.39 | 0.05 | 0.61 | 0.38 | 0.10 | 0.07 |
| D1 | 1584.62 | 254.87 | 42.64 | 358.89 | 406.57 | 0.08 | 11.64 | 14.10 | 0.34 | 1.24 |
| D2 | 772.96 | 146.87 | 13.59 | 162.67 | 129.55 | 0.07 | 4.13 | 3.36 | 0.14 | 0.12 |
| D3 | 403.49 | 57.25 | 0.42 | 35.07 | 7.20 | 0.01 | 0.32 | <LOQ | 0.08 | 0.18 |
| [ng/Nm3] | Zn | Ga | Sr | Ag | Cd | In | Ba | Tl | Pb | Bi |
| A1 | 11.41 | 0.09 | 5.56 | 0.01 | 0.39 | 0.05 | 1.76 | 0.00 | 0.56 | 0.22 |
| A2 | 16.55 | 0.15 | 8.88 | 0.02 | 0.58 | 0.07 | 2.84 | 0.01 | 0.81 | 0.34 |
| A3 | 3.29 | 0.01 | 0.51 | 0.00 | 0.09 | 0.01 | 0.14 | 0.00 | 0.15 | 0.04 |
| B1 | 3.21 | 0.12 | 10.34 | <LOQ | 0.10 | 0.00 | 2.51 | 0.14 | 0.27 | 0.03 |
| B2 | 3.13 | 0.03 | 3.71 | <LOQ | <LOQ | 0.00 | 0.91 | 0.01 | 0.10 | 0.00 |
| B3 | 1.67 | 0.01 | 0.80 | 0.00 | <LOQ | <LOQ | 0.18 | 0.01 | 0.03 | 0.01 |
| C1 | 12.70 | 0.16 | 16.41 | <LOQ | <LOQ | <LOQ | 3.66 | 0.16 | 0.23 | 0.00 |
| C2 | 4.90 | 0.07 | 7.35 | 0.02 | <LOQ | <LOQ | 1.79 | 0.05 | 0.14 | <LOQ |
| C3 | 3.35 | 0.01 | 0.73 | 0.00 | <LOQ | <LOQ | 0.23 | 0.01 | 0.02 | <LOQ |
| D1 | 2.95 | 0.17 | 11.81 | 0.00 | <LOQ | <LOQ | 3.73 | 0.20 | 0.30 | <LOQ |
| D2 | 5.05 | 0.08 | 5.74 | 0.02 | <LOQ | <LOQ | 1.87 | 0.03 | 0.08 | <LOQ |
| D3 | 2.54 | 0.00 | 0.43 | 0.01 | <LOQ | <LOQ | 0.18 | 0.01 | 0.04 | <LOQ |
Disclaimer/Publisher’s Note: The statements, opinions and data contained in all publications are solely those of the individual author(s) and contributor(s) and not of MDPI and/or the editor(s). MDPI and/or the editor(s) disclaim responsibility for any injury to people or property resulting from any ideas, methods, instructions or products referred to in the content. |
© 2024 by the authors. Licensee MDPI, Basel, Switzerland. This article is an open access article distributed under the terms and conditions of the Creative Commons Attribution (CC BY) license (https://creativecommons.org/licenses/by/4.0/).
Share and Cite
Paris, E.; Carnevale, M.; Palma, A.; Vincenti, B.; Salerno, M.; Proto, A.R.; Papandrea, S.; Guerriero, E.; Perilli, M.; Cerasa, M.; et al. Biomass Combustion in Boiler: Environmental Monitoring of Sugar Markers and Pollutants. Atmosphere 2024, 15, 427. https://doi.org/10.3390/atmos15040427
Paris E, Carnevale M, Palma A, Vincenti B, Salerno M, Proto AR, Papandrea S, Guerriero E, Perilli M, Cerasa M, et al. Biomass Combustion in Boiler: Environmental Monitoring of Sugar Markers and Pollutants. Atmosphere. 2024; 15(4):427. https://doi.org/10.3390/atmos15040427
Chicago/Turabian StyleParis, Enrico, Monica Carnevale, Adriano Palma, Beatrice Vincenti, Mariangela Salerno, Andrea Rosario Proto, Salvatore Papandrea, Ettore Guerriero, Mattia Perilli, Marina Cerasa, and et al. 2024. "Biomass Combustion in Boiler: Environmental Monitoring of Sugar Markers and Pollutants" Atmosphere 15, no. 4: 427. https://doi.org/10.3390/atmos15040427