Article

Sensitive Areas’ Observation Simulation Experiments of Typhoon “Chaba” Based on Ensemble Transform Sensitivity Method

College of Ocean and Meteorology, Guangdong Ocean University, Zhanjiang 524088, China
*
Author to whom correspondence should be addressed.
Atmosphere 2024, 15(3), 269; https://doi.org/10.3390/atmos15030269
Submission received: 12 January 2024 / Revised: 16 February 2024 / Accepted: 20 February 2024 / Published: 23 February 2024
(This article belongs to the Special Issue Data Assimilation for Predicting Hurricane, Typhoon and Storm)

Abstract

:
High-impact weather (HIW) events, such as typhoons, usually have sensitive regions where additional observations can be deployed and sensitive observations assimilated, which can improve forecasting accuracy. The ensemble transform sensitivity (ETS) method was employed to estimate the sensitive regions in the “Chaba” case in order to explore the impact of observation data in sensitive areas on typhoon forecasting during the rapid intensification phase. A set of observation system simulation experiments were conducted, with assimilations of sensitive observations (SEN), randomly selected observations (RAN), whole domain observations (ALL), and no assimilation (CTRL). The results show that (1) the sensitive areas of Typhoon “Chaba” are primarily located in the southwest of the typhoon center and are associated with the distribution of the wind field structure; (2) the typhoon intensity and tracks simulated by the SEN and RAN experiments are closer to the truth than the CTRL; (3) the SEN experiment, with only 3.6% of assimilated data observations, is comparable with the ALL experiment during the rapid intensification phase of the typhoon; (4) the uncertainty of the mesoscale model can be improved by capturing large-scale vertical wind shear and vorticity features from the GEFS data and then using the data assimilation method, which makes the vertical shear and vorticity field more reasonable.

1. Introduction

Tropical cyclones are one of the most destructive weather systems. When tropical cyclones land or approach, the strong winds, heavy rains, and storm surges brought by tropical cyclones will have a serious negative impact on human activities and economic development [1]. China, with an average annual landfall of 7–9 typhoons, is one of the countries suffering from the most serious typhoon disasters in the world [2]. Therefore, accurate prediction of typhoon generation and development is the key to minimizing its disasters. At present, significant progress has been made in typhoon track forecasting. However, the accuracy of typhoon intensity prediction is much lower than that of track prediction, and accurate prediction of typhoon intensity, especially rapid intensification (RI), is still one of the challenges to be solved [3].
With the increase in computational power and development of mesoscale numerical simulations in the 21st century, numerical models have brought some improvements to the simulation of rapid intensification, but model forecasts still face problems, such as initial value error, model error, and chaotic properties of the atmosphere. The initial value error refers to the difference between the model’s estimation of the current atmospheric state and the actual state of the atmosphere at the beginning of the numerical weather prediction. The initial value error will be amplified with the increase in forecasting time, which will reduce the accuracy of numerical weather forecasts [4]. In order to solve the problem, previous researchers have proposed the method of data assimilation, which is a method of using statistical methods to combine observations and background constants to obtain analysis fields [5]. As data assimilation methods continue to evolve, a variety of data assimilation methods have emerged in the scientific community, such as manual interpolation methods, 3D variational assignment methods (3DVar) [6], and 4D variational assignment methods (4DVar), dramatically improving the quality of the initial field in numerical weather prediction. In recent years, due to the application of remote-sensing observation data and the continuous improvement of assimilation methods, European and other global numerical prediction centers have made significant progress in tropical cyclone forecasting [7]. Furthermore, numerous scholars have conducted extensive studies based on data assimilation methods. For instance, Zhou et al. assimilated the GPS_ZTD data on the basis of conventional data, such as soundings and wind profiles, to effectively improve the initial water vapor conditions of Typhoon “Likima” No. 14 in 2019, thus improving the accuracy of the prediction of outer rainbands [8]. Zou et al. utilized data assimilation methods to simulate Typhoon “Usagi” No. 19 in 2013 and discovered that the method can reduce the prediction error of the typhoon’s tracks and make the precipitation more concentrated [9]. Yu et al. assimilated AMSR2 satellite data on the basis of WRF-ARW and WRFDA3.8, which further improved the forecast effect of Typhoon “Rammasun” No. 9 in 2014 [10]. The above studies suggest that the data assimilation method can well solve the problem of initial value uncertainty in numerical models, improve typhoon forecasts, and thus reduce the potential hazards of typhoons.
Because of the limitations of observational data and the different contributions of observational data from different regions to the prediction of typhoons using the above methodology, a new idea of combining observations with numerical models has been proposed as adaptive observations in order to improve the efficiency of observational data [11]. This approach refers to obtaining more high-value observational data by performing additional observations in regions (sensitive regions), which have greater impact on the verification area forecast [12]. The information, after being processed by the data assimilation system, provides the model with an initial field of the model, which is closer to the real condition, in order to obtain more accurate forecast results [4]. Compared to conducting assimilation in all regions, the method of data assimilation in sensitive regions is less costly and more efficient, and it can provide more positive contributions to typhoon forecasting. Chen et al. conducted experiments on Typhoon “Likima” No. 14 in 2019, and the results showed that assimilating observations in the sensitive regions significantly improved the typhoon forecasting ability. Meanwhile, data assimilation experiments were conducted in the sensitive area of Typhoon “Higos” No. 07 in 2020, and it was discovered that the improvement in the path prediction result via assimilation of sounding data in the sensitive area only was significantly greater than that achieved via assimilation of data from all eight sounding data [13]. Chen et al. carried out a study on Typhoon “Chan-hom” No. 09 in 2015, and the results demonstrated that the best forecasts were obtained by assimilating the data in sensitive areas [14]. Qin et al. implemented the CNOP method in the prediction of seven typhoon path cases in the western Pacific Ocean in 2009, and the results demonstrated that choosing the sensitive area, which accounts for 1% of the whole field, as the target observation area can effectively improve the prediction results of typhoon tracks [15]. The above studies show that data assimilation within the sensitive areas of typhoons can improve typhoon forecasting more efficiently, but accurate identification of sensitive areas is the core problem in the current research [16].
With the continuous development of technology, a variety of approaches have been developed at home and abroad to estimate the adaptive observations. Some of the methods proposed have included, for example, the linear singular vector method for determining sensitive regions by finding a linear fast-growing error mode [17]; the ensemble transform technique by obtaining signal variance [18]; the ensemble-based sensitivity method [19]; the adjoint-derived sensitivity steering vector (ADSSV) algorithm for tropical cyclones [20]; the conditional non-linear optimal perturbation (CNOP) method [21,22]; the ensemble transform Kalman filter (ETKF) method [23]; the ensemble transformation sensitivity(ETS) method [24], etc. Among them, the linear singular vector method relies on linearized dynamical equations and their corresponding concomitant modes, and its application is constrained by the mechanism of linear propagation of errors, which leads to the fact that the forecasting time period of this method cannot be too long; otherwise, it will lead to a large deviation in the observed sensitive areas from the actual condition [25].The singular vector method does not appear to consider the role of additional introduced observations, which is somewhat different from the optimal objective method [26]. Nevertheless, as an earlier adaptive observation method, the observation sensitivity regions identified by the singular vector method have been proved to be effective to some extent in improving the results in the validation region of deterministic forecast ability [27]. At the same time, the ensemble Kalman transform method has some differences in the data assimilation system for analysis and forecasting, and the ensemble Kalman transform method can somewhat overestimate the impact of observations on forecasting results [28].
At present, there are two main methods for evaluating the effectiveness of target observation methods: the OSSE experiment and the field experiment. Generally speaking, for a new target observation method, the OSSE experiment should be carried out first to confirm its validity, and then the field experiment can be carried out to further examine its effect [4]. Therefore, OSSE experiments have been carried out to test the effectiveness of different target observation methods. Qin used OSSE to examine the effectiveness of CNOP-identified sensitive areas in reducing forecasting errors and found that assimilating simulated observations within CNOP-identified sensitive areas improved the forecasting ability of various physical quantities more than assimilating simulated observations within randomly selected areas [29]. Li carried out OSSE experiments on the rainstorm, which occurred in Beijing and the surrounding areas on 23 July 2009, and the results showed that the assimilation of water vapor in the sensitive area corresponding to water vapor significantly improved the forecasting results of precipitation [30]. Ma et al. identified sensitive areas based on the ensemble transform Kalman filter (ETKF) method in high-impact weather cases of summer rainstorms and winter snowfalls around Beijing, China, and the target data of the observation sensitivity areas brought a positive contribution to the analysis and quality of short-term forecasts [16]. The successful application of the various methods mentioned above also confirms the feasibility of various methods. However, previous researchers have explored to a lesser extent the improvement of assimilation-sensitive area data for the forecasting ability of typhoons during rapid intensification using the OSSE method.
In this study, we used the ensemble transformation sensitivity (ETS) method—a sensitive area identification algorithm based on ET. To identify sensitive areas, the ETS algorithm calculates only the minimum value of the forecast error cost function once, and its computational efficiency is significantly higher than that of the ensemble transformation method. This new method can reduce the computational cost by 60–80% while maintaining computational effectiveness [24]. Meanwhile, in this study, using the OSSE method, four sets of sensitivity tests—including assimilations of sensitive observations (SEN), randomly selected observations (RAN), whole domain observations, and no assimilation (CTRL)—were set up based on the observation data constructed using the ERA5 re-analysis data in order to study the degree of improvement of the target observation data in the numerical prediction of Typhoon “Chaba” and to optimize and adjust the adaptive observation strategy accordingly.
Typhoon “Chaba”, which made landfall off the coast of Dianbai County, Maoming City, Guangdong Province, China, in 2022, caused major economic losses in the western part of Guangdong Province, China. Therefore, intercomparison experiments were conducted using the Gridpoint Statistical Interpolation (GSI) assimilation system and the Advanced Research Weather Research and Forecasting Model (WRF-ARW) mesoscale model to explore the impact of assimilating observations from sensitive areas on typhoon forecasting, with particular emphasis on the typhoon wind field structure, vorticity field, and the evolution of wind shear characteristics. This study will provide a reference for exploring the configuration of the observation system in the target-sensitive area in the South China Sea region of China and the mechanism of the rapid intensification of typhoons in this region.
This paper is organized as follows. In Section 2, we briefly describe the experimental data and the ETS algorithm applied in order to estimate the sensitive areas of Typhoon “Chaba”. In Section 3, we offer the model and experimental configuration. Section 4 provides the results of the experiment and analysis of the reasons. Conclusions are presented in Section 5.

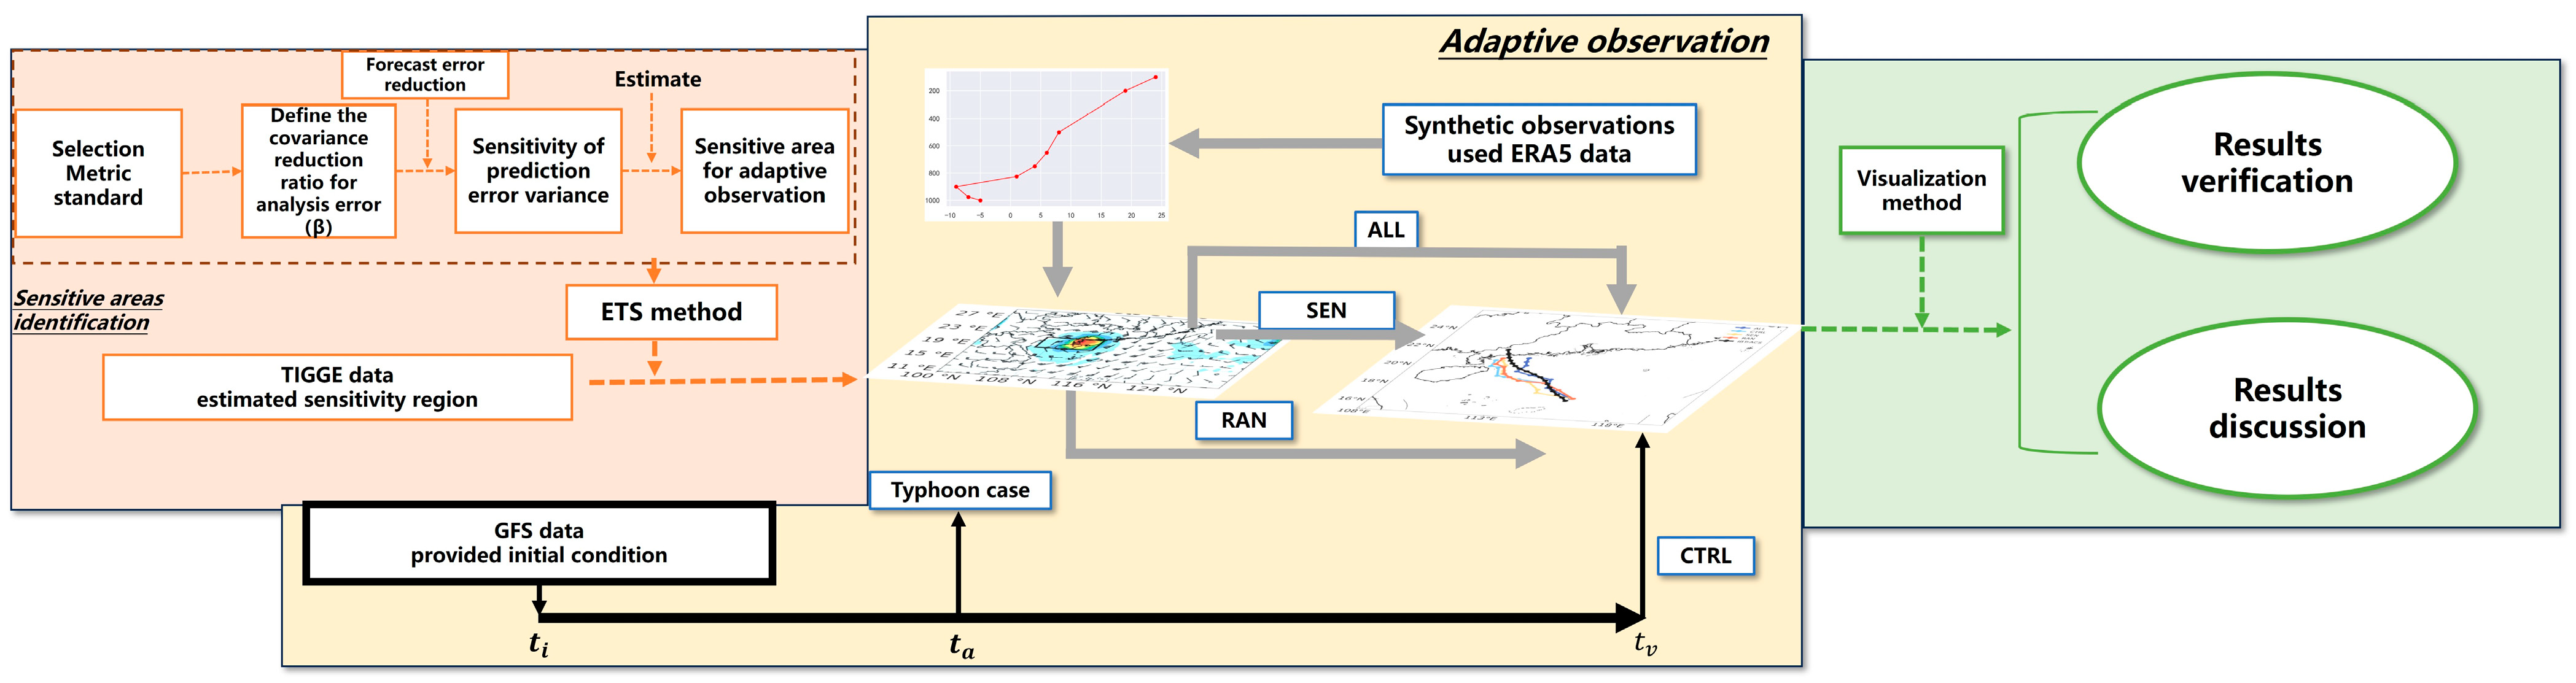
2. Data and Methodology

2.1. Data

The Global Forecast System (GFS)—a global numerical weather prediction product produced by the National Centers for Environmental Prediction (NCEP) of the United States of America—has a wide range of applications in China’s meteorological services. It not only provides forecasting data but also serves as a background to drive the WRF—a regional numerical weather model, which has the same wide range of applications—to conduct short-range and short-term forecasts, etc. [31]. Thus, this paper uses GFS data as the initial values and lateral boundary conditions, with a resolution of 0.25° × 0.25° and a prediction starting time of 2022063012 (UTC), with a forecast time limit of 48 h. Detailed information can be obtained by accessing the database website: https://ftp.ncep.noaa.gov/data/nccf/com/gfs/prod/ (accessed on 21 January 2023).
This paper employs the ERA5 (the fifth generation of the ECMWF global climate re-analysis) dataset forecast product from the European Center for Medium-Range Weather Forecasts (ECMWF) to construct a simulated sounding of the adaptive observation sensitivity areas due to the free data access, high spatial and temporal resolution, and long temporal coverage. ERA5 is a fifth-generation European Center for Medium-Range Weather Forecasts (ECMWF) re-analysis of global climate and weather from 1940 to the present. The re-analysis combines model data with observations from across the world into a globally complete and consistent dataset using the laws of physics. Additionally, the GFS data used to drive the WRF model in this study are not assimilated and therefore do not conflict with the ERA5 data. Furthermore, each assimilation sensitivity test in our study uses ERA5 profile data in which more valuable meteorological information may exist, which can further optimize the assimilation effect of our test and make a positive contribution to our test. These data can be downloaded from the following website: https://cds.climate.copernicus.eu/cdsapp#/Dataset/reanalysisera5pressurelevels, (accessed on 24 January 2023).
In addition, the typhoon verification data are derived from the official website of the International Best Track Archive for Climate Stewardship (IBTrACS), which is a database that records the tracks and intensity of tropical cyclones (e.g., typhoons, hurricanes, and cyclones) around the globe. The purpose of this database is to provide information on the latitude and longitude coordinates, maximum sustained winds, and wind speeds of typhoons, so that researchers can analyze the characteristics and trends of typhoons, and thus, the data are often applied in various research works. The data can be downloaded from the following website: https://www.ncdc.noaa.gov/ibtracs/index.php?name=ib-v4-access, accessed on 10 February 2023).

2.2. Method for Estimating Observation Sensitive Area

In this study, the ensemble transform sensitivity (ETS) method is employed, which is an algorithm for identifying sensitive areas based on the ensemble transform method (ET). The method assumes that the model forecast error is ignored and the ensemble forecast error increases quasi-linearly. The measurement criterion of the method is based on the total dry air disturbance energy (Equation (1)):
1 2 1 D D 0 1 u 2 + v 2 + C p T r T 2 + R T r ( p r e s p r e r ) 2 d δ d D
Among them, u ,   v represents the horizontal wind component; T stand for the temperature and p r e s for the surface air pressure perturbation; C p and R are the constant volume air pressure and phase change latent heat of dry air (with values of 1005.7 J· K g 1 K, 287.04 J· K g 1 K, respectively); D represents the horizontal direction of the calculated area; δ denotes the vertical direction; T r and p r e r are the reference temperature and pressure.
Then, the problem of facing exponential growth in computation with increasing resolution in calculating the signal variance of all scenarios is optimized by the sensitivity test minimization algorithm, and afterward, the sensitivity of the forecast error variance is calculated; finally, based on this, the sensitivity region of adaptive observation is estimated. The specific formulation for calculating sensitivity is as follows:
J β 1 = i = 1 M Z i T Ψ 1 X e a T A g 1 β 1 A g 1 X e ( a ) Ψ 1 Z i
Among them, J represents the sensitivity of the prediction error variance; β 1 indicates the reduction rate of analysis error covariance at the position of the i-th state variable; i represents the i-th variable; Ψ 1 denotes the transpose matrix of the set perturbation matrix; X e a T stands for the transposition matrix of the set perturbation matrix M × K at time a; A g is the analysis error covariance matrix following the assimilation of new observation data; Z represents the transpose matrix of X e ( t v ) , where Z i is the i-th column of matrix Z.
The process is divided into three main parts (Figure 1). First, sensitive areas are identified in order to implement additional observation using the ETS method. The TIGGE data are used to establish sensitive areas for typhoon cases, which have the potential to greatly improve the forecast in the verification region (indicated with a black box at time t) where typhoon landfall is expected to occur. Second, adaptive observations are simulated through numerical prediction. The Global Forecast System (GFS) data are used for control (CTRL) experiments in order to forecast landfall at the verification time t v . Adaptive simulation observation experiments (SEN), random observation experiments (RAN), and whole domain observations (ALL), respectively, assimilate additional synthetic observation data at the analysis time t a . Third, the impact of additional data assimilation in sensitive areas on typhoon forecasting is discussed.

3. Model and Experimental Configuration

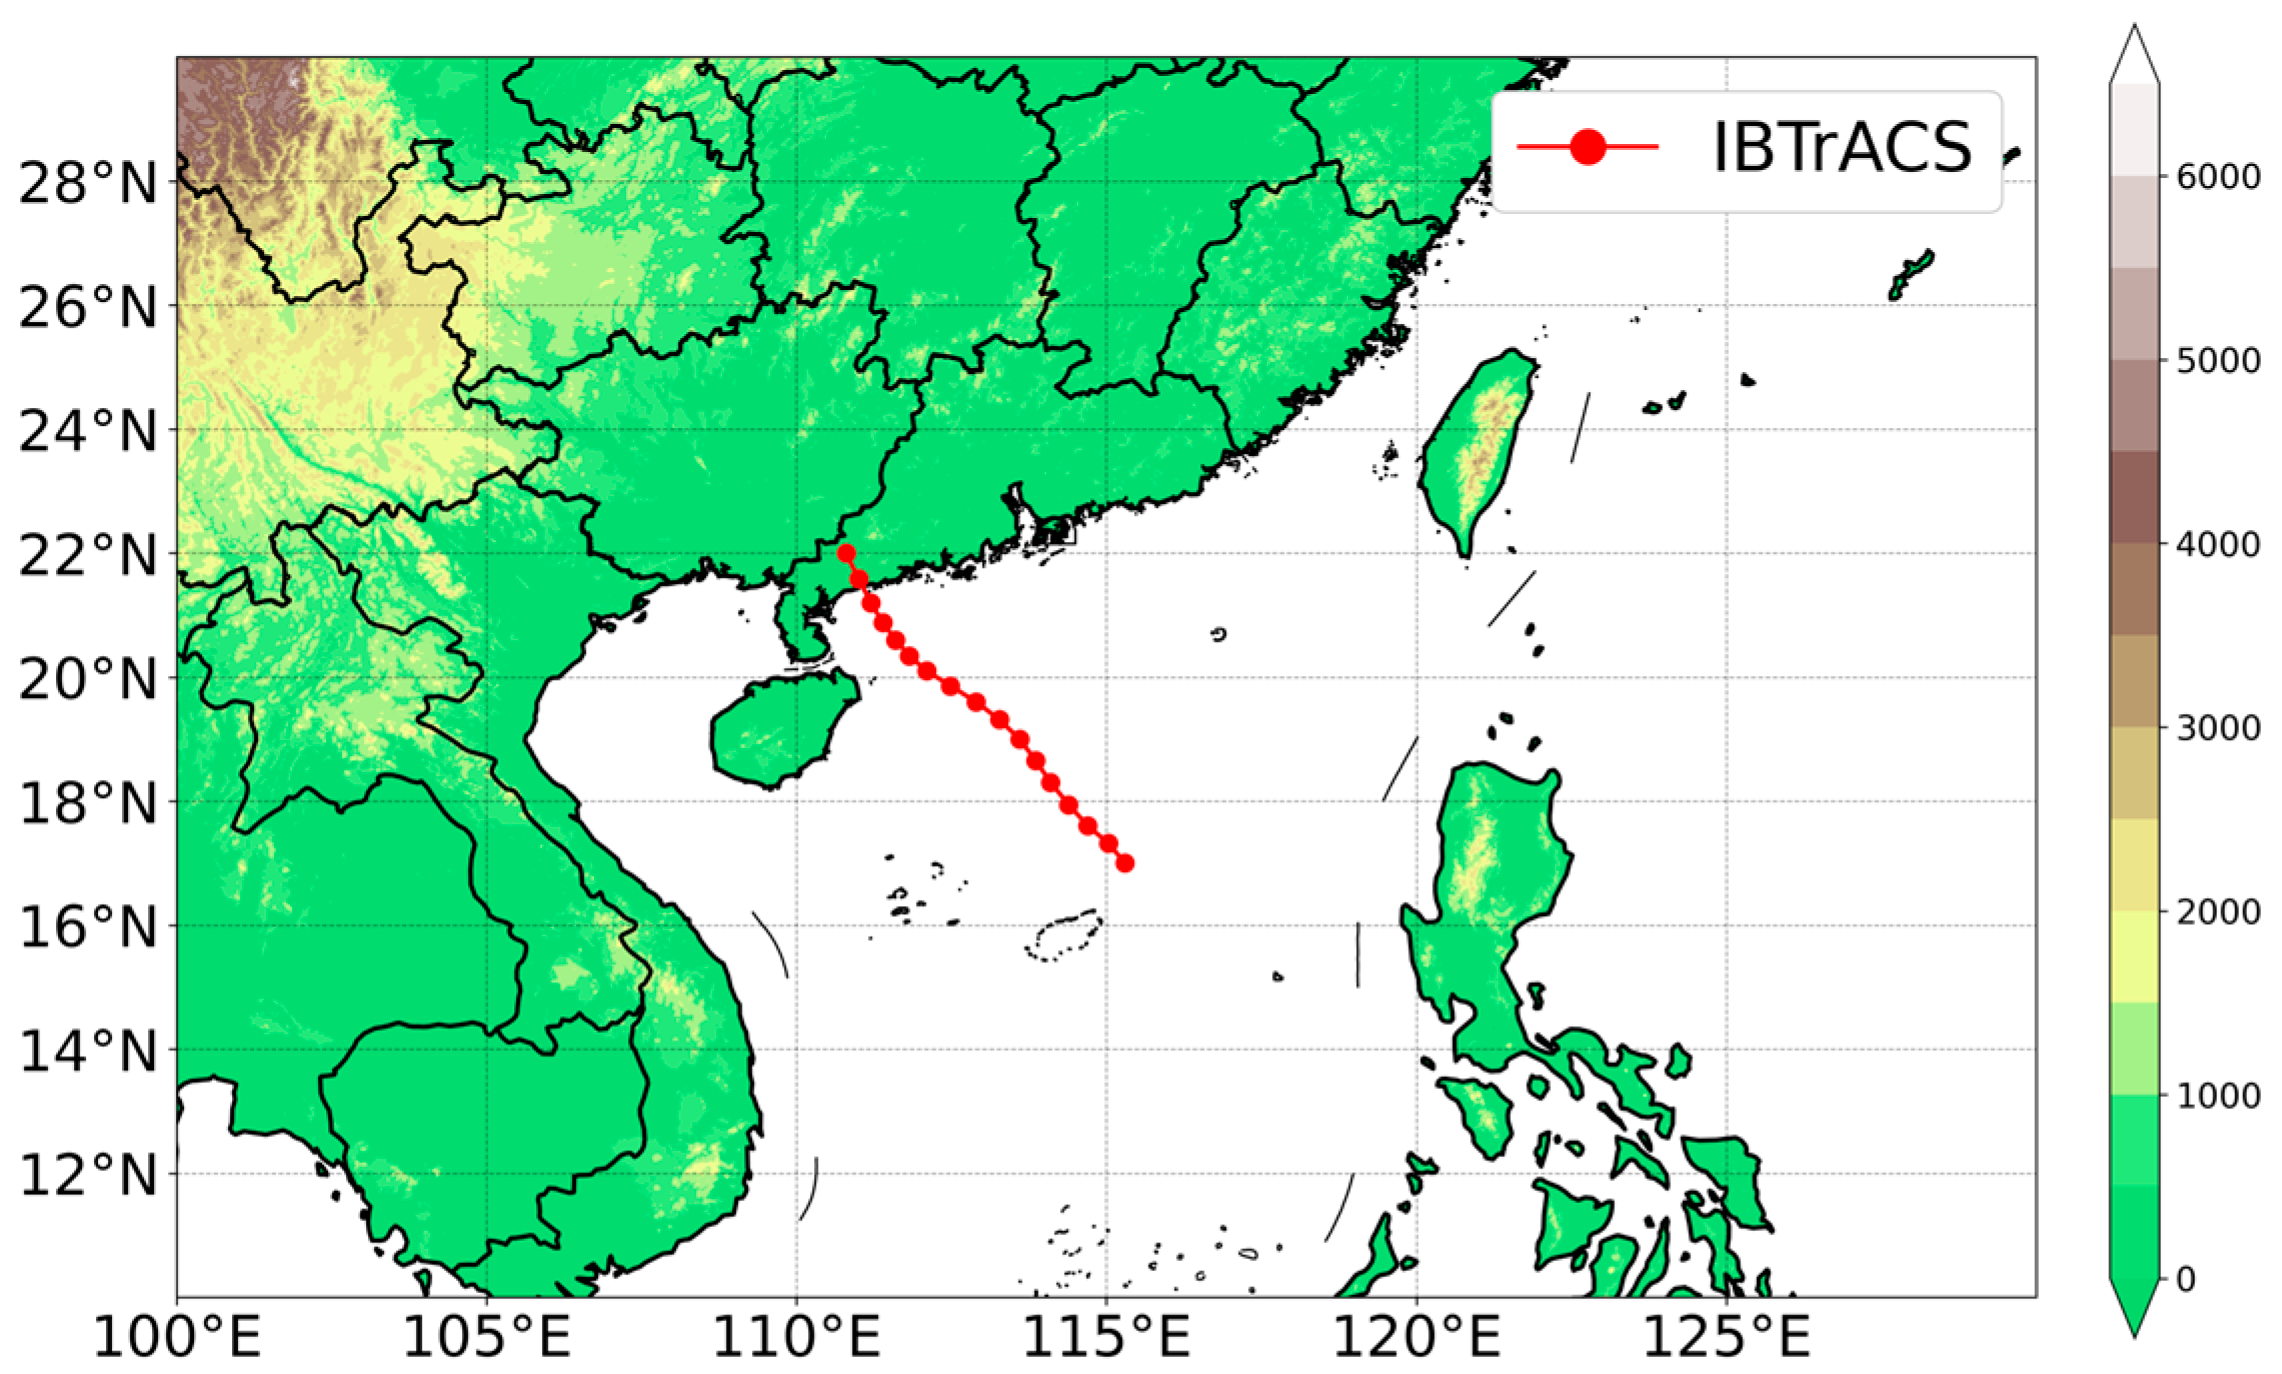
3.1. Description of Typhoon “Chaba”

At 2022063012 (UTC), Typhoon “Chaba” was formed in the South China Sea.At 23:00 that night, it strengthened into a strong tropical storm. At 2022070105 (UTC), the center of Typhoon “Chaba” was located in the central part of the South China Sea, approximately 250 km northeast of Sansha City (Yongxing Island, Xisha), Hainan Province, China, with maximum winds near the center of the typhoon at force 10 (25 m/s). At 2022070108 (UTC), “Chaba” strengthened to typhoon force (12) and was located in the sea, approximately 120 km southeast of Zhanjiang City, Guangdong Province, China. At 2022070115 (UTC), the center of “Chaba” made landfall off the coast of Dianbai, Guangdong Province, with a maximum wind force of 12 (35 m/s) near the center at the time of landfall and a minimum central pressure of 965 hPa. According to China’s Ministry of Emergency Management (MEM), “Chaba” affected 1.862 million people in four provinces (districts) of Guangdong, Guangxi, Hainan, and Jiangxi, with direct economic losses amounting to CNY 3.11 billion.

3.2. Mode Setting

The data assimilation system and forecast model in this paper are the GSI-3DVar assimilation system and the WRF-ARW forecast model, respectively. The spatial resolution of the model is 9 km × 9 km; the number of vertical layers is 50; and the top of the model layer is 50 hPa. The simulation domain of the model falls within a range of 8°97′ N–30°07′ N, 99°64′–130°55′ E (Figure 2), covering most of the areas of South China and the South China Sea, with a total of 361 × 264 grid points. The experimental period in this experiment comprises two consecutive days from 12:00 UTC 30 June 2022 to 12:00 UTC 2 July 2022, and the model forecasting time limit is 48 h from 12:00 UTC 30 June 2022. The model’s physical process and the related parameterization scheme are shown in Table 1.

3.3. Synthetic Observations and Simulation Experiments’ Design

The observation system simulation experiment method is one of the effective methods currently used to evaluate the effectiveness of adaptive observation. This method makes a determination of sensitive areas independently of the problem and does not take into account the influence of model errors on the effect of the experiment; therefore, the experimental results can directly reflect the target observation method, especially the effect of sensitive areas [38]. Therefore, in this study, the observation data of the three sets of assimilated experiments are obtained by combining the configuration information of the actual observation system, interpolating the ERA5 re-analysis data with a resolution of 0.25° × 0.25° from the ECMWF website with the simulated observation site locations, so as to construct the simulated sounding data required by different experiments, and finally assimilating the obtained simulated sounding data with the initial fields used in the SEN, ALL, and RAN experiments. This will enable us to examine the effectiveness of the adaptive observations and to investigate the extent to which the target observations improve numerical prediction and thus optimize the adaptive observation strategy accordingly.
In order to analyze the contribution of the assimilation of simulated sounding observations within the estimated observational sensitive areas to the forecast, four sets of sensitivity experiments are designed with assimilations of sensitive observations (SEN), randomly selected observations (RAN), whole domain observations, and no assimilation (CTRL). In addition, for the purpose of analyzing the contribution of simulated sounding observations within the observational sensitive area to the analysis and forecasting, the analysis time is set at 2022063012 (UTC) in conjunction with the distribution of sensitive area locations estimated at that time. The assimilation ranges for each experiment are shown in Table 2.
For the SEN experiment, we calculate the sensitivities in the whole simulation region based on the ETS method and obtain their distribution. In order to investigate the effect of assimilating the data in this region on the forecasting ability of Typhoon “Chaba”, we select the region with sensitivity values larger than 0.5 (13° N–17° N, 112° E–117° E) as the assimilation region. For the ALL test, which assimilates data over the entire simulation area (10° N–30° N, 100° E–130° E), we choose this area as the assimilation area for the ALL test in order to investigate the assimilation efficiency of the SEN test, since the number of data assimilated in the test is 27 times that of the SEN test. For the RAN test, in order to investigate the degree of influence of data assimilation on the model’s forecasting ability for data in the sensitive area, we select an area of the same size as that in the SEN test (21° N–25° N, 120° E–125° E) for data assimilation. This experimental area is randomly selected in the remain region excluding the sensitive area from the whole simulation area using the Random function in Python computer language.This area has better randomness and representativeness.

4. Results and Discussion

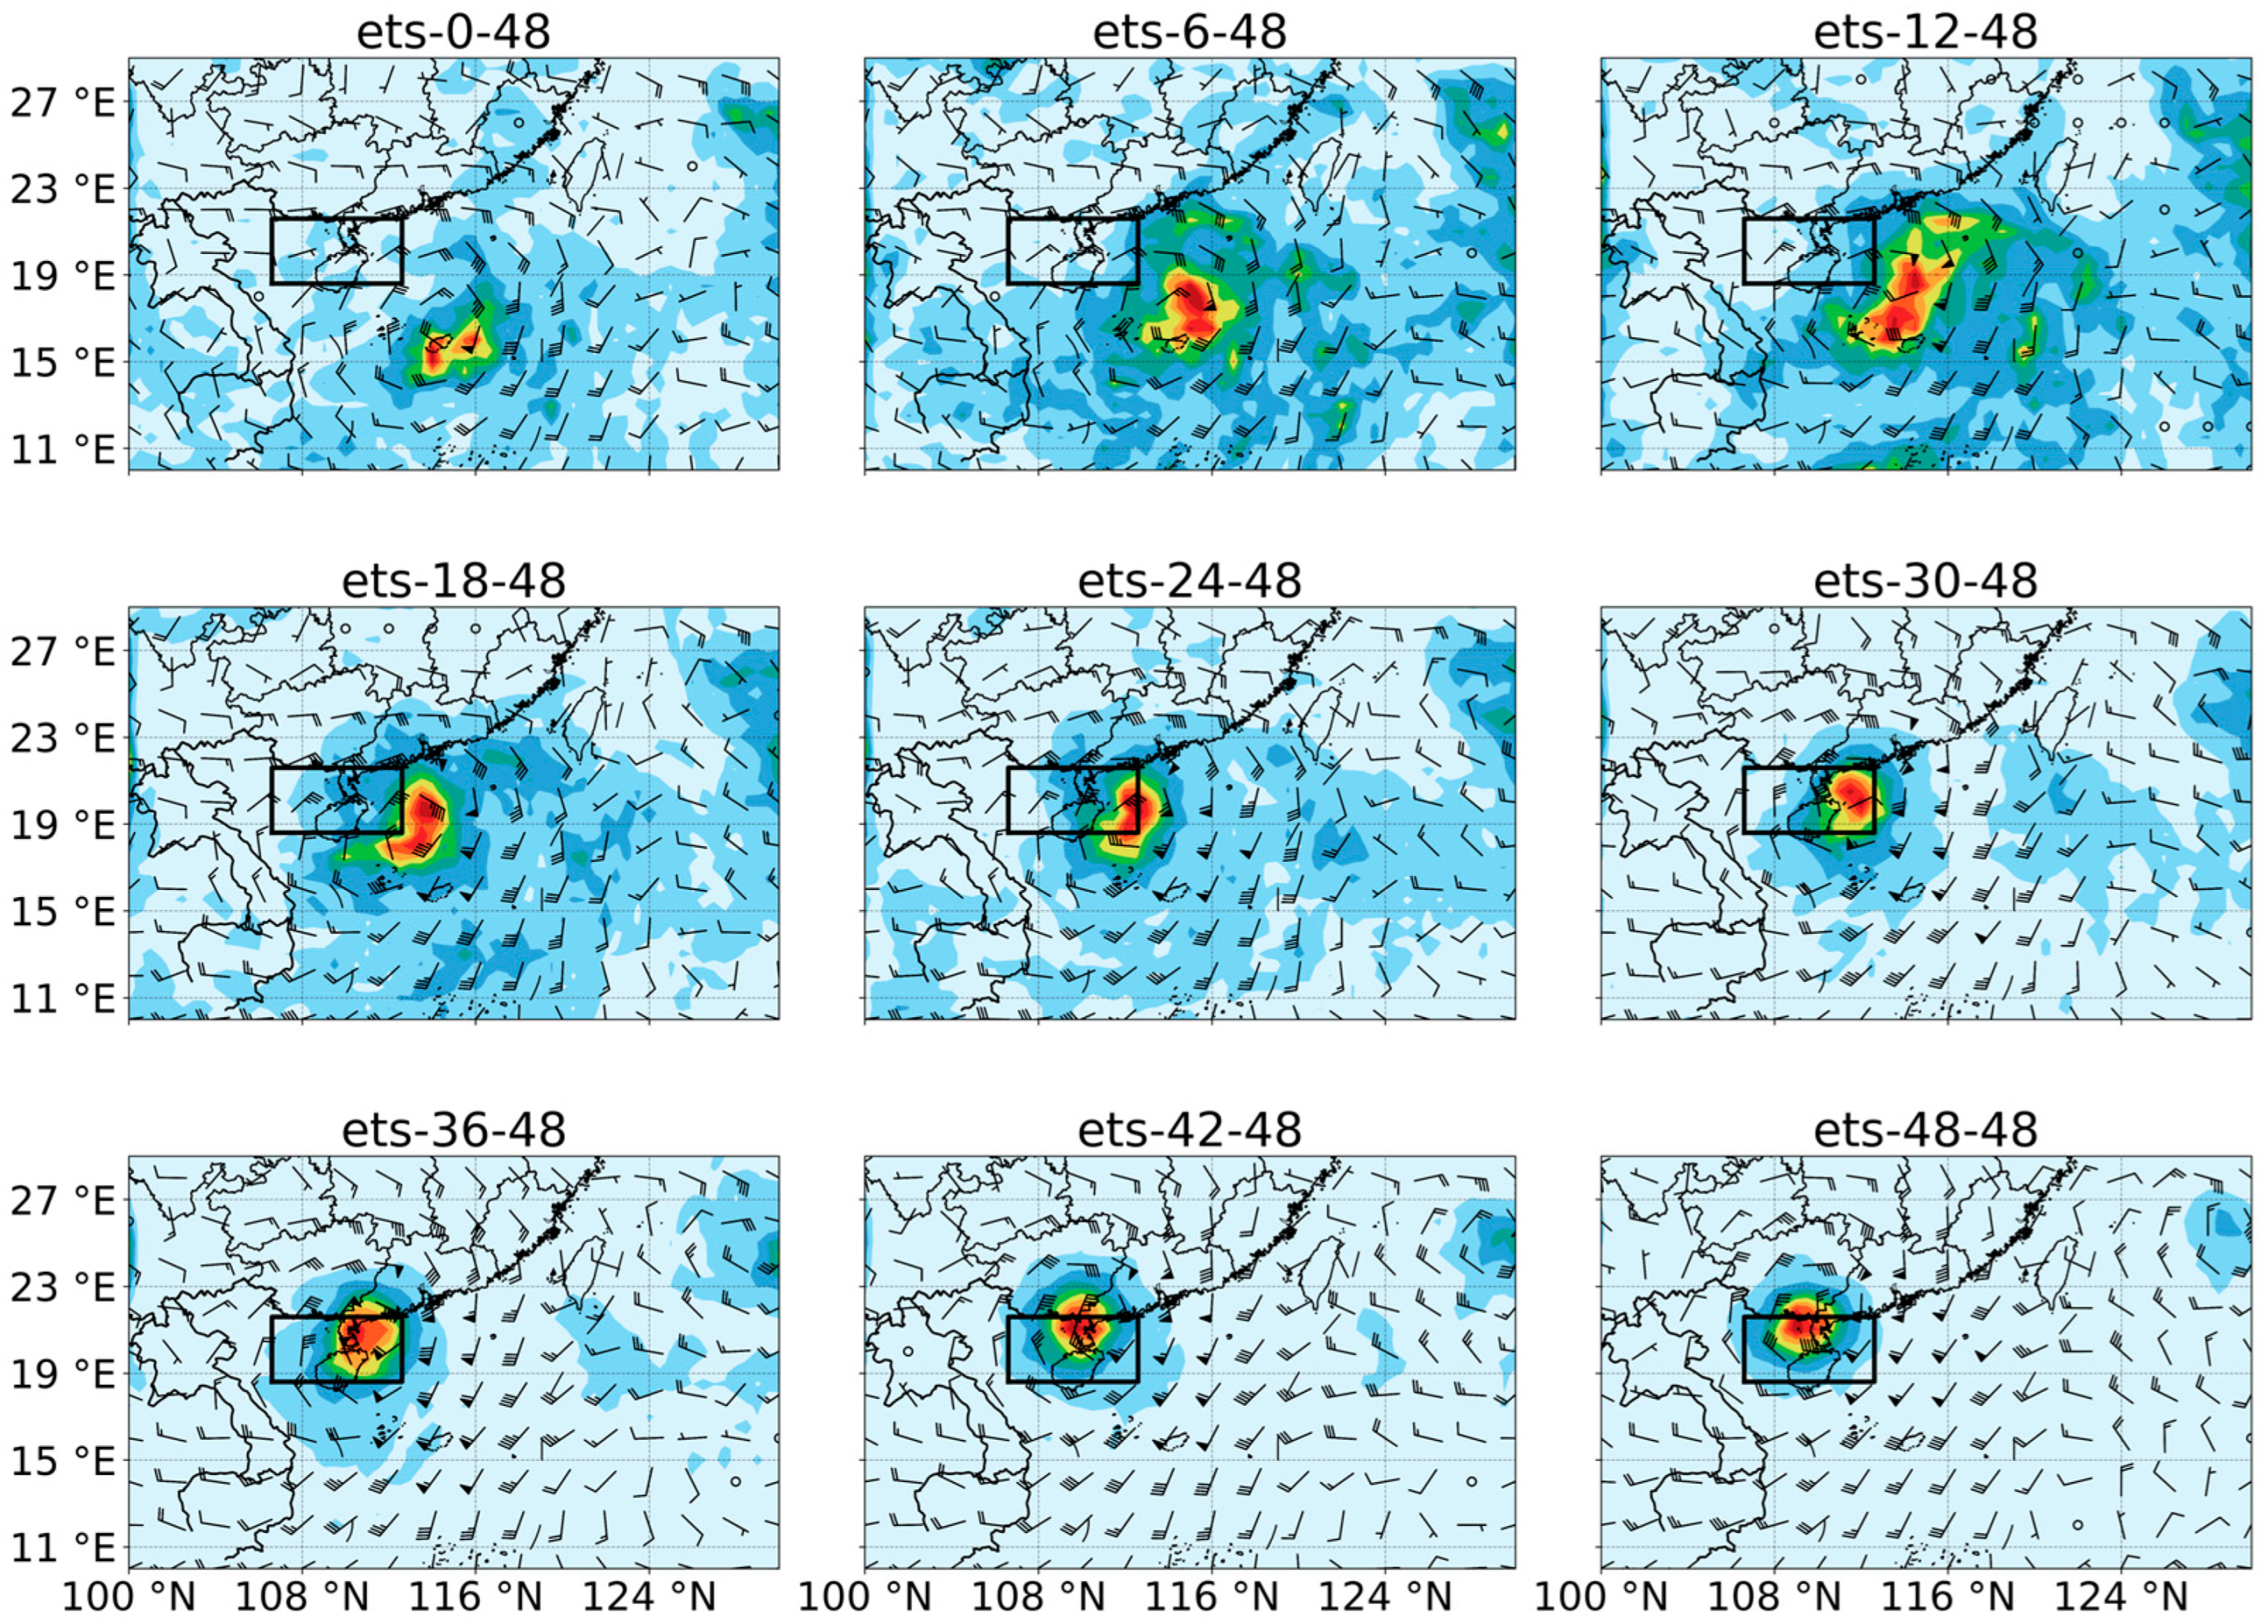
4.1. Description of Typhoon “Chaba” and Its Observation Sensitivity Area

4.1.1. Observation Sensitive Region of Typhoon “Chaba”

For the regions severely affected by Typhoon “Chaba”, the target validation area for adaptive observation is located in Hainan and the western part of Guangdong Province, China (Figure 3, black box). The moment of 2022070212 (UTC) is set as the validation moment, and the shading indicates the sensitivity of the different regions. According to Figure 3, points with sensitivity values higher than 0.5 mostly converge near the center of the typhoon, and a small amount is distributed near the sub-height. The observed sensitive areas located to the southeast of the typhoon center slowly converge to the typhoon center, and the points with sensitivity values higher than 0.5 show a trend of further convergence as time passes. At the same time, the sensitive region on the east side of the Chinese island of Taiwan also tends to concentrate, forming a small value center. By the target analysis moment of 2022070112 (UTC), the points with sensitivity values higher than 0.5 basically converge as a whole and are located at the center of the typhoon and its southwest side, whose range covers the oceanic surface adjacent to the right side of Hainan Island, China. At moments 2022070118 (UTC), 2022070200 (UTC), 2022070206 (UTC), and 2022070212 (UTC), the changes in the observed sensitive regions tend to slow down, and the points with sensitivity values larger than 0.5 are saturated with shrinkage, gradually moving toward the center of the typhoon and within the verification region indicated by the black solid box. In the area formed by points with sensitivity values higher than 0.5, adaptive observation data will have a strong impact on the development and evolution of weather systems in the validation area after data assimilation, and these formed regions are also known as the adaptive observation sensitivity area. When the target analysis moment coincides with the validation moment, the observation sensitive area should be concentrated within the validation areas. As can be seen in Figure 3, the distribution of sensitive areas is more dispersed at earlier moments from the validation moment. As the target analysis moment moves closer to the verification moment, the range of the sensitive area gradually shrinks and eventually falls in the verification area. In this study, the moment of 2022070212 (UTC) coincides with the validation moment, and the sensitive area is basically located in the validation area, which coincides with the propagation law of the forecast error during the development and evolution of the weather system.

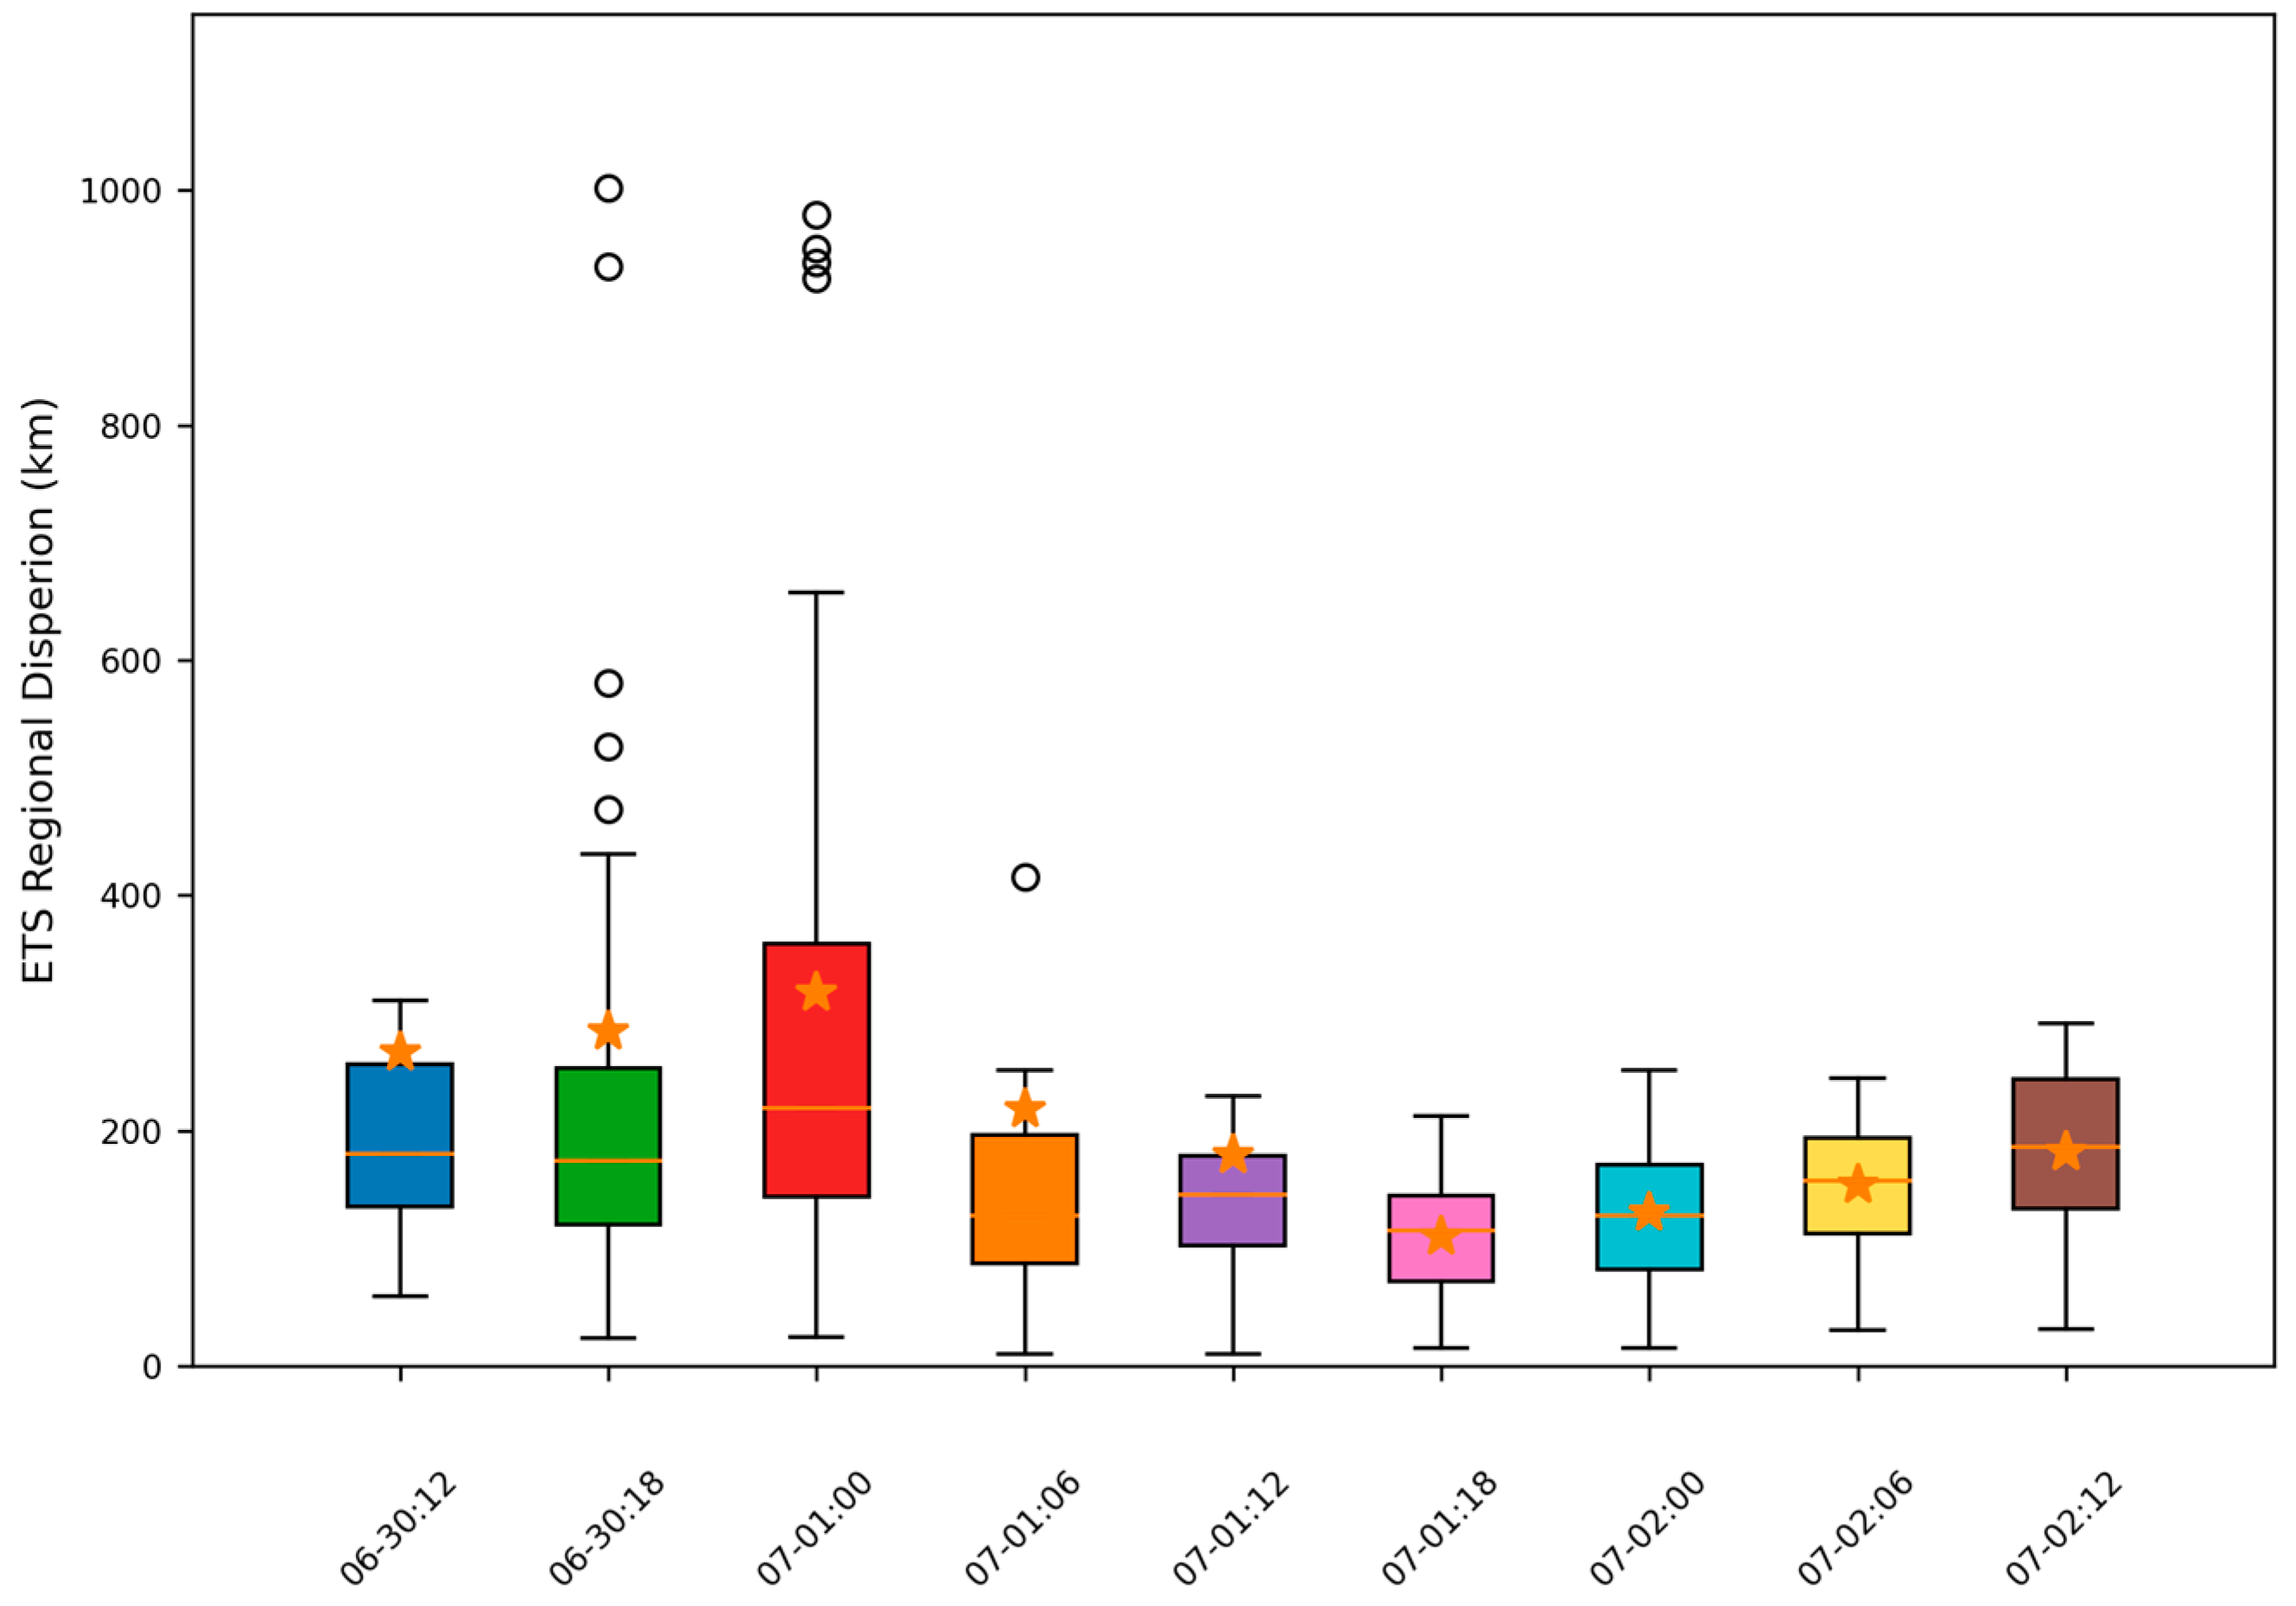
4.1.2. Distributional Characteristics of Typhoon “Chaba’s” Sensitive Regions

According to Figure 4, as the intensity of Typhoon “Chaba” increased over time, the areas with sensitivity values greater than 0.5 showed a general trend from dispersed to concentrated, with a weak tendency to disperse at the end of the typhoon’s development. In the initial stage of its development from 2022063012 (UTC) to 2022070106 (UTC), due to the fact that Typhoon “Chaba” was not yet fully formed, there were more anomalies, and the points with sensitivity values greater than 0.5 were more dispersed. During this period, the mean value of the distance from these points to the typhoon center was above 200 km, and all of them were larger than the median of the distances at each moment, indicating that the points with sensitivity greater than 0.5 at each moment during this period were farther away from the typhoon center. As the typhoon continued to develop, the dispersion of sensitive areas reached a minimum at the moment of 2022070118 (UTC), where points with a sensitivity value greater than 0.5 were more concentrated, with an average distance of about 100 km. Later, as the typhoon evolved, there was a weak tendency for points with sensitivity values greater than 0.5 to disperse. For high-impact weather events (e.g., typhoons), the location of typhoon-sensitive areas is closely related to the current typhoon location [39]. The location of a typhoon is constantly changing during its development, which leads to changes in the distribution of observation sensitive areas for the typhoon.

4.2. The Results of the Four Sets of Experiments

4.2.1. The Number of Data Assimilated into the Data Assimilation System for Typhoon “Chaba”

In this paper, based on the GSI-3.7 system, we performed a statistical analysis of the data entering the assimilation system. For the assimilation experiments, the results from the WRF4.2 model based on the GFS data were used as the background field, while the ERA5 data were used to simulate the synthetic sounding data. According to the location of sensitive areas, the three groups of experiments used different areas as well as U and V variables for data assimilation. The number of data entering the assimilation system in the ALL experiment was 215,622, and the number of SEN and RAN experiments was 7854. It is evident that the number of ALL experiments entering the assimilation system was much larger than the number of SEN and RAN experiments.

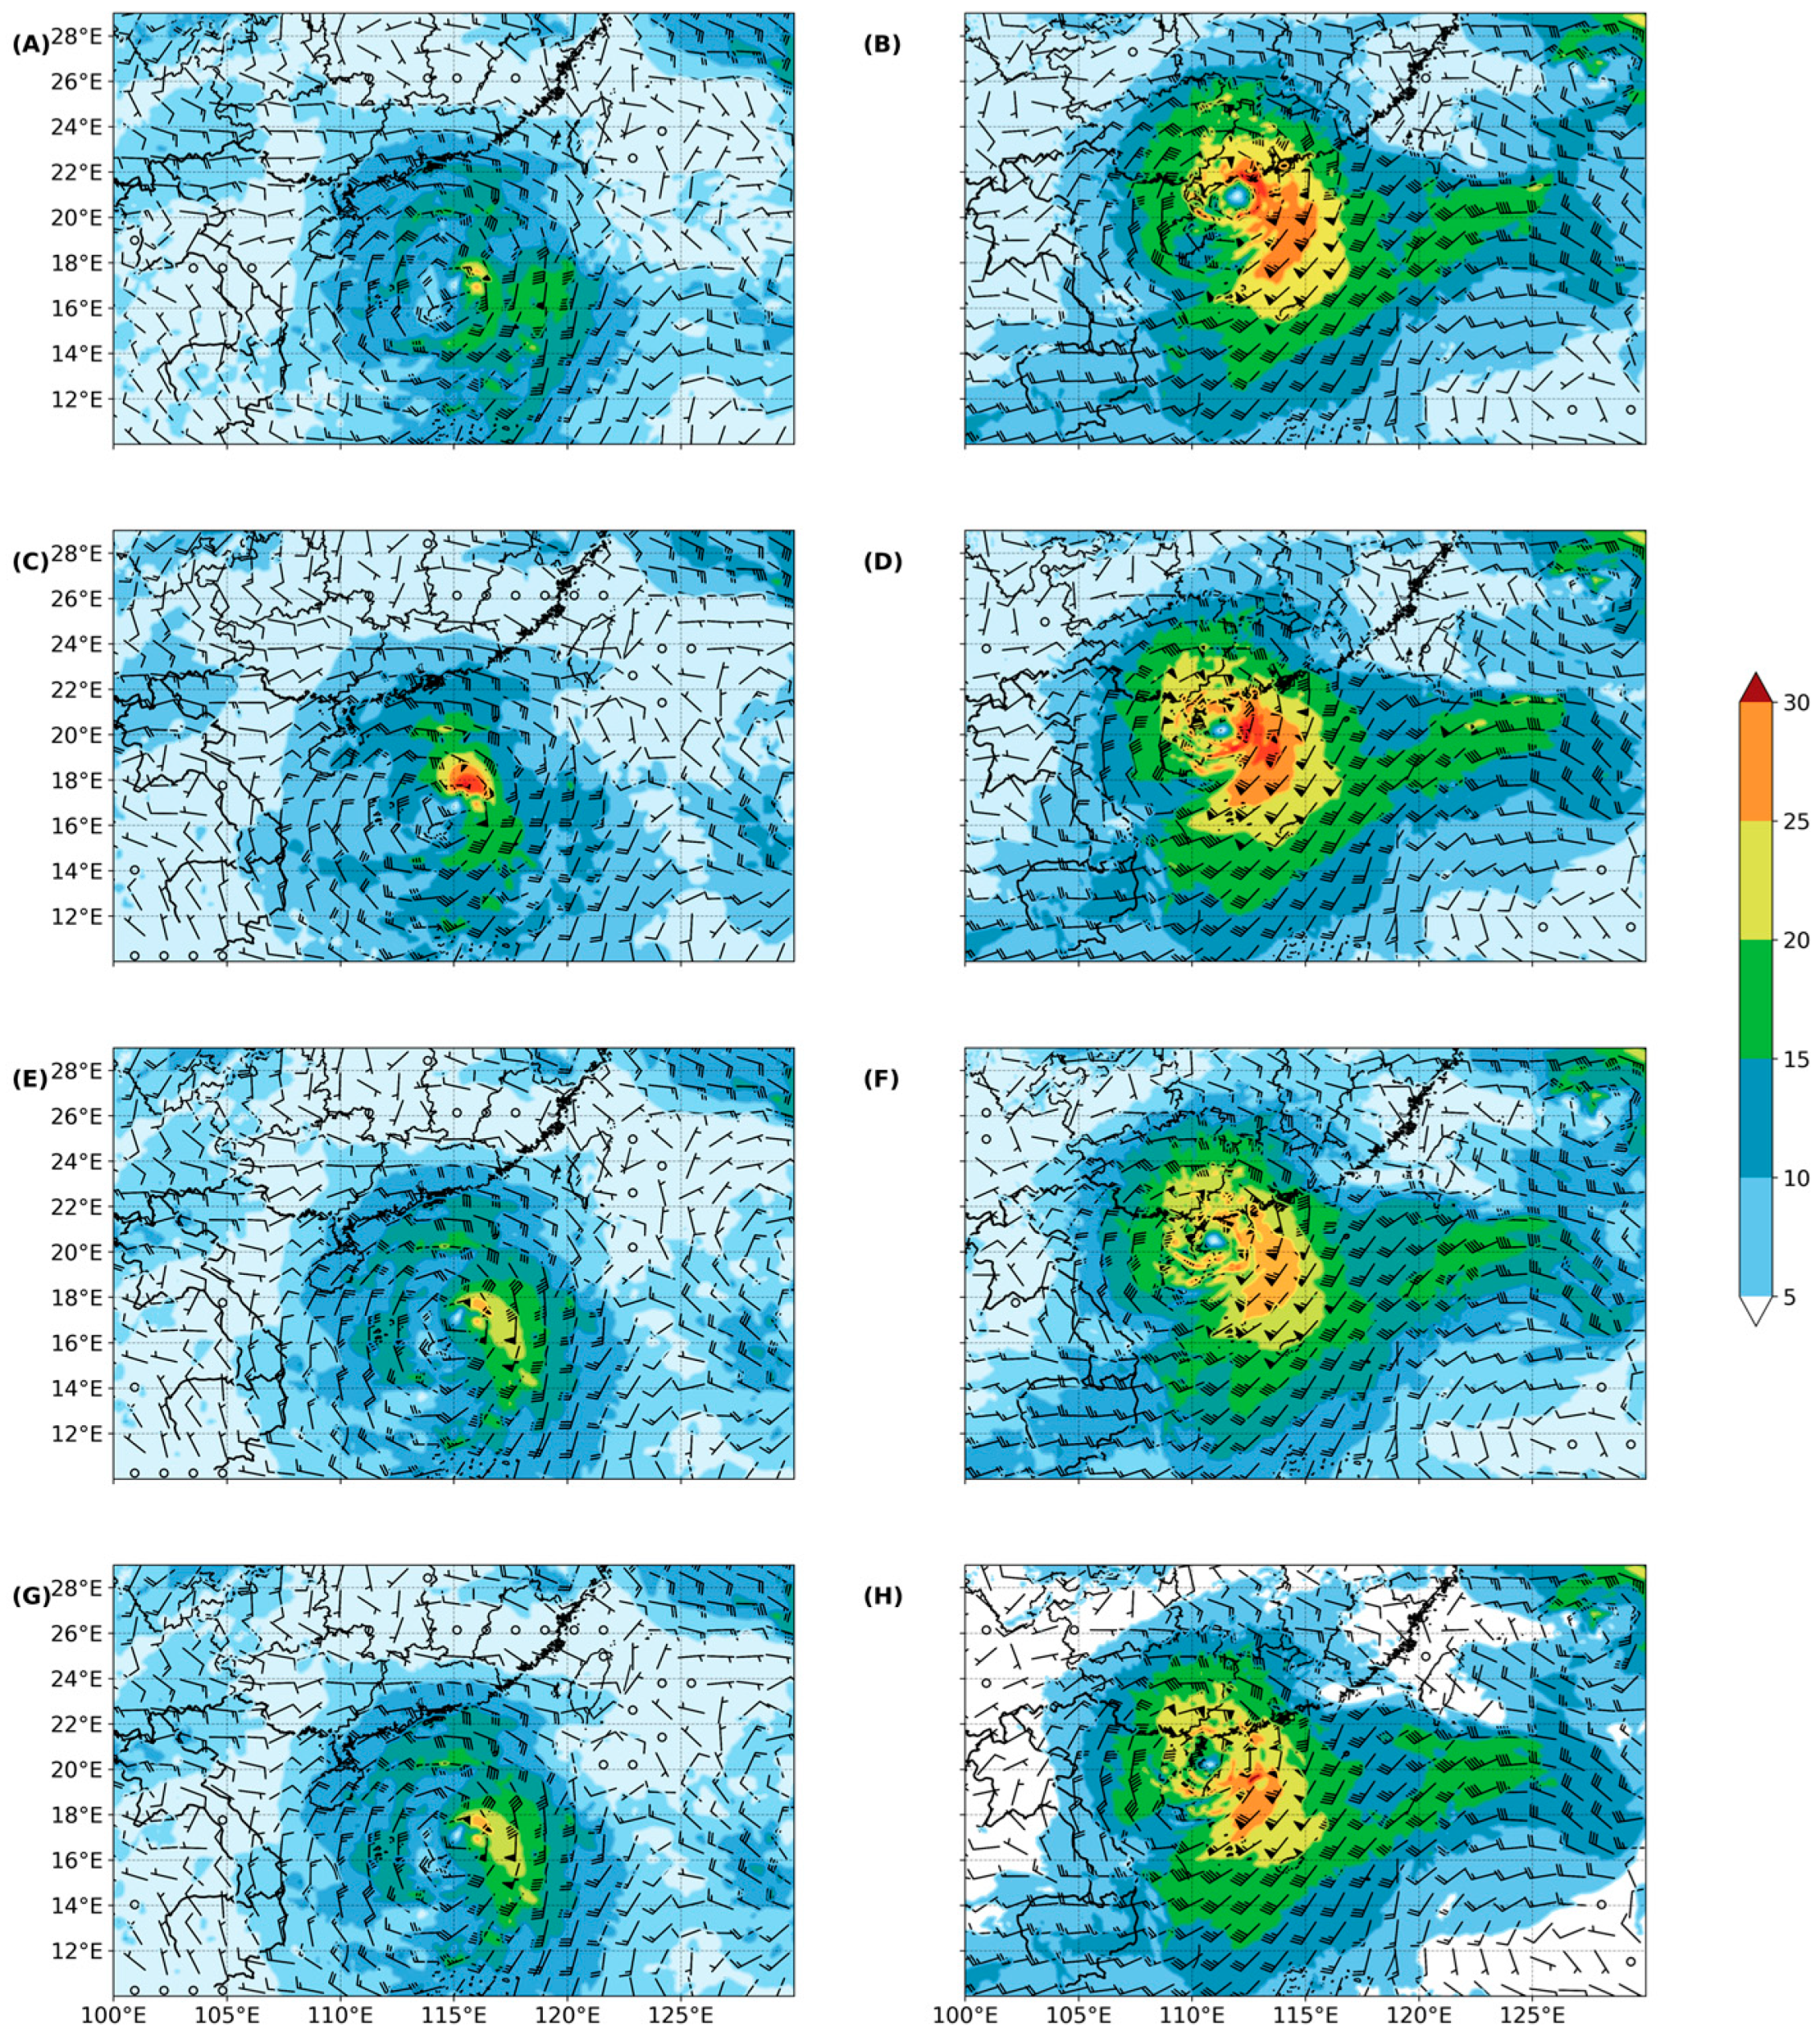
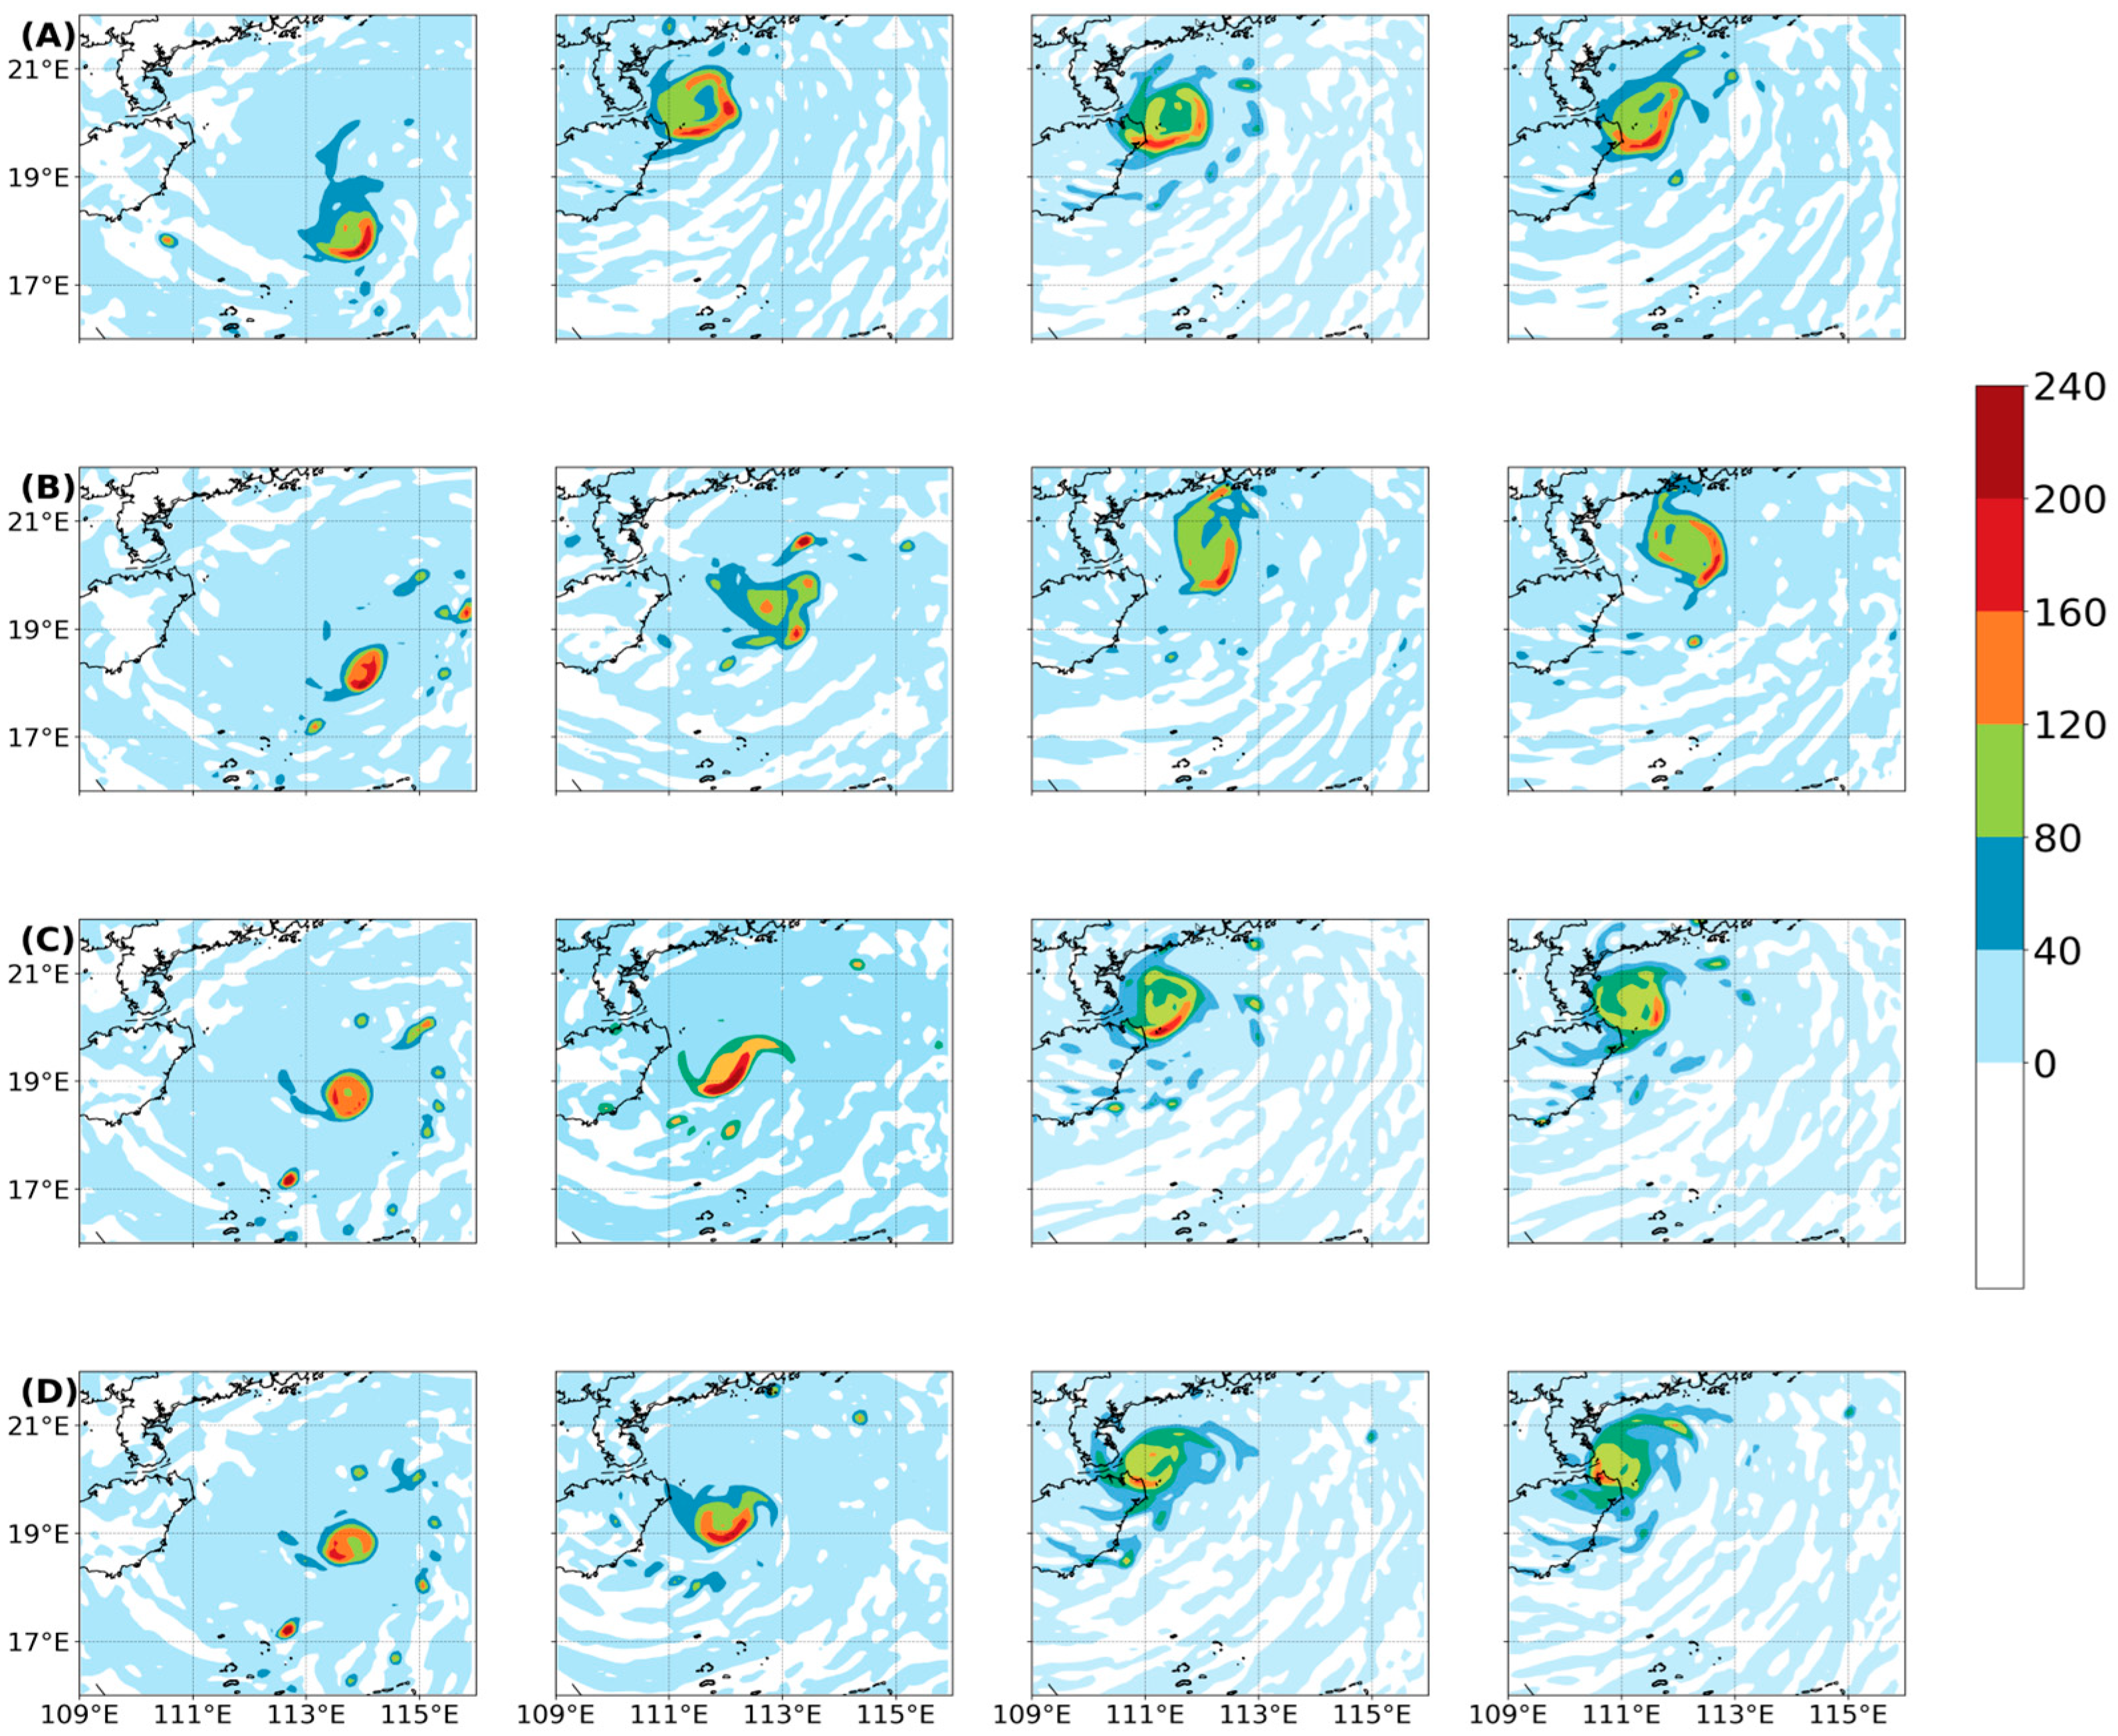
4.2.2. Wind Field Simulation Results of Different Experiments

Figure 5 shows the simulation results of 500 hPa wind field for the four experiments at the initial moment and the strongest moment. At the initial moment of 2022063012 (UTC), the ALL, RAN, and CTRL experiments simulated generally similar results, while the SEN experiment simulated stronger wind field results than the other three experiments. The vortex structure of the typhoon was evident in the initial moment of each experiment, and as the typhoon moved, the vortex intensified. At the strongest moment of 2022070200 (UTC), the simulation results of the four tests showed a better typhoon vortex circulation structure, and the simulated wind speed results were strengthened, but the SEN and ALL experiments were able to recognize a clearer typhoon eye and were stronger than the CTRL and RAN experiments. In addition, the SEN test simulated a more complete and tightly packed typhoon spiral structure than the ALL test, and the center of the maximum wind speed occurred near the eye of the typhoon, while the center of the maximum wind speed in the RAN and CTRL tests was farther away from the eye of the typhoon. Therefore, the SEN test and the ALL test were more compatible with the typhoon center at both the initial and strongest moments. In general, the simulated typhoon circulation structures and maximum wind speeds in the SEN and ALL tests were better than those in the RAN and ALL tests in these two periods, thus providing favorable conditions for the improvement of typhoon forecasts by the SEN and ALL tests.

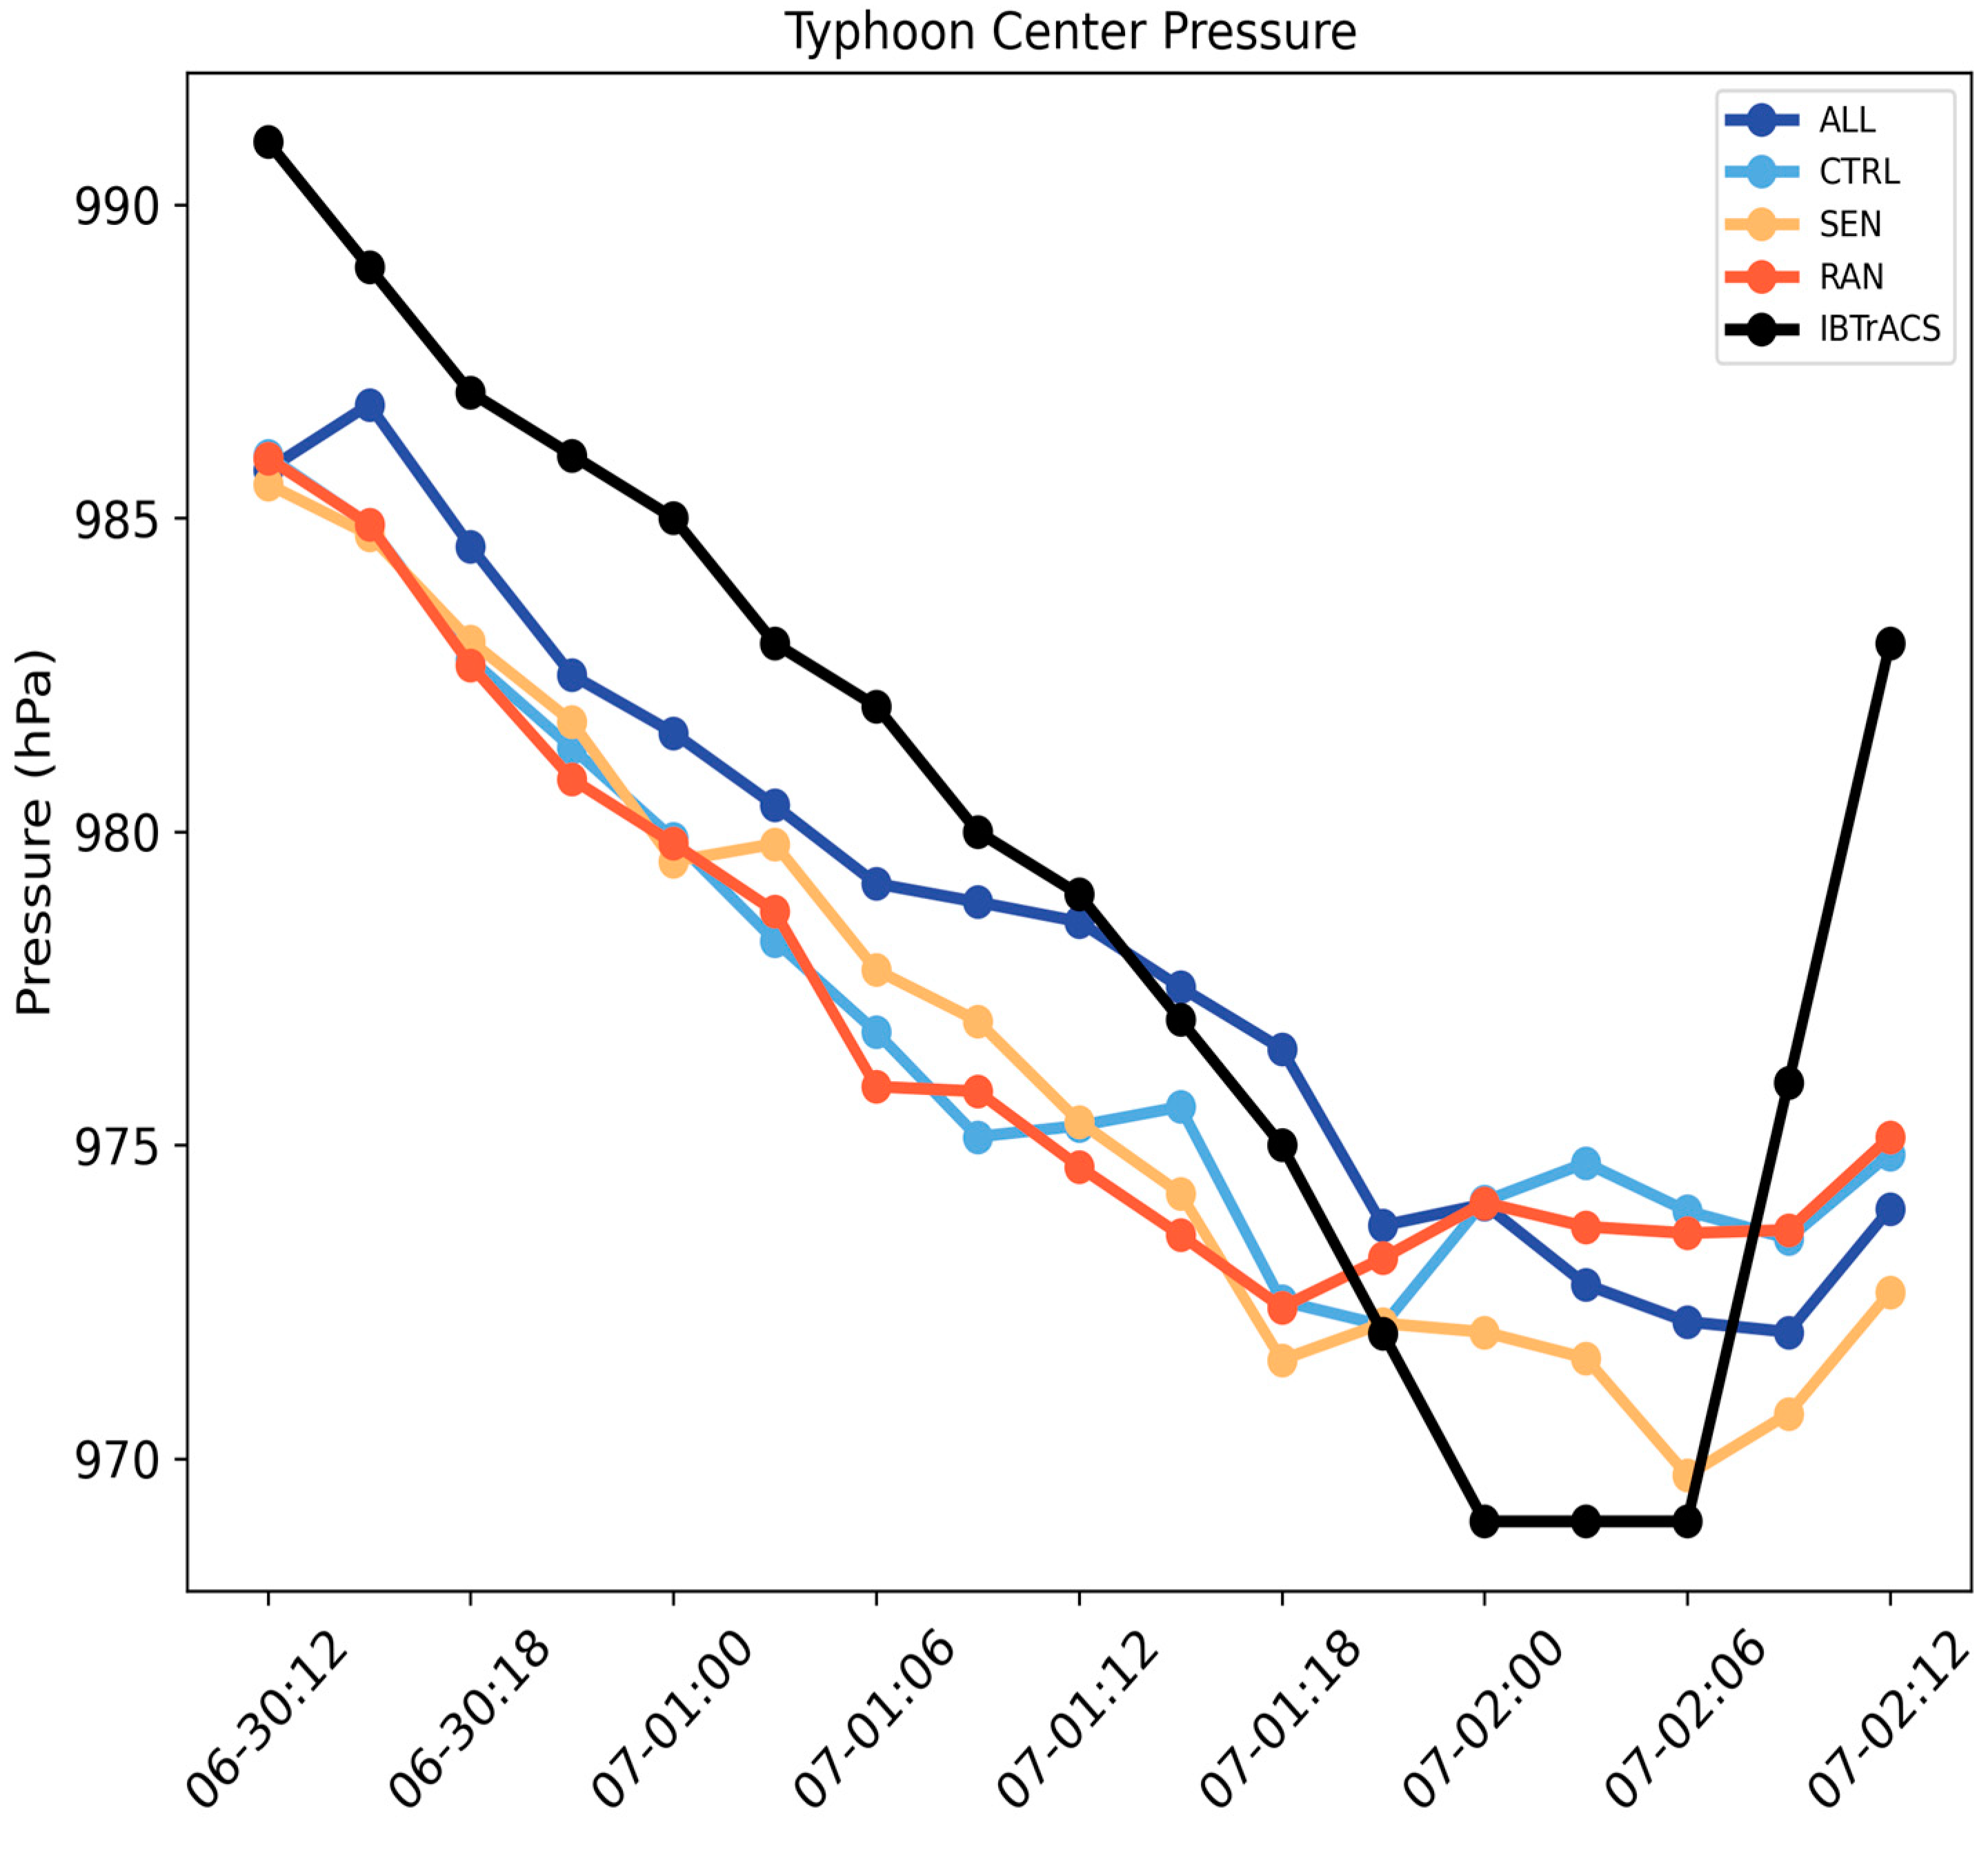
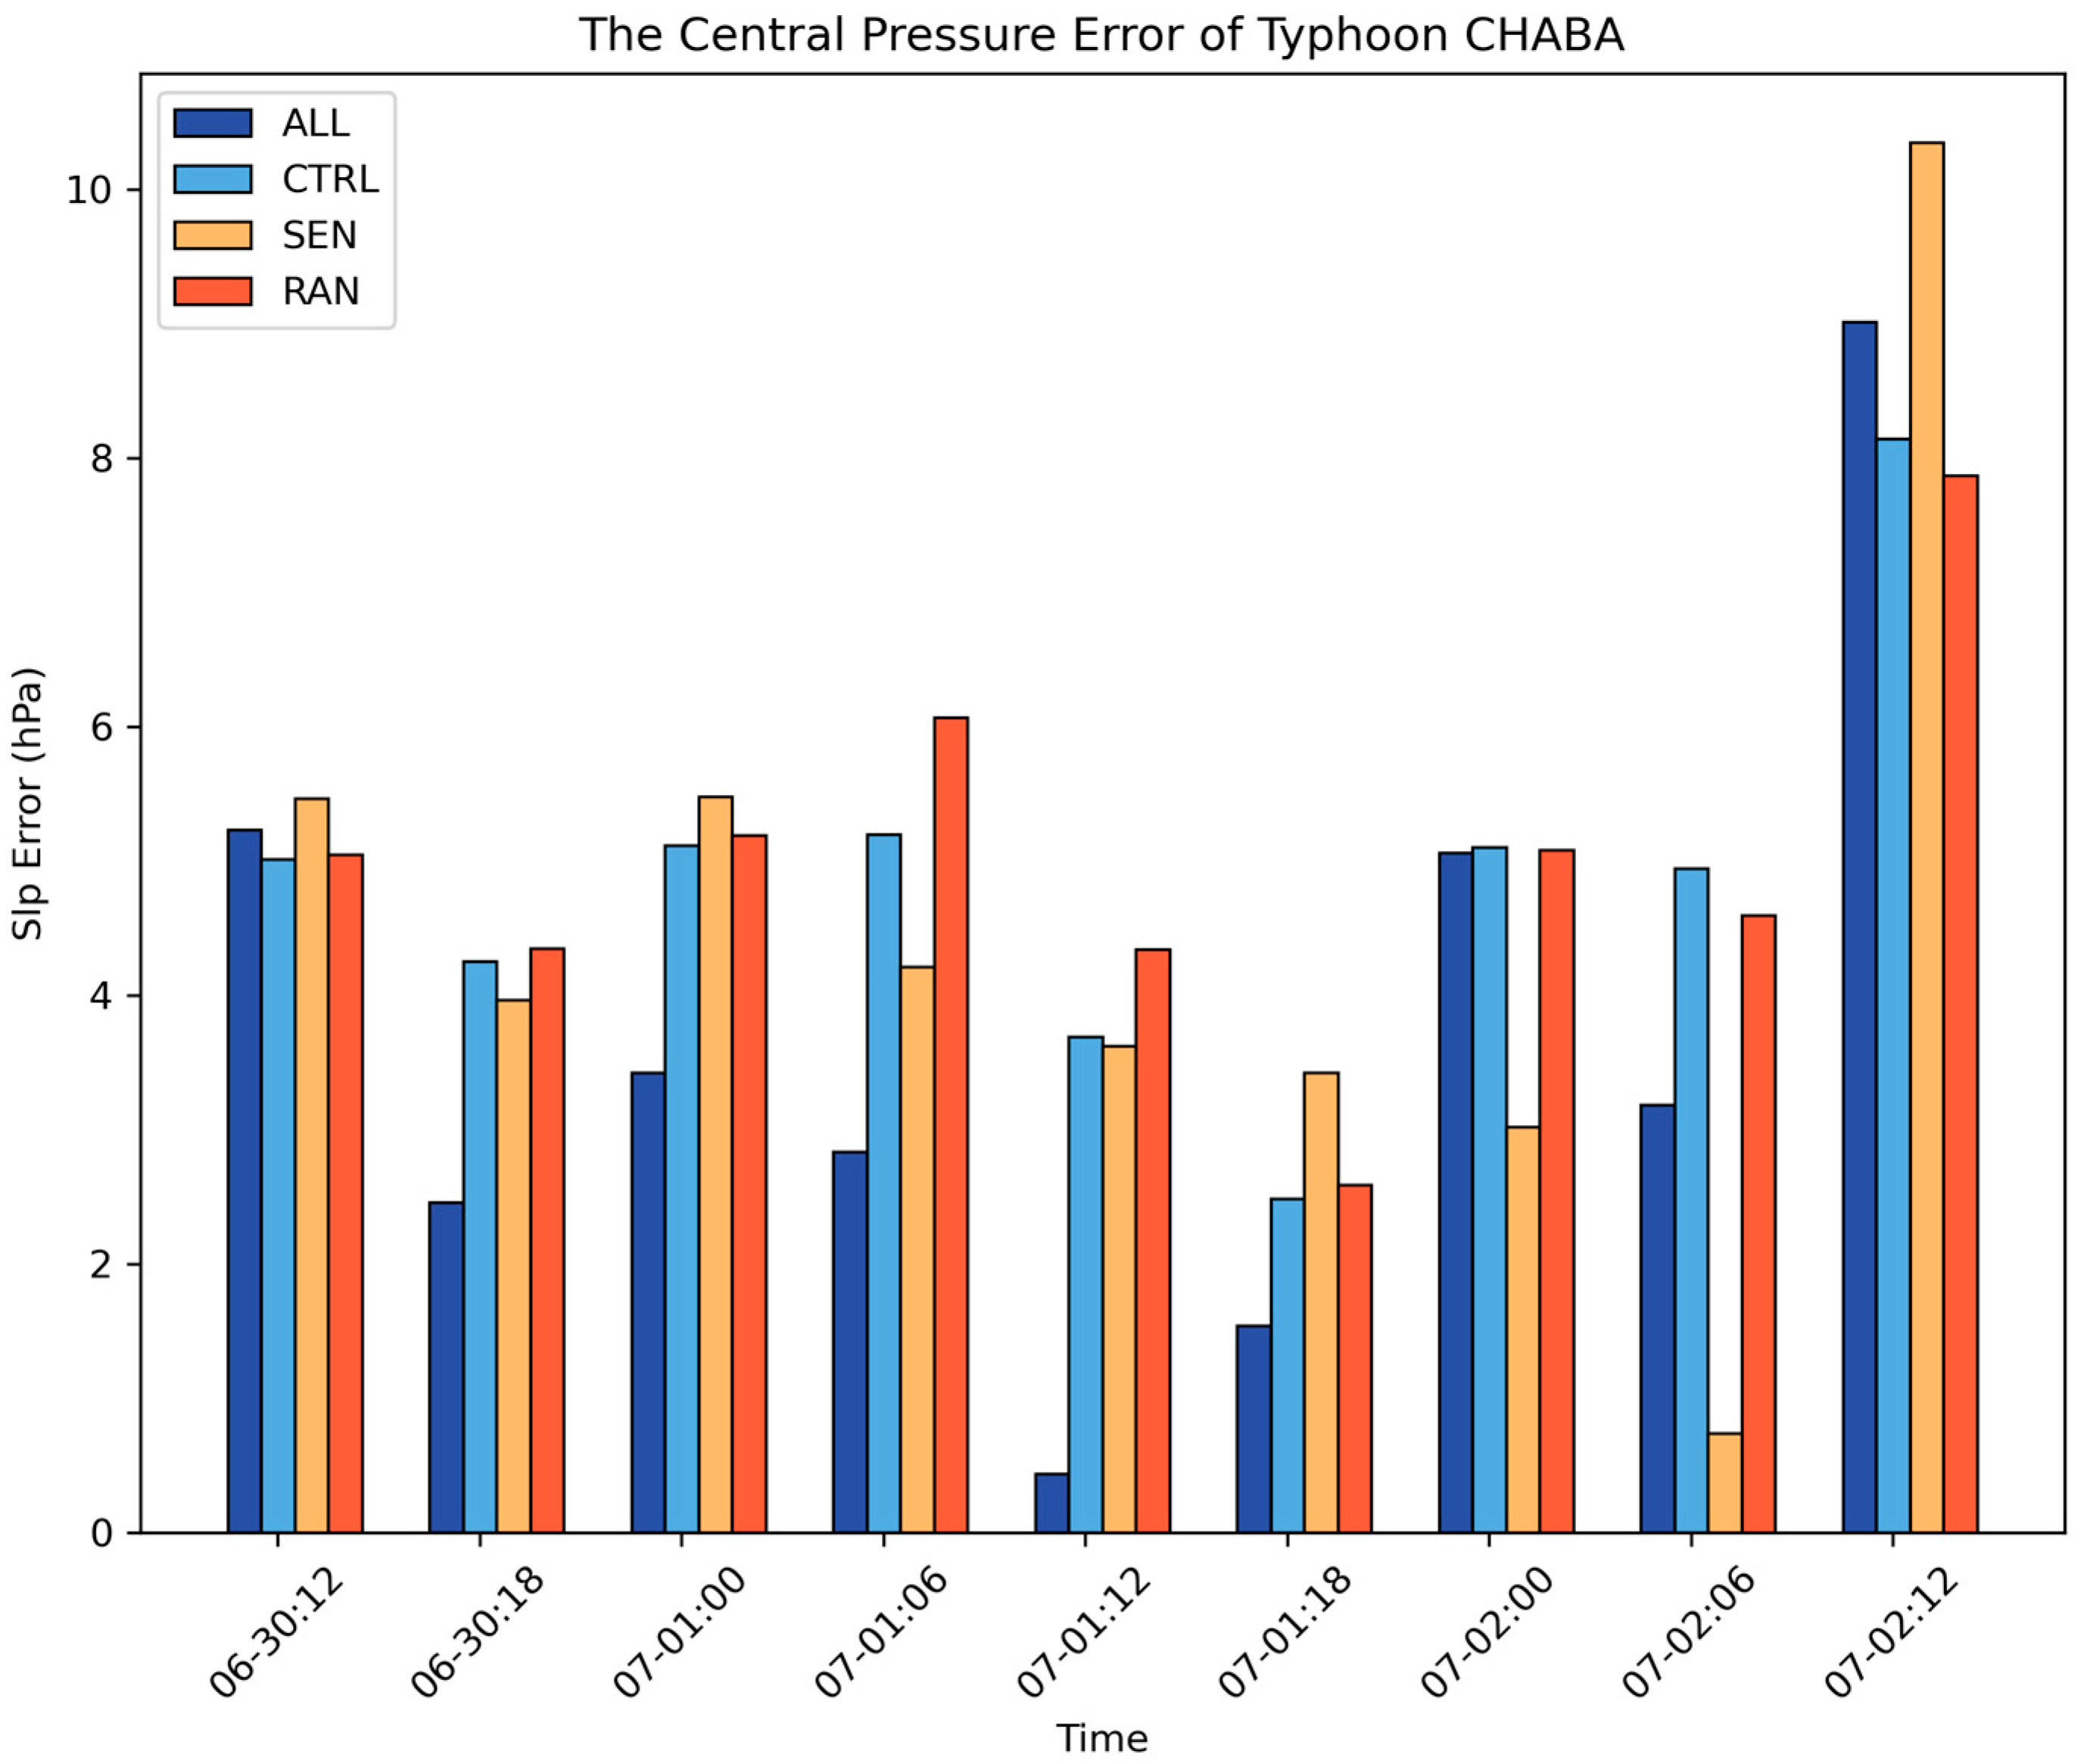
4.2.3. Typhoon Intensity Results for Different Experiments

Figure 6 shows the line plots of the simulated typhoon center air pressure for the four sets of tests and the typhoon center pressure results from IBTrACS over time. It can be seen that Typhoon “Chaba” intensified rapidly during the period 2022070100–2022070206. The simulation results of RAN and CTRL are comparable before the moment of 2022070118 (UTC) and show a gradually decreasing trend, which is consistent with the trend of the IBTrACS results but smaller than that of the IBTrACS results. After that moment, the pressure at the center of the typhoon starts to increase and then level off, albeit with a large deviation from the IBTrACS observations. The central air pressure deviation in the CTRL test and RAN test is as high as 8.14 hPa and 7.87 hPa, respectively; therefore, the forecast effect of these two sets of tests is worse. However, before the moment of 2022070118 (UTC), the changes in typhoon center pressure predicted by the SEN test and the ALL test are closer to the IBTrACS results than to those of the CTRL test and the RAN test, and they are consistent with the tendency of the typhoon center pressure of the IBTrACS typhoon to decrease first, then flatten out, and finally grow. However, after that moment, the simulated central pressure of the typhoon in the SEN experiment is closer to the IBTrACS result, and the deviation is as low as 0.73 hPa around the moment of 2022070206 (UTC) (Figure 7), which is significantly better than the other experiments. The ALL test selected 27 times more data for assimilation than the SEN test, but the SEN test was closest to the ALL test simulation during the enhancement phase and outperformed the ALL test in the late stage of rapid intensification. Overall, during the rapid intensification phase of the typhoon, the simulated typhoon center pressure results from the SEN and ALL experiments were better than those from the CTRL and RAN experiments. In addition, the simulation results of the typhoon center pressure in the ALL test in the early stage of rapid intensification were comparable to the simulation results in the SEN test, but in the late stage of rapid intensification, the results in the SEN test were superior to those in the ALL test.

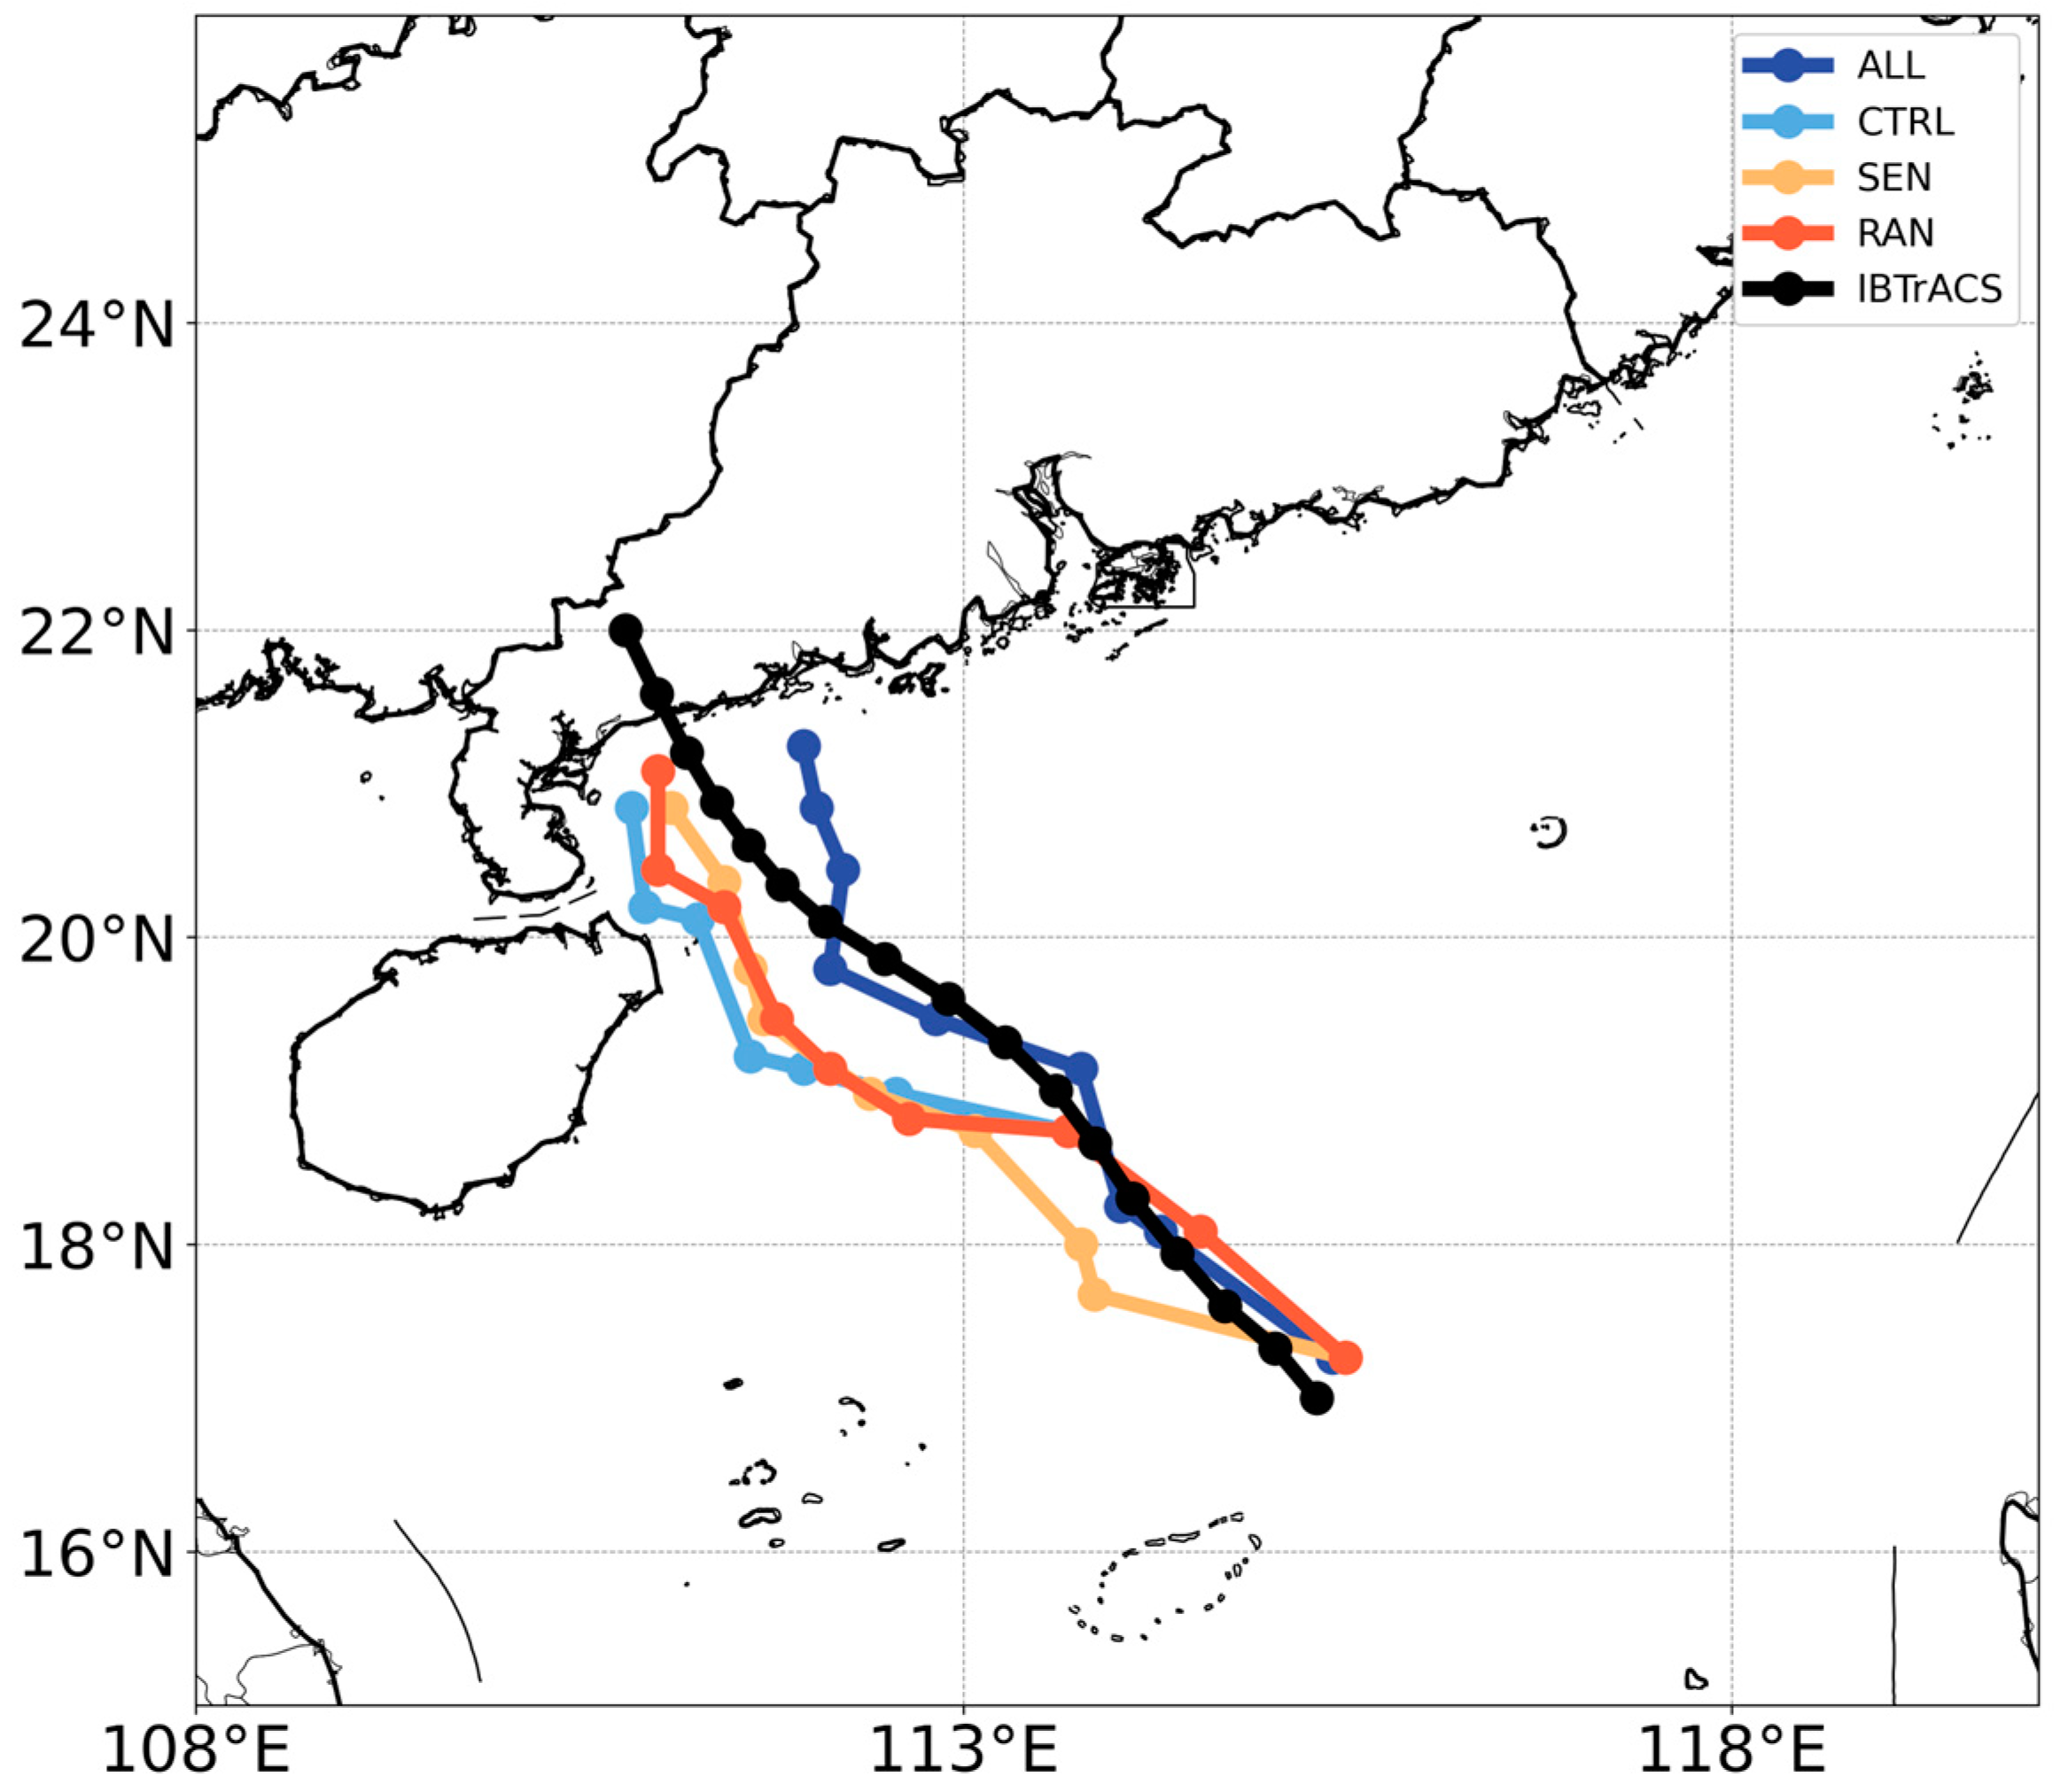
4.2.4. Typhoon Tracks Results Simulated in Four Sets of Experiments

Figure 8 shows the distribution results of the paths from the four experiments, while Figure 9 shows the distance deviation of each experiment from the IBTrACS observations at different moments. The results show that during the stage of rapid intensification of Typhoon “Chaba”, the quality of the track prediction results in the CTRL experiment is obviously poor, with a maximum deviation of more than 100 km. The simulated results of the experiment are significantly westward in relation to the track observation results from IBTrACS, and they are not able to forecast the development trend of the typhoon effectively. At the same time, as the typhoon develops, the distance error fluctuates and increases, finally leading to a large deviation in the simulated typhoon landfall location. Relatively, the remaining three sets of experiments with assimilation observations reduce the deviation of the paths to different degrees, and the quality of the forecast results is improved to some extent. Among the four experiments, only the path simulated in the ALL experiment is eastward relative to the observed path results from the IBTrACS database, while the path simulation results in the rest of the experiments are westward. The simulation results from the ALL experiment exhibit the smallest deviation before the time of 2022070200 (UTC), with a minimum deviation of only approximately 5 km (Figure 9), and the steering of the typhoon path is well simulated. Although a weakening of the strength of the subsequent typhoon caused its forecast track to deviate to the east, its forecast error grew significantly slower than that of the other experiments and captured the path of the typhoon more accurately. The SEN test obtained a better improvement than the ALL test during the rapid intensification phase of the typhoon, especially during the moments from 2022070100 (UTC) to 2022070112 (UTC). In contrast, the RAN experiment simulation results showed only a slight improvement at the end of the rapid intensification of the typhoon. Overall, the quality of the path and speed forecasts of the ALL test was more accurate, and the position was only slightly eastward compared with the actual situation. The remaining three experiments captured more accurately the westward character of the typhoon. Moreover, the SEN experiment simulation results were somewhat inferior to those from the ALL experiment but still significantly better than those from the CTRL and RAN experiments. All three data assimilation experiments achieved a certain degree of improvement in the path simulation. The SEN test was significantly better than the CTRL and RAN tests in the rapid intensification phase of the typhoon, and it accurately captured the westward shift in the path of Typhoon “Chaba” during its development compared to the ALL test.

4.3. Discussion of the Results of Data Assimilation for the Four Sets of Experiments

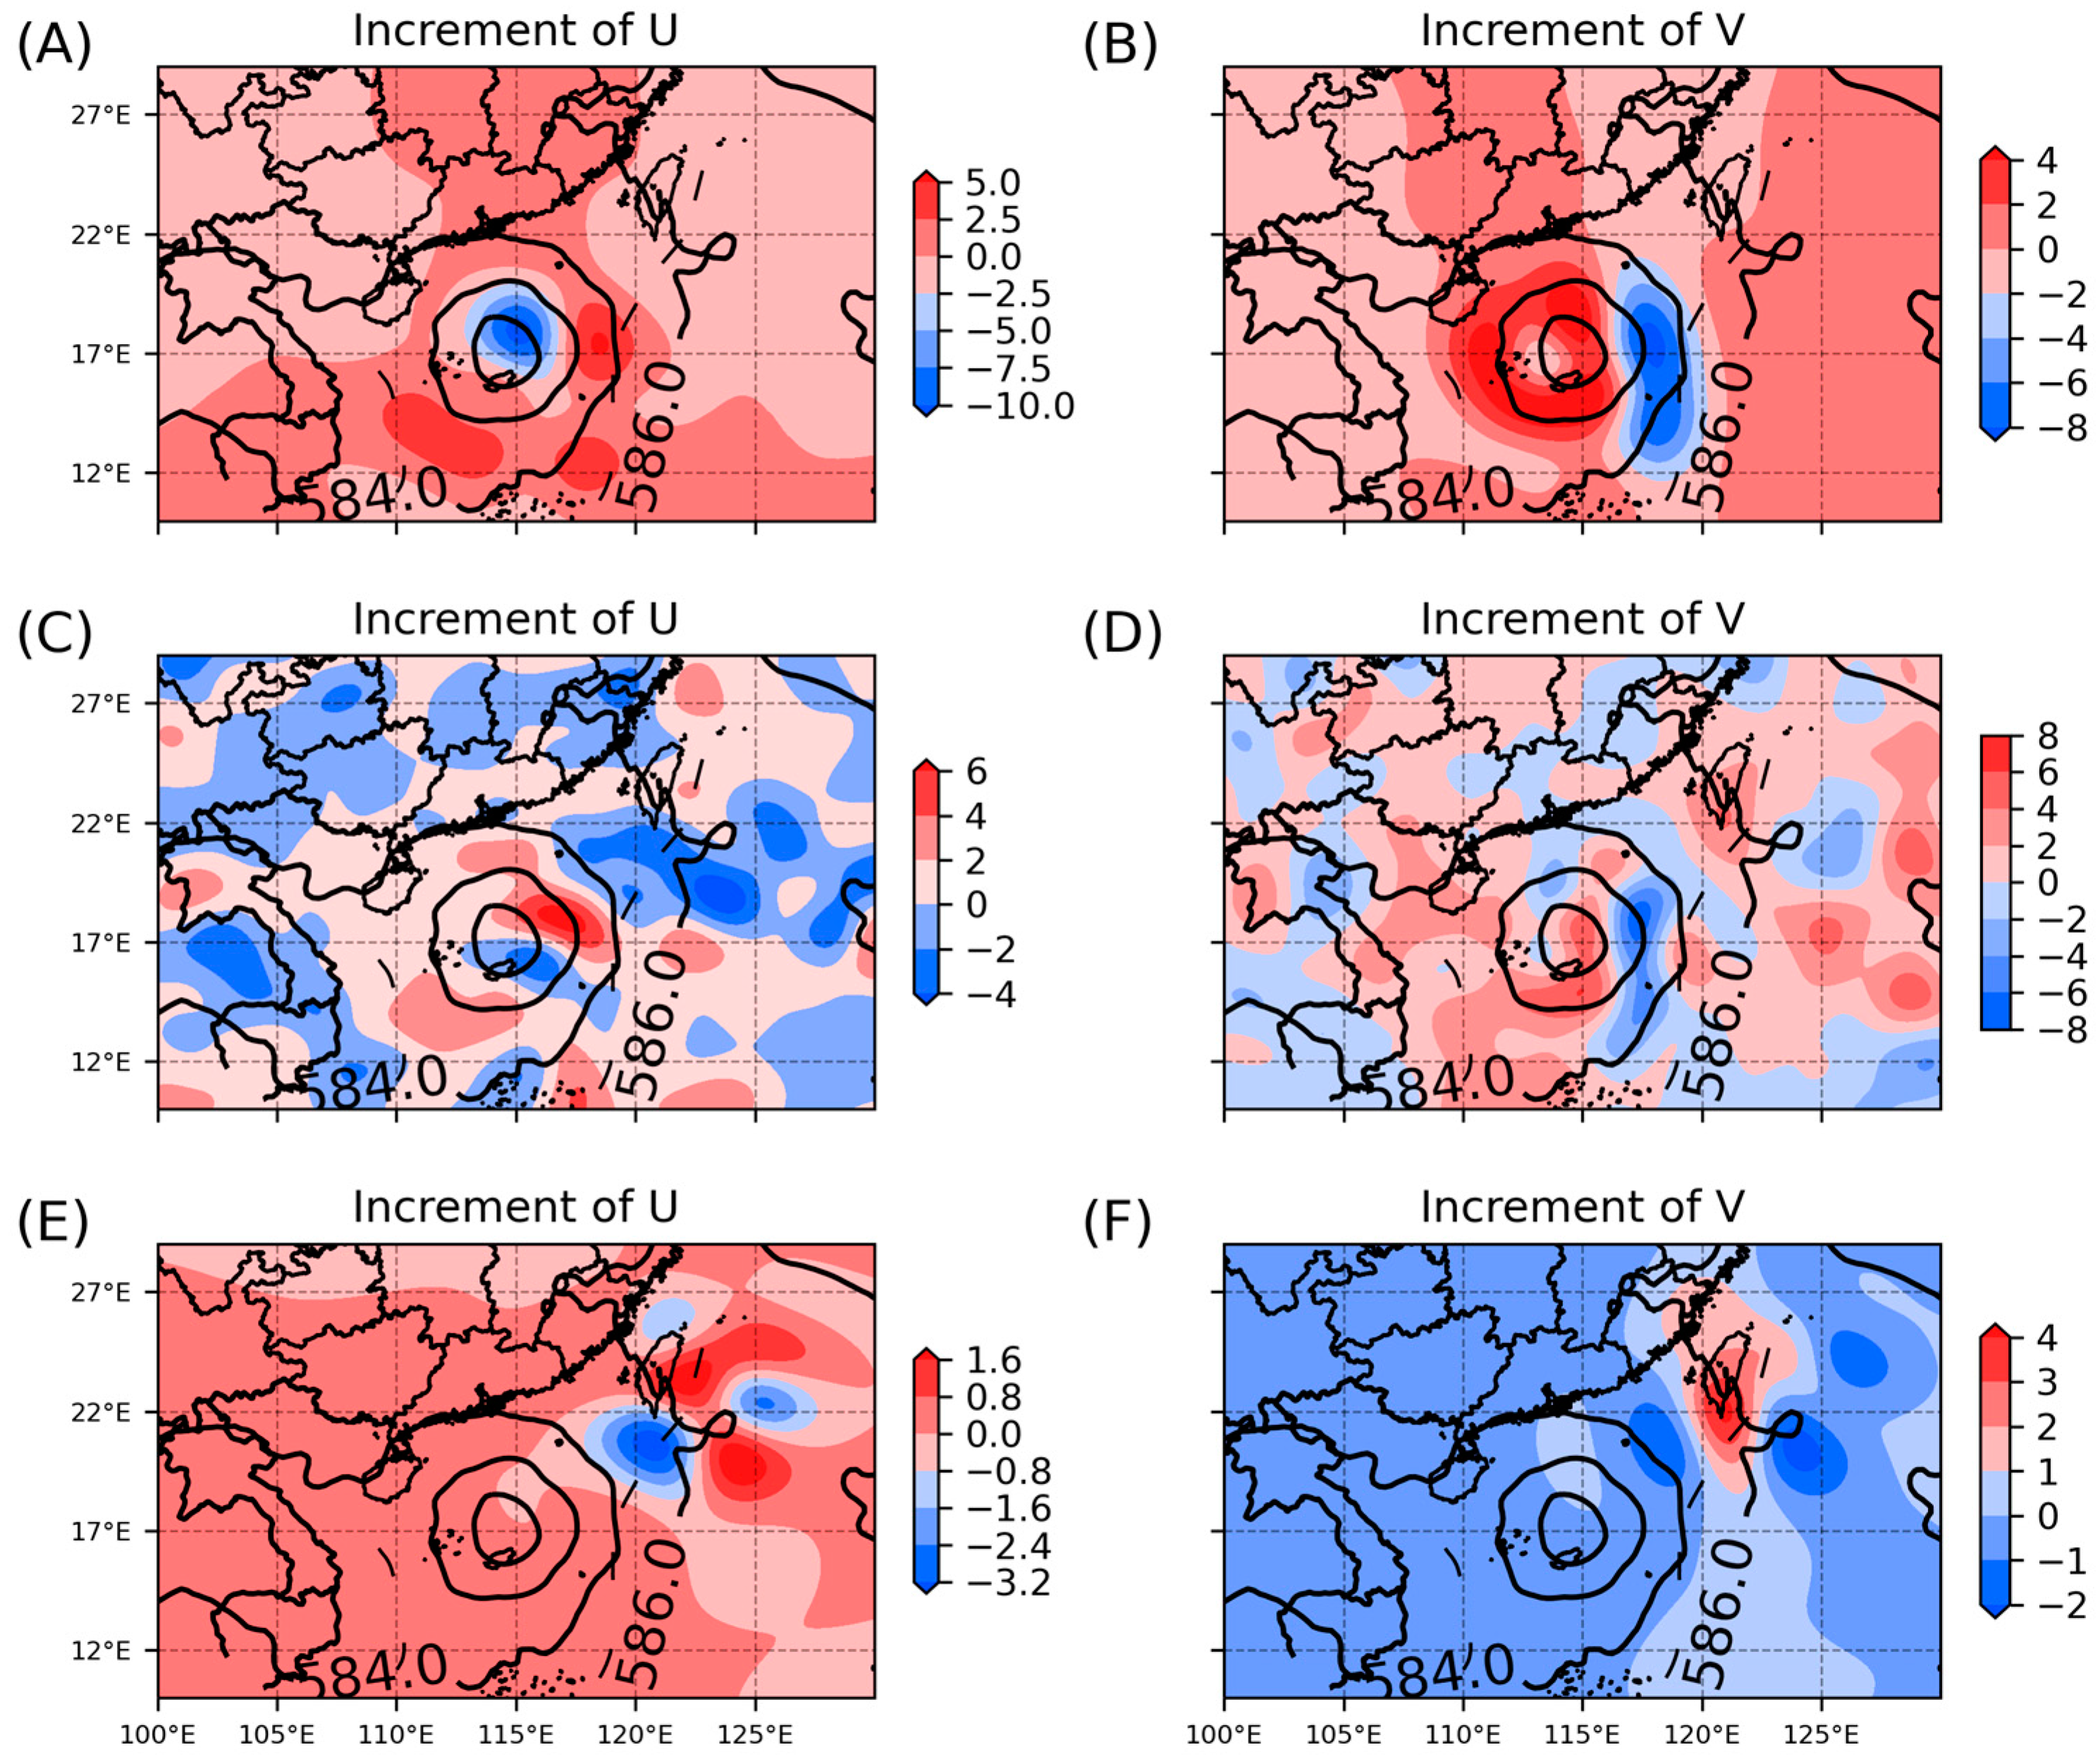
4.3.1. Analysis of the Assimilation Increments from Different Experiments

The initial field is one of the critical determinants of a good or bad forecast [38]. Therefore, this effect can be better illustrated by comparing the assimilation analysis increments before and after the initial field is assimilated; therefore, the assimilation analysis increments for the three experiments are discussed (Figure 10). The wind field assimilation analysis increments for the three tests show that compared with the ALL and RAN tests, the increments for the U and V wind fields around the typhoon vortex in the SEN test show a more marked strengthening of the cyclonicity of the typhoon. The increments for the SEN experiment have a larger positive center of zonal winds on the west side of the typhoon. In contrast, there is a major negative increment on the east side. For meridional winds, there are large positive increments to the south, as well as to the east, and a region of negative increments in the north. For the RAN experiment, in the field of meridional winds, the typhoon center is mainly located in the region of low positive increments, far from the region with high values of negative and positive increments. For zonal winds, they are mainly located in the region of low negative increments and are also far away from the region of high values of negative and positive increments; therefore, the structure of increment distribution in the RAN experiment is not favorable for the simulation of typhoon intensity. The centers of large positive and negative increments of zonal and meridional winds in the ALL test are located to the east and northeast of the typhoon center, and the distribution of positive and negative increments is more dispersed, which is not conducive to typhoon development. The SEN experiment accordingly adjusts the mesoscale eddy structure of the wind field in the background field to be more conducive to the strengthening of typhoon vorticity. The simulated results of the tests show that the SEN experiment is closer to the observation compared to the simulation results of the other three strength tests. Therefore, based on the above analysis, the assimilation of adaptive observation data in sensitive areas (SEN experiment) can effectively improve the simulation of the central intensity of “Chaba”. Through further reasonable adjustment of the vortex structure, the relatively weak typhoon intensity in the initial background field can be effectively and more reasonably strengthened, which can effectively improve the quality of the initial field of the model forecast and better simulate the development trend of the typhoon.

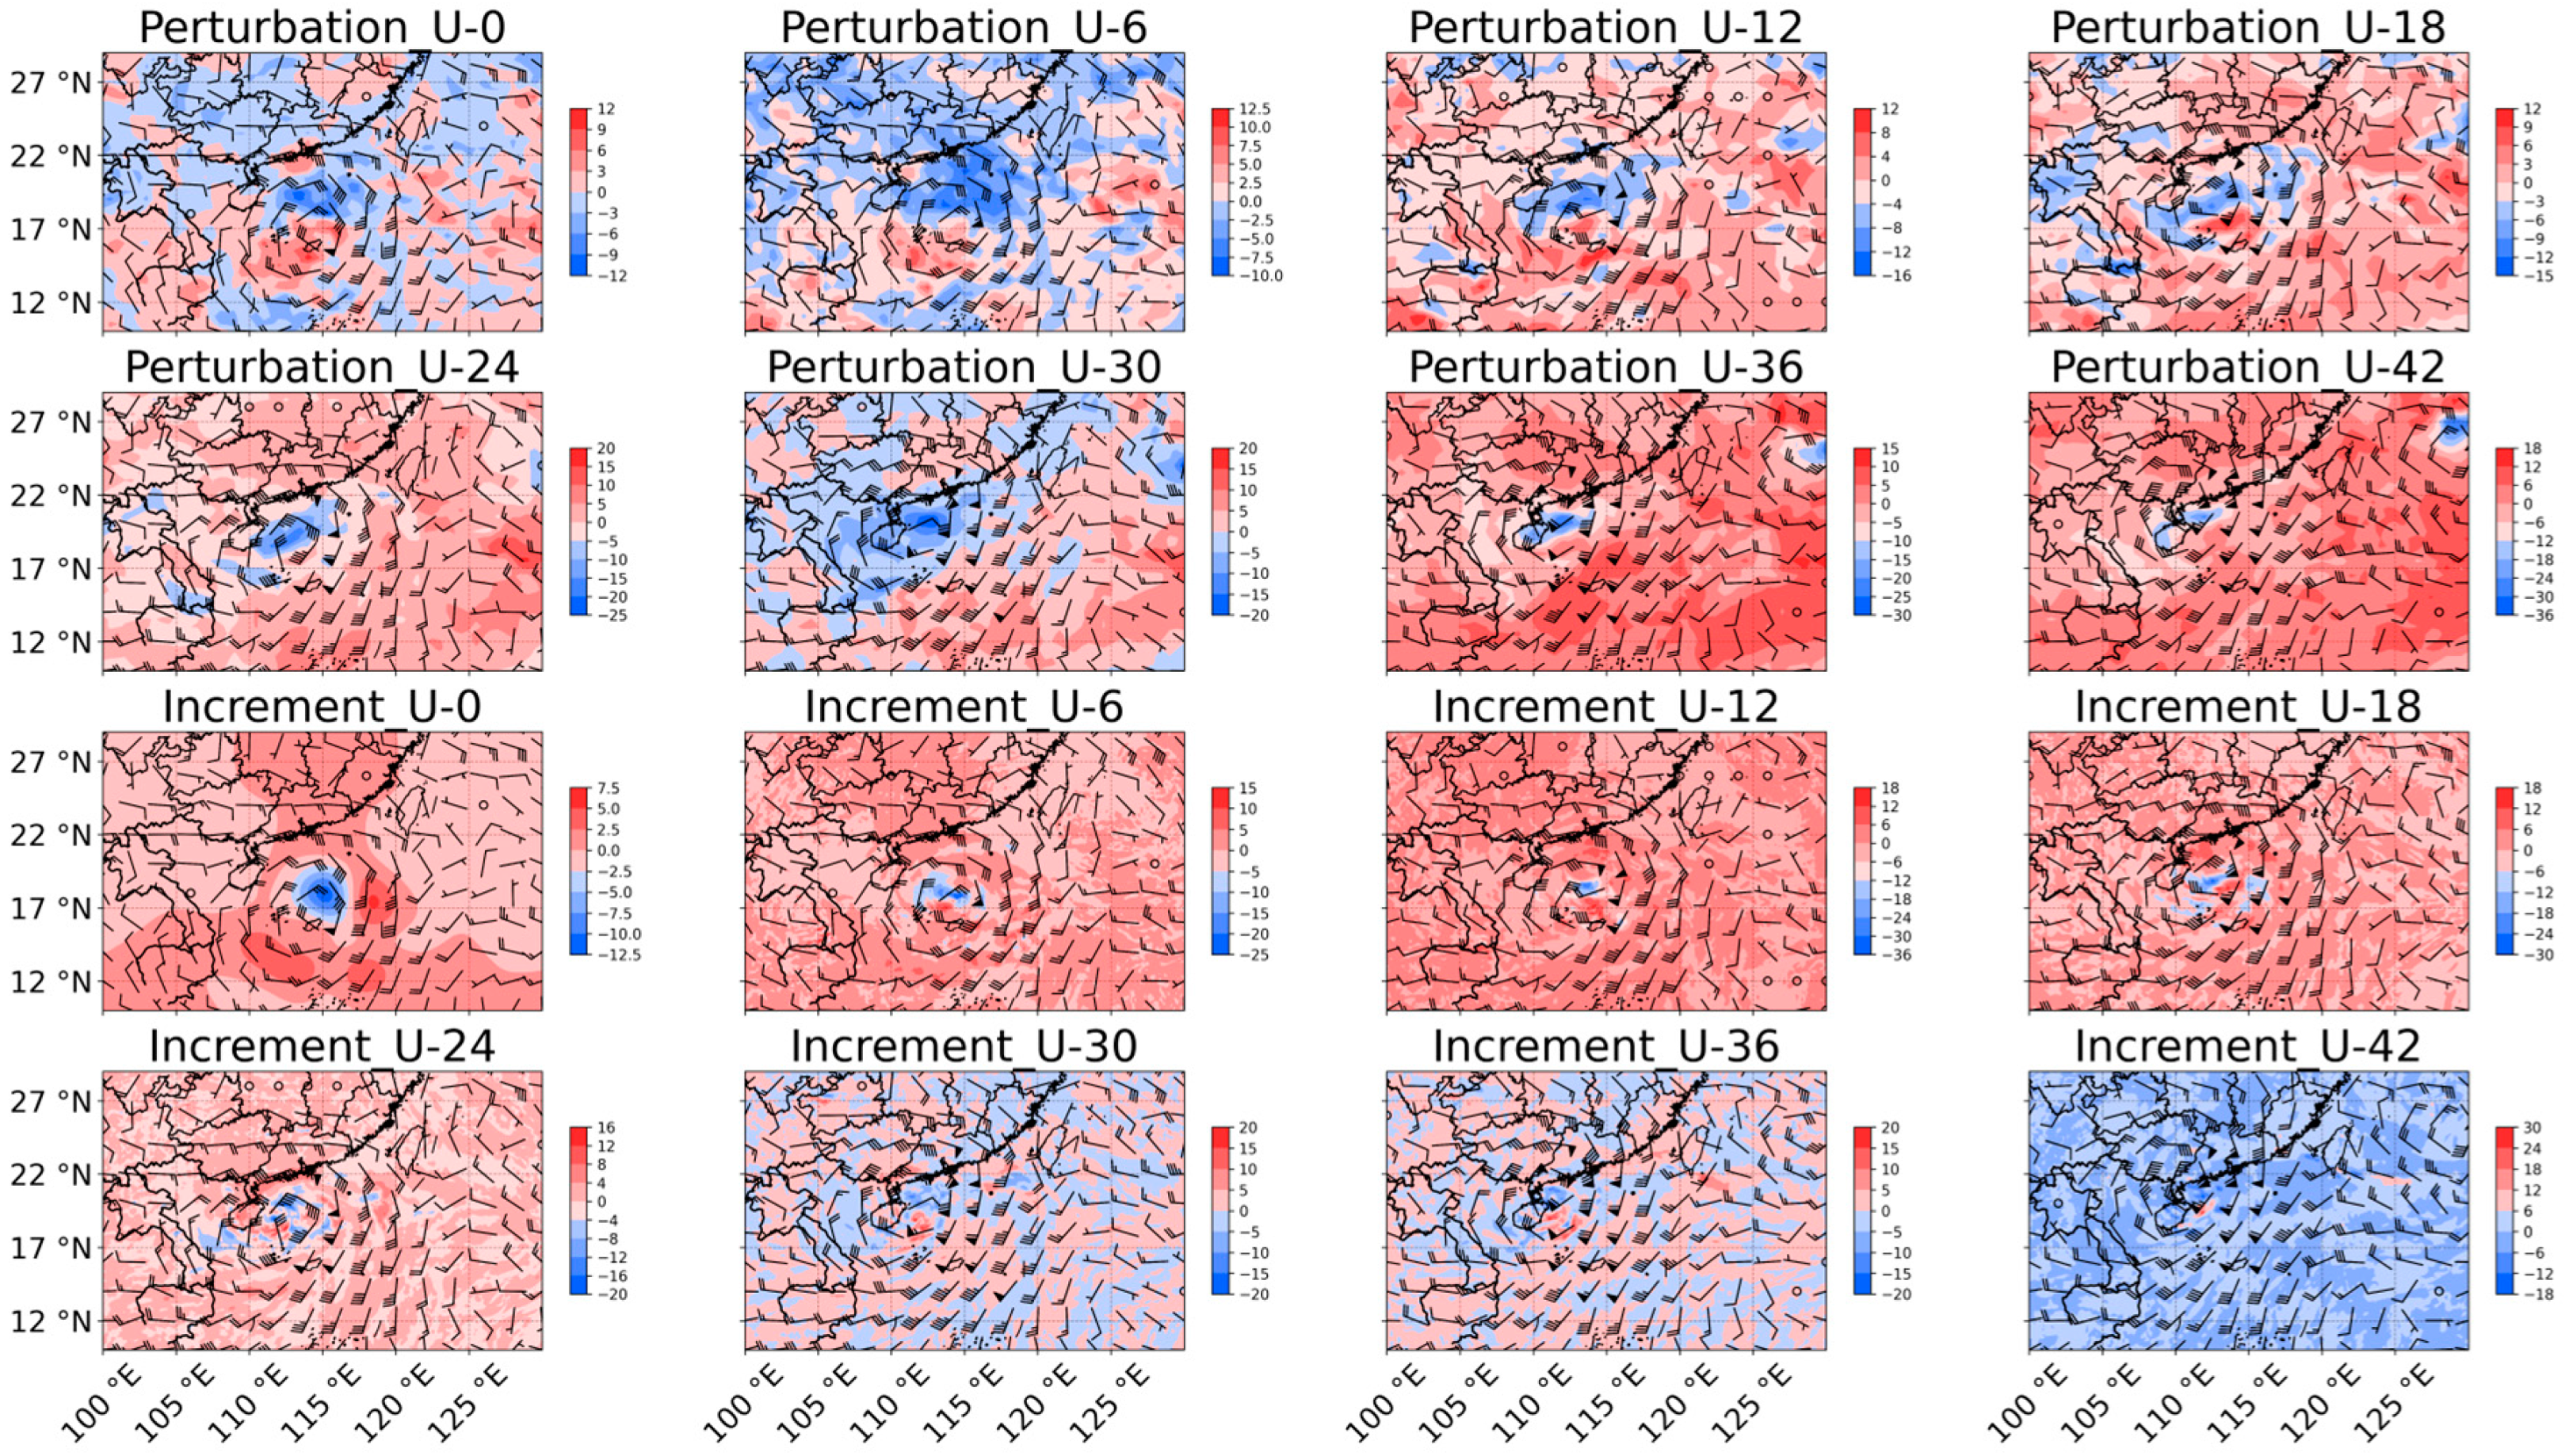
4.3.2. Analysis of the Assimilation Increment and the Perturbation of GEFS Data

By obtaining large-scale features and then based on the data assimilation method, we can further improve the uncertainty problem of our mesoscale model. Figure 11 show the results of the model perturbations and assimilation increments of U and V winds in the SEN experiment over time. At the initial moment, for the perturbations, there is a clear center of negative perturbations in the northern part of the typhoon center and a clear center of positive perturbations in the southern part; for the assimilation increments, there is a center of negative increments in the northern part of the typhoon center, while positive increments dominate in the southern part of the typhoon center. Therefore, the distribution of perturbations from the large-scale GEFS and the assimilation increments from the mesoscale model at the typhoon center at the initial moment are similar. With the passage of time, the typhoon keeps developing, which leads to the changing distribution of perturbation centers and forecast increments. At 6 h, 12 h, and 18 h following the initial moment, their perturbation and forecast increments from the large-scale GEFS data show a negative distribution in the north and a positive distribution in the south near the typhoon center. In the following 24 h, 30 h, 36 h, and 42 h, the typhoon center is dominated by negative perturbations and negative increments. In general, the perturbation from the large-scale GEFS data and the assimilation increment and forecast increment from the mesoscale data are similar in the vicinity of the typhoon center at different times, whereas they are not similar in the area far away from the typhoon center due to the control of the advective flow and other factors. The ETS method we adopt in this paper is an estimation based on the perturbation results, which also shows that by obtaining large-scale features and then based on the data assimilation method, we can further improve the uncertainty problem of our mesoscale model, which in turn contributes to the SEN test’s superiority over the other tests in terms of its forecasting ability during the rapid intensification phase of the typhoon.

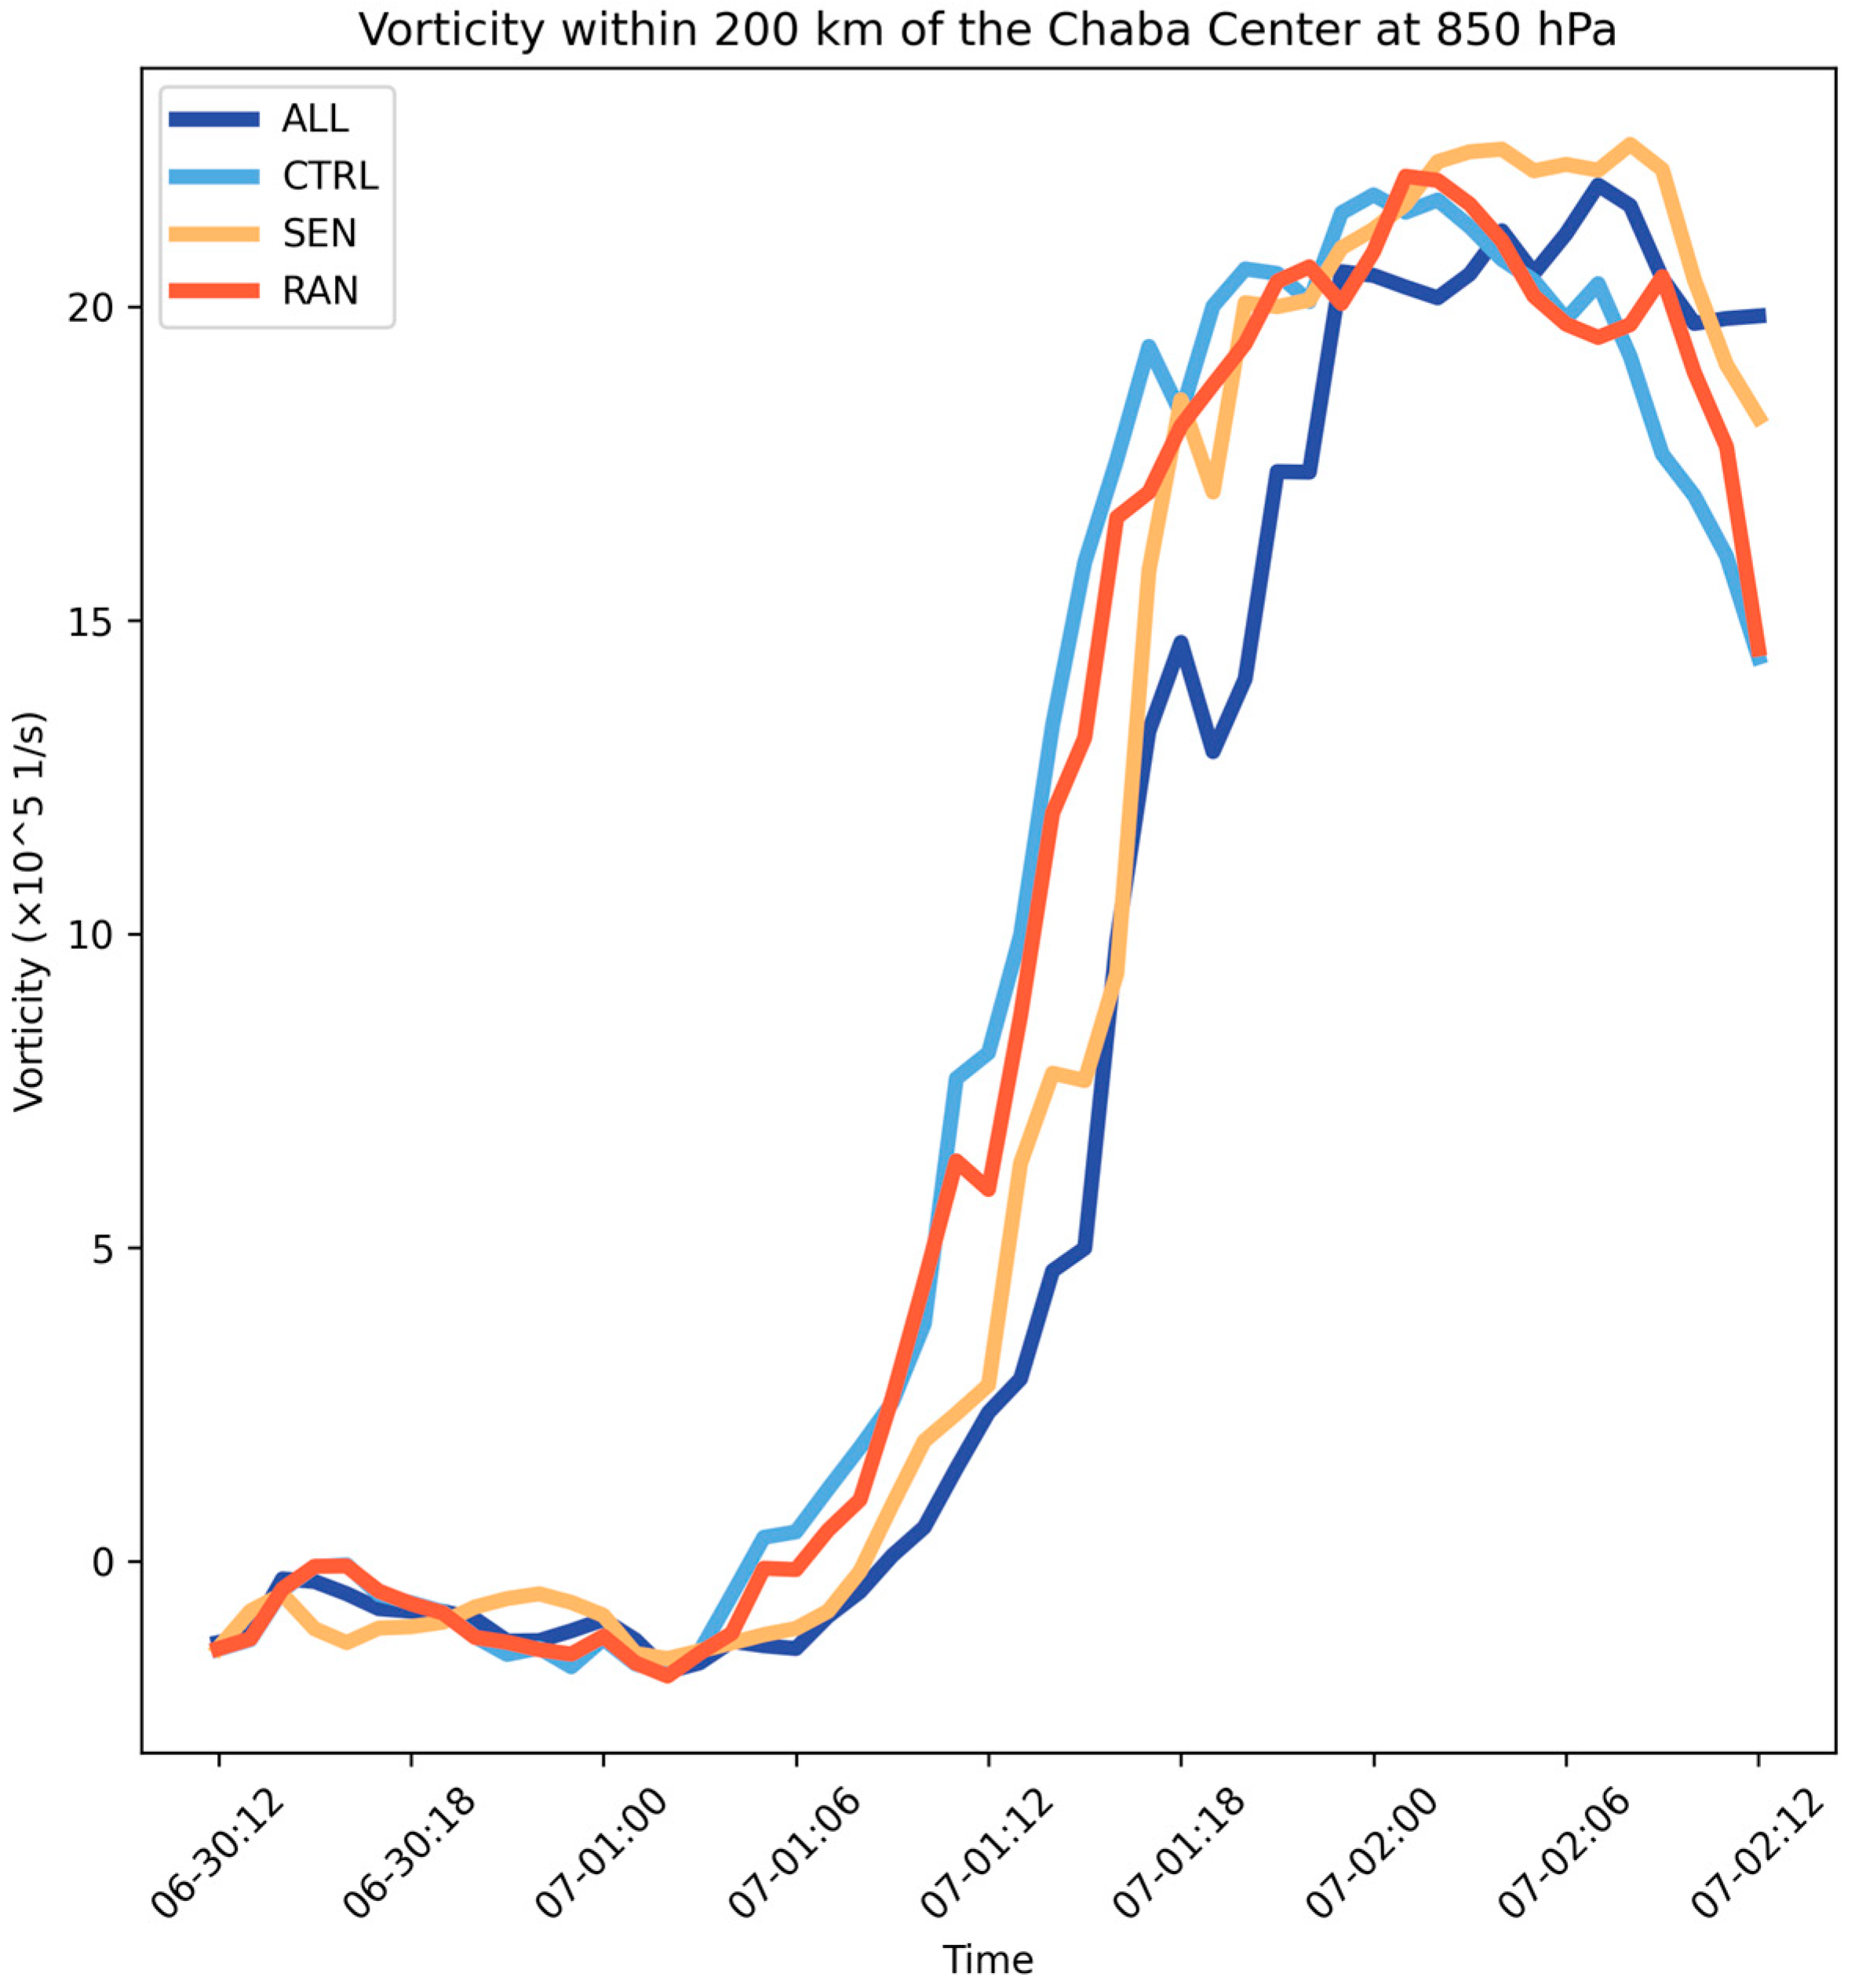
4.3.3. Analysis of Vorticity for the Four Sets of Experiments

Vorticity can accurately characterize the location and intensity of cyclone centers [39], and it is an essential basic physical quantity in weather analysis and forecasting [40]; typhoon changes are often explained in many studies through the analysis of variations in the vorticity field [41]. The average vorticity values within 200 km (Figure 12) are small and stable at the early stage of typhoon development for all four sets of experiments, and the differences in vorticity values between different experiments are small. For the distribution of the vorticity field (Figure 13), the vorticity distribution in the CTRL and RAN experiments is more concentrated, and the maximum value can reach 24 × 10 4   S 1 . The ALL and SEN tests simulate a more dispersed vorticity field and overall smaller vorticity values. Therefore, in the early stage of the rapid intensification of the typhoon, the results of typhoon intensity simulated by the ALL test and the SEN test are on the smaller side but closer to the observations. During the middle stage of the rapid intensification of the typhoon, the vorticity in the four sets of experiments rapidly increases to approximately 22 × 10 5   S 1 from the moment of 2022070100 (UTC) to the moment of 2022070200 (UTC), but the results of the RAN and CTAL experiments increase faster, and the distribution of vorticity is more concentrated. This provides the conditions for stronger strength results simulated by both sets of tests at that time period. At the end of rapid intensification (after the moment of 2022070200), the vorticity values in the RAN and CTRL tests decrease rapidly, with the mean value decreasing to approximately 18 × 10 5   S 1 and the maximum value to approximately 12 × 10 4   S 1 at the moment of 2022070203 (UTC), and at the same time, the distribution of vorticity begins to be dispersed. This inhibits further intensification of the typhoon. The simulated results of the RAN and CTAL experiments are biased in the early and middle stages of the rapid intensification of the typhoon, which leads to increased bias and poorer quality of simulated results in the later stages. While the magnitude of the mean vorticity simulated in the SEN experiment is stable at 22 × 10 5   S 1 during the late stage of rapid intensification of the typhoon, the mean vorticity simulated in the ALL experiment fluctuates up and down at 22 × 10 5 S 1 during the same period of time. During this period, the SEN and ALL experiments reduce the uncertainties of the mesoscale model and further improve its vorticity field distribution by capturing the characteristics of large-scale perturbations and then using data assimilation methods. The distributions of vorticity in both the ALL and SEN experiments show a contracting trend, and the vorticity values are significantly enhanced; therefore, the simulated typhoon intensity results of these two experiments are closer to the observed results during this period. Additionally, the vorticity field simulated in the SEN experiment is better than that in the ALL experiment in the later stages of rapid intensification of the typhoon, which makes some positive contribution to the superiority of the intensity results simulated in the SEN experiment in the later stages of rapid intensification over the other experiments.

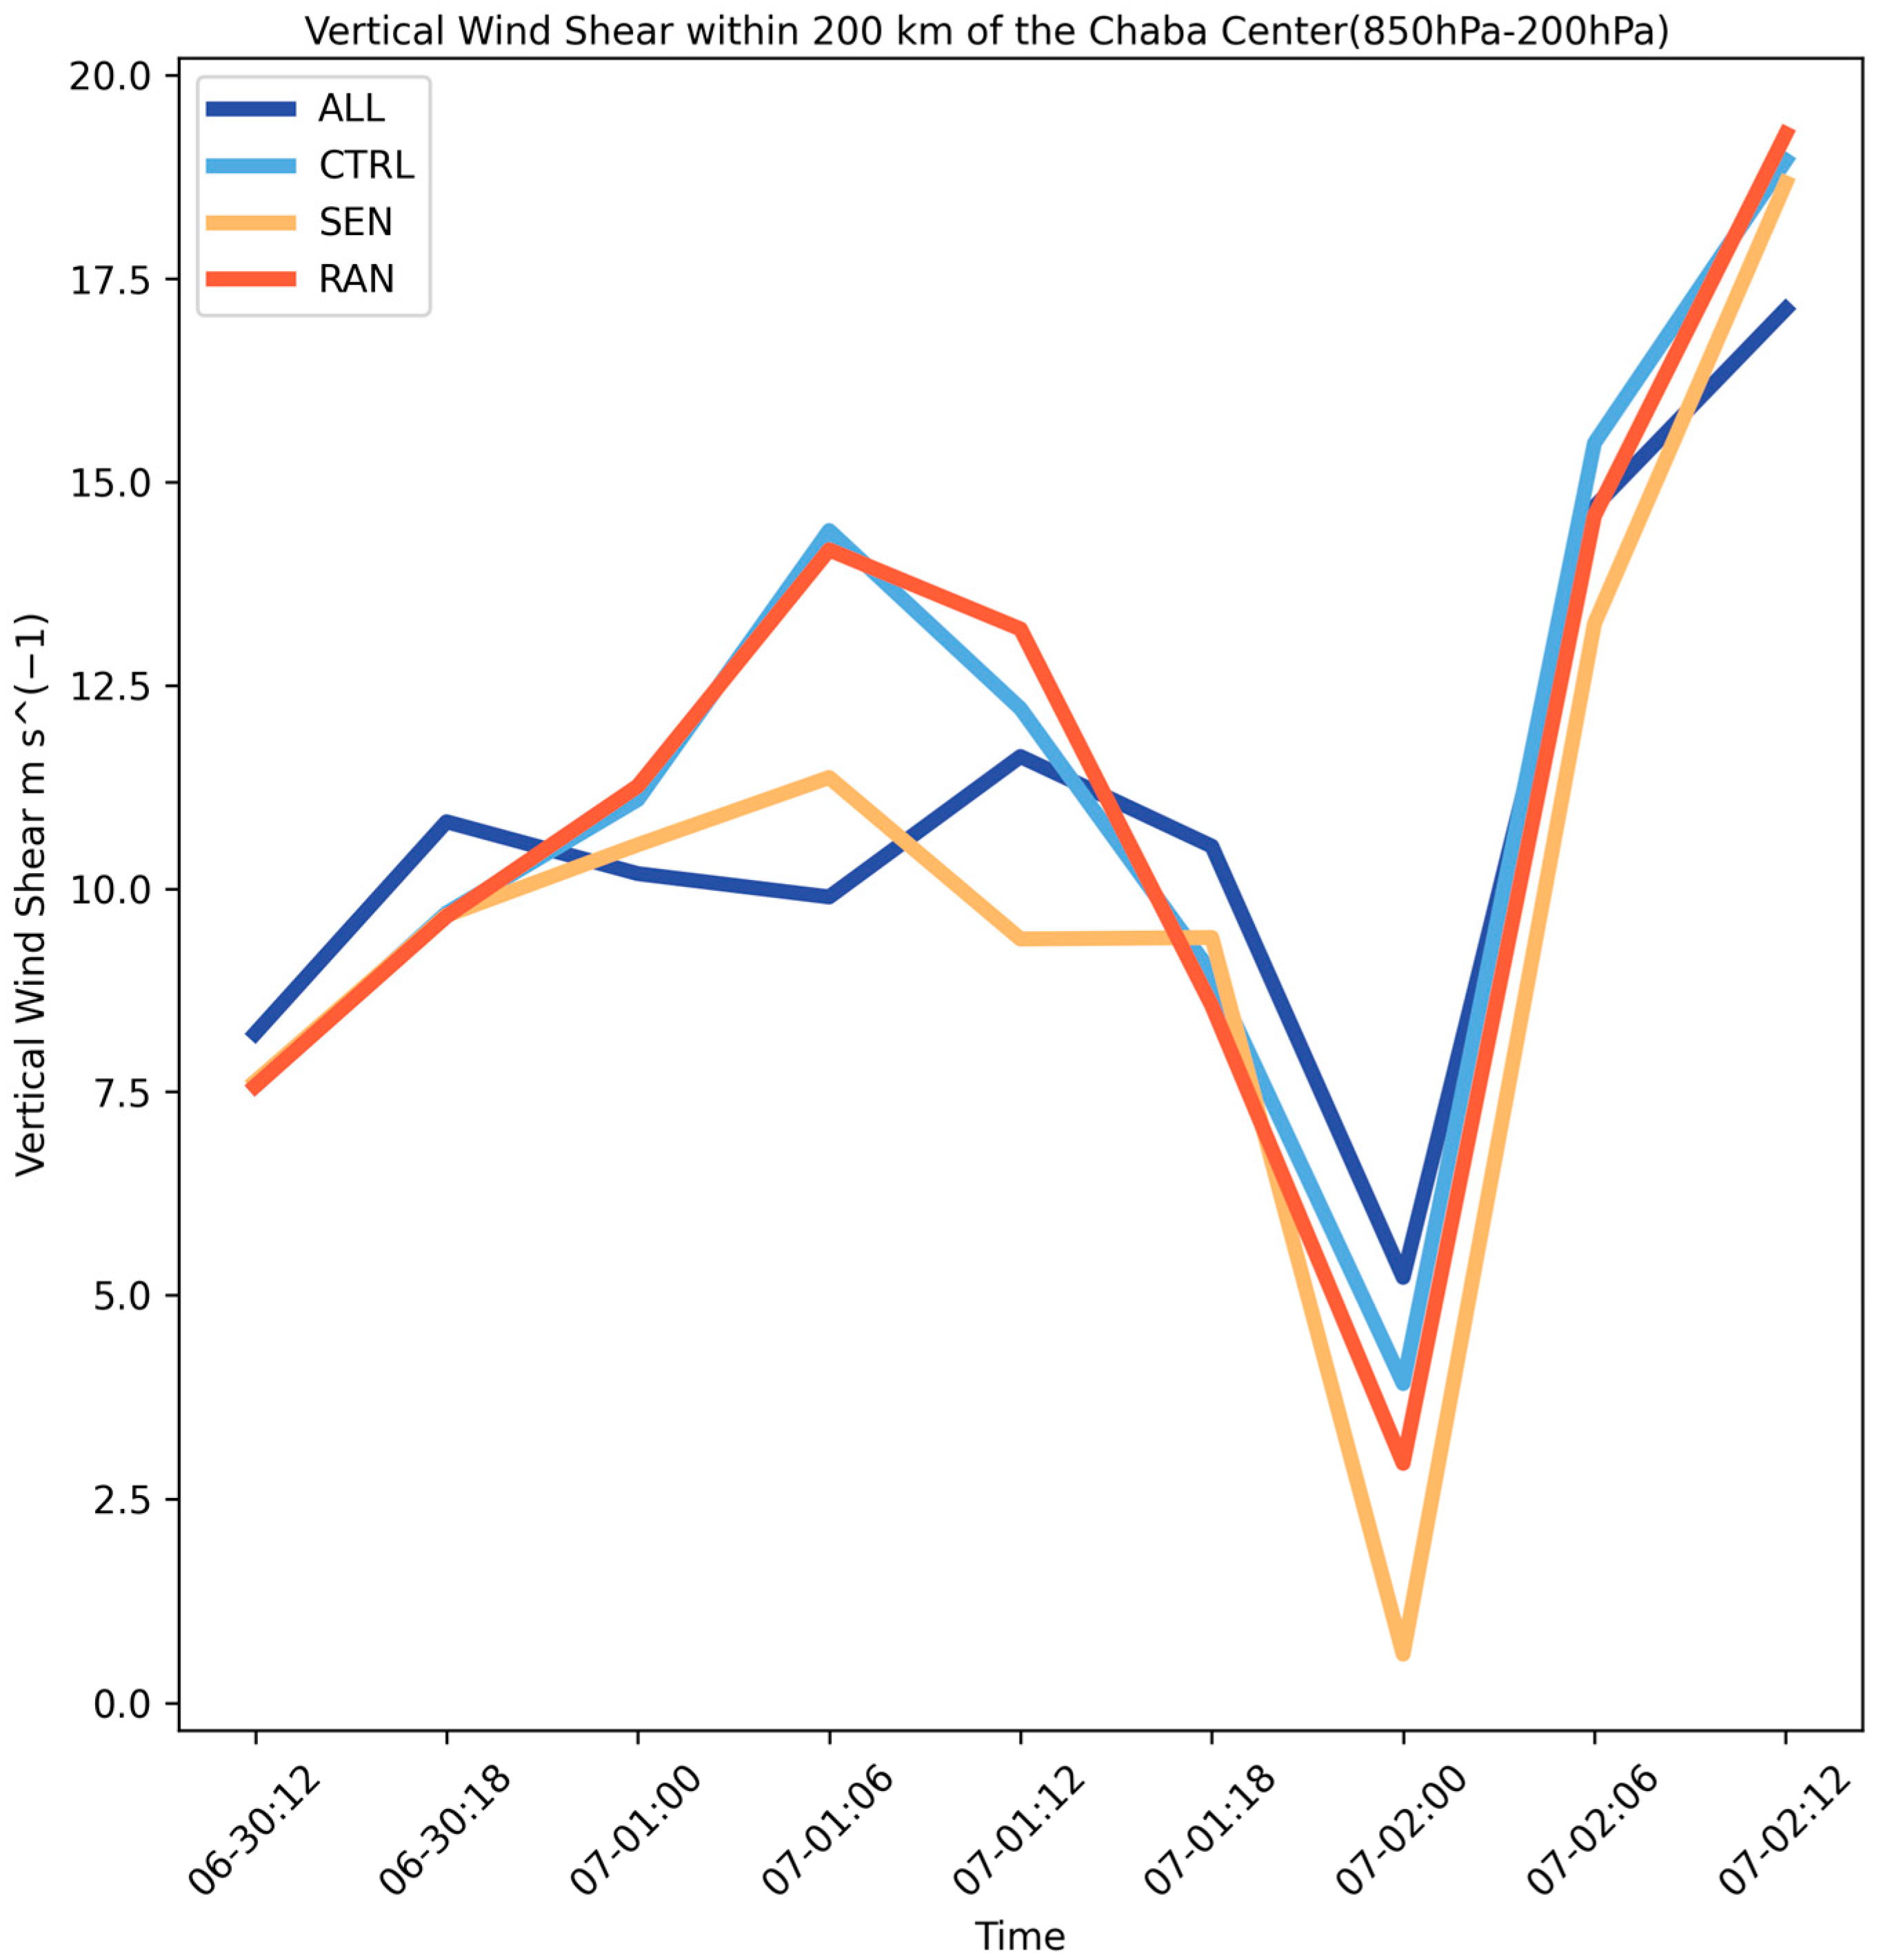
4.3.4. Analysis of Vertical Wind Shear for the Four Sets of Experiments

Environmental vertical wind shear has an inhibitory effect on the development of typhoon intensity, which means that vertical wind shear can prevent the formation and development of typhoons, and the intensity of typhoons will be weakened in a larger vertical wind shear field. In the South China Sea, the small vertical wind shear is an imperative influence factor in the strengthening of typhoon intensity [42]. In Figure 14, at the beginning of the rapid intensification phase of the typhoon, the vertical wind shear values of the SEN and ALL tests are lower than those of the other two groups of tests, and their fluctuations are small, fluctuating up and down in the range of 10   m · s 1 , whereas the simulated results for the CTRL and RAN tests fluctuate greatly, with fluctuations of up to 5   m · s 1 . In the middle of the rapid intensification of the typhoon, the capture of large-scale vertical shear features in the SEN experiment leads to the vertical wind shear results simulated in the SEN experiment being largely lower than those in the remaining three sets of experiments, and such conditions are also conducive to the rapid intensification of the typhoon. In addition, during the later stages of rapid intensification of the typhoon, all four sets of experiments reach the lowest values of vertical wind shear around the moment of 2022070200 (UTC), and a value of 0.5   m · s 1 is reached in the SEN experiment, which is 88% and 79% lower than that in the ALL and RAN experiments, respectively. After the vertical wind shear reaches its lowest value, the simulated vertical wind shear values of the four experiments increase rapidly, thus suppressing the further intensification of the typhoon to a certain extent. However, the vertical shear in the SEN test from 2022070200 (UTC) to 2022070206 (UTC) is significantly smaller than that in the other three sets of tests, which is more favorable to the fact that the results of typhoon intensity simulated in the SEN test are better than those in the ALL test during this time period. This further shows that the uncertainty of mesoscale model forecasts can be improved by capturing large-scale vertical shear features, then using the data assimilation method, which enables the vertical shear field to be simulated more favorably to the development of the typhoon, which is conducive to the model’s simulation of the typhoon in the rapid intensification phase.

5. Conclusions

This study evaluates the distribution of the sensitive areas of Typhoon “Chaba” No. 3 in 2022 and its related characteristics based on the ensemble transform sensitivity method (ETS), and four sets of sensitivity experiments are conducted for Typhoon “Chaba” using the WRF-ARW model and the GSI assimilation system. Based on the simulated results of the four experiments, the contributions of the observation sensitivity regions to the prediction of Typhoon “Chaba” forecasting during the rapid intensification phase are analyzed in terms of typhoon intensity, track, wind field, vertical wind shear, and vorticity field, and the conclusions are as follows:
(1)
The observation sensitivity areas of Typhoon “Chaba” estimated by the ETS method were generally consistent with the theoretical results of adaptive observation, and the distribution of sensitive areas in the study area was reasonable. Points with sensitivity values higher than 0.5 were located to the southeast of the 500 hPa wind field center, while those with sensitivity values less than 0.5 were located to the west and northwest of the 500 hPa wind field center, and their distributions were adapted to the distribution of the wind field structure.
(2)
All three data assimilation experiments achieved some degree of improvement in the simulation of the path. The improvements of the SEN and ALL experiments were significantly better than those of the CTRL and RAN experiments during the rapid intensification of the typhoon, but the SEN experiment accurately captured the westward deviation of Typhoon “Chaba” during its development compared with the ALL experiment.
(3)
During the rapid intensification phase of the typhoon, the simulated central typhoon pressure results of the SEN and ALL tests were better than those of the CTRL and RAN tests. In addition, in the early stage of rapid intensification, the SEN test, with only 3.6% of assimilated data, was comparable to the ALL test. In the late stage of rapid intensification, the simulation error of the SEN test could reach as low as 0.73 hPa, which was much smaller than that of the ALL test. Therefore, the results of the SEN test were better than those of the ALL test. These results showed that the use of the ETS methodology to calculate the sensitive areas before Typhoon “Chaba’s” landfall and the rationalization of adaptive observations within the sensitive areas could provide a significant positive contribution to the improvement of typhoon forecast quality.
(4)
The wind field simulated in the SEN and ALL experiments had more complete and compact characteristics, and the center of the maximum wind speed was reasonably distributed near the eye of the typhoon. The distribution of increments for the SEN experiment was more reasonable. Through further reasonable adjustment of the vortex structure, the relatively weak typhoon intensity in the initial background field could be effectively and more reasonably strengthened, which could effectively improve the quality of the initial field of the model forecast and better simulate the development trend of the typhoon.
(5)
The uncertainty of mesoscale model forecasts can be improved by capturing large-scale vertical shear features and vorticity features from the GEFS and then using the data assimilation method, which enables the vertical shear field and vorticity field to be simulated more favorably to the development of the typhoon. Therefore, the simulation results of the SEN test are obviously better than those of the RAN and CTRL tests in the rapid intensification stage of the typhoon; the SEN test simulation results are better than the ALL test simulation results in the later stage of the rapid intensification of the typhoon.
Typhoon intensity and track changes in the South China Sea have significant regional characteristics, and the impact on neighboring regions cannot be ignored. The results of this paper on Typhoon “Chaba” show that increasing adaptive observations in the sensitive areas can improve the forecast effect of this typhoon, which will also provide a reference for subsequent further research on the mechanism of typhoons in the South China Sea and the exploration of the characteristics of the sensitive area of typhoons in the South China Sea. In addition, the paper also has important implications for disaster prevention and mitigation in the coastal provinces in the South China Sea region. However, this study only analyzes the case of Typhoon “Chaba”, and the distribution of the observation sensitivity areas of other typhoons in the South China Sea and the effect of adding adaptive observations to the sensitive areas on the forecasts of different physical quantities need to be further investigated.

Author Contributions

Conceptualization, Y.Z. (Yu Zhang); Software, Y.A., Y.S. and Y.T.; Data Acquisition, Z.Z., P.L. and Q.Y.; Writing—Original Draft, Y.A., Y.Z. (Yinhui Zhang) and Z.H.; Writing—Review and Editing, D.S. and J.H. All authors have read and agreed to the published version of the manuscript.

Funding

This study was jointly supported by the National Natural Science Foundation of China (42375159), the National Key R&D Program of China (2019YFC1510002), and the Program for Scientific Research Start-Up funds provided by Guangdong Ocean University (R20021).

Institutional Review Board Statement

Not applicable.

Informed Consent Statement

Not applicable.

Data Availability Statement

The ERA5 data used in this work are available from the European Center for Medium-Range Weather Forecasts (ECMWF) (https://cds.climate.copernicus.eu/cdsapp#/Dataset/reanalysisera5pressurelevels, accessed on 24 January 2023);The IBTrACS data is from the following website: https://www.ncdc.noaa.gov/ibtracs/index.php?name=ib-v4-access, accessed on 10 February 2023);The GFS data used in this work are available from the National Centers for Environmental Prediction (NCEP) of the United States of America (https://ftp.ncep.noaa.gov/data/nccf/com/gfs/prod/, accessed on 21 January 2023).

Acknowledgments

The authors are very grateful to the editor and anonymous reviewers for their help and recommendations.

Conflicts of Interest

The authors declare no conflicts of interest.

References

  1. Peduzzi, P.; Chatenoux, B.; Dao, H.; De Bono, A.; Herold, C.; Kossin, J.; Mouton, F.; Nordbeck, O. Global trends in tropical cyclone risk. Nat. Clim. Chang. 2012, 2, 289–294. [Google Scholar] [CrossRef]
  2. Zhao, B.; Tang, J.; Lei, X.; Zhang, X.; Duan, W.; Li, H.; Gao, Z.; Qian, C.; Bao, X.; Luo, J.; et al. Progress on the experiment of a multi-platform collaborative field campaign on offshore typhoon. Sci. China Adv. Earth Sci. 2022, 37, 771–785. [Google Scholar]
  3. Elsberry, R.L.; Lambert, T.D.; Boothe, M.A. Accuracy of Atla ntic and eastern North Pacific tropical cyclone intensity forecast guidance. Weather Forecast. 2007, 22, 747–762. [Google Scholar] [CrossRef]
  4. Mu, M. Methods, current status, and prospect of targeted observation. Sci. China Earth Sci. 2013, 43, 1717–1725. [Google Scholar] [CrossRef]
  5. Kalnay, E. Atmospheric modeling. In Data Assimilation and Predictability; Cambridge University Press: Cambridge, UK, 2002; p. 368. [Google Scholar]
  6. Sasaki, Y. An objective analysis based on the variational method. Meteorol. Soc. Jpn. Ser. 1958, 36, 77–88. [Google Scholar] [CrossRef]
  7. Yamaguchi, M.; Ishida, J.; Sato, H.; Nakagawa, M. WGNE Intercomparison of Tropical Cyclone Forecasts by Operational NWP Models: A Quarter Century and Beyond. Bull. Am. Meteorol. Soc. 2017, 98, 2337–2349. [Google Scholar] [CrossRef]
  8. Zhou, B.; Li, X.; Chen, Y.; Zeng, M. Effect of the GPS ZTD data assimilation on simulation of typhoon “Lekima”. Sci. China J. Meteorol. Sci. 2020, 40, 11–21. [Google Scholar]
  9. Zou, Y.; Ma, X.; Jiang, S.; He, H.; Guo, H. Effect of COSMIC occultation data assimilation on prediction of typhoon Usagi. Sci. China J. Mar. Sci. 2017, 35, 9–19. [Google Scholar]
  10. Yu, Z.W.; Liu, J.W.; Huang, J.P. Assimilation experiment of AMSR2 microwave imaging data and its influence on typhoon forecasting. Sci. China Meteorol. Hydrol. Mar. Instrum. 2017, 34, 1–8. [Google Scholar]
  11. Lei, L.; Tan, Z. On adaptive observation and adaptive observation Strategies. Sci. Meteorol. Sci. 2008, 28, 109–118. (In Chinese) [Google Scholar]
  12. Snyder, C. Summary of an informal workshop on adaptive observations and FASTEX. Bull. Am. Meteorol. Soc. 1996, 77, 953–961. [Google Scholar] [CrossRef]
  13. Chen, S.; Zhang, Y.; Xu, J.; Shen, W.; Ye, G.; Lu, Z. Data assimilation of adaptive observation and application for typhoon forecasts over the Western North Pacific. Atmos. Res. 2022, 276, 106274. [Google Scholar] [CrossRef]
  14. Chen, S.Y.; Ma, X.L.; Sun, L.; Pan, X.; Hong, G. Adaptive observation of the sensitive area of typhoon “Chan-Hom” (1509) and assimilation analysis of simulated data. Trans. Atmos. Sci. 2023, 46, 139–151. [Google Scholar]
  15. Qin, X.H.; Mu, M. Influence of conditional nonlinear optimal perturbations sensitivity on typhoon track forecasts. Q. J. R. Meteorol. Soc. 2011, 138, 185–197. [Google Scholar] [CrossRef]
  16. Ma, X.; Yu, Y.; Jiang, S.; Li, J. Optimization and influence experiment to identify sensitive areas for target observations on ETKF method. Trans. Atmos. Sci. 2014, 37, 749–757. [Google Scholar]
  17. Palmer, T.N.; Gelaro, R.; Barkmeijer, J.; Buizza, R. Singular vectors, metrics, and adaptive observations. Atmos. Sci. 1998, 55, 633–653. [Google Scholar] [CrossRef]
  18. Bishop, C.H.; Toth, Z. Ensemble transformation and adaptive observations. J. Atmos. Sci. 1999, 56, 1748–1765. [Google Scholar] [CrossRef]
  19. Torn, R.D.; Hakim, G.J. Ensemble-based sensitivity analysis. Mon. Weather. Rev. 2008, 136, 663–677. [Google Scholar] [CrossRef]
  20. Wu, C.C.; Lin, P.H.; Aberson, S.; Yeh, T.C.; Huang, W.P.; Chou, K.H.; Hong, J.S.; Lu, G.C.; Fong, C.T.; Liu, C.H.; et al. Dropwindsonde observations for typhoon surveillance near the Taiwan region (dotstar) on jstor. Am. Meteorol. Soc. 2005, 86, 787–790. [Google Scholar]
  21. Mu, M.; Zhou, F.F.; Wang, H.L. A method for identifying the sensitiv we areas in targeted observations for tro pical cyclone prediction: Conditional nonlinear optimal perturbation. Mon. Weather Rev. 2009, 137, 1623–1639. [Google Scholar] [CrossRef]
  22. Mu, M.; Duan, W.S.; Wnag, B. Conditional nonlinear optimal perturb bation and its applications. Nonlinear Process. Geophys. 2003, 10, 493–501. [Google Scholar] [CrossRef]
  23. Majumdar, S.J.; Bishop, C.H.; Buizza, R.; Gelaro, R. A comparison of Ensemble Transform Kalman Filter Targeting Guidance with ECMWF and NRL Total-Energy Singular Vector Guidance. Q. J. R. Meteorol. Soc. 2002, 128, 2527–2549. [Google Scholar] [CrossRef]
  24. Zhang, Y.; Xie, Y.; Wang, H.; Chen, D.; Toth, Z. Ensemble transform sensitivity method for adaptive observations. Adv. Atmos. Sci. 2016, 33, 10–20. [Google Scholar] [CrossRef]
  25. Chen, S.Y. Identification of Target Observation Sensitive Areas for Typhoon Forecasting in China’s Coastal Waters and Data Assimilation Study. Master’s Thesis, Nanjing University of Information Science Technology, Nanjing, China, 2021. [Google Scholar]
  26. Ma, X.; Yu, Y.; Chen, D. The present situation and prospects of the adaptive observation. Acta Meteorol. Sin. 2015, 73, 221–235. [Google Scholar]
  27. Berliner, L.M.; Lu, Z.Q.; Snyder, C. Statistical design for adaptive weather observations. J. Atmos. Sci. 1999, 56, 2536–2552. [Google Scholar] [CrossRef]
  28. Majumdar, S.J.; Bishop, C.H.; Etherton, B.J.; Toth, Z. Adaptive sampling with the ensemble transform Kalman filter. II: Field program implementation. Mon. Weather. Rev. 2002, 130, 1356–1369. [Google Scholar] [CrossRef]
  29. Qin, X.H. A comparison study of the contributions of additional observations in the sensitive regions identified by CNOP and FSV to reducing forecast error variance for the Typhoon Morakot. Atmos. Ocean. Sci. Lett. 2010, 3, 258–262. [Google Scholar]
  30. Li, Y.; Zhang, C.; Zhong, J.; Meng, Z. Case study of observations and sensitive region of heavy rainfall in Beijing area. Clim. Environ. Res. 2013, 18, 651–661. (In Chinese) [Google Scholar]
  31. Shi, X.; Cheng, W.; Wu, J.; Li, S. Methods for downloading and cropping US GFS global numerical weather forecast data. Meteorol. Hydrol. Mar. Instrum. 2021, 38, 81–84. (In Chinese) [Google Scholar]
  32. Rogers, E.; Black, T.; Ferrier, B.; Lin, Y.; Parrish, D.; DiMego, G. National Oceanic and Atmospheric Administration Changes to the NCEP Meso Eta Analysis and Forecast System: Increase in resolution, new cloud microphysics, modified precipitation assimilation, modified 3DVAR analysis. NWS Tech. Proced. Bull 2001, 488, 15. [Google Scholar]
  33. Janjić, Z.I. The Step–Mountain Eta Coordinate Model: Further developments of the convection, viscous sublayer, and turbulence closure schemes. Mon. Wealth Rev. 1994, 122, 927–945. [Google Scholar] [CrossRef]
  34. Zhang, C.; Wang, Y. Projected Future Changes of Tropical Cyclone Activity over the Western North and South Pacific in a 20-km-Mesh Regional Climate Model. Climate 2017, 30, 5923–5941. [Google Scholar] [CrossRef]
  35. Iacono, M.J.; Delamere, J.S.; Mlawer, E.J.; Shephard, M.W.; Clough, S.A.; Collins, W.D. Radiative forcing by long–lived greenhouse gases: Calculations with the AER radiative transfer models. Geophys. Res. 2008, 113. [Google Scholar] [CrossRef]
  36. Tewari, M.; Chen, F.; Wang, W.; Dudhia, J.; Le Mone, M.A. Implementation and verification of the unified NOAH land surface model in the WRF model. In Proceedings of the 20th Conference on Weather Analysis and Forecasting/16th Conference on Numerical Weather Prediction, Seattle, WA, USA, 12–16 January 2004. [Google Scholar]
  37. Monin, A.S.; Obukhov, A.M. Basic laws of turbulent mixing in the surface layer of the atmosphere. Contrib. Geophys. Inst. Acad. Sci. USSR 1954, 151, 163–187. (In Russian) [Google Scholar]
  38. Lorenz, E.N. Deterministic nonperiodic flow. Atmos. Sci. 1963, 20, 130–141. [Google Scholar] [CrossRef]
  39. Xiong, Q.F.; Zhang, X.; Tao, Z.Y. An Analysis of Vorticity Evolution and Physics Mechanism on an Extratropical Cyclone. Metorological Mon. 2016, 42, 294–304. (In Chinese) [Google Scholar]
  40. Cai, Q.F.; Huang, S.X.; Gao, S.T.; Zhong, K.; Li, Z.Q. A new method for calculating vorticity. Acta Phys. Sin. 2008, 57, 3912–3919. [Google Scholar]
  41. Wen, X.P.; Long, X.; Tian, C.; Yuan, T.; Jing, X.J. Diagnostic Analysis of Vorticity and Circulation Budgets during the Development and Evolution of Super Typhoon SANBA. J. Trop. Meteorol. 2018, 34, 87–101. (In Chinese) [Google Scholar]
  42. Liang, M.; Zhong, X.; Xu, J.; Xu, F. Sudden Changes in Tropical Cyclone Intensity in South China Sea from 1960 to 2017. J. Guangdong Ocean Univ. 2020, 40, 83–91. (In Chinese) [Google Scholar]
Figure 1. The adaptive observation and ETS method flow chart for Typhoon “Chaba”.
Atmosphere 15 00269 g001
Figure 2. Overview of the study area. The red realization represents the observed track of Typhoon “Chaba” from the IBTrACS website, where the starting point indicates the initial moment of observation.
Atmosphere 15 00269 g002
Figure 3. Estimation of the sensitive region 48 h before the landfall of Typhoon “Chaba”. Normalized observational sensitivity region (shadow) and 500 hPa wind field (arrow, unit: m/s) of Typhoon “Chaba” at different target analysis moments (the initial moment of ensemble forecast is 2022063012; the verification moment is 202206300 + 48 h; the black box indicates the validation area).
Atmosphere 15 00269 g003
Figure 4. Box plots of the dispersion of sensitive areas for Typhoon “Chaba”. The horizontal coordinates represent the moments, and the vertical coordinates represent the geographical distance (km) between the center of typhoon and the sensitivity value in the region greater than 0.5. The yellow pentagram represents the average; the solid yellow line represents the median; the circles represent the outliers.
Atmosphere 15 00269 g004
Figure 5. A 500 hPa wind field (unit: m/s) simulated in four sets of experiments. (A,B) represent the ALL experiment results; (C,D) represent the SEN experiment results; (E,F) represent the RAN experiment results; and (G,H) represent the CTRL experiment results. The left panel represents the initial moment (2022063012 (UTC)), and the right panel represents the moment of the strongest intensity (2022070200 (UTC)). The shaded area represents the synthetic UV wind (unit: m/s).
Atmosphere 15 00269 g005
Figure 6. The typhoon center pressure changes over time for four sets of tests. The blue line represents the ALL test; the yellow line represents the CTRL test; the red line represents the SEN test; the green line represents the RAN test; and the black line represents the IBTrACS data. The X-axis represents the moment of typhoon development, and the Y-axis represents the typhoon central air pressure.
Atmosphere 15 00269 g006
Figure 7. The central typhoon pressure deviation changes over time for the four sets of tests. The blue histogram represents the ALL test; the yellow histogram represents the CTRL test; the red histogram represents the SEN test; and the green histogram represents the RAN test. The X-axis represents the moment of development of the typhoon, and the Y-axis represents the central pressure deviation of the typhoon.
Atmosphere 15 00269 g007
Figure 8. Distribution of typhoon tracks for the four sets of experiments. The black line represents the observations from the IBTrACS website; the red, purple, yellow, and blue lines represent the typhoon track forecasts from the RAN experiment, the ALL experiment, the SEN experiment, and the CTRL experiment, respectively.
Atmosphere 15 00269 g008
Figure 9. Plot of typhoon path deviations in the four sets of experiments. Among them, the blue line is the CTRL trial; the purple line is the ALL trial; the red line is the RAN trial; and the yellow line is the RAN trial.
Atmosphere 15 00269 g009
Figure 10. Assimilation analysis increment (shadow) of Typhoon “Chaba” in the 500 hPa U wind field (A,C,E; unit: m/s) and V wind field (B,D,F; unit: m/s). The black solid line represents the 500 hPa potential height contour. The left panel of this figure shows the increase in U wind, and the right panel shows the increase in V wind; (A,B) represent the SEN experiment, (C,D) represent the ALL experiment, (E,F) represent the RAN experiment.
Atmosphere 15 00269 g010
Figure 11. Plot of model perturbation and assimilation increment over time for U wind. The top two lines represent the perturbation of the pattern, and the bottom two lines represent the increments (shadow) and 500 hPa wind field (arrow, unit: m/s) of Typhoon “Chaba” at different target analysis moments (the initial moment of ensemble forecast is 2022063012).
Atmosphere 15 00269 g011
Figure 12. Plot of 850 hPa vorticity values within 200 km from the typhoon center over forecast time. The yellow line is the SEN test; the blue line is the CTRL test; the red line is the RAN test; and the purple line is the ALL test.
Atmosphere 15 00269 g012
Figure 13. Results of the 850 hPa vorticity field simulated in each experiment (unit: × 10 5 / s ). (AD) exhibit the results simulated in the SEN, ALL, RAN, and CTAL experiments, respectively. Each column corresponds to a different moment: 2022070100, 2022070112, 2022070200, and 2022070203.
Atmosphere 15 00269 g013
Figure 14. Plot of vertical wind shear within 200 km from the typhoon center over forecast time. The yellow line stands for the SEN test; the blue line stands for the CTRL test; the red line stands for the RAN test; and the purple line stands for the ALL test.
Atmosphere 15 00269 g014
Table 1. Parameterization scheme settings for model physical processes.
Parameterization SchemeDescription
Mp_physicsEta (Ferrier) Scheme [32]
bl_pbl_physicsMellor–Yamada–Janjic Scheme (MYJ) [33]
cu_physicsNew Tiedtke Scheme [34]
ra_lw_physics/ra_rw_physicsRRTMG Shortwave and Longwave Schemes [35]
sf_surface_physicsUnified Noah Land Surface Model [36]
sf_sfclay_physicsEta Similarity Scheme [37]
Table 2. Experimental program.
Experiment NameAssimilation Data
CTRLWithout DA
ALLSynthetic observations for the whole domain
SEN13° N–17° N,
112° E–117° E
RAN21° N–25° N,
120° E–125° E
Disclaimer/Publisher’s Note: The statements, opinions and data contained in all publications are solely those of the individual author(s) and contributor(s) and not of MDPI and/or the editor(s). MDPI and/or the editor(s) disclaim responsibility for any injury to people or property resulting from any ideas, methods, instructions or products referred to in the content.

