A Study on the Formation Reactions and Conversion Mechanisms of HONO and HNO3 in the Atmosphere of Daejeon, Korea


1
Department of Environmental Engineering, Anyang University, Anyang 14028, Republic of Korea
2
E2M3 Inc., Anyang 14059, Republic of Korea
3
Department of Chemistry, Yonsei University, Seoul 03722, Republic of Korea
*
Author to whom correspondence should be addressed.
Atmosphere 2024, 15(3), 267; https://doi.org/10.3390/atmos15030267
Submission received: 29 December 2023
/
Revised: 15 February 2024
/
Accepted: 19 February 2024
/
Published: 23 February 2024
(This article belongs to the Section Air Quality)
Abstract
:Nitrogen oxides (NOX) in the atmosphere cause oxidation reactions with photochemical radicals and volatile organic compounds, leading to the accumulation of ozone (O3). NOX constitutes a significant portion of the NOy composition, with nitrous acid (HONO) and nitric acid (HNO3) following. HONO plays a crucial role in the reaction cycle of NOX and hydrogen oxides. The majority of HNO3 reduction mechanisms result from aerosolization through heterogeneous reactions, having adverse effects on humans and plants by increasing secondary aerosol concentrations in the atmosphere. The investigation of the formation and conversion mechanisms of HONO and HNO3 is important; however, research in this area is currently lacking. In this study, we observed HONO, HNO3, and their precursor gases were observed in the atmosphere using parallel-plate diffusion scrubber-ion chromatography. A 0-D box model simulated the compositional distribution of NOy in the atmosphere. The formation reactions and conversion mechanisms of HONO and HNO3 were quantified using reaction equations and reaction coefficients. Among the various mechanisms, dominant mechanisms were identified, suggesting their importance. According to the calculation results, the produce of HONO was predominantly attributed to heterogeneous reactions, excluding an unknown source. The sink processes were mainly governed by photolysis during daytime and reactions with OH radicals during nighttime. HNO3 showed dominance in its production from N2O5, and in its conversion mechanisms primarily involving aerosolization and deposition.
Keywords:
HONO; HNO3; formation and conversion mechanisms; F0AM; NOy; ion chromatography; PTR-ToF-MS1. Introduction
Nitrogen oxides (NOX), the sum of nitric oxide (NO) and nitrogen dioxide (NO2), cause the oxidation of photochemical radicals and volatile organic compounds (VOCs) in the troposphere [1,2]. NOy, is a collective abbreviation for atmospheric nitrogen oxides, consisting of NOZ and NOX. NOZ, nitrogen oxides excluding NOX, act as a reservoir for NOX [3]. NO2 and NO account for the largest composition of NOy, followed by nitrous acid (HONO), nitric acid (HNO3), and other NOZ species [4].
HONO is an important atmospheric compound because of its contribution to the reaction cycle of NOX and hydrogen oxide radicals (HOx) [4,5]. Photolysis of HONO in the near-ultraviolet spectral range (<320 nm, >400 nm) produces OH radicals and NO, regardless of the amount of ozone (O3) photolysis [6,7]. During the day, photolysis is a major reduction mechanism for HONO [1,8,9]. The OH radicals generated by the photolysis of HONO play a role in triggering the accumulation of O3 in the atmosphere, which substantially impacts the occurrence of photochemical smog in urban areas. At night, HONO is primarily known to be produced through the gas–liquid heterogeneous reaction of NO2. To investigate this reaction, studies have been conducted to determine the relationship between nighttime NO2 and relative humidity [10,11,12]. Despite the importance of HONO in atmospheric chemistry, detailed research on the reaction mechanisms of HONO in the atmosphere is lacking. This is because the yet-to-be-identified reactions during discharge and the homogeneous and heterogeneous reaction processes have complex effects on HONO concentrations [7,13,14].
Atmospheric HNO3 is formed through various pathways, primarily through the reaction of NO2 and OH during the day, and N2O5 and H2O at night, being the most important production reactions [15,16,17]. In the reduction pathway, aerosolization via a heterogeneous reaction plays a significant role [16,17]. Heterogeneous reactions are vital in both the stratosphere and the troposphere, contributing to the increase in secondary particulate matter concentration in the atmosphere [18,19]. HNO3 and sulfuric acid gases (H2SO4) undergo a heterogeneous reaction with ammonia gas (NH3), converting them into secondary ultrafine particles, namely ammonium nitrate (NH4NO3) and ammonium sulfate ((NH4)2SO4).
The aerosolization mechanism of HNO3 predominantly contributes to the reduction in the HNO3 concentration, along with other reduction mechanisms such as drying and wet deposition [19,20]. Studies have been conducted to investigate the conversion mechanisms of HNO3 into particulate matter and precursors [17,18,20,21,22]. However, further research is necessary to comprehensively explain and quantify the process of converting gaseous HNO3 concentration into the particulate phase.
Gil et al. (2020) used the parallel plate diffusion scrubber-ion chromatograph (PPDS-IC) system to measure the HNO3 concentrations in the atmosphere [14]. In addition, the OH generation rate of HNO3 was calculated using the Framework for 0-D Atmospheric Modeling (F0AM) model, a 0-D box model, by comparing photochemical pollution case days with non-case days according to O3 concentration. The research concluded that the accumulation of O3 proceeded by producing OH radicals via the photolysis of HNO3 in the early morning. However, this work focused on photolysis of HNO3, and further expanded studies on the mechanisms of production or formation of HNO3 are needed. Studies that can estimate the mechanism of formation and conversion reaction of HNO3 in detail are needed. Chou et al. (2009) evaluated the effect of O3 production on NOy, which has a major effect on the chemical reaction of O3 [3]. In this study, NOy was divided into NOX and NOZ, resulting in the O3 production efficiency of NOX, and the NOZ and O3 concentrations were positively correlated. Throughout the investigation, they assessed alterations in the composition ratio of NOZ, NO, and NO2. However, there is a gap in the existing literature as no previous studies have delved into the composition ratio and distribution characteristics of individual species, namely HONO and HNO3, N2O5, NO3, and peroxyacetyl nitrate (PAN), which collectively constitute NOZ. Hou et al. (2016) and Liu et al. (2021) measured the HONO concentration in an urban area during the summer months, and the concentration was evaluated along with various variable factors [11,12]. In addition, the formation and uptake reactions of HONO were analyzed in detail to estimate several emission sources and conversion reactions, including unknown sources of HONO. As such, there are many studies that have evaluated and estimated the different reaction mechanisms of HONO; however, studies on HNO3 are lacking. Watson et al. (1994) used the SEQUILIB model, a thermodynamic equilibrium model of the secondary aerosol, and simulated and compared the reduction in aerosol precursors in the winter months in Arizona with measurement results [17]. In addition, an equilibrium equivalence concentration curve of nitrates in the particulate component that varied with the humidity levels was presented. However, the application of these models was limited to Arizona, and changes in equilibrium with temperature levels were not considered. Therefore, it is necessary to develop a mechanism that can explain the aerosol conversion process of HNO3 more closely, and if it can be applied to the gas–particle equilibrium model, it will be a more powerful research tool.
In this study, the concentrations of NOX and intermediate products of particulate matter (HONO and HNO3) were measured. The production and conversion mechanisms of the pollutants were also analyzed. Seasonal differences were examined by comparing concentrations in winter and summer. The characteristics of the relationship between HONO, NO2, and relative humidity, essential in the initial photochemical reactions of diurnal patterns, were investigated. Furthermore, to focus on the effect of changes in the concentrations of HONO and OH radicals on O3 in the atmosphere during summer, when photochemical reactions occur actively, the F0AM model was used for a quantitative evaluation of the production and reduction reactions of HONO and HNO3.
2. Materials and Methods
2.1. Sampling Site and Duration
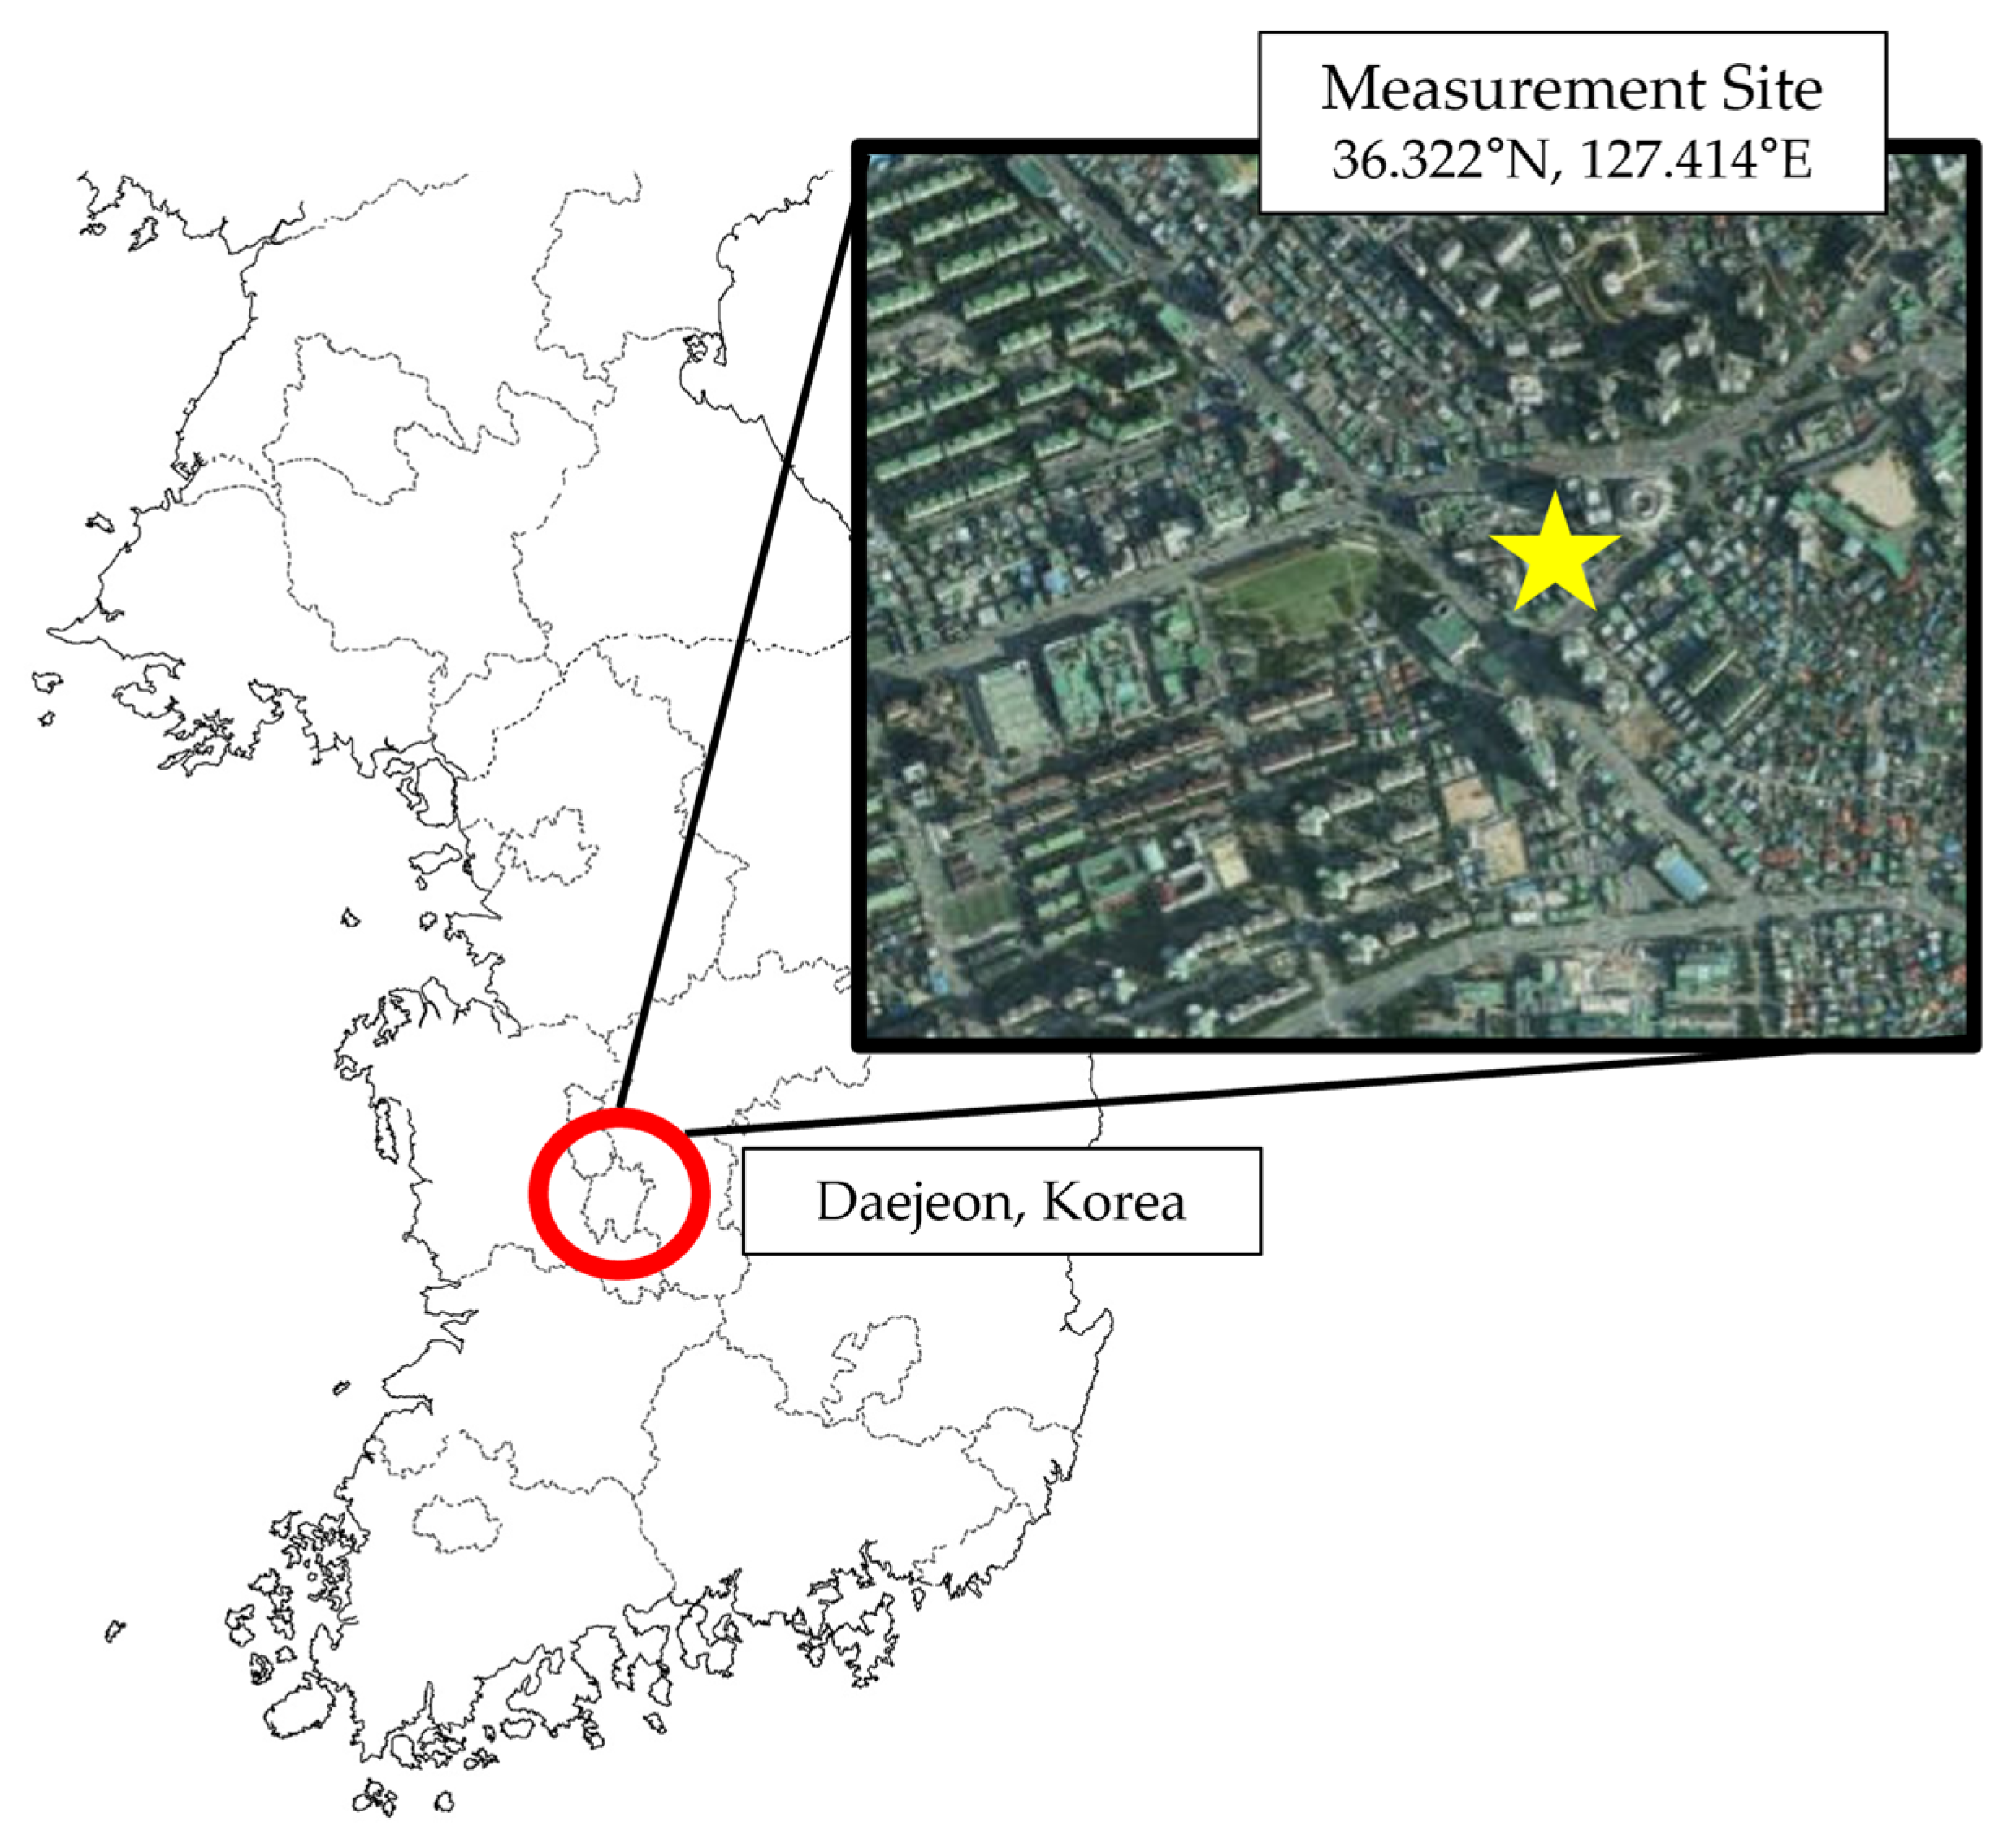
Field measurements were performed at the Central Intensive Air-monitoring Site in Jungangro 12, Junggu, Daejeon, Republic of Korea (36.322° N, 127.414° E). The site is located near an expressway that is severely affected by vehicle traffic and biomass-burning activities, including the incineration of agricultural waste, frequently occurring in the surrounding area (Figure 1). Measurements were carried out for 23 days from 7 to 29 January 2021, for the winter season and 28 days from 18 May to 16 June 2021, for the summer season.
2.2. PPDS-IC System
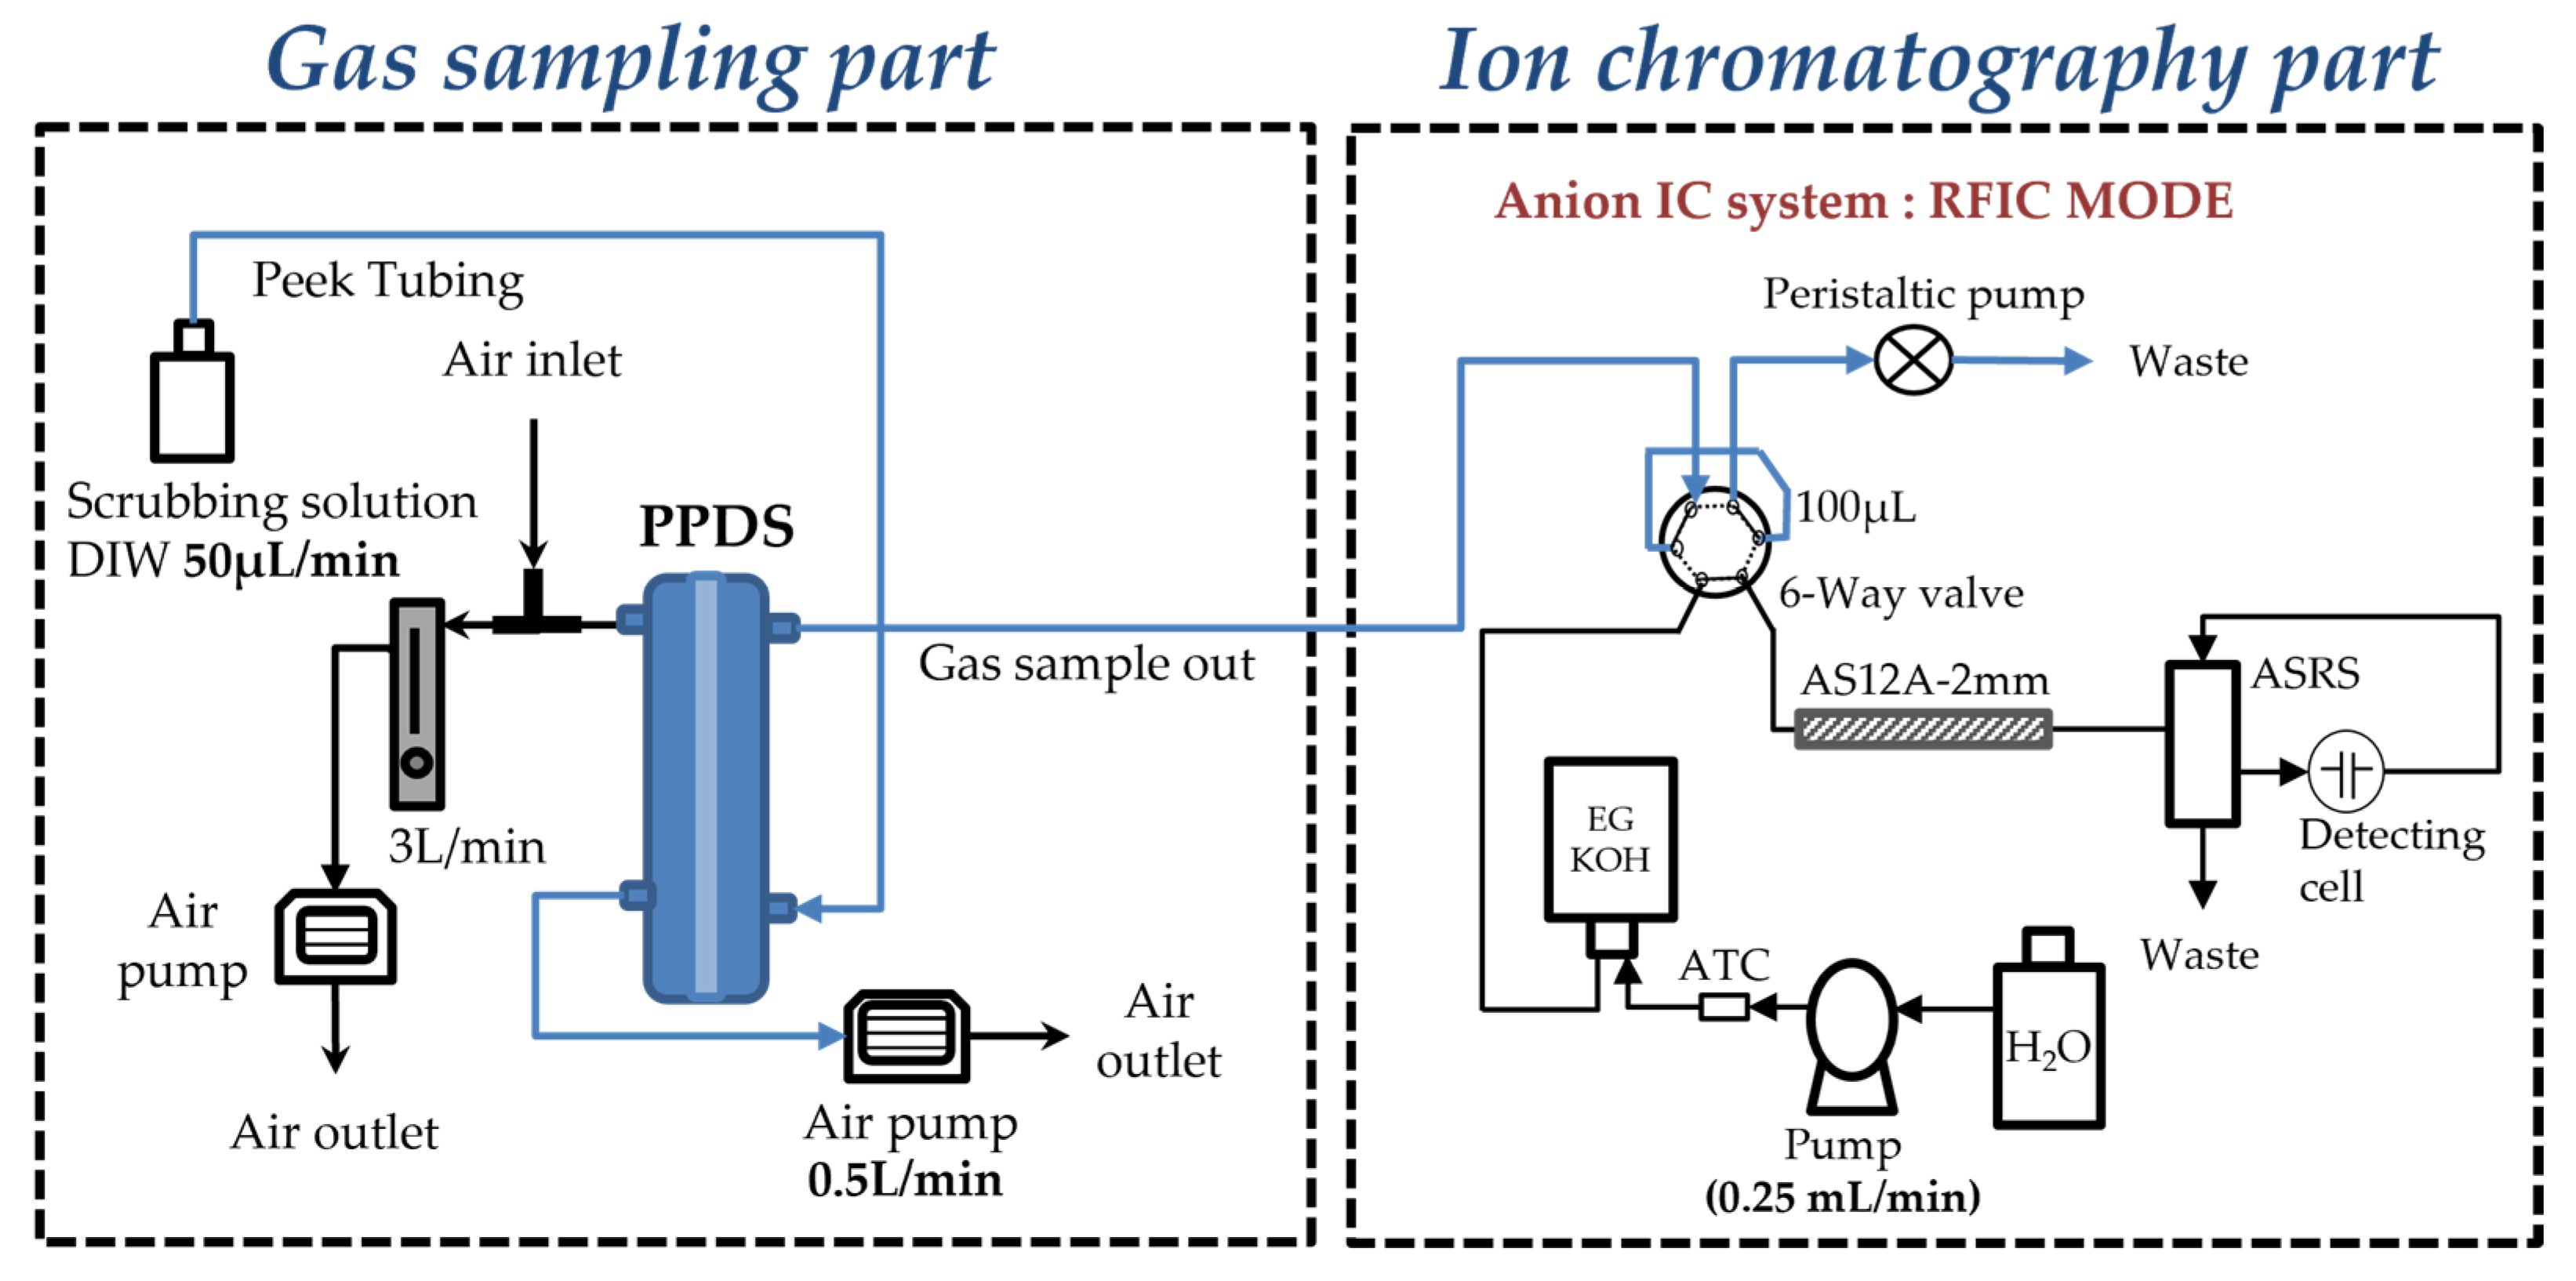
In this study, ambient air was analyzed using the PPDS-IC method, which is schematically shown in Figure 2. A membrane positioned between the liquid and air channels, preventing the passage of particles from the air into the liquid channel. Instead, gas molecules soluble in water pass through the membrane, dissolve in the distillation water flowing through the liquid channel, and the resulting sample is then transported to the IC for measurement [23].
The absorbent flowed through the channel at a constant flow rate of 50 μL/min, and the absorbent solution was injected every hour using the sample autoinjector of IC systems. Cations and anions were eluted with 10 mM methane sulfonic acid (MSA; J.T. Baker, Phillipsburg, NJ, USA) and 40 mM KOH (J.T. Baker, Phillipsburg, NJ, USA), respectively. An IC system analyzer (CD20, DIONEX, Sunnyvale, CA, USA) operated using reagent-free ion chromatography with an eluent generation mode. To eliminate bubbles that could arise due to temperature fluctuations in deionized water during measurement, continuous purging was performed using helium gas (JC GAS, Gyeonggi, Republic of Korea). The PPDS-IC measurement method details are outlined by Kim et al. (2021) [24], and the IC conditions for the measurements are provided in Table 1.
2.3. Box Model (F0AM)
Whereas direct measurements of OH and HO2 radicals and NO3, N2O5, and PAN were not performed in this study, the F0AM was used to calculate the mixing ratios of these precursor species. The F0AM is an open platform for simulating atmospheric chemistry [25]. The F0AM is mainly used to quantify the production and loss of reactants in chemical reactions involving numerous chemical and physical processes in the atmosphere [26]. The 0-D box model provides simplicity and ease of use but has limitations. It excludes the horizontal and vertical transport of atmospheric matter, and its reliability is not absolute. The model does not offer a comprehensive quantitative evaluation of physical conversion processes, such as aerosol formation or deposition. The F0AM is written in MATLAB and has the option of selecting a chemical reaction based on several mechanisms, including the Master of Chemical Mechanism (MCM), the Carbon Bond mechanism, and the Regional Atmospheric Chemistry Mechanism. This study employed MCM v3.3.1, utilizing a 1 h average of the observed concentration and meteorological dataset [27,28]. Detailed chemical and photochemical reaction data for this mechanism can be accessed on the MCM website (https://mcm.york.ac.uk/MCM/ (accessed on 22 February 2024)). Only the summer data of the precursors were simulated using the F0AM because photochemical reactions occur more actively in summer.
2.4. PTR-ToF-MS
The key parameters in atmospheric photochemical reactions with NOX are the VOCs. A proton transfer reaction time-of-flight mass spectrometer (PTR-ToF-MS 1000) (IONICON, Innsbruck, Austria) was used for VOC observations. The biggest advantage of the PTR-ToF-MS is that atmospheric VOCs can be analyzed in real time without pretreatment. The detailed operation method used in this study has been described in a previous study [29,30,31]. In this study, calibration was conducted using standard gas before use and was used for measurement after a reliability test was performed [30].
2.5. Other Data
Meteorological data (temperature, relative humidity, pressure) were obtained from the Daejeon Meteorological Observatory automatic observation system, which can be accessed from the Korea Meteorological Administration website. (https://data.kma.go.kr/cmmn/main.do (accessed on 22 February 2024)). In addition, SO2, NO, NO2, CO, and O3 were not measured directly; however, observational data from the same period provided by an air quality monitoring station (situated approximately 2.3 km away from the measurement site) operated by the National Institute of Environment and Research were used.
3. Results and Discussion
3.1. Data Overview
The mixing ratios of HONO in winter and summer were 2.59 ± 1.91 ppbv (n = 490) and 1.8 ± 0.76 ppbv (n = 687), respectively. Those of HNO3 in winter and summer were 0.72 ± 0.61 ppbv (n = 375) and 0.1 ± 0.03 ppbv (n = 686), respectively. The observed mixing ratio of O3 at the air quality monitoring station was 18 ± 16 ppbv (n = 525), and that of NOX was 56 ± 55 ppbv (n = 522). The O3 and NOX mixing ratios in summer were 44 ± 18.3 ppbv (n = 687) and 15.9 ± 8.5 ppbv (n = 687), respectively.
Table 2 summarizes the mixing ratio distribution of gaseous matter observed during the measurement period. The average mixing ratio of HONO in winter was approximately 1.43 times higher than that in summer, and that of HNO3 in summer was approximately 7.2 times higher than that in winter. The levels of mixing ratio of HONO in this study were higher than those observed by Chang et al. (2008) in Gwangju (0.5 ppbv in spring) and those measured by Gil et al. (2020) in Seoul (0.28 ppbv in summer) [14,32]. Ahn et al. (2013) measured HNO3 in Seoul as 0.83 ppbv, which is higher than that in this study at Daejeon in winter (0.72 ppbv) but lower than that in summer (0.1 ppbv) [33]. The difference between the mentioned air pollutants may be due to the seasonal variability of anthropogenic load and the difference in the sources of pollutants themselves.
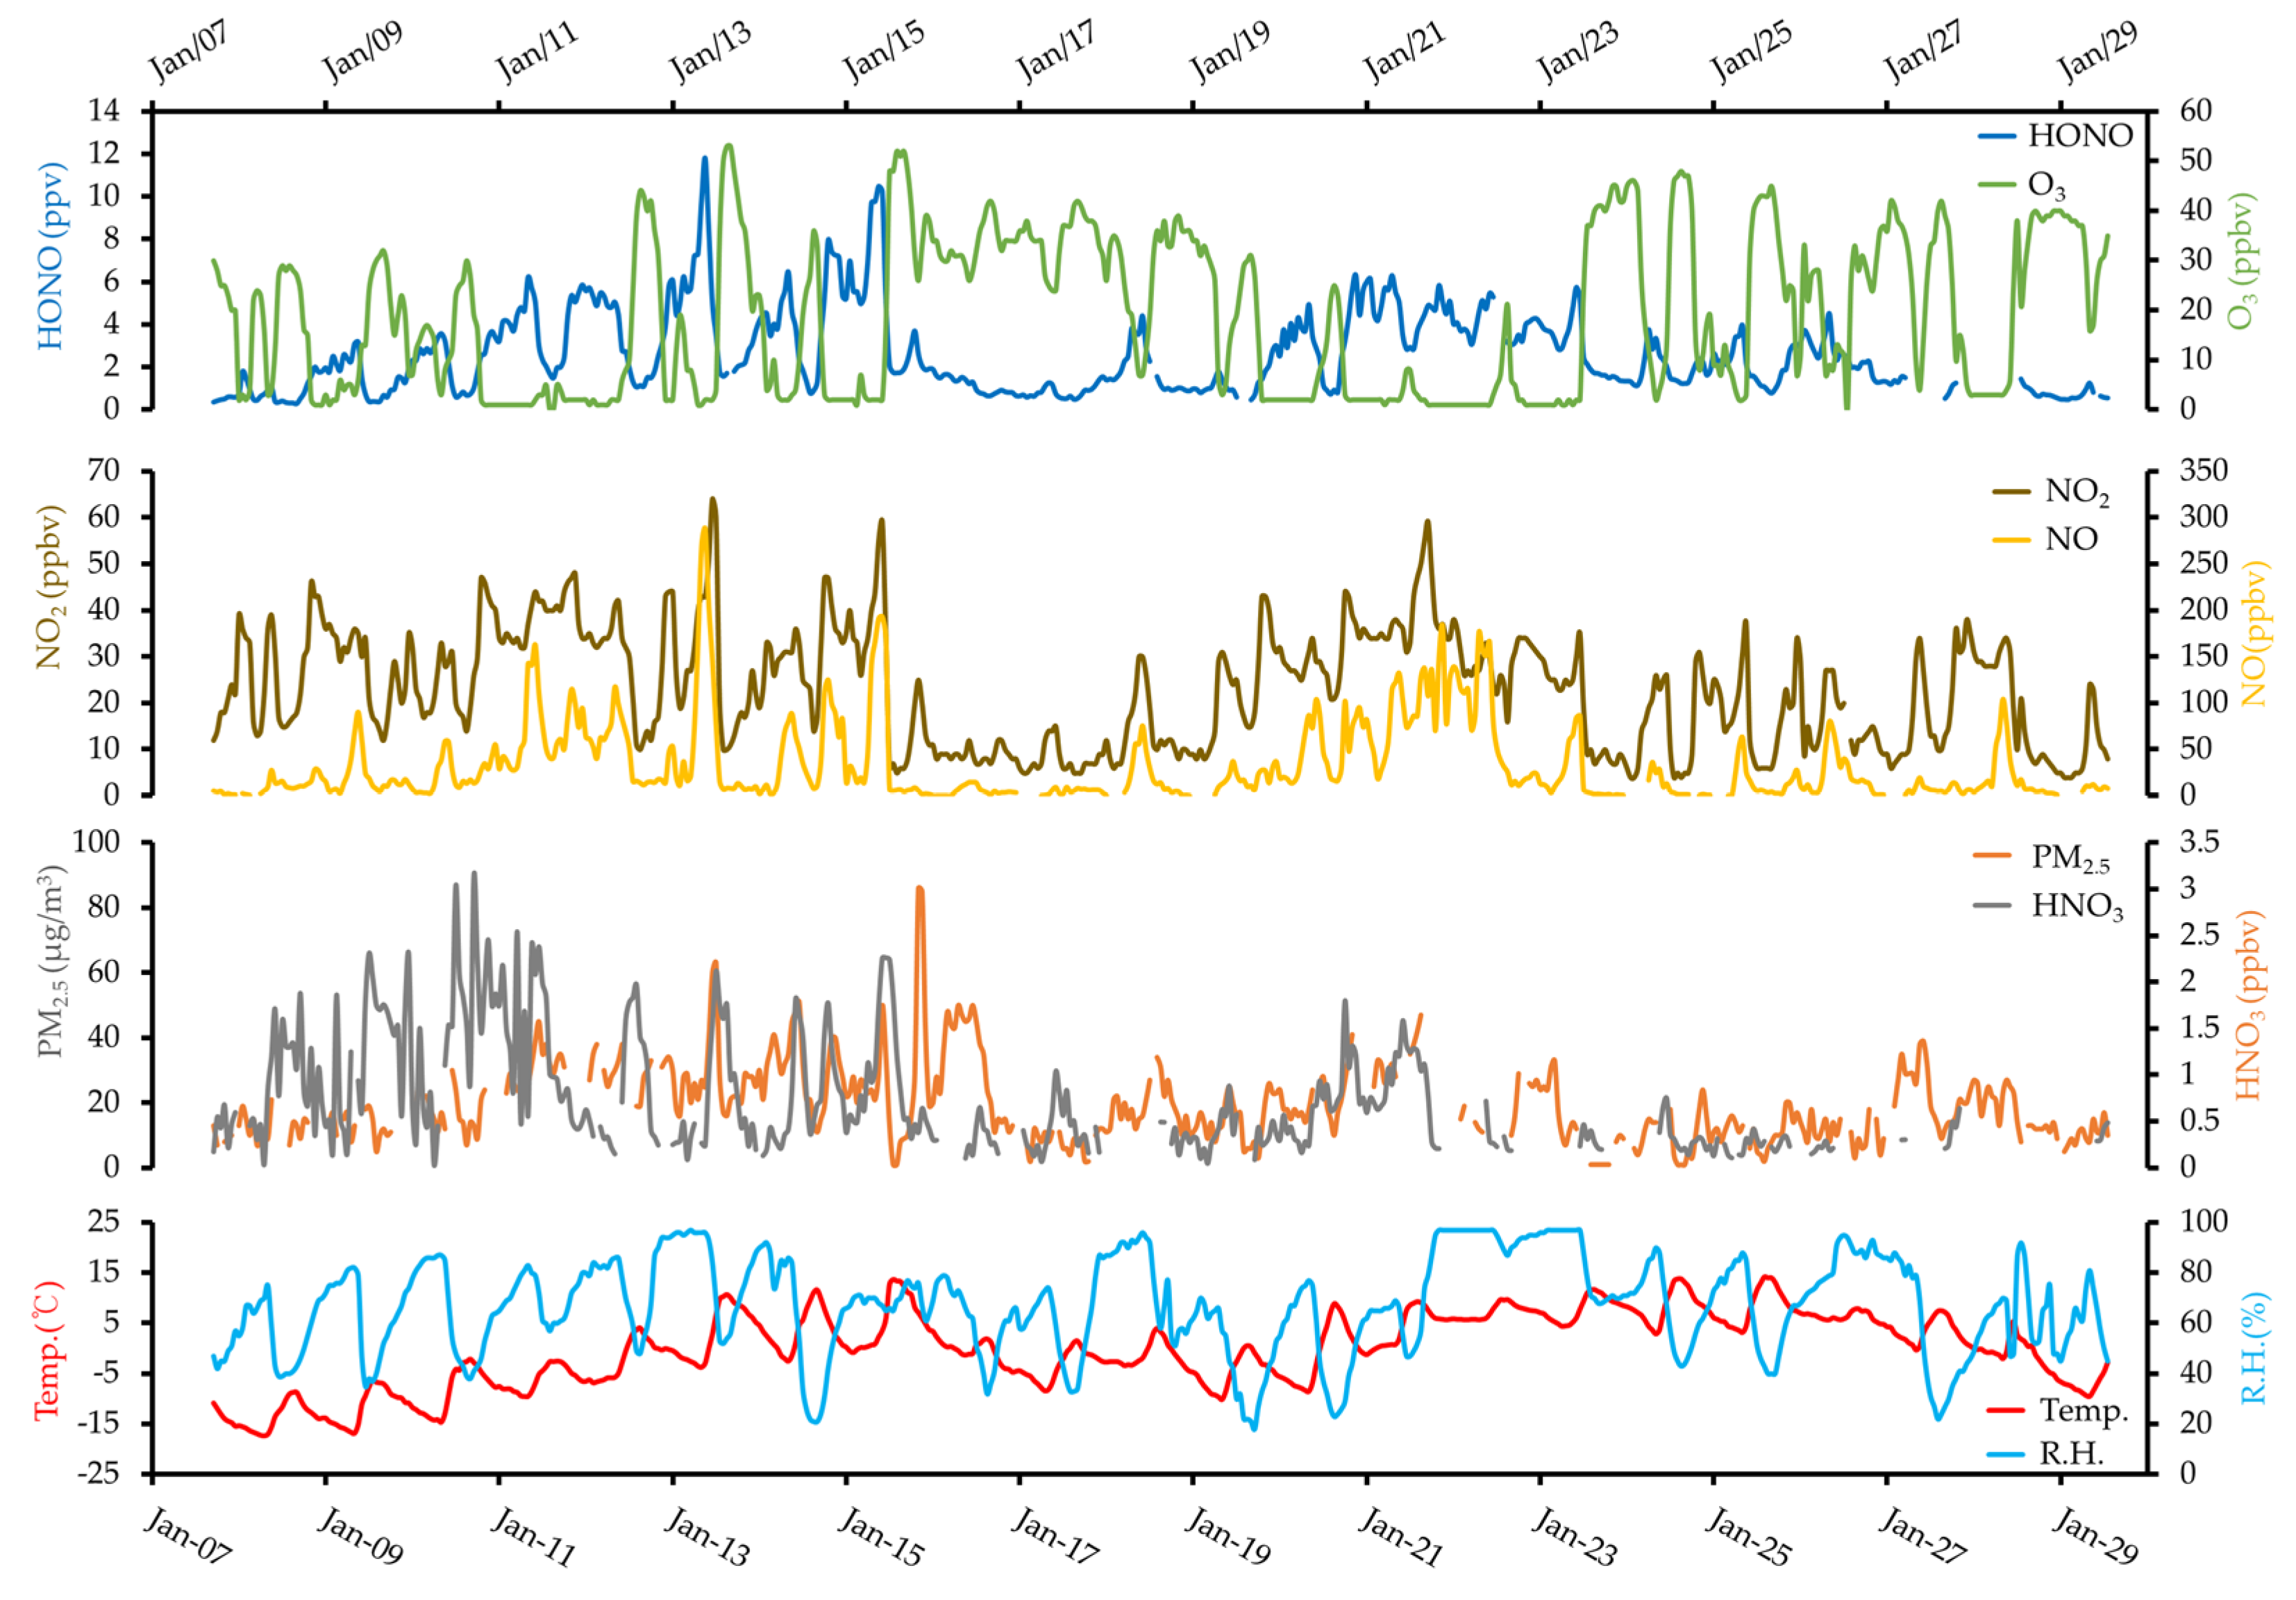
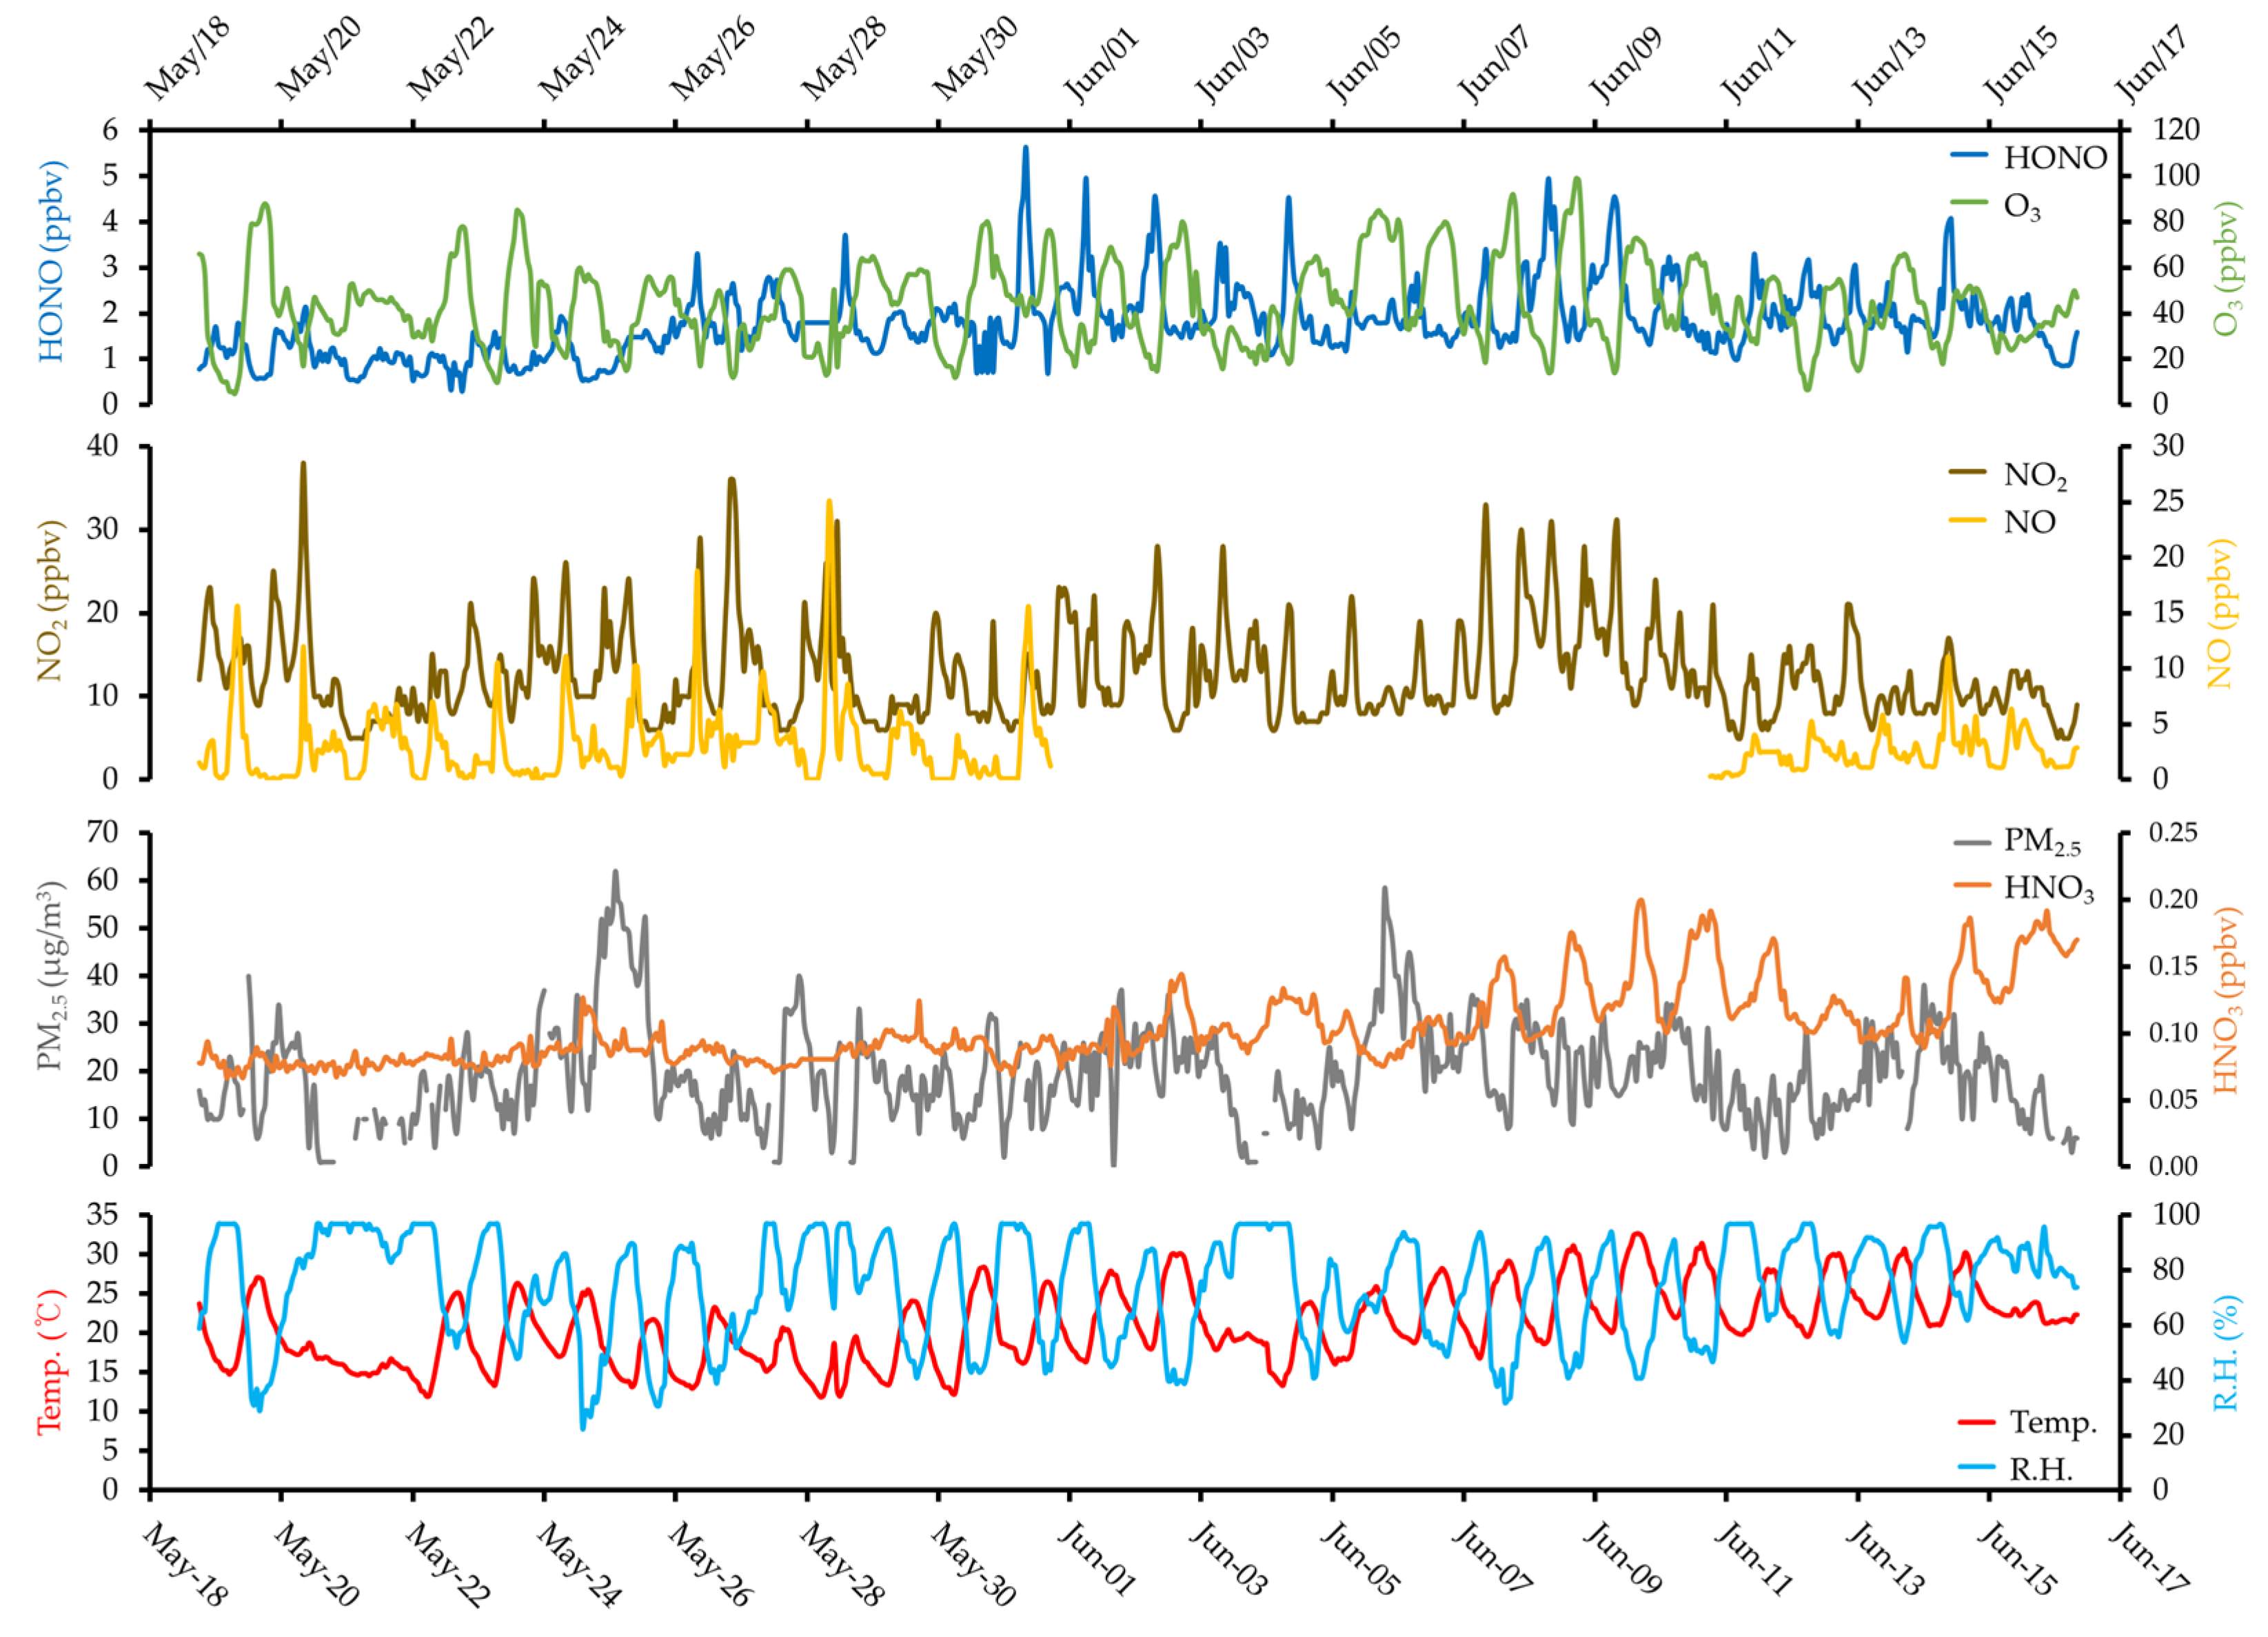
Figure 3 and Figure 4 represent the time-series distribution for the entire measurement period in winter and summer, respectively. There was an absence of data because of the inspection of the measuring instrument and data below the detection limit. In winter, high HONO and O3 concentrations were observed between 13 and 14 January. From 15 to 16 January, PM2.5, HONO, HNO3, and O3 exhibited high concentrations. In summer, the PM2.5 concentration was severe from 24 to 25 May; however, the measured mixing ratios of HONO and HNO3 were relatively low. Diurnal distributions of HONO and O3 were clearly observed. The average NO/NO2 ratio in winter (1.4) was approximately seven times higher than that in summer (0.2).
The heightened concentrations of air pollutants in Daejeon during winter, compared to summer, may be attributed, in part, to prevailing westerly winds facilitating the transport of emissions from major industrial facilities and power plants located to the northwest. This geographical arrangement, coupled with seasonal weather patterns, likely contributes to an increased impact on air quality during winter in the region.
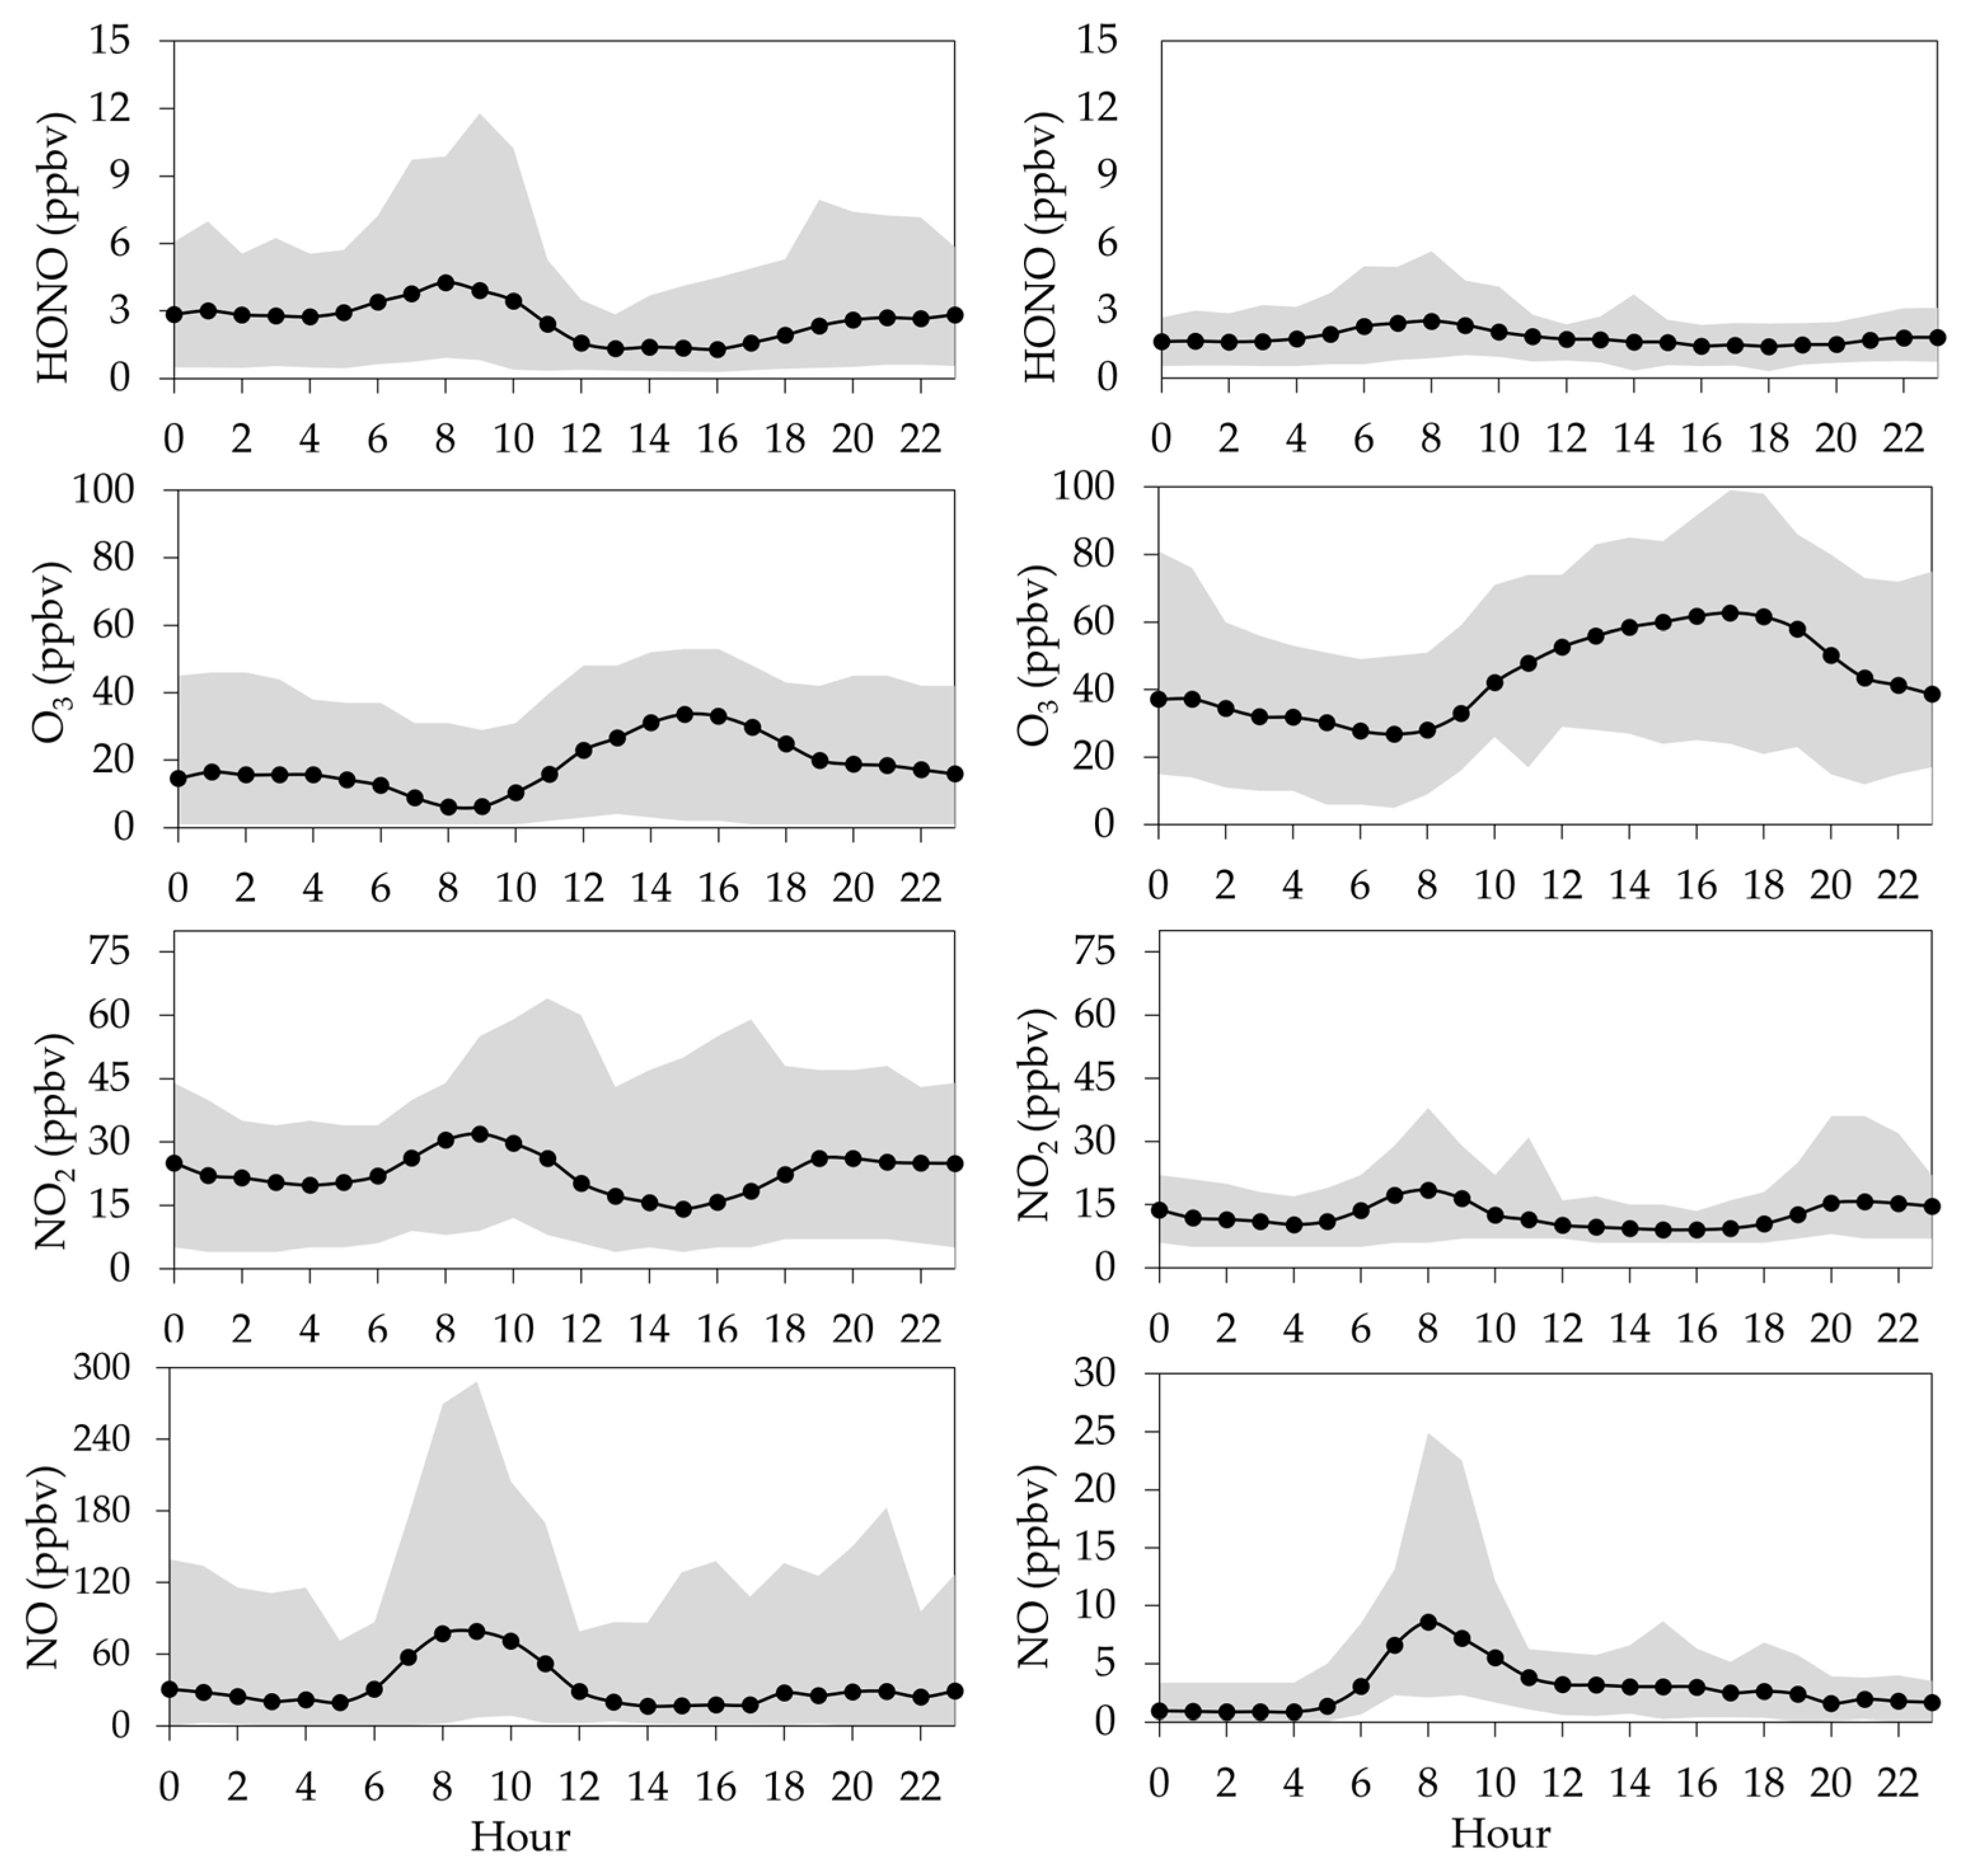
Figure 5 illustrates the diurnal variations in the average concentrations of the measured pollutants during winter and summer. The HONO concentration in both seasons sharply decreased from 7 to 8 a.m. because of photochemical reactions. At sunrise, O3 concentrations exhibited a rapid increase. NO and NO2 showed high concentrations during the morning hours, indicating the influence of nearby vehicular emission sources. HNO3 increased in the morning and gradually decreased after noon during winter, whereas during summer, it increased until the evening and decreased after sunset.
3.2. Zero-Dimensional Box Model
In this study, the F0AM model was utilized to analyze the specific chemical reactions of HONO and HNO3, focusing on the summer season when photochemical reactions particularly active. As substances such as OH radicals, HO2, NO3, N2O5, and PAN were not the targeted measurements, a 0-D box model, namely the F0AM model, was employed to quantitatively identify the concentrations of these substances present in the atmosphere during the measurement period [25,28]. Incorporating the chemical reaction mechanism of MCM v3.1.1, the model accounts for a comprehensive set of reactions governing the behavior of HONO and HNO3. MCM v3.1.1 provides a detailed framework for understanding the intricacies of atmospheric chemistry, assisting in the quantitative analysis of these compounds. The applied data, encompassing hourly averaged datasets (including meteorological data), further enhances the model’s ability to simulate and interpret the atmospheric processes during the study period.
To acquire VOC data for simulating the F0AM model in this study, VOC measurements were conducted using a PTR-ToF-MS (IONICON) at the same measurement site. The collected data were then applied to the F0AM model. The selection of VOC substances for model calculations were based on their measured concentrations and maximum incremental reactivity (MIR) values. MIR is a metric developed by the California Air Resource Board that quantitatively assesses the impact of VOCs on ground-level O3 [34,35,36]. Substances with a product of the overall average concentration and the MIR value of the measured VOC substances ≥ 1 were chosen and incorporated into the model. The selected VOC species are presented in Table 3.
The model employed in this study simulated the concentrations of various precursors in an actual atmospheric environment. Table 4 represents a comparison between the observed concentrations of the precursors and air pollutants and the concentrations simulated using the model. Root mean square deviation (RMSD) served as an index to assess the accuracy of the model estimates. The smaller RMSD value indicates a better agreement between the model calculations and the measured value. The RMSD value was generally 1 or less for most VOCs, except formaldehyde. Inorganic species like HONO, O3, and NOX, exhibited relatively high RMSD values, highlighting a limitation of the F0AM model designed for the photochemical simulation of VOC species.
3.3. Simulated HOX and NOZ Species
HOX is a term collectively encompassing the OH and HO2 radicals, which play a significant oxidizing role against VOCs, NOX, O3, and other atmospheric substances [35,36]. The quantities of NOy substances, including N2O5, NO3, and PAN, were calculated concurrently with those of the HOX radicals. N2O5 and NO3 are nitrogen oxides intricately involved in the formation of HNO3, while PAN is a nitrogen oxides component contributing to photochemical smog [3,4,15].
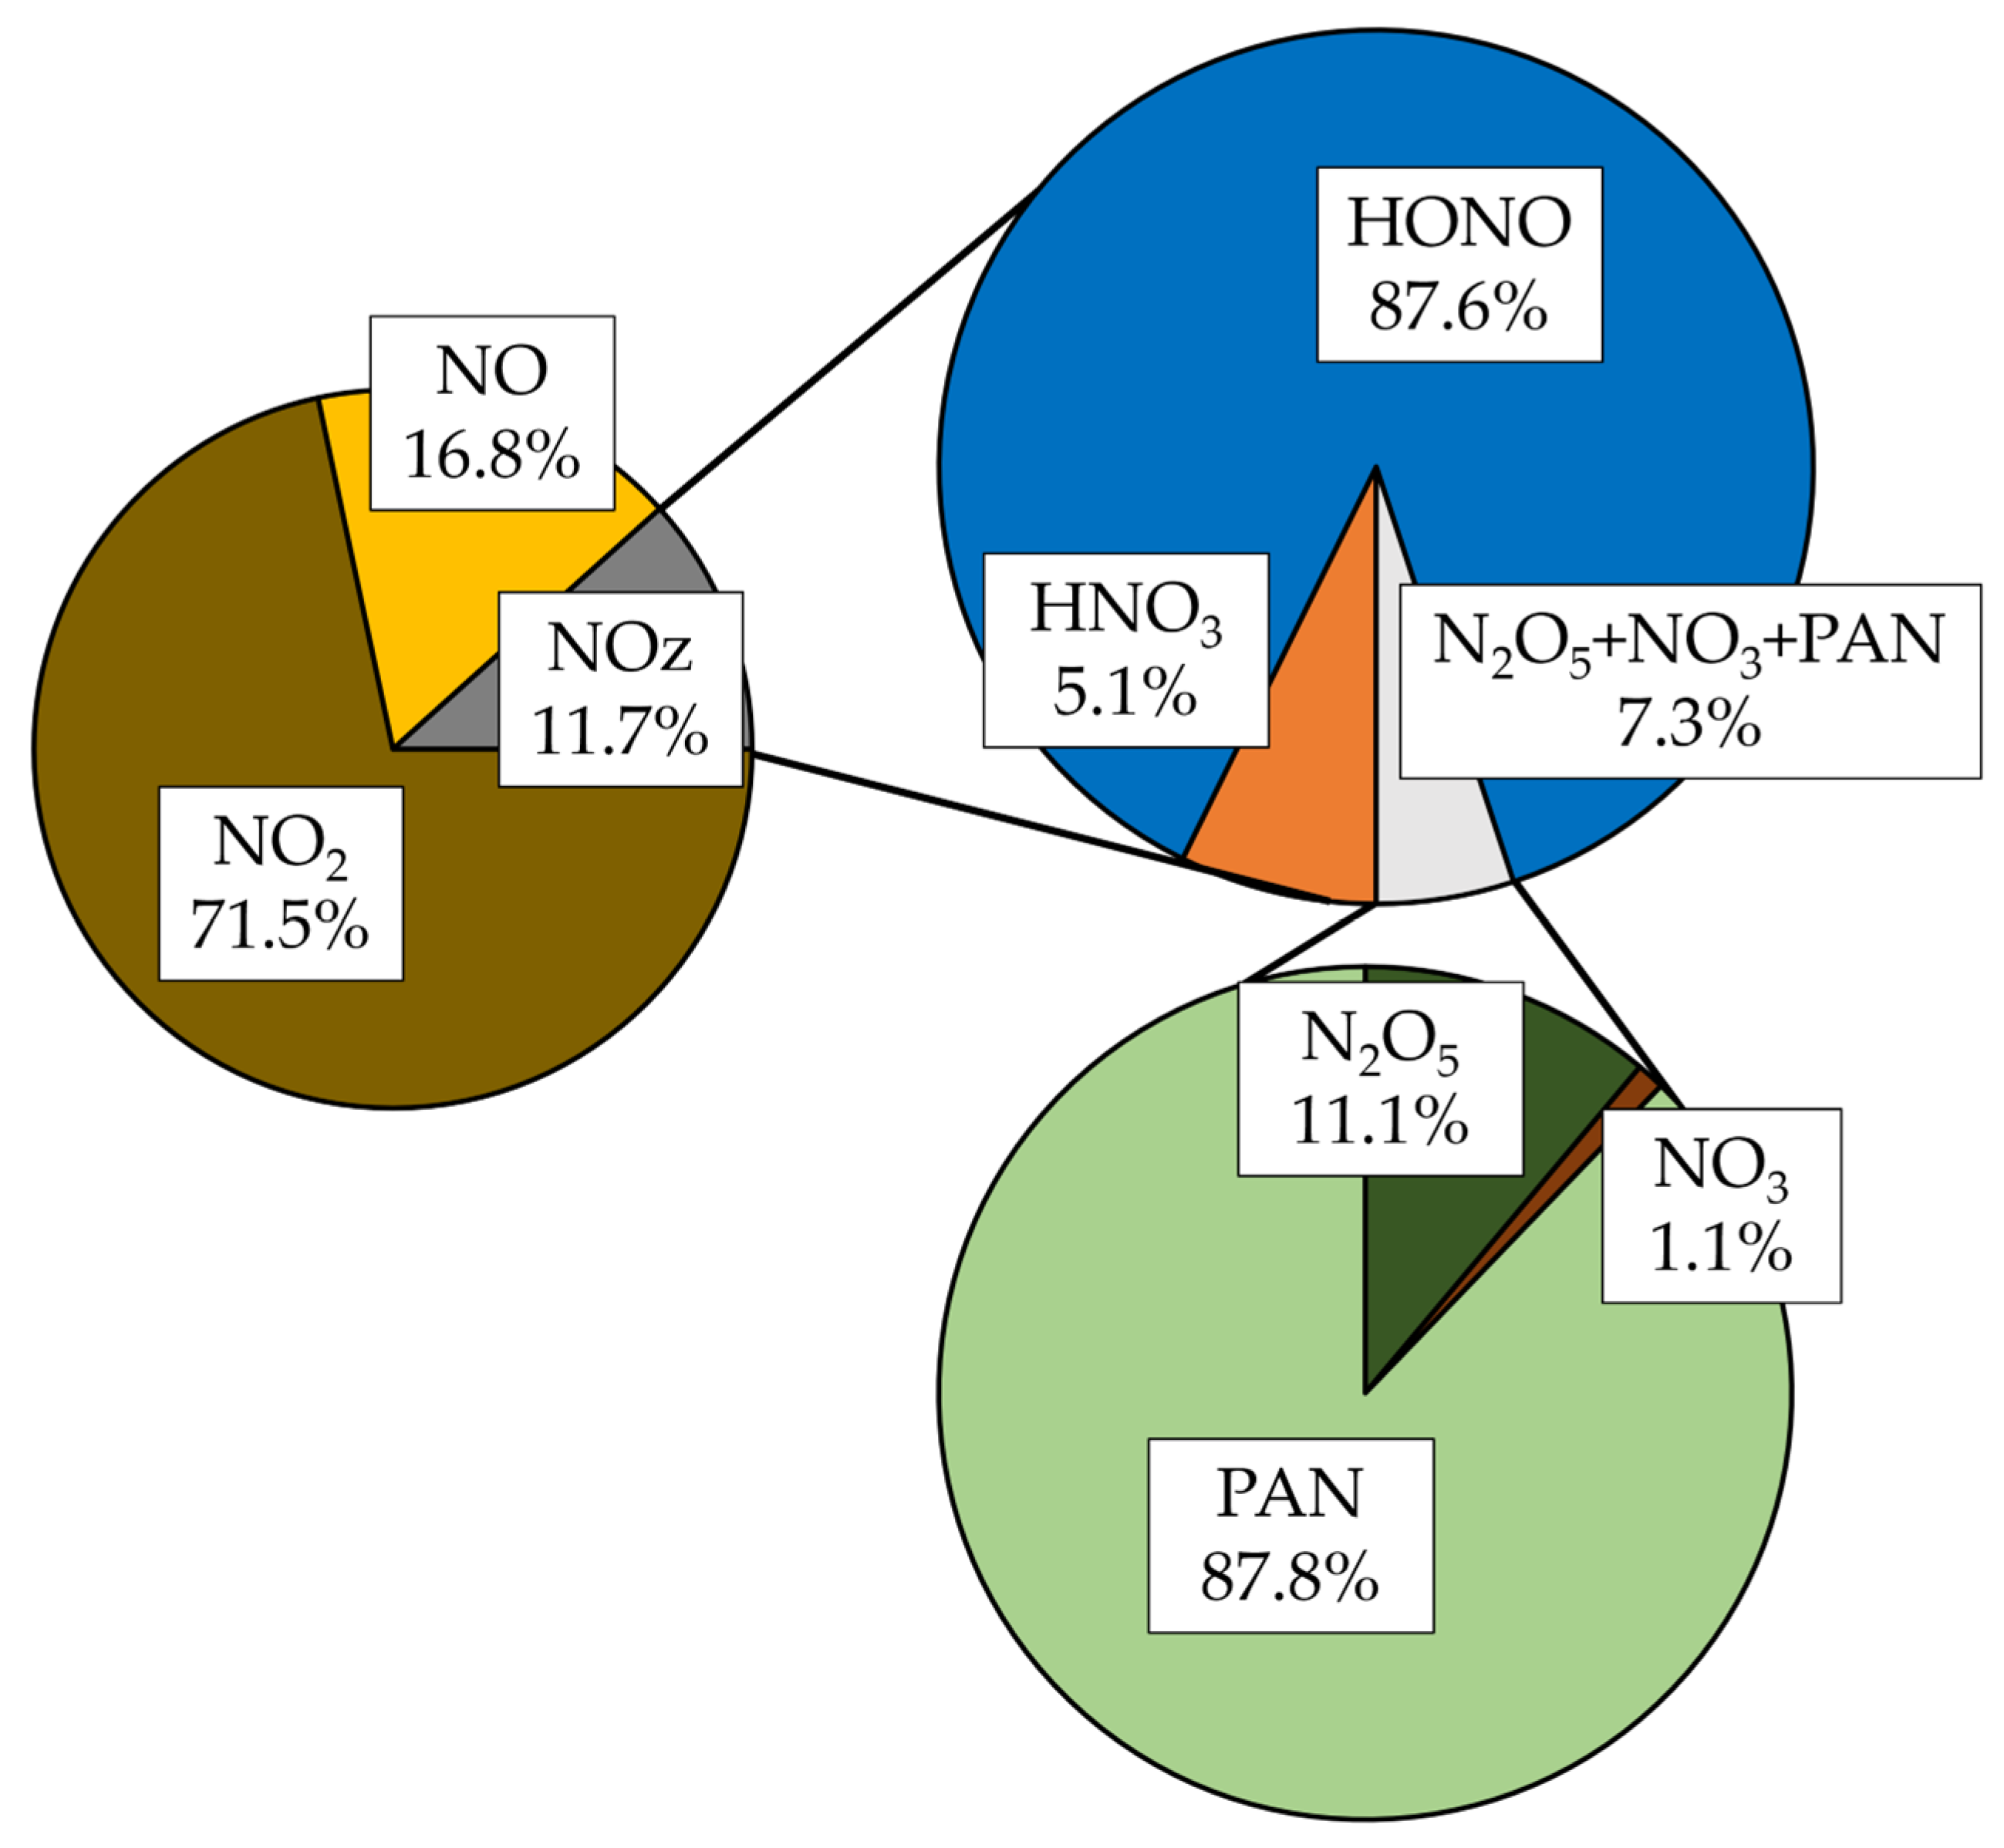
The average OH and HO2 concentrations in the summer atmosphere, calculated using the F0AM model, were 1.1 ± 0.25 × 10⁶ molecules cm−3 (n = 687) and 1.4 ± 0.95 × 10⁸ molecules cm−3 (n = 687), respectively. The OH radical concentrations are simulated at a lower level than the actual measured values in the other research [37,38,39]. However, according to previous research that used modeling techniques to calculate global OH radical concentrations, the reported average range of OH concentrations is 5.6–14.6 × 10⁵ molecules cm−3 [40]. Therefore, the simulated OH concentrations in this study are reasonably calculated in comparison. The N2O5, NO3, and PAN concentrations in the atmosphere, calculated using the model, were 17 ± 9 pptv (n = 687), 1.6 ± 1.5 pptv (n = 687), and 0.13 ± 0.07 ppbv (n = 687), respectively. Figure 6 shows the composition ratio of NOX to NOZ and the NOZ species (HONO, HNO3, N2O5, NO3, and PAN). Among NOy, NO2 accounted for the largest proportion at 71.7%, followed by NO and NOZ at 16.8% and 11.7%, respectively. For NOZ, HONO accounted for 87.6% of the total. N2O5, NO3, and PAN accounted for only 7.3% of NOZ. The HNO3 concentration in the atmosphere is significantly lower than that of HONO.
3.4. Mechanisms of HONO Production and Conversion
Despite recent studies on the production and loss mechanisms of HONO, there are still unidentified sources of HONO emissions [8,11,12]. Therefore, it was necessary to incorporate an additional unknown source of HONO emissions (Punknown) in this study. This source was estimated based on the variations in the measured HONO concentration over time, attributed to several reactions, including the reaction between OH radicals and NO and the photolysis of HONO.
Then,
δ[HONO]/δt represents the HONO concentration of change over time (ppbv hr−1). P and L with the reactants written in subscripts represent the budget (in ppbv hr−1) of HONO produced or lost (i.e., sinks), respectively. Pdirect corresponds to the direct emission rate of HONO from automobile engine combustion [41].
Phet refers to the HONO concentration converted from NO2 through heterogeneous reactions and can be estimated by multiplying the CHONO and NO2 concentrations [42]. The CHONO for calculating the budget of HONO converted from NO2 can be calculated as in the following equation [43,44]:
Research on CHONO, a coefficient for calculating the budget of HONO converted from NO2, has been continuously conducted, and the average value of CHONO calculated in this study was 0.011 ± 0.021 hr−1, which did not differ substantially from that in previous studies [12,41,42]. JHONO represents the numerical coefficient of the fractional photolysis of HONO and is expressed in reciprocal seconds (s−1). As J is dependent on the solar zenith angle (SZA) at the time of measurement, its application is limited to daylight hours. In this study, the average JHONO value was 0.0019 s−1, with the maximum recorded value during the measurement period reaching 0.0024 s−1.
In the case of the mechanisms leading to the decrease in HONO, Lphoto corresponded to the decrease through photolysis, whereas diffusion or vertical/horizontal physical transport and deposition were not considered due to their minimal contributions.
Changes in the HONO concentration over time were quantified by multiplying the reaction rate coefficients corresponding to each reaction by the concentrations of the reactants. Table 5 summarizes the reactions and reaction rate coefficients of HONO used in this study.
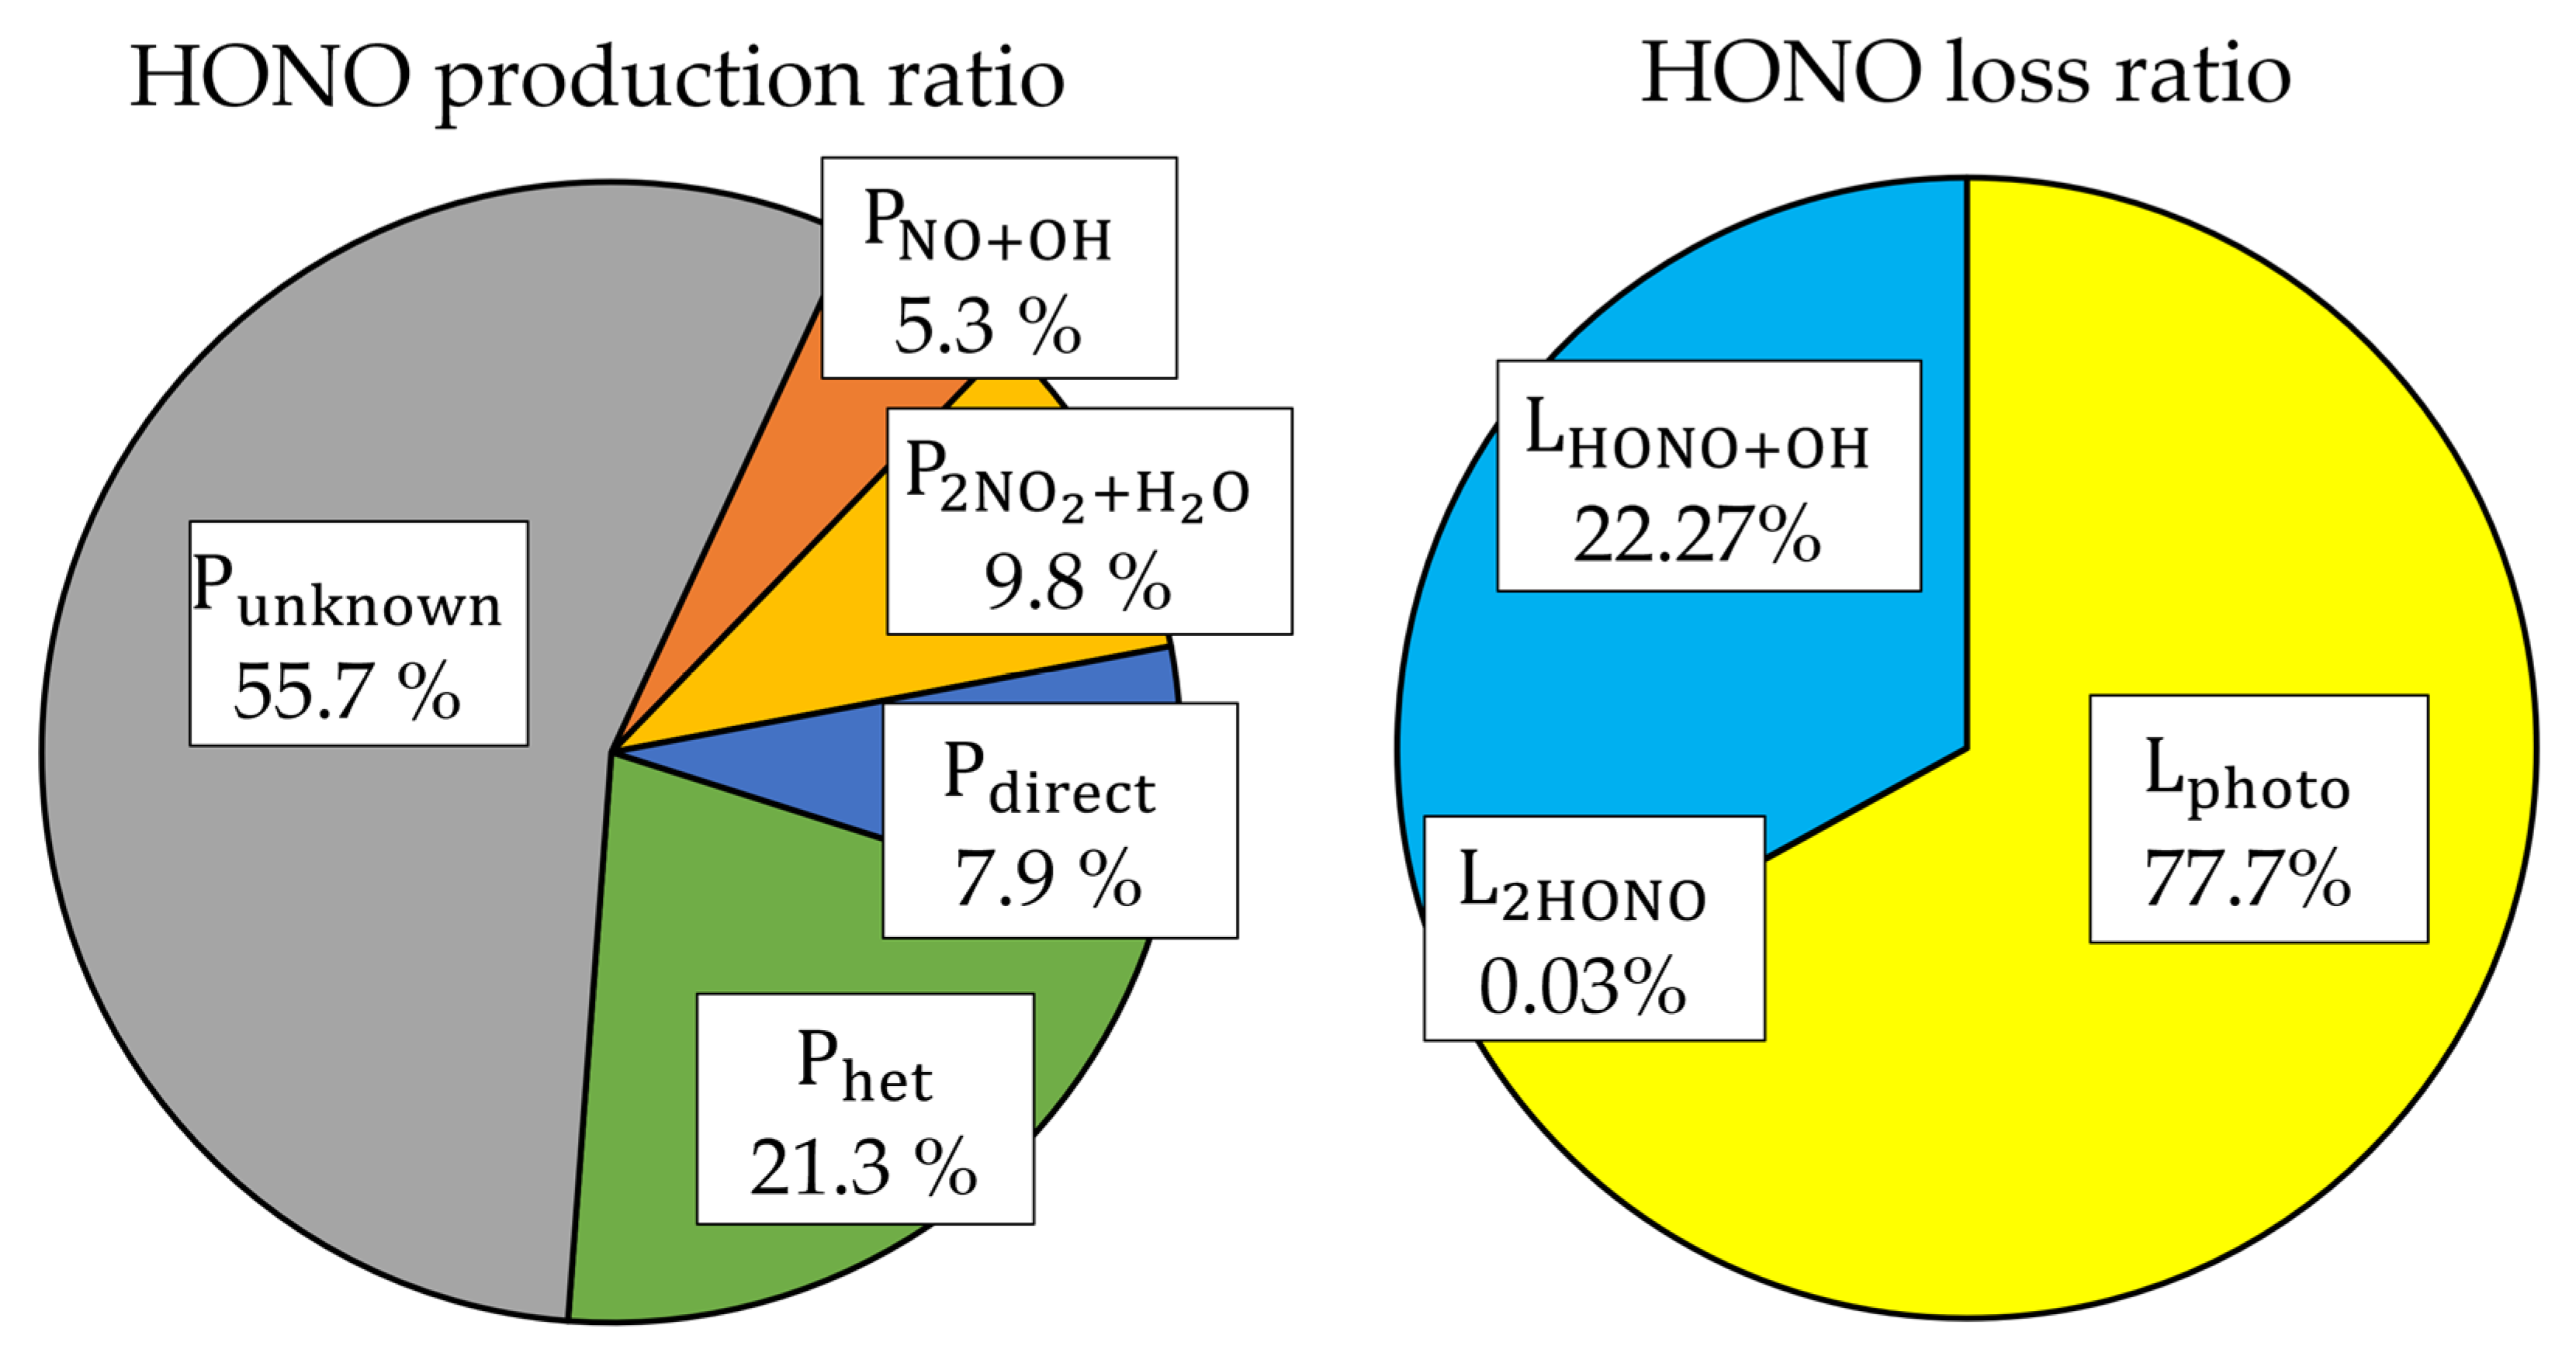
Figure 7 illustrates the calculated time-dependent changes in HONO concentration and the processes of production, conversion, and loss of HONO using reaction coefficients. The results revealed that the unknown source of HONO emissions (Punknown) constituted 55.7% of the total HONO production. Among the various HONO production processes, the heterogeneous reaction pathway (Phet, 21.3%) was the most dominant, excluding the unknown source. The direct emissions (vehicle exhaust from engine combustion) accounted for 7.9%. The combined production from the two considered reaction equations was approximately 15%.
Regarding the loss of HONO, photolysis of HONO (Lphoto) was the dominant mechanism, constituting 77.7%, followed by LHONO+OH at 22.3%. The reduction in the HONO budget due to L2HONO was negligible.
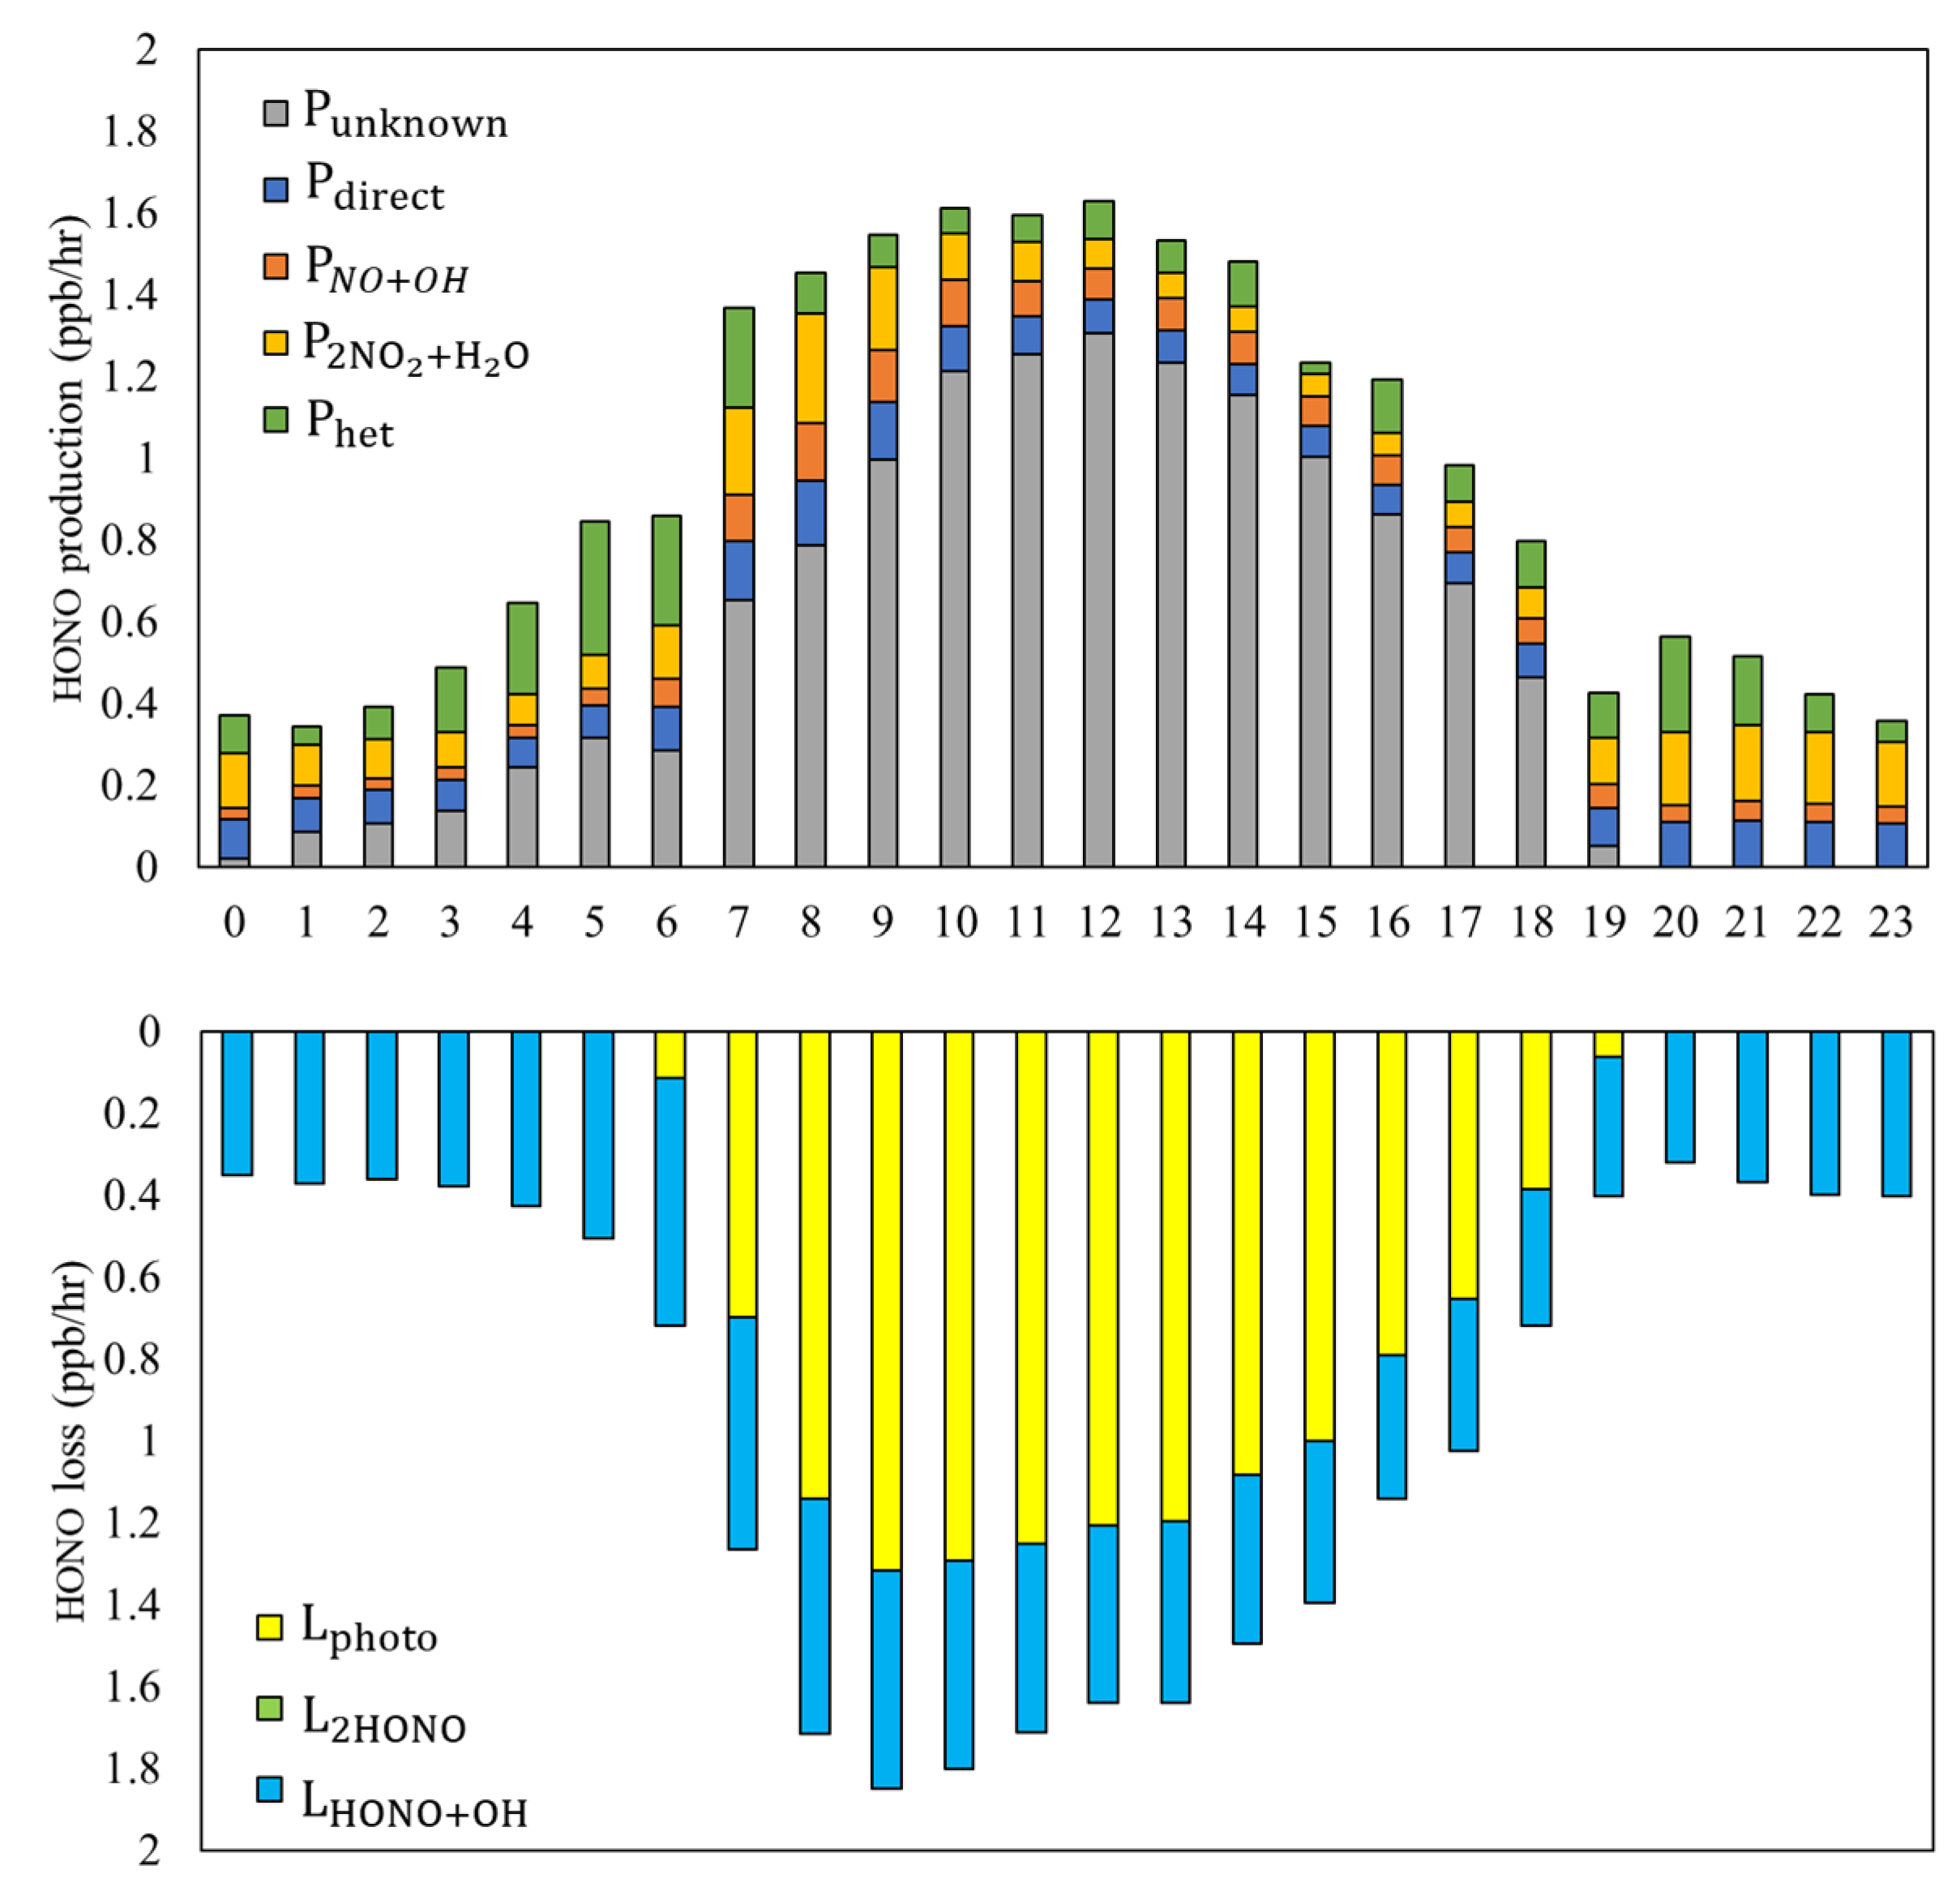
Figure 8 illustrates the diurnal variations in HONO production and loss. HONO production exhibited a significant increase in the morning, with the primary source identified as an unknown emission source. During the morning rush hour, the contribution of direct emissions increased due to elevated NOX emissions. However, after sunset, the contribution of the heterogeneous reaction pathway (Phet) significantly increased.
HONO loss exhibited an increasing trend in photolysis-induced HONO loss after sunrise; however, the reduction rate decreased over time as the SZA decreased. The second-largest loss was attributed to the gas-phase reaction between HONO and OH radicals (LHONO+OH), where the OH radicals produced from the photolysis of HONO reacted with another HONO molecule, leading to the reduction in HONO. This reaction is presumed to be dominant at night, contributing to the decrease in atmospheric HONO concentration.
3.5. Mechanisms of HNO3 Production and Conversion
HNO3 is produced through various pathways, some of which are more important than others. However, the decrease in HNO3 is primarily due to heterogeneous reactions (gas-to-liquid) rather than homogeneous reactions between the gases [18,49]. The most important mechanism for this decrease is the aerosolization reaction, in which NH4NO3 is produced from the reaction between ammonia in the atmosphere, and HNO3 is converted into aerosols [49].
In this study, the change in HNO3 gas concentration over time was estimated using various mechanisms. The remaining change in concentration was attributed to the amount of HNO3 that decreased due to aerosolization, as well as through dry and wet deposition.
Then,
δ[HNO3]/δt represents the quantity of change in HNO3 concentration per unit time (ppb hr−1), and P and L represent the budget (in ppb hr−1) of HNO3 that is produced or lost through reactions as several equations summarized in Table 6. Similarly to the calculation of HONO, these equations were used to estimate the differences in HNO3 concentration over time.
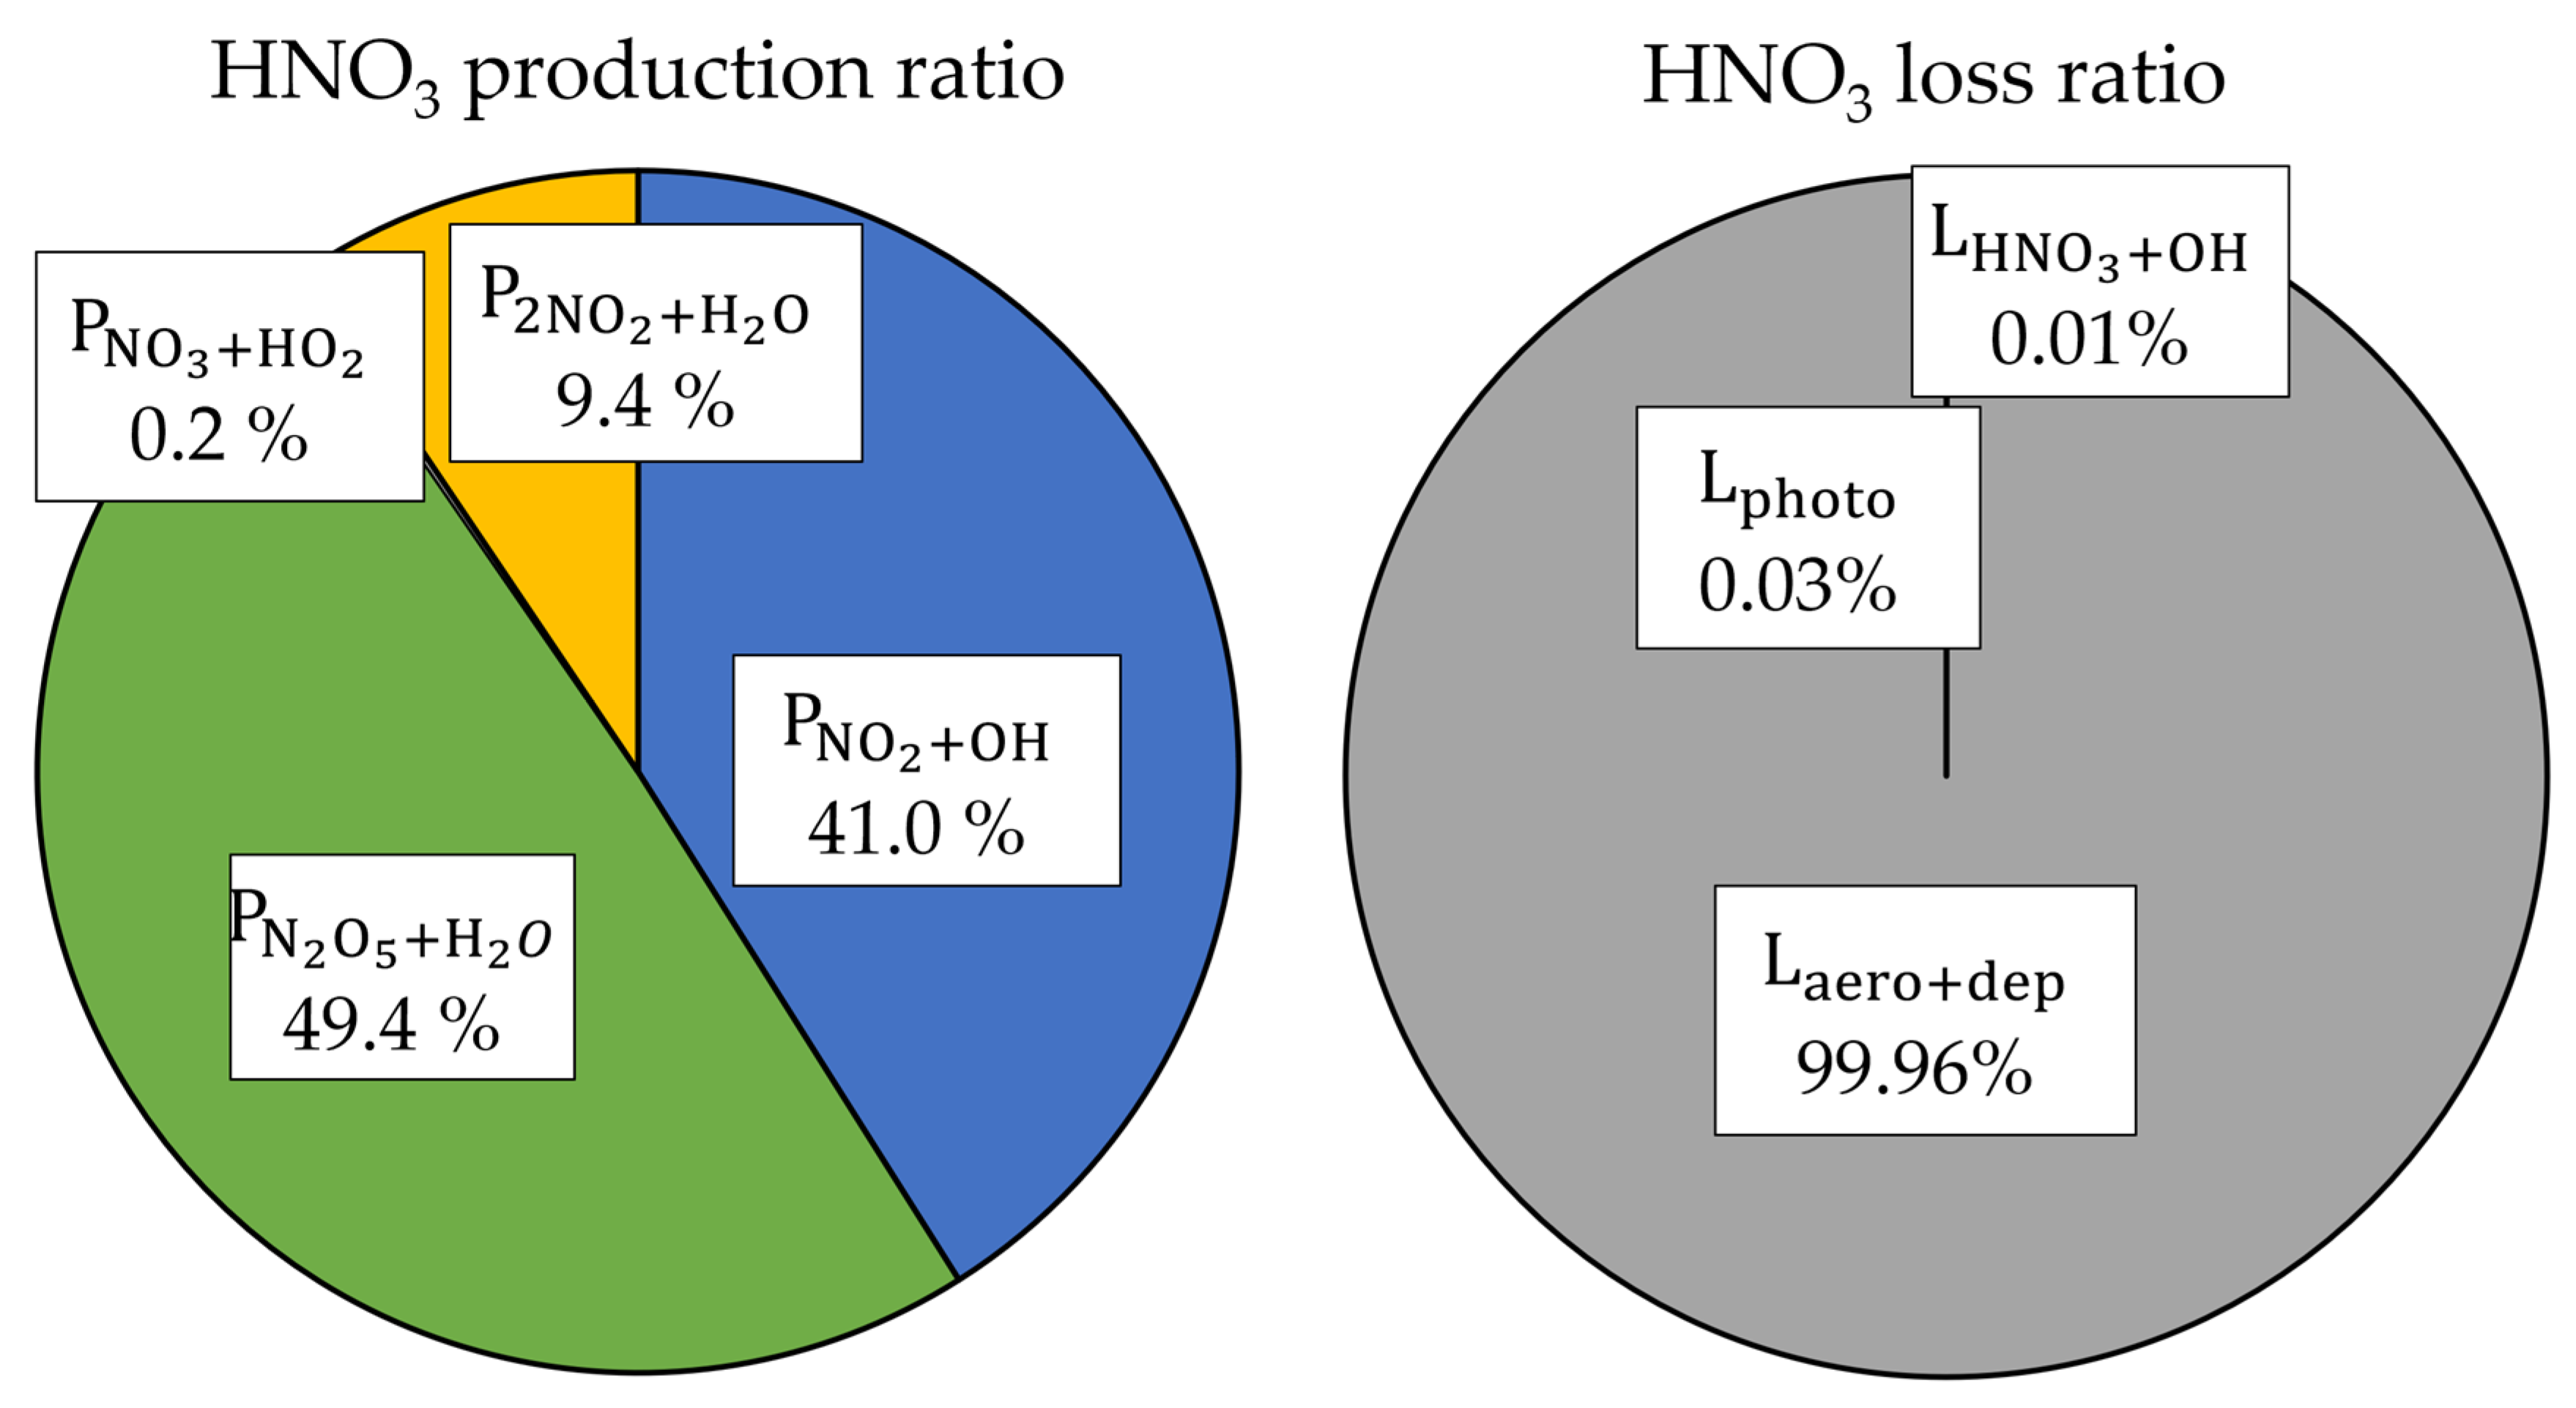
Figure 9 depicts the ratios of HNO3 production, conversion, and loss rates based on the reaction coefficients. Concerning production mechanisms, HNO3 production via the reaction of NO2 and OH () accounted for approximately 41.0%. The reaction between N2O5 and H2O, occurring during the nighttime denoted as , contributed significantly with 49.4%, indicating its dominance in total HNO3 production. , representing the hydrolysis reaction with NO2, accounted for 9.4%. Meanwhile, the production from the reaction of NO3 and HO2 () had a minor composition ratio.
In the case of loss rates, the majority HNO3 underwent reduction through aerosolization or deposition, serving as the primary causes of reduction. Further research is required to elucidate the relationship between aerosolization pathways and deposition.
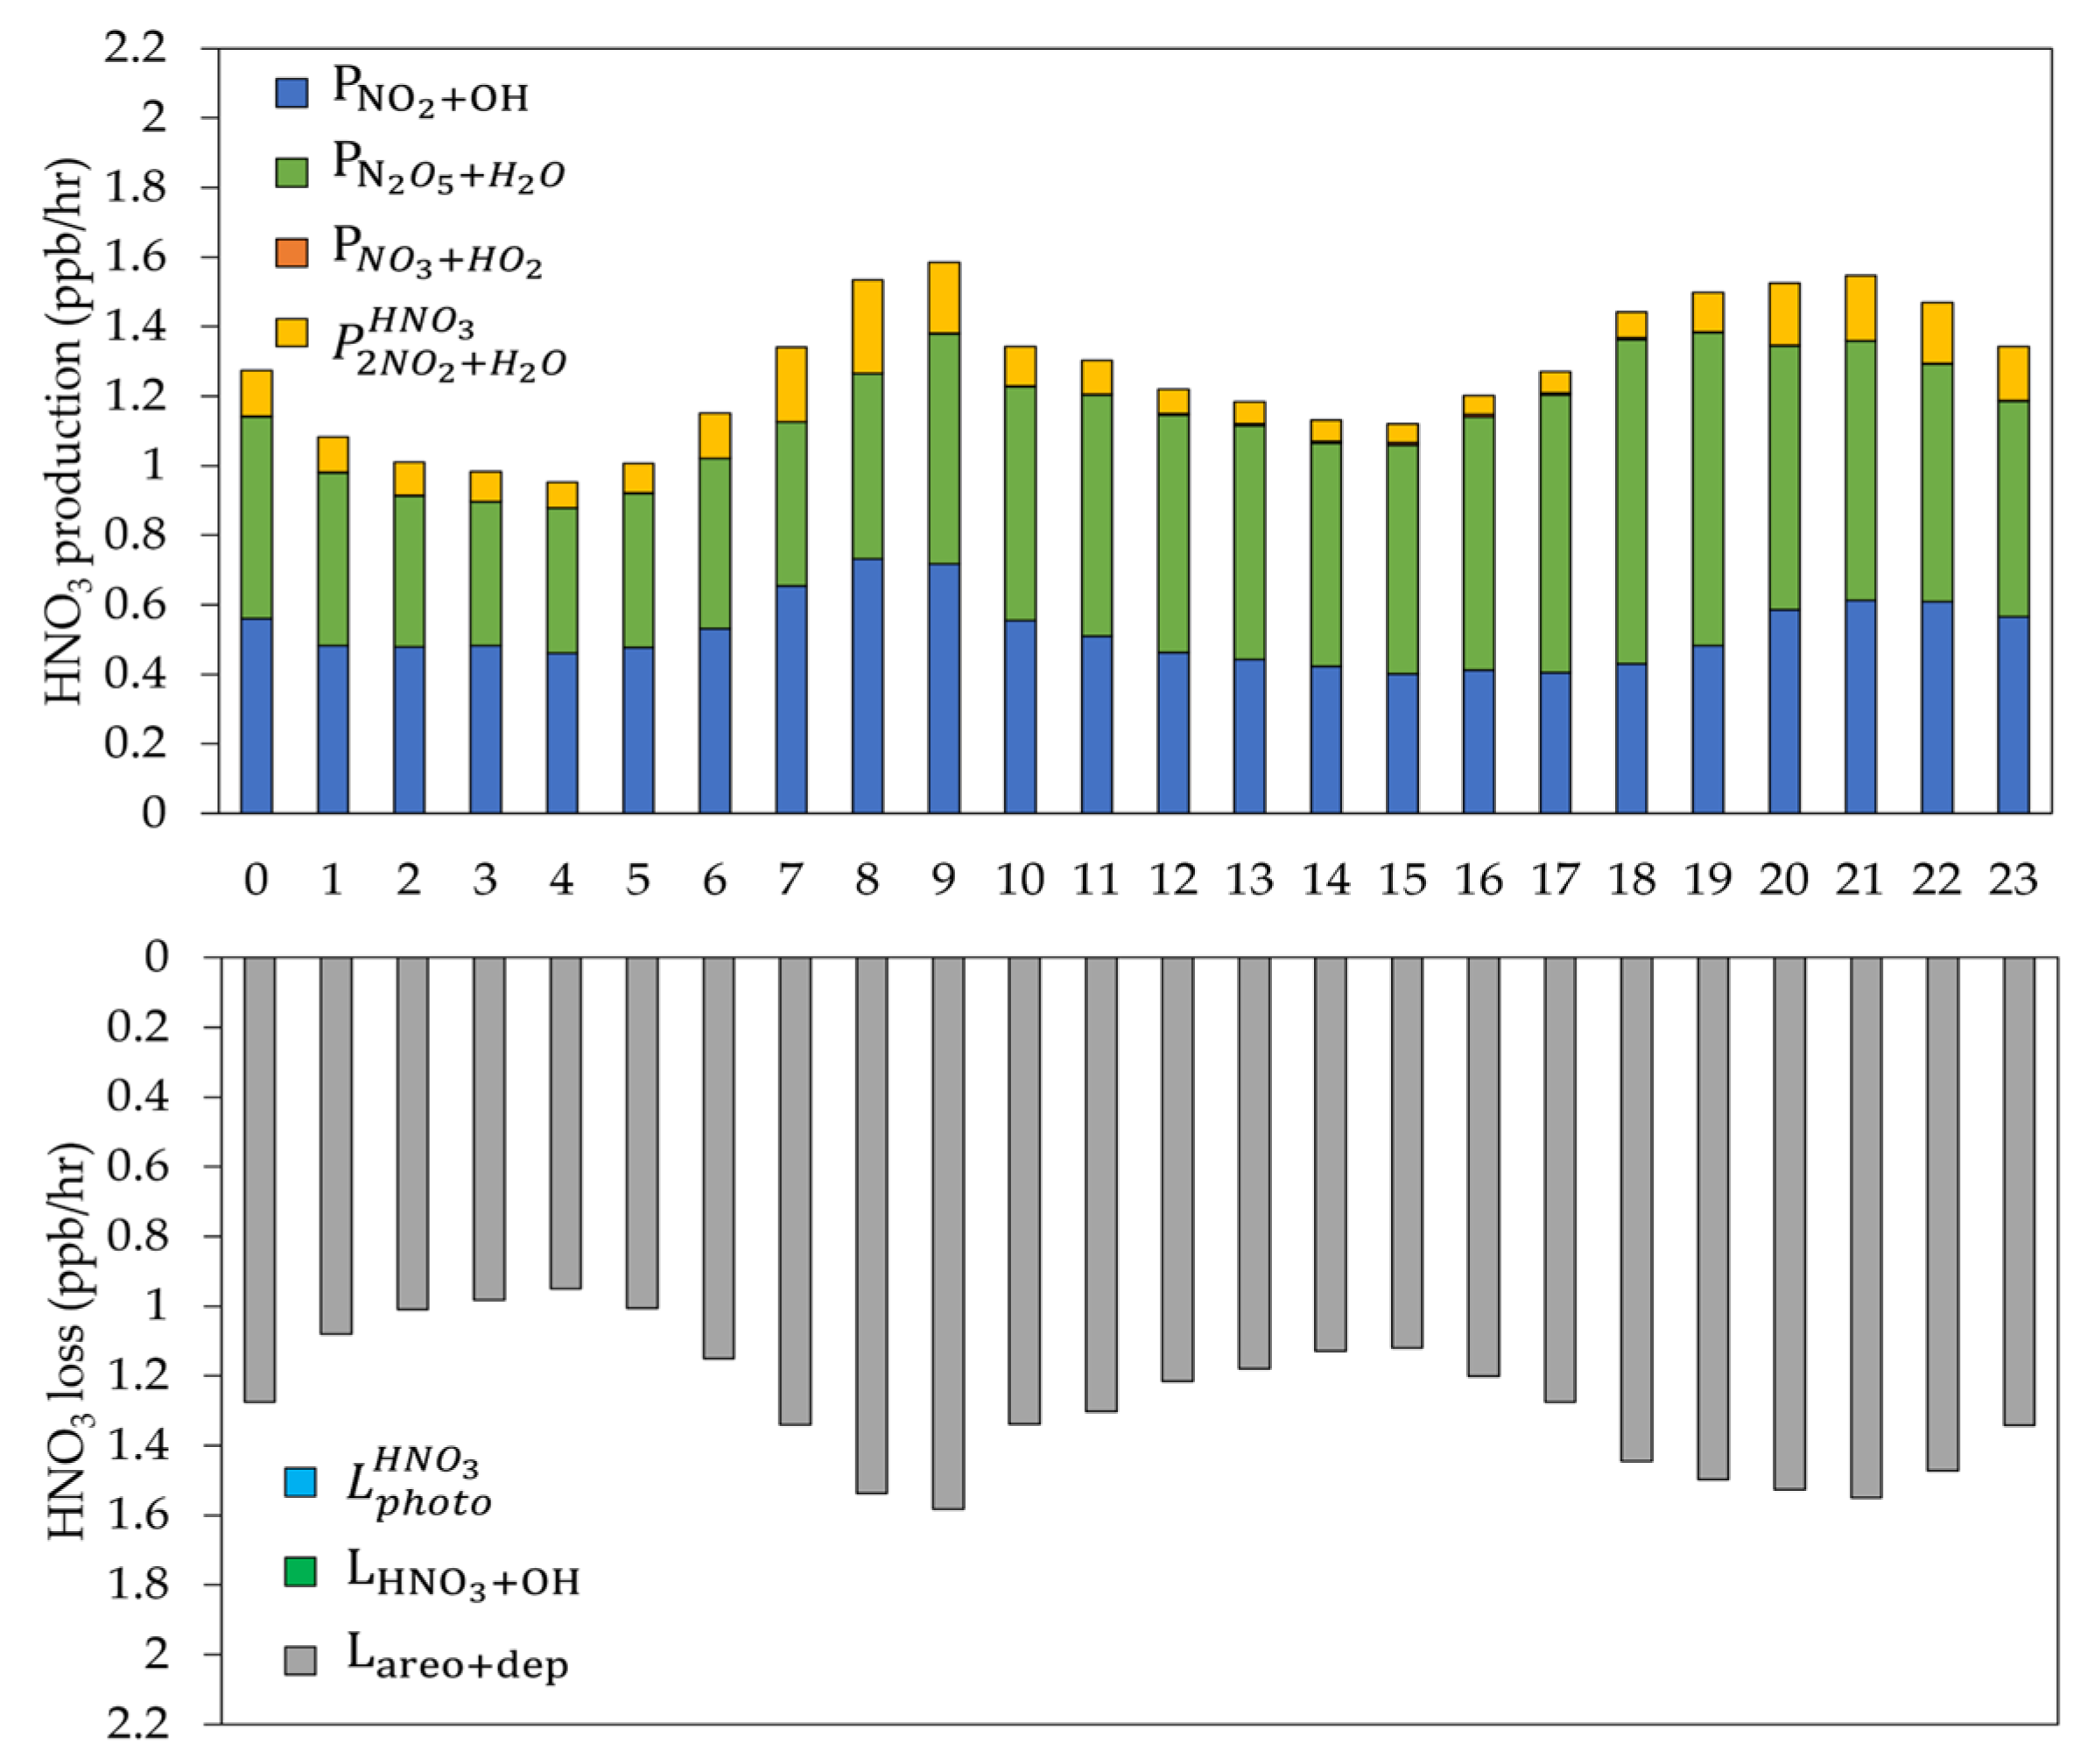
Figure 10 illustrates the diurnal variations in HNO3 production over time. From 7 to 8 a.m., the production rate of HNO3 by was high. The quantity of HNO3 produced by gas-phase reactions between NO2 and OH () decreased during the day, while the production rate of HNO3 formed by the reaction between N2O5 and H2O () increased. Because of the reaction of , the production rate of HNO3 was determined by the same equivalent ratio as that of HONO, and it was relatively small compared to the production rates by other reactions. The production rate of was low.
Regarding the reduction in HNO3, the conversion rate to aerosols was proportional to the HNO3 concentration. The reduction by aerosol conversion and deposition surpassed that by photolysis or reaction with OH radicals, making it challenging to analyze the one-to-one reduction. Conducting further research using the thermodynamic equilibrium model from gas to particles could provide more detailed estimates of the reduction rate in HNO3 [50].
To evaluate the reliability of Laero+dep, quantified from various reaction equations and the concentration budget over time, a quantitative comparison was conducted between the model-simulated and observed values. Since the F0AM model does not account for particle transformation mechanisms or dry and wet deposition processes, the HNO3 concentration estimated by the F0AM model was higher than the actual measured value. Hence, the difference between the observed HNO3 concentration values and those simulated by the model was assumed to be aerosolized or deposited. A comparative analysis of these two indicators was then performed.
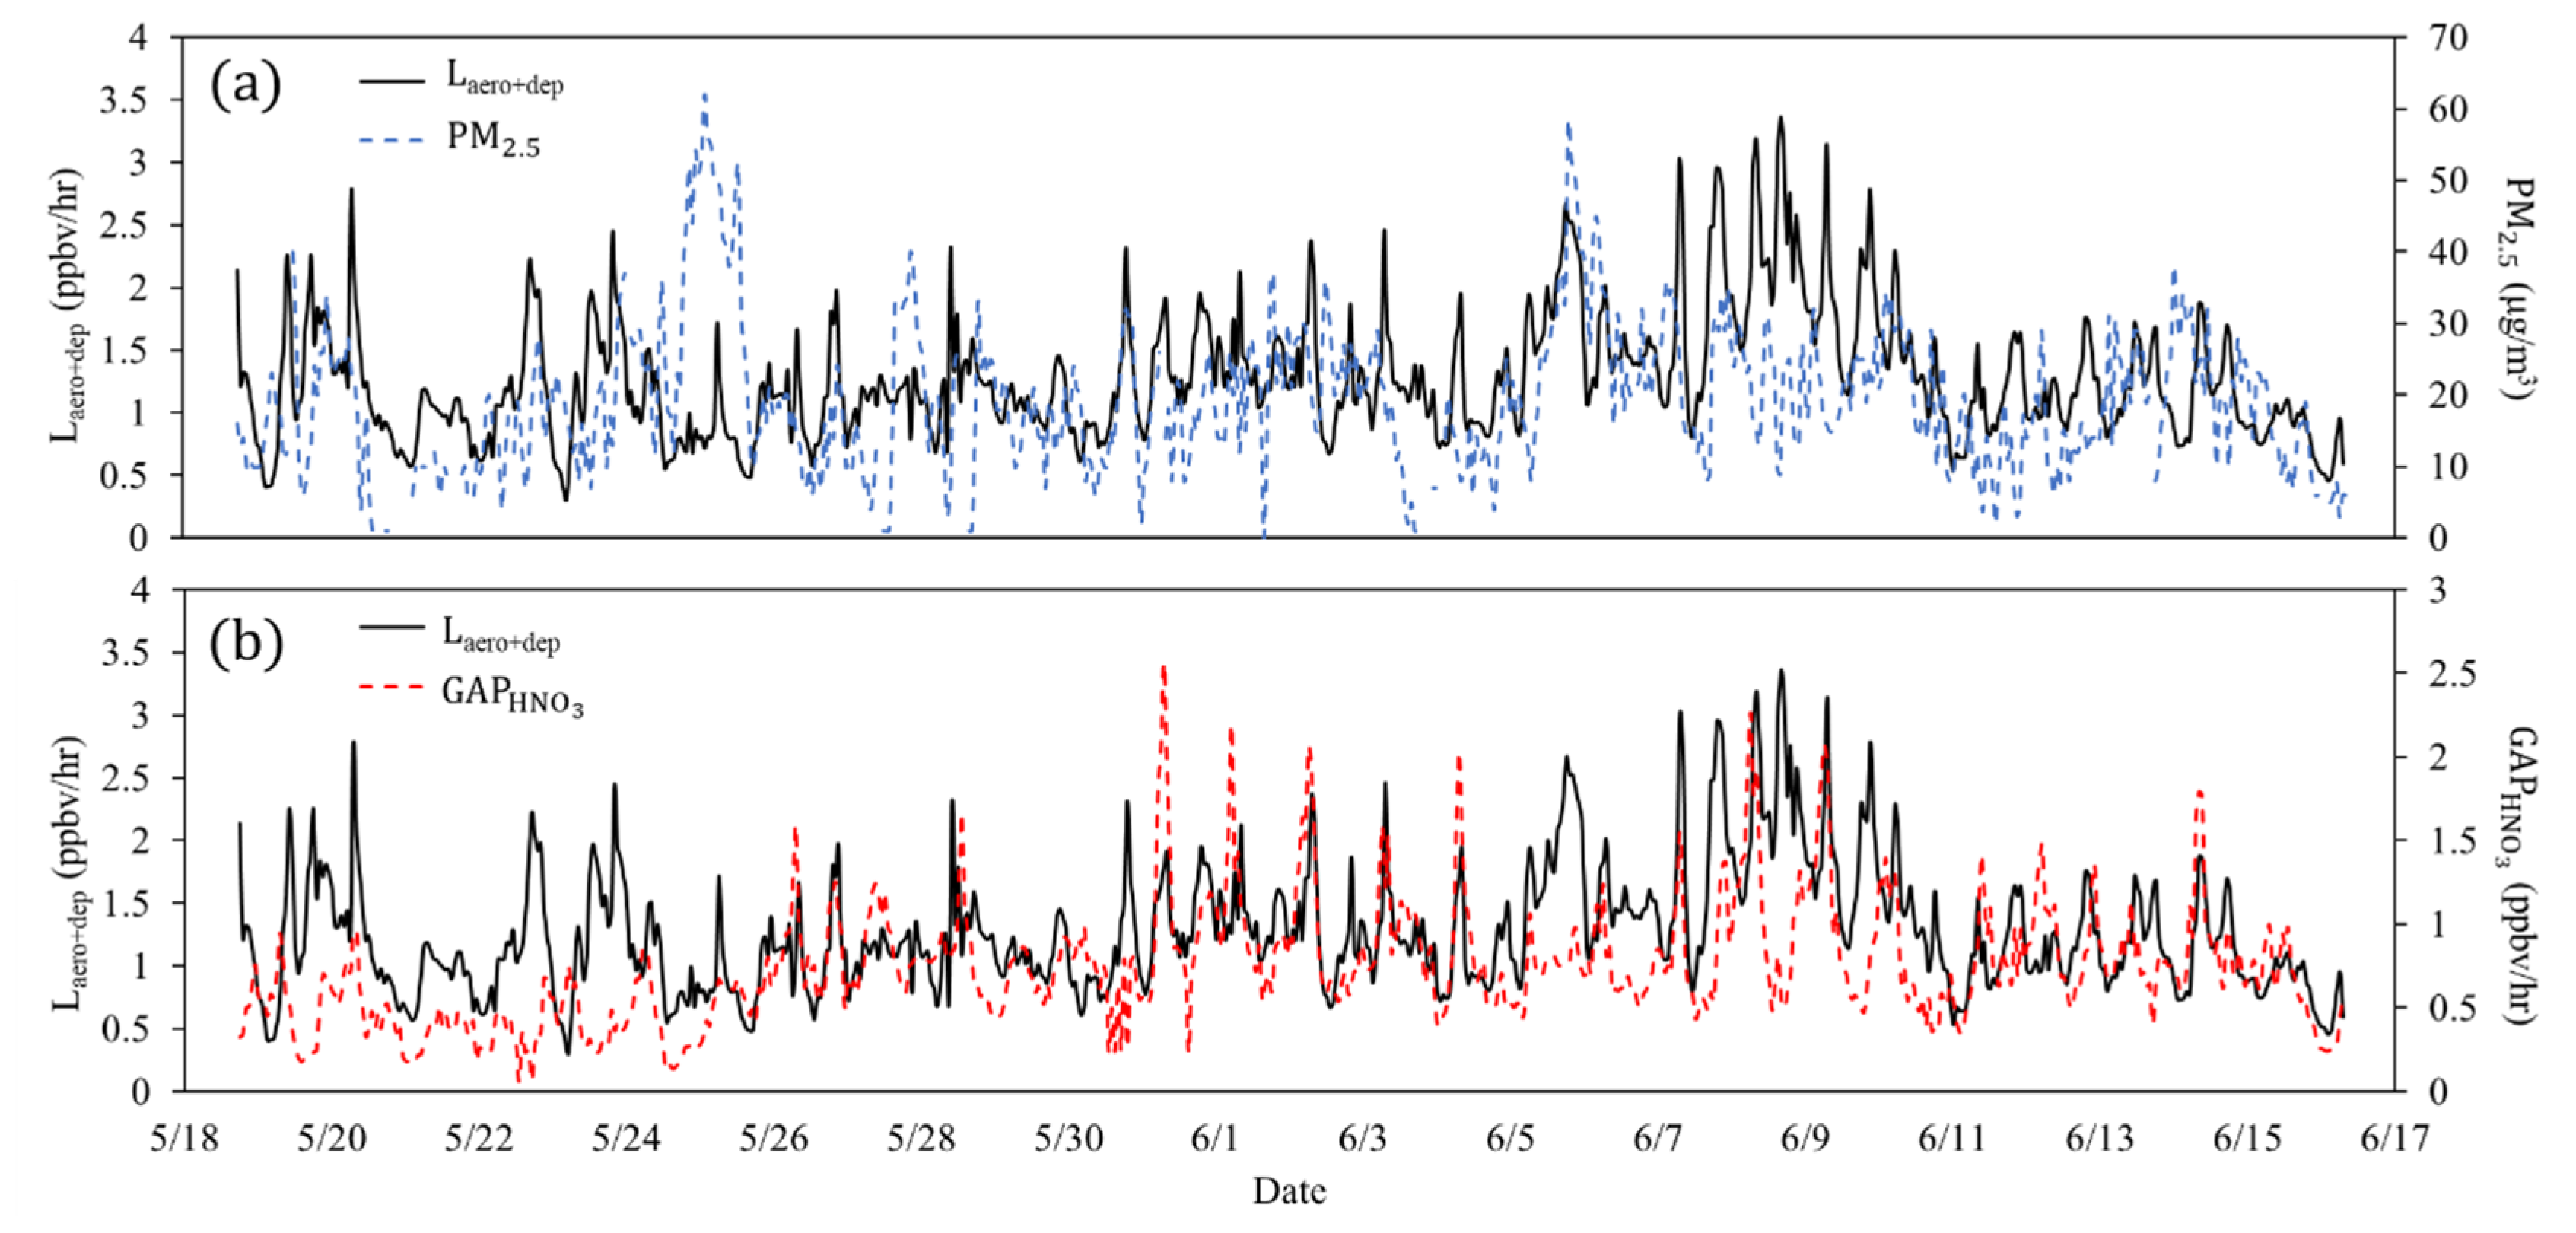
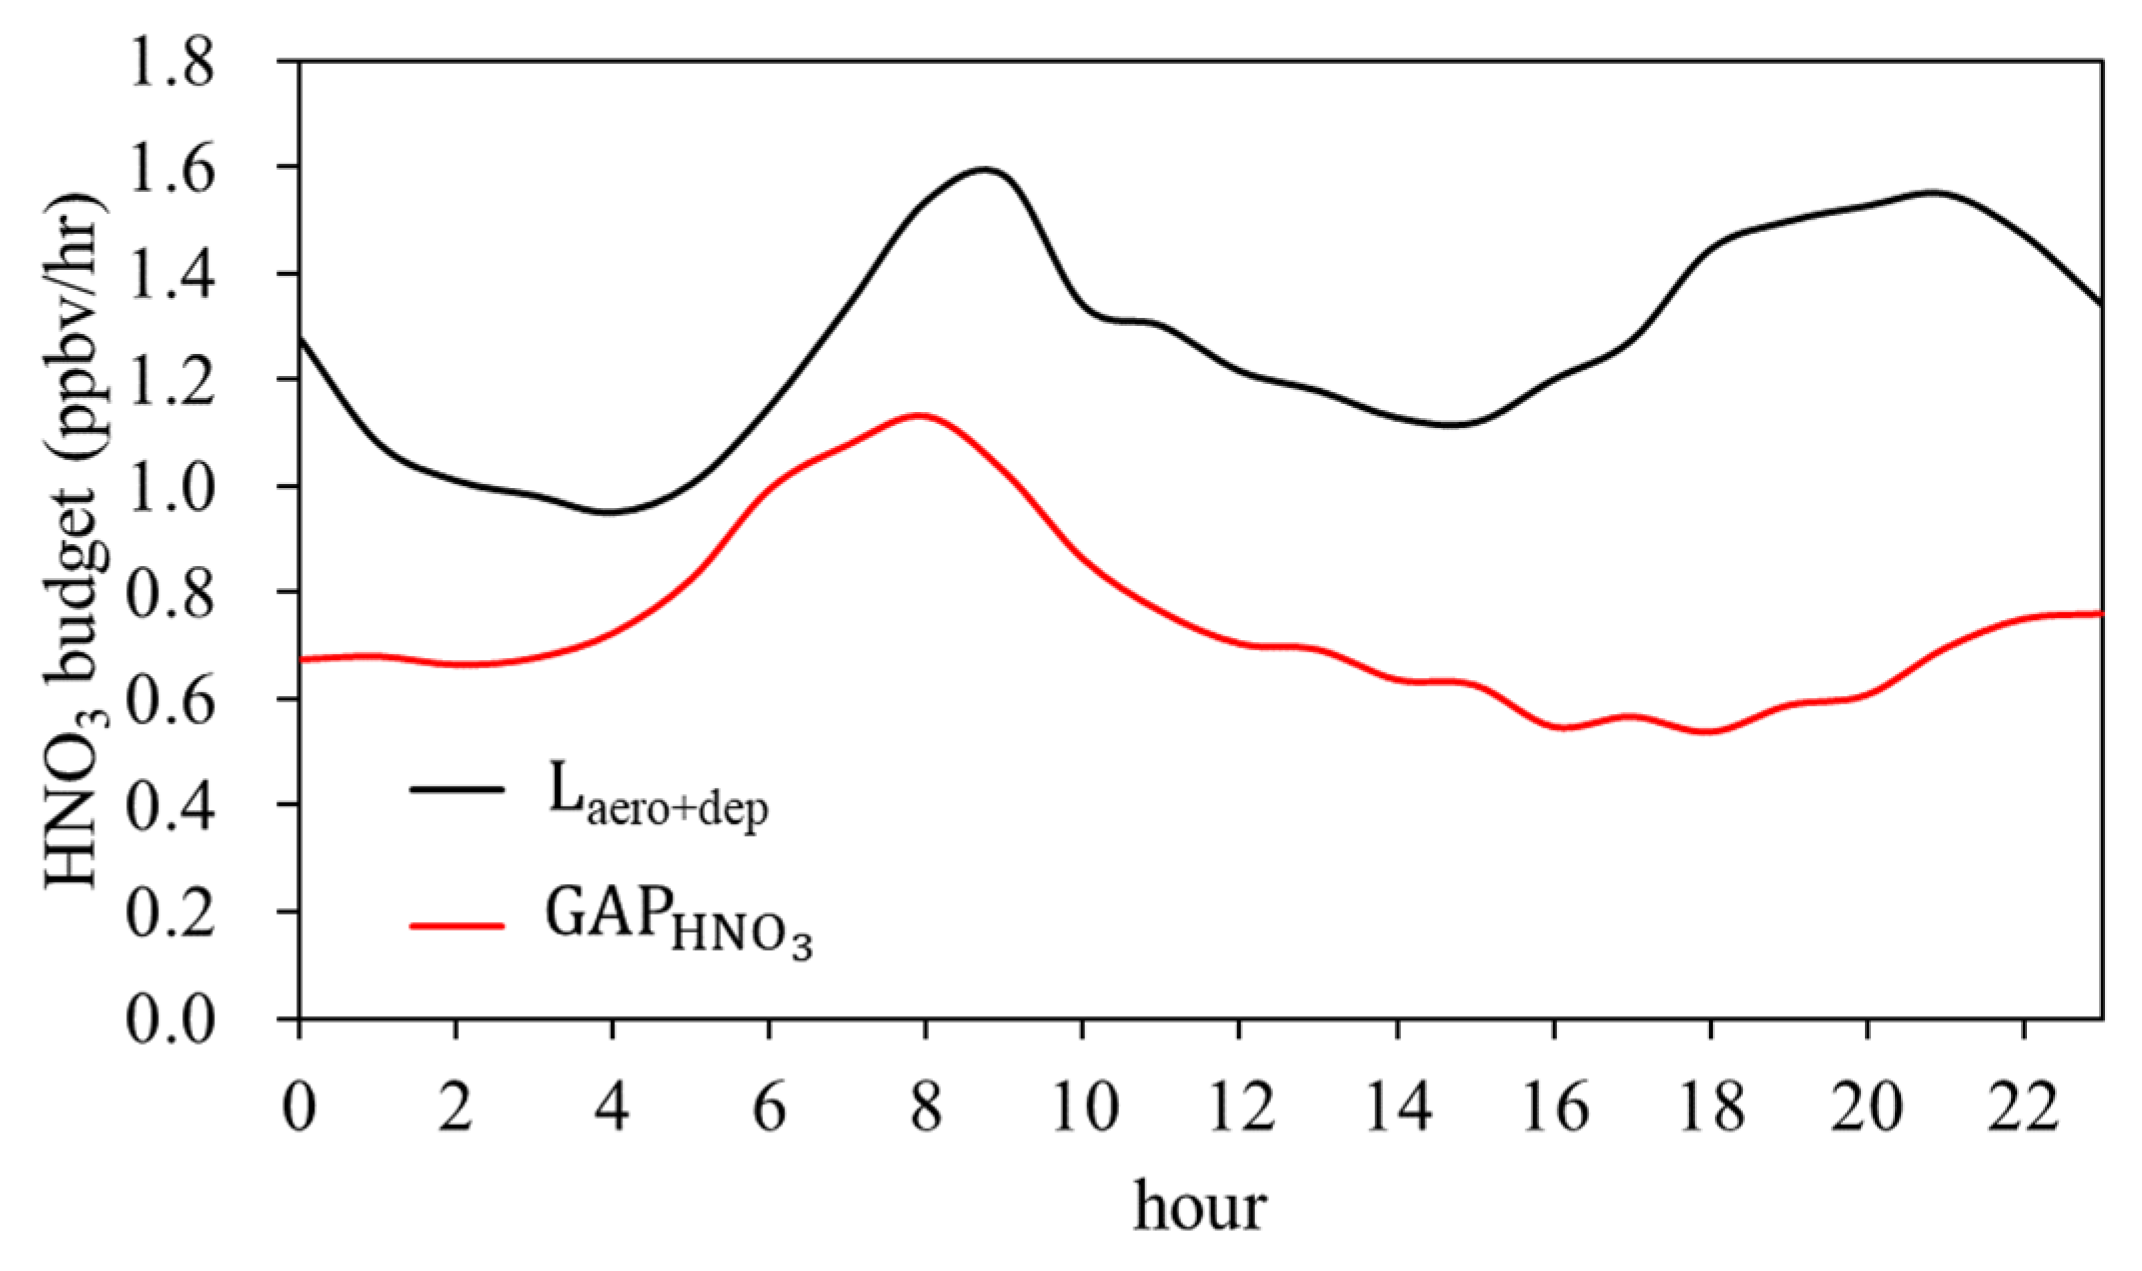
As depicted in Figure 11, the estimated concentration of HNO3 transformed into particles and deposited exhibited a relatively similar trend to the PM2.5 concentration, except for the peak case during the measurement. However, the trend of loss through the pathway of aerosolization and deposition did not align with that of . Figure 12 illustrates the diurnal patterns of the HNO3 budget for Laero+dep and , showing a difference in the values of the two indicators; nevertheless, the pattern itself was similar.
The Laero+dep value calculated in this study is an estimated parameter; this does not imply that the absolute budget of HNO3 is necessarily transformed into an aerosol. To determine the conversion to aerosols in detail, it was necessary to employ a gas–particle equilibrium model to quantify the values that vary depending on changes in conditions such as temperature and humidity [50]. It was suggested that a comparative study on the concentration of NO3− ions (μg m−3) obtained by analyzing the components of PM2.5 in the atmosphere and the budget converted from HNO3 is required.
4. Conclusions
This study conducted measurements of HONO and HNO3 concentrations, along with their precursor gases, in the atmosphere during both winter and summer in Daejeon, Korea. The average HONO concentrations measured were found to be 2.59 ± 1.91 ppbv in winter and 1.79 ± 0.76 ppbv in summer, while the HNO3 concentrations were 0.72 ± 0.61 ppbv in winter and 0.1 ± 0.03 ppbv in summer. In particular, the HONO concentration exhibited a decrease at sunrise through photolysis, contributing to the production of OH radicals and influencing the accumulation of O3 in the atmosphere. Analyses were conducted on changes in the HONO/NOZ and HNO3/NOZ ratios based on the composition of NOy substances and the measurement period. Utilizing the 0-D box model, concentrations of N2O5, NO3, and PAN were calculated.
Quantitative evaluations of production and conversion mechanisms were conducted using observed and simulated F0AM concentration data, employing several reaction equations and constants for HONO and HNO3. The HONO production through the heterogeneous reaction of NO2 (Phet) accounted for 21.3%, with an estimated proportion of 55.7% for unknown source (Punknown). Further detailed research is required to determine the budget of HONO with an unknown source. Regarding HONO reduction, the largest loss occurred through photolysis during the day (77.7%), with remaining reduction due to the reaction of high OH radicals with HONO.
For HNO3 production, the majority involved the reaction of N2O5 and H2O (49.4%), with 41.0% produced by the homogeneous reaction of NO2 and OH radicals. In terms of HNO3 budget loss, 99.9% of the reduction was converted to aerosols or deposited. A comparison between the F0AM model result values and measured HNO3 concentrations () and Laero+dep revealed similar diurnal patterns over time.
Author Contributions
Conceptualization, J.H.; methodology, J.E.; validation, J.H. and J.E.; formal analysis, K.K., C.L., D.C. and S.H.; investigation, K.K. and D.C.; data curation, J.H. and J.E.; writing—original draft preparation, K.K.; writing—review and editing, K.K., C.L. and S.H.; supervision, J.H.; funding acquisition, J.H. All authors have read and agreed to the published version of the manuscript.
Funding
This research was supported by the FRIEND (Fine Particle Research Initiative in East Asia Considering National Differences) Project through the National Research Foundation of Korea (NRF) funded by the Ministry of Science and ICT (2020M3G1A1114999) and Experts Training Graduate Program for Particulate Matter Management from the Ministry of Environment, Korea.
Institutional Review Board Statement
Not applicable.
Informed Consent Statement
Not applicable.
Data Availability Statement
The data presented in this study are available on request from the corresponding author.
Conflicts of Interest
Sangwoo Han is employee of E2M3 Inc., Anyang 14059, Republic of Korea. The paper reflects the views of the scientists and not the company.
References
- Finlayson-Pitts, B.J.; Pitts, J.N. Chemistry of the Upper and Lower Atmosphere—Theory, Experiments and Applications, 1st ed.; Academic Press: San Diego, CA, USA, 2000. [Google Scholar]
- Saunders, S.M.; Jenkin, M.E.; Derwent, R.G.; Pilling, M.J. Protocol for the development of the Master Chemical Mechanism, MCM v3 (Part A): Tropospheric degradation of non-aromatic volatile organic compounds. Atmos. Chem. Phys. 2003, 3, 161–180. [Google Scholar] [CrossRef]
- Chou, C.C.K.; Tsai, C.Y.; Shiu, C.J.; Liu, S.C.; Zhu, T. Measurement of NOy during Campaign of Air Quality Research in Beijing 2006 (CAREBeijing-2006): Implications for the ozone production efficiency of NOX. Geophys. Res. 2009, 114, D00G001. [Google Scholar] [CrossRef]
- Li, T.; An, J.; Min, M.; Zhang, W.; Wang, F.; Xie, P. Impacts of HONO sources on the air quality in Beijing, Tianjin and Hebei province of China. Atmos. Environ. 2011, 45, 4735–4744. [Google Scholar] [CrossRef]
- Emmerson, K.; Carslaw, N.; Pilling, M. Urban atmospheric chemistry during the PUMA campaign 2: Radical budgets for OH, HO2 and RO2. Atmos. Environ. 2005, 52, 165–183. [Google Scholar] [CrossRef]
- Kanaya, Y.; Cao, R.; Akimoto, H.; Fukuda, M.; Komazaki, Y.; Yokouchi, Y.; Koike, M.; Tanimoto, H.; Takegawa, N.; Kondo, Y. Urban photochemistry in central Tokyo: 1. Observed and modeled OH and HO2 radical concentrations during the winter and summer of 2004. Geophys. Res. Atmos. 2007, 112, D21312. [Google Scholar] [CrossRef]
- Yang, Y.; Li, X.; Zua, K.; Lian, C.; Chen, S.; Dong, H.; Fenge, M.; Liu, H.; Liu, J.; Lu, K.; et al. Elucidating the effect of HONO on O3 pollution by a case study in southwest China. Sci. Total Environ. 2020, 756, 144127. [Google Scholar] [CrossRef] [PubMed]
- Li, X.; Brauers, T.; Häseler, R.; Bohn, B.; Fuchs, H.; Hofzumahaus, A.; Holland, F.; Lou, S.; Lu, K.D.; Rohrer, F.; et al. Exploring the atmospheric chemistry of nitrous acid (HONO) at a rural site in Southern China. Atmos. Chem. Phys. 2012, 12, 1497–1513. [Google Scholar] [CrossRef]
- Kleffmann, J.; Gavriloaiei, T.; Hofzumahaus, A.; Holland, F.; Koppmann, R.; Rupp, L.; Schlosser, E.; Siese, M.; Wahner, A. Daytime formation of nitrous acid: A major source of OH radicals in a forest. Geophys. Res. Lett. 2005, 32, L05818. [Google Scholar] [CrossRef]
- Idarto, A. Heterogeneous reactions of HONO formation from NO2 and HNO3: A review. Res. Chem. Interm. 2012, 38, 1029–1041. [Google Scholar] [CrossRef]
- Hou, S.; Tong, S.; Ge, M.; An, J. Comparison of atmospheric nitrous acid during severe haze and clean periods in Beijing, China. Atmos. Environ. 2016, 124, 199–206. [Google Scholar] [CrossRef]
- Liu, J.; Liu, Z.; Ma, Z.; Yang, S.; Yao, D.; Zhao, S.; Hu, B.; Tang, G.; Sun, J.; Cheng, M.; et al. Detailed budget analysis of HONO in Beijing, China: Implication on atmosphere oxidation capacity in polluted megacity. Atmos. Environ. 2021, 244, 117957. [Google Scholar] [CrossRef]
- Meng, F.; Qin, M.; Tang, K.; Duan1, J.; Fang, W.; Liang, S.; Ye, K.; Xie, P.; Sun, Y.; Xie, C.; et al. High-resolution vertical distribution and sources of HONO and NO2 in the nocturnal boundary layer in urban Beijing, China. Atmos. Chem. Phys. 2020, 20, 5071–5092. [Google Scholar] [CrossRef]
- Gil, J.S.; Son, J.W.; Kang, S.G.; Park, J.H.; Lee, M.H.; Jeon, E.M.; Shim, M.H. HONO measurement in Seoul during summer 2018 and its impact on Photochemistry. J. Korean Soc. Atmos. Environ. 2020, 36, 579–588. [Google Scholar] [CrossRef]
- Dentener, F.J.; Crutzen, P.J. Reaction of N2O5 on tropospheric aerosols: Impact on the global distributions of NOX, O3, and OH. Geophys. Res. 1993, 98, 7149–7163. [Google Scholar] [CrossRef]
- Crowley, J.N.; Ammann, M.; Cox, R.A.; Hynes, R.G.; Jenkin, M.E.; Mellouki, A.; Rossi, M.J.; Troe, J.; Wallington, T.J. Evaluated kinetic and photochemical data for atmospheric chemistry: Volume V–heterogeneous reactions on solid substrates. Atmos. Chem. Phys. 2010, 10, 9059–9223. [Google Scholar] [CrossRef]
- Watson, J.G.; Chow, J.C.; Lurmann, F.W.; Musarra, S.P. Ammonium nitrate; nitric acid; ammonia equilibrium in wintertime Phoenix, Arizona. J. Air Waste Manag. Assoc. 1994, 44, 405–412. [Google Scholar] [CrossRef]
- Park, J.S.; Kim, C.H.; Lee, J.J.; Kim, J.H.; Hwang, U.H.; Kim, S.D. A study on the chemical mass composition of particle matter in Seoul. J. Korean Soc. Urban Environ. 2010, 10, 293–303. [Google Scholar]
- Saiz-Lopez, A.; Notario, A.; Albaladejo, J.; McFiggans, G.; Saiz-Lopez, A. Seasonal variation of NOX loss processes coupled to the HNO3 formation in a daytime urban atmosphere: A model study. J. Water Air Soil Pollut. 2007, 182, 197–206. [Google Scholar] [CrossRef]
- Shon, Z.H.; Kim, K.H.; Song, S.K.; Jung, K.; Kim, N.J.; Lee, J.B. Relationship between water-soluble ions in PM2.5 and their precursor gases in Seoul megacity. Atmos. Environ. 2012, 59, 540–550. [Google Scholar] [CrossRef]
- Ansari, A.S.; Pandis, S.N. Response of inorganic PM to precursor concentrations. Environ. Sci. Technol. 1998, 32, 2706–2714. [Google Scholar] [CrossRef]
- Blanchard, C.L.; Roth, P.M.; Tanenbaum, S.J. The use of ambient measurements to identify which precursor species limit aerosol nitrate formation. J. Air Waste Manag. Assoc. 2000, 50, 2073–2084. [Google Scholar] [CrossRef]
- Chang, I.H.; Lee, C.G.; Lee, D.S. Development of an automated method for simultaneous determination of low molecular weight aliphatic amines and ammonia in ambient air by diffusion scrubber coupled to ion chromatography. Anal. Chem. 2003, 75, 6141–6146. [Google Scholar] [CrossRef]
- Kim, K.C.; Lee, C.S.; Han, S.W.; Choi, D.Y.; Lee, S.J.; Eom, J.W.; Lee, S.B.; Han, J.S. A study on the formation reactions and conversion mechanisms of HONO in the atmosphere. J. Korean Soc. Urban Environ. 2021, 21, 233–241. [Google Scholar] [CrossRef]
- Wolfe, G.M.; Marvin, M.R.; Roberts, S.J.; Travis, K.R.; Liao, J. The framework for 0-D atmospheric modeling (F0AM) v3.1. Geosci. Model Develop. 2016, 9, 3309–3319. [Google Scholar] [CrossRef]
- Kim, S.Y.; Lee, M.H.; Kim, S.Y.; Choi, S.H.; Seok, S.J.; Kim, S.W. Photochemical characteristics of high and low ozone episodes observed in the Taehwa Forest Observatory (TFO) in June 2011 near Seoul South Korea. Asia-Pac. J. Atmos. Sci. 2013, 49, 325–331. [Google Scholar] [CrossRef]
- Jenkin, M.E.; Saunders, S.M.; Wagner, V.; Pilling, M.J. Protocol for the development of the Master Chemical Mechanism, MCM v3 (Part B): Tropospheric degradation of aromatic volatile organic compounds. Atmos. Chem. Phys. 2003, 3, 181–193. [Google Scholar] [CrossRef]
- Jenkin, M.E.; Saunders, S.M.; Pilling, M.J. The tropospheric degradation of volatile organic compounds: A protocol for mechanism development. Atmos. Environ. 1997, 31, 81–104. [Google Scholar] [CrossRef]
- Jenkin, M.E.; Young, J.C.; Richard, A.R. The MCM v3.3.1 degradation scheme for isoprene. Atmos. Chem. Phys. 2015, 15, 11433–11459. [Google Scholar] [CrossRef]
- Oh, B.H.; Han, J.S.; Kim, H.S.; Lee, H.M.; Lee, C.S.; Kim, K.C.; Choi, D.Y.; Joo, H.S. Source characterization of volatile organic compounds of industrial complex measured by proton-transfer-reaction time-of-flight mass spectrometers in Korea. J. Odor Indoor Environ. 2023, 22, 1–14. [Google Scholar] [CrossRef]
- Martin, G.; Markus, M.; Armin, H. High resolution PTR-TOF: Quantification and formula confirmation of VOC in real time. J. Am. Soc. Mass Spec. 2010, 21, 1037–1044. [Google Scholar]
- Chang, W.I.; Choi, J.H.; Hong, S.B.; Lee, J.H. Simultaneous measurements of gaseous nitrous acid and particulate nitrite using diffusion scrubber/steam chamber/luminol chemiluminescence. Bull. Korean Chem. Soc. 2008, 29, 1525–1532. [Google Scholar]
- Lee, H.S.; Gang, C.M.; Kang, B.W.; Kim, H.K. A study of concentration characteristics of acidic air pollutants during the summer and winter seasons in Seoul. J. Korean Soc. Environ. Anal. 1999, 15, 113–120. [Google Scholar]
- Carter, W.P.L.; Pierce, J.A.; Luo, D.M.; Malkina, I.L. Environmental chamber study of maximum incremental reactivities of volatile organic compounds. Atmos. Environ. 1995, 29, 2499–2511. [Google Scholar] [CrossRef]
- Carter, W.P.L. Updated Maximum Incremental Reactivity Scale for Regulatory Applications; Air Pollution Research Center and College of Engineering, Center for Environmental Research and Technology: Riverside, CA, USA, 2010. [Google Scholar]
- Lee, G.W.; Park, J.H.; Kim, D.G.; Koh, M.S.; Lee, M.H.; Han, J.S.; Kim, J.C. Current status and future directions of tropospheric photochemical ozone studies in Korea. J. Korean Soc. Atmos. Environ. 2020, 36, 419–441. [Google Scholar] [CrossRef]
- Bottorff, B.; Lew, M.M.; Woo, Y.; Rickly, P.; Rollings, M.D.; Deming, B.; Anderson, D.C.; Wood, E.; Alwe, H.D.; Millet, D.B.; et al. OH, HO2, and RO2 radical chemistry in a rural forest environment: Measurements, model comparisons, and evidence of a missing radical sink. Atmos. Chem. Phys. 2023, 23, 10287–10311. [Google Scholar] [CrossRef]
- Tan, Z.; Lu, K.; Hofzumahaus, A.; Fuchs, H.; Bohn, B.; Holland, F.; Liu, Y.; Rohrer, F.; Shao, M.; Sun, K.; et al. Experimental budgets of OH, HO2, and RO2 radicals and implications for ozone formation in the Pearl River Delta in China 2014. Atmos. Chem. Phys. 2019, 19, 7129–7150. [Google Scholar] [CrossRef]
- Li, M.; Karu, E.; Brenninkmeijer, C.; Fischer, H.; Lelieveld, J.; Williams, J. Tropospheric OH and stratospheric OH and Cl concentrations determined from CH4, CH3Cl, and SF6 measurements. NPJ Clim. Atmos. Sci. 2018, 1, 29. [Google Scholar] [CrossRef]
- Zhao, Y.; Saunois, M.; Bousquet, P.; Lin, X.; Berchet, A.; Hegglin, M.I.; Canadell, J.G.; Jackson, R.B.; Hauglustaine, D.A.; Szopa, S.; et al. Inter-model comparison of global hydroxyl radical (OH) distributions and their impact on atmospheric methane over the 2000–2016 period. Atmos. Chem. Phys. 2019, 19, 13701–13723. [Google Scholar] [CrossRef]
- Kurtenbacha, R.; Becker, K.H.; Gomes, J.A.G.; Kleffmann, J.; Lorzer, J.C.; Spittler, M.; Wiesen, P.; Ackermann, R.; Geyer, A.; Platt, U. Investigations of emissions and heterogeneous formation of HONO in a road traffic tunnel. Atmos. Environ. 2001, 35, 3385–3394. [Google Scholar] [CrossRef]
- Huang, R.J.; Yang, L.; Cao, J.; Wang, Q.; Tie, X.; Ho, K.F.; Shen, Z.; Zhang, R.; Li, G.; Zhu, C. Concentration and sources of atmospheric nitrous acid (HONO) at an urban site in Western China. J. Sci. Total Environ. 2017, 593, 165–172. [Google Scholar] [CrossRef]
- Alicke, B.; Platt, U.; Stutz, J. Impact of nitrous acid photolysis on the total hydroxyl radical budget during the limitation of oxidant production/pianura padana produzione di ozono study in Milan. J. Geophys. Res. Atmos. 2002, 107, 1–17. [Google Scholar] [CrossRef]
- Alicke, B.; Geyer, A.; Hofzumahaus, A.; Holland, F.; Konrad, S.; Pätz, H.; Schäfer, J.; Stutz, J.; Volz-Thomas, A.; Platt, U. OH formation by HONO photolysis during the BERLIOZ experiment. J. Geophys. Res. Atmos. 2003, 108, 1–17. [Google Scholar] [CrossRef]
- Carter, W.P.L. Development of the SAPRC-07 chemical mechanism. Atmos. Environ. 2010, 44, 5324–5335. [Google Scholar] [CrossRef]
- England, C.; Corcoran, W.H. Kinetics and mechanisms of the gas-phase reaction of water vapor and nitrogen dioxide. J. Indus. Eng. Chem. Fundam. 1974, 13, 373–384. [Google Scholar] [CrossRef]
- Atkinson, R.; Baulch, D.L.; Cox, R.A.; Crowley, J.N.; Hampson, R.F.; Hynes, R.G.; Jenkin, M.E.; Rossi, M.J.; Troe, J. IUPAC task group on atmospheric chemical kinetic data evaluation. Atmos. Chem. Phys. 2004, 4, 1461–1738. [Google Scholar] [CrossRef]
- Chan, W.H.; Nordstrom, R.J.; Calvert, J.G.; Shaw, J.H. Kinetic study of HONO formation and decay reactions in gaseous mixtures of HONO, NO, NO2, H2O, and N2. Environ. Sci. Technol. 1976, 10, 674–682. [Google Scholar] [CrossRef]
- Kim, H.R.; Park, J.S.; Kim, S.G.; Pawar, K.N.; Song, M.J. High efficiency of nitric acid controls in alleviating particulate nitrate in livestock and urban areas in South Korea. Environ. Sci. Atmos. 2023, 3, 422–433. [Google Scholar] [CrossRef]
- Fountoukis, C.; Nenes, A. ISORROPIA II: A computationally efficient thermodynamic equilibrium model for K+–Ca2+–Mg2+–NH4+–Na+–SO42−–NO3−–Cl−–H2O aerosols. Atmos. Chem. Phys. 2007, 7, 4639–4659. [Google Scholar] [CrossRef]
Figure 1.
Location of the Central Intensive Air-monitoring Site in Daejeon, Republic of Korea. The yellow star indicates the measurement position.
Figure 1.
Location of the Central Intensive Air-monitoring Site in Daejeon, Republic of Korea. The yellow star indicates the measurement position.

Figure 2.
Schematics of the PPDS-IC systems.

Figure 3.
Time−series distribution for measurements in winter.

Figure 4.
Time−series distribution for measurements in summer.

Figure 5.
Diurnal patterns of precursor gases representing winter (left) and summer (right). The gray area represents the range (standard deviation) of hourly averaged data.
Figure 5.
Diurnal patterns of precursor gases representing winter (left) and summer (right). The gray area represents the range (standard deviation) of hourly averaged data.

Figure 6.
The distribution ratio of NOy. NO, NO2, HONO, and HNO3 concentrations were measured and NO3, N2O5, PAN concentrations were calculated using the F0AM model.
Figure 6.
The distribution ratio of NOy. NO, NO2, HONO, and HNO3 concentrations were measured and NO3, N2O5, PAN concentrations were calculated using the F0AM model.

Figure 7.
Composition ratio of productions and losses of HONO.

Figure 8.
Diurnal variation in the production and loss rate of HONO.

Figure 9.
Composition ratio of productions and losses of HNO3.

Figure 10.
Diurnal variation in production and loss rates of HNO3.

Figure 11.
Time-series distribution comparing Laero+dep with two indicators: (a) with PM2.5 (the blue dotted line); (b) with (the red dotted line).
Figure 11.
Time-series distribution comparing Laero+dep with two indicators: (a) with PM2.5 (the blue dotted line); (b) with (the red dotted line).

Figure 12.
Diurnal pattens of Laero+dep and .


Table 1.
Analysis conditions of IC.
| IC | Cation | Anion |
|---|---|---|
| Analytical System | Dionex CD20 | Dionex CD20 |
| Analytical Column | IonPac CS15 (2 × 250 mm, Dionex) | IonPac AS12A (2 × 250 mm, Dionex) |
| Eluent | MSA 10 mM (in RFIC mode) | KOH 40 mM (in RFIC mode) |
| Eluent Flow Rate | 0.25 mL/min | 0.25 mL/min |
| Cell Temperature | 35 °C | 35 °C |
| Injection Volume | 500 μL | 100 μL |
| Suppressor | CERS (in Recycle mode) | AERS (in Recycle mode) |
| Suppressor Current | 11 mA | 25 mA |
| Background Conductivity | 274 nS/cm | 334 nS/cm |
| Pressure | 1210 psi | 1762 psi |
Table 2.
Summary of measurement data.
| Average | Max | Min | STD | n | ||
|---|---|---|---|---|---|---|
| HONO | winter | 2.59 * | 11.8 | 0.29 | 1.91 | 490 |
| summer | 1.8 | 5.6 | 0.3 | 0.76 | 687 | |
| HNO3 | winter | 0.72 | 3.1 | 0.03 | 0.61 | 375 |
| summer | 0.1 | 0.2 | 0.07 | 0.03 | 686 | |
| PM2.5 | winter | 20 | 86 | 1 | 12 | 445 |
| summer | 19.3 | 62 | 1 | 10.2 | 657 | |
| O3 | winter | 18 | 53 | 1 | 16 | 525 |
| summer | 44 | 99 | 5 | 18.3 | 687 | |
| NO2 | winter | 23 | 64 | 4 | 12 | 522 |
| summer | 13 | 38 | 5 | 5.5 | 687 | |
| NO | winter | 33 | 288 | 0.1 | 43 | 483 |
| summer | 2.9 | 24.9 | 0.003 | 3.0 | 447 | |
| CO | winter | 570 | 1700 | 100 | 250 | 525 |
| summer | 523 | 1000 | 300 | 94 | 687 | |
| SO2 | winter | 3 | 7 | 1 | 1.1 | 522 |
| summer | 2.8 | 10 | 0.1 | 10.1 | 687 | |
| Temp. | winter | −0.12 | 14 | −17.3 | 7.4 | 525 |
| summer | 21.1 | 32.7 | 11.9 | 4.7 | 687 | |
| R.H. | winter | 67.1 | 97 | 18 | 19 | 525 |
| summer | 74.3 | 97 | 23 | 18.8 | 687 |
* The unit for PM2.5 is μg/m3, that for Temp. (Temperature) is °C, that for relative humidity is %, and that for others is ppbv.
Table 3.
VOCs used for the F0AM model measured using a PTR-ToF-MS.
| VOC Species | Conc. (ppbv) | MIR | Conc. MIR | |
|---|---|---|---|---|
| 1 | Propene | 3.7 | 11.7 | 42.6 |
| 2 | Butene | 2.8 | 9.7 | 27.4 |
| 3 | Butanol | 2.1 | 6.0 | 12.5 |
| 4 | m-Xylene | 1.3 | 9.8 | 12.3 |
| 5 | Acetaldehyde | 1.6 | 6.5 | 10.2 |
| 6 | Formaldehyde | 0.6 | 9.5 | 5.3 |
| 7 | Methanol | 7.3 | 0.7 | 4.9 |
| 8 | Toluene | 1.2 | 4.0 | 4.8 |
| 9 | Ethanol | 2.9 | 1.5 | 4.4 |
| 10 | 1,2,4-Trimethylbenzene | 0.5 | 8.9 | 4.2 |
| 11 | 1,3-Butadiene | 0.3 | 12.6 | 4.0 |
| 12 | Ethene | 0.4 | 9.0 | 4.0 |
| 13 | Isoprene | 0.4 | 10.6 | 3.9 |
| 14 | Crotonaldehyde | 0.4 | 9.4 | 3.8 |
| 15 | Acrolein | 0.5 | 7.5 | 3.4 |
| 16 | n-Hexane | 1.8 | 1.2 | 2.2 |
| 17 | Ethylbenzene | 0.6 | 3.0 | 1.9 |
| 18 | iso-Butyl alcohol | 0.8 | 2.5 | 1.9 |
| 19 | a-Pinene | 0.4 | 4.5 | 1.7 |
| 20 | n-Valeraldehyde | 0.3 | 5.1 | 1.7 |
| 21 | Acetic acid | 2.2 | 0.7 | 1.5 |
| 22 | 2-Ethoxyethanol | 0.4 | 3.7 | 1.4 |
| 23 | Methyl iso-butyl ketone | 0.3 | 3.9 | 1.3 |
| 24 | 2-Methoxyethanol | 0.4 | 2.9 | 1.2 |
| 25 | Acetone | 3.1 | 0.4 | 1.1 |
Table 4.
Comparison between measured and modeled values of observed gases.
| Species | Measured Conc. | Modeled Conc. | RMSD (ppbv) | ||
|---|---|---|---|---|---|
| AVG | STD | AVG | STD | ||
| HONO | 1.79 | 0.76 | 0.85 | 0.36 | 1.02 |
| HNO3 | 0.10 | 0.03 | 0.76 | 0.28 | 0.71 |
| O3 | 43.8 | 18.3 | 45.0 | 18.1 | 2.91 |
| NO2 | 12.5 | 5.51 | 13.7 | 5.49 | 2.45 |
| NO | 2.33 | 2.58 | 0.83 | 1.08 | 2.57 |
| CO | 523 | 94.2 | 523 | 94.3 | 0.30 |
| SO2 | 2.80 | 1.07 | 2.78 | 1.06 | 0.01 |
| Propene | 3.64 | 1.74 | 3.04 | 1.43 | 0.69 |
| Butene | 2.82 | 1.13 | 2.33 | 0.94 | 0.53 |
| Butanol | 2.10 | 1.17 | 2.02 | 1.13 | 0.10 |
| m-Xylene | 1.26 | 0.74 | 1.13 | 0.66 | 0.16 |
| Acetaldehyde | 1.56 | 0.93 | 2.03 | 1.05 | 0.54 |
| Formaldehyde | 0.56 | 0.25 | 1.85 | 0.63 | 1.38 |
| Methanol | 7.31 | 2.40 | 7.28 | 2.40 | 0.03 |
| Toluene | 1.19 | 0.83 | 1.15 | 0.81 | 0.04 |
| Ethanol | 2.89 | 2.22 | 2.85 | 2.19 | 0.06 |
| 1,2,4-Trimethylbenzene | 0.47 | 0.24 | 0.41 | 0.20 | 0.08 |
| 1,3-Butadiene | 0.32 | 0.13 | 0.22 | 0.09 | 0.11 |
| Ethene | 0.42 | 0.21 | 0.40 | 0.20 | 0.02 |
| Isoprene | 0.37 | 0.10 | 0.20 | 0.06 | 0.18 |
| Crotonaldehyde | 0.40 | 0.13 | 0.34 | 0.11 | 0.07 |
| Acrolein | 0.46 | 0.21 | 0.48 | 0.19 | 0.04 |
| n-Hexane | 1.78 | 0.98 | 1.73 | 0.95 | 0.06 |
| Ethylbenzene | 0.64 | 0.34 | 0.62 | 0.32 | 0.02 |
| iso-butyl alcohol | 0.75 | 0.33 | 0.72 | 0.31 | 0.04 |
| a-Pinene | 0.38 | 0.19 | 0.13 | 0.15 | 0.26 |
| n-Valeraldehyde | 0.33 | 0.09 | 0.28 | 0.08 | 0.04 |
| Acetic acid | 2.21 | 1.09 | 2.21 | 1.09 | 0.01 |
| 2-Ethoxyethanol | 0.36 | 0.14 | 0.33 | 0.13 | 0.03 |
| Methyl iso-butyl ketone | 0.33 | 0.13 | 0.31 | 0.13 | 0.02 |
| 2-Methoxyethanol | 0.40 | 0.15 | 0.38 | 0.14 | 0.03 |
| Acetone | 3.08 | 1.09 | 3.14 | 1.09 | 0.06 |
Table 5.
Summary of the reaction rate constants of HONO.
| Reaction | Constant | Unit | Reference | |
|---|---|---|---|---|
| PNO+OH | NO + OH → HONO | 7.31 × 10⁻¹² | cm3 mole−1 s−1 | [45] |
| 2NO2 + H2O → HONO + HNO3 | 1.47 × 10⁻²³ | L2 mol−2 s−1 | [46] | |
| Pdirect | Depends on concentration of NOX | [NOX] × 0.0065 | - (a) | [47] |
| Phet | Depends on conversion rate from NO2 | CHONO × [NO2] | - | [41,42] |
| Lphoto | HONO + hv → NO + OH | JHONO × [HONO] | - (a) | [47] |
| L2HONO | 2HONO → NO + NO2 + H2O | 1.4 × 10⁻³ | ppm−1 min−1 | [48] |
| LHONO+OH | HONO + OH → NO2 + H2O | 5.59 × 10⁻¹¹ | cm3 mole−1 s−1 | [48] |
(a) The unit must be converted to ppb/h.
Table 6.
Summary of constants for reaction rate of HNO3.
| Reaction | Constant | Unit | Reference | |
|---|---|---|---|---|
| NO2 + OH → HNO3 | 1.051 × 10⁻¹¹ | cm3 molecules−1 s−1 | [45] | |
| N2O5 + H2O → 2HNO3 | 2.5 × 10⁻²² | cm3 molecules−1 s−1 | [45] | |
| NO3 + HO2 → HNO3 + O2 | 1.9 × 10⁻¹² | cm3 molecules−1 s−1 | [16] | |
| 2NO2 + H2O → HONO + HNO3 | 5.5 × 10⁴ | L2 mol−2 s−1 | [46] | |
| HNO3 + hv → NO2 + OH | × [HNO3] | - (a) | [47] | |
| HNO3 + OH → H2O + NO3 | 1.51 × 10⁻¹³ | cm3 molecules−1 s−1 | [45] | |
(a) The unit must be converted to ppb hr−1.
Disclaimer/Publisher’s Note: The statements, opinions and data contained in all publications are solely those of the individual author(s) and contributor(s) and not of MDPI and/or the editor(s). MDPI and/or the editor(s) disclaim responsibility for any injury to people or property resulting from any ideas, methods, instructions or products referred to in the content. |
© 2024 by the authors. Licensee MDPI, Basel, Switzerland. This article is an open access article distributed under the terms and conditions of the Creative Commons Attribution (CC BY) license (https://creativecommons.org/licenses/by/4.0/).
Share and Cite
MDPI and ACS Style
Kim, K.; Lee, C.; Choi, D.; Han, S.; Eom, J.; Han, J. A Study on the Formation Reactions and Conversion Mechanisms of HONO and HNO3 in the Atmosphere of Daejeon, Korea. Atmosphere 2024, 15, 267. https://doi.org/10.3390/atmos15030267
AMA Style
Kim K, Lee C, Choi D, Han S, Eom J, Han J. A Study on the Formation Reactions and Conversion Mechanisms of HONO and HNO3 in the Atmosphere of Daejeon, Korea. Atmosphere. 2024; 15(3):267. https://doi.org/10.3390/atmos15030267
Chicago/Turabian StyleKim, Kyoungchan, Chunsang Lee, Dayeong Choi, Sangwoo Han, Jiwon Eom, and Jinseok Han. 2024. "A Study on the Formation Reactions and Conversion Mechanisms of HONO and HNO3 in the Atmosphere of Daejeon, Korea" Atmosphere 15, no. 3: 267. https://doi.org/10.3390/atmos15030267
Note that from the first issue of 2016, this journal uses article numbers instead of page numbers. See further details here.