Article

The WRF-CMAQ Simulation of a Complex Pollution Episode with High-Level O3 and PM2.5 over the North China Plain: Pollution Characteristics and Causes

1
Key Laboratory of Environmental Remediation and Ecological Health, Ministry of Education, Research Center for Air Pollution and Health, College of Environmental and Resource Sciences, Zhejiang University, Hangzhou 310058, China
2
School of Environmental Sciences and Engineering, Zhejiang Gongshang University, Hangzhou 310018, China
3
State Key Laboratory of Infrared Physics, Shanghai Institute of Technical Physics, Chinese Academy of Sciences, Shanghai 200031, China
*
Authors to whom correspondence should be addressed.
Atmosphere 2024, 15(2), 198; https://doi.org/10.3390/atmos15020198
Submission received: 9 January 2024 / Revised: 28 January 2024 / Accepted: 2 February 2024 / Published: 4 February 2024
(This article belongs to the Special Issue Advances in Urban Air Pollution Observation and Simulation)

Abstract

:
The problem of atmospheric complex pollution led by PM2.5 and O3 has become an important factor restricting the improvement of air quality in China. In drawing on observations and Weather Research and Forecasting-Community Multiscale Air Quality (WRF-CMAQ) model simulations, this study analyzed the characteristics and causes of a regional PM2.5-O3 complex pollution episode in North China Plain, in the period from 3 to 5 April 2019. The results showed that in static and stable weather conditions with high temperature and low wind speed, despite photochemical reactions of O3 near the ground being weakened by high PM2.5 concentrations, a large amount of O3 generated through gas-phase chemical reactions at high altitudes was transported downwards and increased the O3 concentrations at the ground level. The high ground-level O3 could facilitate both the conversion of SO2 and NO2 into secondary inorganic salts and volatile organic compounds into secondary organic aerosols, thereby amplifying PM2.5 concentrations and exacerbating air pollution. The contributions of transport from outside sources to PM2.5 (above 60%) and O3 (above 46%) increased significantly during the episode. This study will play an instrumental role in helping researchers to comprehend the factors that contribute to complex pollution in China, and also offers valuable references for air pollution management.

1. Introduction

Rapid economic development and significant rises in energy consumption have resulted in regional and complex pollution emerging as the foremost air pollution challenge in China [1,2,3]. The prominent feature of this complex pollution is the high mass concentrations of atmospheric oxidizing species, represented by ozone (O3), and fine particulate matter (PM2.5) (an aerodynamic diameter ≤ 2.5 μm) [4]. In recent years, with the implementation of various atmospheric control measures, PM2.5 pollution has been alleviated to a certain extent in China [5,6]. Nonetheless, owing to the relatively inadequate regulation of volatile organic compound (VOC) emissions and the intricate nonlinear connection between O3 and its precursors, concentrations of O3 show an upward trend [7,8]. The challenge of PM2.5 pollution remains unresolved, and O3 pollution is gradually emerging, contributing to a severe environmental scenario marked by the increasingly conspicuous features of PM2.5 and O3 complex pollution in China. Although O3 in the stratosphere benefits life on Earth by filtering out harmful ultraviolet radiation from the sun, O3 and PM2.5 can have adverse effects on human health on the ground. The level of simultaneous exposure to PM2.5 and O3 is highly correlated with an increased risk to human health, including cardiovascular and respiratory diseases [9,10,11].
At present, PM2.5 is the largest factor causing air pollution in China, followed by PM10 and O3 [12]. The concentrations of PM2.5 were higher in winter than in summer, and decreased with increasing altitude [13]. In northern cities of China, PM2.5 concentrations were generally high [14], and total particle number concentrations did not decrease much from urban to rural areas or even remote environments [15]. This is in contrast to Europe, where average total particle number concentrations in urban environments are usually higher than those in rural environments [16,17]. PM2.5 concentrations are influenced by anthropogenic emissions and meteorological conditions [18]. The high concentrations of PM2.5 in northern China were related to emissions from fossil fuel combustion and biomass combustion [19]. More coal-fired industries (such as coal-fired power plants, steel manufacturing, etc.) and household heating based on coal and biomass during winter (mid November to mid March) led to higher emissions and PM concentrations in the northern region [20]. The impact mechanism of meteorological factors on PM concentrations is relatively complex, and the impact of a single meteorological factor depends on its combination with other factors. Moreover, the same meteorological element has different or even opposite effects on the inflow and outflow of PM [21]. PM2.5 is more susceptible to meteorological conditions than PM10 [22]. The studies showed that terrain played a crucial role in the generation and migration of PM [23]. The wind azimuth has a significant impact on the outflow of PM, while wind speed and direction have a significant impact on the inflow of PM [21]. Temperature and relative humidity are also correlated with the concentration of PM2.5 [22]. These results reflect the important role of meteorological factors in the air pollution processes that occur in different seasons and significant changes in geological regions.
O3 is a secondary pollutant formed in the atmosphere through the photochemical reactions of nitrogen oxides (NOx) and VOCs [24,25]. Power plants, industry, and transportation are the main sources of NOx [26], while VOCs are released from more diverse sources, such as vehicle exhausts, evaporative fuels and solvents, consumer goods, and trees. There is no significant spatial distribution difference between nitrogen dioxide (NO2) and O3, and O3 is more divergent in space than NO2, reflecting the complex nonlinear relationship between O3 and NOx [14]. NOx can cause a decrease or increase in O3 concentrations, depending on the relative ratios of NOx to VOC. Generally speaking, in urban areas with high NOx/VOC ratios, the production of O3 is limited by VOC, resulting in a decreased NOx titration of O3 and free radicals. The reduction in NOx emissions will tend to increase O3 concentrations. In contrast, in rural areas where NOx/VOCs ratios are typically low, reducing NOx emissions will lower O3 concentrations [27]. In many cities and industrialized regions around the world, the increase in O3 concentrations in the lower atmosphere remains a persistent environmental problem. The surface O3 concentrations in developed areas or nearby areas of China are increasing, and the growth rates in rural areas are lower than those in urban core areas, which are both the result of reduced NOx emissions. In terms of space, there are O3 hotspots all over eastern China, especially in the North China Plain (NCP) and the Yangtze River Delta (YRD), which are mainly caused by human sources producing high-level O3 precursors. Some western cities also experienced severe O3 pollution, such as central Gansu Province, which may be due to the unique terrain (mountainous valleys and basins), coupled with high local O3 precursor emissions from the petrochemical industry and vehicles [28]. The distribution ranges of O3 in China were comparable to those of Europe and the United States, but the scale and frequency of high O3 events in China were much higher. Since the 1990s, severe O3 pollution in many urban areas of Europe and the United States has been widely alleviated by strict emission control measures [29,30]. Meanwhile, South and East Asia have experienced rapid urbanization and industrialization, leading to a significant increase in anthropogenic O3 precursor emissions and potentially shifting global air pollution hotspots to densely populated areas such as India [31] and Mexico City [32]. However, after 2020 the overall O3 pollution levels in most typical regions of China decreased [33], which may be explained by the coordinated control measures for PM2.5 and O3 implemented by the Chinese government [34] and the continuous impact of COVID-19 in China. Meanwhile, meteorological changes can also have a significant impact on surface O3 concentrations. Meteorological conditions have a strong impact on the production and distribution of O3 by changing air transport patterns, the dry and wet deposition of gases and aerosols, and the rates of chemical reactions and natural emissions [35].
Although the peak seasons for PM2.5 and O3 pollutions are different, as shown by cold-season PM2.5 pollution and warm-season O3 pollution [3], simultaneous occurrences of high concentrations of PM2.5 and O3 (PM2.5-O3 complex pollution) have been observed from time to time. Mao et al. [36] pointed out that PM2.5-O3 complex pollution events accounted for 33.4% of total O3 pollution events in Shanghai from 2013 to 2017. Xiao et al. [37] found there was a total of 34 days of PM2.5-O3 complex pollution in Tianjin from 2017 to 2019, which appeared between March and September and then slightly increased every year. Simultaneous exposure to both PM2.5 and O3 results in disproportionately more severe health effects than individual exposure to either pollutant [38,39]. While previous studies have thoroughly explored PM2.5 and/or O3 pollution [40,41,42], there is a notable lack of research that specifically addresses air pollution events characterized by simultaneously high concentrations of PM2.5 and O3.
Several studies in China have analyzed the causes of PM2.5-O3 complex pollution from the perspective of meteorology. For example, by drawing on field observations in Shanghai from 2014 to 2016, Yang et al. [43] found that days with simultaneously high concentrations of PM2.5 and O3 constituted 1.0% of the entire study period. These events were predominantly observed in stable weather conditions marked by high temperatures, relatively high humidity, and low wind speeds. Lai et al. [44] found that the formation of PM2.5-O3 complex pollution in the Pearl River Delta (PRD) region was favored in specific weather conditions, including continental cold high, tropical cyclone, and denatured high, with the occurrence frequency accounting for 49.4%, 21.9%, and 20.7%, respectively. Zhao et al. [45] found that, compared with single PM2.5 or O3 pollution, complex pollution in Handan imposes more stringent requirements on meteorological elements, requiring temperatures from 21 to 29 °C, high humidity, and low wind speed and air pressure. Wang et al. [46] analyzed two PM2.5-O3 complex pollution events in Beijing on 2 August and 21 August 2014, and revealed that the synoptic situations in the complex pollution were characterized as westerly gas flow at a height of 500 hPa height, with low pressure at the ground. In addition to observational analyses, the simulation of PM2.5-O3 complex pollution by the chemical transport models (CTMs) can also provide significant information, and contribute to the understanding of pollution characteristics and causes. Lai et al. [47] simulated a regional PM2.5-O3 complex pollution event in the PRD region on 27 October 2014 by using the Weather Research and Forecasting-Chemistry (WRF-Chem) model, and found that high O3 concentrations were associated with both physical and gas-phase photochemical processes; and also found high PM2.5 concentrations were related to high initial concentrations and a large production amount of secondary inorganic aerosols. However, at present, few studies have used CTMs to analyze PM2.5-O3 complex pollution.
Corresponding reports abroad have highlighted simultaneous occurrences of PM2.5 and O3 pollution. For example, Kalashnikov et al. [38] defined the extreme values of PM2.5 and O3 in each region as the daily average of local PM2.5 and the 90th percentile value of the maximum daily 8-h average concentration of ozone (MDA8_O3) within each year, respectively. If PM2.5 and O3 exceeds the extreme values, it is considered as the co-occurrences of PM2.5 and O3 pollution (complex pollution). A fixed threshold is not used to define complex pollutions because this spatiotemporal extreme value can take into account both the overall air quality improvement due to emission reduction and stricter national air quality standards. The results indicate that, from 2001 to 2020, the frequency, spatial range, and temporal persistence of extreme PM2.5-O3 events in the western United States significantly increased, resulting in approximately 25 million more people being exposed to various harmful air pollutants annually [38]. And it is speculated that with the continuous warming of the climate, the possibility of complex pollution events occurring simultaneously in the western United States will increase. However, few worldwide studies have conducted in-depth analysis of the characteristics and causes of PM2.5-O3 complex pollution, and the findings of our study could therefore fill the gap in the related fields. Currently, many studies have utilized machine learning techniques and big data analysis to identify hotspots, cold spots, and air pollution patterns in air pollution research [48]. Kovacs and Haidu [49] used principal component analysis of multidimensional satellite images to study NO2 changes, and modeled tropospheric NO2 concentrations by using developed principal component analysis models for air pollution estimation, fully demonstrating the reliability of principal component analysis in identifying and predicting patterns of air pollution changes.
The NCP region is densely populated and heavily industrialized, and is the area of China that is most seriously affected by PM2.5 and O3 pollution [3,14,28]. In this study, the Weather Research and Forecasting-Community Multiscale Air Quality (WRF-CMAQ) model was utilized to investigate a regional PM2.5-O3 complex pollution episode in the NCP region from 3 to 5 April 2019. The study conducted an analysis of pollution characteristics and weather situations, and also examined the formation mechanism and source apportionment. The novelty of this study lies in the fact that typical pollution events in the NCP, where PM2.5 and O3 pollution are relatively serious, are selected for research. Secondly, a more in-depth analysis of the formation mechanism of regional PM2.5-O3 composite pollution is conducted through PM2.5 chemical composition analysis and O3 process analysis. Thirdly, the contribution of regional transports to this pollution episode is revealed through ISAM source analyses. The findings of this research can contribute to a better understanding of the causes of complex pollution and offer valuable insights to current air quality management, not only in China, but also around the world.

2. Materials and Methods

2.1. Observations

The measurements of meteorological parameters used in this study, including 2 m temperature (T2), 2 m relative humidity (RH2), 10 m wind speed (WS10), and 10 m wind direction (WD10), were obtained from the National Climate Data Center (NCDC, ftp://ftp.ncdc.noaa.gov/pub/data/noaa/, accessed on 1 November 2023). NCDC is under the jurisdiction of the National Oceanic and Atmospheric Administration (NOAA) in the United States, and its meteorological observation data have a time resolution of 3 h. The surface weather charts were provided by the Hong Kong Observatory (http://envf.ust.hk/dataview/hko_wc/current/, accessed on 1 November 2023). Hourly PM2.5 and O3 observation data of 367 Chinese prefecture-level cities were obtained from the China National Environmental Monitoring Center (CNEMC, http://www.cnemc.cn/, accessed on 1 November 2023). The data collections of CNEMC were conducted with the guidance of the grade II national standard for ambient air quality (GB3095-2012) [50], and the technical guideline on environmental monitoring quality management (HJ630-2011) [51]. In accordance with GB3095-2012, we defined the PM2.5-O3 complex pollution as the daily average concentration of PM2.5 exceeding 75 μg/m3 and MDA8_O3 exceeding 160 μg/m3 (on the same day). We then selected a regional PM2.5-O3 complex pollution episode in the NCP region from 3 to 5 April 2019 and chose 4 typical cities (Handan, Jining, Anyang, Kaifeng) as the analytical objects (Figure 1).

2.2. WRF-CMAQ Model Configuration

In this study, the offline WRF (v3.9.1)-CMAQ (v5.3.2) model [52,53,54] was used to simulate the PM2.5-O3 complex pollution. The meteorological output from WRF was processed by Meteorology-Chemistry Interface Processor (v5.1) (MCIP) to the format required by CMAQ. We conducted the simulation period from 00:00 Local Time (LT) on 25 March to 00:00 LT on 10 April 2019, and the first 5 days were used as spin-up to minimize the influence of the initial conditions. Figure 1a shows the model domain, with a horizontal resolution of 12 km covering most of China. In the vertical direction, there were 31 sigma layers in the WRF, with the model top fixed at 100 hPa; and for the CMAQ model, there were 12 layers to enhance the modeling proficiency. The detailed physical parameterizations and chemical options in the WRF-CMAQ model were the same as those in Li et al. [55]. The initial and lateral boundary conditions of meteorological fields were provided by the Fifth Generation Atmospheric Reanalysis of the Global Climate (ERA5) dataset of the European Center for Medium-Range Weather Forecasts (ECMWF), which has a spatial resolution of 31 km, a temporal resolution of 1 h and 38 barometric layers in the vertical direction. The default initial and boundary chemical conditions provided in CMAQ were used. The anthropogenic emissions were derived from th Emission Inventory of Air Benefit and Cost and Attainment Assessment System (EI-ABaCAS) established by Tsinghua University [56,57]. The Biogenic Emission Inventory System version 3.14 (BEISv3.14) was used to calculate the natural sources for biogenic emissions.

2.3. The Integrated Process Rate Analysis

In order to analyze the formation mechanism of O3, the integrated process rate (IPR) analysis method embedded in the CMAQ model was applied [58]. IPR can calculate the quantitative contribution of individual physical and chemical processes in a specific grid, including gas-phase chemical reactions (CHEM), cloud processes with the aqueous chemistry (CLDS), dry deposition (DDEP), horizontal advection (HADV), horizontal diffusion (HDIF), vertical advection (ZADV), and vertical diffusion (VDIF). In this study, we defined HTRA (HADV + HDIF) and VTRA (ZADV + VDIF) to represent the net effects of horizontal and vertical transports on the O3 formation, respectively [59]. The CHEM contribution was calculated as the sum of O3 chemical productions and losses in the atmosphere.

2.4. The Integrated Source Apportionment Method

The integrated source apportionment method (ISAM) module, coupled with the CMAQ model, can tag and track the pollutants from different geographic regions and source types, which have been widely applied in the source apportionment of PM2.5 and O3 [60,61,62]. In this study, the ISAM was used to quantify the contributions of different regions, as well as the boundary conditions (BCON) for the regional transports of PM2.5 and O3 in the receptor cities. As shown in Figure 1c, d, there are 10 tagged regions inside China, which are defined on the basis of administrative division: Beijing (BJ), Tianjin (TJ), Hebei (HB), Henan (HN), Shandong (SD), Shanxi (SX), Hubei (HUB), Anhui (AH), Jiangsu (JS), and other regions (OTH) inside China

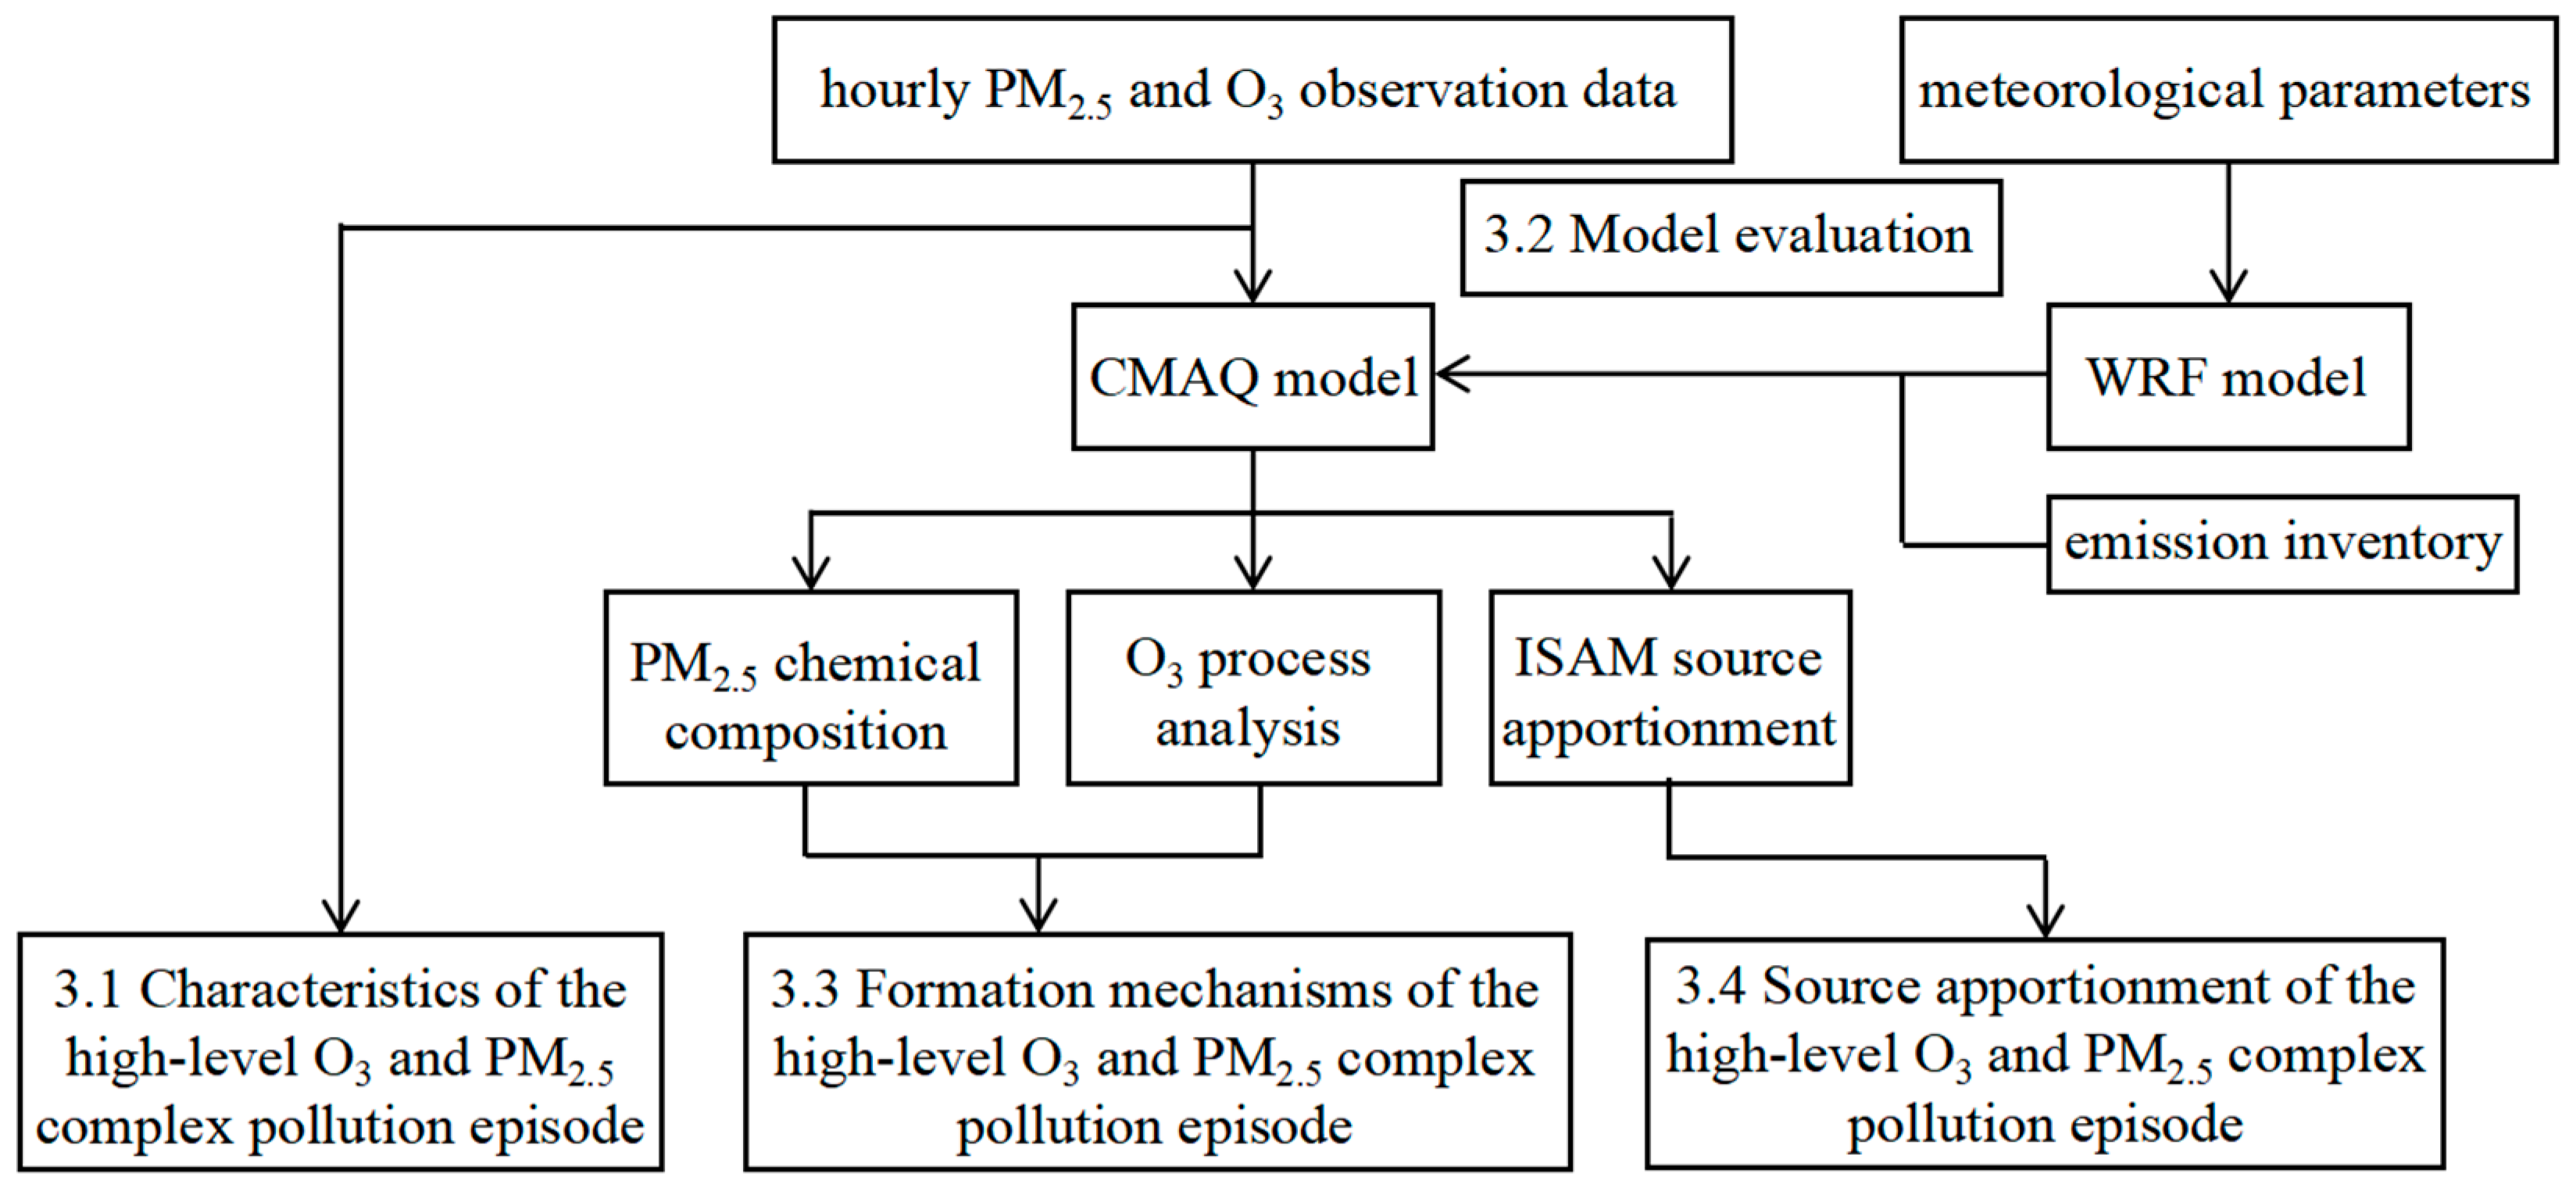
2.5. The Technical Workflow

Figure 2 shows the step-by-step technical workflow of this study. On the basis of air quality monitoring data, this study analyzed the temporal and spatial characteristics of a regional PM2.5-O3 complex pollution episode in NCP in 2019; the simulation effects of WRF and CMAQ models were also evaluated using observed data. The WRF-CMAQ model was used, for PM2.5 chemical composition analysis, O3 process analysis, and ISAM source apportionment, to analyze the formation mechanism and source apportionment of this complex pollution episode.

3. Results

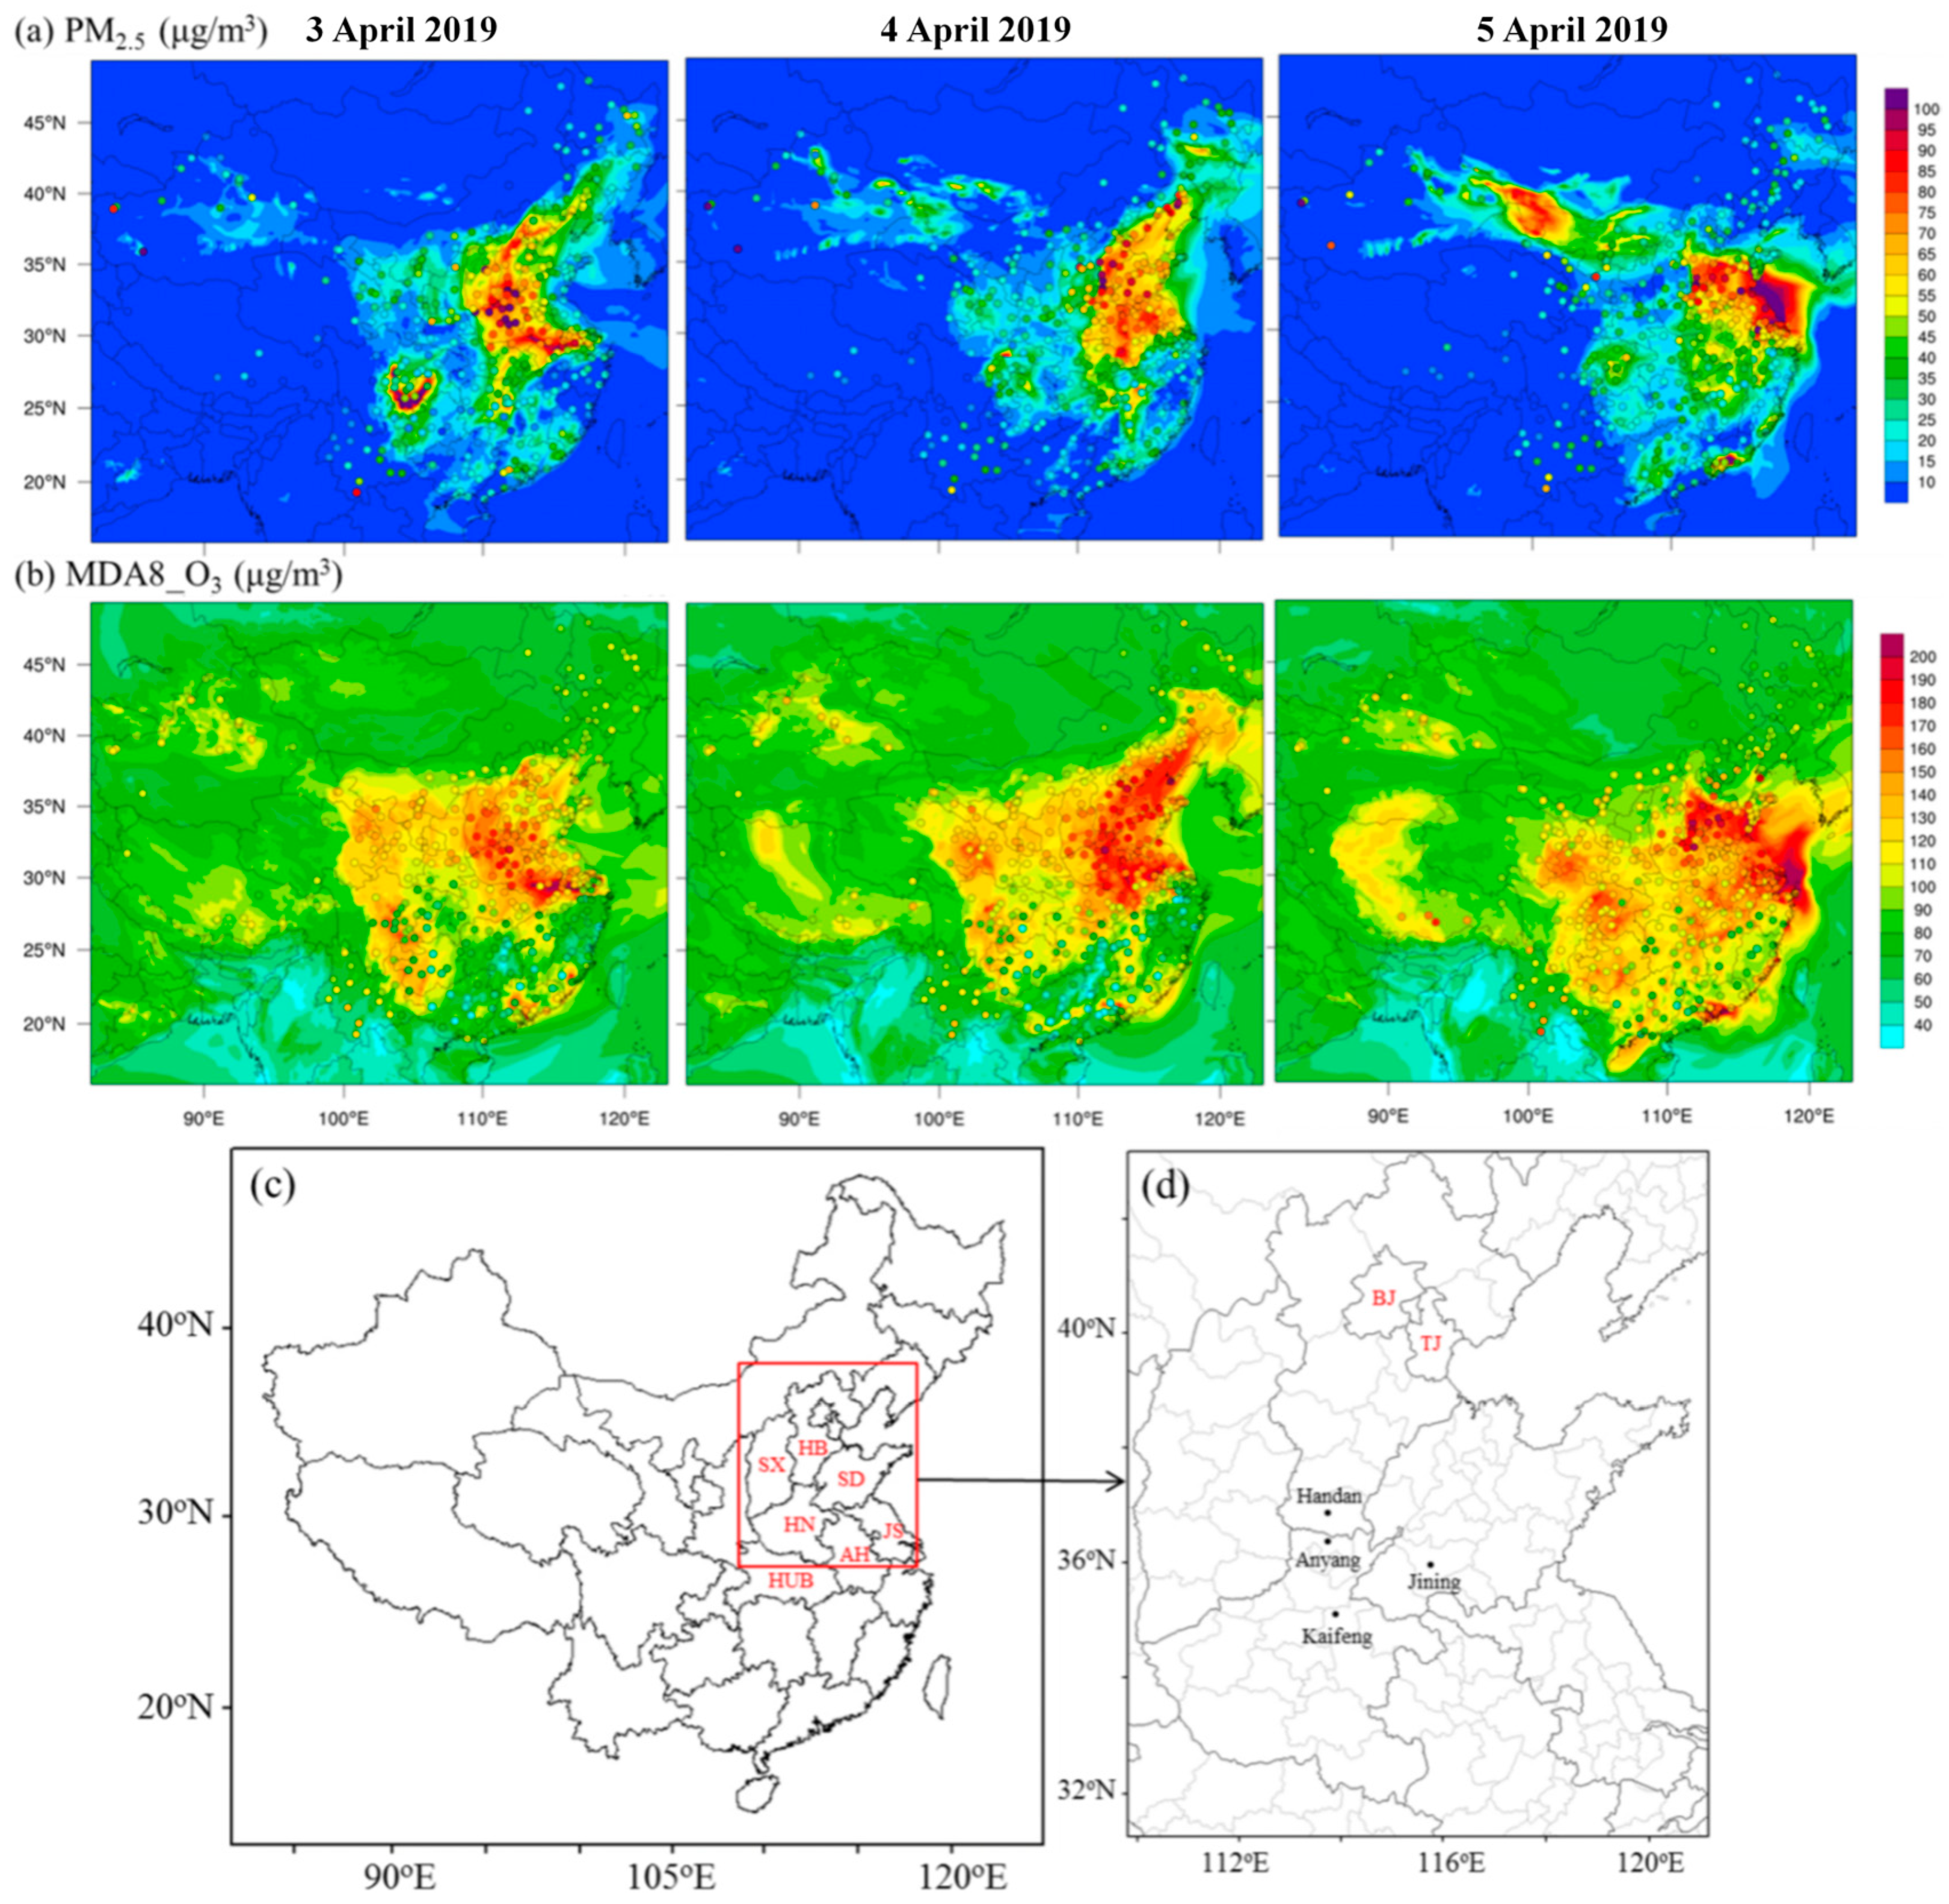
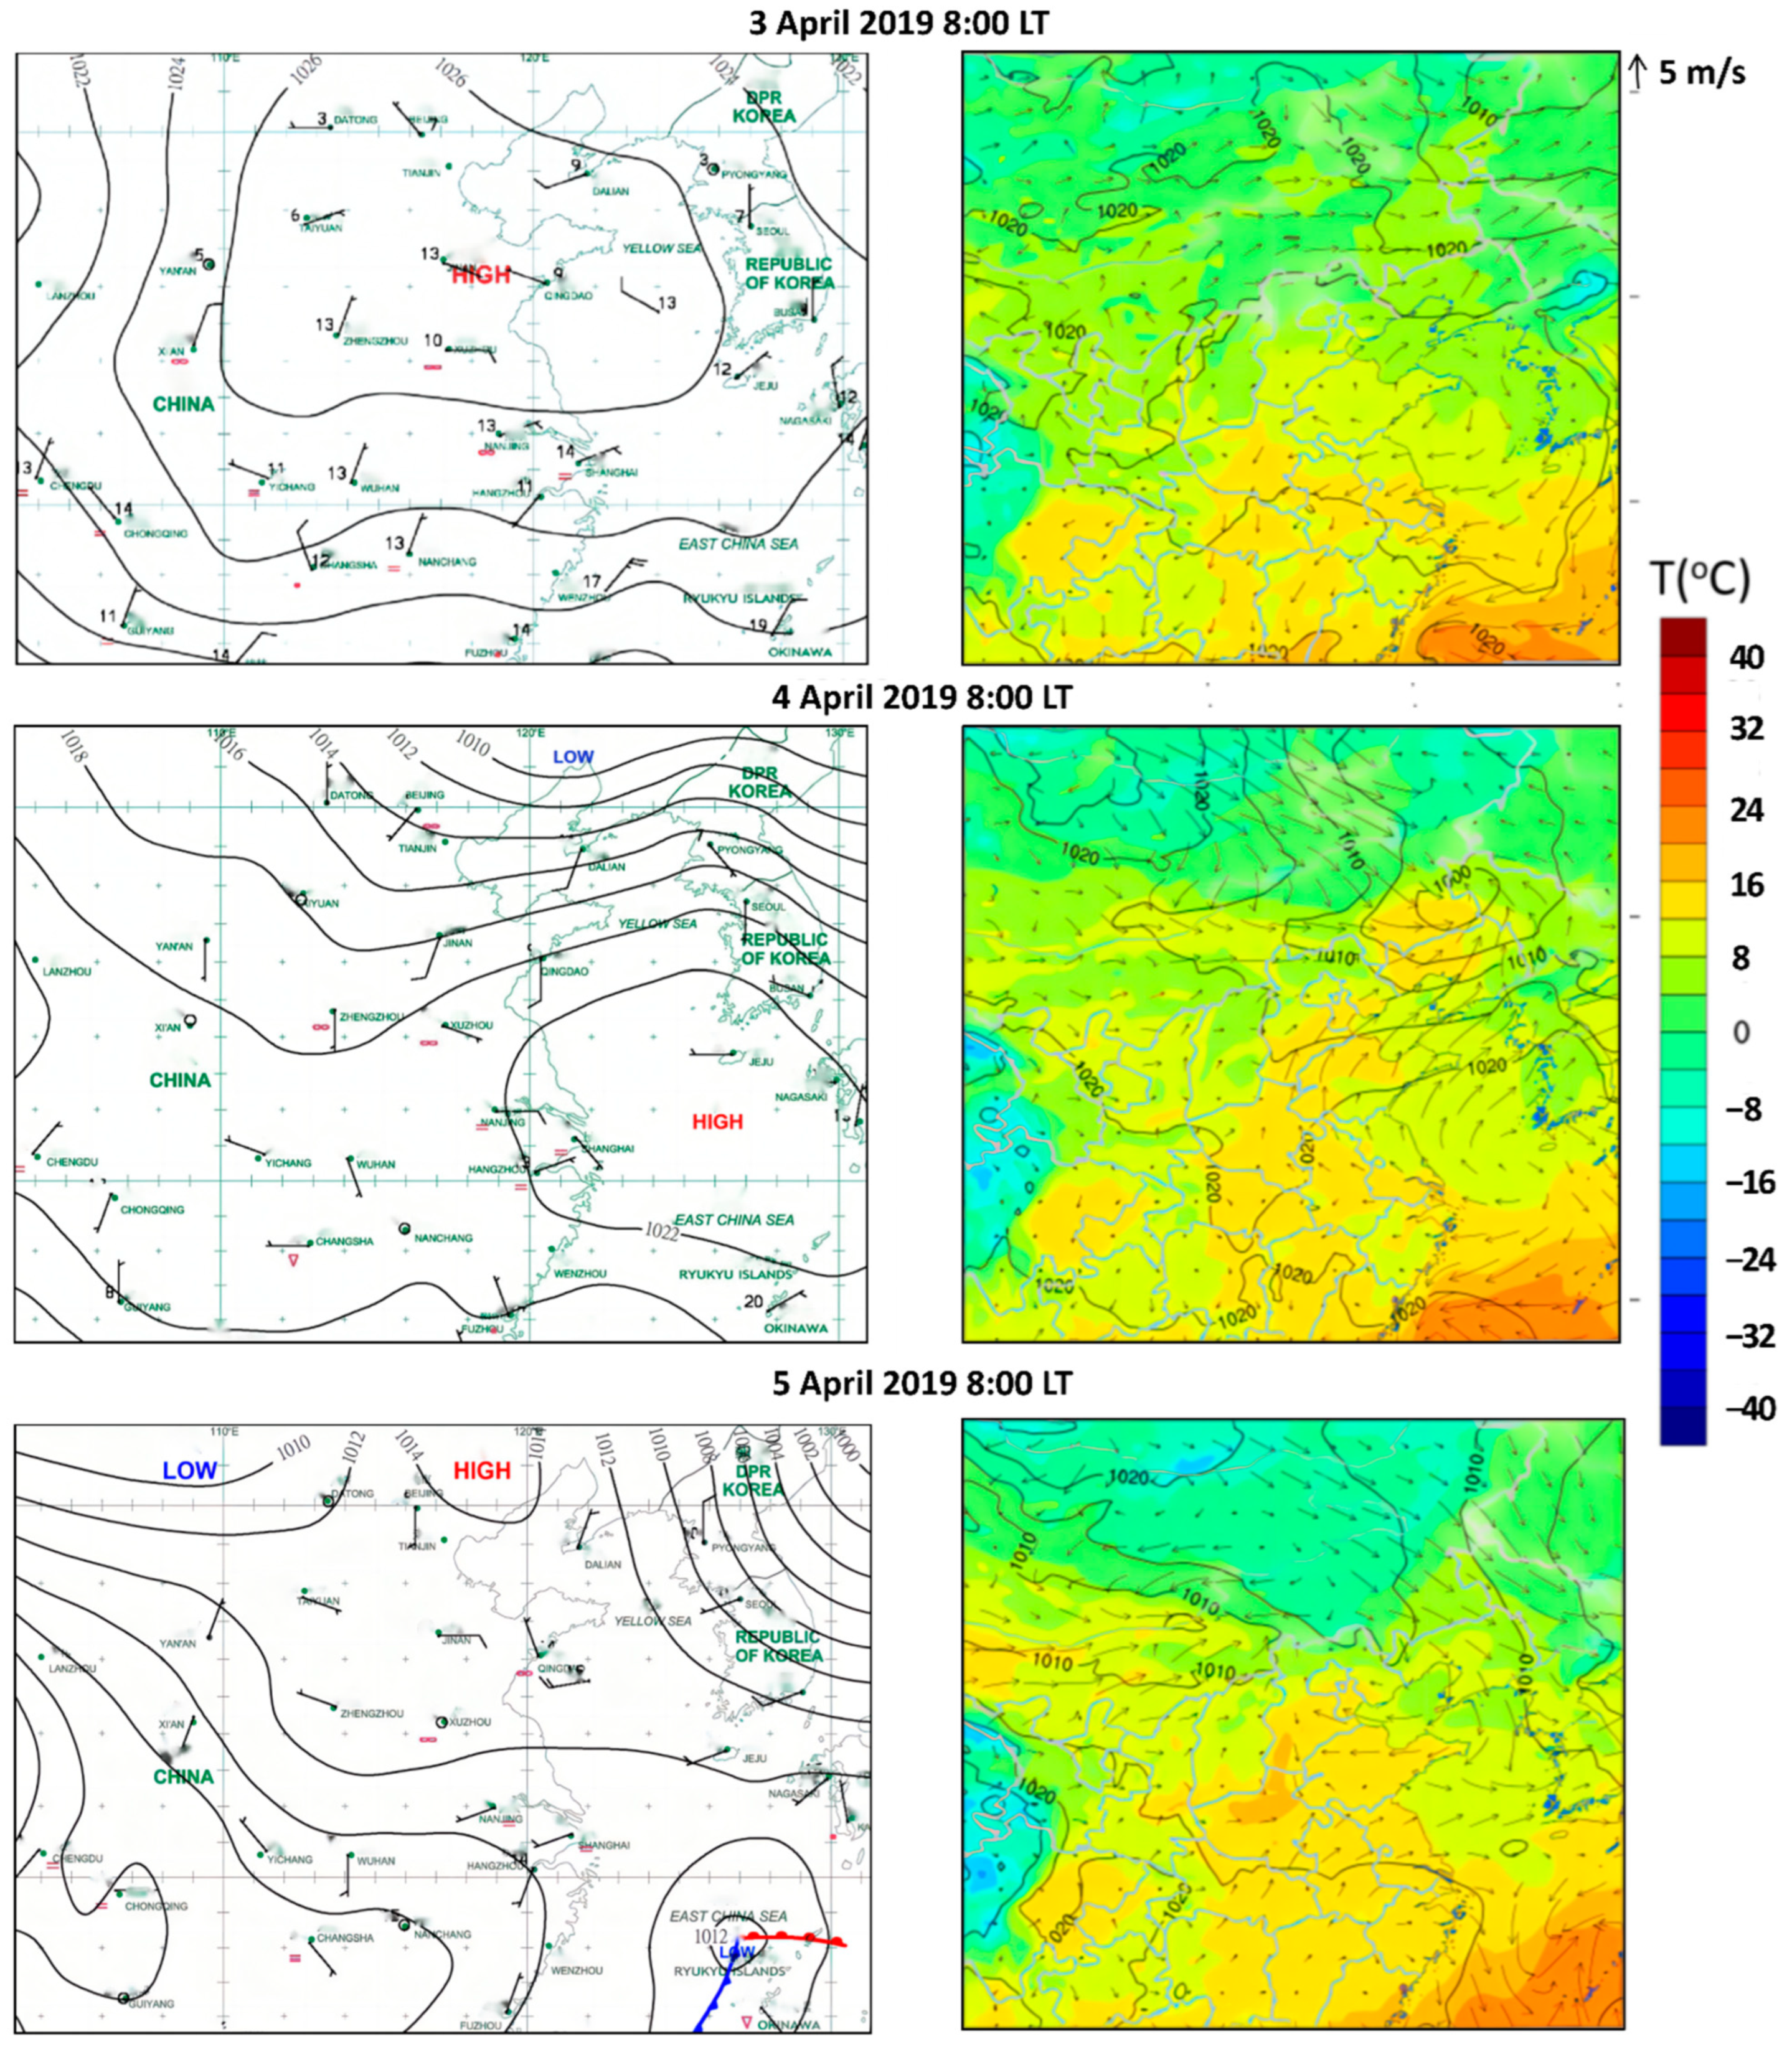
3.1. Characteristics of the High-Level O3 and PM2.5 Complex Pollution Episode

Figure 1a,b show the spatial distributions of the PM2.5 and MDA8_O3 concentrations over mainland China from 3 to 5 April 2019, when a large-scale complex pollution process of high-level PM2.5 and O3 concentrations occurred in the NCP region. Over a span of three consecutive days, concentrations of both PM2.5 and O3 in more than 10 cities simultaneously exceeded the grade II national standard. Among them, Handan, Jining, Anyang, and Kaifeng experienced successive complex pollution on three days. Thus, we focused on these four cities to investigate the characteristics and causes of this PM2.5-O3 complex pollution episode. As shown in Figure 3, concentrations of PM2.5 in all four cities exceeded 75 μg/m3 on 2 April, suggesting that the PM2.5 had accumulated before the occurrence of the complex pollution. Concentrations of both PM2.5 and O3 during the complex pollution episode are high in Figure 3, indicating that, despite the high PM2.5, concentrations reduced the intensity of solar radiation reaching the surface, there were still active photochemical reactions that could produce O3.
From 30 March to 5 April, the T and RH values of each city exhibited a predominantly ascending pattern (Figure 3), and with the T values notably peaking during the episode of complex pollution. After 6 April, precipitation occurred successively in the various regions, with decreases of T on 7 April being accompanied by increases of RH. Figure 4 shows the surface weather and surface wind field charts at 8:00 from 3 to 5 April. At 8:00 on 3 April, Shandong Province was located in a center of high pressure, the weather was sunny, and the ground wind speed was low. Governed by an anticyclone, the horizontal airflow in Shandong Province exhibited a clockwise divergence. Then, the high-pressure center moved to the southeast and entered the East China Sea at 8:00 on 4 April. At this time, a low-pressure system in the Northeast emerged and underwent subsequent development. The NCP region was situated in proximity to a subdued low-pressure trough, with surface winds shifting from the southeast towards the NCP, and from the southwest towards the northeast. At 8:00 on 5 April, the NCP region was located between the high pressure in the Qinghai Tibet Plateau and the low pressure in the Japan Sea. Under the control of the pressure equalizing field, there was air convergence at the junction of Hebei, Henan, and Shandong, with small pressure gradient, weak wind and sunny weather. In short, throughout the complex pollution episode, the NCP region experienced predominantly sunny conditions due to the influence of static and stable weather. This entailed high temperatures, low wind speeds, and unfavorable atmospheric diffusion conditions, resulting in the accumulation of pollutants and facilitating photochemical reactions, ultimately leading to the formation of pollution. This was consistent with the research findings of Wang et al. [46] and Li et al. [63].

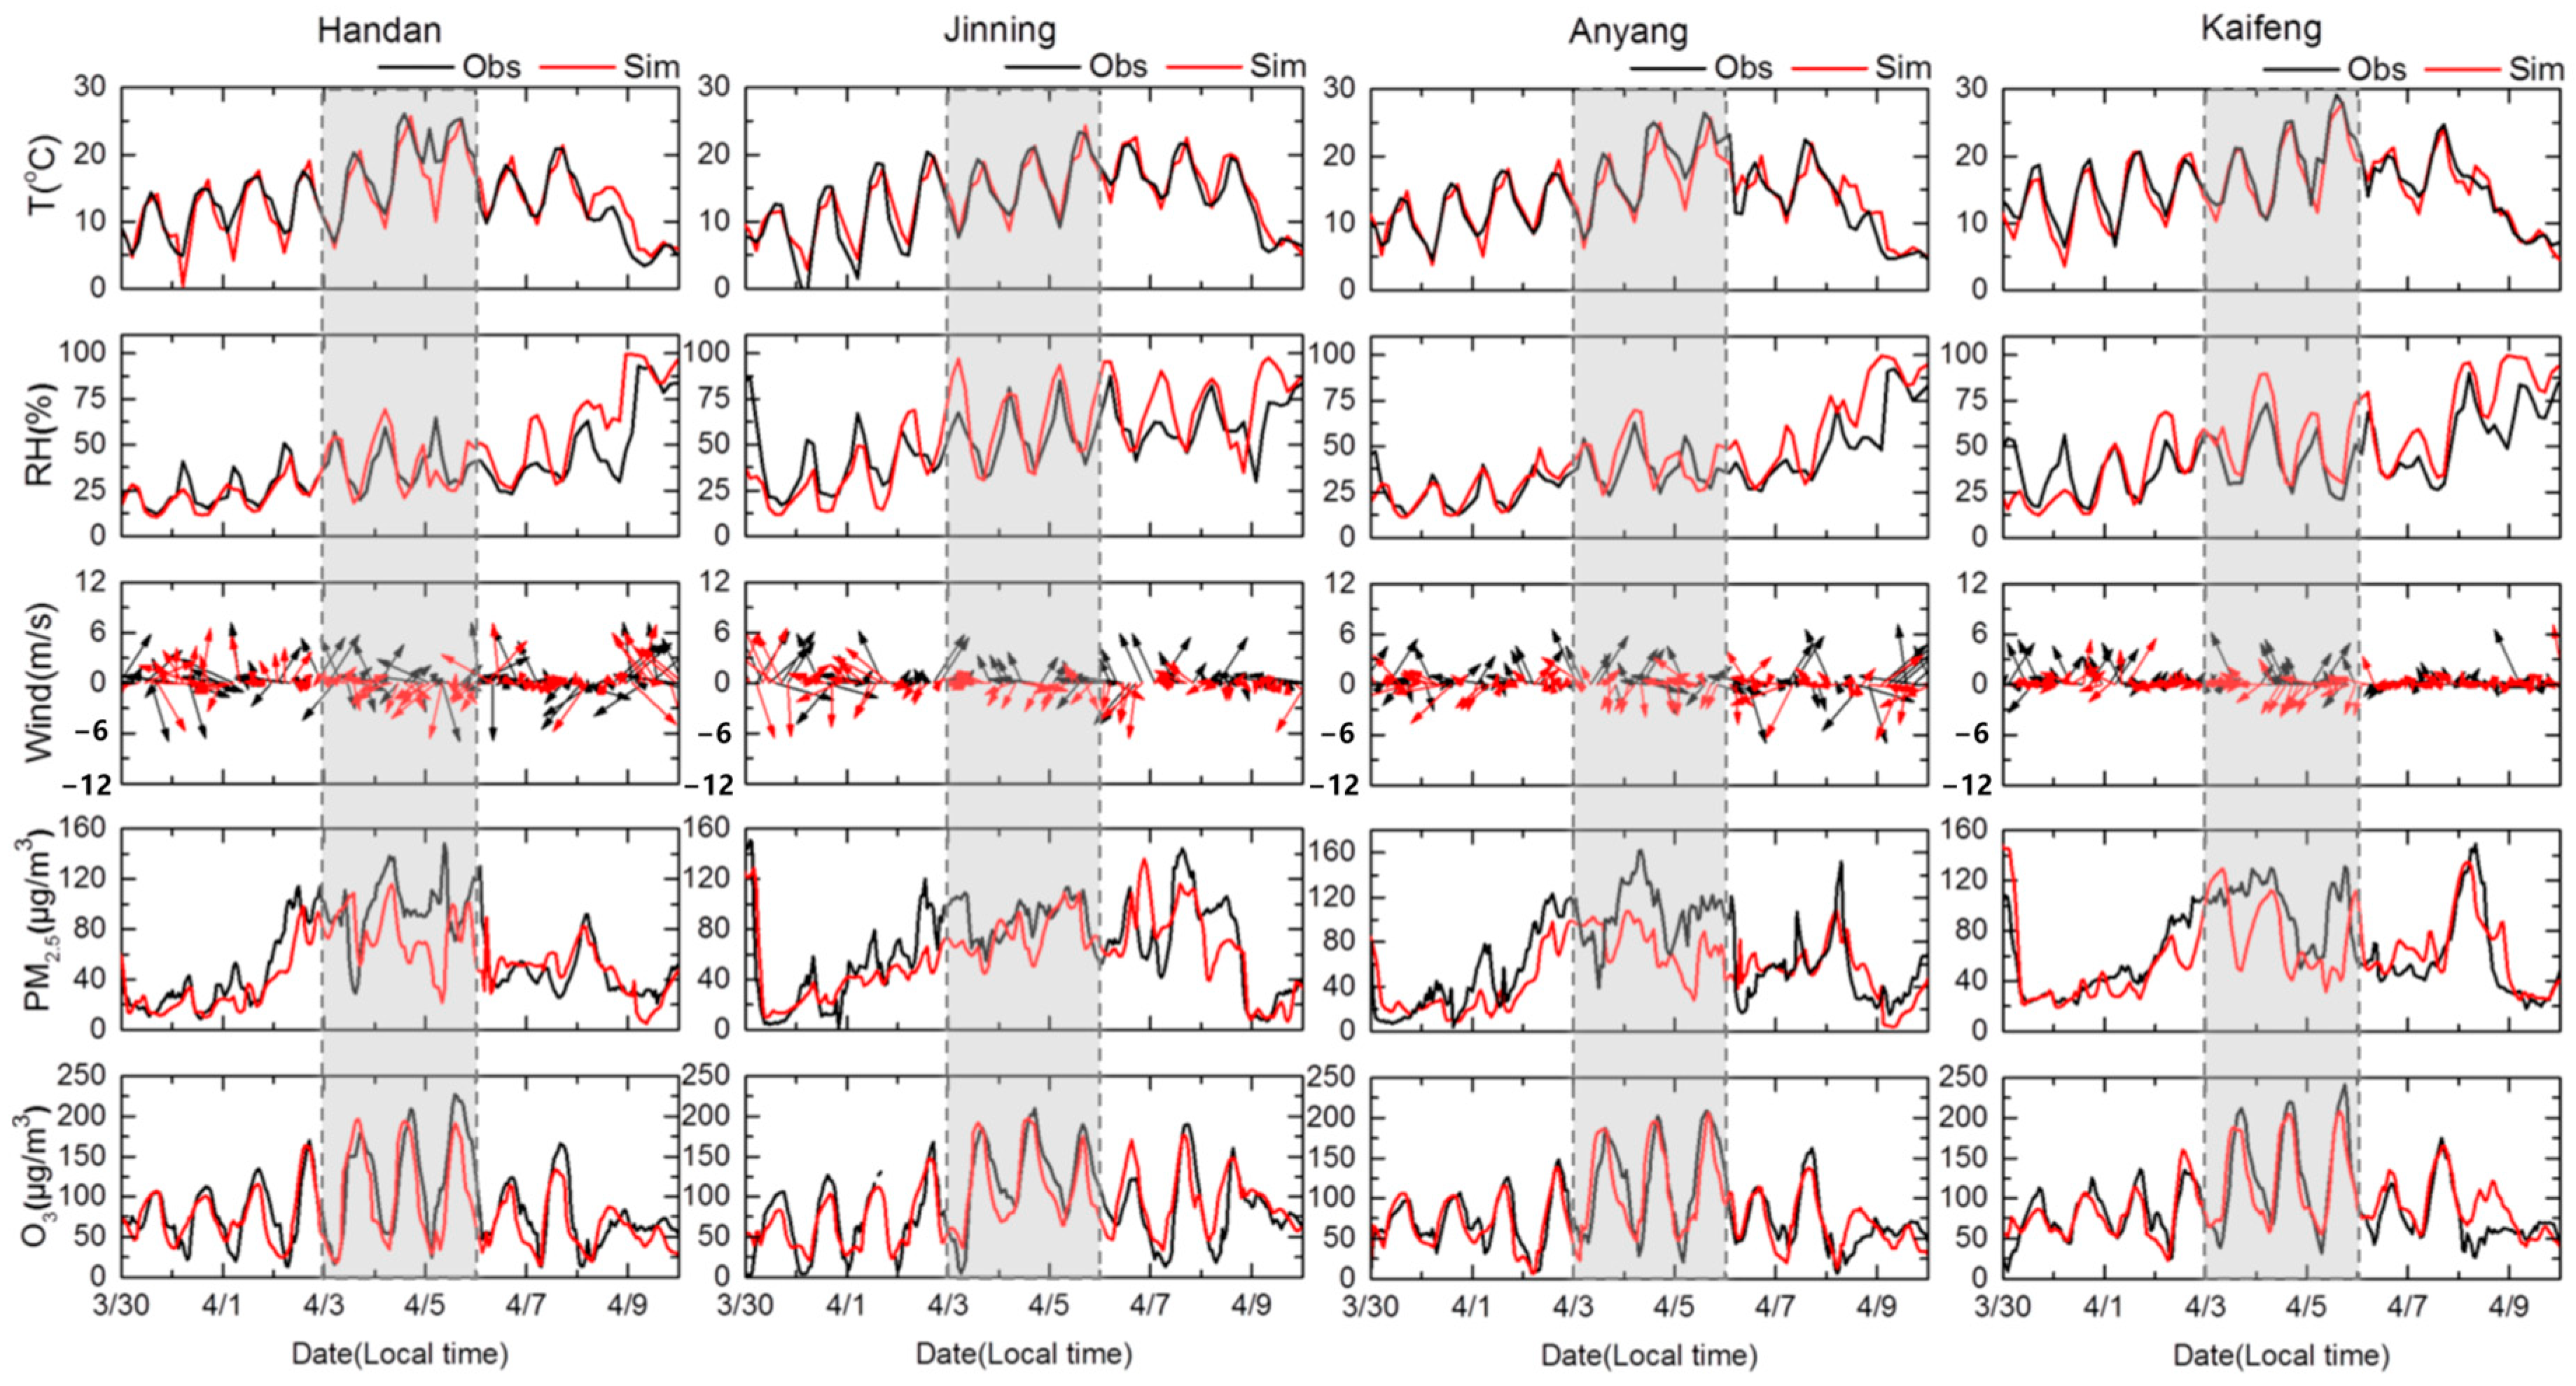
3.2. Model Evaluation

The modeling results were compared with the observations to evaluate the WRF-CMAQ simulation performance. Table S1 presents the statistical metrics, including mean bias (MB), mean error (ME), root mean square error (RMSE), and the index of agreement (IOA) for T2, RH2, WS10, and WD10 in Handan, Jining, Anyang, and Kaifeng. Additionally, normalized mean bias (NMB), normalized mean error (NME), and the Pearson’s correlation coefficient (R) were added to assess the PM2.5 and O3 simulations, as shown in Table S2. The definitions of these statistical metrics can be found in the Supplementary Materials [53].
As shown in Table S1 and Figure 2, the WRF model captured the variations of T2 well, with MB values between −0.46 and 0.39 °C, and IOA values higher than 0.95 in the four cities. The T2 values of Jining were overestimated, and the values of the other three cities were slightly underestimated. Similar to T2, the simulated RH2 showed a good fit with the observations, with IOA values between 0.87 and 0.93. The model overestimated the RH2 of the four cities slightly, with MB values varying from 1.72 to 4.19%. For WS10, with the exception of the underestimation in Handan (MB = −0.73 m/s), positive biases were acquired in the other three cities, with the MB values ranging from 0.67 to 1.70 m/s, and IOA values mainly between 0.71 and 0.80 (except Jining, with 0.53). Since the WS10 data provided by NCDC were presented as integer values, their relative inaccuracy could potentially amplify disparities between observations and simulations. Compared to the other three meteorological parameters, the WD10 simulations were relatively weak, with MB and IOA values ranging from −27.26 to −19.09 °C and 0.52 to 0.79, respectively. The significant bias observed in WD10 resulted from various factors, including the deviation in time resolution between observations and simulations [61], and the insufficient resolution of land use and land cover data [64]. In conclusion, the WRF model could reflect the actual meteorological conditions and provide accurate meteorological fields to the CMAQ simulation.
As shown in Table S2 and Figure 3, the model captured the change trends and peaks of PM2.5 and O3, with R values between 0.73 and 0.81 (except the PM2.5 of Kaifeng, at 0.56). The observed PM2.5 and O3 concentrations were underestimated slightly, with NMB values ranging from −20.5 to −4.2% and −25.4 to 1.3%, respectively. Despite the presence of underestimations in PM2.5 and O3 during the complex pollution, the model effectively captured variabilities in both pollutants, and the underestimations fell within an acceptable range (±30%, US-EPA) [65], meaning it was therefore feasible to use the model results to analyze complex pollution. In addition to the PM2.5 and O3 evaluation of the above four cities, the simulation results over the whole domain during the complex pollution were also evaluated. Figure 1a,b show the comparison of the spatial distributions of the simulated and observed PM2.5 daily average and MDA8_O3 concentrations over mainland China from 3 to 5 April 2019. It can be seen that the high pollution areas of simulated PM2.5 and O3 were basically distributed in the NCP region and its surrounding areas, being consistent with the observations. In general, the CMAQ model performed well in simulating both PM2.5 and O3, and could be used in the subsequent study of the pollution formation mechanism and source apportionment.

3.3. Formation Mechanisms of the High-Level O3 and PM2.5 Complex Pollution Episode

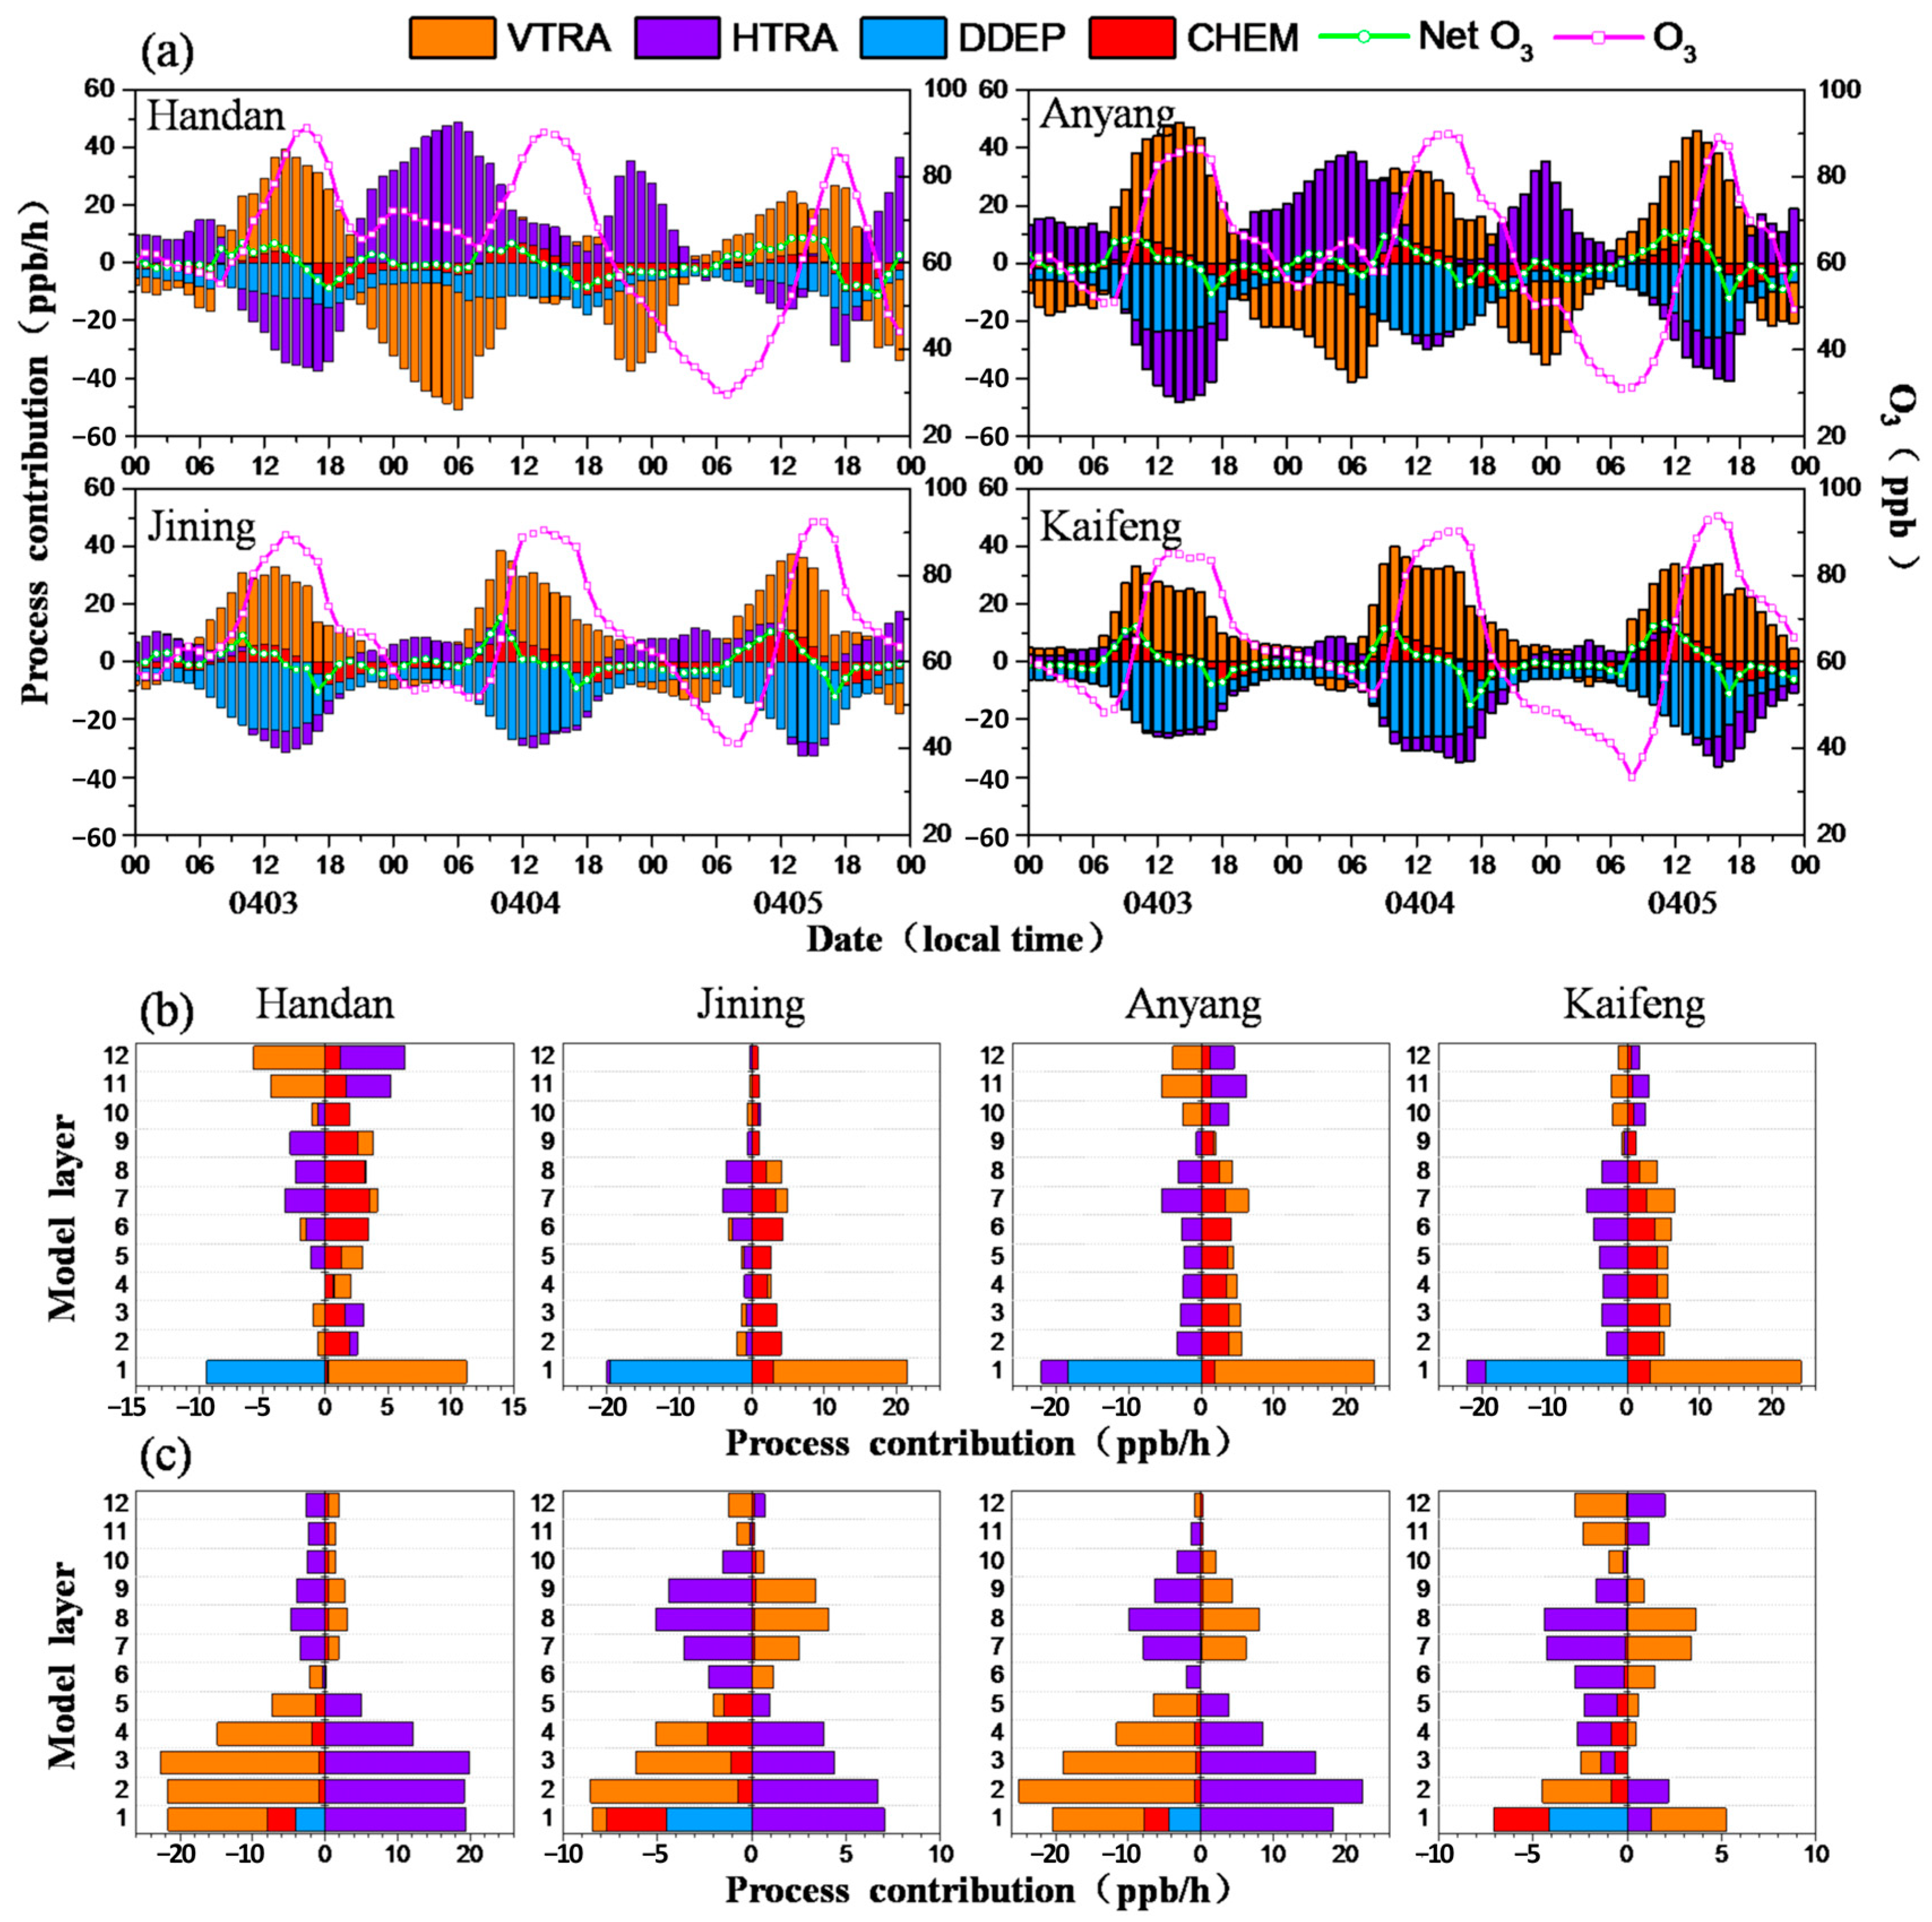
3.3.1. Analysis of O3 Formation Mechanisms

Figure 5a shows the hourly contributions of different atmospheric processes to the formation of surface O3 in Handan, Jining, Anyang, and Kaifeng at the first modeling layer from 3 to 5 April 2019. Similar to previous studies [59,66], the contribution of CLDS was negligible and was not considered in this study because of the sunny weather and few clouds during this pollution episode. Generally, the contribution of CHEM was positive in the daytime (7:00~18:00), due to the active photochemical reactions, and negative at night, due to the chemical loss caused by O3 consuming species (i.e., NO). As shown in Figure 5a, when compared to the other three processes, the contribution of CHEM was relatively weak but consistent with the change trend of net O3, indicating the important role of CHEM in the O3 formation. As an important way of removing gaseous pollutants, DDEP made a significant negative contribution to O3, with −6.72 ppb/h in Handan, −12.02 ppb/h in Jining, −11.35 ppb/h in Anyang, and −11.80 ppb/h in Kaifeng, and was highly related to the concentrations of surface O3 and dry-deposition velocity. The HTRA and VTRA processes were closely related to meteorological conditions (i.e., wind field, boundary layer turbulence), which demonstrated varying positive or negative contributions to O3, both at different times and in different locations. During the complex pollution episode, the HTRA and VTRA contributed most to the formation of O3. The high concentrations of O3 in Handan and Anyang mainly came from both HTRA and VTRA processes, while those in Jining and Kaifeng mainly came from the VTRA process.
Figure 5b,c show the average contributions of each process to O3 formation at different heights during the daytime (7:00~18:00) and nighttime (19:00~6:00), from 3 to 5 April 2019, respectively. During the daytime, CHEM contributed positively to O3, at both near-surface and aloft levels (from 50 to 3400 m above ground, model layers 2~12), with a lower contribution at the surface layer than at high altitudes. This was similar to the results of Li et al. [67], who found that, in August, photochemical reactions at the height of 300~1500 m were stronger than those on the ground in the Yangtze River Delta (YRD) region. A large amount of O3 generated by gas-phase chemistry at high altitudes were transported to the ground, which significantly increased the positive contributions of the surface VTRA to O3, with mean contributions of 10.98 ppb/h in Handan, 18.51 ppb/h in Jining, 21.97 ppb/h in Anyang, and 20.75 ppb/h in Kaifeng. During the nighttime, the negative contribution of CHEM to O3 was less evident above five layers (500 m), and O3 was mainly consumed by gas-phase chemistry in the surface layer, with mean contributions ranging from −3.97 to −2.90 ppb/h in the four cities. Above 500 m, the formation of O3 was mainly affected by HTRA and VTRA, and these two processes had opposite contributions and offset each other.
Generally, in the severe O3 pollution episodes, the contribution of CHEM to the surface O3 in the daytime could reach more than 10 ppb/h [66]. However, our results showed that the mean contributions of CHEM in the four cities were 0.15~3.18 ppb/h during the daytime, of which the highest contribution was 11.0 ppb/h in Kaifeng at 12:00. The contributions of CHEM to the surface O3 in the daytime were significantly reduced during the complex pollution episode, indicating that the high PM2.5 concentrations in the atmosphere weakened the intensity of incident solar radiation due to extinction, thereby weakening O3 photochemistry productions. This was consistent with the results of Gao et al. [68], who also pointed out that the reduction of surface O3 caused by aerosols would lead to the weakening of dry deposition, slowing down the reduction of surface O3 to a certain extent. More importantly, the significant reduction of surface O3 gas-phase chemical production formed a larger O3 vertical gradient, prompting more air masses with high concentrations of O3 to enter the surface from the top of the boundary layer, partially offsetting the reduction of O3 gas-phase chemical production. Therefore, the impacts of aerosols on surface O3 concentration stemmed from the collaborative effects of diverse physical and chemical processes. Previous studies also showed that the complex physicochemical properties of aerosols impacted the generation and loss of near surface O3. The O3 concentrations could be directly affected by changing atmospheric dynamics and photodegradation rates, or indirectly affected by cloud optical thickness and heterogeneous reaction processes [69,70,71].

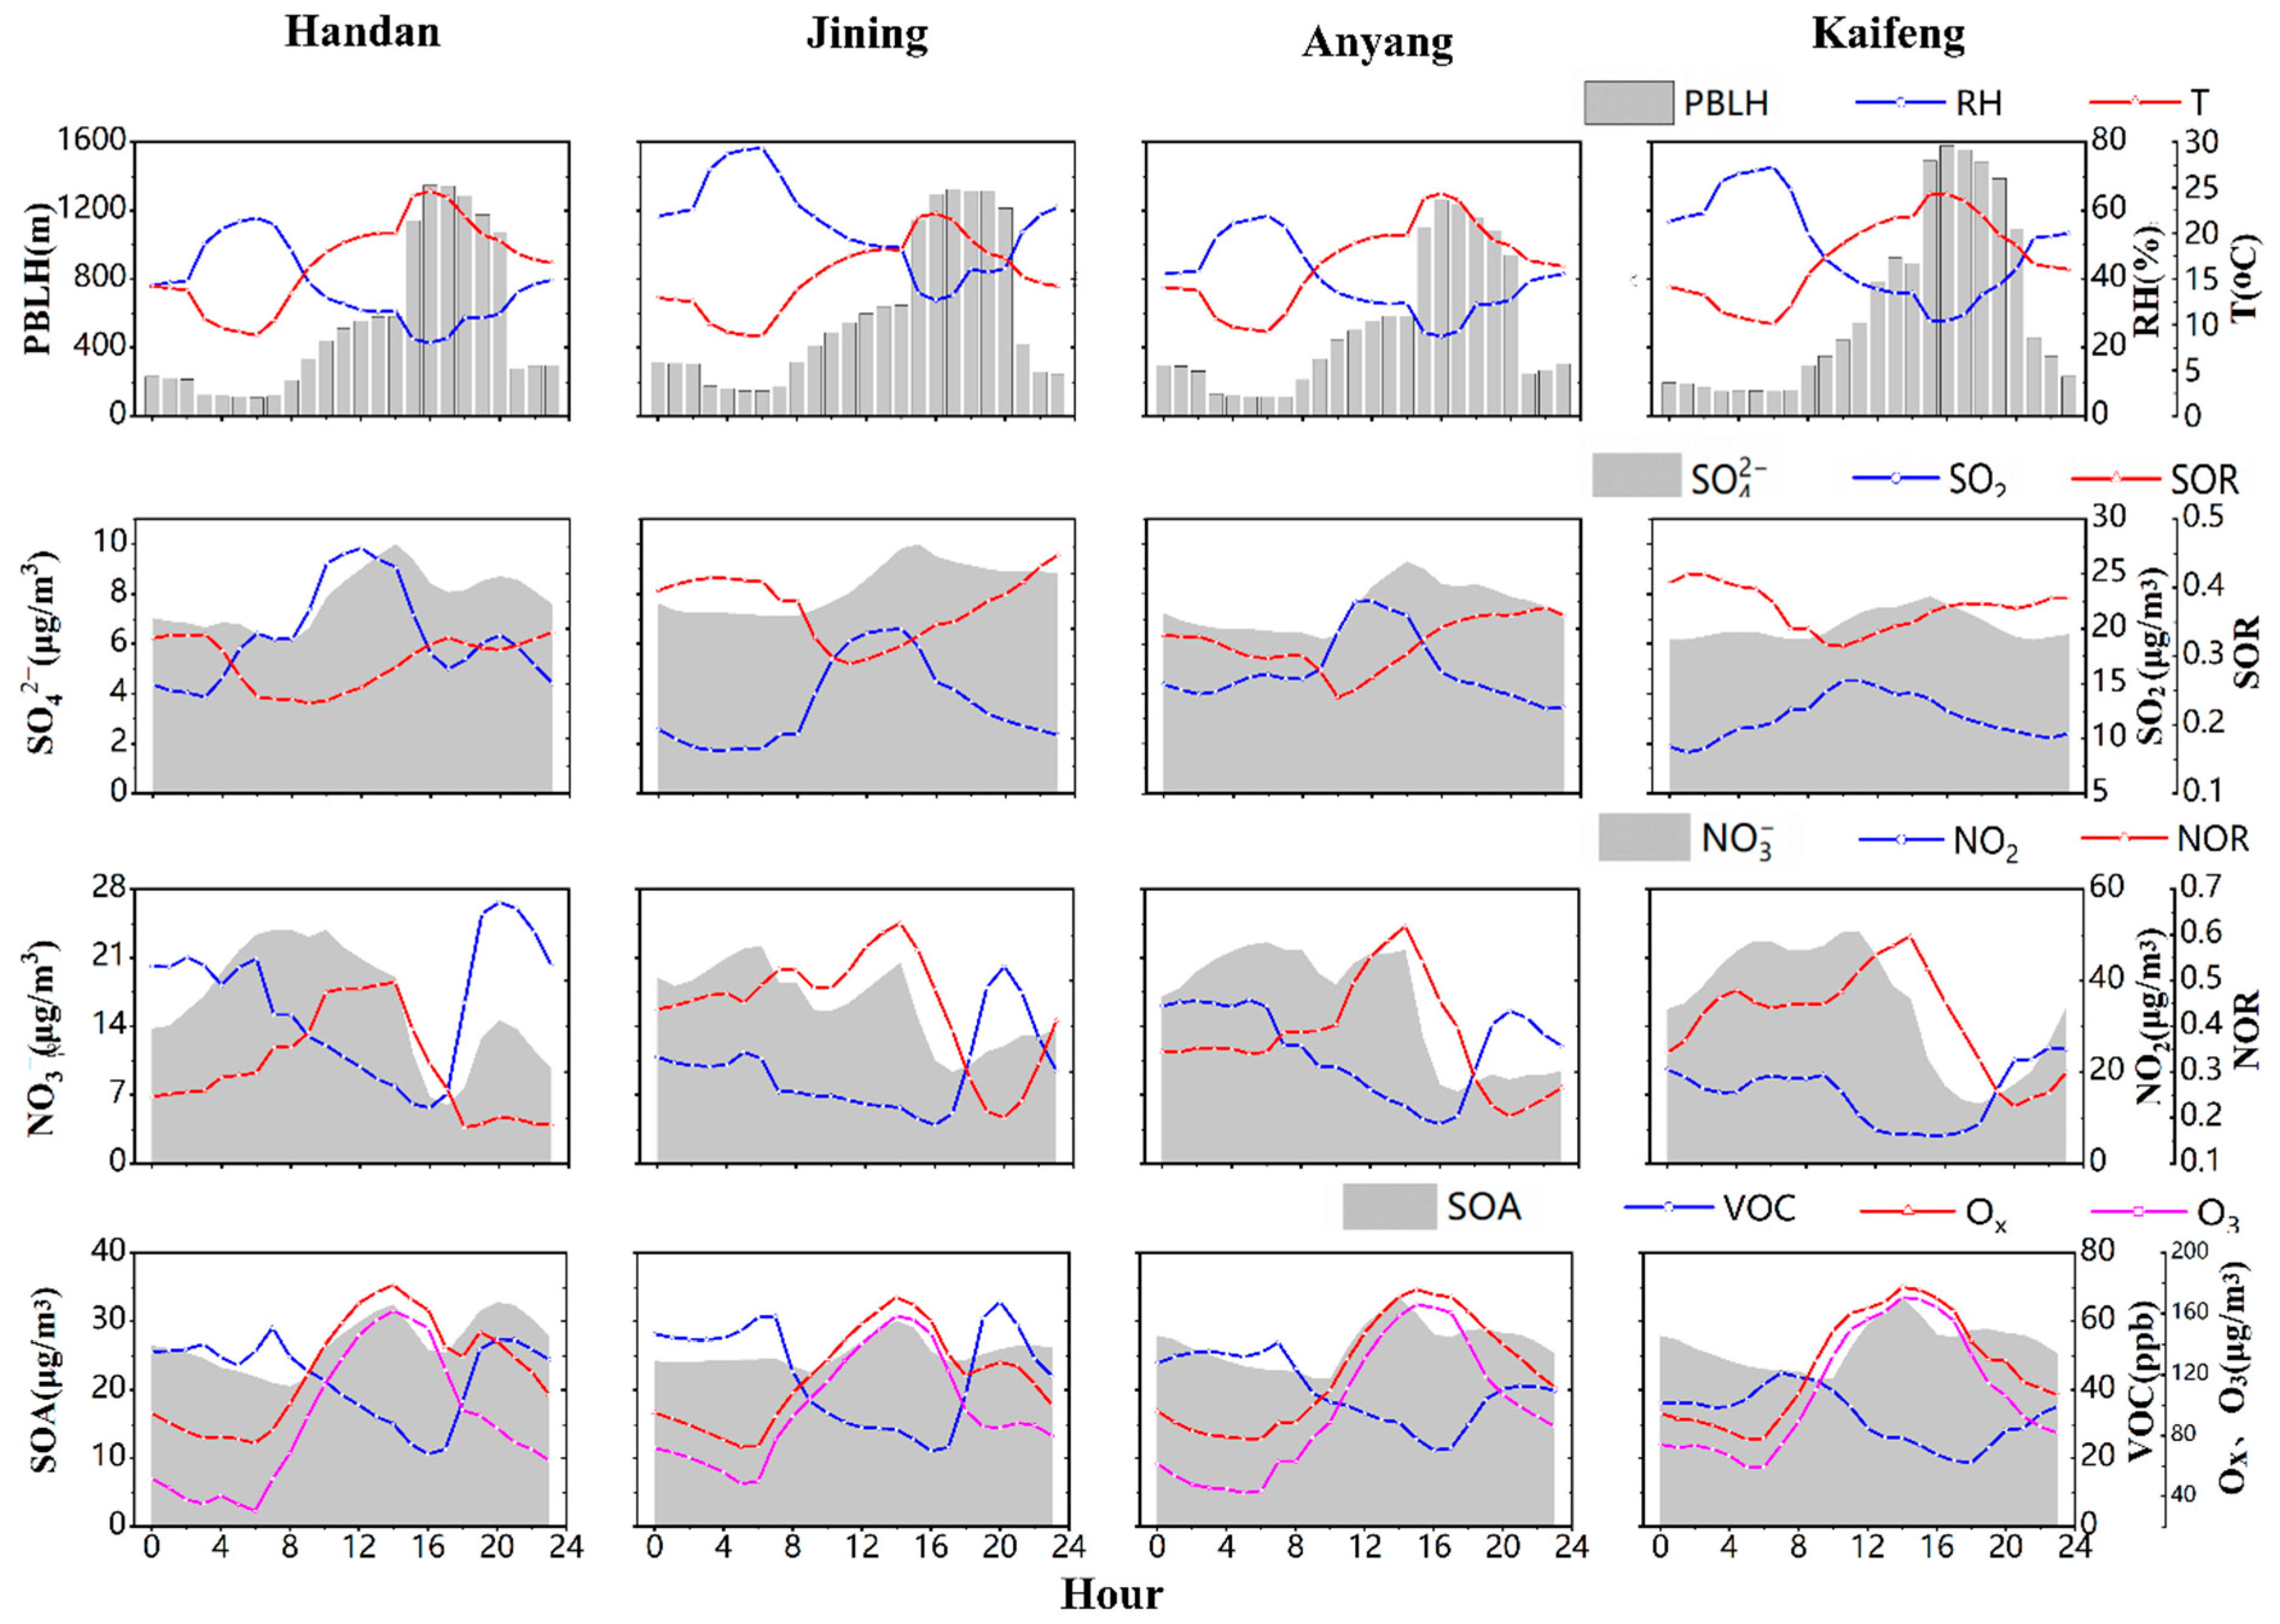
3.3.2. Analysis of PM2.5 Formation Mechanisms

The chemical composition of PM2.5 is intricate, encompassing both primary emissions and secondary generations through homogeneous and heterogeneous chemical reactions. Among them, secondary particles, such as sulfate, nitrate, ammonium salt, and secondary organic aerosols (SOA), are important components, accounting for more than 50% of the total mass of PM2.5 [72,73], and acting as the key factors in the occurrence of high concentration PM2.5 pollutions.
Table 1 shows the simulated concentrations of elemental carbon (EC), sulfate (SO42−), nitrate (NO3), ammonium (NH4+), SOA, and PM2.5 during complex and non-complex pollution periods in Handan, Jining, Anyang, and Kaifeng (30 March to 9 April). It is worth noting that the simulated and observed PM2.5 concentrations reached a high value on 2 April (Figure 2), indicating that the PM2.5 had accumulated before the occurrence of complex pollution. During the complex pollution episode, the proportion of secondary components in PM2.5 in the four cities increased from 68.3–75.5% on non-complex pollution days, and from 75.9% to 78.5% on complex pollution days. The concentration of SOA increased the most, and it was also the component with the highest concentration of the secondary aerosol. For secondary inorganic aerosol (SIA), NO3 concentration was the highest, followed by SO42−, NH4+. EC is the primary particulate matter, mainly from fuel combustion, that has stable chemical properties in the atmosphere and can represent the primary component of PM2.5. When compared with the non-complex pollution periods, concentrations of PM2.5 and its main components increased significantly during the complex pollution periods, and the growth multiple of EC concentrations was lower than those of secondary component concentrations. For example, the EC concentration in Handan increased 1.4 times during complex pollution periods, while the growth multiples of SO42−, NO3, NH4+, and SOA concentrations were 1.8, 2.2, 2.2, and 2.3, respectively. This indicates that, during the complex pollution period, the formation and accumulation of secondary components through chemical reactions had a significantly stronger influence on the formation of PM2.5 pollution than the direct emission of primary components. Li [74] also found, in a study of the atmospheric complex pollution episode in the Yangtze River Delta urban agglomeration, that the concentration of SOA and NO3 increased most significantly in high concentrations of PM2.5 pollution events; and also that, during the entire pollution period, the PM2.5 component with the highest concentration was NO3, followed by NH4+, SO42−, organic carbon (OC), and EC.
Figure 6 shows the average daily changes of key meteorological elements and pollutants in Handan, Jining, Anyang and Kaifeng during the complex pollution episode (3 to 5 April). The meteorological elements included planetary boundary layer height (PBLH), RH and T. The pollutants included SO2, SO42−, NO2, NO3, SOA, VOCs, O3 and photochemical oxidants (Ox, Ox = NO2 + O3), as well as the sulfate oxidation rate (SOR) and nitrate oxidation rate (NOR), which could reflect the secondary conversion rates of gaseous pollutants (SO2 and NO2) in the atmosphere. Their specific formulas follow:
S O R = S O 4 2 S O 4 2 + S O 2
N O R = N O 3 N O 3 + N O 2
Higher values of SOR and NOR indicated a stronger secondary oxidation of SO2 and NO2.
Sulfate is generated by the oxidation of SO2 to sulfuric acid (H2SO4) in the gas or liquid phases. In the process of gas phase oxidation, SO2 is oxidized by OH to form sulfur trioxide (SO3) and then H2SO4. Compared to the liquid phase oxidation, the gas phase oxidation is more important for sulfate formation [75]. In the daytime change curve, the SO2 concentration began to increase earlier than SO42−, which indicated there were sufficient precursors for sulfate formation. The SO2 concentration peaked at about 12:00, later than the early peak time, indicating that SO2 mainly came from the emissions of overhead power plants and took a certain time to diffuse to the ground [76]. The concentration of SO42− increased rapidly between 8:00 and 14:00, as in Handan, where it reached 10.0 from 6.1 μg/m3, which was consistent with the increase of O3 and Ox during this period. In daytime, sulfate was mainly generated by SO2 gas phase oxidation, and SO42− concentrations were positively correlated with Ox concentrations (r = 0.70), indicating that the photochemical reactions played an important role in the SO2 gas phase oxidation. Sun et al. [77] revealed that when the SOR value was higher than 0.10, SO2 could be oxidized to sulfate through photochemical reactions. The average SOR values of Handan, Jining, Anyang and Kaifeng were 0.29, 0.37, 0.32 and 0.37, respectively, indicating the high secondary oxidation rate of SO2. Therefore, the increase of SO2 concentrations and the active photochemical reaction during this complex pollution episode emerged as pivotal factors in sulfate formation.
There are two main ways of achieving nitrate formation [78]; one is the gas-phase photochemical reaction between NO2 and OH radicals, which mainly occurs in the daytime with high photochemical activities. Through these reactions, gaseous nitric acid (HNO3) is generated, which can be adsorbed on the surface of particles or react with NH3 to form granular ammonium nitrate. Ammonium nitrate is semi volatile, and there is a dynamic balance between the chemical reactions of HNO3 and NH3, which depends on T, RH, HNO3 and NH3 concentrations. High temperatures can promote the volatilization of ammonium nitrate.
The second is to generate NO3 through NO2 oxidation in the atmosphere, which can further react with NO2 to form N2O5 during the nighttime. This is an important source of nocturnal HNO3 because of the photolysis of NO3, and nitrate therefore has different formation mechanisms in different periods of time. Taking Handan as an example (see Figure 6), the concentration of NO2 increased slightly from 4:00 to 6:00, and the PBLH reached the minimum at the same time. The morning traffic emissions then increased, and the concentration of NO3 rose rapidly, peaking around 8:00, when the photochemical reaction was more active due to the increase of solar radiation; the O3 concentration rose rapidly after 6:00, indicating that the formation of high concentration nitrate in the morning (6:00~10:00) was mainly due to gas-phase photochemical oxidation. After 10:00, the NO3 concentration began to decrease, and decreased rapidly after 14:00 due to the further rapid rise of T and PBLH, which accelerated the volatilization of ammonium nitrate [79] and enhanced the atmospheric diffusion ability. At 16:00, the NO2 concentration decreased to the minimum, and at 17:00, the NO3 concentration decreased to a low value, and the T then began to decrease and the RH gradually increased. Although the O3 concentrations gradually decreased during this period, it was still maintained at a high level (the average concentration between 17:00 and 23:00 was 87 μg/m3). Due to traffic emissions in the evening peak, the NO2 concentration rose rapidly after falling to the minimum, and peaked at 20:00. At night, the high concentration of NO2 and the presence of O3, as well as the external conditions of weakened light and increased RH, promoted the conversion of NO3 and/or N2O5 to HNO3 through the hydrolysis reaction [80], which increased the NO3 concentration. The diurnal variation curve of NOR was more consistent with O3, indicating that the gas-phase photochemical oxidation had an important impact on the secondary conversion of NO2. The average NOR values of Handan, Jining, Anyang and Kaifeng during the pollution episode were 0.31, 0.44, 0.38 and 0.42, respectively, which were higher than the SOR value, indicating that, compared to SO2, the secondary conversion rate of NO2 was higher, and its contributions to the PM2.5 concentration were more obvious.
As the highest concentration component in secondary aerosols, SOA is mainly formed by VOCs through a series of photochemical oxidation reactions, via a very complex formation mechanism. According to the daily variations in Figure 6, the VOCs concentration reached their peak at 7:00, indicating that a large number of hydrocarbons were emitted from motor vehicles. The massive emission of VOCs and the rapid increase of O3 concentrations meant SOA started to be generated rapidly around 9:00, and then peaked at 14:00. The correlation coefficient between SOA and Ox was 0.69, indicating that the formation of SOA was mainly promoted by photochemical oxidation during this complex pollution episode. Similar results were observed in the YRD region [81].
The high concentration of PM2.5 in this complex pollution episode was mainly due to the high initial concentration and large amount of secondary aerosol. High concentrations of O3 enhanced the atmospheric oxidation ability; and active photochemical reactions promoted the transformation of SO2 and NO2 to secondary inorganic salts, and VOCs to secondary organic aerosols, which increased PM2.5 concentrations and worsened the air quality.

3.4. Source Apportionment of the High-Level O3 and PM2.5 Complex Pollution Episode

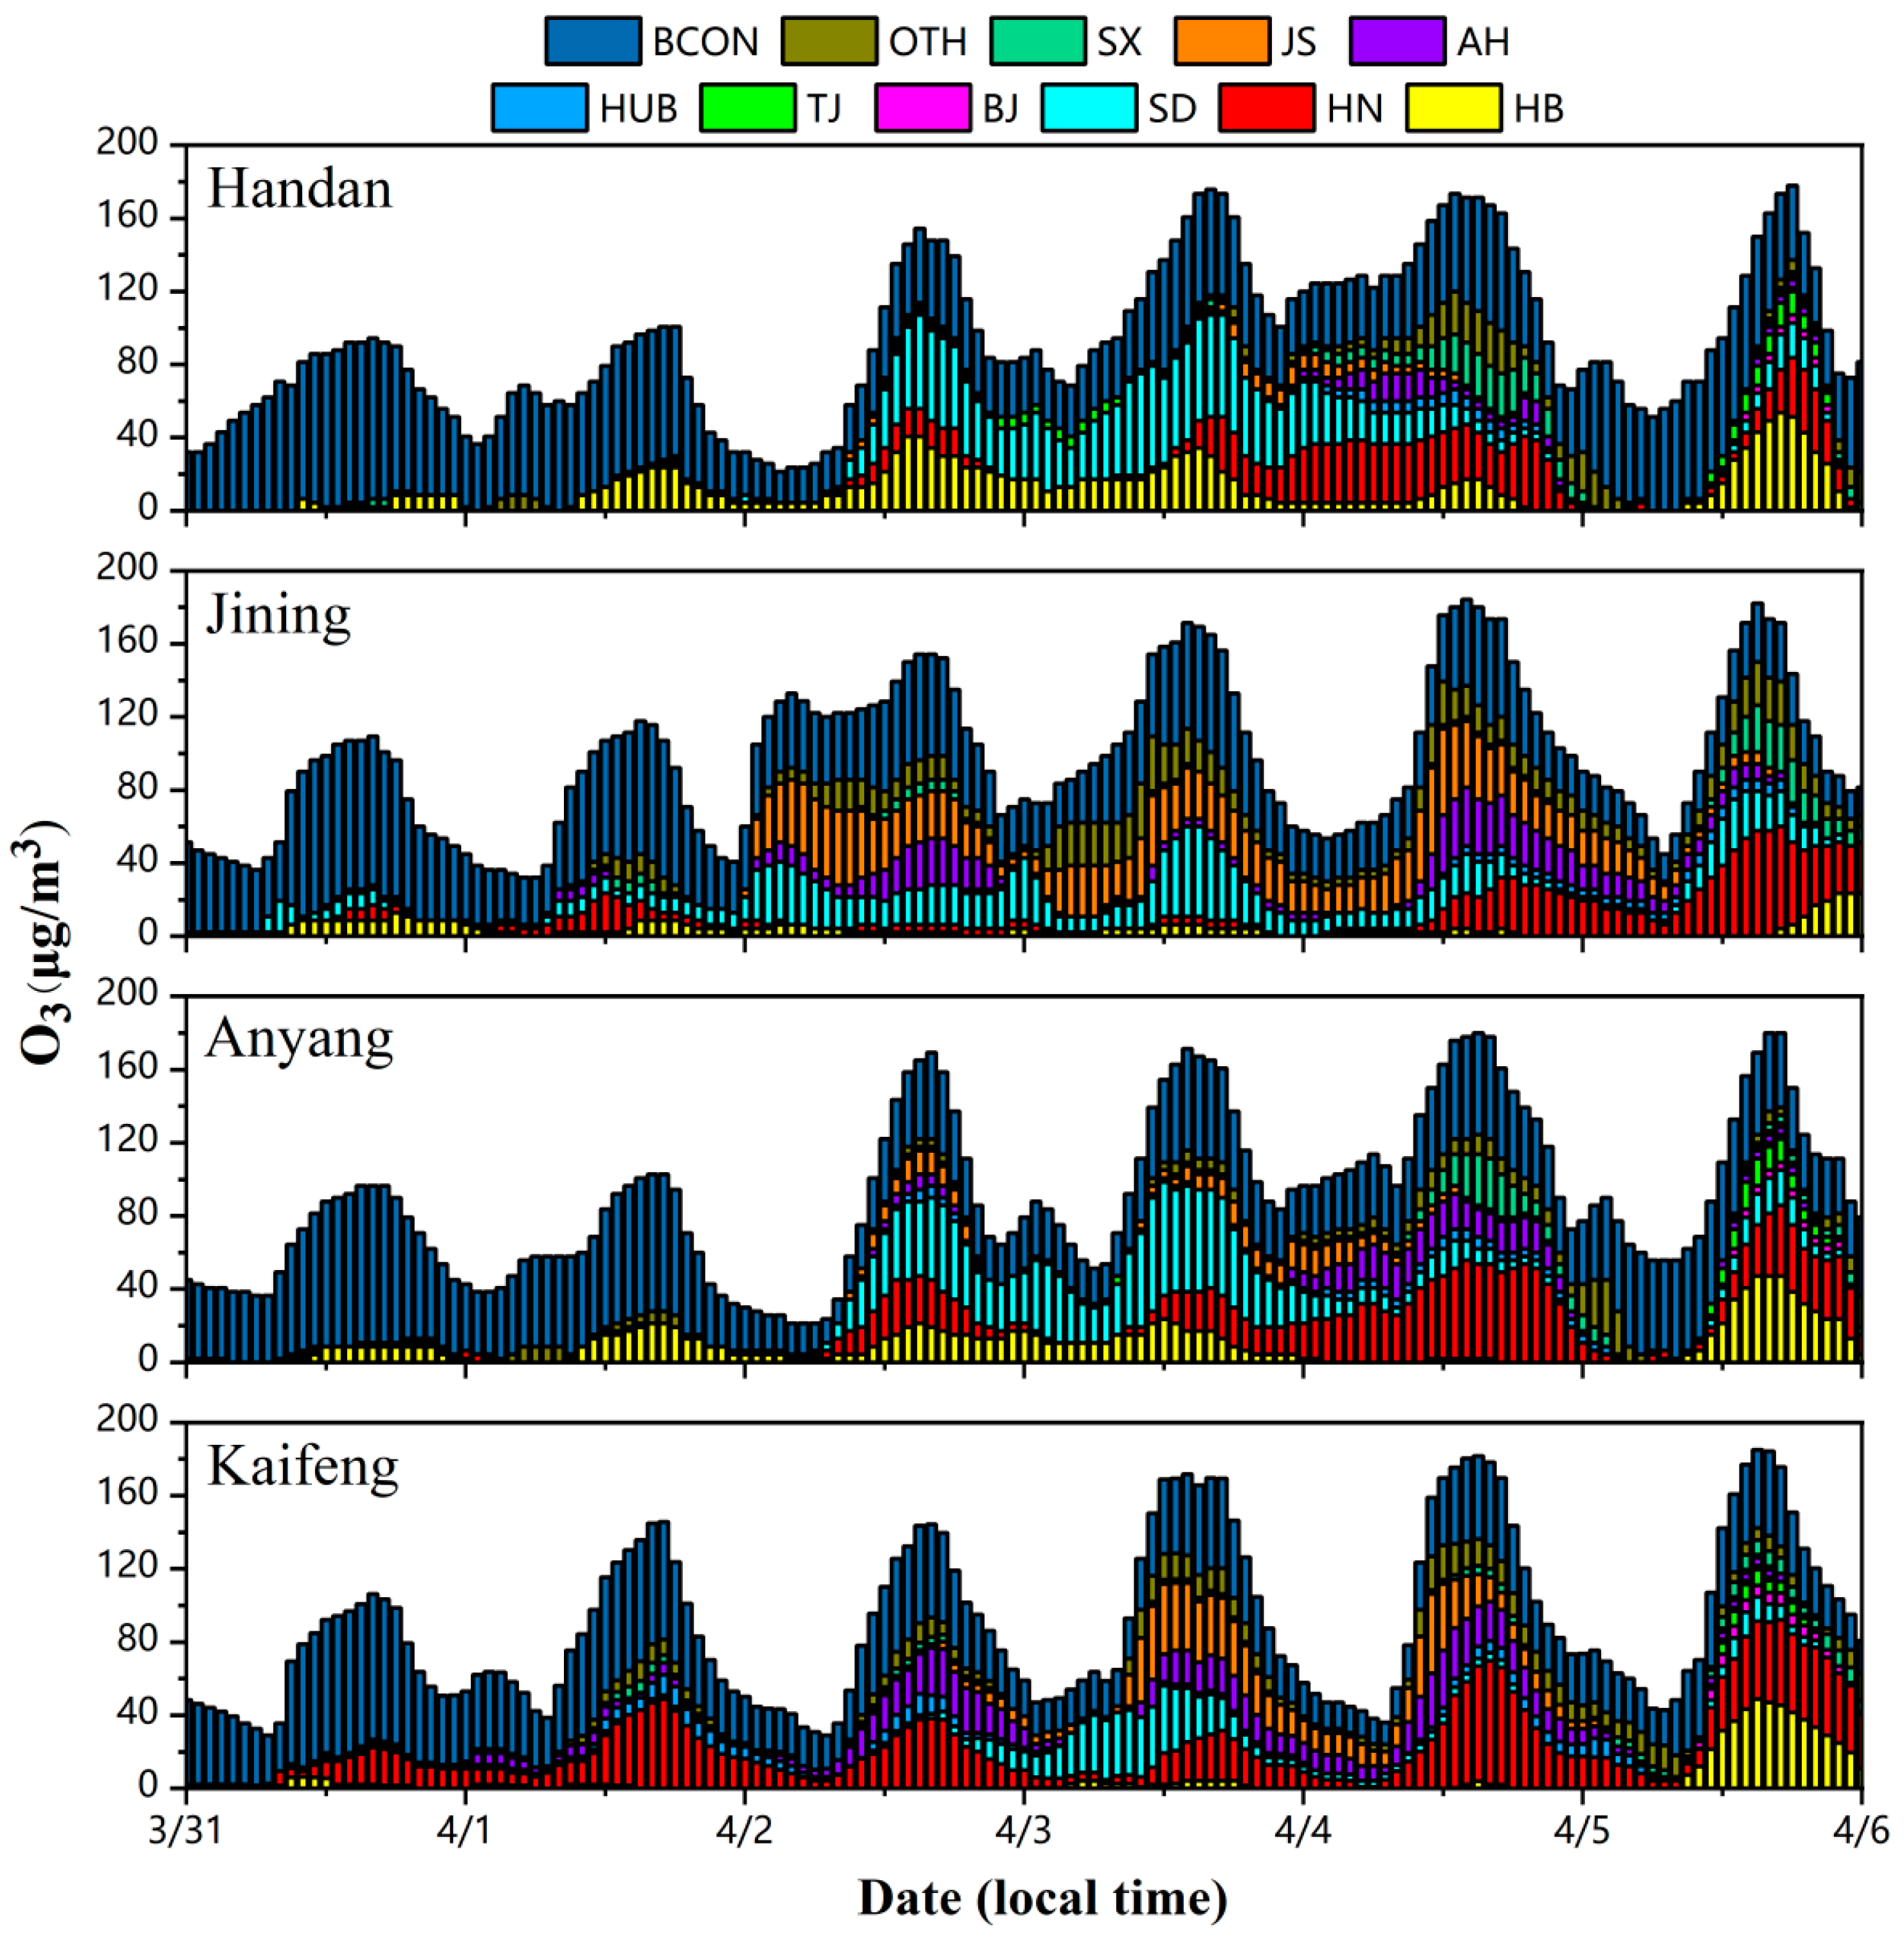
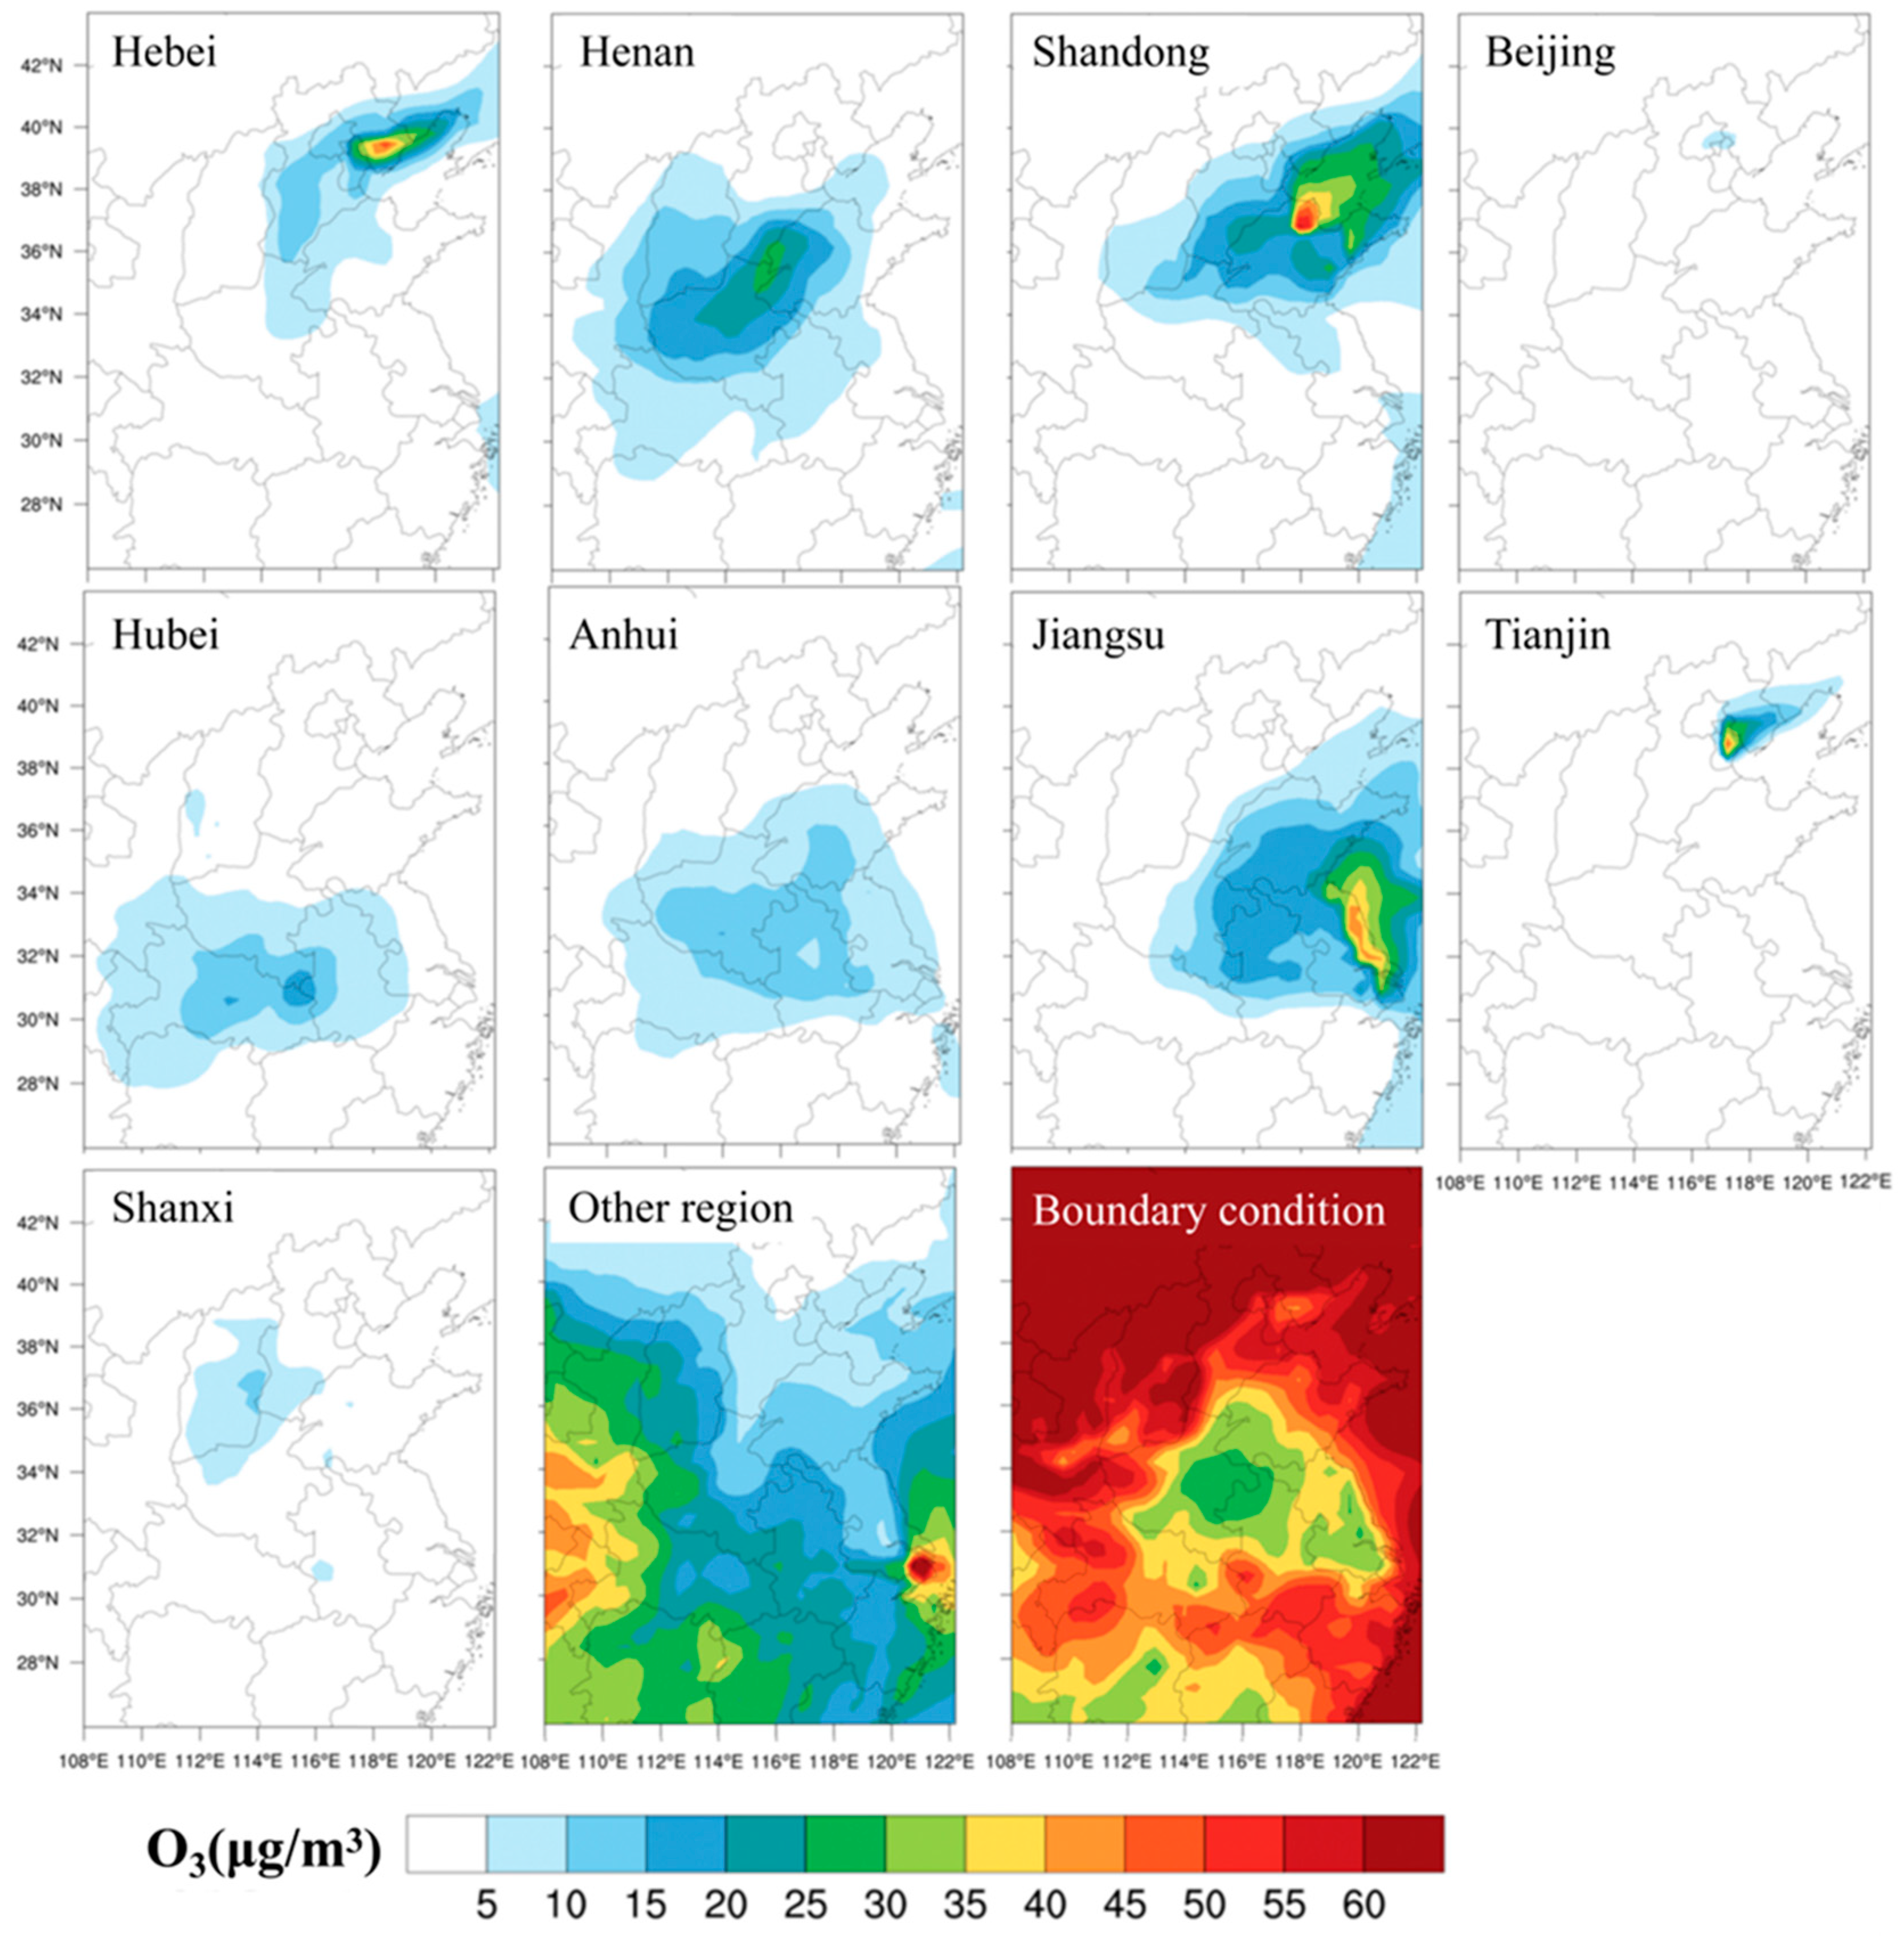
3.4.1. Analysis of O3 Source Apportionment

The horizontal and vertical transport processes made important contributions to the high concentrations of O3 in this complex pollution episode, and ISAM source analysis was able to quantify the regional transport contributions. Figure 7 shows the time series of contributions that different marked areas made to O3 concentrations in Handan, Jining, Anyang and Kaifeng in the period from 31 March to 5 April 2019, showing significant differences in the impact of regional transports in different cities at different times. During the complex pollution episode, the contribution of the BCON to the O3 concentrations in the four cities decreased by nearly half (compared to before this pollution episode), but a large proportion still remained, ranging from 28.5% to 39.2%. The contribution of BCON to the O3 concentrations was predominant when O3 levels were low (31 March to 1 April), and it conversely remained relatively stable and constituted a substantial proportion (approximately 30%) when the O3 concentration was high (2 April to 5 April). Li et al. [63] also found that strong ultraviolet radiation and sinking airflow formed by high pressure were the main causes of boundary layer complex pollution, and especially O3 pollution. Handan and Anyang are adjacent cities at the junction of the Hebei and Henan provinces, and so the time series of regional transport contributions were relatively similar. From 2 to 3 April, Shandong Province was located in the center of high pressure. Under the influence of anticyclone weather, O3 was transported from Shandong to Hebei and Henan, meaning Shandong made stronger contributions to O3 in Handan and Anyang higher than in their own provinces (Hebei and Henan). On 4 April, the prevailing south wind blew from Henan to Hebei, meaning Henan made a stronger contribution to O3 in Handan than Hebei. The O3 concentrations in Anyang were mostly contributed by Henan, since Anyang is located in the north of Henan Province. In addition, Shandong, Shanxi and Anhui provinces also made certain contributions to O3 concentrations in Handan and Anyang. By 5 April, Hebei became the largest regional source of O3 in Handan and Anyang, followed by Henan, Shandong and Tianjin. The O3 concentrations in Jining on 3 April were mostly contributed by Shandong. Of the foreign sources, Jiangsu and other regions not labeled by ISAM also had significant contributions. In the next two days, the provincial source contributions decreased, having mainly been affected by the transport of foreign sources, such as Jiangsu, Anhui, Henan and Shanxi. On 3 April, the contribution of Henan to O3 concentrations in Kaifeng was significantly lower than those of other sources, and O3 was mainly transported from Shandong and Jiangsu provinces. The results indicated that, during the complex pollution episode, the contributions of foreign sources to O3 concentrations in Handan, Jining, Anyang and Kaifeng reached 49.2%, 57.6%, 46.1% and 50.8%, respectively, much higher than those of provincial sources. From 4 April to 5 April, the contribution of local sources increased, and the formation of O3 was determined by both local and foreign sources.
Figure 8 shows the spatial distributions of the contributions of different marked areas to mean O3 concentrations, in the period from 3 to 5 April 2019. BCON contributed the most O3 concentrations in the whole study area, especially for the northern part of the area, where BCON contributed more than 60 μg/m3 of O3. In comparison to other provinces, Beijing and Tianjin had smaller areas with low pollution emissions, resulting in a more confined scope of impact. Although O3 contributed by each area was mainly concentrated in the province and city itself, this also increased the O3 concentration in the surrounding areas. The adjacent provinces had mutual regional transports. For example, O3 from Jiangsu contributed 5~20 μg/m3 to the O3 concentrations in Shandong, eastern Henan and northern Anhui; and O3 from Shandong contributed 5~20 μg/m3 to O3 concentrations in Hebei, Shanxi, Henan and Jiangsu, and 20~40 μg/m3 to O3 concentrations in the Bohai Sea. Other regions contributed a large amount of O3 to Shanghai and the western region, and also contributed 5~20 μg/m3 to the O3 concentrations in the NCP region.

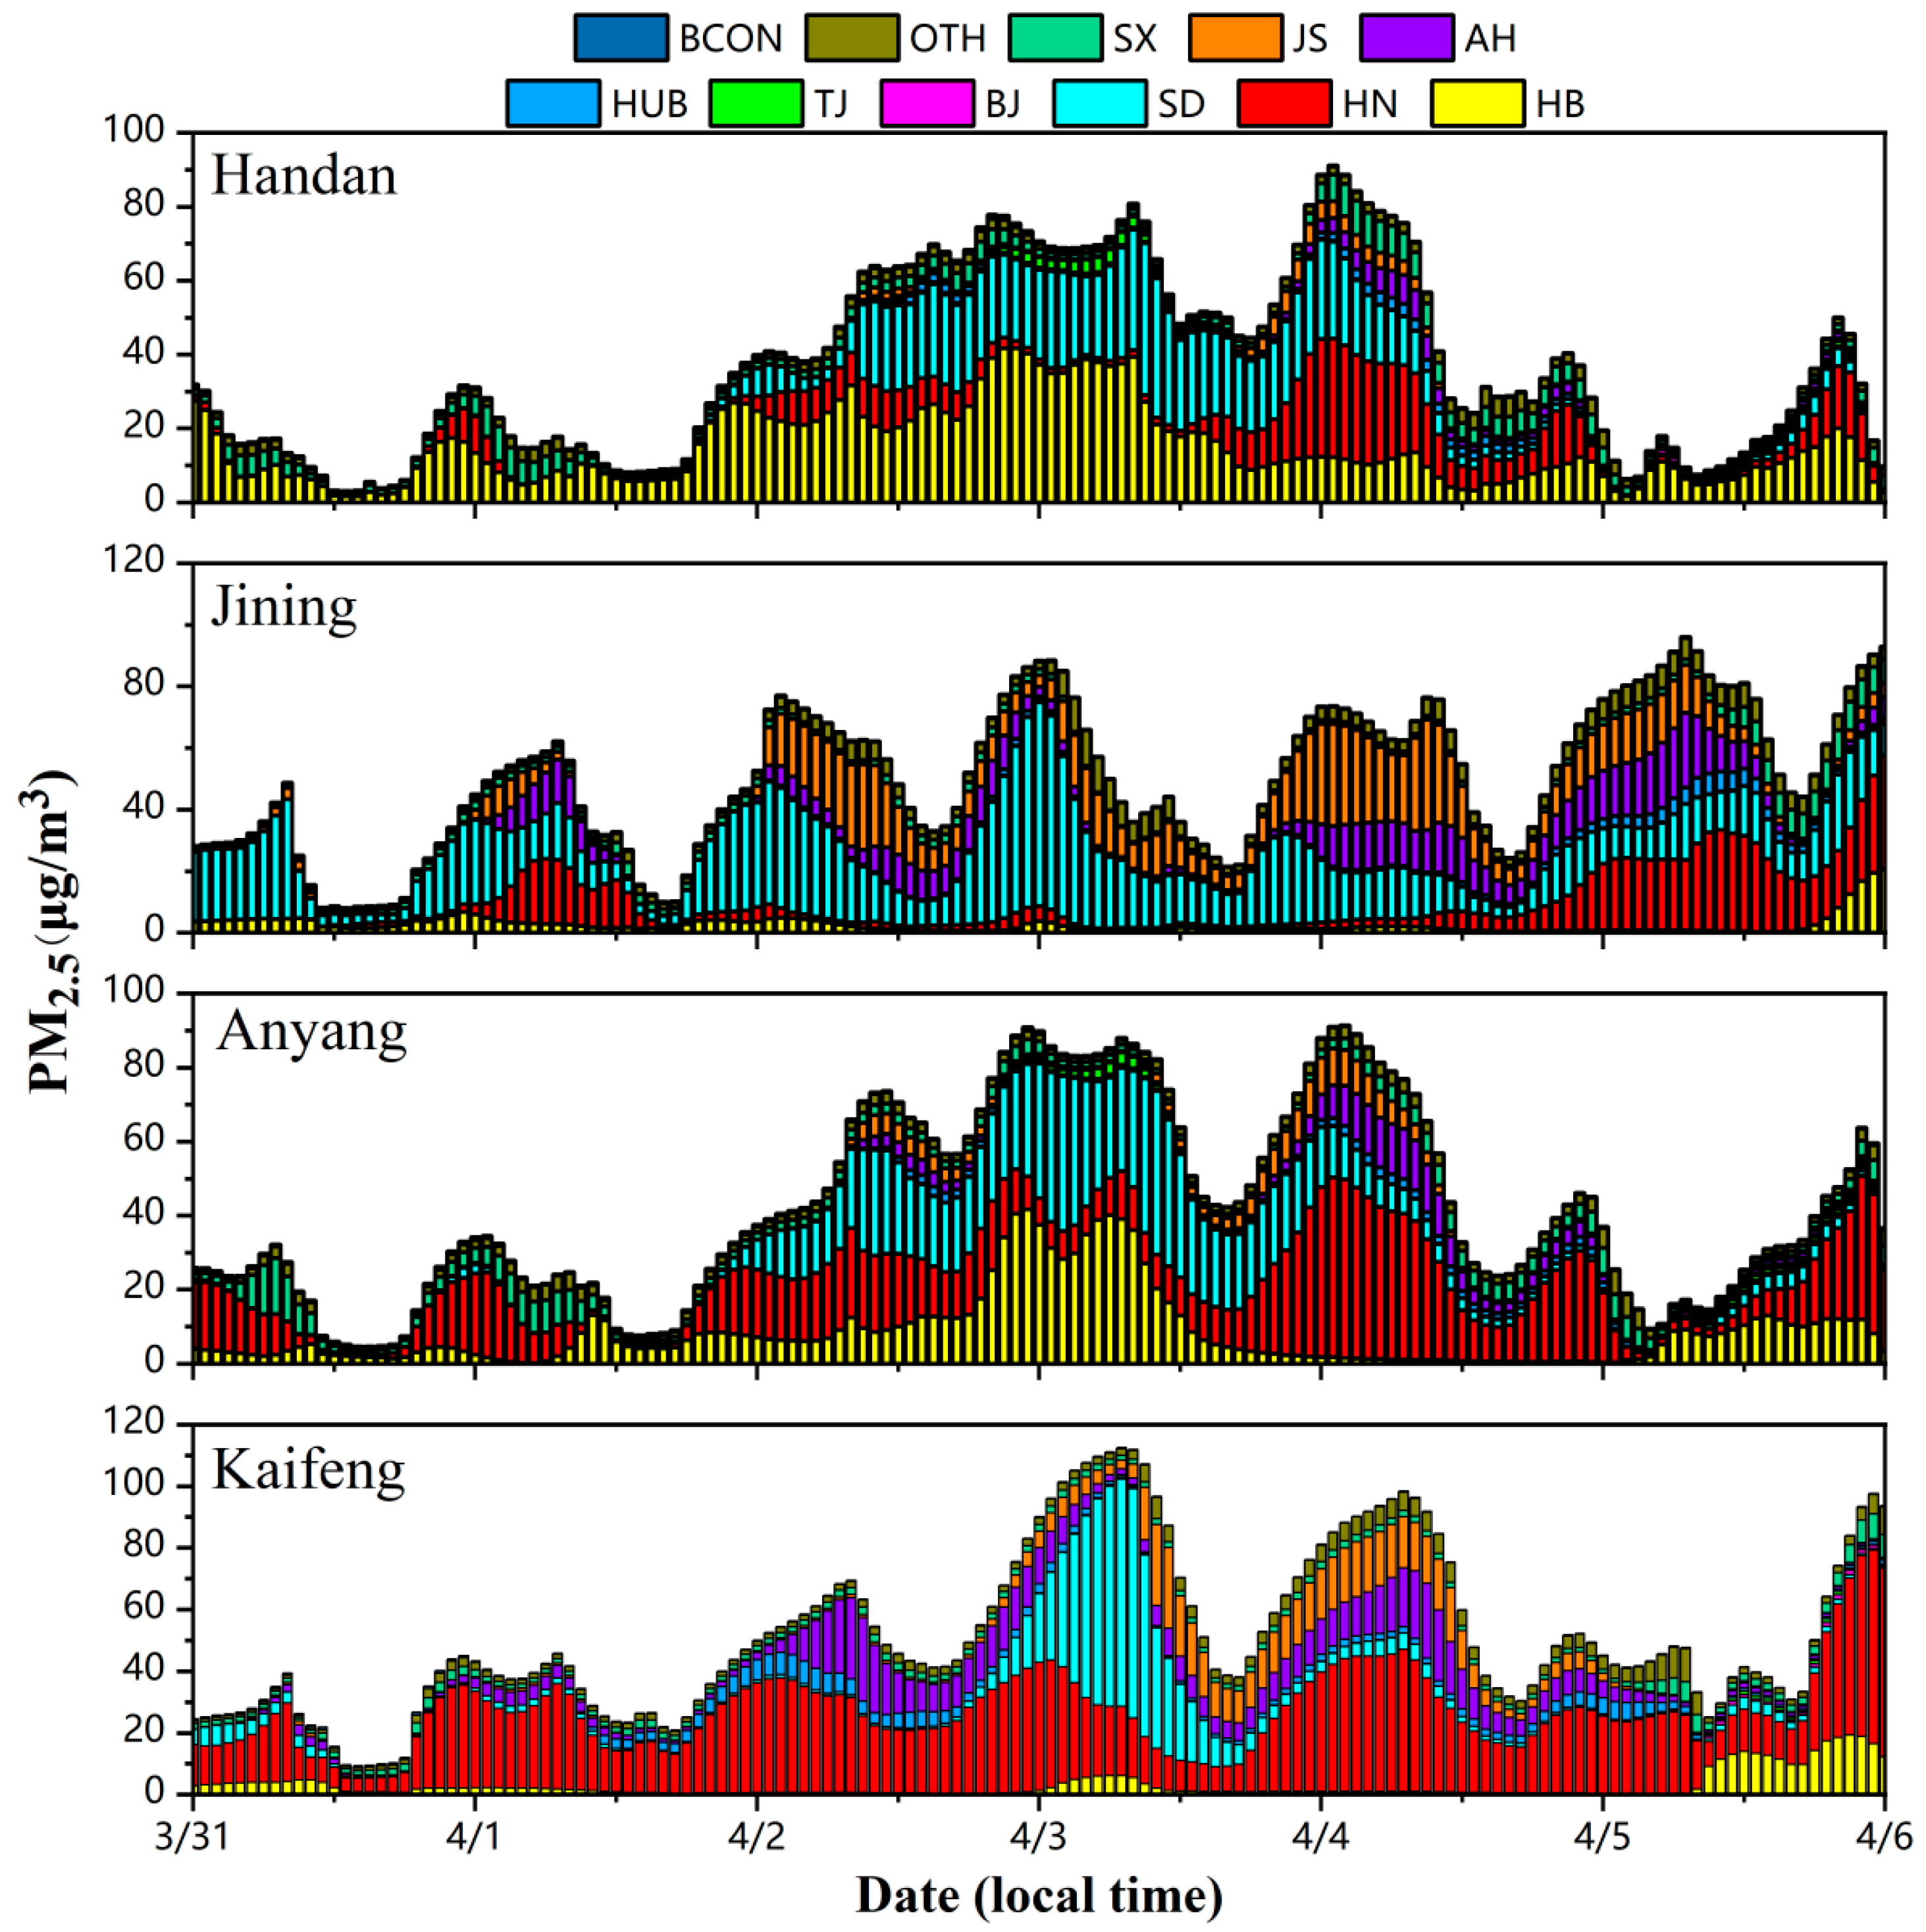
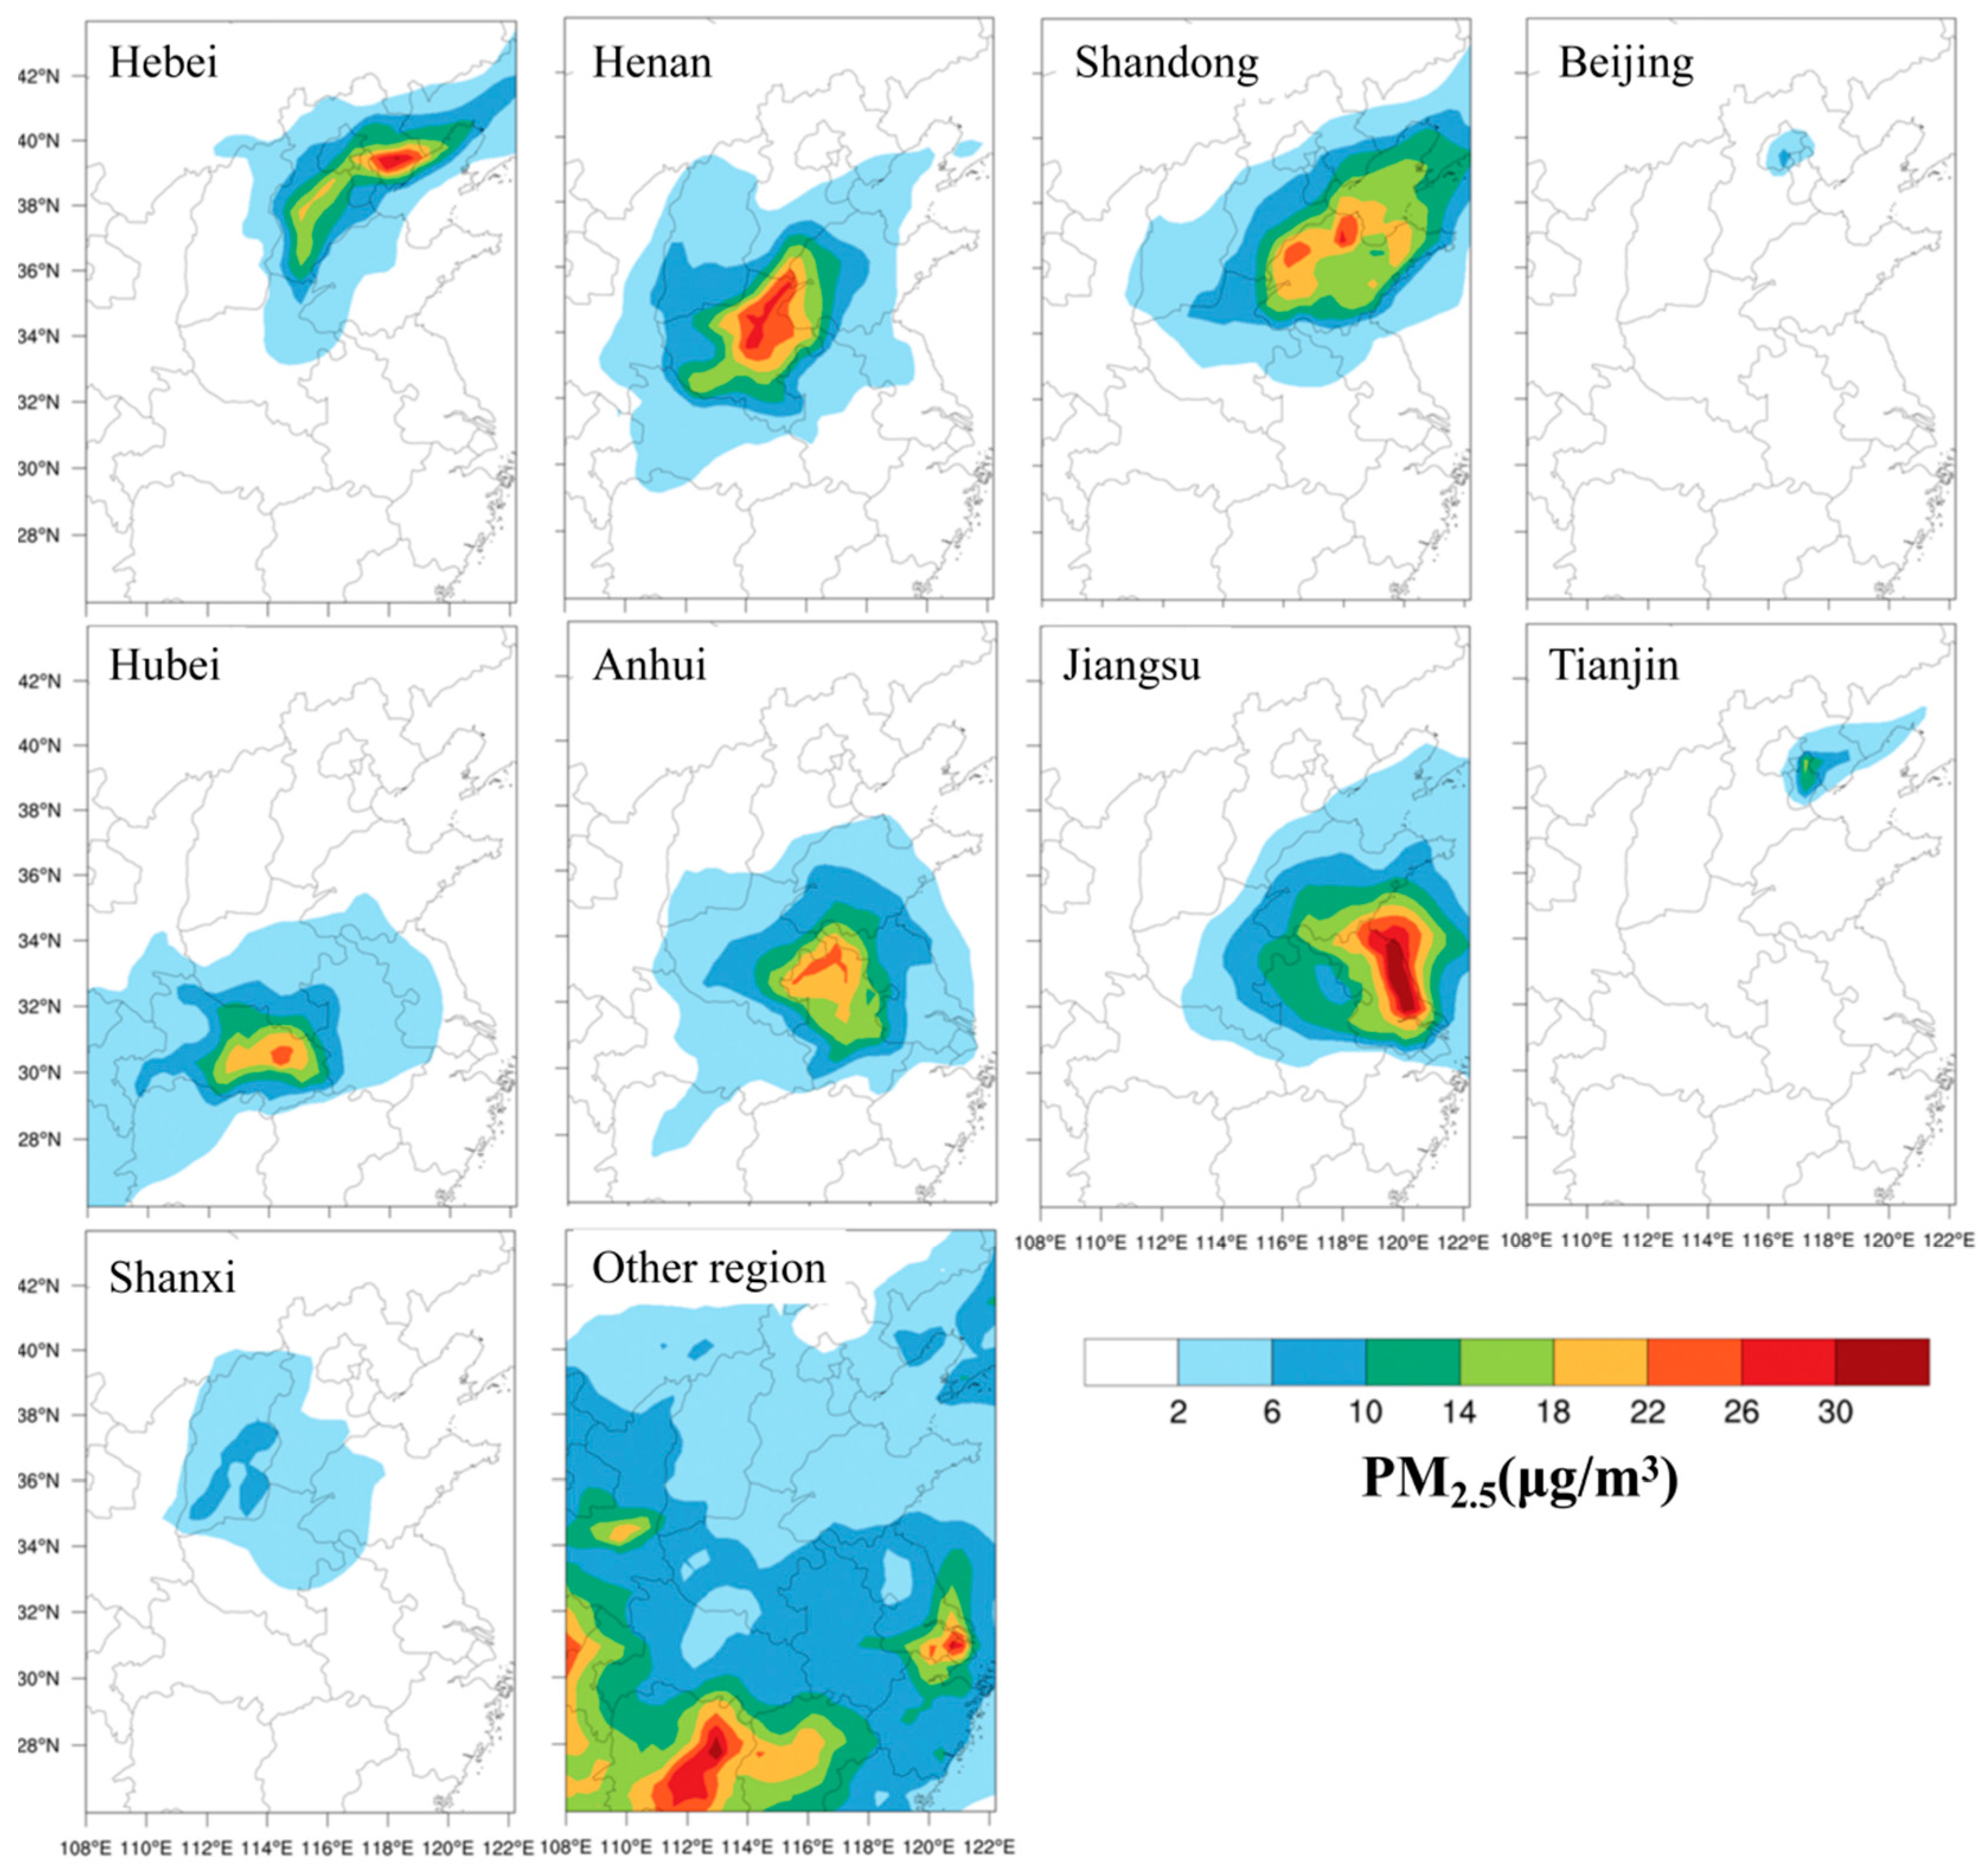
3.4.2. Analysis of PM2.5 Source Apportionment

Figure 9 shows the time series of contributions of different marked areas to the PM2.5 concentrations in Handan, Jining, Anyang, and Kaifeng, from 31 March to 5 April 2019. In contrast to O3, PM2.5 concentrations were jointly affected by the transports of local emission sources and external sources, while the contributions of BCON to PM2.5 concentrations were found to be negligible. Since the transport path of pollutions was closely related to the evolution of the wind, the variation trends of the PM2.5 concentrations contributed by the transports of each region were similar to those of O3. According to the observations, PM2.5 concentrations in four cities exceeded the standard on 2 April, and had accumulated before the complex pollution episode. During the complex pollution episode, the contributions of foreign sources caused by regional transports increased and the contributions of foreign sources to PM2.5 concentrations in Handan, Jining, Anyang and Kaifeng ranged from 60.2% to 70.9%, with Shandong Province making an important contribution to the high PM2.5 concentrations. The regional transports from Shandong contributed a large amount of PM2.5 in the early stage of the complex pollution, which kept these cities at a high concentration of PM2.5 in the early morning of 3 April. At 16:00 on 3 April, the PM2.5 concentrations dropped to the minimum. After Henan’s contributions to the PM2.5 concentrations in Handan, Anyang and Kaifeng increased, and Jiangsu’s contributions to the PM2.5 concentrations in Jining also increased, the PM2.5 concentrations began to rise gradually. On the afternoon of 4 April, after the PM2.5 concentrations again fell to a low value, the provincial source emerged as the primary contributor to PM2.5 concentrations in Handan, Anyang and Kaifeng. Conversely, in Jining, PM2.5 concentrations were primarily influenced by foreign sources, from Jiangsu, Anhui, and Henan, in addition to provincial sources. Meanwhile, PM2.5 concentrations in Jining were mainly contributed by foreign sources from Jiangsu, Anhui and Henan, along with provincial sources.
Figure 10 shows the spatial distributions of contributions made by different marked to mean PM2.5 concentrations in the period from 3 to 5 April 2019. The PM2.5 concentration contributed by BCON was negligible, and is therefore not shown in the figure. The spatial distribution ranges and degrees of PM2.5 concentration contributed by each marker area were similar to those of O3. Other regions contributed a large amount of PM2.5 to the Shanghai, Xi’an and Hunan provinces, along with 2~10 μg/m3 to PM2.5 concentrations in the NCP region. In contrast, the PM2.5 concentration contributions of Shanxi Province, Beijing and Tianjin were relatively small. The high concentrations of PM2.5 in the Hebei, Henan, Shandong, Hubei, Anhui and Jiangsu provinces, along with their mutual influence through transports, led to high PM2.5 pollution in the NCP region.

4. Discussion

On the basis of the observational data, this study screened out a regional PM2.5-O3 complex pollution episode in the NCP region in the period from 3 to 5 April 2019, and analyzed its meteorological and pollution characteristics. The WRF-CMAQ model was employed to simulate the complex pollution processes. Subsequently, the formation mechanisms and sources of PM2.5 and O3 during this pollution episode were analyzed on the basis of the model results.
From 3 to 5 April 2019, PM2.5 and O3 concentrations in more than 10 cities in the NCP region simultaneously exceeded the standard for three consecutive days. The concentrations of PM2.5 and O3 on the complex pollution days were significantly higher than on the non-complex pollution day, indicating there would still be active photochemical reactions when PM2.5 concentrations were high, leading to excessive O3 concentrations. PM2.5 concentrations in daytime were slightly higher than in nighttime on some days, indicating that high O3 concentrations promoted the oxidation of secondary particles in the complex pollution processes, when the NCP region was affected by static and stable weather conditions, and the weather was sunny with high temperature and low wind speed. The atmospheric diffusion conditions were poor, which was conducive to the generation and accumulation of pollutants, resulting in the complex pollution episode. Note that on some complex pollution days, there were relatively small fluctuations in PM2.5 concentrations for the whole day, which was because of temperature inversions and a stable nighttime atmosphere.
The process analysis results of O3 showed that high concentrations of PM2.5 weakened the photochemical effects of O3 to a certain extent. However, the photochemical reactions at high altitudes were stronger than those on the ground, making a large number of O3 generated by the gas-phase chemical reaction transport from the high altitude to the ground, significantly increasing the contribution of vertical transports to the formation of O3 on the ground. Therefore, high O3 concentrations in the complex pollution episode were mainly produced by the gas phase chemistry and the vertical transport process. The high PM2.5 concentrations mainly came from the initial high concentrations and the formation of secondary aerosols. High O3 concentration enhanced the atmospheric oxidation ability, and the active photochemical reactions promoted the transformation of SO2 and NO2 to secondary inorganic salts, and VOCs to secondary organic aerosols. This increased the PM2.5 concentrations and aggravated air pollution.
The source apportionment results of O3 showed that the contribution of the BCON to O3 concentrations in the four cities during the complex pollution episode decreased by nearly half, compared to those before this pollution episode. During the complex pollution episode, the contribution of regional transports increased significantly and the contributions of foreign sources to the O3 concentrations in the four cities (Handan, Jining, Anyang, Kaifeng) reached 49.2%, 57.6%, 46.1% and 50.8%, respectively. The source apportionment results of PM2.5 also showed that during the complex pollution episode, the contribution of foreign sources caused by regional transport increased; the contribution of foreign sources to the PM2.5 concentrations in four cities ranged from 60.2% to 70.9%, with Shandong Province making an important contribution to these high PM2.5 concentrations. This study used the WRF-CMAQ model to analyze a representative regional PM2.5-O3 complex pollution process in the NCP region. It elucidated the formation mechanisms and conducted source analyses for O3 and PM2.5, providing valuable insights into the prevention and control of complex pollution in China.
The first limitation of this study lies in the poor simulation of wind direction by WRF, which failed to quantify the impacts and contributions of meteorological conditions in the process of pollutant transport. In the future, quantitative analyses can be conducted on the effects of wind speed and direction on pollutant transport. The second, limitation lies in this study only analyzing a case of PM2.5-O3 complex pollution in NCP in April 2019, meaning the findings should be further checked by using different methods. In the future, researchers should carry out case studies of other regions and in other periods, with the aim of better understanding the formation mechanism and pollution sources of complex pollution in China. Third, the areas marked in the source analysis process were based on provinces, and were therefore not accurate enough. In the future, the marked areas can be further refined to specific cities or areas, which will enable more detailed source analysis.

5. Conclusions

This study used the WRF-CMAQ model to analyze a representative regional PM2.5-O3 complex pollution episode in the NCP region, elucidated formation mechanisms, and conducted source analyses of O3 and PM2.5. The results indicated the high concentrations of O3 mainly came from vertical and horizontal transports, highlighting that although photochemical reactions of O3 near the ground were weakened by the high PM2.5 concentrations, gas-phase chemical reactions at high altitudes would generate a large amount of O3 and increase the ground level O3 concentrations through the vertical transports. The high concentration of PM2.5 came from the regional transport and the accumulation of secondary inorganic salts and secondary organic aerosols, which were facilitated by the high ground-level O3. These findings provided valuable insights that will contribute to the prevention and control of complex pollution in China.

Supplementary Materials

The following supporting information can be downloaded at: https://www.mdpi.com/article/10.3390/atmos15020198/s1. Section S1: Calculation Formula of the Statistical Metrics; Table S1: Performance statistics of 2 m temperature (T2), 2 m relative humidity (RH2), 10 m wind speed (WS10), and 10 m wind direction (WD10) in the 4 cities from 00:00 LT March 30 to 00:00 LT April 10, 2019; Table S2: Performance statistics of PM2.5 and O3 in the 4 cities from 00:00 LT March 30 to 00:00 LT April 10, 2019.

Author Contributions

X.D., J.L. and S.Y. conceived and designed the research. X.D. and J.L. ran the model. X.D., J.L. and Z.S. conducted data analysis. Y.S. and N.Y. contributed to scientific discussions. X.D., J.L., Y.S. and P.L. wrote and revised the manuscript. All authors have read and agreed to the published version of the manuscript.

Funding

This work was supported by the National Natural Science Foundation of China (No. 42175084, 72361137007, 21577126, 41561144004), the Ministry of Science and Technology of China (No. 2016YFC0202702, 2018YFC0213506, 2018YFC0213503), and the National Air Pollution Control Key Issues Research Program (No. DQGG0107).

Institutional Review Board Statement

Not applicable.

Informed Consent Statement

Not applicable.

Data Availability Statement

All model results are available upon request. The data are not publicly available due to privacy.

Conflicts of Interest

The authors declare no conflicts of interest.

References

  1. Li, K.; Jacob, D.J.; Liao, H.; Zhu, J.; Shah, V.; Shen, L.; Bates, K.H.; Zhang, Q.; Zhai, S. A two-pollutant strategy for improving ozone and particulate air quality in China. Nat. Geosci. 2019, 12, 906–910. [Google Scholar] [CrossRef]
  2. Li, K.; Jacob, D.J.; Shen, L.; Lu, X.; De Smedt, I.; Liao, H. Increases in surface ozone pollution in China from 2013 to 2019: Anthropogenic and meteorological influences. Atmos. Chem. Phys. 2020, 20, 11423–11433. [Google Scholar] [CrossRef]
  3. Zhao, S.; Yin, D.; Yu, Y.; Kang, S.; Qin, D.; Dong, L. PM2.5 and O3 pollution during 2015–2019 over 367 Chinese cities: Spatiotemporal variations, meteorological and topographical impacts. Environ. Pollut. 2020, 264, 114694. [Google Scholar] [CrossRef] [PubMed]
  4. Deng, T.; Wu, D.; Deng, X.; Tan, H.; Li, F.; Zheng, J.; Liao, B. Simulation of a typical complex pollution process over Pearl River Delta area. China Environ. Sci. 2012, 32, 193–199. [Google Scholar]
  5. Chen, Z.; Chen, D.; Kwan, M.-P.; Chen, B.; Gao, B.; Zhuang, Y.; Li, R.; Xu, B. The control of anthropogenic emissions contributed to 80 % of the decrease in PM2.5 concentrations in Beijing from 2013 to 2017. Atmos. Chem. Phys. 2019, 19, 13519–13533. [Google Scholar] [CrossRef]
  6. Xue, T.; Liu, J.; Zhang, Q.; Geng, G.; Zheng, Y.; Tong, D.; Liu, Z.; Guan, D.; Bo, Y.; Zhu, T.; et al. Rapid improvement of PM2.5 pollution and associated health benefits in China during 2013–2017. Sci. China Earth Sci. 2019, 62, 1847–1856. [Google Scholar] [CrossRef]
  7. Li, K.; Jacob, D.J.; Liao, H.; Shen, L.; Zhang, Q.; Bates, K.H. Anthropogenic drivers of 2013-2017 trends in summer surface ozone in China. Proc. Natl. Acad. Sci. USA 2019, 116, 422–427. [Google Scholar] [CrossRef] [PubMed]
  8. Wang, T.; Xue, L.; Brimblecombe, P.; Lam, Y.F.; Li, L.; Zhang, L. Ozone pollution in China: A review of concentrations, meteorological influences, chemical precursors, and effects. Sci. Total Environ. 2017, 575, 1582–1596. [Google Scholar] [CrossRef]
  9. Anderson, F. Application of multivariate geostatistics in environmental epidemiology: Case study from Houston, Texas. J. Geosci. Environ. Prot. 2016, 04, 110–115. [Google Scholar] [CrossRef]
  10. Anderson, F.; Delclos, G.L.; Rao, D.C. The effect of air pollutants and socioeconomic status on asthma in Texas. J. Geosci. Environ. Prot. 2016, 04, 39–52. [Google Scholar] [CrossRef]
  11. Anderson, F.; Carson, A.; Whitehead, L.; Burau, K. Spatiotemporal analysis of the effect of ozone and fine particulate on CVD emergency room visits in Harris County, Texas. Open J. Air Pollut. 2014, 3, 87–99. [Google Scholar] [CrossRef]
  12. Wang, L.T.; Wei, Z.; Yang, J.; Zhang, Y.; Zhang, F.F.; Su, J.; Meng, C.C.; Zhang, Q. The 2013 severe haze over southern Hebei, China: Model evaluation, source apportionment, and policy implications. Atmos. Chem. Phys. 2014, 14, 3151–3173. [Google Scholar] [CrossRef]
  13. Yang, J.; Kang, S.; Ji, Z.; Yin, X.; Tripathee, L. Investigating air pollutant concentrations, impact factors, and emission control strategies in western China by using a regional climate-chemistry model. Chemosphere 2020, 246, 125767. [Google Scholar] [CrossRef] [PubMed]
  14. Wang, Y.; Ying, Q.; Hu, J.; Zhang, H. Spatial and temporal variations of six criteria air pollutants in 31 provincial capital cities in China during 2013–2014. Environ. Int. 2014, 73, 413–422. [Google Scholar] [CrossRef]
  15. Wang, J.; Zhao, B.; Wang, S.; Yang, F.; Xing, J.; Morawska, L.; Ding, A.; Kulmala, M.; Kerminen, V.M.; Kujansuu, J.; et al. Particulate matter pollution over China and the effects of control policies. Sci. Total Environ. 2017, 584–585, 426–447. [Google Scholar] [CrossRef]
  16. Putaud, J.P.; Van Dingenen, R.; Alastuey, A.; Bauer, H.; Birmili, W.; Cyrys, J.; Flentje, H.; Fuzzi, S.; Gehrig, R.; Hansson, H.C.; et al. A European aerosol phenomenology—3: Physical and chemical characteristics of particulate matter from 60 rural, urban, and kerbside sites across Europe. Atmos. Environ. 2010, 44, 1308–1320. [Google Scholar] [CrossRef]
  17. Asmi, A.; Wiedensohler, A.; Laj, P.; Fjaeraa, A.M.; Sellegri, K.; Birmili, W.; Weingartner, E.; Baltensperger, U.; Zdimal, V.; Zikova, N.; et al. Number size distributions and seasonality of submicron particles in Europe 2008–2009. Atmos. Chem. Phys. 2011, 11, 5505–5538. [Google Scholar] [CrossRef]
  18. Kang, Y.H.; You, S.; Bae, M.; Kim, E.; Son, K.; Bae, C.; Kim, Y.; Kim, B.U.; Kim, H.C.; Kim, S. The impacts of COVID-19, meteorology, and emission control policies on PM2.5 drops in Northeast Asia. Sci. Rep. 2020, 10, 22112. [Google Scholar] [CrossRef]
  19. Chai, F.; Gao, J.; Chen, Z.; Wang, S.; Zhang, Y.; Zhang, J.; Zhang, H.; Yun, Y.; Ren, C. Spatial and temporal variation of particulate matter and gaseous pollutants in 26 cities in China. J. Environ. Sci. 2014, 26, 75–82. [Google Scholar] [CrossRef]
  20. Zhao, Y.; Nielsen, C.P.; Lei, Y.; McElroy, M.B.; Hao, J. Quantifying the uncertainties of a bottom-up emission inventory of anthropogenic atmospheric pollutants in China. Atmos. Chem. Phys. 2011, 11, 2295–2308. [Google Scholar] [CrossRef]
  21. Danek, T.; Weglinska, E.; Zareba, M. The influence of meteorological factors and terrain on air pollution concentration and migration: A geostatistical case study from Krakow, Poland. Sci. Rep. 2022, 12, 11050. [Google Scholar] [CrossRef]
  22. He, J.; Gong, S.; Yu, Y.; Yu, L.; Wu, L.; Mao, H.; Song, C.; Zhao, S.; Liu, H.; Li, X.; et al. Air pollution characteristics and their relation to meteorological conditions during 2014–2015 in major Chinese cities. Environ. Pollut. 2017, 223, 484–496. [Google Scholar] [CrossRef]
  23. Zhang, H.; Wang, Y.; Hu, J.; Ying, Q.; Hu, X.M. Relationships between meteorological parameters and criteria air pollutants in three megacities in China. Environ. Res. 2015, 140, 242–254. [Google Scholar] [CrossRef]
  24. Li, J.; Zhang, H.; Ying, Q. Comparison of the SAPRC07 and SAPRC99 photochemical mechanisms during a high ozone episode in Texas: Differences in concentrations, OH budget and relative response factors. Atmos. Environ. 2012, 54, 25–35. [Google Scholar] [CrossRef]
  25. Zhang, H.; Ying, Q. Contributions of local and regional sources of NOx to ozone concentrations in Southeast Texas. Atmos. Environ. 2011, 45, 2877–2887. [Google Scholar] [CrossRef]
  26. Zhang, H.; Li, J.; Ying, Q.; Yu, J.Z.; Wu, D.; Cheng, Y.; He, K.; Jiang, J. Source apportionment of PM2.5 nitrate and sulfate in China using a source-oriented chemical transport model. Atmos. Environ. 2012, 62, 228–242. [Google Scholar] [CrossRef]
  27. Wang, T.; Xue, L.; Feng, Z.; Dai, J.; Zhang, Y.; Tan, Y. Ground-level ozone pollution in China: A synthesis of recent findings on influencing factors and impacts. Environ. Res. Lett. 2022, 17, 063003. [Google Scholar] [CrossRef]
  28. Lu, X.; Hong, J.; Zhang, L.; Cooper, O.R.; Schultz, M.G.; Xu, X.; Wang, T.; Gao, M.; Zhao, Y.; Zhang, Y. Severe Surface Ozone Pollution in China: A Global Perspective. Environ. Sci. Technol. Lett. 2018, 5, 487–494. [Google Scholar] [CrossRef]
  29. Chang, K.-L.; Petropavlovskikh, I.; Cooper, O.R.; Schultz, M.G.; Wang, T. Regional trend analysis of surface ozone observations from monitoring networks in eastern North America, Europe and East Asia. Elem. Sci. Anth. 2017, 50, 22. [Google Scholar] [CrossRef]
  30. Lefohn, A.S.; Malley, C.S.; Smith, L.; Wells, B.; Hazucha, M.; Simon, H.; Naik, V.; Mills, G.; Schultz, M.G.; Paoletti, E.; et al. Tropospheric ozone assessment report Global ozone metrics for climate change, human health and cropecosystem research. Elem. Sci. Anth. 2018, 6, 27. [Google Scholar] [CrossRef] [PubMed]
  31. Lu, X.; Zhang, L.; Liu, X.; Gao, M.; Zhao, Y.; Shao, J. Lower tropospheric ozone over India and its linkage to the South Asian monsoon. Atmos. Chem. Phys. 2018, 18, 3101–3118. [Google Scholar] [CrossRef]
  32. Barrett, B.S.; Raga, G.B. Variability of winter and summer surface ozone in Mexico City on the intraseasonal timescale. Atmos. Chem. Phys. 2016, 16, 15359–15370. [Google Scholar] [CrossRef]
  33. Wei, J.; Li, Z.; Li, K.; Dickerson, R.R.; Pinker, R.T.; Wang, J.; Liu, X.; Sun, L.; Xue, W.; Cribb, M. Full-coverage mapping and spatiotemporal variations of ground-level ozone (O3) pollution from 2013 to 2020 across China. Remote Sens. Environ. 2022, 270, 112775. [Google Scholar] [CrossRef]
  34. Xiang, S.; Liu, J.; Tao, W.; Yi, K.; Xu, J.; Hu, X.; Liu, H.; Wang, Y.; Zhang, Y.; Yang, H.; et al. Control of both PM2.5 and O3 in Beijing-Tianjin-Hebei and the surrounding areas. Atmos. Environ. 2020, 224, 117259. [Google Scholar] [CrossRef]
  35. Lin, M.; Horowitz, L.W.; Payton, R.; Fiore, A.M.; Tonnesen, G. US surface ozone trends and extremes from 1980 to 2014: Quantifying the roles of rising Asian emissions, domestic controls, wildfires, and climate. Atmos. Chem. Phys. 2017, 17, 2943–2970. [Google Scholar] [CrossRef]
  36. Mao, Z.; Xu, J.; Yang, D.; Yu, Z.; Qu, Y.; Zhou, G. Analysis of characteristics and meteorological causes of PM2.5-O3 compound pollution in Shanghai. China Environ. Sci. 2019, 39, 2730–2738. [Google Scholar] [CrossRef]
  37. Xiao, Z.; Xu, H.; Gao, J.; Cai, Z.; Bi, W.; Li, P.; Yang, N.; Deng, X.; Ji, Y. Characteristics and Sources of PM2.5-O3 Compound Pollution in Tianjin. Environ. Sci. 2022, 43, 1140–1150. [Google Scholar] [CrossRef]
  38. Kalashnikov, D.A.; Schnell, J.L.; Abatzoglou, J.T.; Swain, D.L.; Singh, D. Increasing co-occurrence of fine particulate matter and ground-level ozone extremes in the western United States. Sci. Adv. 2022, 8, eabi9386. [Google Scholar] [CrossRef]
  39. Siddika, N.; Rantala, A.K.; Antikainen, H.; Balogun, H.; Amegah, A.K.; Ryti, N.R.I.; Kukkonen, J.; Sofiev, M.; Jaakkola, M.S.; Jaakkola, J.J.K. Synergistic effects of prenatal exposure to fine particulate matter (PM2.5) and ozone (O3) on the risk of preterm birth: A population-based cohort study. Environ. Res. 2019, 176, 108549. [Google Scholar] [CrossRef] [PubMed]
  40. Zheng, Y.; Jiang, F.; Feng, S.; Cai, Z.; Shen, Y.; Ying, C.; Wang, X.; Liu, Q. Long-range transport of ozone across the eastern China seas: A case study in coastal cities in southeastern China. Sci. Total Environ. 2021, 768, 144520. [Google Scholar] [CrossRef] [PubMed]
  41. Huang, Y.; Deng, T.; Li, Z.; Wang, N.; Yin, C.; Wang, S.; Fan, S. Numerical simulations for the sources apportionment and control strategies of PM2.5 over Pearl River Delta, China, part I: Inventory and PM2.5 sources apportionment. Sci. Total Environ. 2018, 634, 1631–1644. [Google Scholar] [CrossRef]
  42. Wu, Y.; Wang, P.; Yu, S.; Wang, L.; Li, P.; Li, Z.; Mehmood, K.; Liu, W.; Wu, J.; Lichtfouse, E.; et al. Residential emissions predicted as a major source of fine particulate matter in winter over the Yangtze River Delta, China. Environ. Chem. Lett. 2018, 16, 1117–1127. [Google Scholar] [CrossRef]
  43. Yang, K.; Kong, L.; Tong, S.; Shen, J.; Chen, L.; Jin, S.; Wang, C.; Sha, F.; Wang, L. Double High-Level Ozone and PM2.5 Co-Pollution Episodes in Shanghai, China: Pollution Characteristics and Significant Role of Daytime HONO. Atmosphere 2021, 12, 577. [Google Scholar] [CrossRef]
  44. Lai, A.; Cheng, X.; Liu, Y.; Jiang, M.; Liu, Y.; Wang, X.; Fan, Q. Characteristics of complex pollution with high concentrations of PM2.5 and O3 over the Pearl River Delta, China. Acta Sci. Nat. Univ. Sunyatseni 2018, 57, 30–36. [Google Scholar] [CrossRef]
  45. Zhao, S.; Wang, L.; Qi, M.; Lu, X.; Wang, Y.; Liu, Z.; Liu, Y.; Tan, J.; Zhang, Y.; Wang, Q.; et al. Study on the characteristics and mutual influence of PM2.5-O3 complex pollution in Handan. Acta Sci. Circumst. 2021, 41, 2250–2261. [Google Scholar] [CrossRef]
  46. Wang, Z.; Zhang, D.; Li, Y.; Dong, X.; Sun, R.; Sun, N. Different Air Pollution Situations of O3 and PM2.5 during Summer in Beijing. Environ. Sci. 2016, 37, 807–815. [Google Scholar] [CrossRef]
  47. Lai, A.; Chen, X.; Liu, Y.; Jiang, M.; Wang, X.; Wei, X.; Fan, Q. Numerical simulation of a complex pollution episode with high concentrations of PM2.5 and O3 over the Pearl River Delta region, China. China Environ. Sci. 2017, 37, 4022–4037. [Google Scholar] [CrossRef]
  48. Zareba, M.; Dlugosz, H.; Danek, T.; Weglinska, E. Big-Data-Driven Machine Learning for Enhancing Spatiotemporal Air Pollution Pattern Analysis. Atmosphere 2023, 14, 760. [Google Scholar] [CrossRef]
  49. Kovacs, K.D.; Haidu, I. Modeling NO2 air pollution variation during and after COVID-19-regulation using principal component analysis of satellite imagery. Environ. Pollut. 2023, 342, 122973. [Google Scholar] [CrossRef] [PubMed]
  50. GB 3095–2012; Ambient Air Quality Standard. China Environment Press: Beijing, China, 2012. Available online: http://www.cnemc.cn/jcgf/dqhj/201711/t20171108_647276.shtml (accessed on 12 January 2024).
  51. HJ630-2011; Technical Guideline on Environmental Monitoring Quality Management. Available online: https://www.mee.gov.cn/ywgz/fgbz/bz/bzwb/other/qt/201109/t20110914_217274.shtml (accessed on 12 January 2024).
  52. U.S. Environmental Protection Agency. CMAQ User’s Guide; U.S. Environmental Protection Agency: San Francisco, CA, USA, 2022. Available online: https://github.com/USEPA/CMAQ/blob/master/DOCS/Users_Guide/README.md (accessed on 1 December 2023).
  53. Yu, S.; Mathur, R.; Kang, D.; Schere, K.; Eder, B.; Pleim, J. Performance and diagnostic evaluation of ozone predictions by the Eta-Community Multiscale Air Quality Forecast System during the 2002 New England Air Quality Study. J. Air Waste Manag. Assoc. 2006, 56, 1459–1471. [Google Scholar] [CrossRef]
  54. Eder, B.; Yu, S. A performance evaluation of the 2004 release of Models-3 CMAQ. Atmos. Environ. 2006, 40, 4811–4824. [Google Scholar] [CrossRef]
  55. Li, J.; Yu, S.; Chen, X.; Zhang, Y.; Li, M.; Li, Z.; Song, Z.; Liu, W.; Li, P.; Xie, M.; et al. Evaluation of the WRF-CMAQ Model Performances on Air Quality in China with the Impacts of the Observation Nudging on Meteorology. Aerosol Air Qual. Res. 2022, 22, 220023. [Google Scholar] [CrossRef]
  56. Dong, Z.; Wang, S.; Xing, J.; Chang, X.; Ding, D.; Zheng, H. Regional transport in Beijing-Tianjin-Hebei region and its changes during 2014–2017: The impacts of meteorology and emission reduction. Sci. Total Environ. 2020, 737, 139792. [Google Scholar] [CrossRef] [PubMed]
  57. Zheng, H.; Zhao, B.; Wang, S.; Wang, T.; Ding, D.; Chang, X.; Liu, K.; Xing, J.; Dong, Z.; Aunan, K.; et al. Transition in source contributions of PM2.5 exposure and associated premature mortality in China during 2005–2015. Environ. Int. 2019, 132, 105111. [Google Scholar] [CrossRef]
  58. Byun, D.; Schere, K.L. Review of the Governing Equations, Computational Algorithms, and Other Components of the Models-3 Community Multiscale Air Quality (CMAQ) Modeling System. Appl. Mech. Rev. 2006, 59, 51–77. [Google Scholar] [CrossRef]
  59. Zhang, Y.; Yu, S.; Chen, X.; Li, Z.; Li, M.; Song, Z.; Liu, W.; Li, P.; Zhang, X.; Lichtfouse, E.; et al. Local production, downward and regional transport aggravated surface ozone pollution during the historical orange-alert large-scale ozone episode in eastern China. Environ. Chem. Lett. 2022, 20, 1577–1588. [Google Scholar] [CrossRef]
  60. Kwok, R.H.F.; Napelenok, S.L.; Baker, K.R. Implementation and evaluation of PM2.5 source contribution analysis in a photochemical model. Atmos. Environ. 2013, 80, 398–407. [Google Scholar] [CrossRef]
  61. Han, X.; Zhu, L.; Wang, S.; Meng, X.; Zhang, M.; Hu, J. Modeling study of impacts on surface ozone of regional transport and emissions reductions over North China Plain in summer 2015. Atmos. Chem. Phys. 2018, 18, 12207–12221. [Google Scholar] [CrossRef]
  62. Kwok, R.H.F.; Baker, K.R.; Napelenok, S.L.; Tonnesen, G.S. Photochemical grid model implementation and application of VOC, NOx, and O3 source apportionment. Geosci. Model Dev. 2015, 8, 99–114. [Google Scholar] [CrossRef]
  63. Li, T.; Wei, P.; Cheng, S.; Su, F.; Ren, Z.; Bai, J. Analysis of a near earth surface O3 and PM2.5 pollution in combination with its contaminating process in Beijing. J. Saf. Environ. 2017, 17, 1979–1985. [Google Scholar] [CrossRef]
  64. Tao, H.; Xing, J.; Zhou, H.; Chang, X.; Li, G.; Chen, L.; Li, J. Impacts of land use and land cover change on regional meteorology and air quality over the Beijing-Tianjin-Hebei region, China. Atmos. Environ. 2018, 189, 9–21. [Google Scholar] [CrossRef]
  65. EPA-454/B-07-002; Guidance on the Use of Models and Other Analyses for Demonstrating Attainment of Air Quality Goals for Ozone, PM2.5, and Regional Haze. US-EPA: San Francisco, CA, USA, 2007.
  66. Shu, L.; Xie, M.; Wang, T.; Gao, D.; Chen, P.; Han, Y.; Li, S.; Zhuang, B.; Li, M. Integrated studies of a regional ozone pollution synthetically affected by subtropical high and typhoon system in the Yangtze River Delta region, China. Atmos. Chem. Phys. 2016, 16, 15801–15819. [Google Scholar] [CrossRef]
  67. Li, L.; Chen, C.H.; Huang, C.; Huang, H.Y.; Zhang, G.F.; Wang, Y.J.; Wang, H.L.; Lou, S.R.; Qiao, L.P.; Zhou, M.; et al. Process analysis of regional ozone formation over the Yangtze River Delta, China using the Community Multi-scale Air Quality modeling system. Atmos. Chem. Phys. 2012, 12, 10971–10987. [Google Scholar] [CrossRef]
  68. Gao, J.; Li, Y.; Zhu, B.; Hu, B.; Wang, L.; Bao, F. What have we missed when studying the impact of aerosols on surface ozone via changing photolysis rates? Atmos. Chem. Phys. 2020, 20, 10831–10844. [Google Scholar] [CrossRef]
  69. Xu, J.; Zhang, Y.; Zheng, S.; He, Y. Aerosol effects on ozone concentrations in Beijing: A model sensitivity study. J. Environ. Sci. 2012, 24, 645–656. [Google Scholar] [CrossRef]
  70. Xing, J.; Mathur, R.; Pleim, J.; Hogrefe, C.; Gan, C.M.; Wong, D.C.; Wei, C.; Wang, J. Air pollution and climate response to aerosol direct radiative effects: A modeling study of decadal trends across the northern hemisphere. J. Geophys. Res.—Atmos. 2015, 120, 12221–12236. [Google Scholar] [CrossRef]
  71. Xing, J.; Wang, J.; Mathur, R.; Wang, S.; Sarwar, G.; Pleim, J.; Hogrefe, C.; Zhang, Y.; Jiang, J.; Wong, D.C.; et al. Impacts of aerosol direct effects on tropospheric ozone through changes in atmospheric dynamics and photolysis rates. Atmos. Chem. Phys. 2017, 17, 9869–9883. [Google Scholar] [CrossRef]
  72. Huang, R.J.; Zhang, Y.; Bozzetti, C.; Ho, K.F.; Cao, J.J.; Han, Y.; Daellenbach, K.R.; Slowik, J.G.; Platt, S.M.; Canonaco, F.; et al. High secondary aerosol contribution to particulate pollution during haze events in China. Nature 2014, 514, 218–222. [Google Scholar] [CrossRef]
  73. Wang, Y.; Zhang, Q.Q.; He, K.; Zhang, Q.; Chai, L. Sulfate-nitrate-ammonium aerosols over China: Response to 2000–2015 emission changes of sulfur dioxide, nitrogen oxides, and ammonia. Atmos. Chem. Phys. 2013, 13, 2635–2652. [Google Scholar] [CrossRef]
  74. Li, L. The Numerical Simulation of Comprehensive Air Pollution Characteristics in a Typical City-Cluster. Ph.D. Thesis, Shanghai University, Shanghai, China, 30 November 2012. [Google Scholar]
  75. Kurten, T.; Lane, J.R.; Jorgensen, S.; Kjaergaard, H.G. A computational study of the oxidation of SO2 to SO3 by gas-phase organic oxidants. J. Phys. Chem. A 2011, 115, 8669–8681. [Google Scholar] [CrossRef]
  76. Xu, W.Y.; Zhao, C.S.; Ran, L.; Lin, W.L.; Yan, P.; Xu, X.B. SO2 noontime-peak phenomenon in the North China Plain. Atmos. Chem. Phys. 2014, 14, 7757–7768. [Google Scholar] [CrossRef]
  77. Sun, Y.; Zhuang, G.; Tang, A.; Wang, Y.; An, Z. Chemical Characteristics of PM2.5 and PM10 in Haze-Fog Episodes in Beijing. Environ. Sci. Technol. 2006, 40, 3148–3155. [Google Scholar] [CrossRef]
  78. Wang, X.; Zhang, Y.; Chen, H.; Yang, X.; Chen, J. Particulate Nitrate Formation in a Highly Polluted Urban Area: A Case Study by Single-Particle Mass Spectrometry in Shanghai. Environ. Sci. Technol. 2009, 43, 3061–3066. [Google Scholar] [CrossRef]
  79. Wen, L.; Chen, J.; Yang, L.; Wang, X.; Caihong, X.; Sui, X.; Yao, L.; Zhu, Y.; Zhang, J.; Zhu, T.; et al. Enhanced formation of fine particulate nitrate at a rural site on the North China Plain in summer: The important roles of ammonia and ozone. Atmos. Environ. 2015, 101, 294–302. [Google Scholar] [CrossRef]
  80. Yang, F.; Chen, H.; Du, J.; Yang, X.; Gao, S.; Chen, J.; Geng, F. Evolution of the mixing state of fine aerosols during haze events in Shanghai. Atmos. Res. 2012, 104–105, 193–201. [Google Scholar] [CrossRef]
  81. Wang, D.; Zhou, B.; Fu, Q.; Zhao, Q.; Zhang, Q.; Chen, J.; Yang, X.; Duan, Y.; Li, J. Intense secondary aerosol formation due to strong atmospheric photochemical reactions in summer: Observations at a rural site in eastern Yangtze River Delta of China. Sci. Total Environ. 2016, 571, 1454–1466. [Google Scholar] [CrossRef]
Figure 1. The model simulation domain and the simulations with observations overlaid (circle) for (a) PM2.5 daily average concentrations, (b) MDA8_O3 concentrations over mainland China from 3 to 5 April 2019. The tracked source regions are shown in (c). BJ: Beijing; TJ: Tianjin; SX: Shanxi; SD: Shandong; HB: Hebei; HN: Henan; HUB: Hubei; AH: Anhui; JS: Jiangsu; OTH: Other regions, except the marked areas in the domain. (d) The geographical distributions of 4 cities in the NCP region (including Handan, Jining, Anyang, Kaifeng).
Atmosphere 15 00198 g001
Figure 2. Step-by-step workflow.
Atmosphere 15 00198 g002
Figure 3. Time series of the observed (Obs) and simulated (Sim) T, RH, Wind, PM2.5, and O3 in the four cities from 00:00 LT 30 March to 00:00 LT 10 April 2019. The PM2.5-O3 complex pollution episode was marked by the grey backgrounds.
Atmosphere 15 00198 g003
Figure 4. Ground weather situation at 8:00 LT from 3 to 5 April 2019. The left column is the ground weather map, and the right column is the ground temperature and wind field map.
Atmosphere 15 00198 g004
Figure 5. (a) Hourly contributions of CHEM, DDEP, HTRA, and VTRA to O3 formation in the four cities, with green and pink lines presenting the net O3 (the sum of all processes) and O3 concentration changes, respectively. Vertical profiles of (b) daytime (7:00~18:00) and (c) nighttime (17:00~23:00) mean process contributions to the O3 formation at different heights, from 3 to 5 April 2019.
Atmosphere 15 00198 g005
Figure 6. Average daily changes of meteorological parameters and pollutant concentrations in Handan, Jining, Anyang and Kaifeng, from 3 to 5 April 2019.
Atmosphere 15 00198 g006
Figure 7. Time series of O3 regional source analyses in Handan, Jining, Anyang and Kaifeng, from 31 March to 5 April 2019.
Atmosphere 15 00198 g007
Figure 8. The spatial distributions of the contributions of different areas to the mean O3 concentrations, from 3 to 5 April 2019.
Atmosphere 15 00198 g008
Figure 9. Time series of PM2.5 regional source analyses in Handan, Jining, Anyang and Kaifeng from 31 March to 5 April 2019.
Atmosphere 15 00198 g009
Figure 10. The spatial distributions of different area contributions to mean PM2.5 concentrations, from 3 to 5 April 2019.
Atmosphere 15 00198 g010
Table 1. Simulated concentrations of PM2.5 and its major components (μg/m3) during complex and non-complex pollution periods.
PollutantsComplex Pollution PeriodsNon-Complex Pollution Periods
HandanJiningAnyangKaifengHandanJiningAnyangKaifeng
EC3.82.63.22.32.71.92.42.0
SO42−7.88.37.56.74.45.24.76.0
NO316.516.316.311.67.48.87.710.1
NH4+7.07.16.85.23.23.83.44.4
SOA26.927.026.724.811.716.113.719.6
PM2.576.674.773.962.539.045.942.353.2
Secondary proportion 175.9%78.5%77.4%77.4%68.3%73.8%69.7%75.5%
1 Refers to the ratio of the sum of SO42−, NO3, NH4+, and SOA to PM2.5.
Disclaimer/Publisher’s Note: The statements, opinions and data contained in all publications are solely those of the individual author(s) and contributor(s) and not of MDPI and/or the editor(s). MDPI and/or the editor(s) disclaim responsibility for any injury to people or property resulting from any ideas, methods, instructions or products referred to in the content.

