
Assessment of Particulate Matters, Metals, and PAHs’ Air Pollution in Industrial vs. Animal Husbandry Areas
 , , and
Abstract
:1. Introduction
2. Materials and Methods
2.1. Sampling Campaigns Locations
2.2. Particulate Matters Sampling
2.3. PAHs Detection
2.4. Metallic Elements Detection
2.5. Measurement Uncertainty of the Applied Methods
2.6. Statistics
3. Results
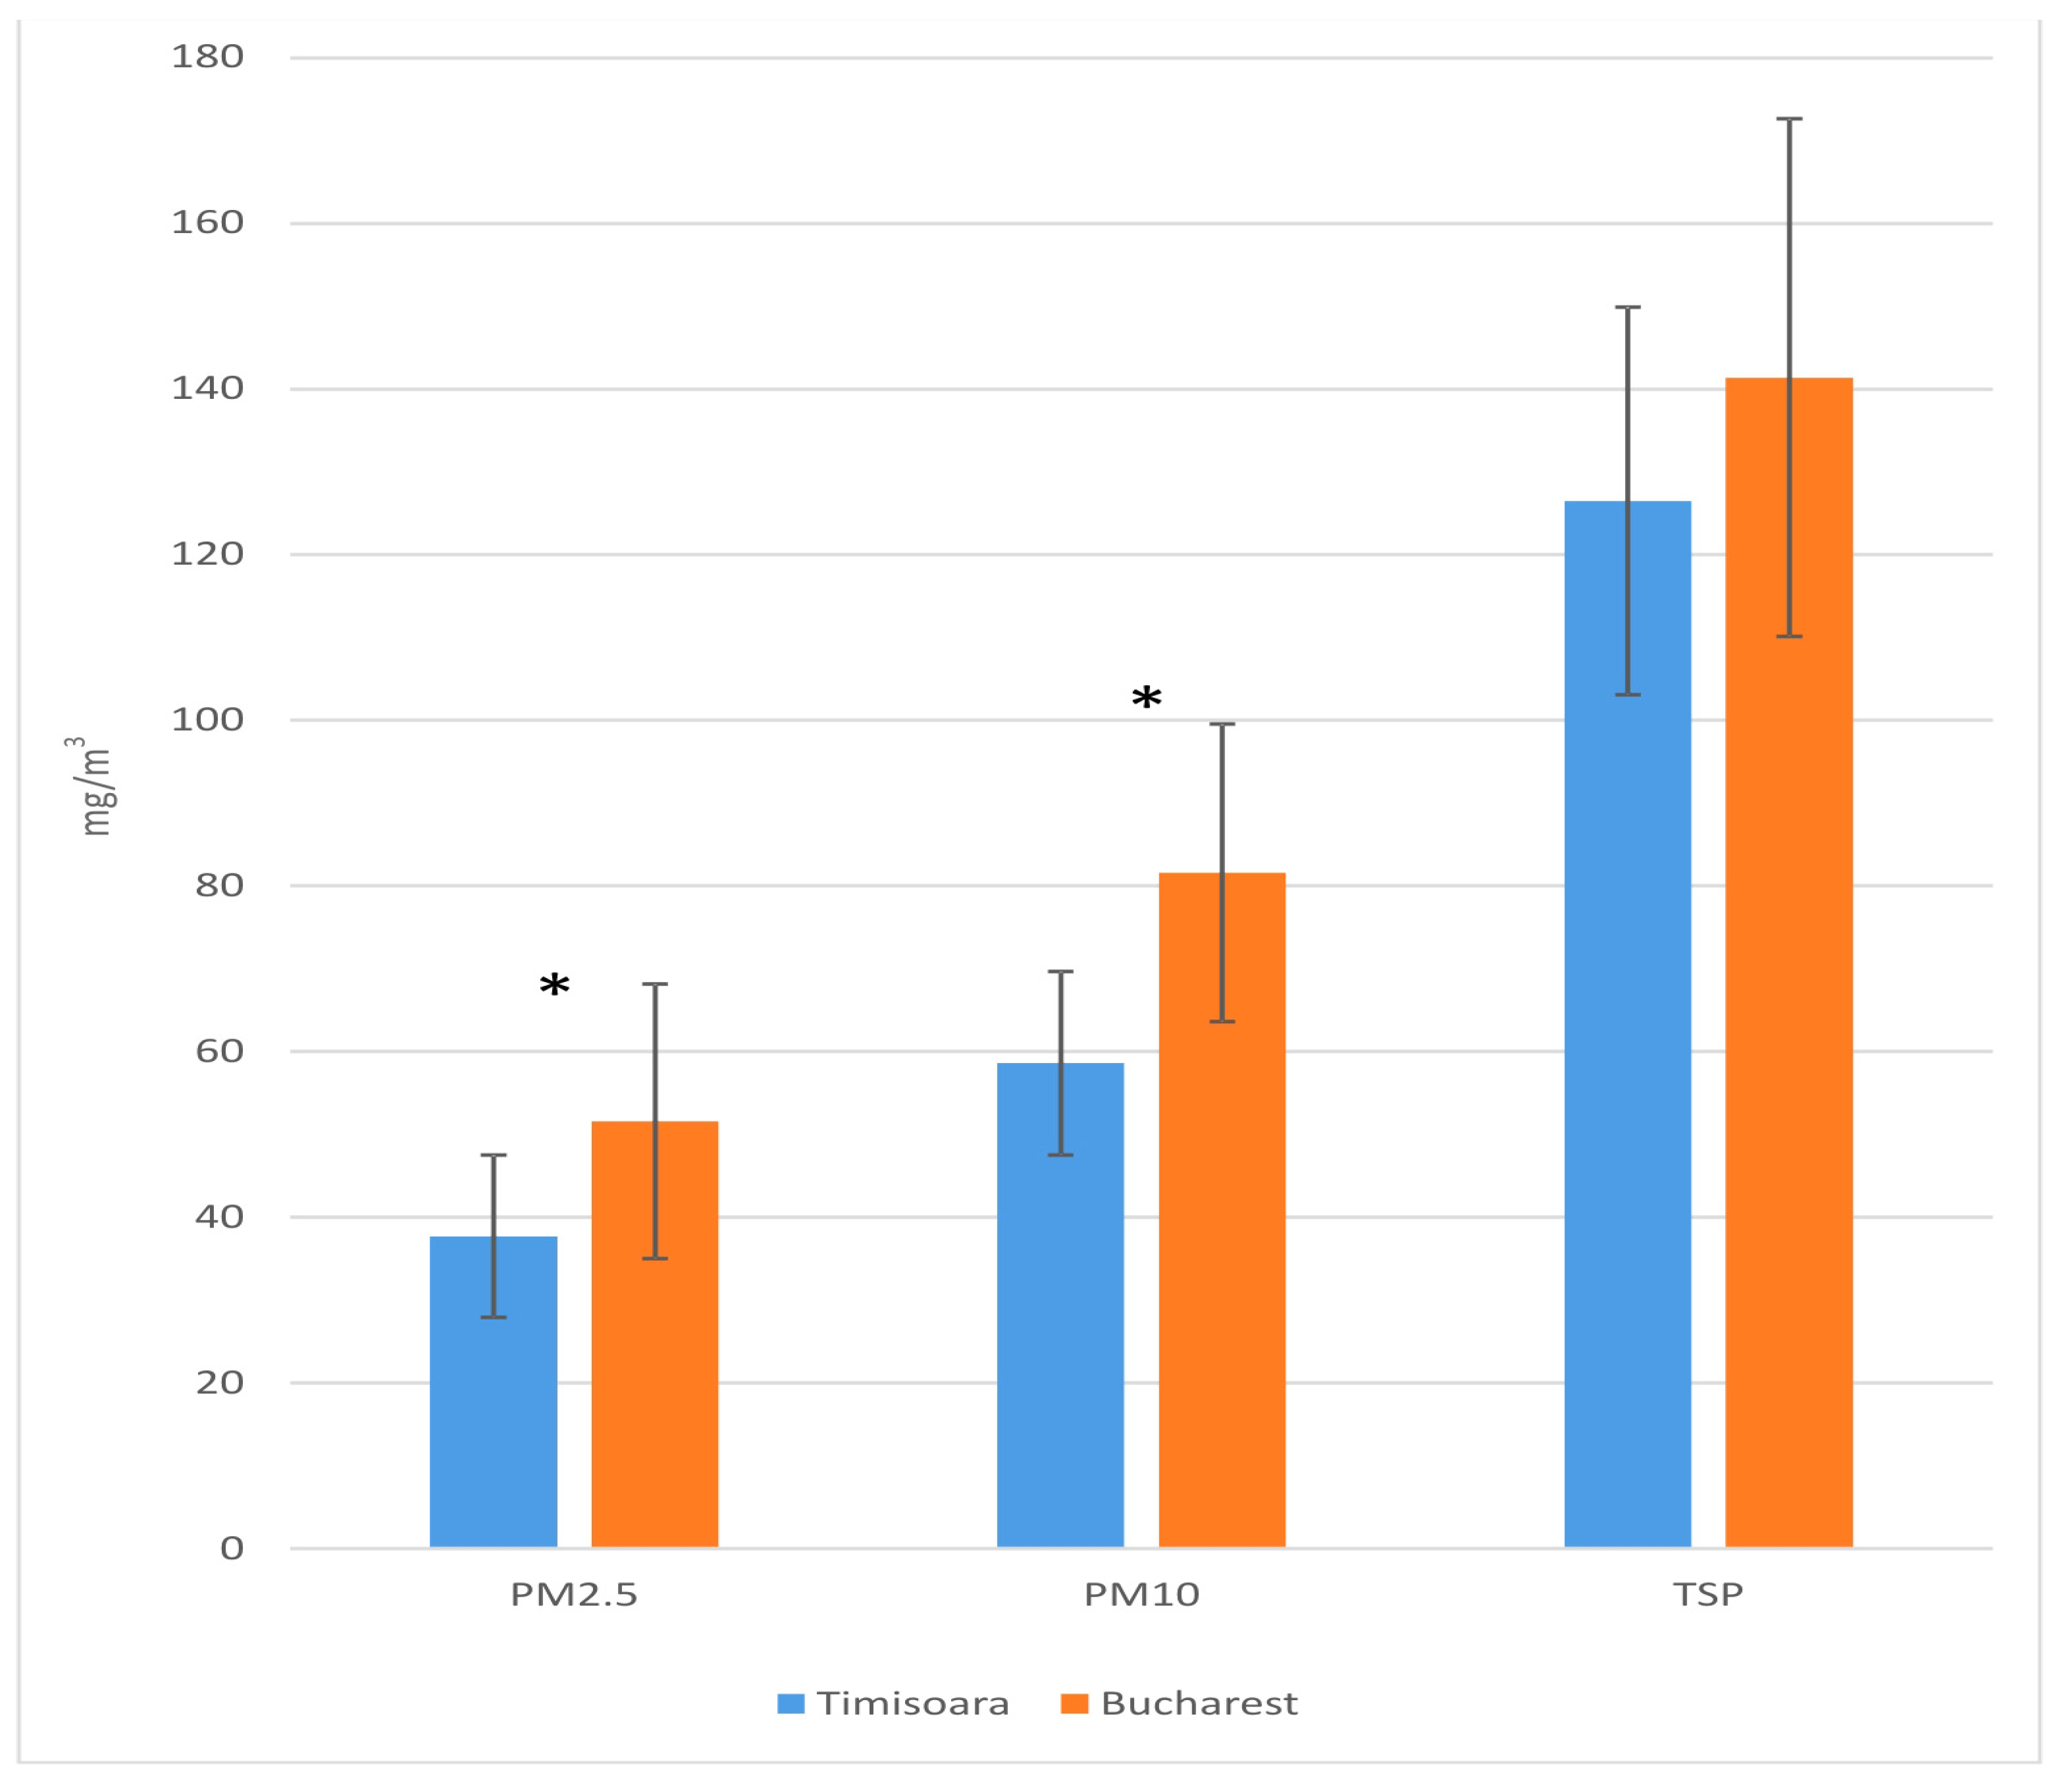
3.1. PM Results
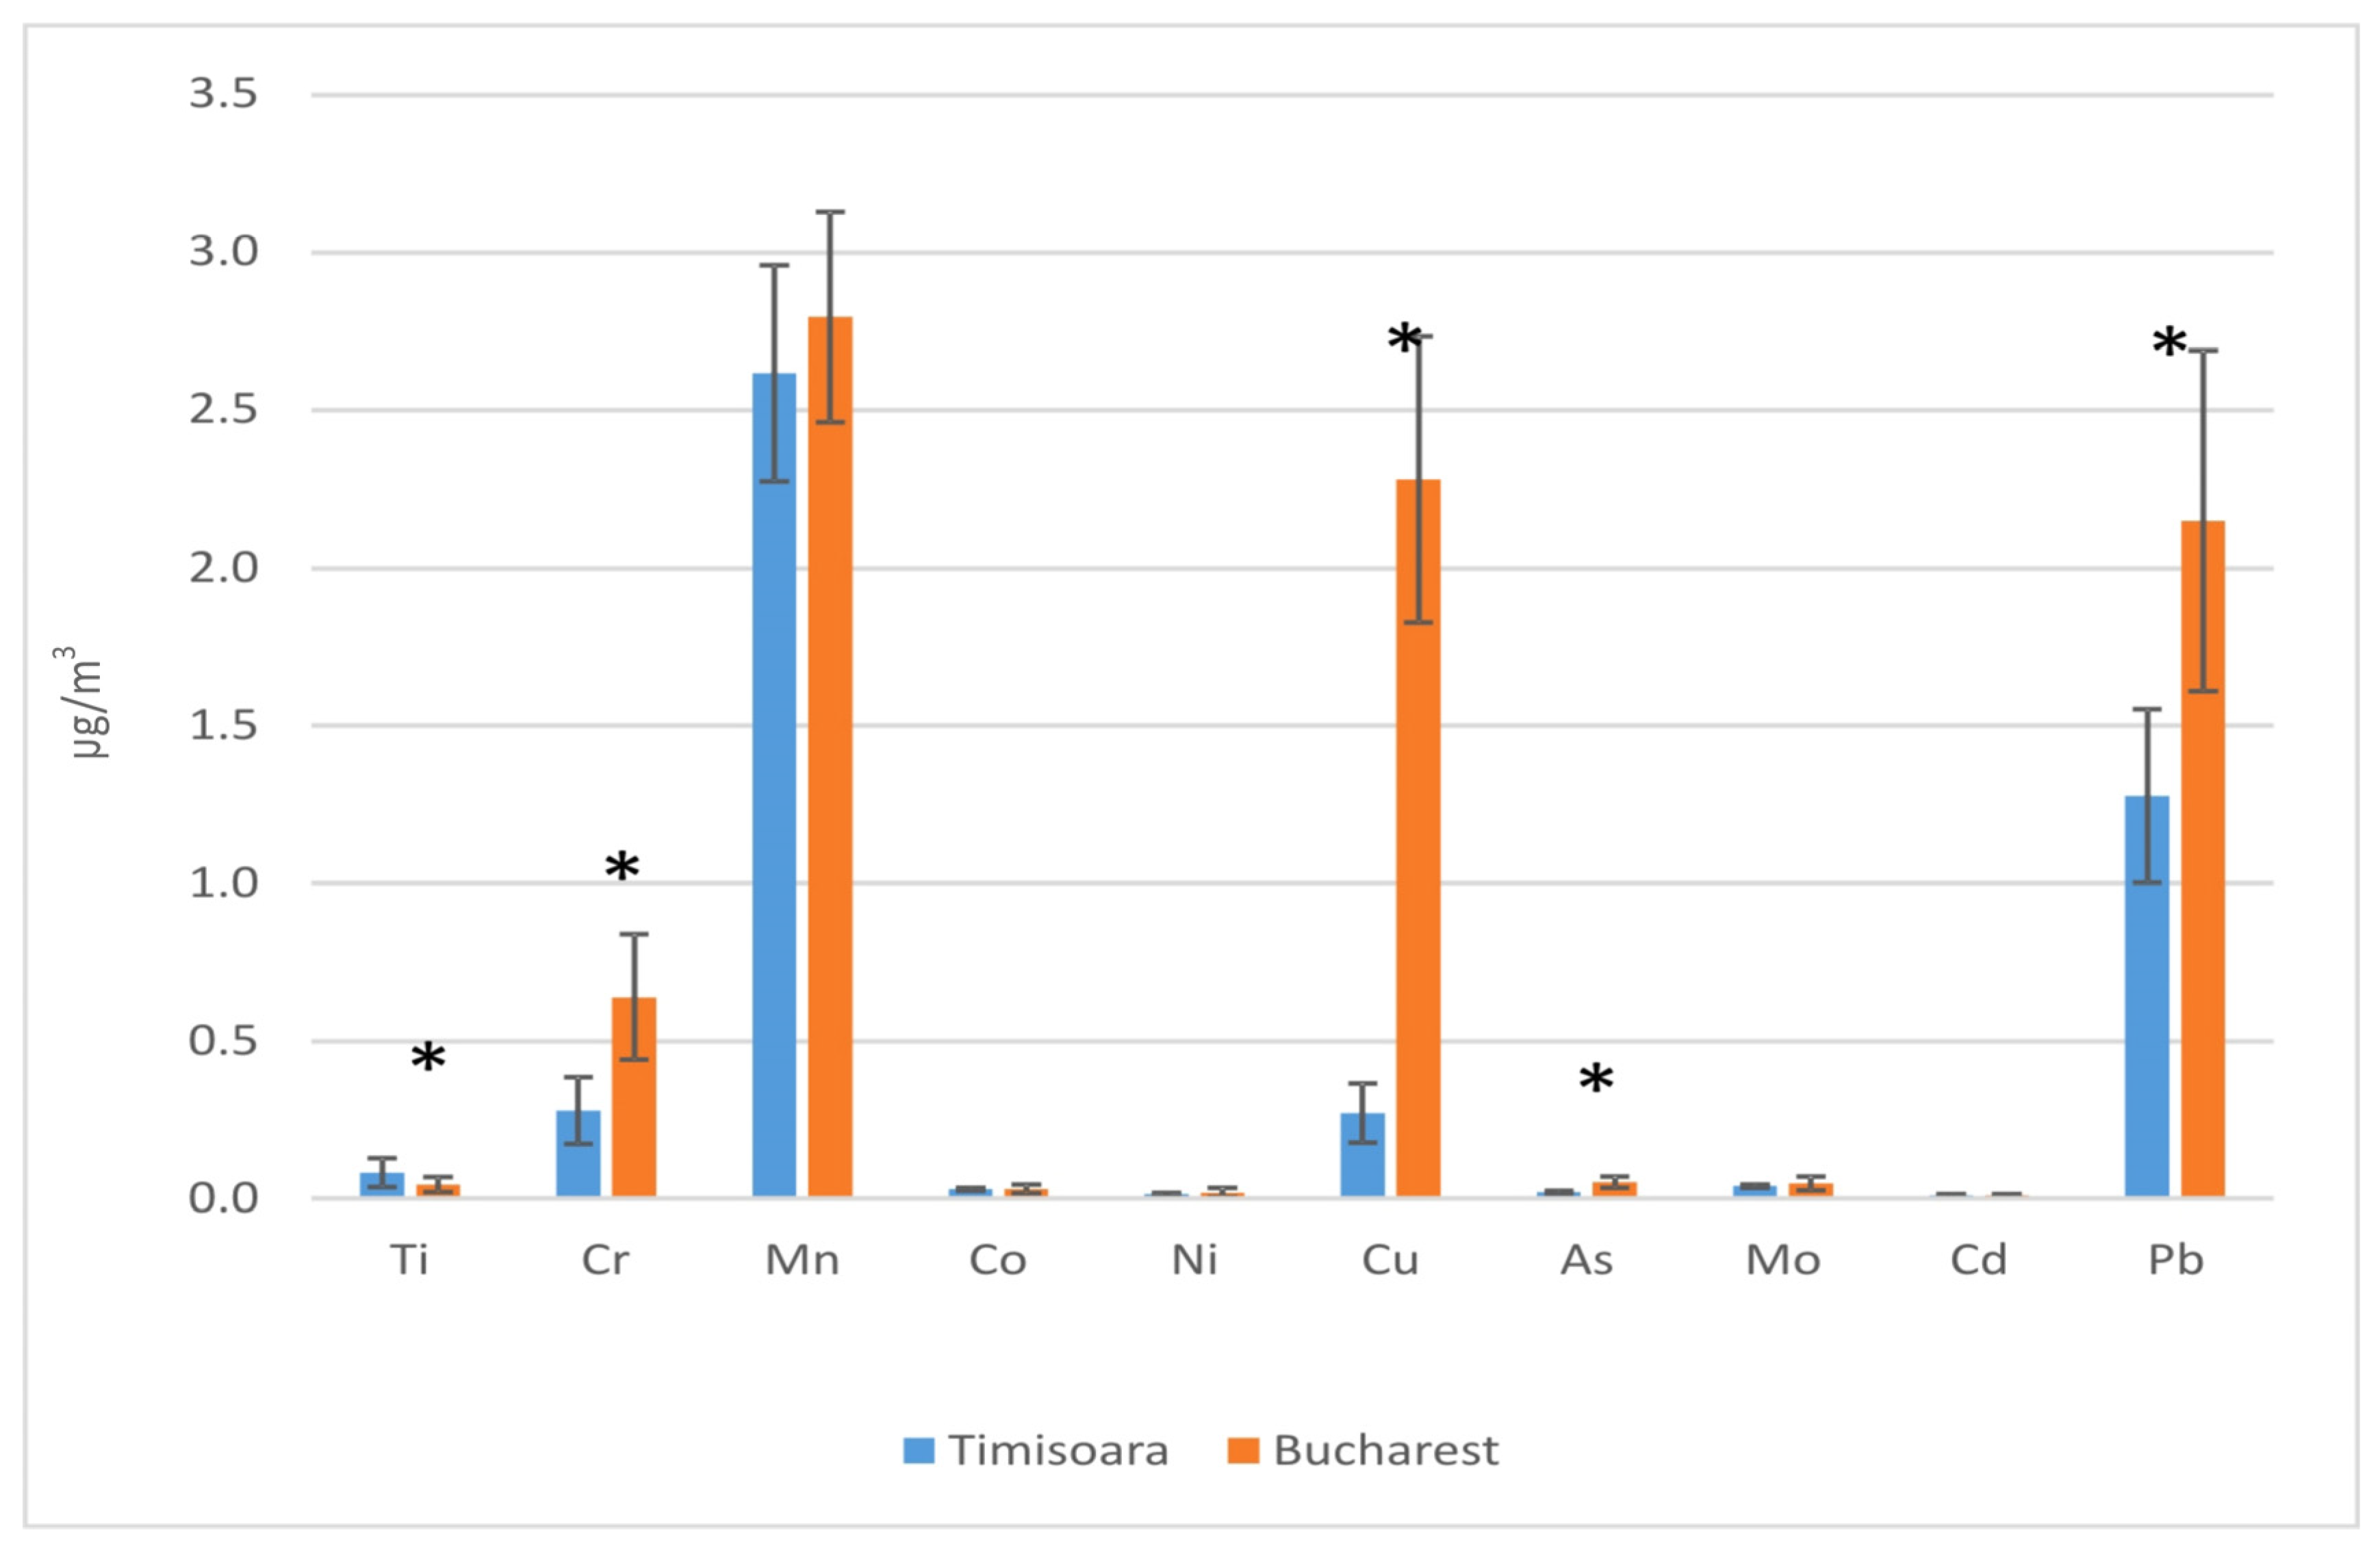
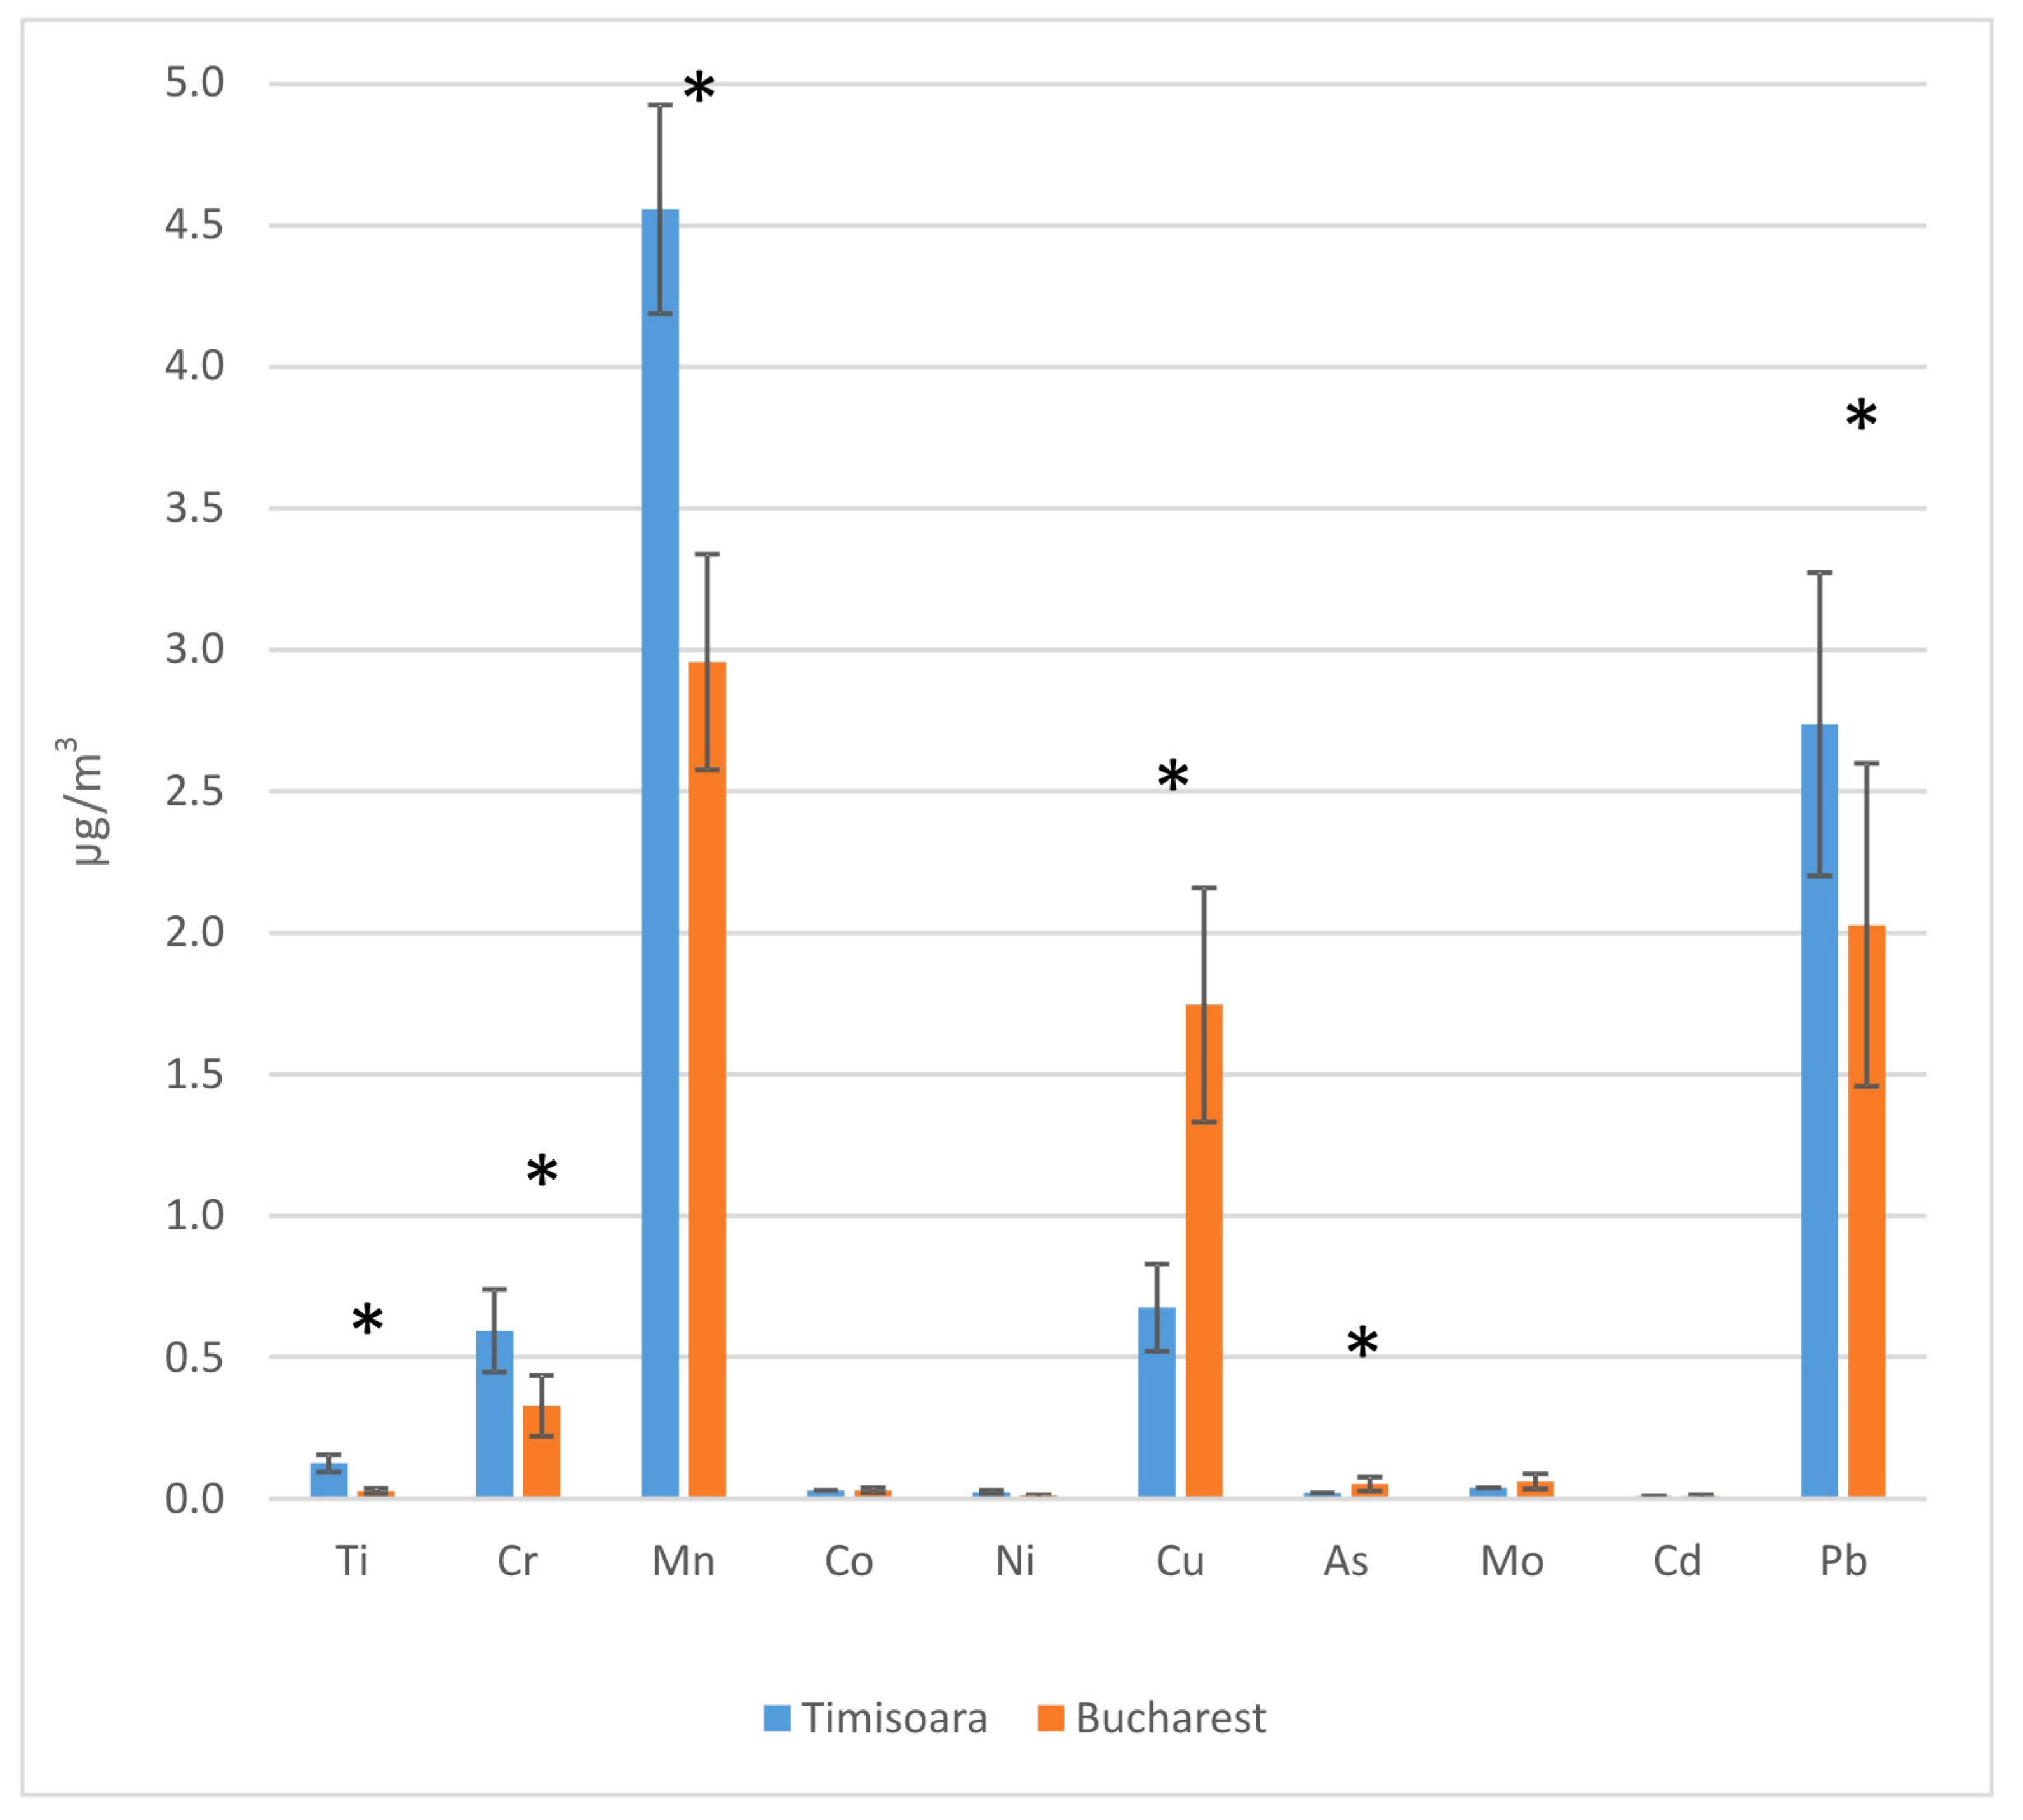
3.2. Metals Results
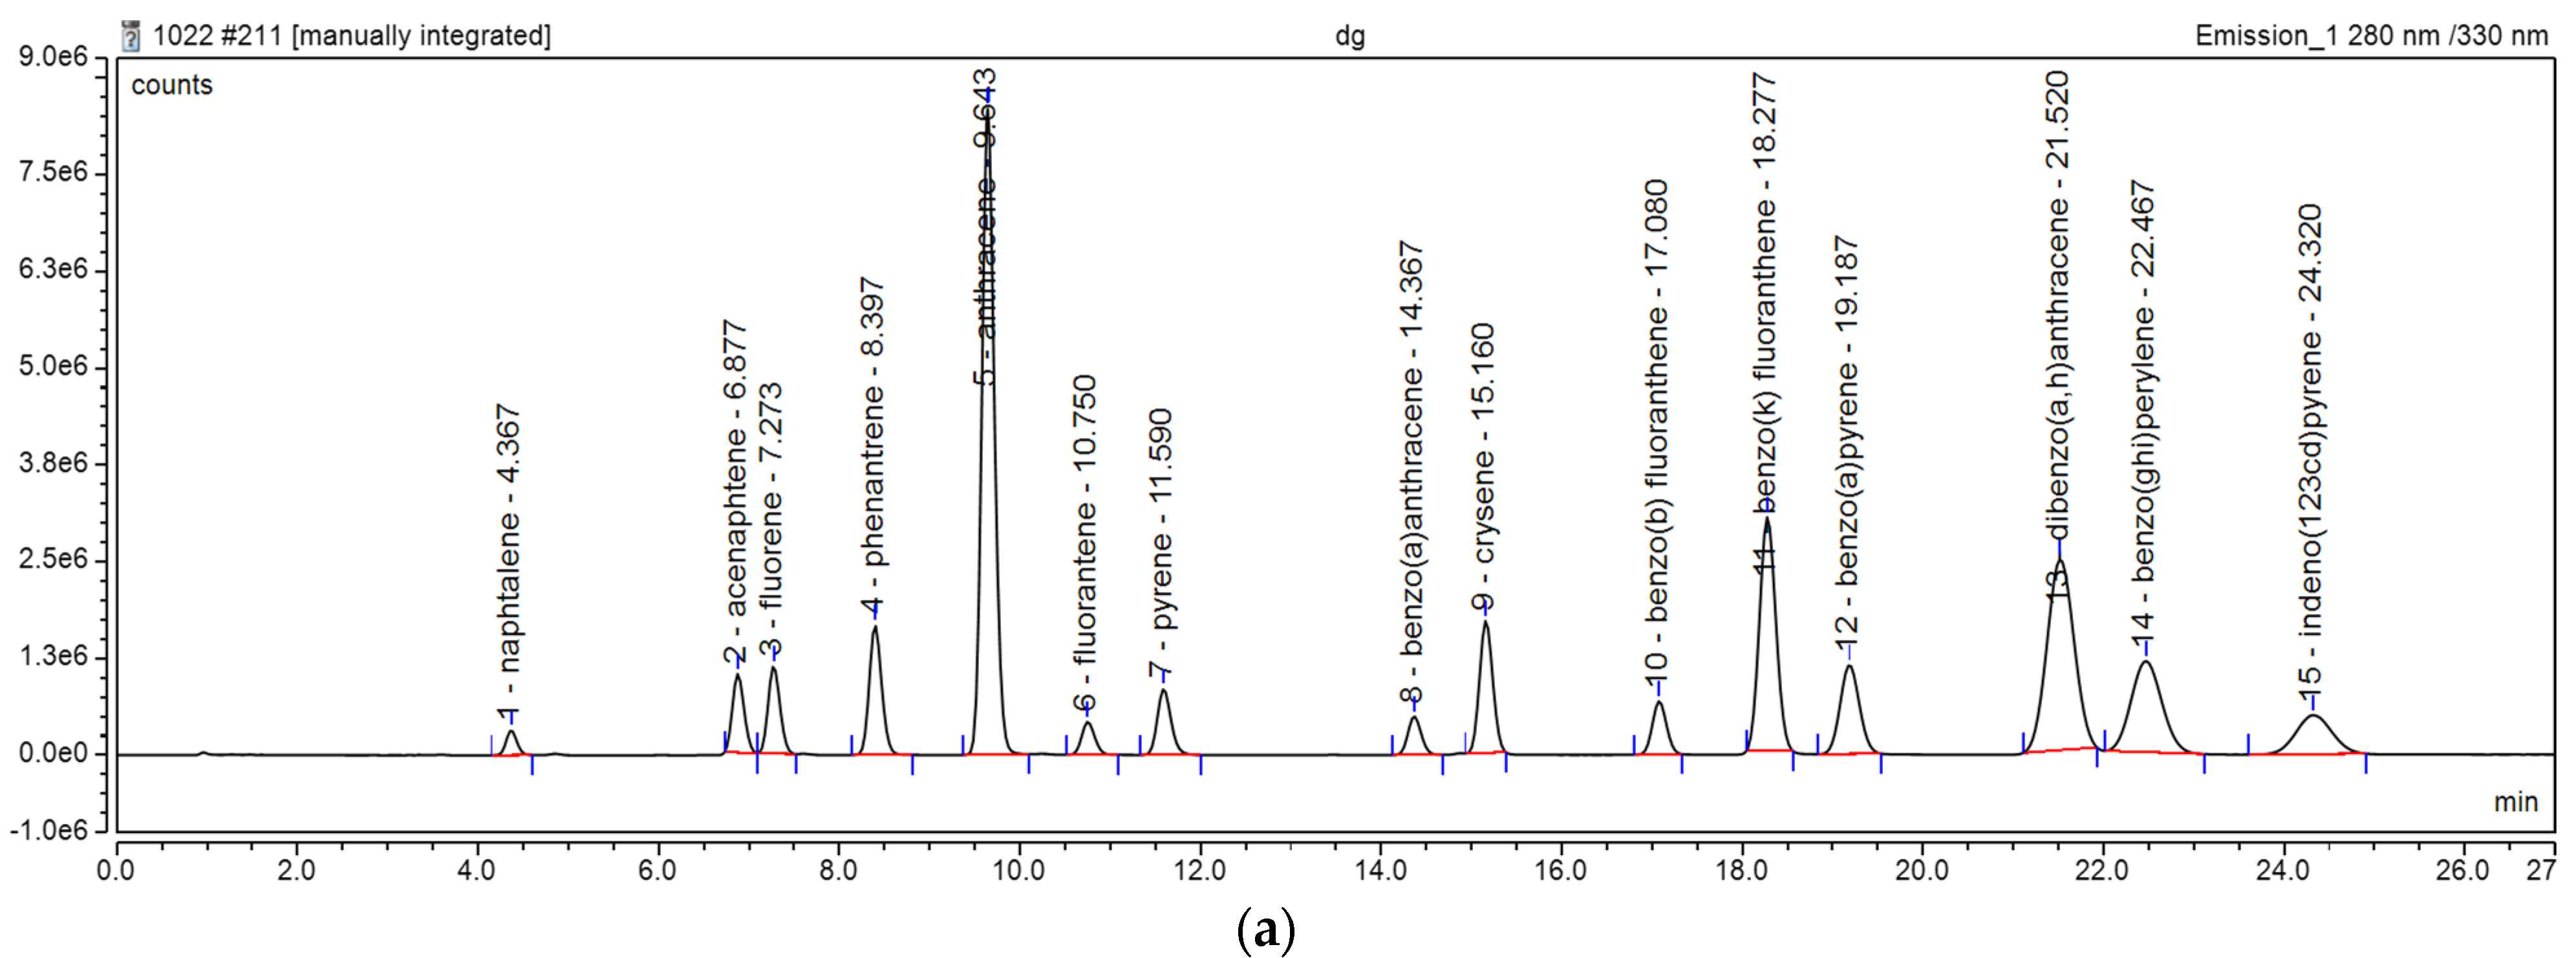
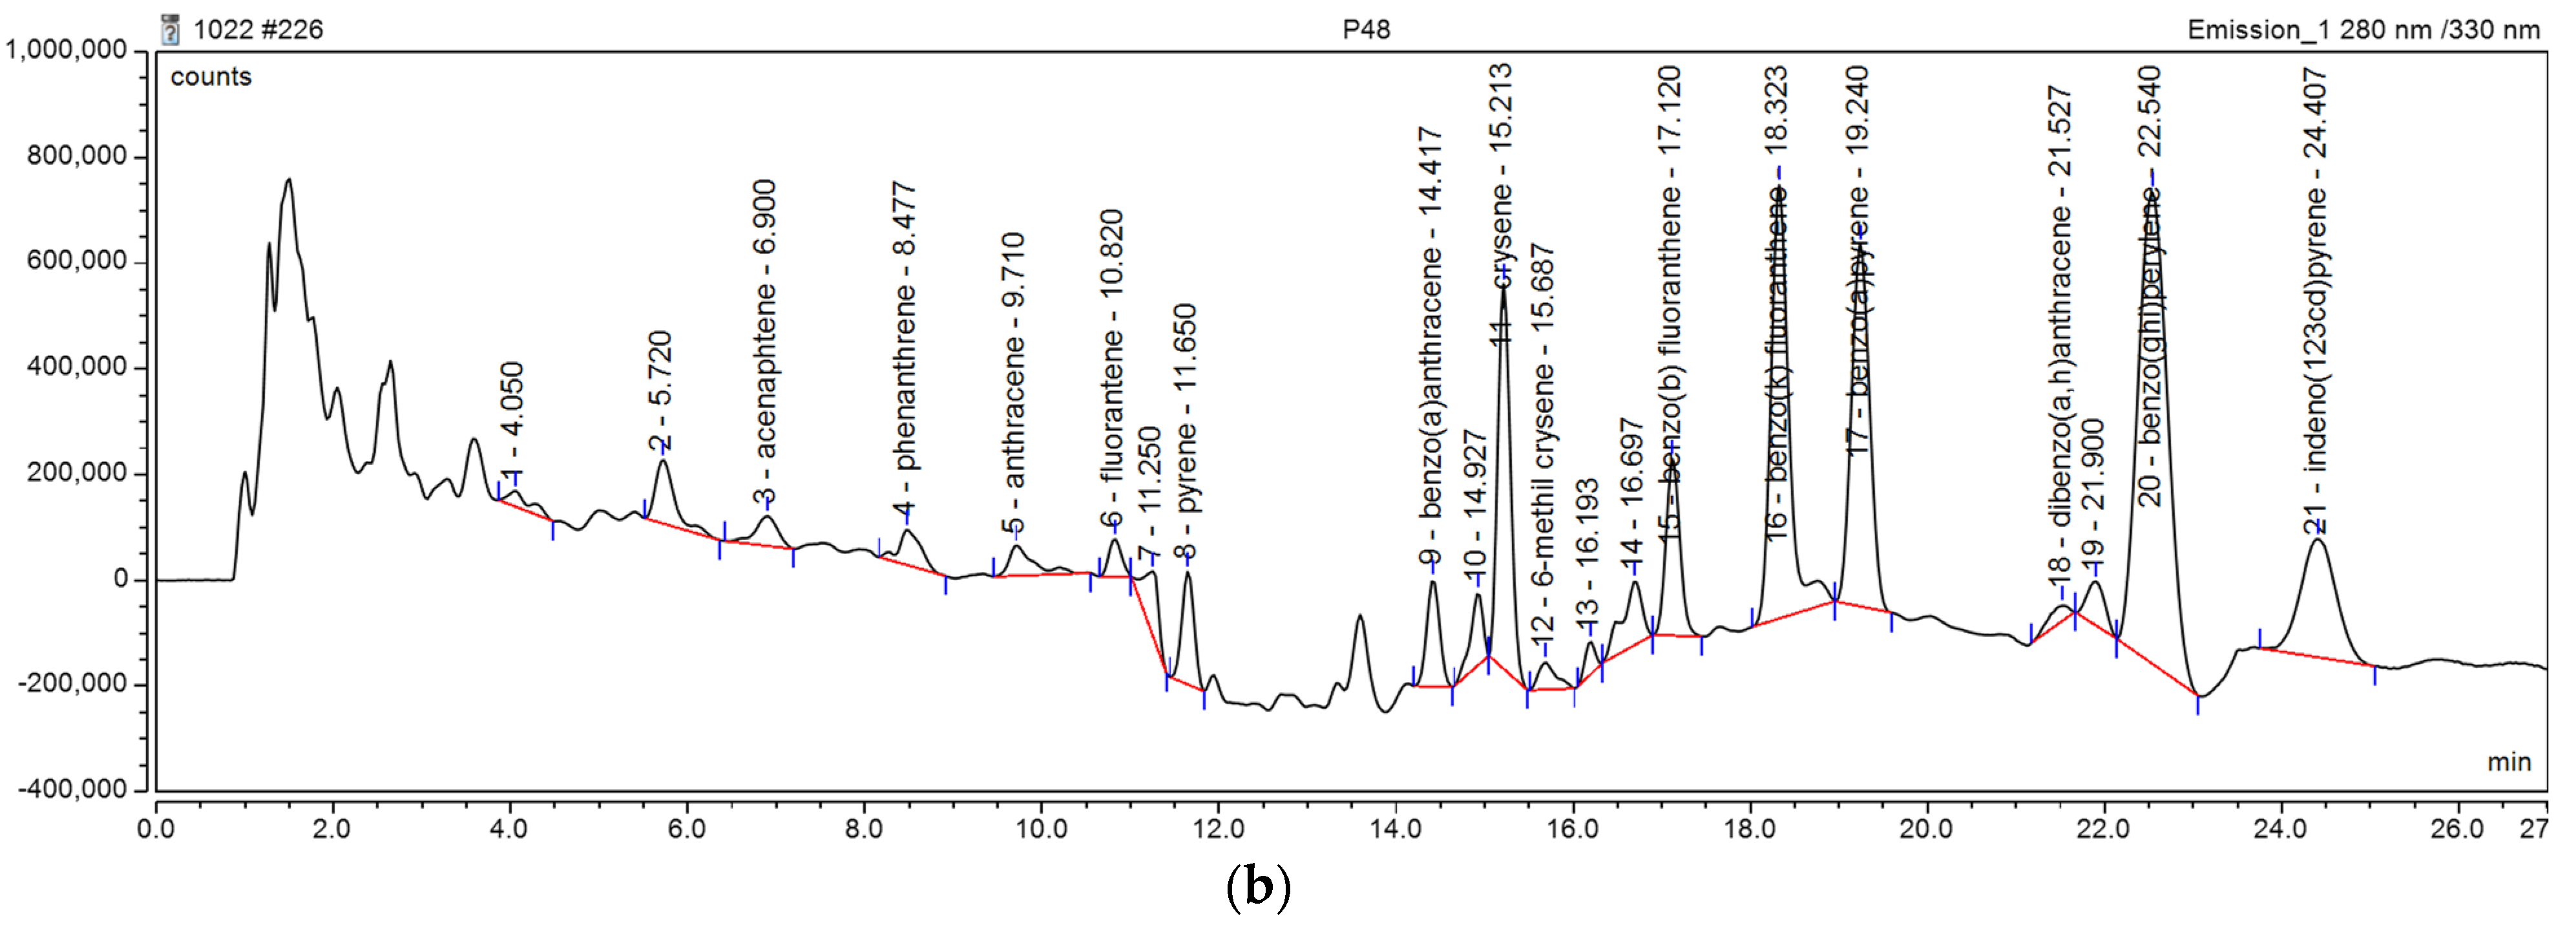
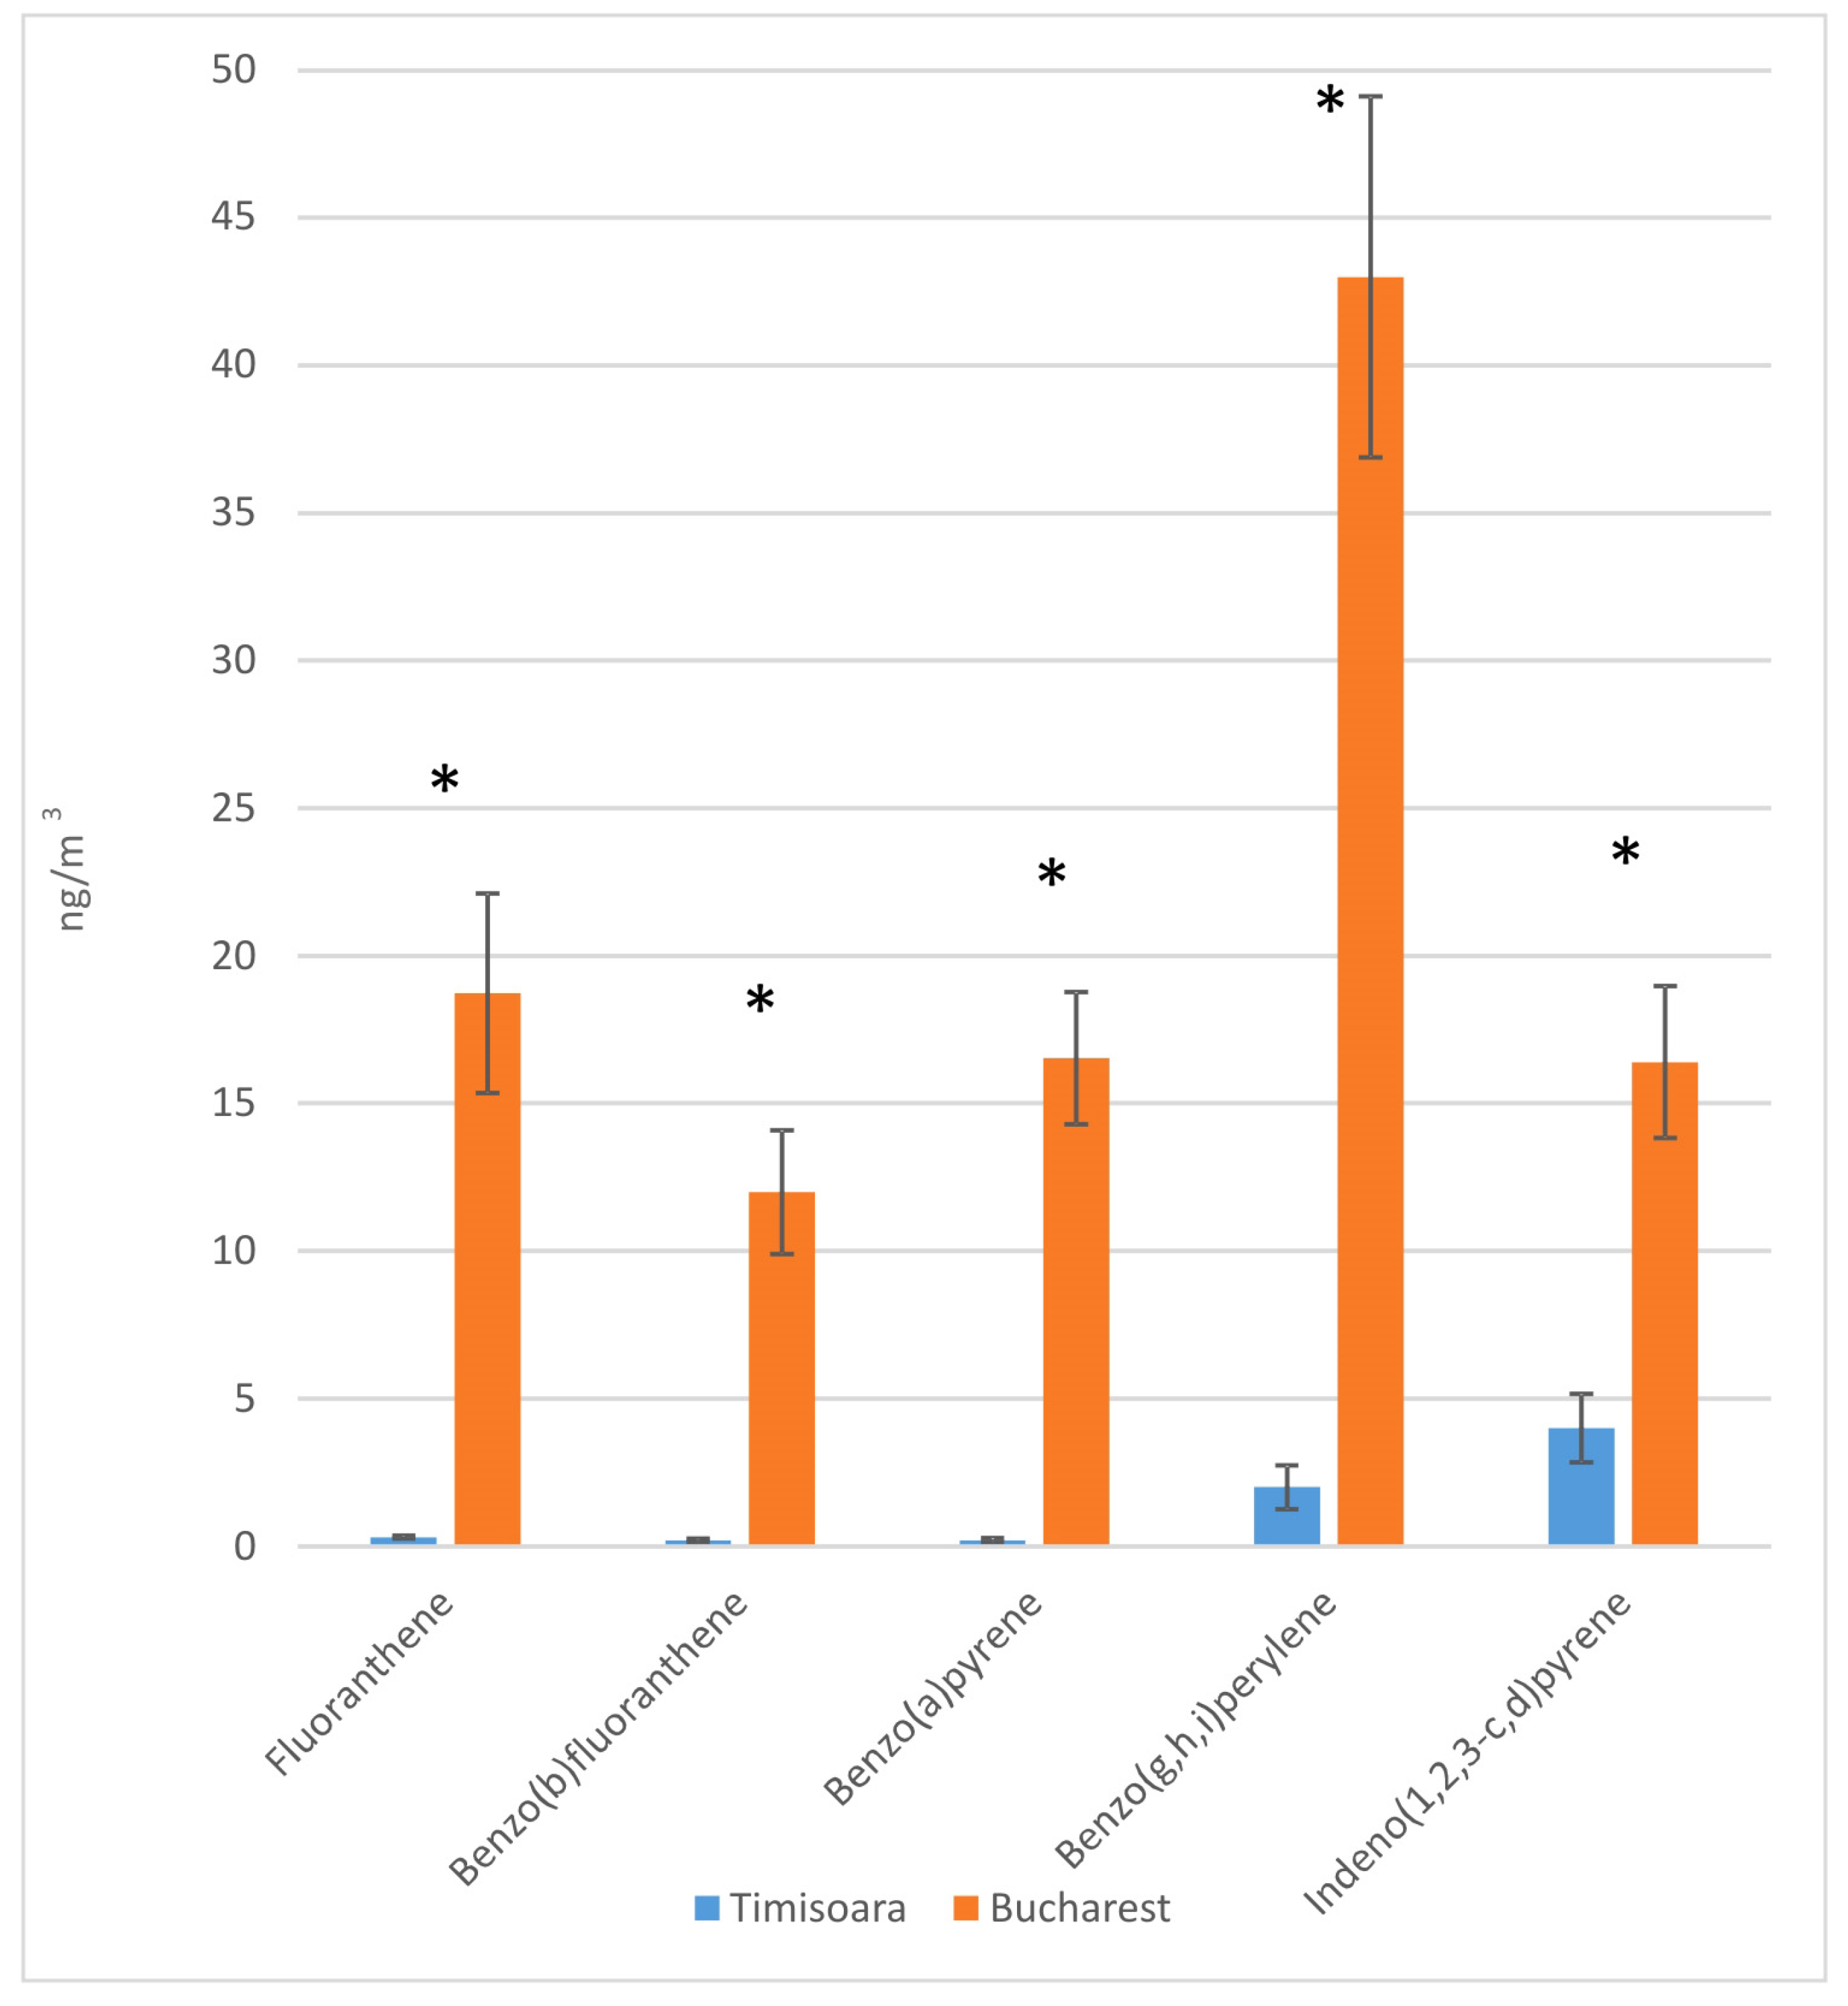
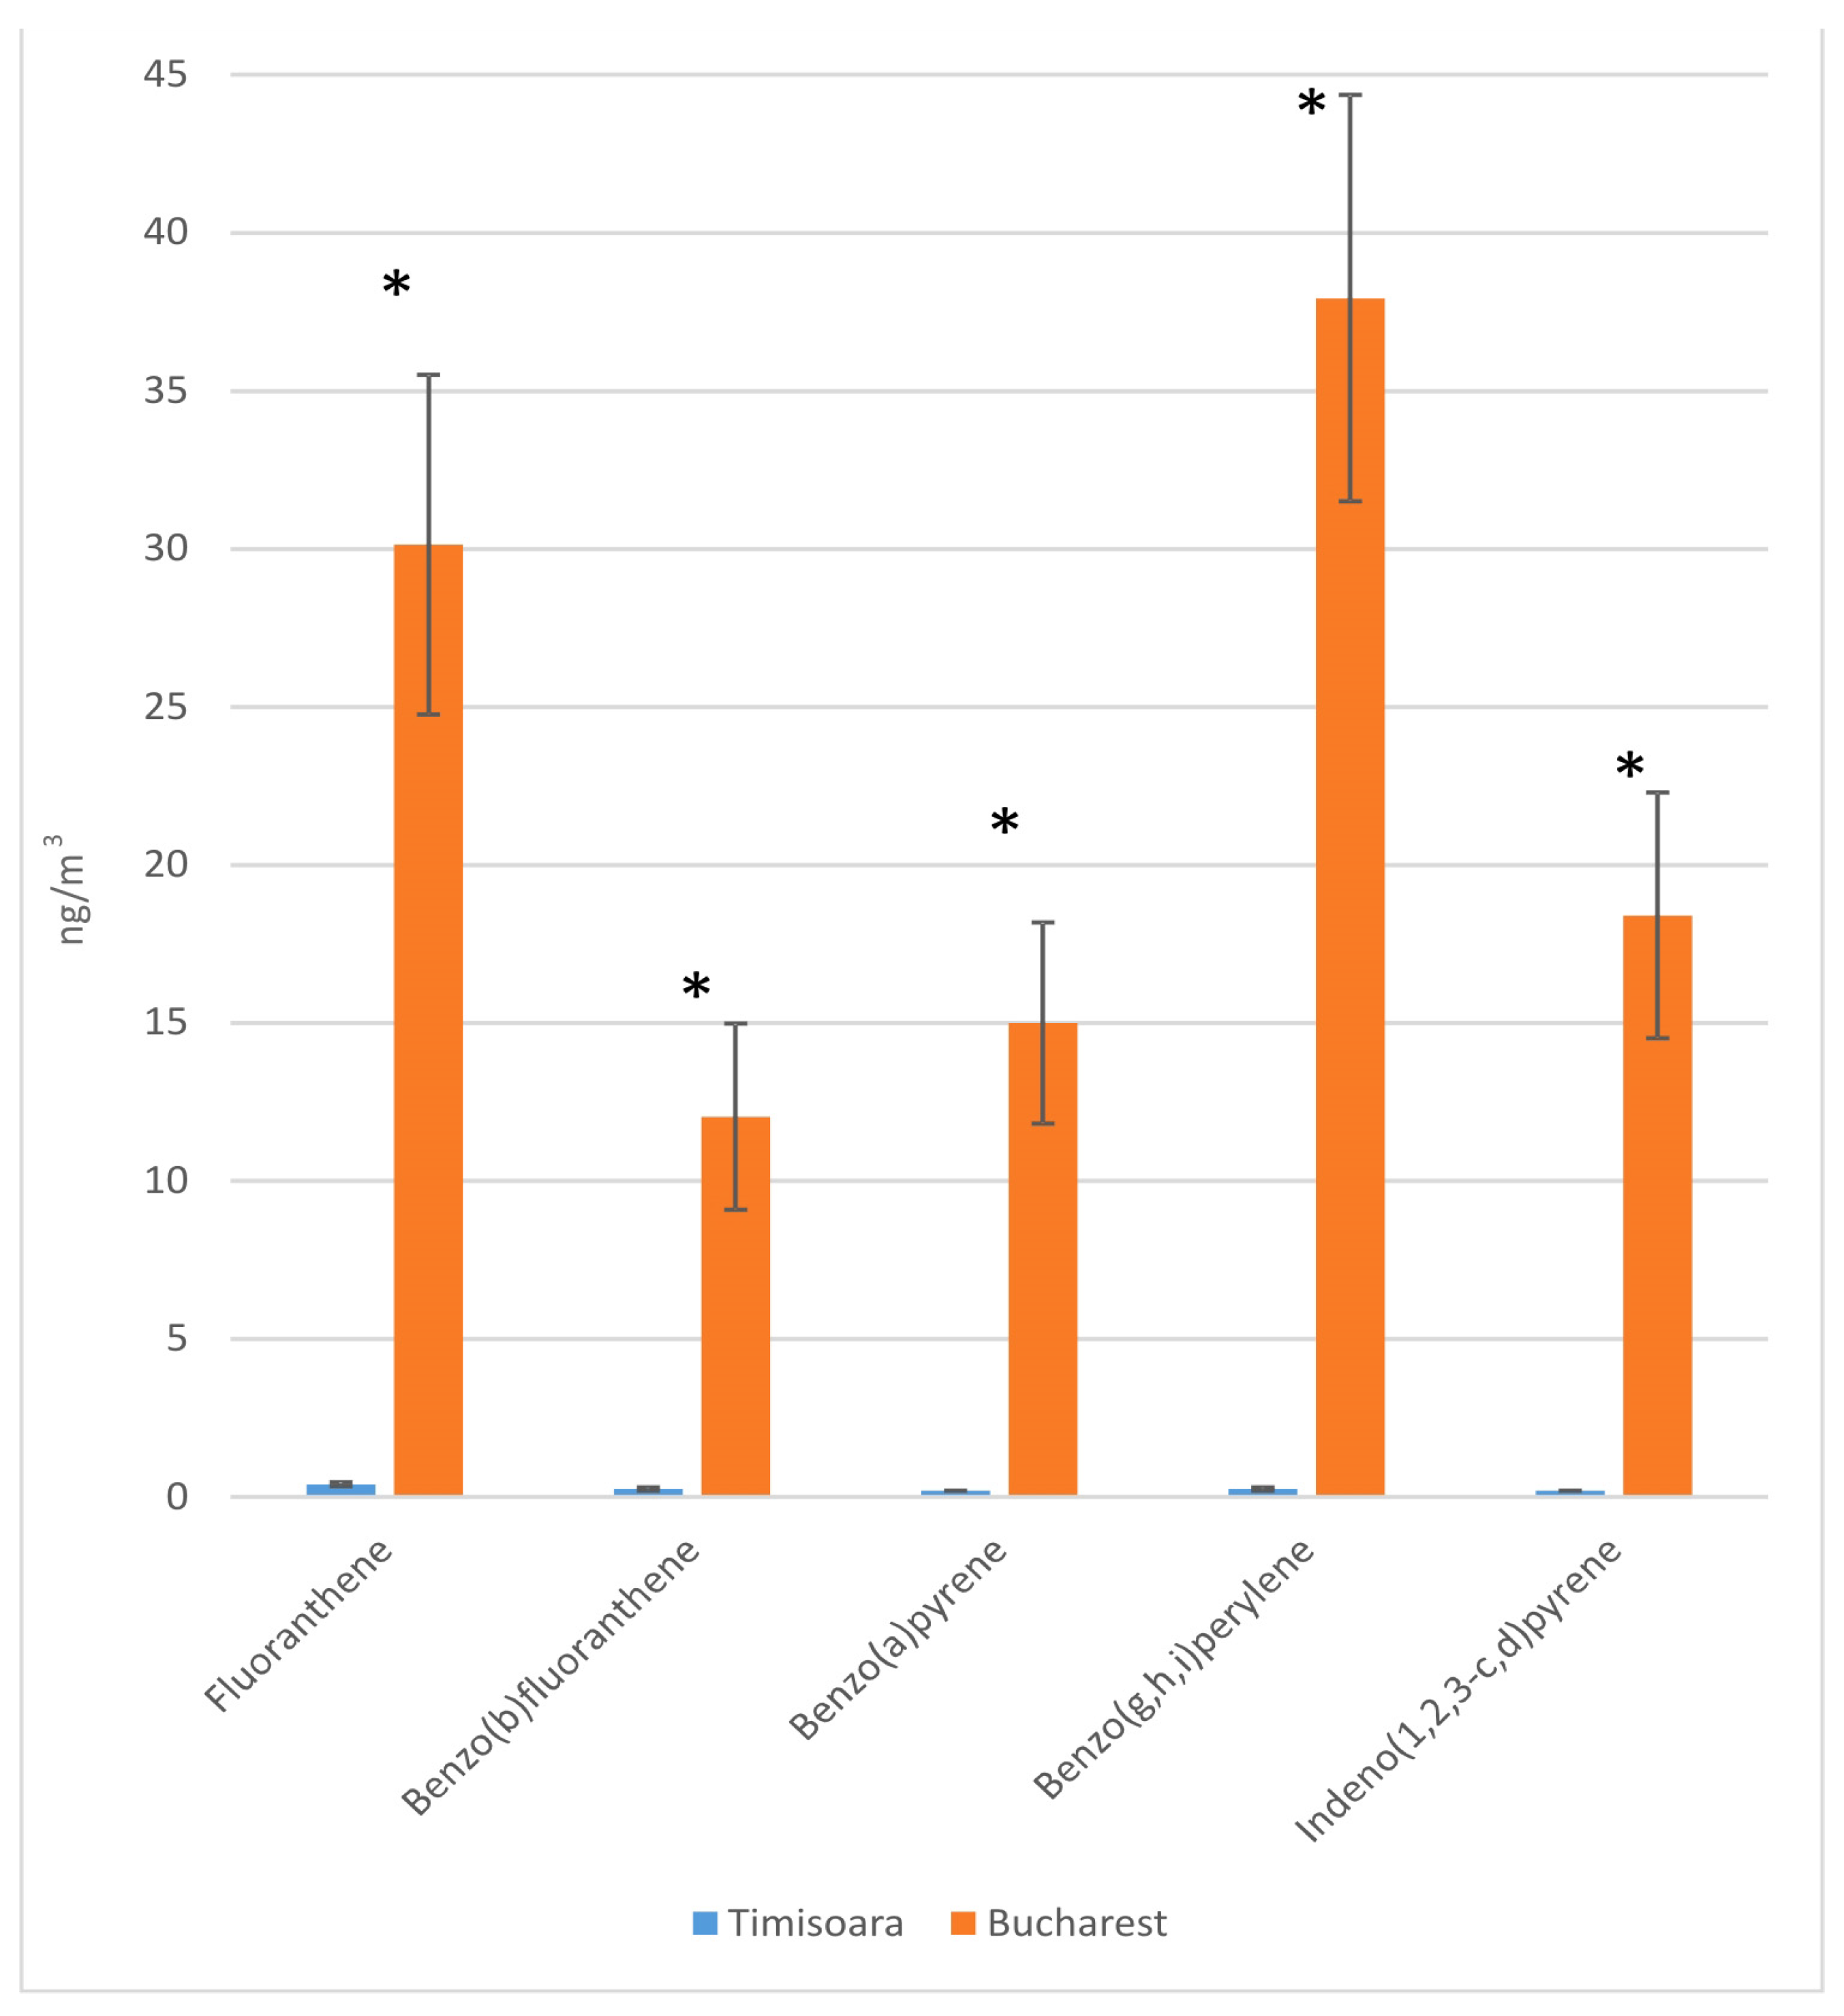
3.3. PAHs Results
4. Discussion
5. Conclusions
Author Contributions
Funding
Institutional Review Board Statement
Informed Consent Statement
Data Availability Statement
Acknowledgments
Conflicts of Interest
References
- Abed Al Ahad, M.; Demsar, U.; Sullivan, F.; Kulu, H. Long-term exposure to air pollution and mortality in Scotland: A register-based individual-level longitudinal study. Environ. Res. 2023, 238, 1–10. [Google Scholar] [CrossRef] [PubMed]
- Orellano, P.; Reynoso, J.; Quaranta, N. Short-term exposure to sulphur dioxide (SO2) and all-cause and respiratory mortality: A systematic review and meta-analysis. Environ. Int. 2021, 150, 106434. [Google Scholar] [CrossRef] [PubMed]
- Chen, R.; Yin, P.; Meng, X.; Liu, C.; Wang, L.; Xu, X.; Ross, J.A.; Tse, L.A.; Zhao, Z.; Kan, H.; et al. Fine particulate air pollution and daily mortality: A nationwide analysis in 272 Chinese cities. Am. J. Respir. Crit. Care Med. 2017, 196, 73–81. [Google Scholar] [CrossRef] [PubMed]
- Requia, W.J.; Vicedo-Cabrera, A.M.; Amini, H.; Schwartz, J.D. Short-term air pollution exposure and mortality in Brazil: Investigating the susceptible population groups. Environ. Pollut. 2024, 340, 122797. [Google Scholar] [CrossRef] [PubMed]
- Yu, P.; Xu, R.; Li, S.; Coelho, M.S.Z.S.; Saldiva, P.H.N.; Sim, M.R.; Abramson, M.J.; Guo, Y. Associations between long-term exposure to PM2.5 and site-specific cancer mortality: A nationwide study in Brazil between 2010 and 2018. Environ. Pollut. 2022, 302, 119070. [Google Scholar] [CrossRef] [PubMed]
- WHO Global Air Quality Guidelines—Particulate Matter (PM2.5 and PM10), Ozone, Nitrogen Dioxide, Sulfur Dioxide and Carbon Monoxide; World Health Organization: Geneva, Switzerland, 2021. Available online: https://iris.who.int/bitstream/handle/10665/345329/9789240034228-eng.pdf (accessed on 25 October 2023).
- Ministry of Foreign Affair of the Republic of Korea. Air Pollution: An Introduction to Its Causes, Effects and Solutions; Ministry of Foreign Affair of the Republic of Korea: Seul, Republic of Korea, 2021; p. 18. Available online: https://www.neaspec.org/sites/default/files/Air_Pollution_Handbook.pdf (accessed on 25 October 2023).
- Wang, X.; Ran, S.; Xia, H.; Shi, H.; Wu, G.; Zhang, Z.; Wang, C.; Cai, M.; Zhang, J.; Lin, H. Ambient air pollution associated with incident asthma, subsequent cardiovascular disease and death: A trajectory analysis of a national cohort. J. Hazard. Mater. 2023, 460, 132372. [Google Scholar] [CrossRef] [PubMed]
- Feng, J.; Cai, M.; Qian, Z.M.; Zhang, S.; Yang, Y.; McMillin, S.E.; Chen, G.; Hua, J.; Tabet, M.; Wang, C.; et al. The effects of long-term exposure to air pollution on incident mental disorders among patients with prediabetes and diabetes: Findings from a large prospective cohort. Sci. Total Environ. 2023, 897, 165235. [Google Scholar] [CrossRef] [PubMed]
- Li, D.; Ma, Y.; Cui, F.; Yang, Y.; Liu, R.; Tang, L.; Wang, J.; Tian, Y. Long-term exposure to ambient air pollution, genetic susceptibility, and the incidence of bipolar disorder: A prospective cohort study. Psychiatry Res. 2023, 327, 115396. [Google Scholar] [CrossRef]
- Qiu, X.; Yazdi, M.D.; Wei, Y.; Di, Q.; Just, A.; Zanobetti, A.; Weisskopf, M.; Dominici, F.; Schwartz, J. Associations of short-term exposure to air pollution and increased ambient temperature with psychiatric hospital admissions in older adults in the USA: A case–crossover study. Lancet Planet. Health 2022, 6, e331–e341. [Google Scholar] [CrossRef]
- Chu, Y.J.; Holladay, S.; Qiu, Y.; Tian, X.L.; Zhou, M. Air pollution and mortality impacts of coal mining: Evidence from coalmine accidents in China. J. Environ. Econ. Manag. 2023, 121, 102846. [Google Scholar] [CrossRef]
- Manisalidis, I.; Stavropoulou, E.; Stavropoulos, A.; Bezirtzoglou, E. Environmental and health impacts of air pollution: A review. Front. Public Health 2020, 8, 14. [Google Scholar] [CrossRef] [PubMed]
- Boström, C.E.; Gerde, P.; Hanberg, A.; Jernström, B.; Johansson, C.; Kyrklund, T. Cancer risk assessment, indicators and guidelines for polycyclic aromatic hydrocarbons in ambient air. Environ. Health Perspect. 2002, 110, 451–489. [Google Scholar] [PubMed]
- Abdel-Shafy, H.I.; Mansour, M.S. A review on polycyclic aromatic hydrocarbons: Source, environmental impact, effect on human health and remediation. Egypt. J. Pet. 2016, 25, 107–123. [Google Scholar] [CrossRef]
- Di-Toro, D.M.; McGrath, J.A.; Hansen, D.J. Technical basis for narcotic chemicals and polycyclic aromatic hydrocarbon criteria. I. Water and tissue. Environ. Toxicol. Chem. 2000, 19, 1951–1970. [Google Scholar] [CrossRef]
- Baklanov, A.; Hänninen, O.; Slørdal, L.H.; Kukkonen, J.; Bjergene, N.B. Fay Integrated systems for forecasting urban meteorology, air pollution and population exposure. Atmos. Chem. Phys. 2007, 7, 855–874. [Google Scholar] [CrossRef]
- Ma, W.L.; Qi, H.; Baidron, S.; Liu, L.Y.; Yang, M.; Li, Y.F. Implications for long-range atmospheric transport of polycyclic aromatic hydrocarbons in Lhasa, China. Environ. Sci. Pollut. Res. 2013, 20, 5525–5533. [Google Scholar] [CrossRef]
- Mojiri, A.; Zhou, J.L.; Ohashi, A.; Ozaki, N.; Kindaichi, T. Comprehensive review of polycyclic aromatic hydrocarbons in water sources, their effects and treatments. Sci. Total Environ. 2019, 696, 133971. [Google Scholar] [CrossRef]
- Patel, A.B.; Shaikh, S.; Jain, K.R.; Desai, C.; Madamwar, D. Polycyclic aromatic hydrocarbons: Sources, toxicity, and remediation approaches. Front. Microbiol. 2020, 11, 562813. [Google Scholar] [CrossRef]
- Shimada, K.; Nohchi, M.; Maeshima, K.; Uchino, T.; Kobayashi, Y.; Ono, K.; Ogata, H.; Katsumi, N.; Inazu, K.; Okochi, H. Effects of changes in polycyclic aromatic hydrocarbons (PAHs) emissions and degradation on their concentrations in Tokyo from 2007 and 2016. Sci. Rep. 2022, 12, 4249. [Google Scholar] [CrossRef]
- Wang, Z.; Ren, P.; Sun, Y.; Ma, X.; Liu, X.; Na, G.; Yao, Z. Gas/particle partitioning of polycyclic aromatic hydrocarbons in coastal atmosphere of the north Yellow Sea, China. Environ. Sci. Pollut. Res. 2013, 20, 5753–5763. [Google Scholar] [CrossRef]
- Ravindra, K.; Sokhi, R.; Van Grieken, R. Atmospheric polycyclic aromatic hydrocarbons: Source attribution, emission factors and regulation. Atmos. Environ. 2008, 42, 2895–2921. [Google Scholar] [CrossRef]
- Gupte, A.; Tripathi, A.; Patel, H.; Rudakiya, D.; Gupte, S. Bioremediation of polycyclic aromatic hydrocarbon (PAHs): A perspective. Open Biotechnol. J. 2016, 10, 363–378. [Google Scholar] [CrossRef]
- Lammel, G. Polycyclic Aromatic Compounds in the Atmosphere–A Review Identifying Research Needs. Polycycl. Aromat. Compd. 2015, 35, 316–329. [Google Scholar] [CrossRef]
- Gong, X.; Huang, Y.; Duong, J.; Leng, S.; Zhan, F.B.; Guo, Y.; Lin, Y.; Luo, L. Industrial air pollution and low birth weight in New Mexico, USA. J. Environ. Manag. 2023, 348, 119236. [Google Scholar] [CrossRef] [PubMed]
- Pacín, C.; Martínez-Abaigar, J.; Núñez-Olivera, E.; Aboal, J.R.; De Nicola, F.; Fernández, J. Polycyclic aromatic hydrocarbons (PAHs) levels in PM10 and bulk deposition using Mosspheres: A pilot study in an urban environment. Environ. Res. 2023, 223, 115406. [Google Scholar] [CrossRef] [PubMed]
- World Health Organization (WHO). Air Quality Guidelines for Europe; WHO Regional Publications; WHO: Geneva, Switzerland, 2000.
- Shaltout, A.A.; Hassan, S.K.; Alomairy, S.E.; Manousakas, M.; Karydas, A.G.; Eleftheriadis, K. Correlation between inorganic pollutants in the suspended particulate matter (SPM) and fine particulate matter (PM2.5) collected from industrial and residential areas in Greater Cairo, Egypt. Air Qual. Atmos. Health 2019, 12, 241–250. [Google Scholar] [CrossRef]
- Hien, T.T.; Chi, N.D.T.; Huy, D.H.; Anh, H.; Oram, D.E.; Forster, G.L.; Mills, G.P.; Baker, A.R. Soluble trace metals associated with atmospheric fine particulate matter in the two most populous cities in Vietnam. Atmos. Environ. X 2022, 15, 100178. [Google Scholar] [CrossRef]
- Jiang, S.Y.N.; Yang, F.; Chan, K.L.; Ning, Z. Water solubility of metals in coarse PM and PM2.5 in typical urban environment in Hong Kong. Atmos. Pollut. Res. 2014, 5, 236–244. [Google Scholar] [CrossRef]
- Galon-Negru, A.G.; Olariu, R.I.; Arsene, C. Size-resolved measurements of PM2.5 water-soluble elements in Iasi, north-eastern Romania: Seasonality, source apportionment and potential implications for human health. Sci. Total Environ. 2019, 695, 133839. [Google Scholar] [CrossRef]
- Danciulescu, V.; Cozea, A.; Bucur, E.; Tanase, G.; Bratu, M. Concentration versus number of particles in the assessment of air pollution with particulate matter. Rom. J. Ecol. Environ. Chem. 2022, 4, 68–74. [Google Scholar] [CrossRef]
- Lyu, X.P.; Wang, Z.W.; Cheng, H.R.; Zhang, F.; Zhang, G.; Wang, X.M.; Ling, Z.H.; Wang, N. Chemical characteristics of submicron particulates (PM1.0) in Wuhan, Central China. Atmos. Res. 2015, 161–162, 169–178. [Google Scholar] [CrossRef]
- US EPA. Quality Assurance Handbook for Air Pollution Measurement Systems Ambient Air Specific Methods; EPA/600/R-94/038a; US Environmental Protection Agency: Washington, DC, USA; US Government Printing Office: Washington, DC, USA, 1994; Volume 2, p. 11. Available online: https://nepis.epa.gov (accessed on 7 February 2022).
- Directive 2008/50/CE; Transpose in Romanian Legislation by Law no.104/2011 Regarding Air Quality. Official Monitor: Bucharest, Romania, 2011. (In Romanian)
- STAS 12574–87; Air in Protected Areas. Quality Conditions. ASRO: Bucharest, Romania, 1987. (In Romanian)
- CEN-EN 15549; Air Quality-Standard Method for the Measurement of the Concentration of Benzo[a]Pyrene in Ambient Air. CEN: Brussels, Belgium, 2008.
- Tanase, I.G.; Radu, G.L.; Pana, A.; Buleandra, M. Validation of the Analytical Methods. Theoretical Principles and Case Studies; Printech Publishing House: Bucharest, Romania, 2007; pp. 170–175. (In Romanian) [Google Scholar]
- Siudek, P.; Frankowski, M. The role of sources and atmospheric conditions in the seasonal variability of particulate phase PAHs at the urban site in Central Poland. Aerosol Air Qual. Res. 2018, 18, 1405–1418. [Google Scholar] [CrossRef]
- Albinet, A.; Leoz-Garziandia, E.; Budzinski, H.; ViIlenave, E. Polycyclic aromatic hydrocarbons (PAHs), nitrated PAHs and oxygenated PAHs in ambient air of the Marseilles area (south of France): Concentrations and sources. Sci. Total Environ. 2007, 384, 280–292. [Google Scholar] [CrossRef] [PubMed]
- Lin, Y.; Ma, Y.; Qiu, X.; Li, R.; Fang, Y.; Wang, J.; Zhu, Y.; Hu, D. Sources, transformation, and health implications of PAHs and their nitrated, hydroxylated, and oxygenated derivatives in PM2.5 in Beijing. J. Geophys. Res. 2015, 120, 7219–7228. [Google Scholar] [CrossRef]
- Fang, G.-C.; Wu, Y.-S.; Chen, J.-C.; Fu, P.P.-C.; Chang, C.-N.; Ho, T.-T.; Chen, M.-H. Characteristic study of polycyclic aromatic hydrocarbons for fine and coarse particulates at Pastureland near Industrial Park sampling site of central Taiwan. Chemosphere 2005, 60, 427–433. [Google Scholar] [CrossRef]
- Hjortenkrans, D.S.T.; Bergbäck, B.G.; Häggerud, A.V. Metal emissions from brake linings and tires: Case studies of Stockholm, Sweden 1995/1998 and 2005. Environ. Sci. Technol. 2007, 41, 5224–5230. [Google Scholar] [CrossRef]
- Fang, T.; Guo, H.; Verma, V.; Peltier, R.E.; Weber, R.J. PM2.5 water–soluble elements in the southeastern United States: Automated analytical method development, spatiotemporal distributions, source apportionment, and implications for heath studies. Atmos. Chem. Phys. 2015, 15, 11667–11682. [Google Scholar] [CrossRef]
- Jaba, E.; Grama, A. Statistical Analysis with SPSS under Windows; Polirom Publishing House: Iasi, Romania, 2004; pp. 34–39. (In Romanian) [Google Scholar]


| PAH Compound | Time, Minute | Wavelengths, nm | |
|---|---|---|---|
| Excitation | Emission | ||
| Naphtalene | 0 | 280 | 335 |
| Phenanthrene | 8.0 | 245 | 350 |
| Anthracene | 9.2 | 260 | 420 |
| Fluoranthene | 10.5 | 280 | 440 |
| Pyrene | 11.20 | 235 | 390 |
| Chrysene Benzo(a)anthracene | 13.0 | 260 | 380 |
| Benzo(b)fluoranthene Benzo(k)fluoranthene Benzo(a)pyrene | 16.50 | 290 | 430 |
| Benzo(g,h,i)perylene | 20.8 | 290 | 410 |
| Indeno(1,2,3-c,d)pyrene | 23.50 | 300 | 505 |
| PAH | Certified Value ± Uncertainty *, mg/kg | Obtained Value ± Uncertainty *, mg/kg | Recovery, % |
|---|---|---|---|
| Benzo(a)anthracene | 0.91 ± 0.07 | 0.82 ± 0.17 | 89.63 |
| Benzo(a)pyrene | 0.72 ± 0.05 | 0.58 ± 0.12 | 80.17 |
| Benzo(b)fluoranthene | 1.42 ± 0.14 | 1.26 ± 0.26 | 88.76 |
| Benzo(k)fluoranthene | 0.67 ± 0.06 | 0.59 ± 0.11 | 88.12 |
| Indeno(1,2,3-c,d)pyrene | 1.07 ± 0.10 | 0.83 ± 0.17 | 77.36 |
| Anthracene ** | 0.28 | 0.25 ± 0.05 | 88.96 |
| Benzo(g,h,i)pyrene ** | 1.76 | 1.39 ± 0.25 | 78.96 |
| Chrysene ** | 1.61 | 1.41 ± 0.28 | 87.63 |
| Fluoranthene ** | 4.57 | 4.26 ± 0.82 | 93.21 |
| Phenanthene ** | 2.23 | 1.69 ± 0.33 | 75.97 |
| Pyrene ** | 4.59 | 4.32 ± 0.94 | 94.15 |
| Element | ERM-CZ120 (Fine Dust, PM10-Like) | BCR-176R (Fly Ash) | ||||
|---|---|---|---|---|---|---|
| Certified Value ± Uncertainty *, mg/kg | Obtained Value ± Uncertainty *, mg/kg | Recovery, % | Certified Value ± Uncertainty *, mg/kg | Obtained Value ± Uncertainty *, mg/kg | Recovery, % | |
| As | 7.10 ± 0.70 | 6.87 ± 0.72 | 96.76 | 54 ± 5.0 | 52 ± 5.5 | 96.30 |
| Cd | 0.90 ± 0.22 | 0.99 ± 0.11 | 110.0 | 226 ± 19 | 221 ± 24 | 97.79 |
| Co | 14.3 ** | 15.4 ± 1.5 | 107.7 | 26.7 ± 1.6 | 27.3 ± 2.7 | 102.2 |
| Cr | 201 ** | 213 ± 28 | 106.0 | 810 ± 70 | 835 ± 111 | 103.1 |
| Cu | 462 ** | 476 ± 56 | 103.0 | 1050 ± 70 | 1093 ± 128 | 104.1 |
| Ni | 58 ± 7.0 | 54 ± 6.3 | 93.10 | 117 ± 6 | 121 ± 14 | 103.4 |
| Pb | 113 ± 17 | 109 ± 10.6 | 96.46 | 5000 ± 500 | 5280 ± 512 | 105.6 |
| Zn | 1240 ** | 1284 ± 74 | 103.5 | 16,800 ± 400 | 17,153 ± 995 | 102.1 |
| Mn | 611 ** | 597 ± 53 | 97.71 | 730 ± 50 *** | 698 ± 61 | 95.62 |
| Mo | 33.2 ** | 35.1 ± 4.1 | 105.7 | - | - | - |
| Ti | 4372 ** | 4181 ± 460 | 95.63 | - | - | - |
| PAH | Expanded Uncertainty *, % | Elements | Expanded Uncertainty *, % |
|---|---|---|---|
| Benzo(a)anthracene | 20.8 | As | 10.5 |
| Benzo(a)pyrene | 21.3 | Cd | 10.9 |
| Benzo(b)fluoranthene | 20.9 | Co | 9.70 |
| Benzo(k)fluoranthene | 19.3 | Cr | 13.3 |
| Benzo(g,h,i)pyrene | 18.0 | Cu | 11.7 |
| Indeno(1,2,3-c,d)pyrene | 20.1 | Mn | 11.6 |
| Anthracene | 19.4 | Mo | 11.6 |
| Naphthalene | 20.7 | Ni | 11.6 |
| Chrysene | 19.9 | Pb | 9.70 |
| Fluoranthene | 19.2 | Sr | 13.4 |
| Phenanthene | 19.2 | Ti | 11.0 |
| Pyrene | 21.8 | Zn | 5.80 |
| PM | |||
| PM2.5, PM10 | 6.80 | TSP | 7.30 |
| Pollutant | Period of Time | Measurement Units | Concentration Limits | |
|---|---|---|---|---|
| Law 104/2011 [36] | STAS 12574-87 Standard [37] | |||
| PM10 | 24 h | µg/m3 | 50 | N/A |
| PM2.5 | 24 h | µg/m3 | 20 | N/A |
| TSP | 24 h | µg/m3 | N/A | 150 |
| Metals from PM2.5 | Timisoara | Bucharest |
|---|---|---|
| Zn | 21.25 ± 6.15 µg/m3 | 8.30 ± 2.32 µg/m3 |
| Sr | 11.78 ± 3.26 µg/m3 | 1.28 ± 0.40 µg/m3 |
| Metals from PM10 | Timisoara | Bucharest |
|---|---|---|
| Zn | 31.34 ± 8.22 µg/m3 | 6.87 ± 1.77 µg/m3 |
| Sr | 24.95 ± 5.21 µg/m3 | 0.49 ± 0.13 µg/m3 |
| Pollutant * | Measurement Units | Concentration Limits | |
|---|---|---|---|
| Law 104/2011 [36] | STAS 12574-87 Standard [37] | ||
| Lead | µg/m3 | 0.5 | N/A |
| Arsenic | ng/m3 | 6.0 | N/A |
| Cadmium | ng/m3 | 5.0 | N/A |
| Nickel | ng/m3 | 20 | N/A |
| q Range | Correlation | q Range | Correlation | q Range | Correlation |
|---|---|---|---|---|---|
| ±[0.0 ÷ 0.2] | very weak | ±[0.4 ÷ 0.6] | moderate | ±[0.8 ÷ 1.0] | very good |
| ±[0.2 ÷ 0.4] | weak | ±[0.6 ÷ 0.8] | good | ±1.0 | strong |
| PM2.5 | Metals- PM2.5 | PAH-PM2.5 | PM10 | Metals- PM10 | PAH-PM10 | TSP | Metals-TSP | PAH-TSP | |
|---|---|---|---|---|---|---|---|---|---|
| PM2.5 | 1.000 | −0.800 | −0.400 | 0.400 | −0.800 | −0.400 | 0.740 | 0.250 | −0.632 |
| Metals PM2.5 | −0.800 | 1.000 | 0.800 | −0.200 | 0.400 | 0.200 | −0.800 | 0.600 | 0.316 |
| PAH-PM2.5 | −0.400 | 0.800 | 1.000 | 0.400 | −0.200 | −0.400 | −0.400 | 0.800 | 0.316 |
| PM10 | 0.400 | −0.200 | 0.400 | 1.000 | −0.800 | −1.000 ** | 0.400 | 0.200 | 0.316 |
| Metals-PM10 | −0.800 | 0.400 | −0.200 | −0.800 | 1.000 | 0.800 | −0.800 | −0.400 | 0.316 |
| PAH-PM10 | −0.400 | 0.200 | −0.400 | −1.000 ** | 0.800 | 1.000 | −0.400 | −0.200 | −0.316 |
| TSP | 0.740 | −0.800 | −0.400 | 0.400 | −0.800 | −0.400 | 1.000 | 0.000 | −0.632 |
| Metals-TSP | 0.250 | 0.600 | 0.800 | 0.200 | −0.400 | −0.200 | 0.000 | 1.000 | −0.316 |
| PAH-TSP | −0.632 | 0.316 | 0.316 | 0.316 | 0.316 | −0.316 | −0.632 | −0.316 | 1.000 |
| PM2.5 | Metals- PM2.5 | PAH-PM2.5 | PM10 | Metals- PM10 | PAH-PM10 | TSP | Metals- TSP | PAH-TSP | |
|---|---|---|---|---|---|---|---|---|---|
| PM2.5 | 1.000 | −0.174 | −0.029 | 0.683 * | 0.600 | 0.029 | 0.486 | −0.257 | −0.657 |
| Metals- PM2.5 | −0.174 | 1.000 | 0.203 | −0.174 | 0.261 | −0.377 | −0.667 | 0.783 * | 0.725 |
| PAH-PM2.5 | −0.029 | 0.203 | 1.000 | −0.029 | 0.371 | 0.371 | −0.086 | 0.143 | −0.143 |
| PM10 | 0.683 * | −0.174 | −0.029 | 1.000 | 0.600 | 0.029 | 0.486 | −0.257 | −0.657 |
| Metals-PM10 | 0.600 | 0.261 | 0.371 | 0.600 | 1.000 | −0.371 | −0.257 | 0.371 | −0.143 |
| PAH-PM10 | 0.029 | −0.377 | 0.371 | 0.029 | −0.371 | 1.000 | 0.429 | −0.314 | −0.371 |
| TSP | 0.486 | −0.667 | −0.086 | 0.486 | −0.257 | 0.429 | 1.000 | −0.943 ** | −0.886 ** |
| Metals- TSP | −0.257 | 0.783 * | 0.143 | −0.257 | 0.371 | −0.314 | −0.943 ** | 1.000 | 0.829 * |
| PAH-TSP | −0.657 | 0.725 | −0.143 | −0.657 | −0.143 | −0.371 | −0.886 ** | 0.829 * | 1.000 |
Disclaimer/Publisher’s Note: The statements, opinions and data contained in all publications are solely those of the individual author(s) and contributor(s) and not of MDPI and/or the editor(s). MDPI and/or the editor(s) disclaim responsibility for any injury to people or property resulting from any ideas, methods, instructions or products referred to in the content. |
© 2024 by the authors. Licensee MDPI, Basel, Switzerland. This article is an open access article distributed under the terms and conditions of the Creative Commons Attribution (CC BY) license (https://creativecommons.org/licenses/by/4.0/).
Share and Cite
Pascu, L.-F.; Danciulescu, V.; Calinescu, S.M.; Iancu, V.I.; Nicolescu, I.; Banciu, A.R.; Nita-Lazar, M.; Vasile, G.-G. Assessment of Particulate Matters, Metals, and PAHs’ Air Pollution in Industrial vs. Animal Husbandry Areas. Atmosphere 2024, 15, 141. https://doi.org/10.3390/atmos15010141
Pascu L-F, Danciulescu V, Calinescu SM, Iancu VI, Nicolescu I, Banciu AR, Nita-Lazar M, Vasile G-G. Assessment of Particulate Matters, Metals, and PAHs’ Air Pollution in Industrial vs. Animal Husbandry Areas. Atmosphere. 2024; 15(1):141. https://doi.org/10.3390/atmos15010141
Chicago/Turabian StylePascu, Luoana-Florentina, Valeriu Danciulescu, Simona Mariana Calinescu, Vasile Ion Iancu, Ileana Nicolescu, Alina Roxana Banciu, Mihai Nita-Lazar, and Gabriela-Geanina Vasile. 2024. "Assessment of Particulate Matters, Metals, and PAHs’ Air Pollution in Industrial vs. Animal Husbandry Areas" Atmosphere 15, no. 1: 141. https://doi.org/10.3390/atmos15010141