
Flow Channel Optimization to Improve the Performance of a Liquid–Gas Ejector for an Intelligent Toilet Spray Bar


College of Metrology and Measurement Engineering, China Jiliang University, Hangzhou 310018, China
*
Author to whom correspondence should be addressed.
Atmosphere 2024, 15(1), 58; https://doi.org/10.3390/atmos15010058
Submission received: 8 November 2023
/
Revised: 23 December 2023
/
Accepted: 26 December 2023
/
Published: 31 December 2023
(This article belongs to the Special Issue CFD Modeling in Multiphase Flow Transport/Separation Equipment)
Abstract
:Intelligent toilets can effectively remove odors and harmful substances from exhaust gases and wastewater, maintaining a fresh and clean indoor atmosphere, which is beneficial to the indoor environment and human health. Currently, research on intelligent toilets conducted by sanitary ware manufacturers is still in its early stages. Many of the intelligent toilets available on the market exhibit issues such as an excessive oscillation amplitude of the cleaning spray bar, premature breakdown of the water column, and inadequate air intake. The present study involves the analysis and redesign of a cleaning spray bar model for intelligent toilets. Additionally, several optimization schemes concerning the flow channel of the cleaning spray bar are proposed in order to enhance the performance of the liquid–air ejector. The computational fluid dynamics (CFD) technique is utilized to analyze the water flow characteristics within the cleaning spray bar of the intelligent toilet and to compare and evaluate the proposed schemes. The calculation results indicate that, for the same inlet flow rate, the optimal structure the block with a length of L = 1.5 mm and the block positioned (4). The swirl numbers of these two optimized models are 14.8% and 8.3% of the protype, respectively, while their air intake is 133% and 131% of the protype, respectively. The optimized solutions exhibited significant performance improvements when compared to the prototype. The computational results offer valuable insights for optimizing the flow characteristics of the enhanced product.
1. Introduction
Intelligent toilets have the capability to efficiently eliminate odors and harmful substances from waste gases, thereby ensuring the freshness and cleanliness of the indoor atmosphere. This purification system plays a significant role in reducing the transmission of bacteria, viruses, and harmful gases, leading to an enhancement in indoor atmosphere quality and promoting human health [1]. With the rapid development of technology, intelligent bathroom products have come into being. Unlike traditional bathroom products, intelligent bathroom products incorporate a variety of new technologies in several areas to enhance the bathroom product experience. The intelligent toilet, which is considered one of the most significant advancements in sanitary products [2], has gained increasing popularity in society due to its effectiveness in improving the hygiene environment of toilets [3]. Intelligent toilets feature automatic commode flushing, water washing, and warm air-drying technology, of which water washing technology is the most important part of an intelligent toilet. The cleaning spray bar is the top priority in the water washing technology; therefore, the performance of the cleaning spray bar has a key impact on the intelligent toilet experience.
The cleaning spray bar is one of the core components of the intelligent toilet, and it is also a major water and energy consuming component. However, most sanitary ware manufacturers are still in the initial stages of research on intelligent toilets [4]. More intelligent toilets on the market have problems such as a large swing when spraying water from the cleaning spray bar, premature breakage of the spray water column, and carrying less air when spraying, which affects the working performance and user experience of intelligent toilets.
Several studies have been conducted by enterprises and scholars to enhance the operational performance and user experience of intelligent toilets through the development of advanced control systems [5,6,7]. Wang proposed the existence of an ill health detection state and protection application program for intelligent toilet systems [8]. Cao presented a targeted intelligent home care design in an intelligent toilet gasket design [9]. Xu discussed the features and benefits of healthy bathrooms, including intelligent toilets [10]. Zhu proposed that the emotional needs of people should be included in the design of intelligent toilets [11]. Wang and Liu et al. studied the operation interface of intelligent toilets [12,13]. Zhou et al. conducted a study on the styling and structural design of the integrated testing machine for intelligent toilet covers, which optimized the styling and structure of the existing products and improved their usability [14]. Han et al. used computational fluid dynamics (CFD) technology to calculate and analyze—combined with experimental testing to verify the reproduction of the complex—the microscopic flow state of the water flow inside an intelligent toilet cover, providing guidance for optimizing and improving the product [15]. Zhang et al. conducted a performance and optimization study of self-excited suction pulse nozzles for intelligent toilets and explored the possibility of using self-excited pulsed water jet technology for intelligent toilets [16].
A patent for a bidet including nozzle assembly was filed abroad by Jin et al. TOTO Co., Ltd., Tokyo, Japan. filed a patent application related to an intelligent toilet sanitary washing device. Touru et al., in collaboration with TOTO Co., Ltd., investigated the effects of intelligent toilet nozzle cleanliness on nozzles and the effects of neutral electrolyzed water on intelligent toilet nozzles and spray bars [17,18].
A significant body of scholarly research has been conducted on the structure and flow characteristics of the spray rod in intelligent toilets. This research encompasses a range of analytical methods, including experiments and CFD simulations. Prior studies on the internal water flow performance of intelligent toilets and the investigation of pulse nozzles have had a positive impact on enhancing and optimizing the overall performance of intelligent toilets [16,17,18]. However, there is a paucity of research specifically focusing on the spray of intelligent toilets, and limited attention has been given to understanding the influence of the cleaning spray’s performance on the functionality and user experience of intelligent toilets. Therefore, this study aims to investigate the effects of key factors such as swirl number, suction volume, and pressure loss on the performance of the cleaning spray in intelligent toilets. The intelligent toilet cleaning spray bar in the actual engineering flow is complex and difficult to measure. Physical modeling experiments have limitations and often only give fluid parameters, while numerical simulation can provide specific information about the relevant flow field and physical phenomena. Therefore, in this paper, the CFD technique is used to analyze and study an intelligent toilet cleaning spray bar.
This study focuses on the redesign of the cleaning spray bar in a domestic model of an intelligent toilet. One of its primary objectives is to maximize the air intake while minimizing the swirl number. By incorporating the existing liquid–gas ejector water intake and suction technology, the objective is to address issues such as excessive fluid swirling and inadequate air intake at the outlet of the cleaning spray bar [19,20,21]. The CFD technique was used to simulate and analyze the swirl number of outlet mixed fluid, the inlet volume, and the specific flow conditions in the flow channel for each model. The swirl elimination study and air intake study performed in this paper on the intelligent toilet cleaning spray bar can not only be used for the development and application of the new intelligent toilet, but also has the same reference value and application for the similar flow channel structure of the fire hose gun [22,23,24], ejector station intake runners, and other scenarios [25,26,27,28,29,30,31,32,33,34,35,36,37].
2. Methods of Calculation and Simulation Validation
2.1. Structure and Working Principle of the Cleaning Spray Bar
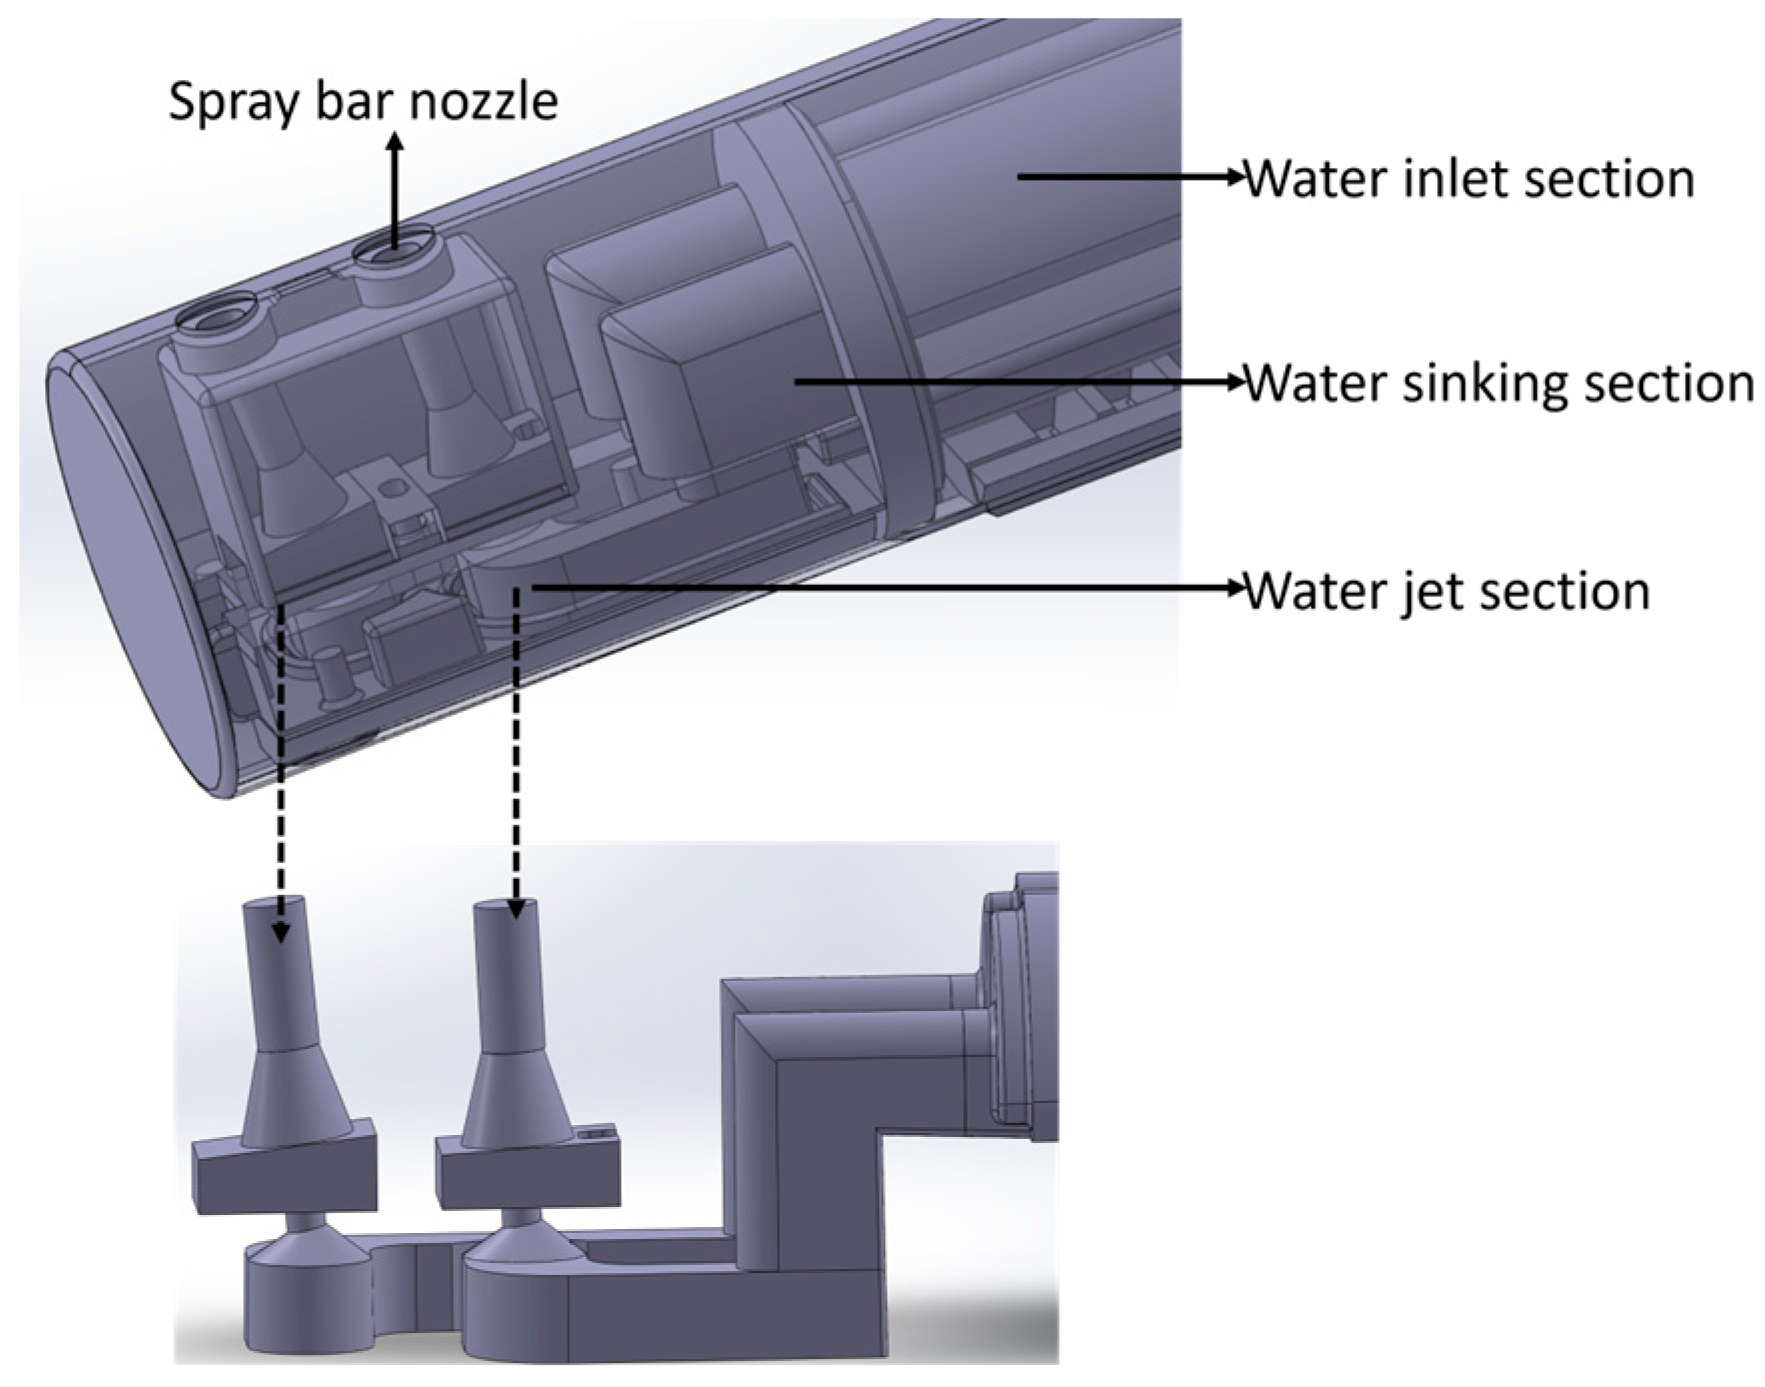
The overall structure and internal flow channel of the intelligent toilet cleaning spray bar are shown in Figure 1. Usually, the intelligent toilet cleaning spray bar has 1~3 spray holes with the same number of runners corresponding to them, and these runners do not interfere with each other. The cleaning spray bar studied in this paper is a common two-hole design. Each of the individual holes in the double orifice serves a different purpose. The left hole in the two holes in Figure 1 corresponds to the female cleansing runners, and the right hole corresponds to the buttock cleansing runners. The bubbling water stream is more delicate and gentler for female cleansing, and the buttock cleansing utilizes a warm water stream instead of traditional paper wipes. The dual jet runner design makes full use of the spray bar space and delivers more hygienic water, double cleaning to solve the needs of the whole family.
2.2. Geometry and Mesh
The cleaning spray bar of the intelligent toilet is depicted in Figure 1 and is equipped with a dual jet spray. Due to its symmetric and non-interfering design, this study focuses on investigating only one of the runners, with the understanding that the conclusions drawn from this research can be extrapolated to the other runners as well. In this study, the lower side of the flow channel depicted in Figure 1 is selected as a more representative choice for investigation. This decision is based on the shorter length of the straight section within the channel and the consequential relatively unstable flow conditions.
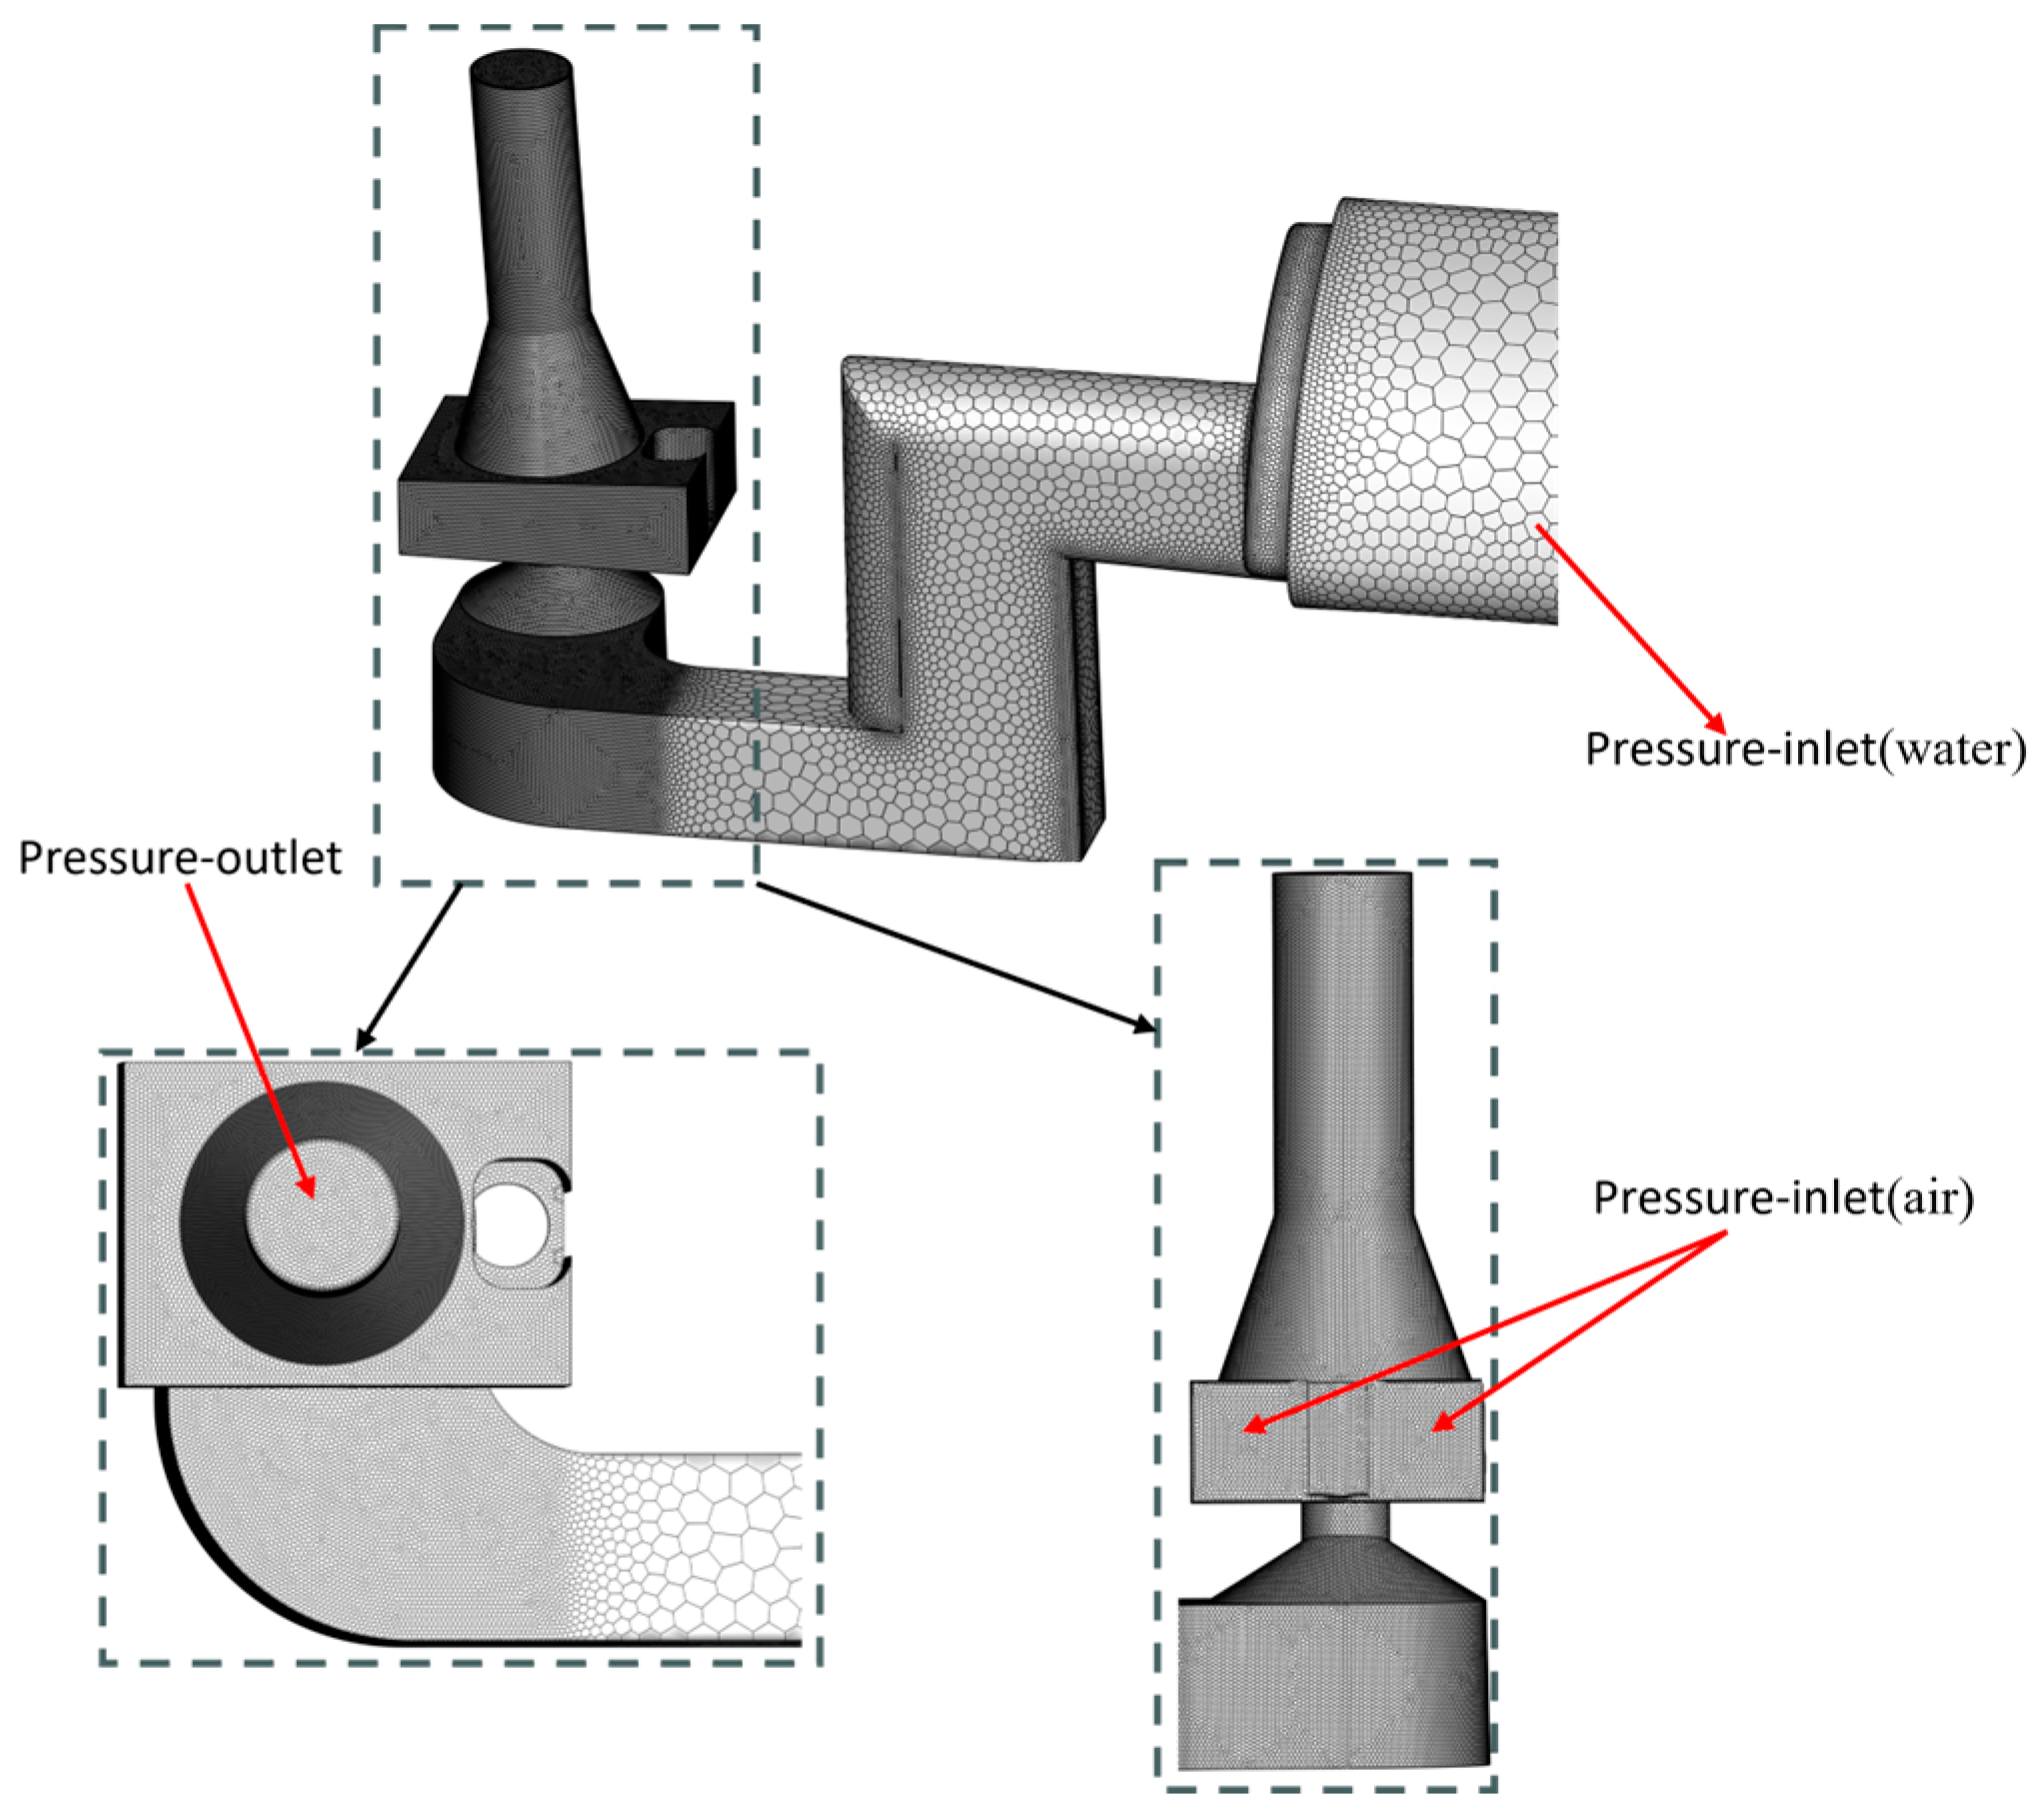
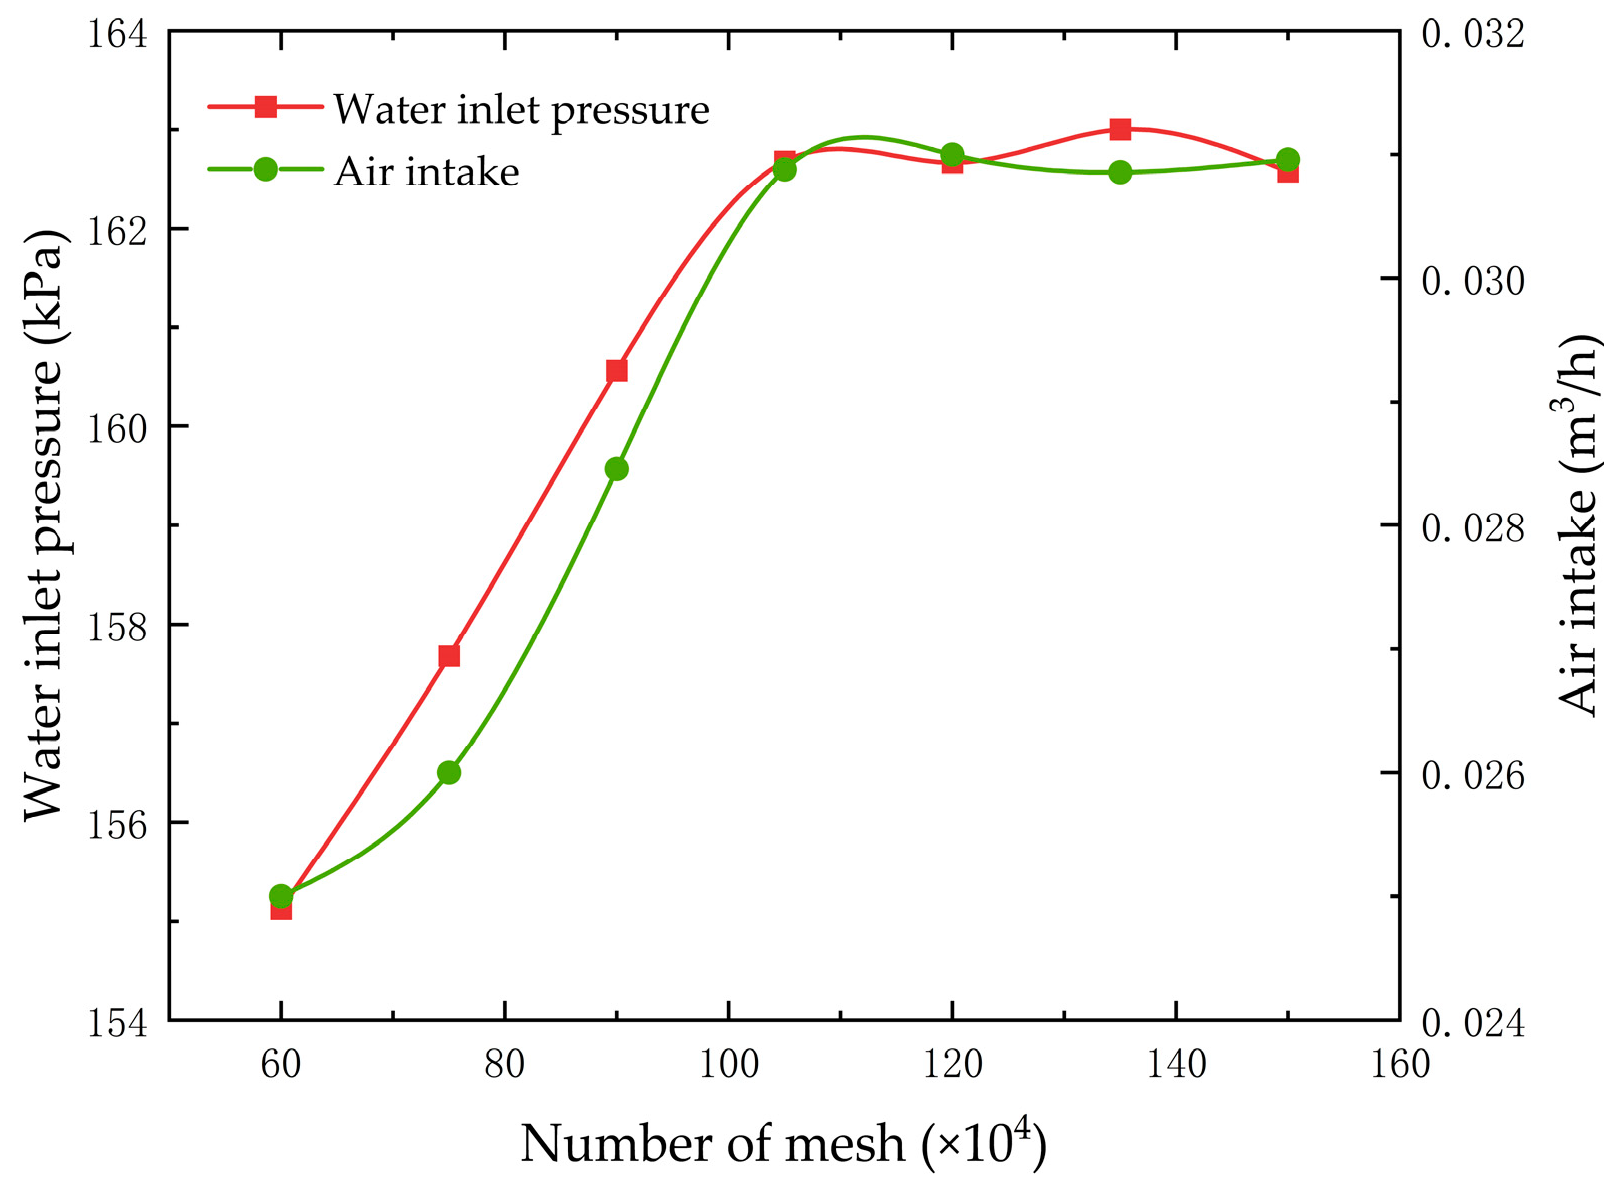
The present study employed Fluent Meshing for mesh partitioning. The mesh sizes ranged from 0.5 mm to 1 mm, with selective local refinement applied at critical regions including the bend of the spray rod, the liquid–air mixing zone, and the outlet. Poly-hexcore was chosen as the mesh type, ensuring a mesh quality surpassing 0.6. Poly-hexcore meshes offer superior computational efficiency by preserving mesh quality while utilizing fewer mesh elements. Figure 2 illustrates a section of the computational domain’s mesh structure for the flow channel model. To assess grid independence, in Figure 3, the mesh size is progressively increased from 0.6 million to 1.5 million. Considering computational accuracy and efficiency, a minimum of 1 million mesh cells is chosen as the final mesh resolution.
2.3. Mathematical Model
In this study, we refer to the existing numerical simulations of liquid–gas ejectors as well as multiphase flow algorithms for the computational setup, and the VOF model is selected as the multiphase flow model for the numerical calculations [28,29,30]. The VOF multiphase flow model simulates the multiphase flow equations of motion by using the same set of momentum equations solved jointly for mutually immiscible fluids and calculating the volume fraction of each fluid in motion. By solving separate momentum equations and dealing with the volume fraction of each fluid in the computational domain, the problem of simulating the motion of two or three fluids that cannot dissolve each other is thus simulated [31,32].
The VOF model performs calculations on the research problem through the volume fraction equation, momentum conservation equation, and energy conservation equation. The cross section between the phases can be traced by solving the continuity equation for the volume fraction of a single or multiple phases. The continuity equation for the volume fraction of the q phase is as follows [33]:
where ρq is the physical density of the q phase; vq is the velocity of the q phase; mpq is the mass transfer from the q phase to the p phase; mqp is the mass transfer from the p phase to the q phase; and Sαq is the source term, which has a default value of zero and can also be specified as a constant or a user-defined mass source term.
Meanwhile, with reference to the numerical simulation of the jet ejector, considering that the fluid inside the elbow may generate divergent, secondary, and cyclonic flows, the SIMPLE algorithm and realizable k-ε model is utilized, and the second-order windward format with a higher accuracy is selected. According to the realizable k-ε, the model can be expressed as follows [34,35,36,37,38]:
where k represents the turbulent kinetic energy; ε represents the turbulent kinetic energy dissipation rate; xi and xj are the coordinates; μ1 is the laminar vortex viscosity coefficient; μt represents the molecular viscosity and turbulent viscosity; Pk represents the turbulent kinetic energy generated by the velocity gradient; Pb represents the turbulent kinetic energy generated by buoyancy; YM is the fluctuation due to diffusion; Sk and Sε are the parameters; and C1ε, C2ε, and C3ε are model constants.
The liquid phase inlet boundary uses a mass flow inlet, the gas phase inlet boundary uses a pressure inlet, and the outlet boundary uses a pressure outlet. In this case, the inlet mass flow of the liquid phase is 0.01 kg/s, the inlet pressure of the gas phase is the standard atmospheric pressure, and the outlet pressure is the standard atmospheric pressure. The fluid materials used in this paper are water and air, which have densities of 998.2 kg/m3 and 1.226 kg/m3, respectively, and the temperatures of both are kept at 15 °C.
The numerical simulation calculates the residuals below 10−5. The quality difference between the exports and imports is below 0.5%, and the maximum speed of the monitored exports reaches a level considered to satisfy the convergence requirements.
2.4. Validation of Computational Schemes
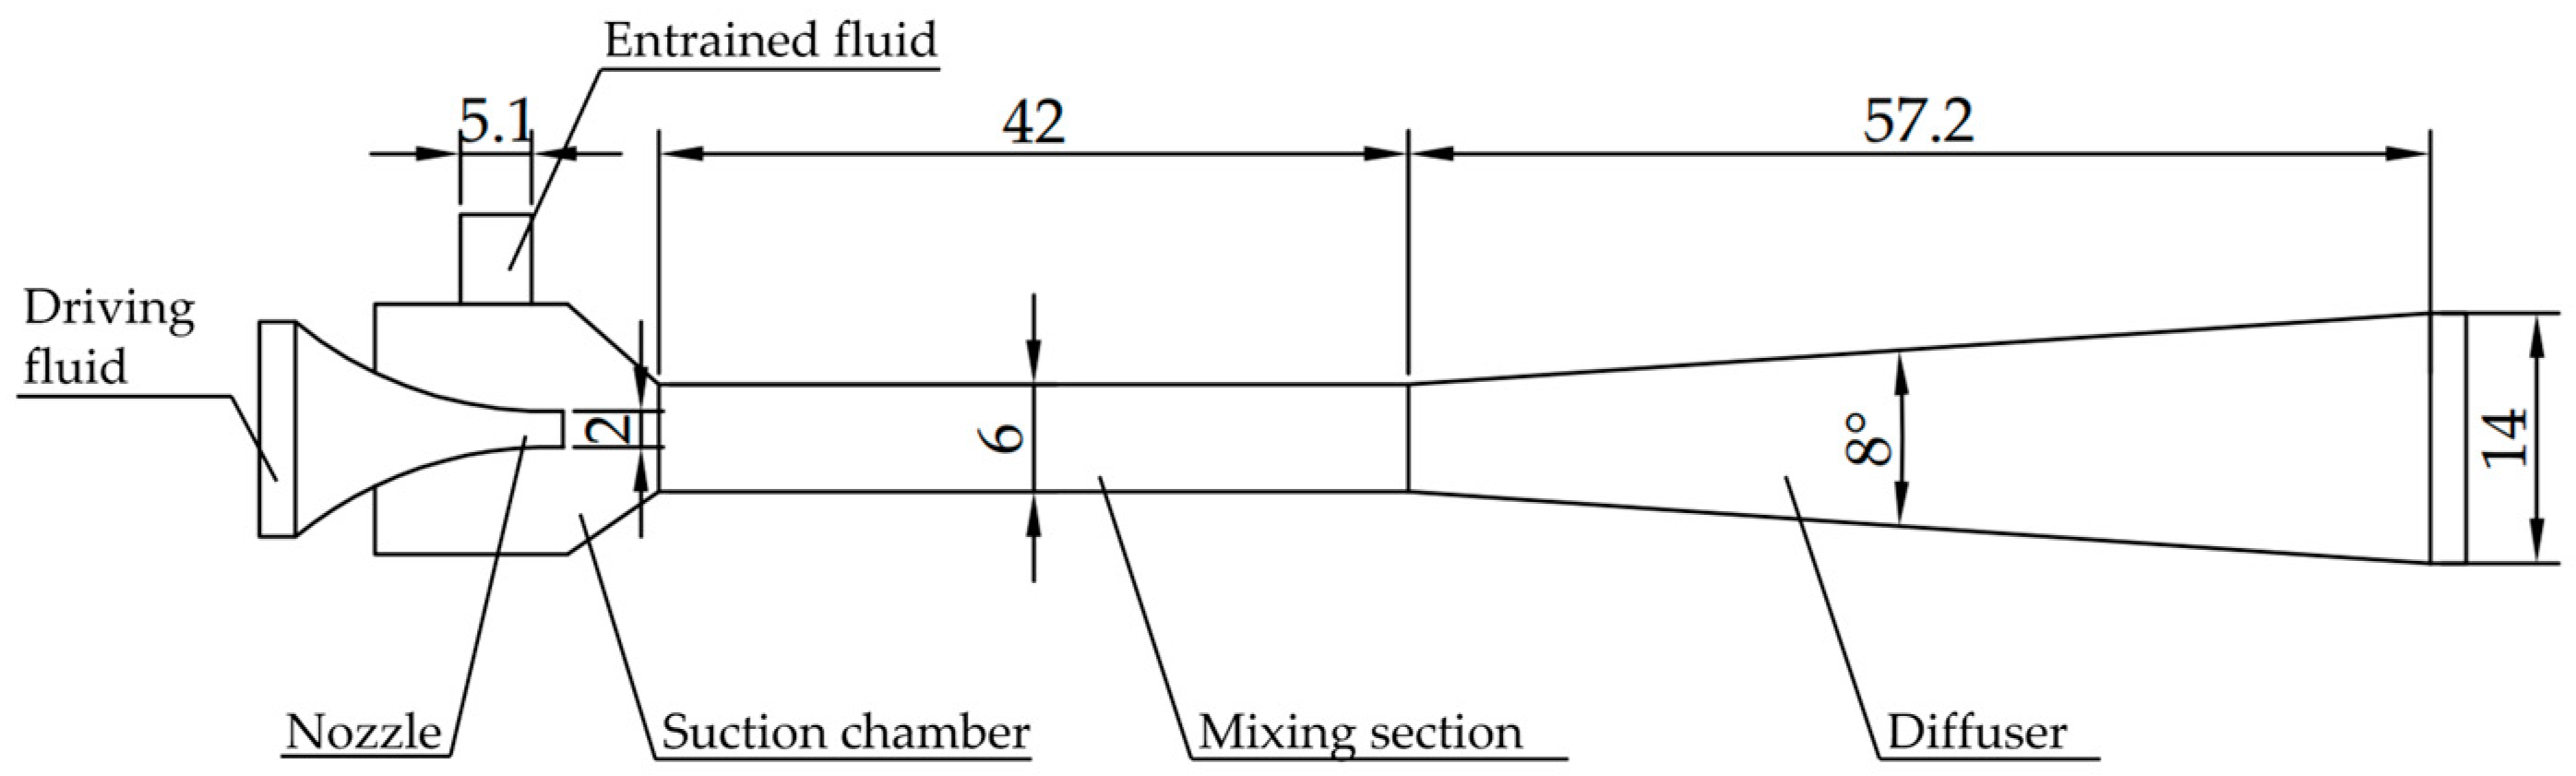
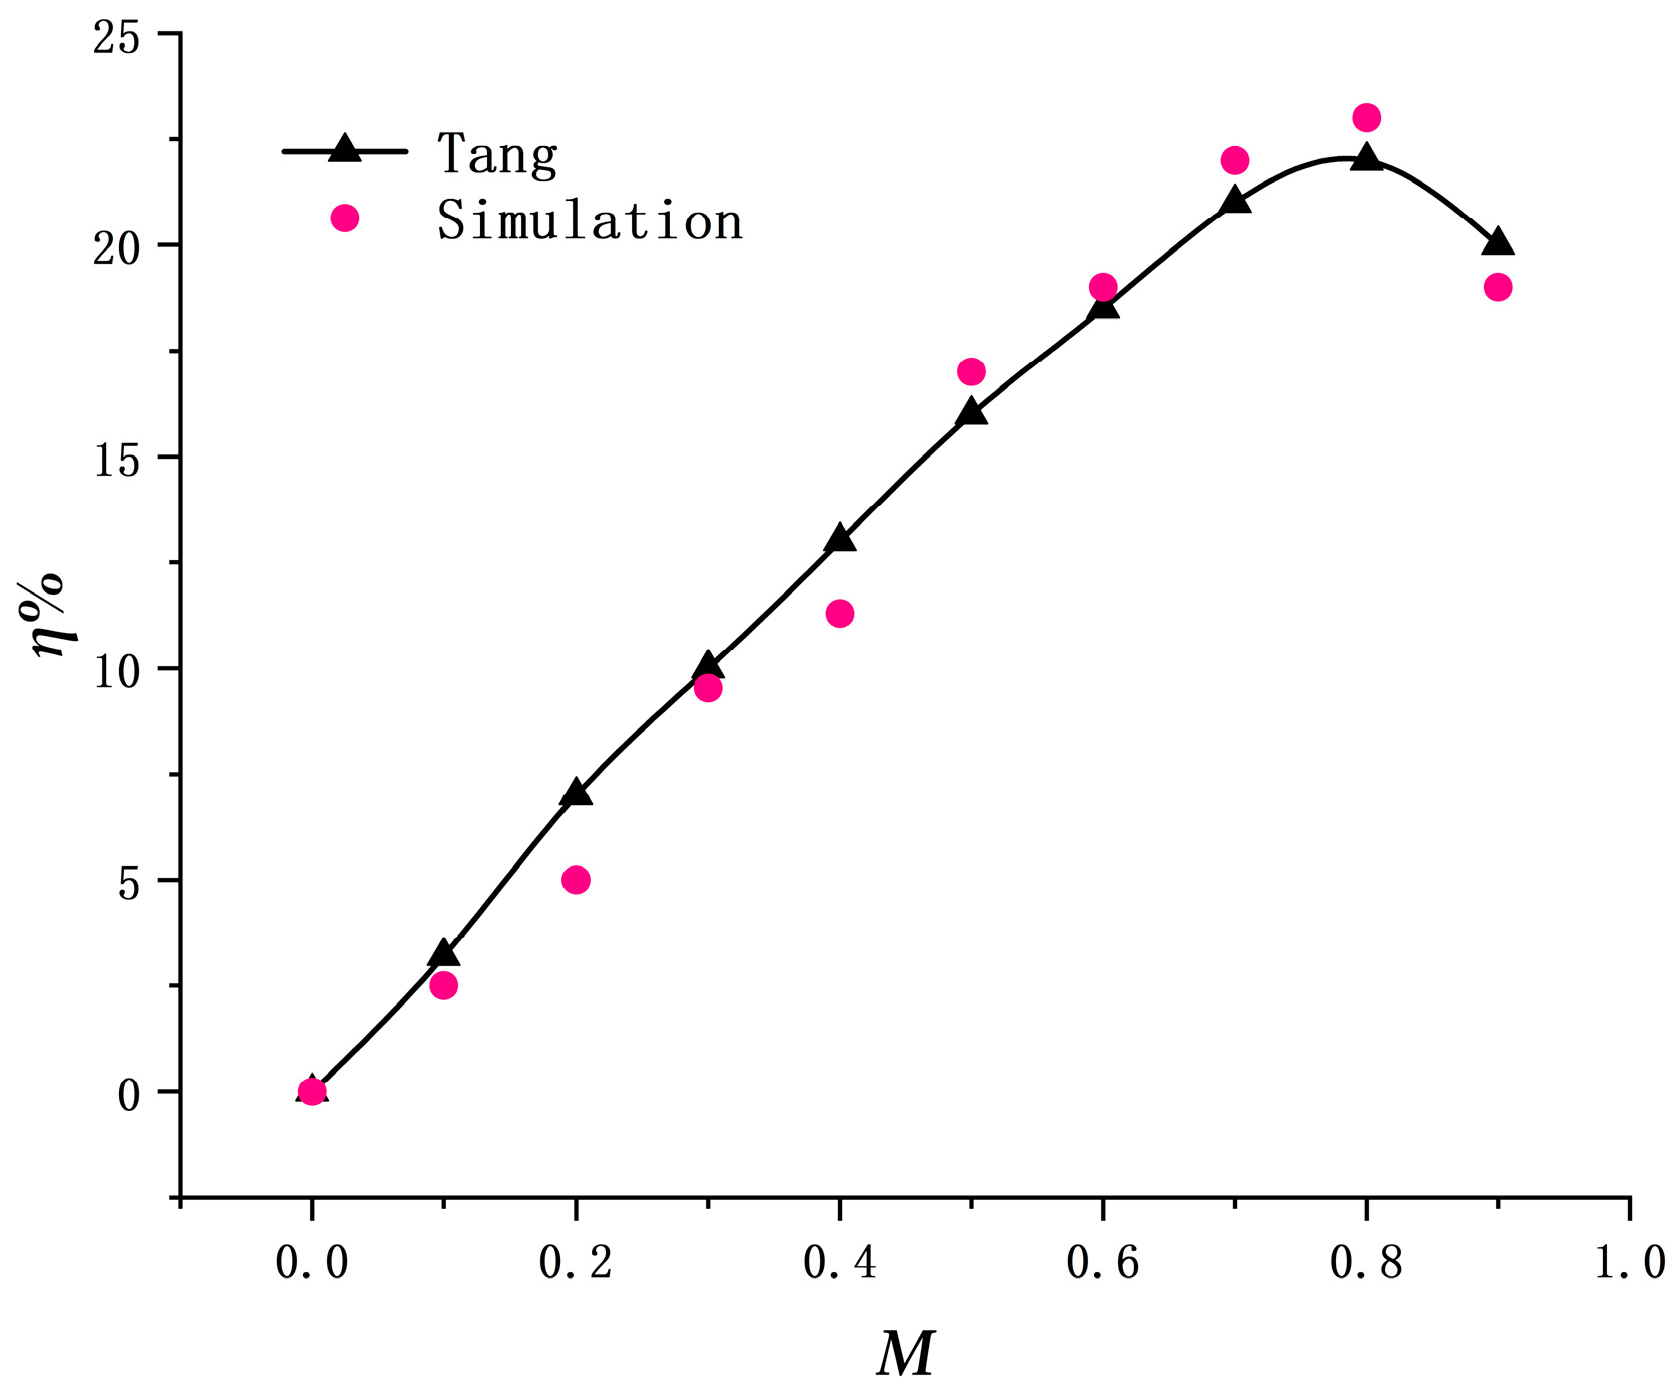
Given the analogous operational principles shared by the liquid–gas ejector and intelligent toilet spray, where gas is transported via high-speed liquid flow and characterized by inlet, air intake, and mixed outlet features, this study devises a simulation model for the intelligent toilet spray based on the established simulation model for the liquid–gas ejector. The objective of this approach is to ascertain the dependability of the simulated outcomes. This paper numerically simulates the dimensions of the liquid–gas ejector used in the experiment conducted by Tang et al. [38]. The performance curve of the liquid–gas ejector was derived through the integration of computational and experimental data. The dimensional structure of the liquid–gas ejector utilized in this study is presented in Figure 4, while Figure 5 depicts the comparison between the simulation and experimental results.
Here, q represents the flow ratio of the liquid–gas ejector, Qp denotes the inflow rate at the liquid–gas ejector inlet, Qs stands for the inflow rate at the liquid–gas ejector suction port, h indicates the pressure ratio of the liquid–gas ejector, Po represents the outlet pressure of the liquid–gas ejector, Pp represents the pressure at the liquid–gas ejector water inlet, Ps represents the pressure at the liquid–gas ejector suction port, and η denotes the efficiency of the liquid–gas ejector.
The simulation model of the intelligent toilet spray was integrated into the simulation model of the liquid–gas ejector in this study. By comparing the water inflow rate, suction port flow rate, water inlet pressure, suction port pressure, and outlet pressure of the liquid–gas ejector, a performance curve was derived. The data obtained from the simulation of the intelligent toilet spray, which include the aforementioned parameters, closely correspond to the data obtained from the simulation of the liquid–gas ejector. Therefore, this study suggests that the simulation verification of the liquid–gas ejector provides a certain level of reliability for the simulation calculation of the intelligent toilet spray.
Figure 5 demonstrates that the trends of the liquid–air ejector curves obtained from the numerical simulations and experiments align closely. Particularly for lower flow rates, there is a relatively high level of agreement between the calculated and experimental results. As the flow ratio increases, the discrepancy between the two datasets also grows, yet the maximum error remains below 5%. These findings establish the accuracy and reliability of the numerical simulation utilized in this study.
3. Calculated Analysis of Prototype Clean Spray Bar
3.1. Performance of the Spray Bar Channel
The outlet swirl number is defined as follows [39]:
where So denotes the swirl number of the prototype spray; Sn denotes the swirl number of the optimized model spray; S denotes the ratio of swirl numbers between the optimized model and the prototype; uz denotes the average value of axial velocity on the cross-section; uθ is the average value of tangential velocity on the cross-section; R is the diameter of the cross-section; and r is the radius of the cross-section.
Here, λ is the ratio of the suction volume of the optimized model of the clean spray bar to that of the prototype; Qa−n is the suction volume of the optimized model; Qa−o is the suction volume of the prototype; β is the ratio of the static pressure at the inlet of the optimized model of the clean spray bar to that of the prototype; Pw−n is the static pressure at the inlet of the optimized model; and Pw−o is the static pressure at the inlet of the prototype. A higher value of λ indicates that the optimized model inhales a larger amount of gas, while a lower value of β indicates that the optimized model consumes less energy.
A numerical simulation of the characteristics of a prototype clean spray bar stream channel was calculated using CFD techniques. Combining the above equations yields the swirl number at the outlet of the cleaning spray bar for the prototype.
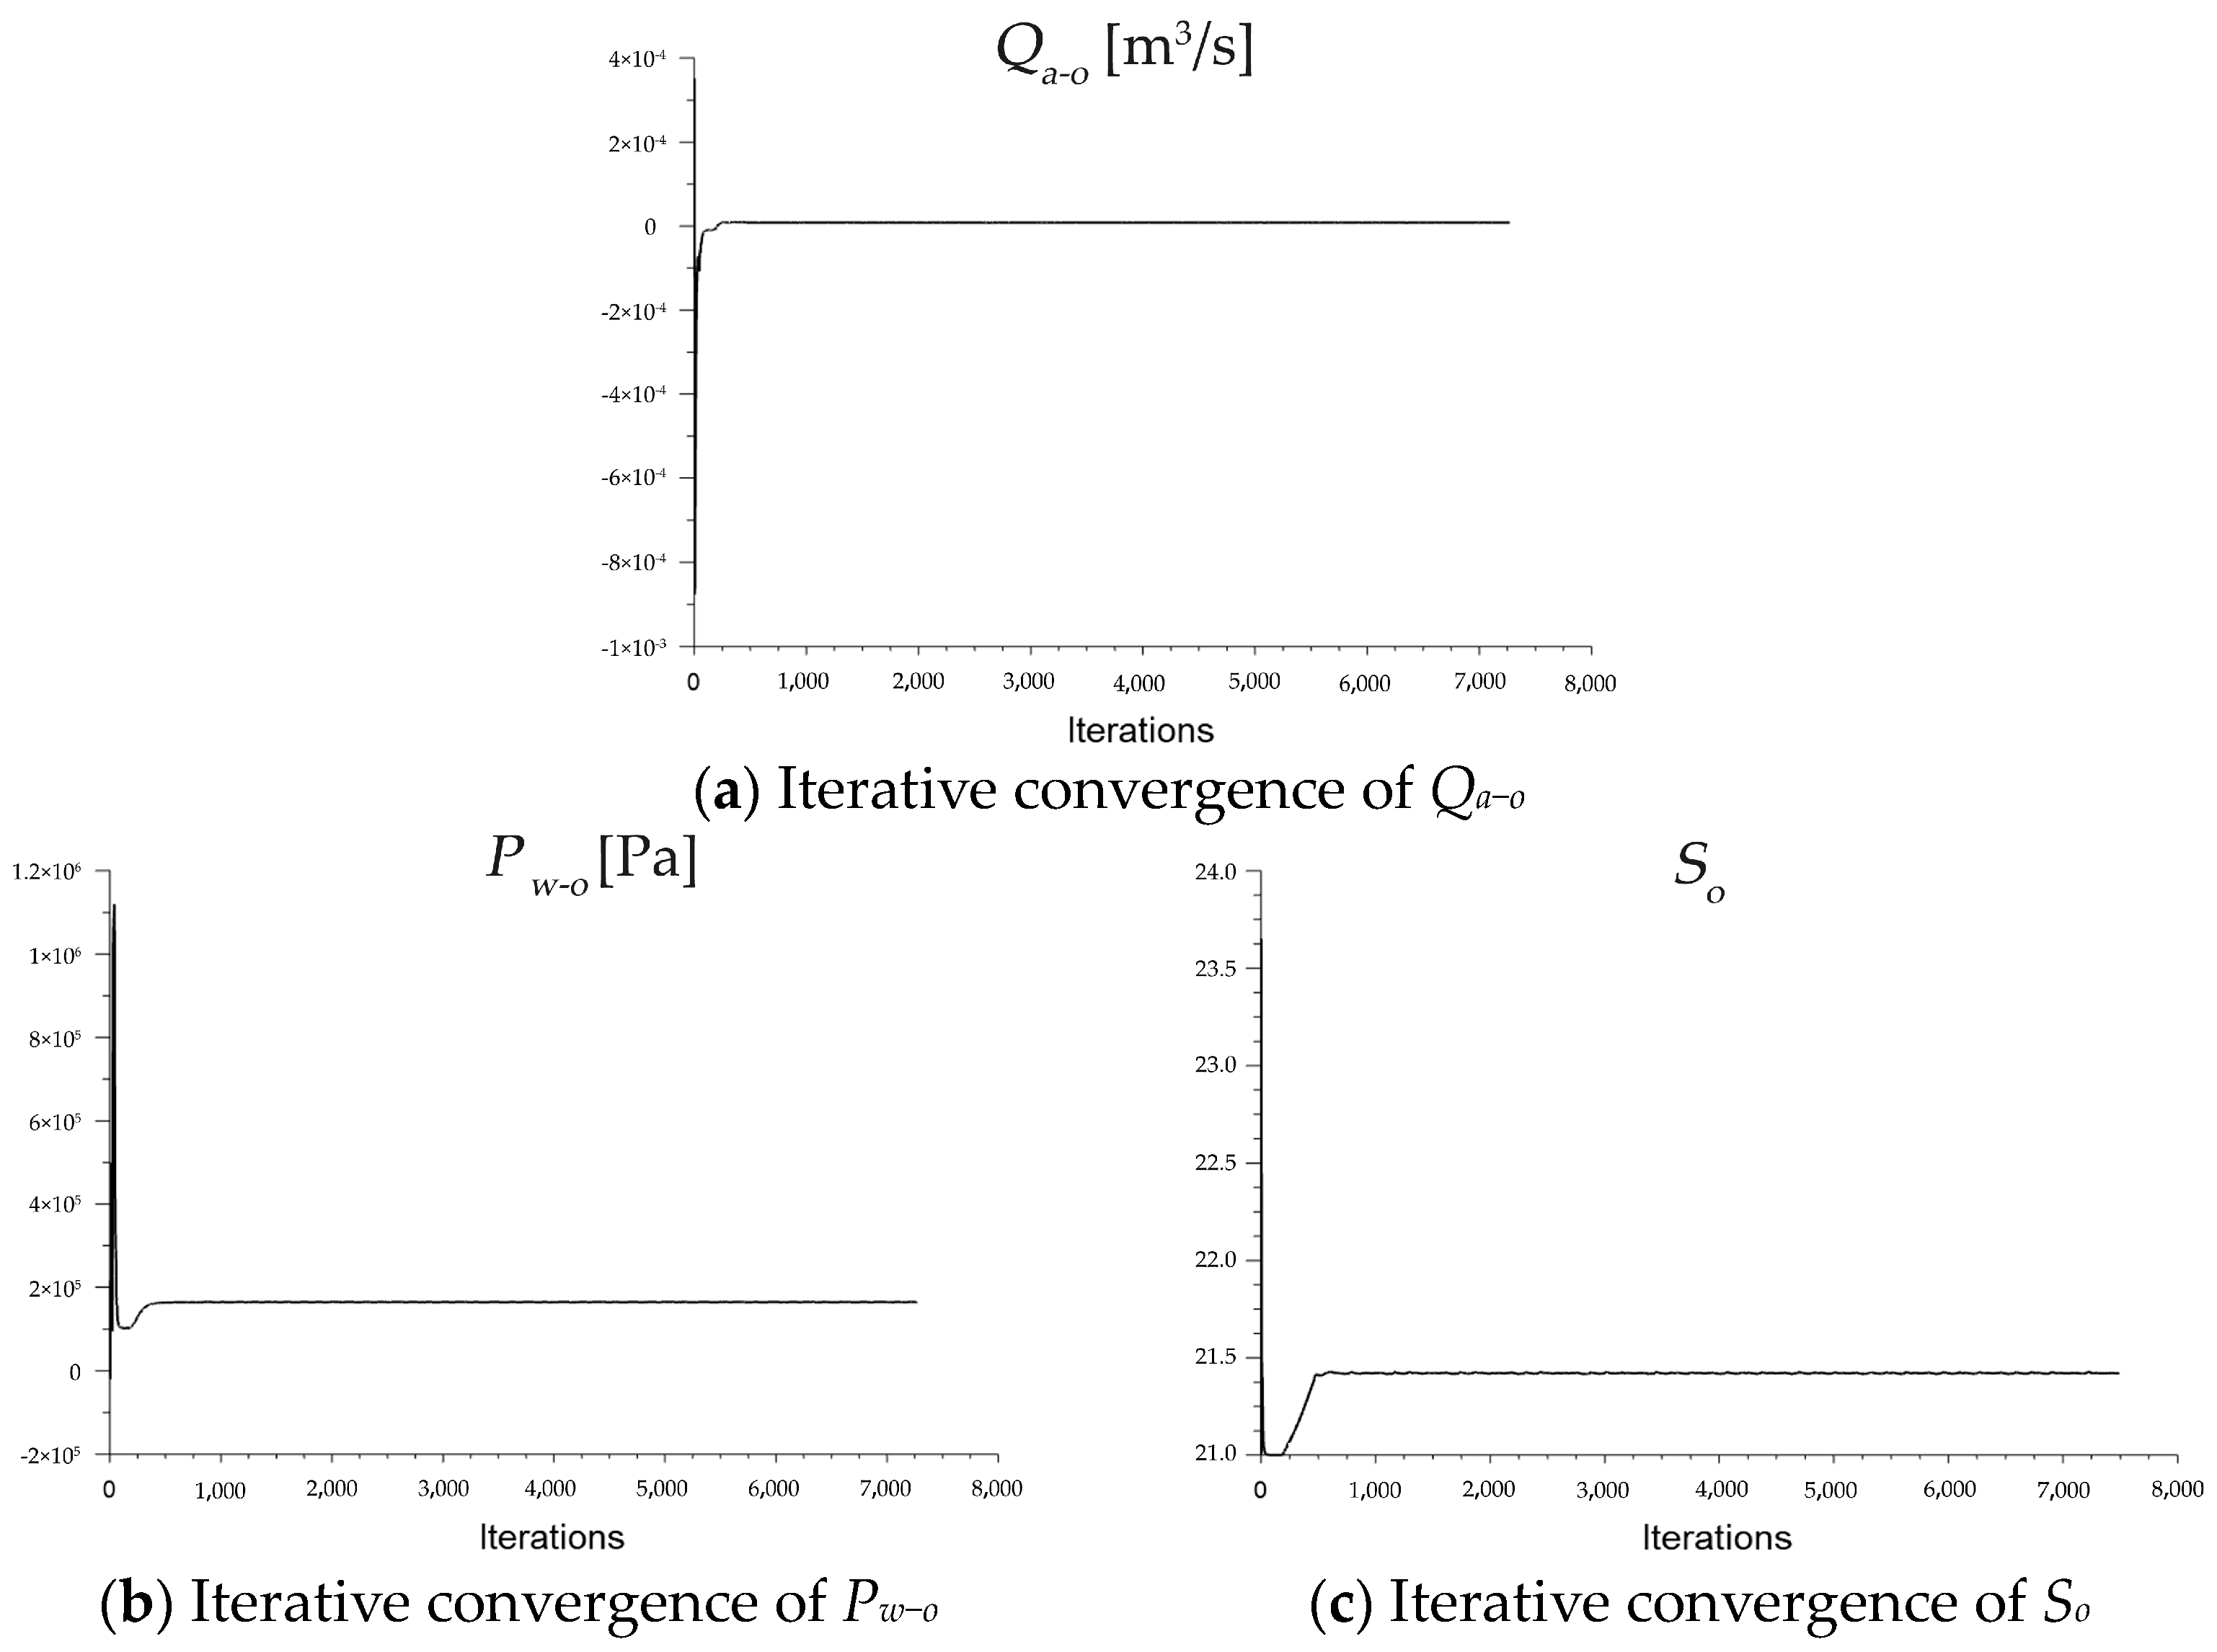
This study utilizes CFD technology for the calculations, and the values required for the aforementioned formula can be obtained using CFD software, as illustrated in Figure 6. Numerical simulations are conducted to evaluate the properties of the clean spray in the prototype. By integrating the formula and extracting numerical values from CFD calculations, the swirl number of the clean spray is determined as So = 21.46, Qa−o = 0.0299 m3/h and Pw−o = 162,681.94 Pa.
3.2. Flow Analysis of the Spray Bar Channel
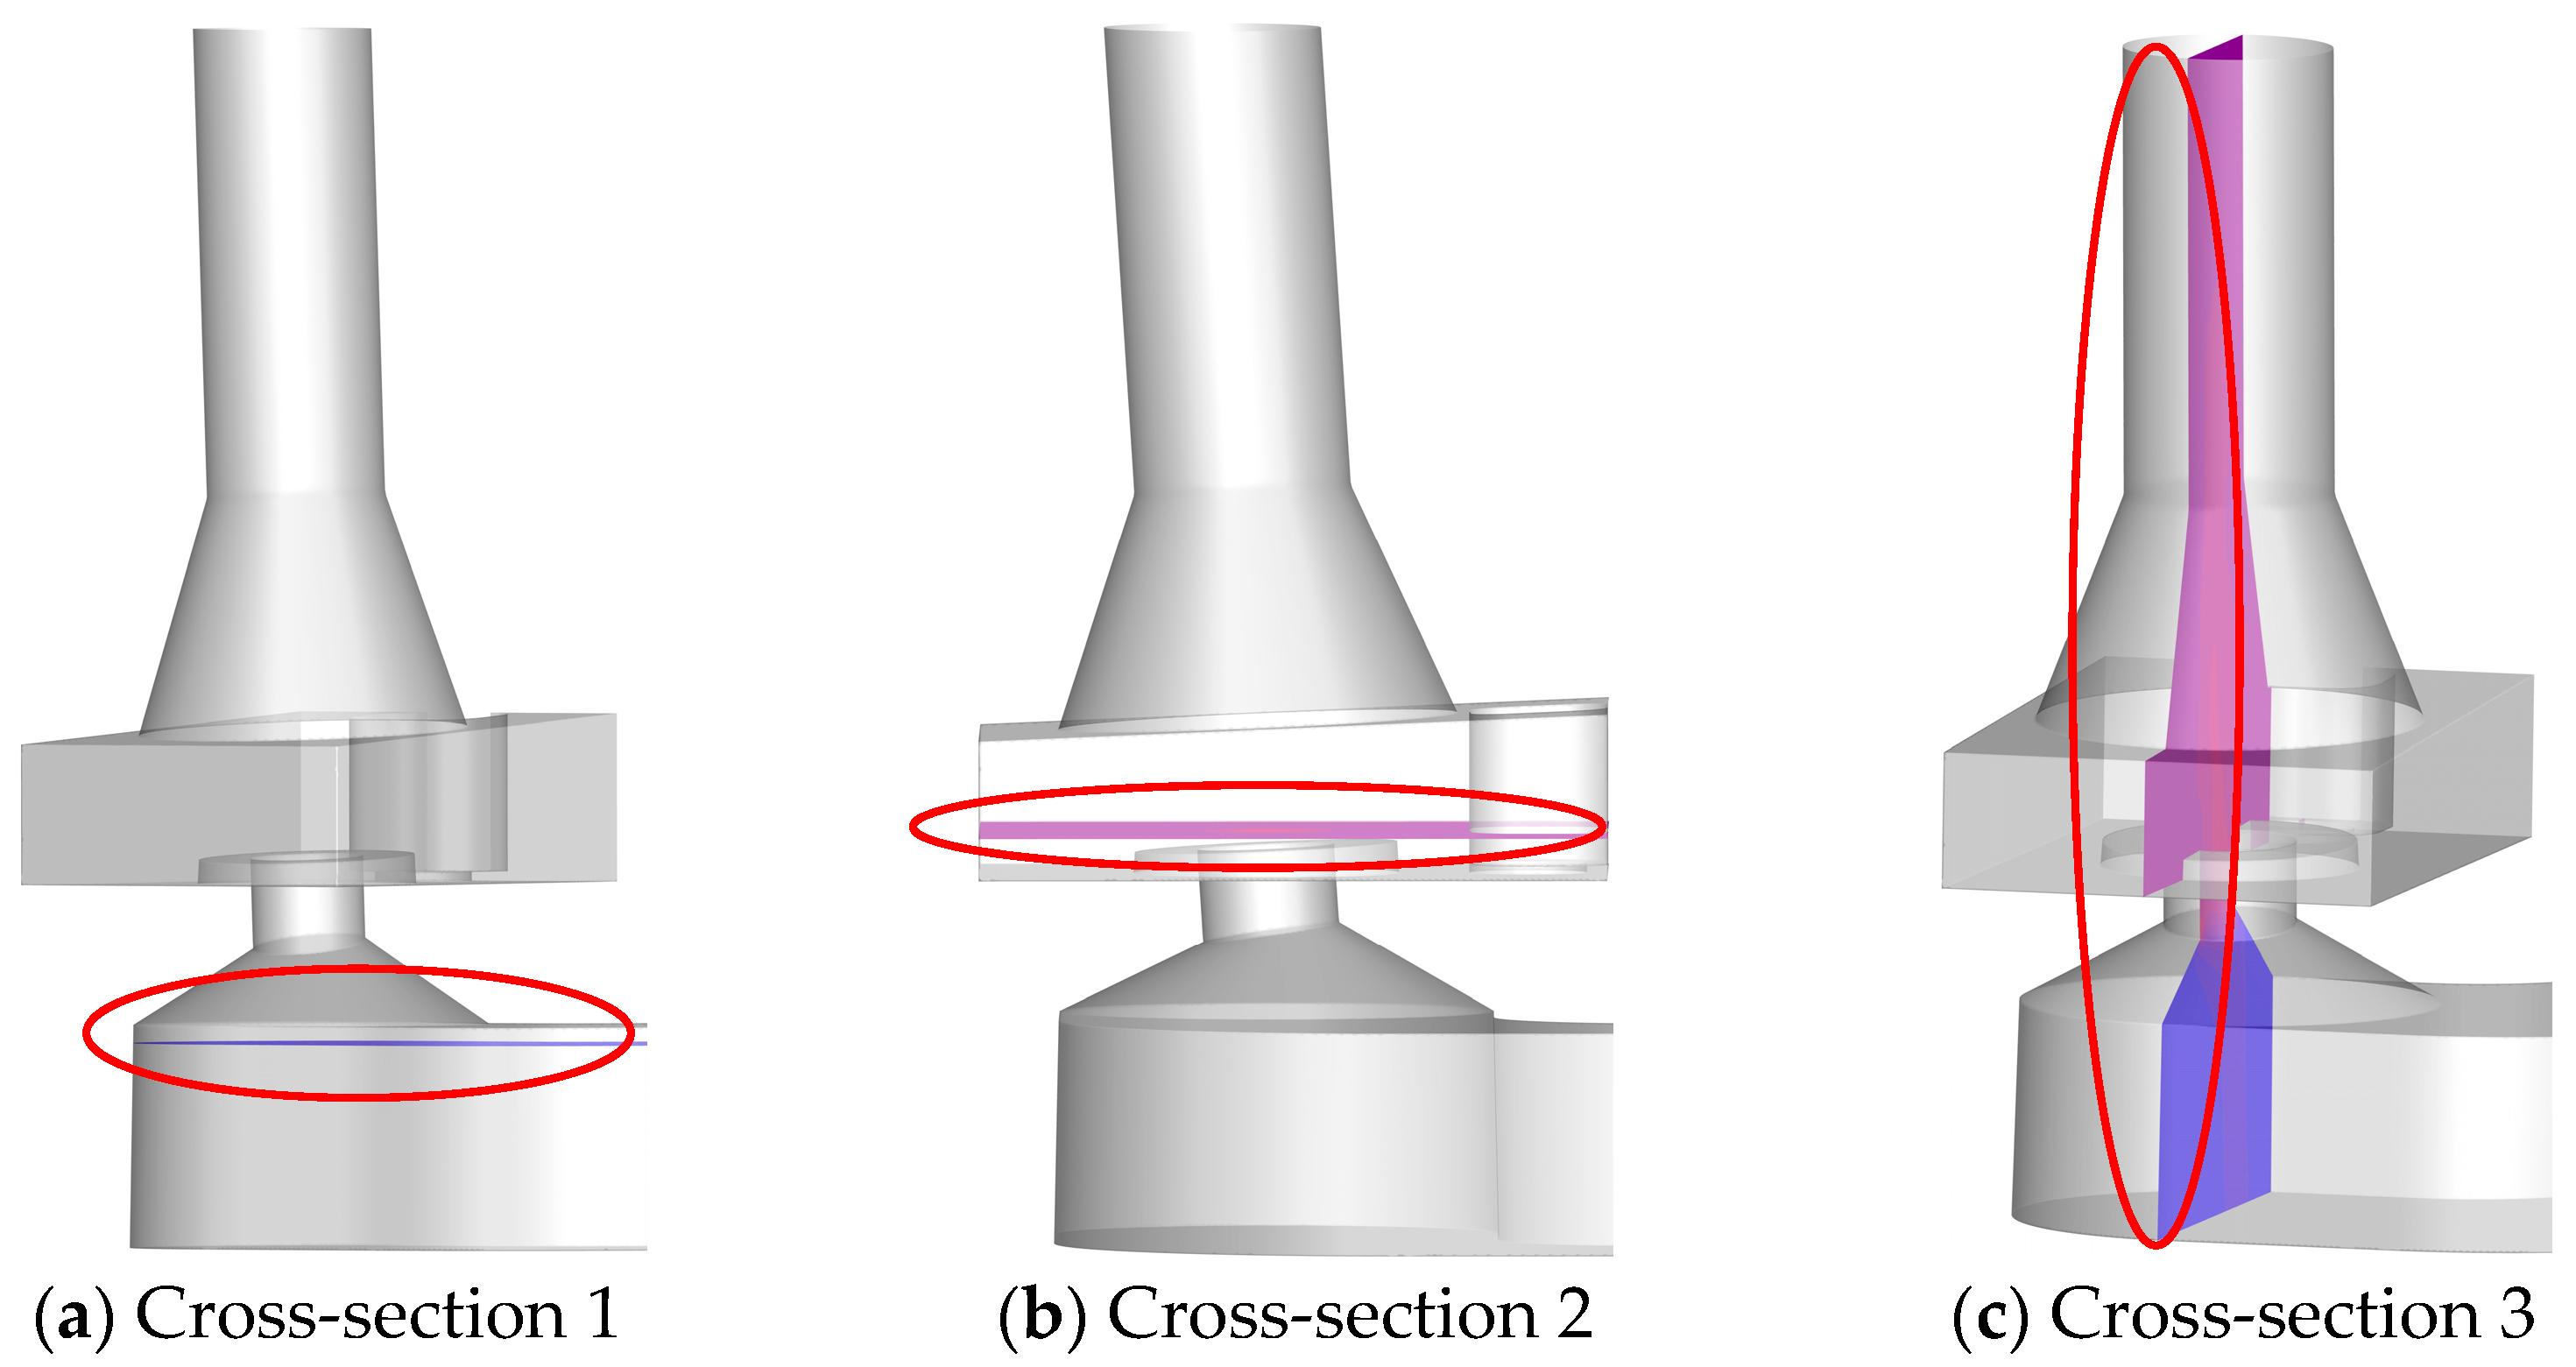
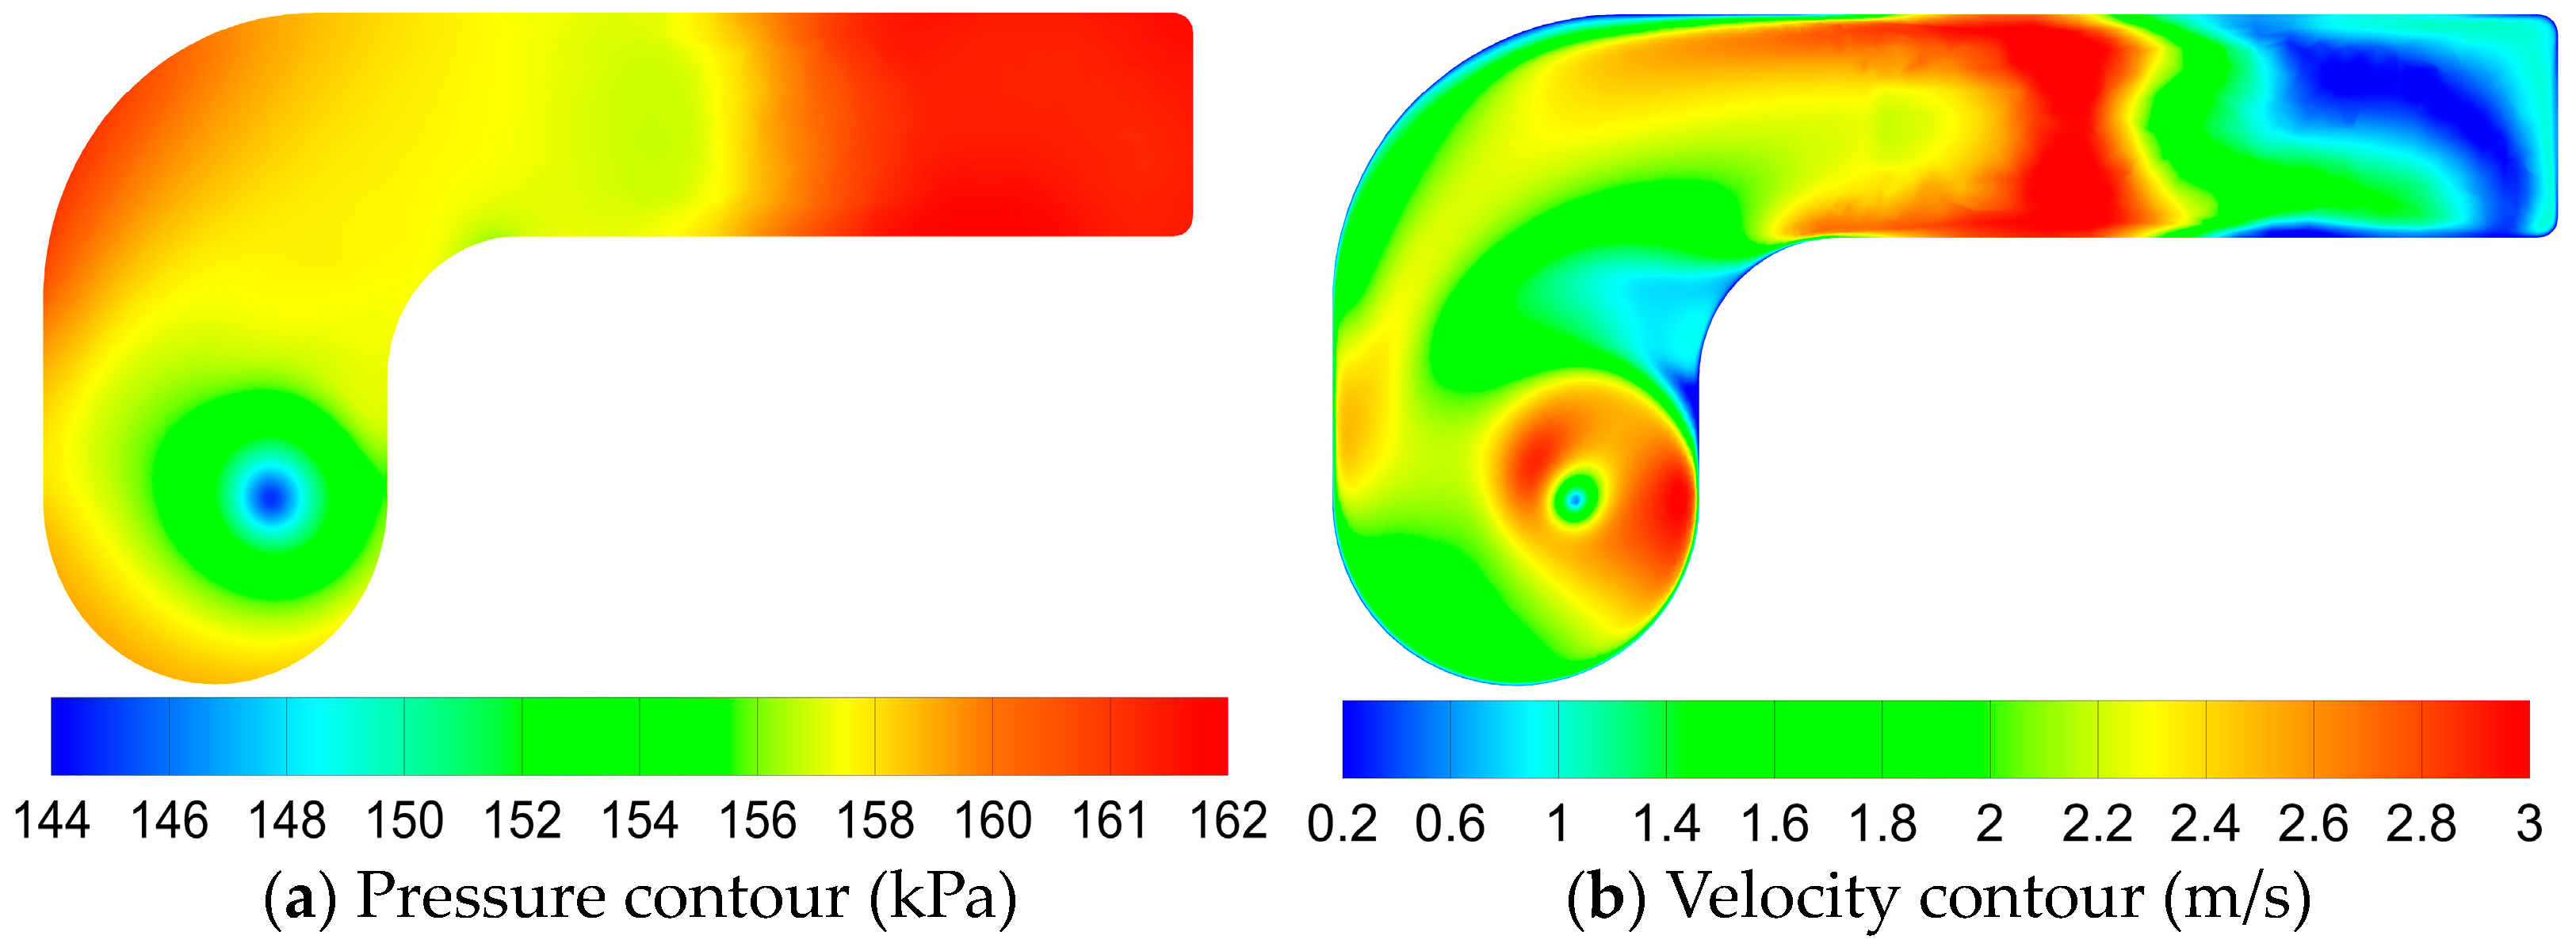
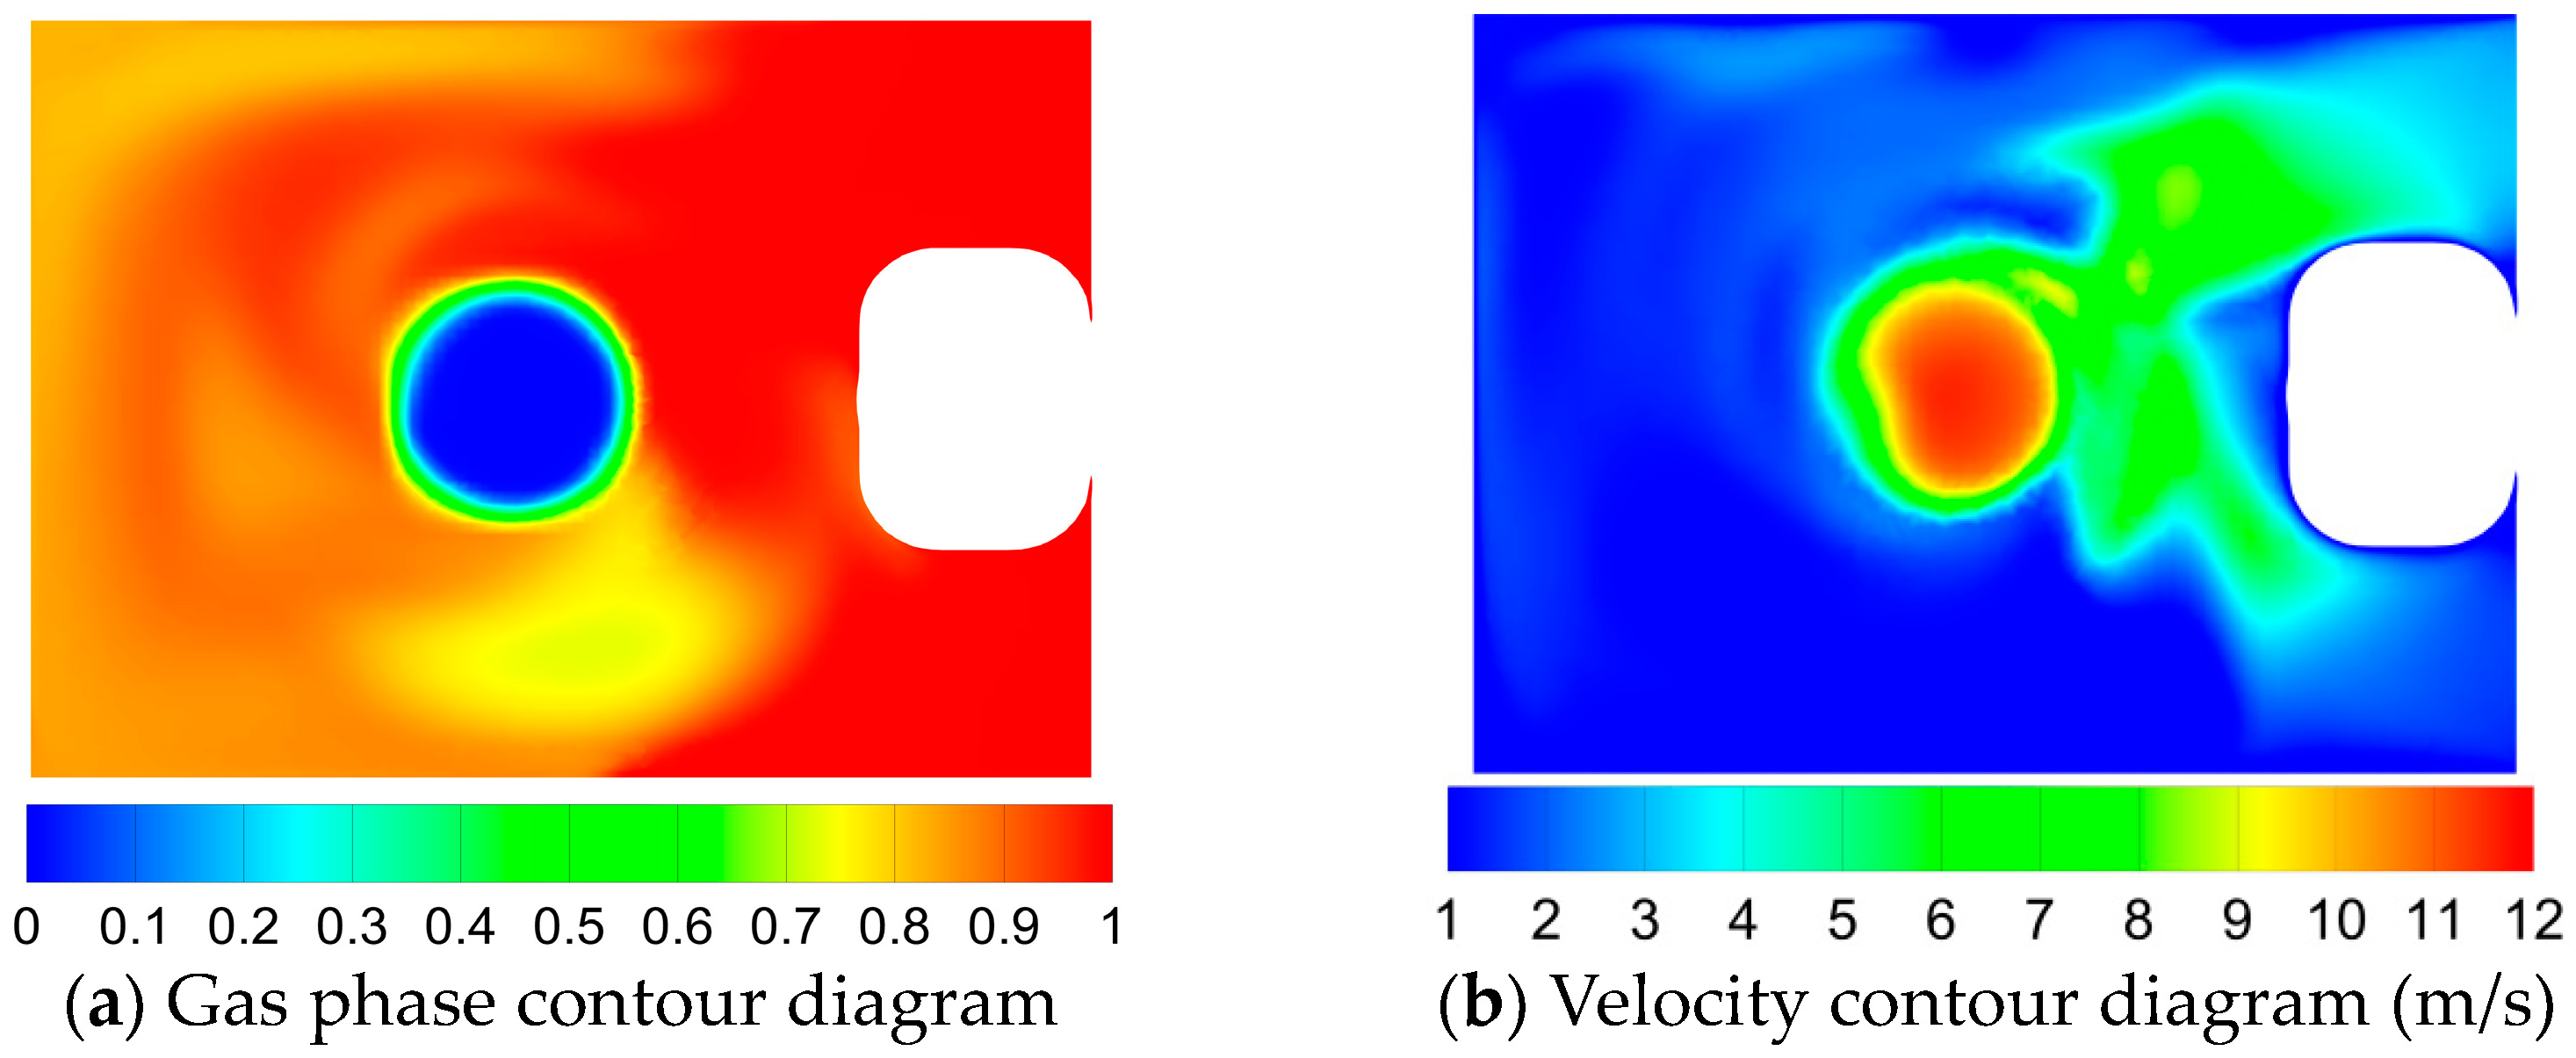
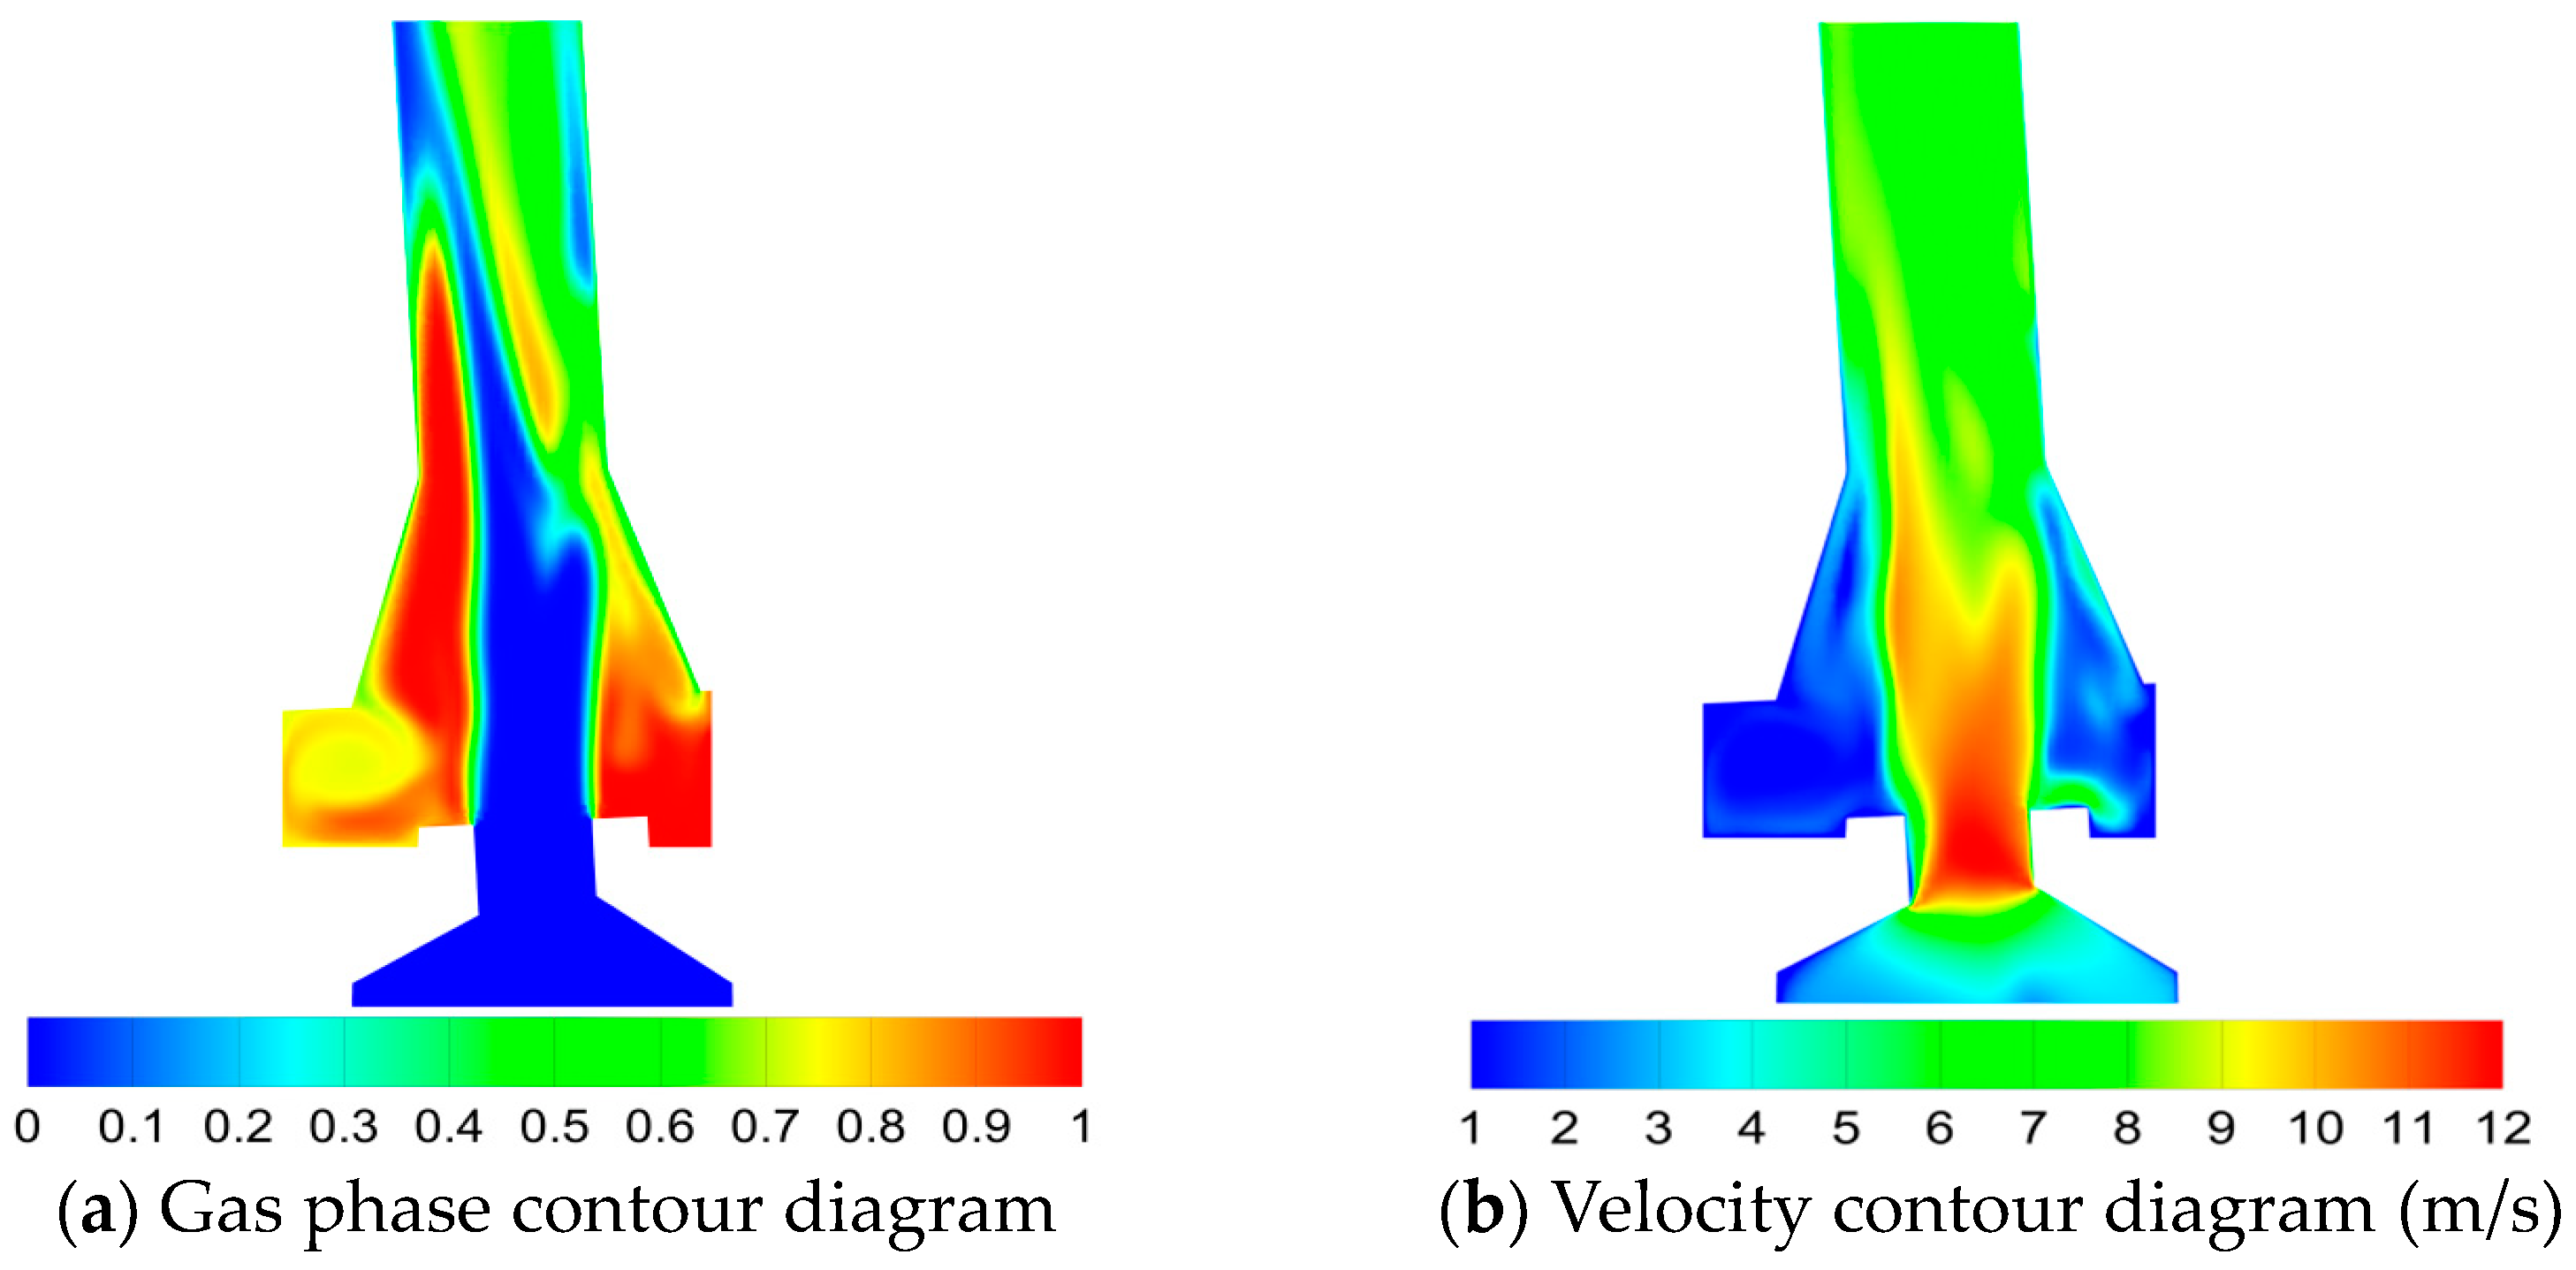
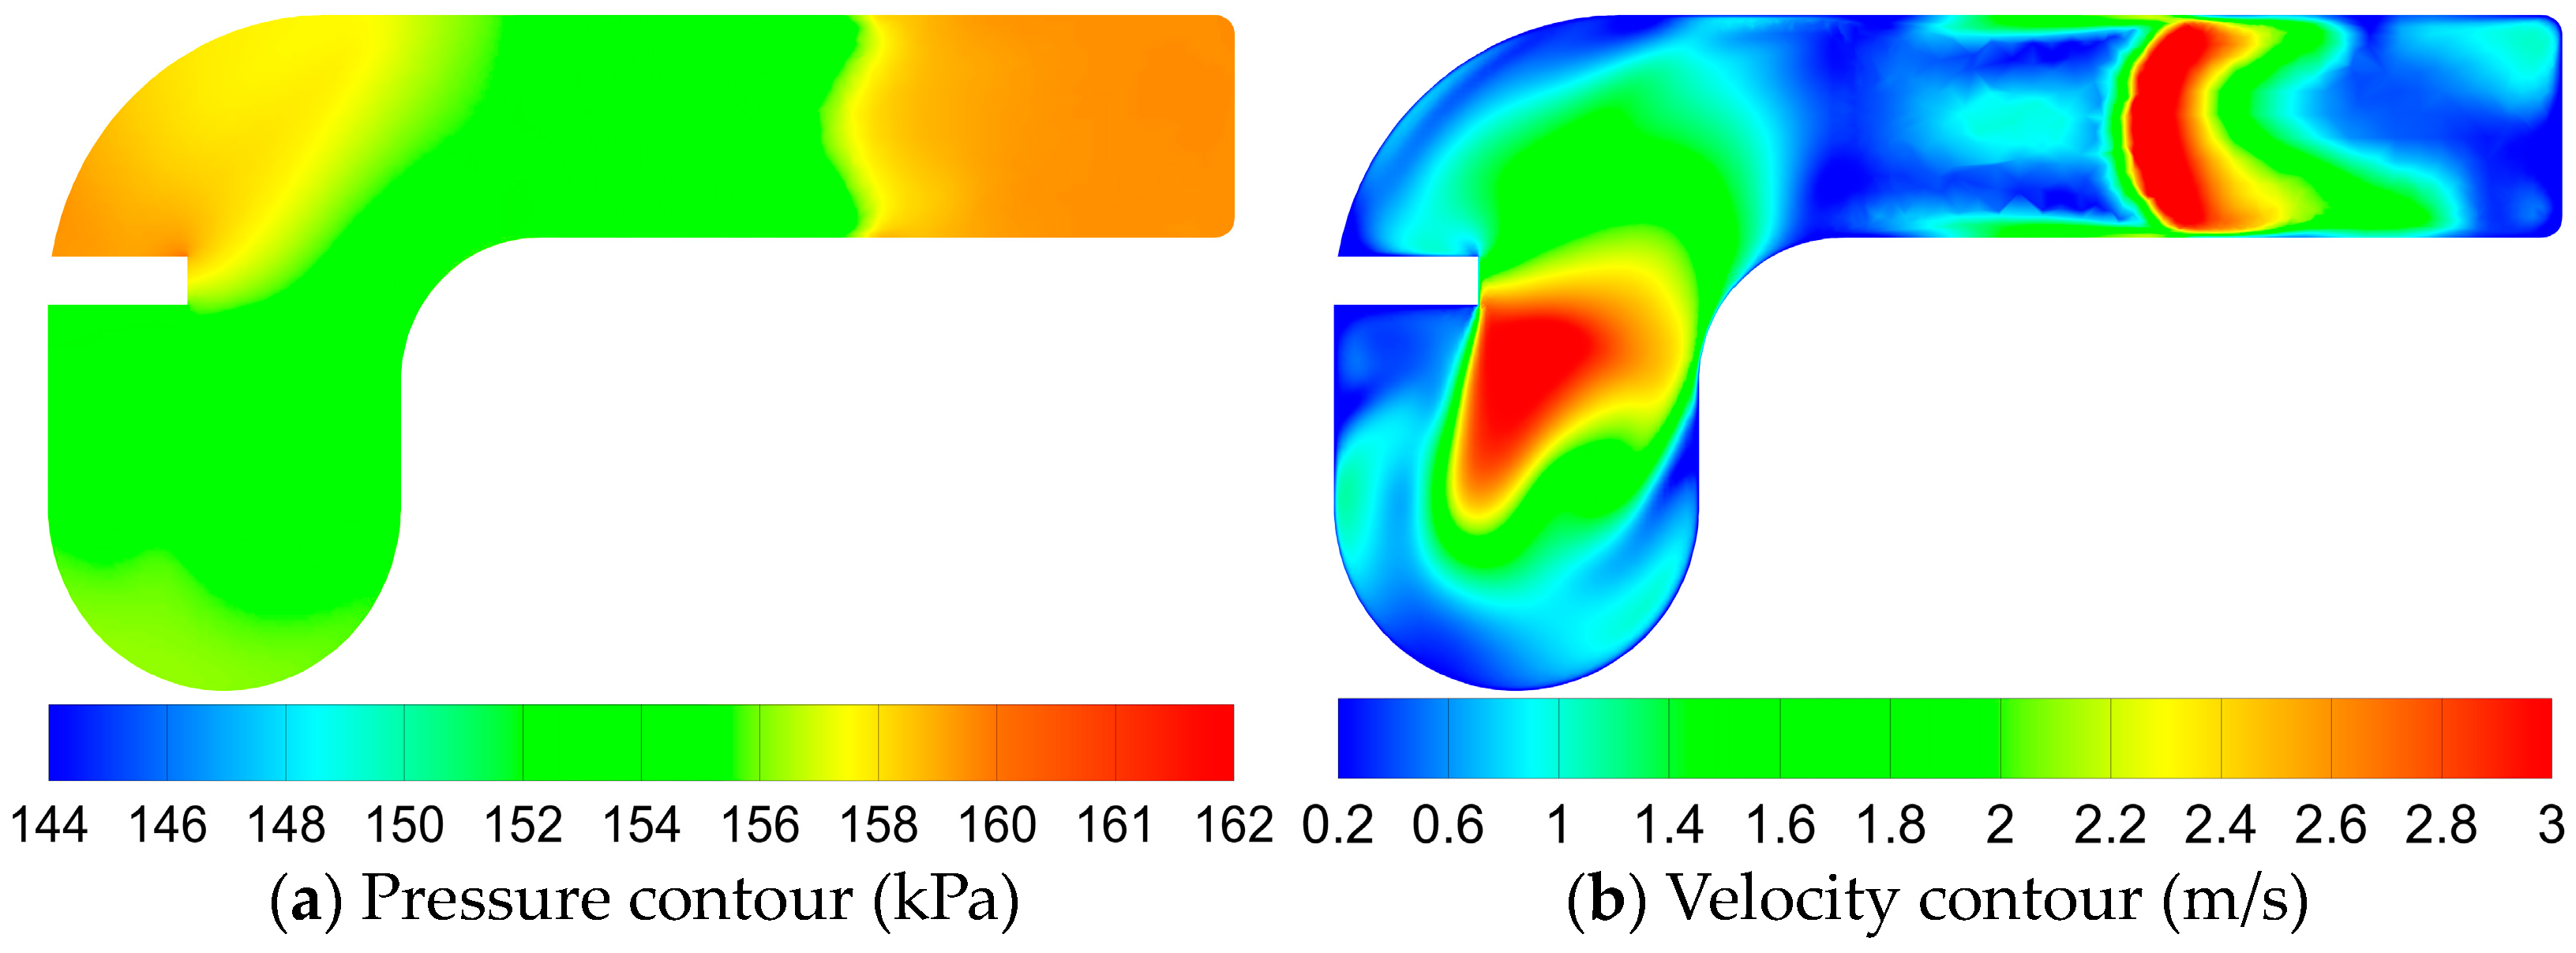
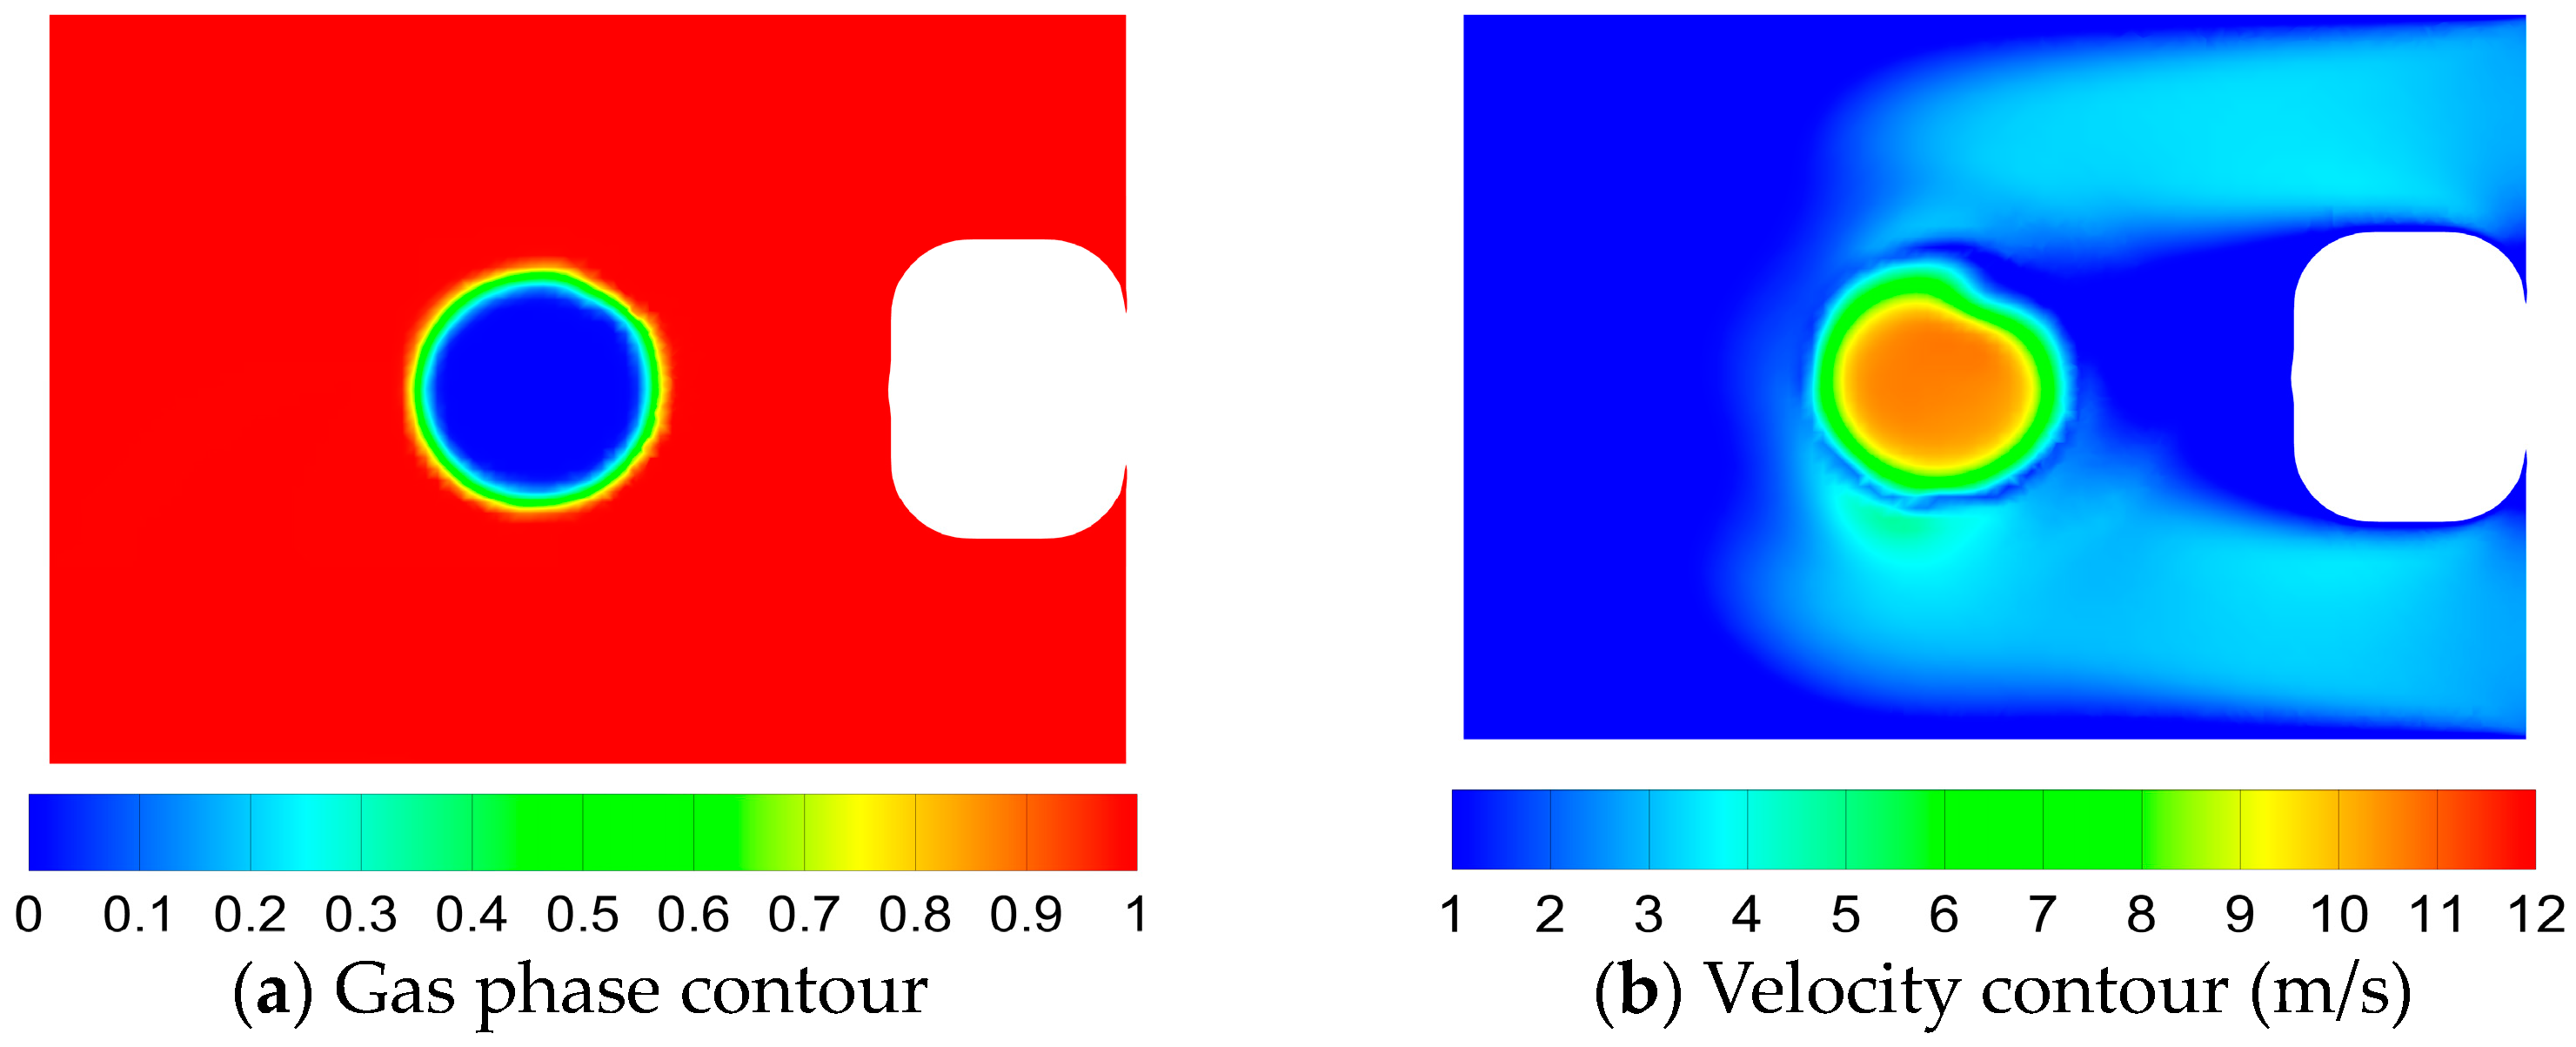
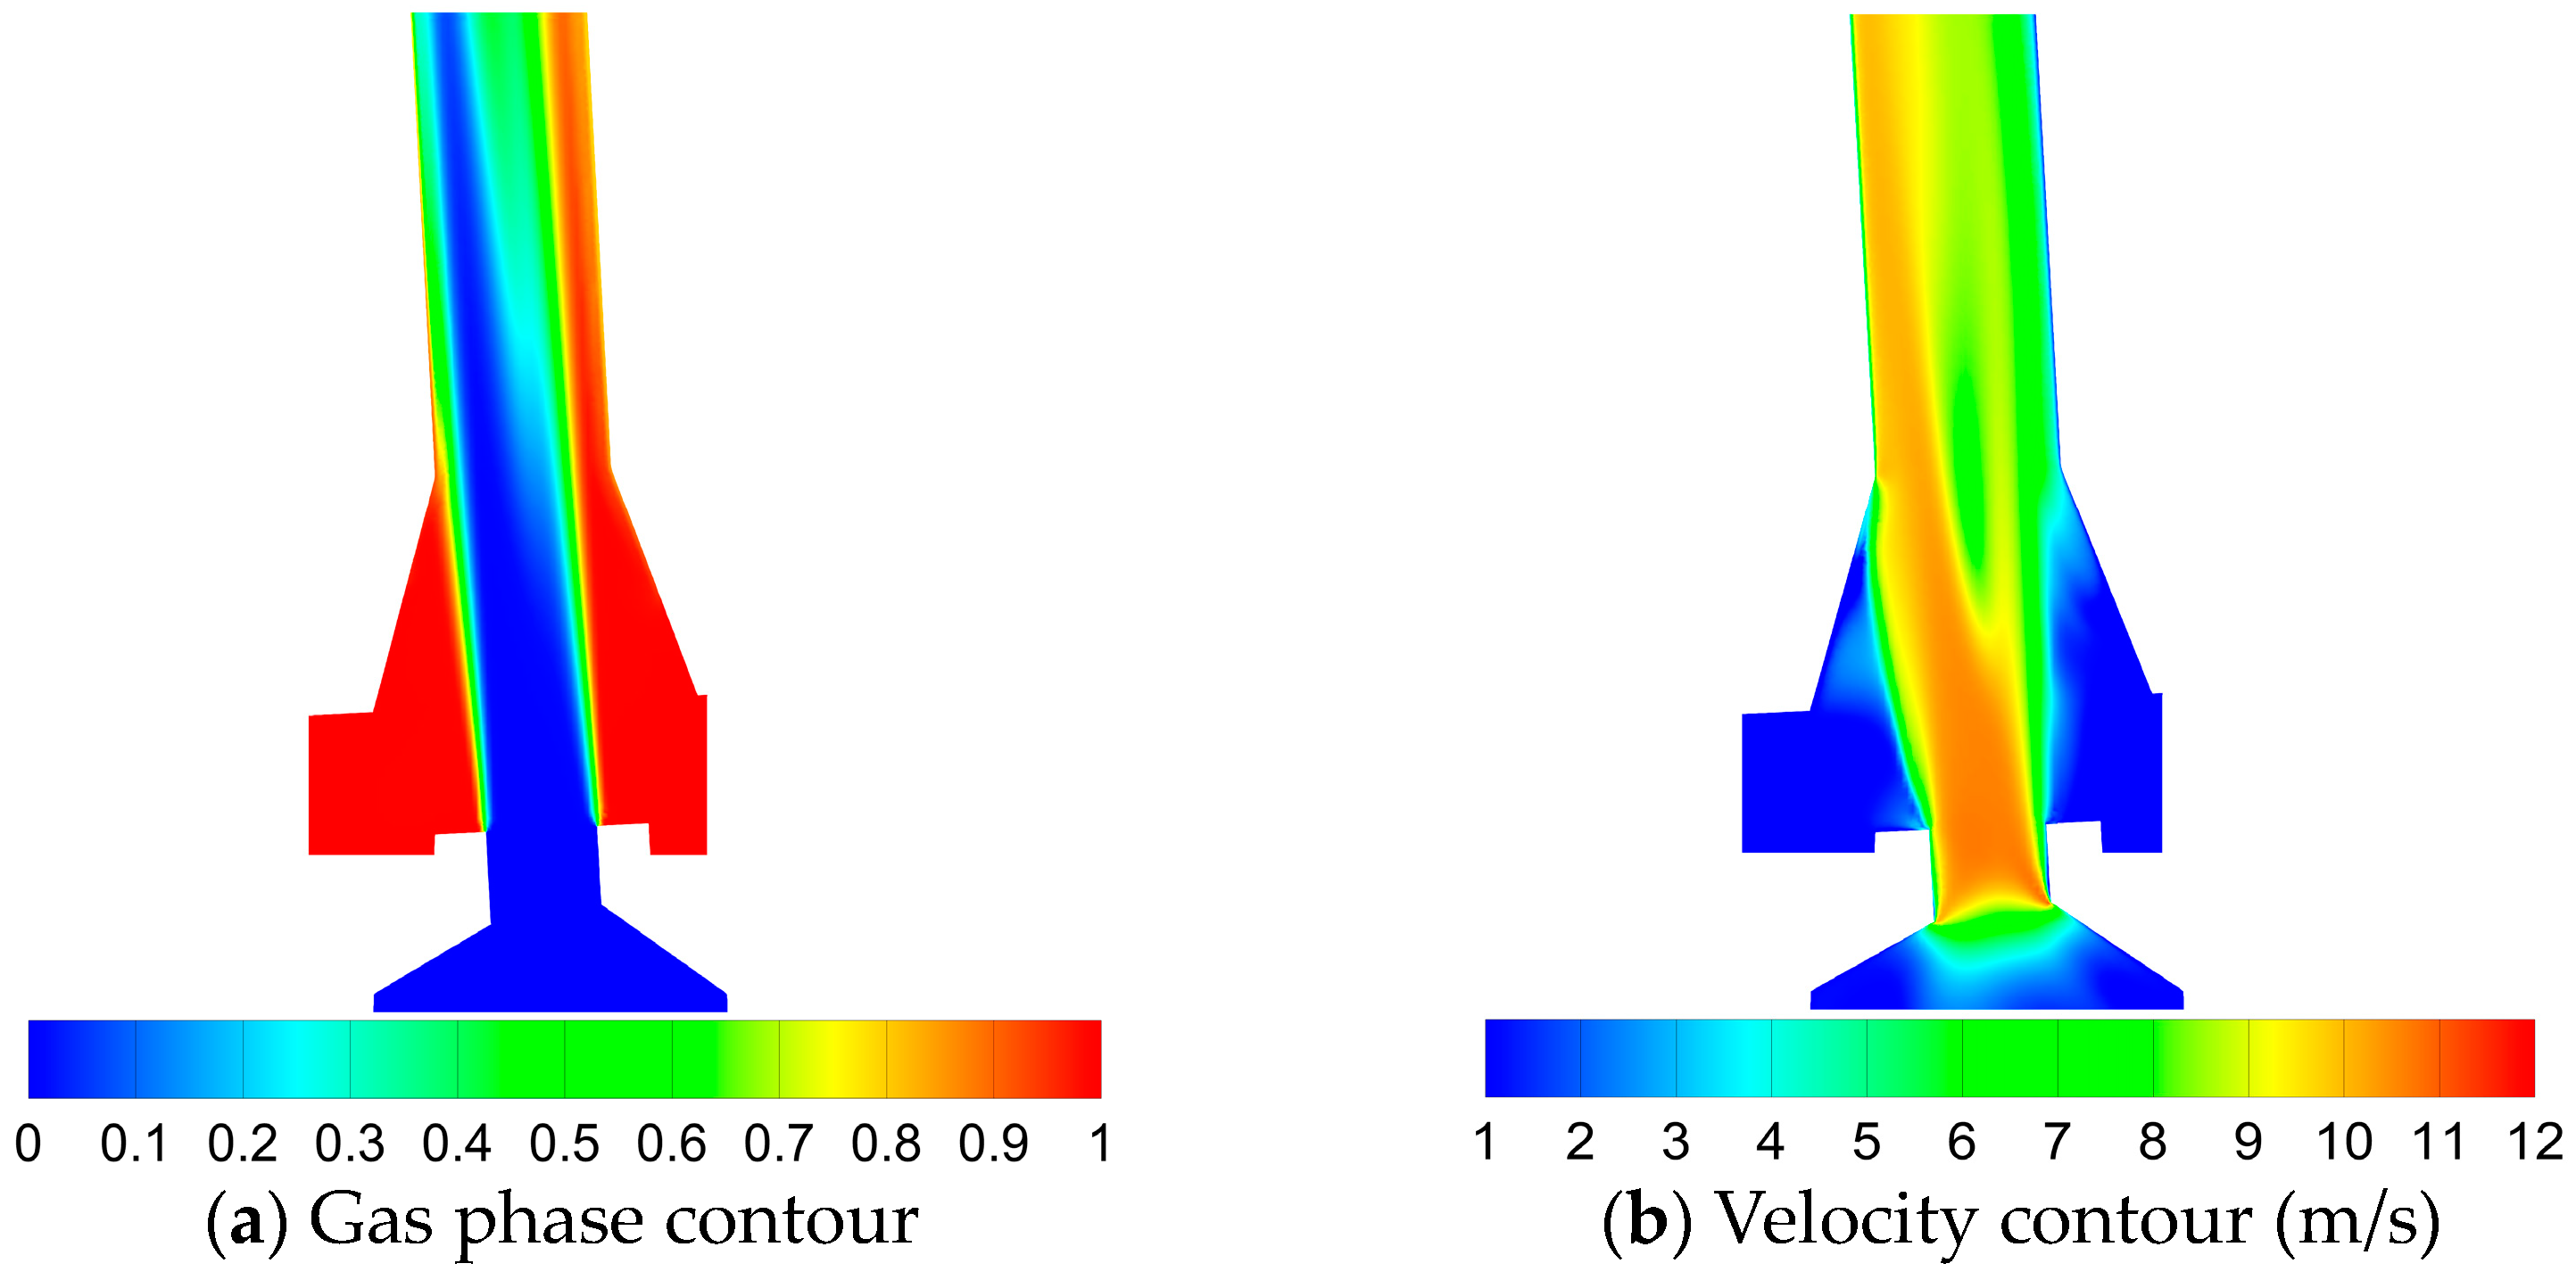
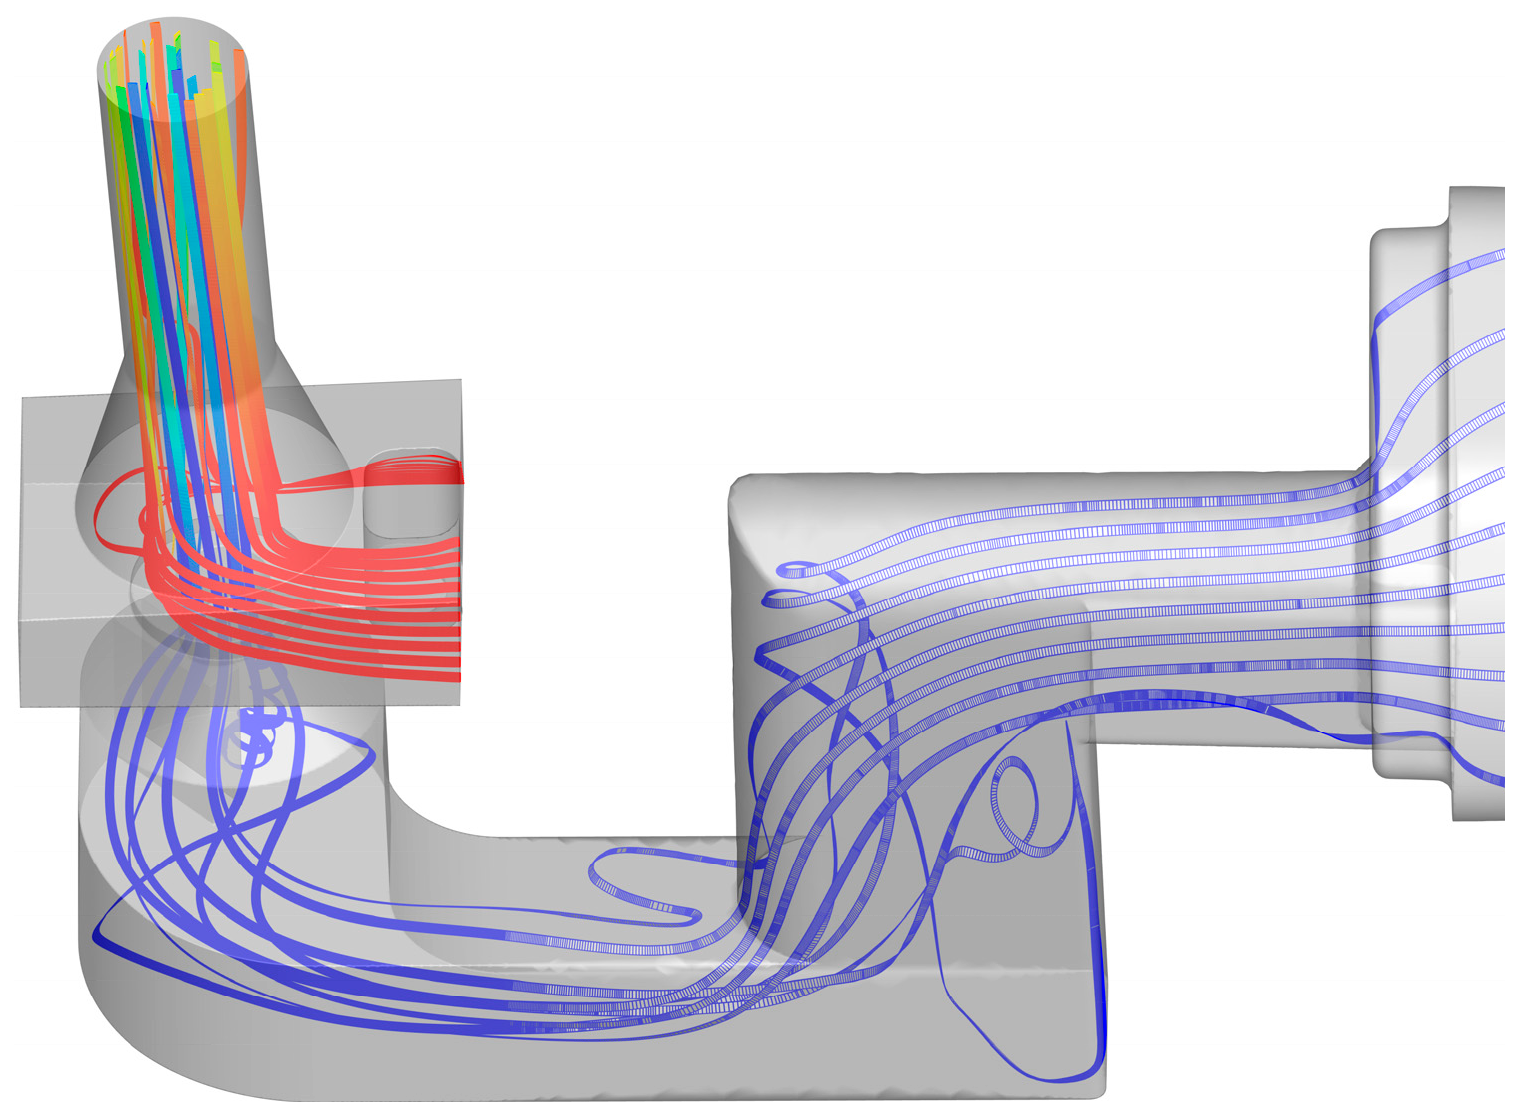
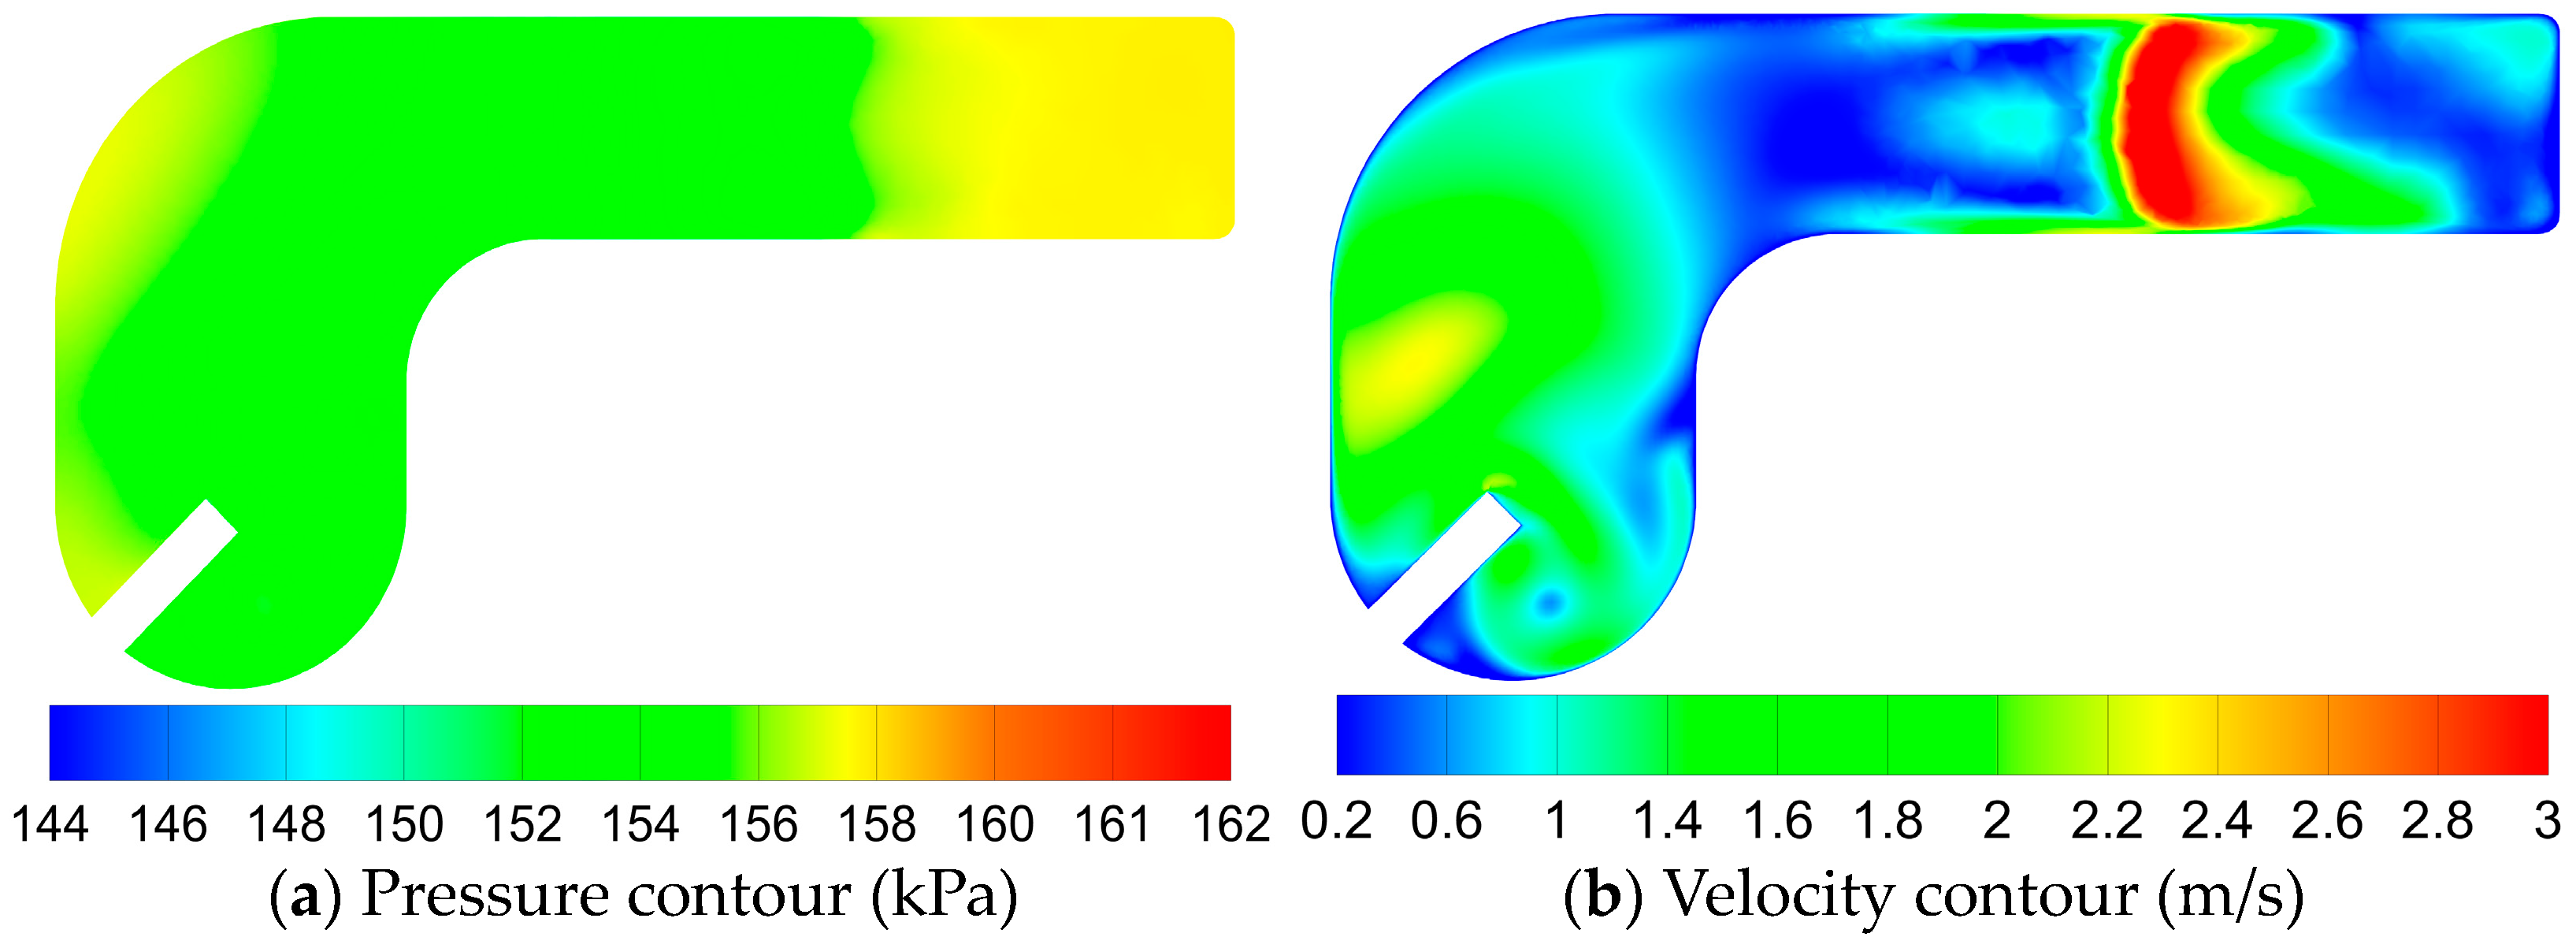
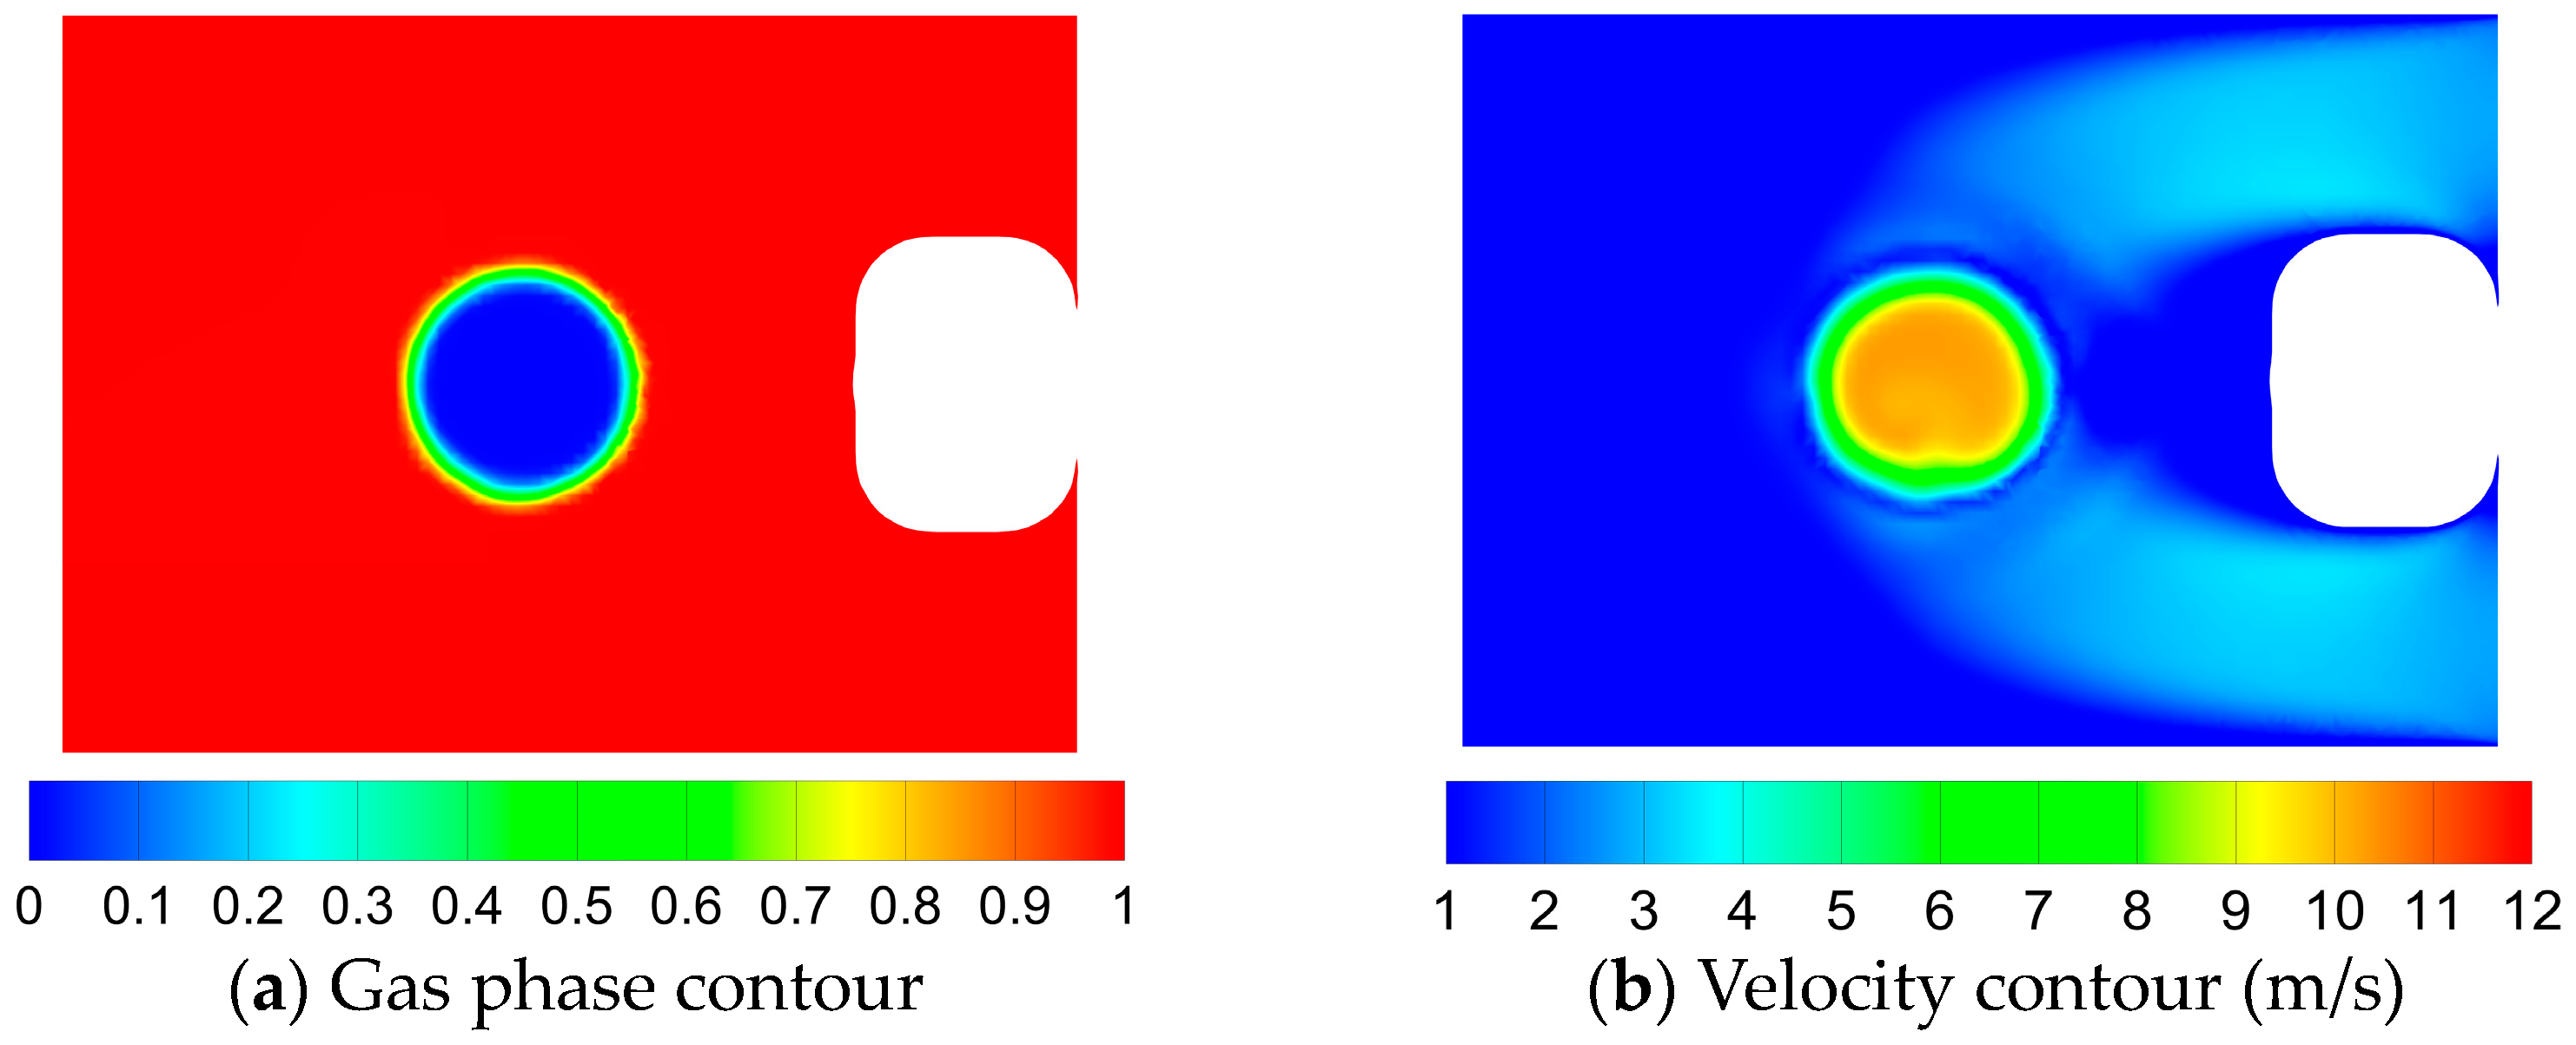
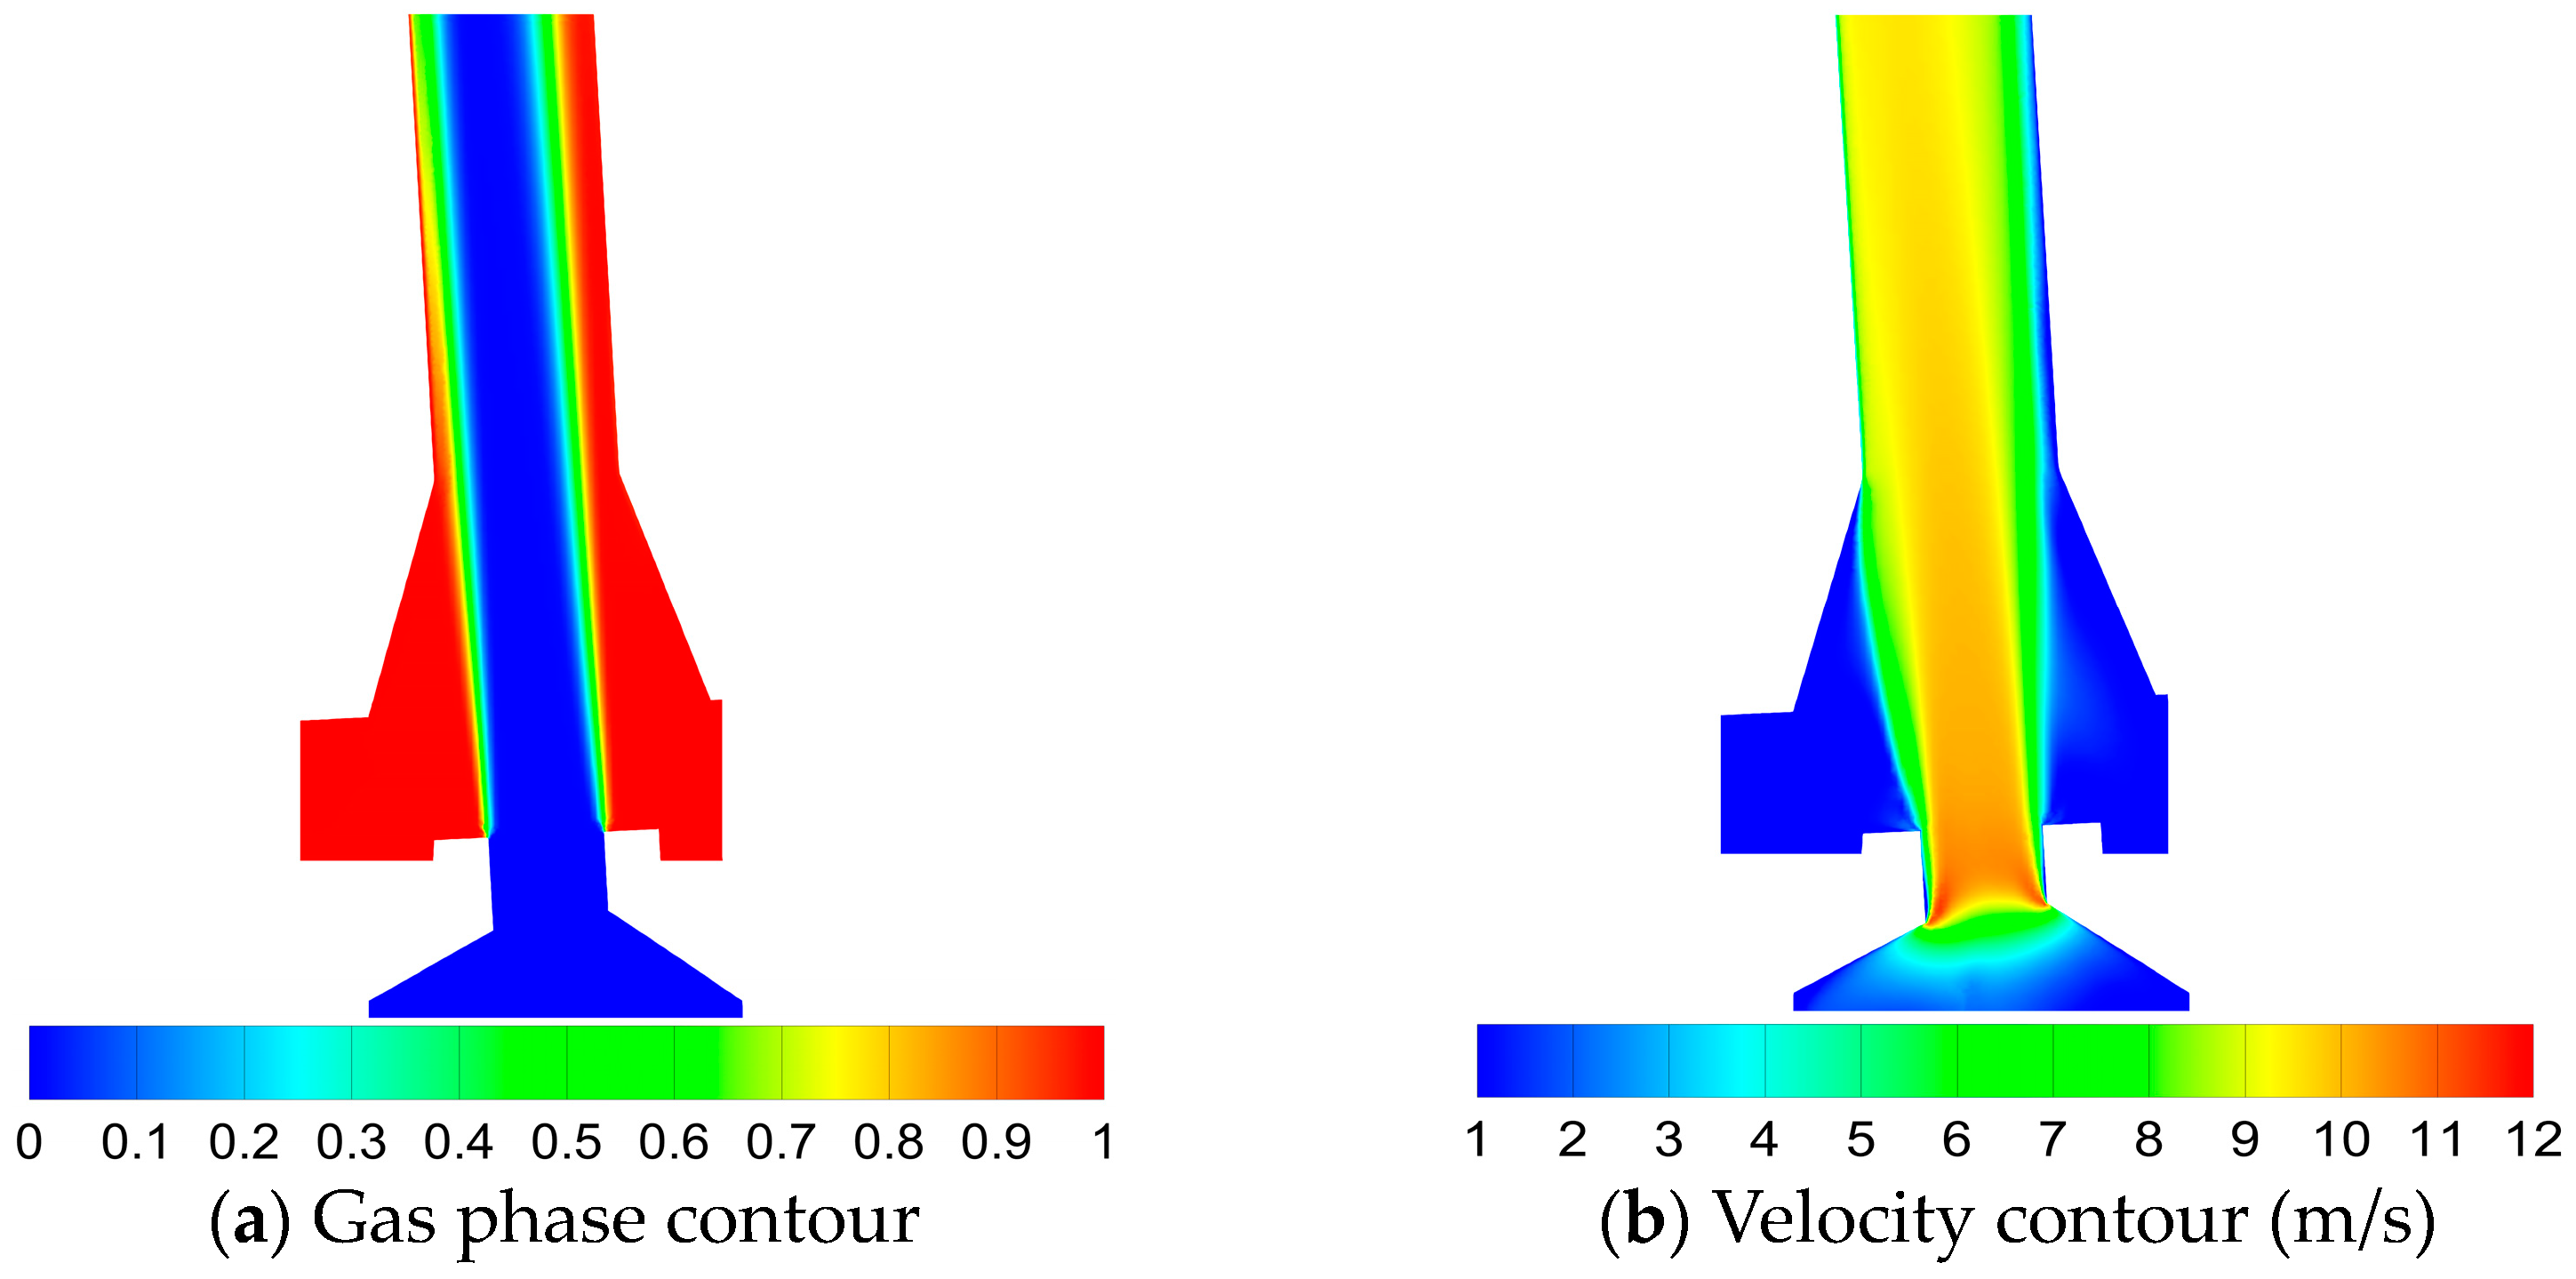
In Figure 7, three cross-sections, (a), (b), and (c), of the flow channel in the cleaning spray bar of the prototype intelligent toilet are depicted. Cross-section 1 represents the liquid phase flow, while cross-sections 2 and 3 represent the gas–liquid mixing regions. Figure 8 displays the three-dimensional flow diagram of the gas–liquid mixture in the cleaning spray bar prototype. The flow characteristics of cross-section 1 are depicted in Figure 9, with Figure 9a presenting the pressure contour and Figure 9b presenting the velocity contour. The flow field details for cross-section 2 are illustrated in Figure 10. Figure 10a displays the gas phase contour, while Figure 9b presents the velocity contour. Furthermore, Figure 11 depicts the flow field details in cross-section 3, with Figure 11a showcasing the gas phase contour and Figure 11b illustrating the velocity contour.
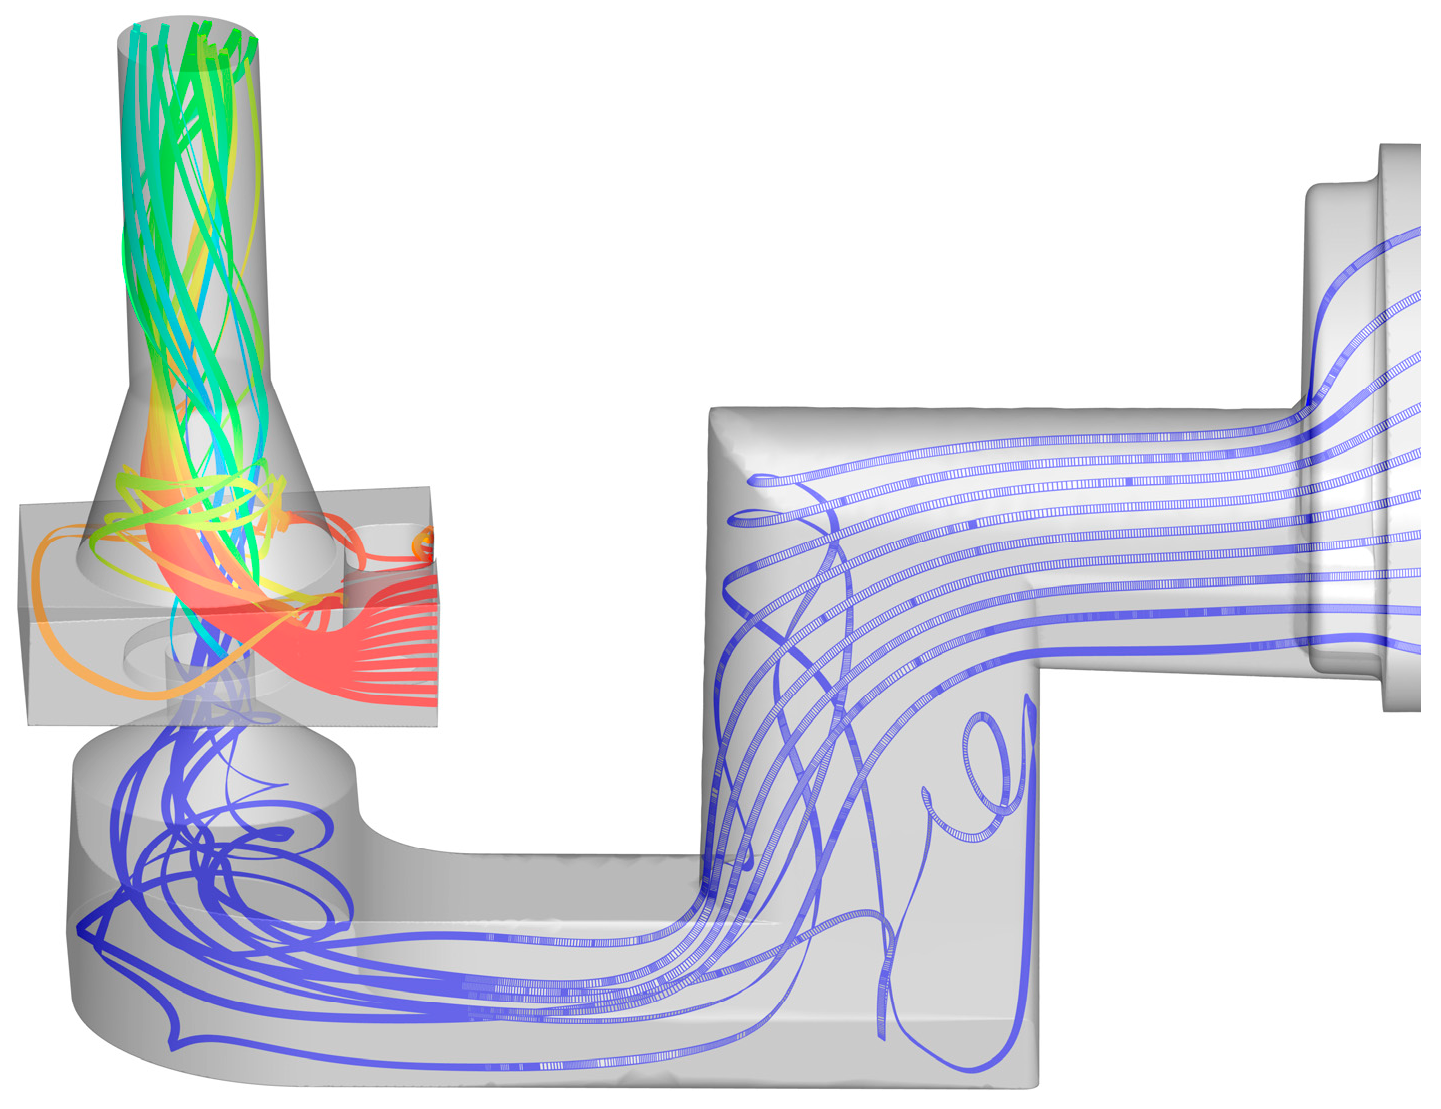
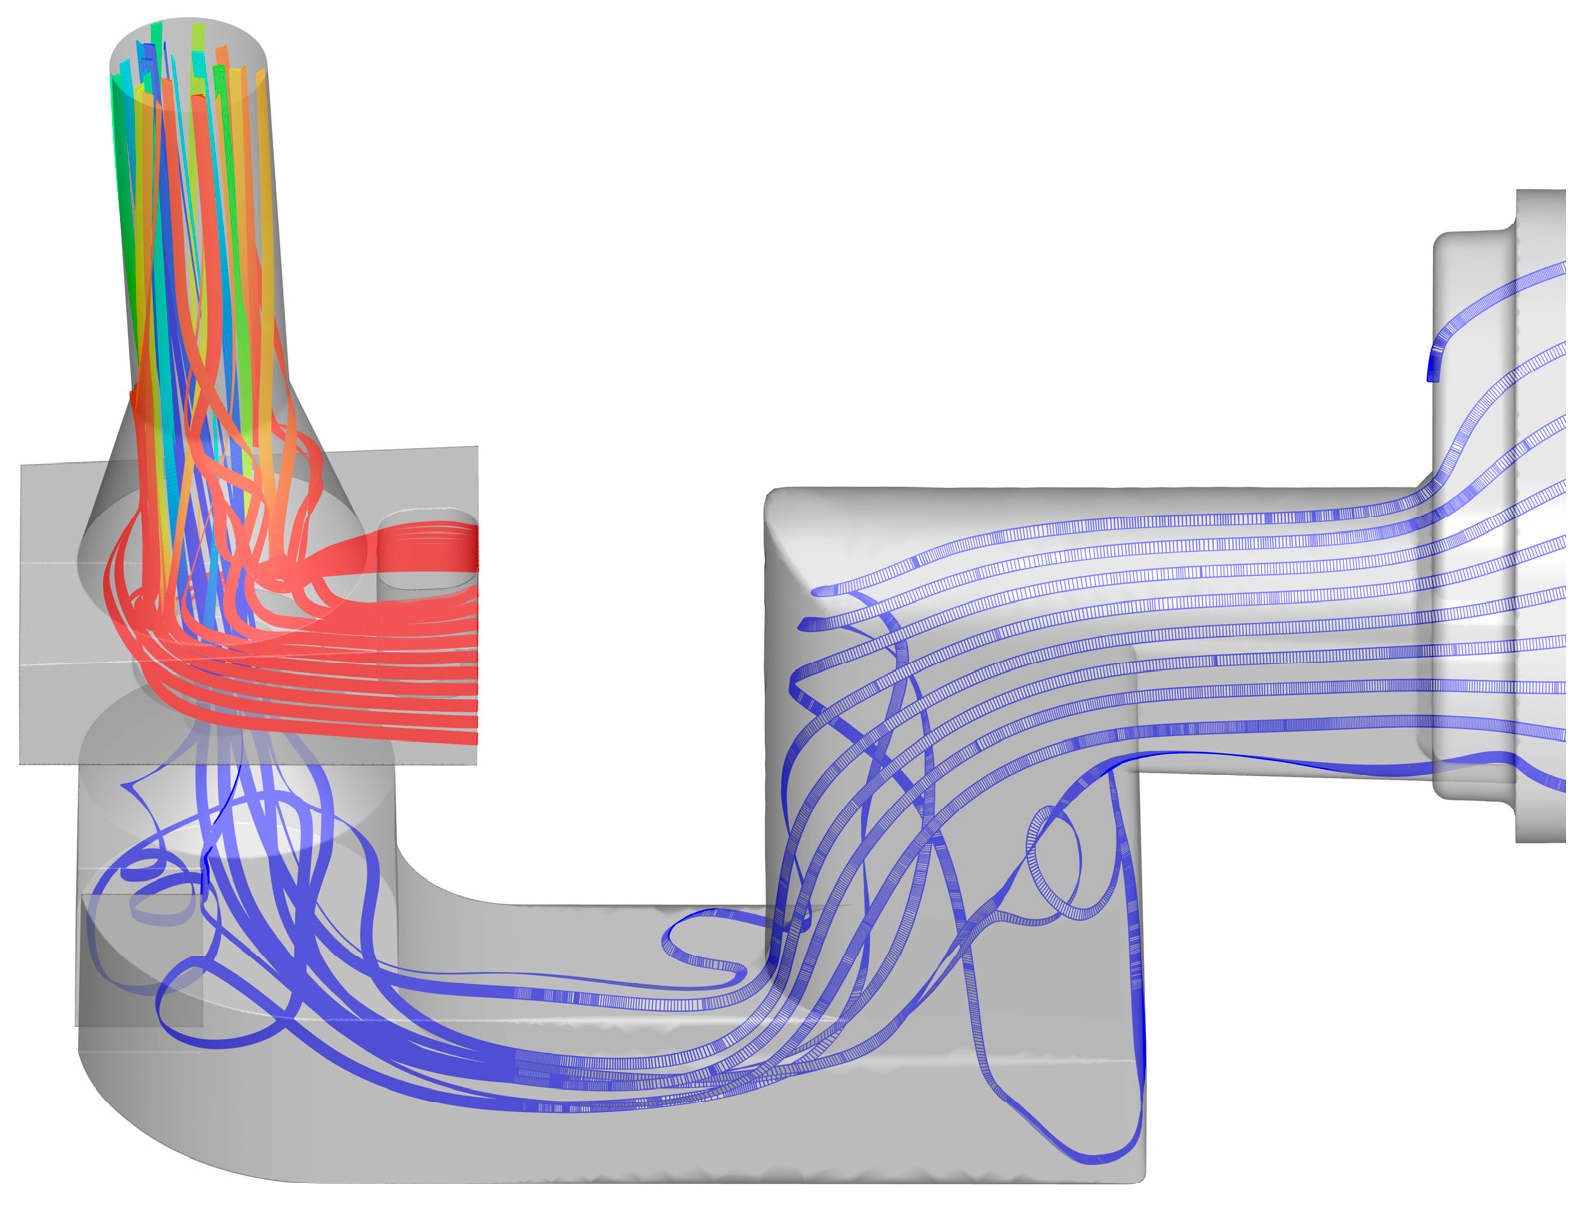
In Figure 8, when water flows into the spray bar through the diversion pipe, it generates an upward spiral flow below the spray bar. This swirling motion is induced by a 90° right angle bend located in the lower section of the spray bar. Based on the analysis of Figure 9a,b, there is a considerable variation in the pressure and velocity of the water flow along the walls of the spray bar bend. Notably, the wall pressure and flow rate exhibit significant disparities between the larger and smaller curvatures, with higher values observed at the larger curvature segment. These two different pressure and flow rates of the water flow through the elbow will be mutual friction and collision. The pressure and speed of the larger water flow will impact the other pressure and speed of the smaller water flow, resulting in the formation of an upward spiral.
Figure 9 and Figure 10 demonstrate detailed cross-sections of the flow field regarding gas–liquid mixing. By observing the gas phase contour maps of the two cross sections in Figure 10a and Figure 11a, it is evident that the gas–liquid mixing within the prototype clean spray bar is characterized by chaotic and unstable behavior, primarily induced by the presence of intense swirling flow. There is a large buildup of gas at the exit of the prototype cleaning spray bar, causing the gas–liquid mixing to slow down dramatically at the exit of the spray bar. This results in a reduction in the amount of suction from the prototype cleaning spray bar. By observing the velocity contours of the two cross-sections in Figure 10b and Figure 11b, the air intake at the air inlet on both sides of the prototypical cleaning spray bar is not uniform due to the presence of a stronger cyclonic flow, which in turn can explain why the gas–liquid mixing of the cleaning spray bar is unstable and the pumped gas flow rate is low. This affects the efficiency of the cleaning spray and reduces the comfort of the user.
4. Optimization of the Spray Bar
4.1. Development of the Optimization Scheme
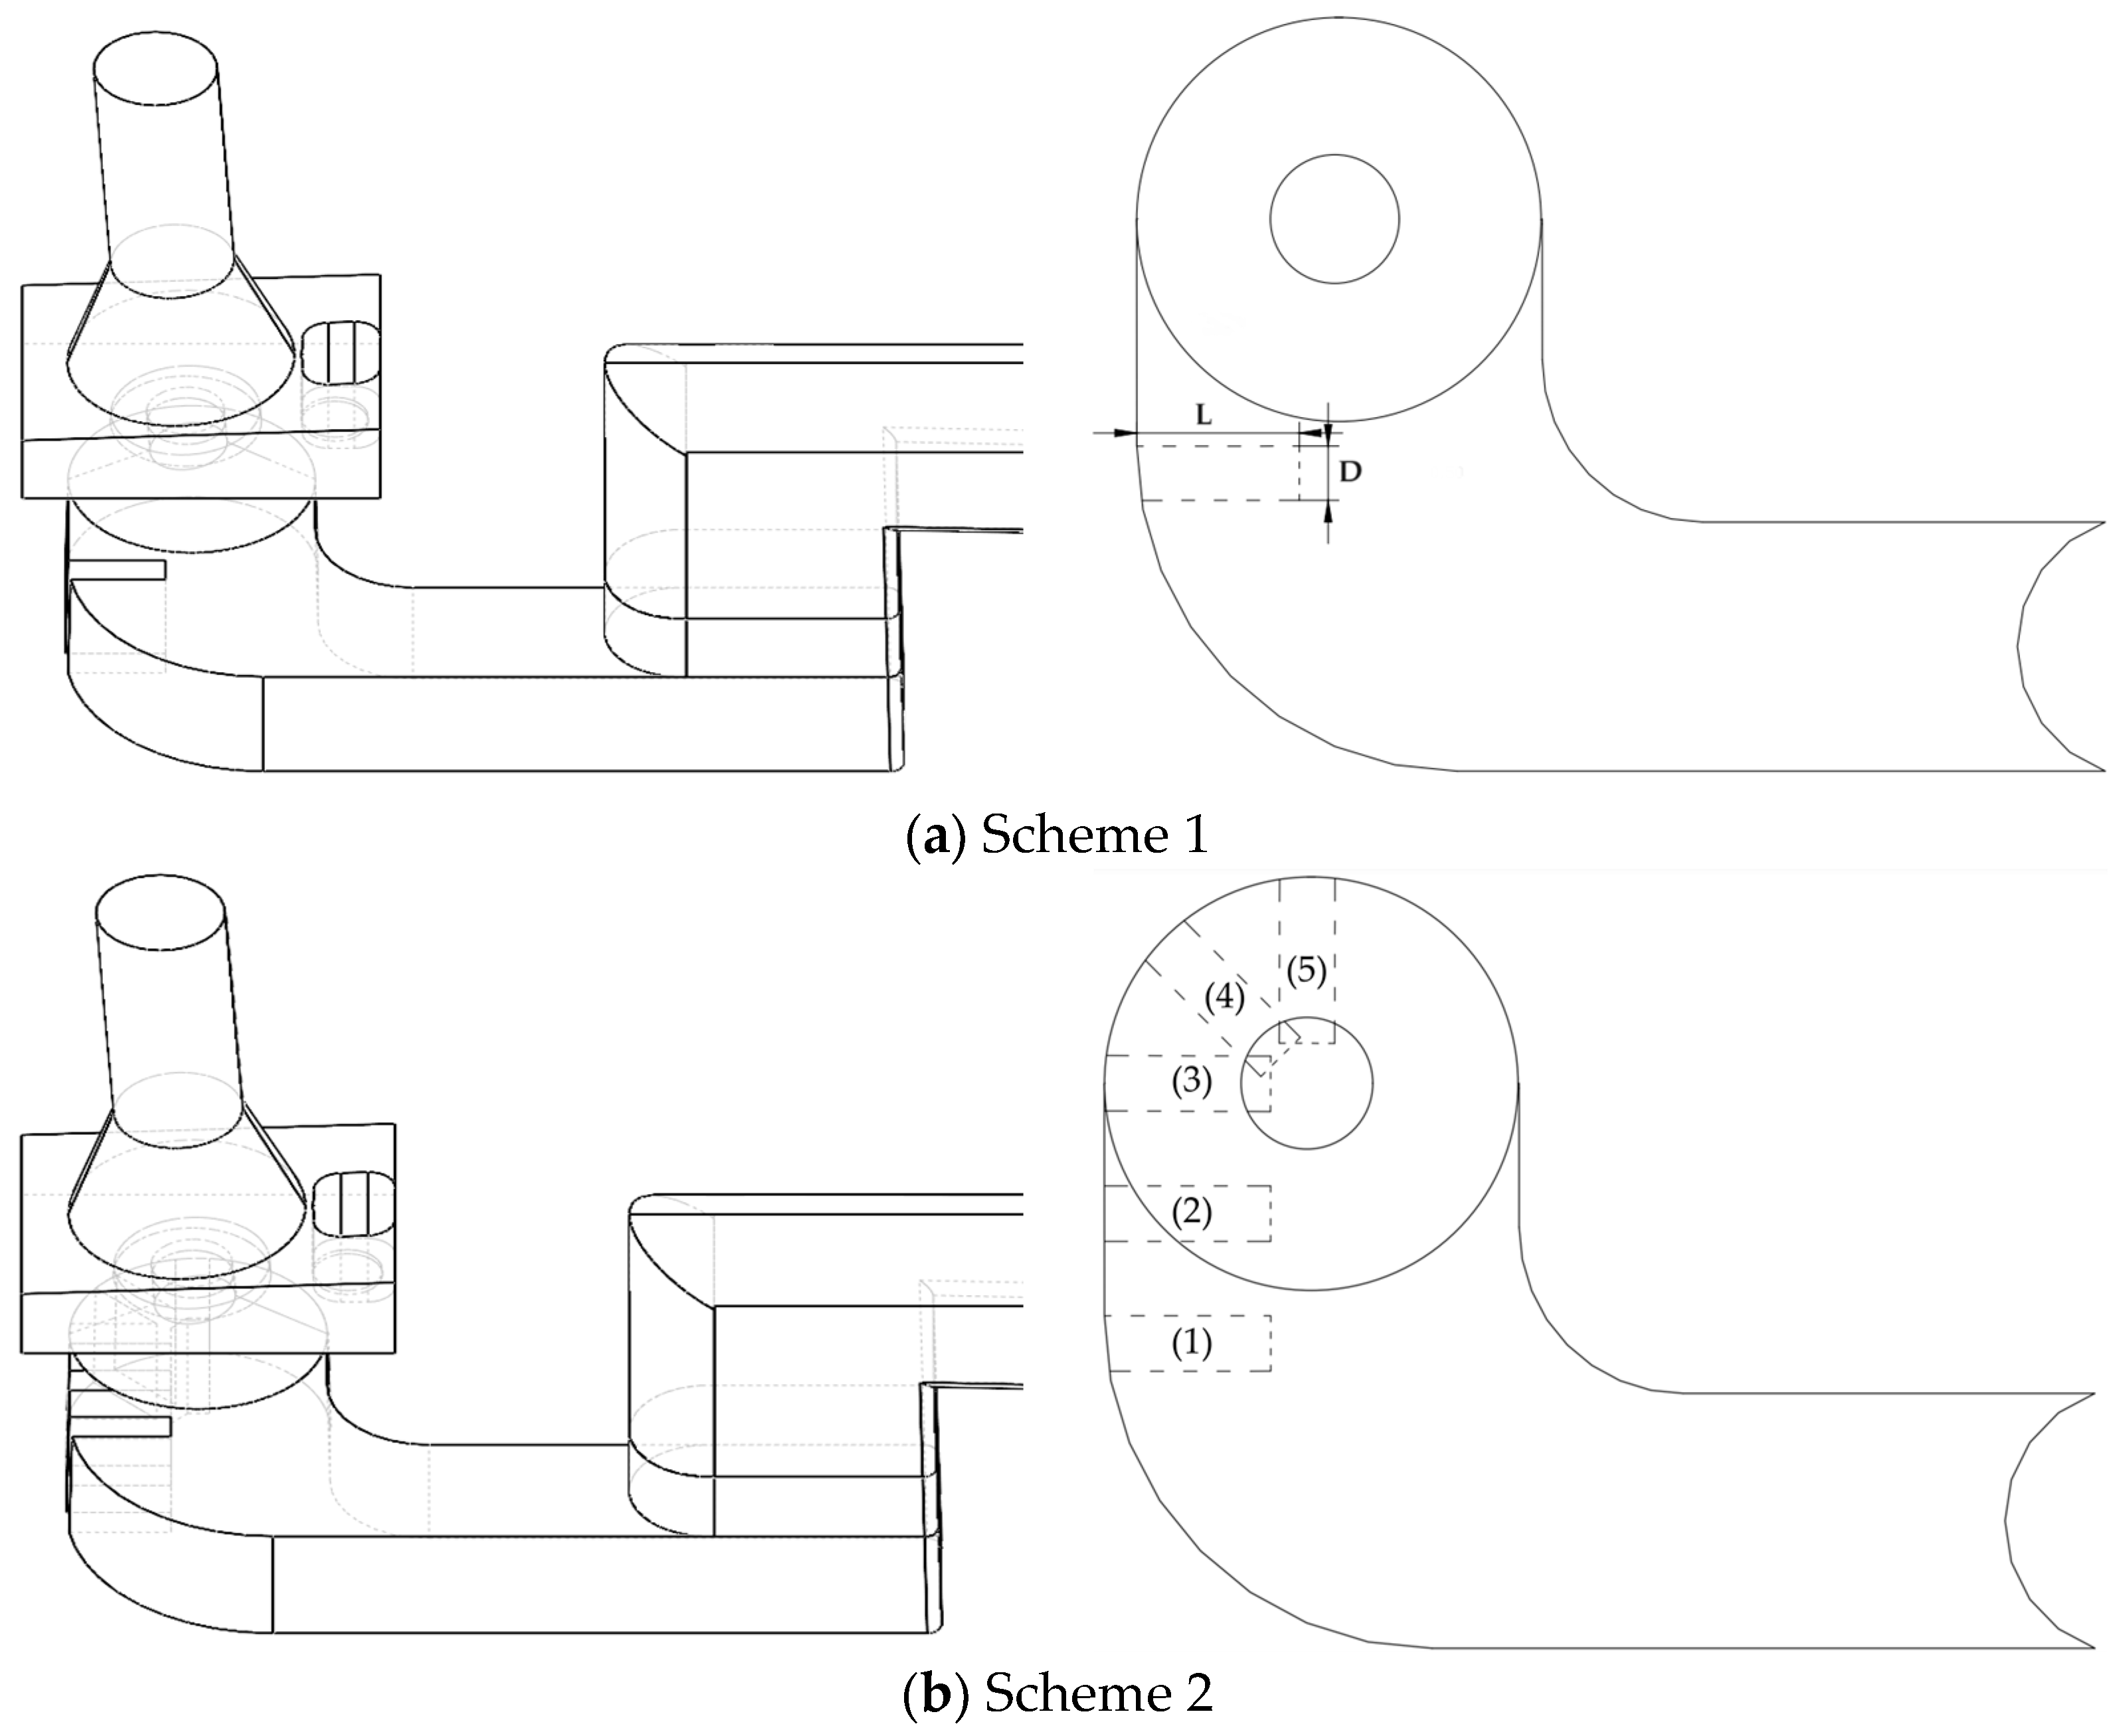
Based on the analysis above, it is evident that in the prototype model, the presence of a 90° curved pipe duct in the cleaning spray bar of the intelligent toilet results in the generation of a highly turbulent swirling flow within the flow channel. This uneven mixing of gas and liquid adversely impacts the efficiency of the intelligent toilet system and the user experience. To address this issue and achieve a more stable gas–liquid mixture, two optimization schemes for the flow channel structure were proposed, as depicted in Figure 12.
- (1)
- Figure 12a involves the placement of a small block at the end of the 90° bend in the channel. The specific location of the block is shown in Figure 12a, with a block width (D) of 0.5 mm. The block length (L) is set at four different values: 0.5, 1, 1.5, and 2 mm for the four different simulations corresponding to the four programs.
- (2)
- Figure 12b is an extension of Figure 12a, where the optimal block length determined from Figure 12a is selected. This optimal length is then used to place blocks at four distinct positions, namely (2), (3), (4), and (5), as shown in Figure 12b. Subsequently, simulations are conducted for each of these four schemes.
4.2. Calculation Results and Analysis of the Optimization Schemes
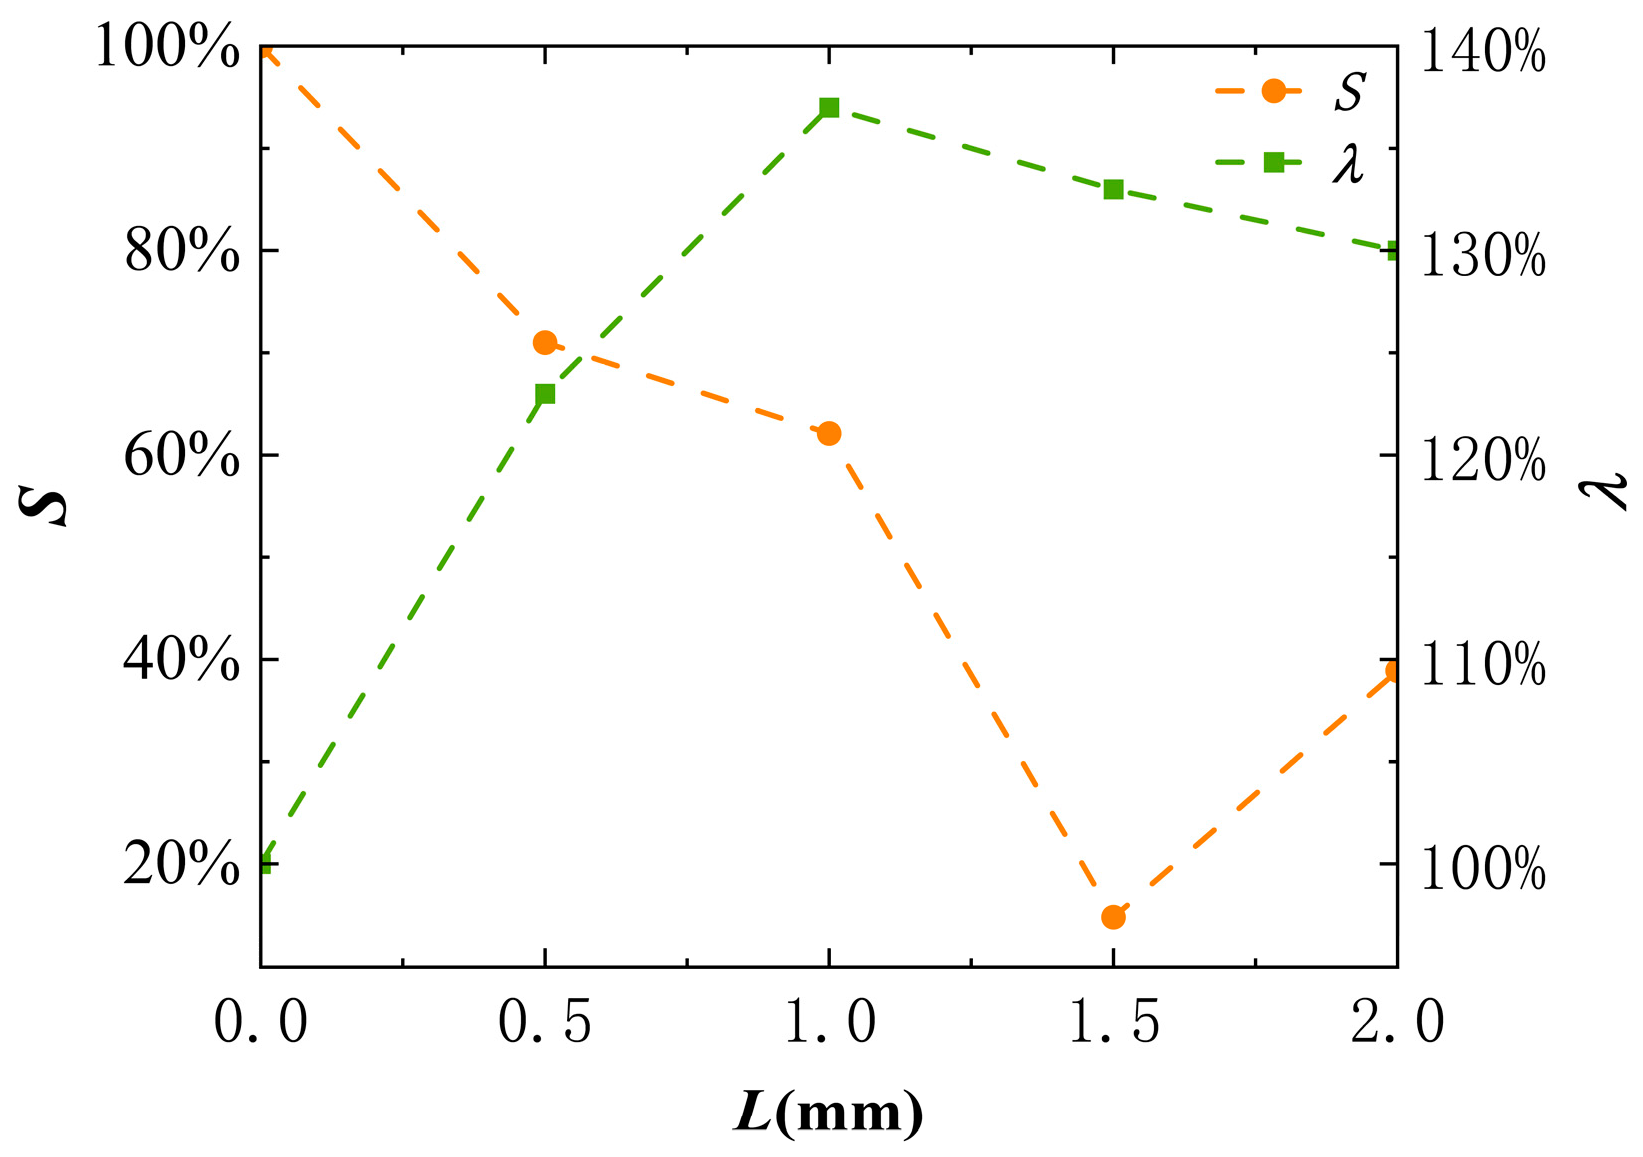
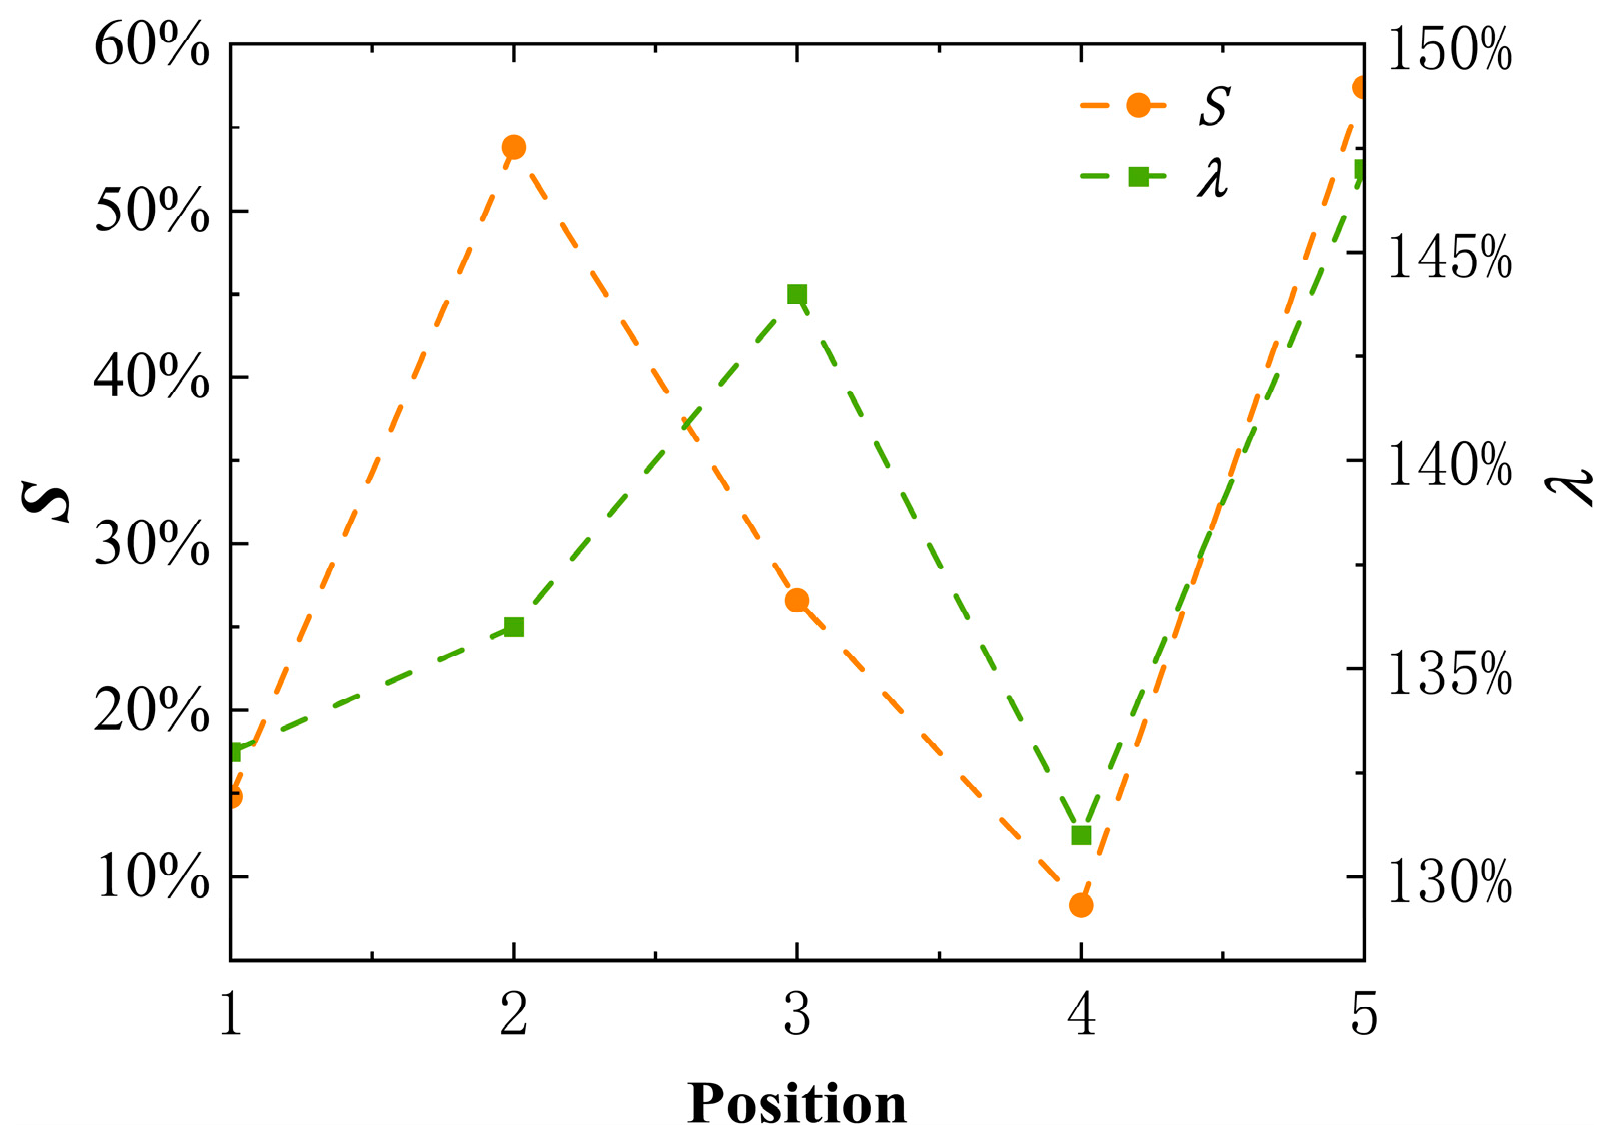
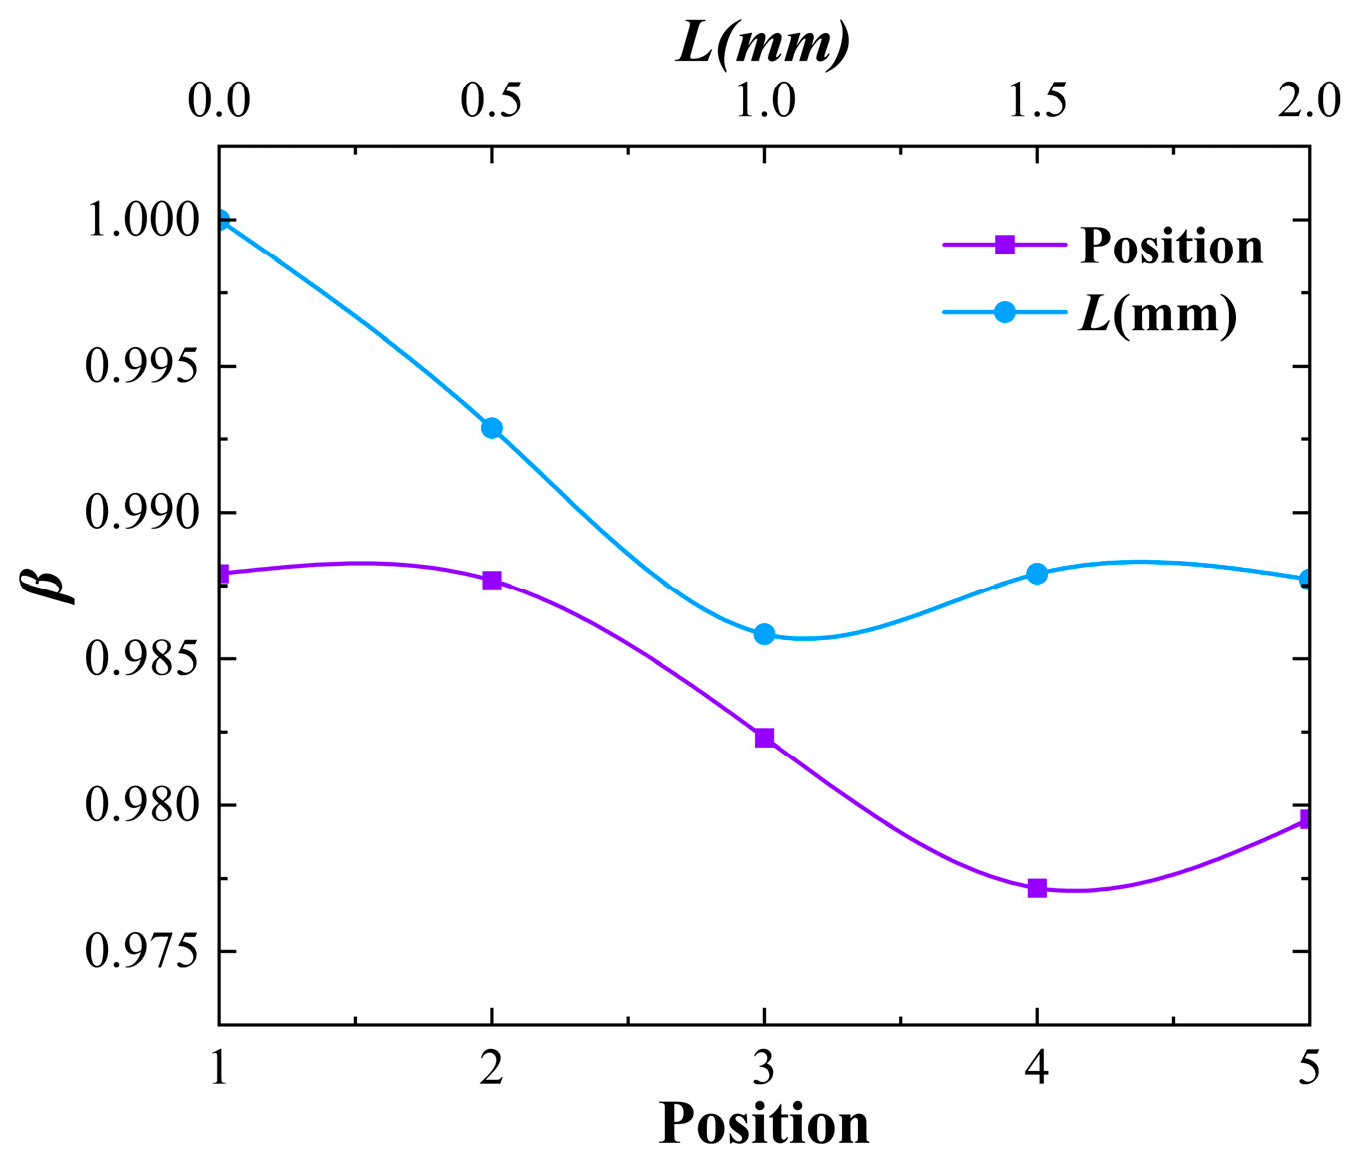
The simulation results of the optimized schemes were compared with the prototype, focusing on the swirl number, air intake, and inlet static pressure of the spray bar structure. Figure 13, Figure 14 and Figure 15 present the comparison results. With regards to optimization schemes 1 and 2, Figure 12 shows that as the position L increases from 0.5 mm to 2 mm, the swirl number S decreases to 71%, 62.1%, 14.8%, and 38.9% compared to the prototype, respectively. Additionally, the suction volume ratios λ are 123%, 137%, 133%, and 130%, respectively. When comparing L = 1 mm and L = 1.5 mm, it is observed that the swirl number, S, is 47.3% higher for L = 1 mm than for L = 1.5 mm. Conversely, the air intake ratio, λ, is only 7% higher for L = 1 mm compared to L = 1.5 mm. Thus, L = 1.5 mm is determined to be the optimal length in optimization Figure 12a. Figure 14 reveals that for a fixed block of length L, as the position of the block changes from (1) to (5), the swirl number S decrease from the prototype by 14.8%, 53.8%, 26.6%, 8.3%, and 57.4%, respectively. Similarly, the air intake volume ratios λ rise from the prototype by 133%, 146%, 144%, 131%, and 147%, respectively. The swirl number of the spray bar at position (4) is the lowest, only 8.3% of the prototype, and the air intake volume ratio λ is 131%. Therefore, position (4) is considered to be the best position for optimization Figure 12b. Based on Figure 15, the static pressure ratio β reaches its minimum value at position (4), where the static pressure at the inlet is the lowest and the pressure consumption is minimized. Among the two optimization schemes, position (4) in optimization Figure 12b exhibits the most favorable performance.
The simulation results reveal a significant decrease in the swirl number achieved by optimizing the structure of the spray bar channels. The optimized design of the channels enhances flow stabilization, minimizing the swirl effect caused by the bends and resulting in reduced energy loss. Additionally, the gas–liquid mixing region demonstrates a more stable and uniform velocity field, effectively improving suction and greatly enhancing the performance of the clean spray bar. This, in turn, enhances the overall user experience.
For the spray bar channel optimization scheme described above in this paper, Figure 16, Figure 17, Figure 18 and Figure 19 correspond to the flow field data for L = 1.5 mm in optimization Figure 12a, and Figure 20, Figure 21, Figure 22 and Figure 23 correspond to the flow field data for position (4) in optimization Figure 12b.
A comparison of the flow diagrams, as depicted in Figure 8 for the spray bar prototype, Figure 17 for optimized Figure 12a (L = 1.5 mm), and Figure 20 for optimized Figure 12b (position (4)), clearly demonstrates that Figure 8 exhibits a more prominent and widespread swirling pattern at the spray bar outlet. The occurrence of cyclonic flow also exists in the flow diagram of Figure 16, but the intensity and range of the swirl shown in Figure 16 are significantly weaker than those shown in Figure 8. On the other hand, no obvious swirl can be seen in the flow diagram of Figure 20, and the flow lines at the spray bar outlet are all very uniform and straight. Based on the observations, there is minimal to no presence of swirling in the flow diagram of this model.
Figure 9 is compared with Figure 17 and Figure 21 to analyze the pressure and velocity variation between the inner and outer walls of the bend when water flows through it. In Figure 17, the presence of the block results in the consumption of the majority of water flow energy on the outer wall, thereby reducing the pressure and velocity of the water flow on the outer wall. This subsequently reduces the difference in pressure and velocity between the water flows on the inner and outer walls. However, due to the block’s constrained placement, it is unable to maintain a uniform pressure and velocity between the inner and outer water flows. As a result, the two flows still exhibit differences in both pressure and velocity, leading to continued collision and rubbing between the two streams. Consequently, a swirling flow persists when the two streams collide and interact. In Figure 21, the position of the block in the optimization model has been altered, bringing it closer to the center of the swirl. As a result, the water flow on the outer wall and the inner wall encounter collision and friction with the block at the central point. This interaction causes a dissipation of energy from the water flow on the outer and inner walls, leading to a reduction in the pressure and velocity. Consequently, the difference between the velocities and pressures on the two walls narrows, effectively eliminating the swirl. It should be noted that the block is positioned towards the center of the outer wall because the water flow on the outer wall has a higher pressure and velocity.
The flow field details of cross-section 2 and cross-section 3 of the prototype are compared with those of cross-section 2 and cross-section 3 of the optimized Figure 12a (L = 1.5 mm) and optimized Figure 12b (Position (4)). The gas–liquid mixing of the optimized Figure 12a (L = 1.5 mm) is illustrated in Figure 18a for the gas phase contour of cross-section 2 and Figure 19a for the gas phase contour of cross-section 3. A comparison with Figure 10a and Figure 11a reveals that the gas–liquid mixing in the optimized Figure 12a (L = 1.5 mm) is noticeably more stable and homogeneous. Only a small amount of unstable gas–liquid mixing is observed, in contrast to the significant gas–liquid chaos and pile-up phenomenon observed in the prototype. Comparing Figure 18b and Figure 19b with Figure 10b and Figure 11b, it becomes evident that the optimized Figure 12a (L = 1.5 mm) exhibits a reduced swirl number compared to the prototype. This reduction in swirl results in a more uniform inlet velocity and a stable mixing with the liquid phase. Consequently, there is a decreased energy loss in the gas–liquid phases during their stable state, leading to an increased flow rate and enhanced air intake. Examining Figure 22a and Figure 23a for the optimization Figure 12b (position (4)), the gas-phase contour diagrams indicate a higher stability when compared to Figure 18a and Figure 19a. In this optimization scheme, there is minimal gas–liquid mixing chaos, ensuring a highly stable gas–liquid mixture. Furthermore, Figure 22b and Figure 23b demonstrate that this optimized model, with the lowest swirl number, exhibits the most uniform velocity contour at the inlet and the most stable gas–liquid mixing, resulting in the least energy loss during the mixing process.
5. Conclusions
- (1)
- The optimization presented in this study for the cleaning spray model of intelligent toilets effectively reduces the swirl number, increases the air intake, and minimizes the pressure loss. These substantial enhancements significantly improve the overall user comfort of intelligent toilets. With the same inlet flow rate, the block width (D) in optimization Figure 12a is 0.5 mm, and the optimal block length (L) is determined to be 1.5 mm (L = 1.5 mm). At these settings, the swirl number reaches 14.8% of the prototype, while the air intake increases to 133% of the prototype. In optimization Figure 12b, among the five block positions, the optimal position is identified as position (4). The number of swirls of this optimized scheme is 8.3% of the prototype, with an air intake reaching 131% of the prototype. Overall, Figure 12b, with the optimal block position (4), represents the optimal solution derived in this study.
- (2)
- Among the optimization schemes evaluated in this study, the optimized model with the highest air intake corresponds to block position (5) in optimization Figure 12b. The achieved air intake and swirl number achieved by this optimized model are 147% and 57.4% of the prototype, respectively. Compared to the optimized model with block position (4) in optimization Figure 12b, this model exhibits a 16% increase in air intake and a 49.1% increase in swirl number. Hence, we conclude that there is no direct correlation between the swirl number and the air intake, and it is incorrect to assume that lower swirl numbers result in higher air intake. Facing different scenario requirements, different models are used.
- (3)
- The optimization models employed in this study reveal that the β value associated with Figure 12b is generally lower in comparison to Figure 12a. Notably, the position (4) model within Figure 12b exhibits the lowest β value. The findings suggest that altering the block position is more effective in reducing pressure loss in the cleaning spray bar compared to adjusting the block length.
- (4)
- The simulation calculations and results of this paper can not only be used to improve the structural performance of the intelligent toilet cleaning spray bar channel and enhance the competitiveness of the product but also can be applied to the structure of fire water cannons with similar flow channels, pumping station inlet channels, and liquid–gas ejectors by applying the optimized structure and simulation calculations of this paper to improve the strength of their swirling, the eccentricity of the ejectors, and the air intake, as well as other problems.
- (5)
- Based on this study’s findings, several recommendations can be proposed for future research. New simulation calculations should be performed by modifying the block’s shape or altering the overall structure of the spray in intelligent toilets. Further research is warranted to strive for a solution design that maximizes air intake, minimizes pressure loss, and effectively suppresses the swirling effect.
Author Contributions
Conceptualization, Q.Z.; methodology, C.Z.; validation, X.Y.; formal analysis, J.C.; writing—original draft preparation, Q.Z.; writing—review and editing, Q.Z.; supervision, J.M. All authors have read and agreed to the published version of the manuscript.
Funding
This research was funded by the Zhejiang Provincial Science and Technology Plan Project of China (Grant No. 2021C01052).
Institutional Review Board Statement
Not applicable.
Informed Consent Statement
Not applicable.
Data Availability Statement
The data presented in this study are available on request from the corresponding author. The data are not publicly available because the data of this Intelligent toilet product involves the manufacturer’s trade secrets.
Conflicts of Interest
The authors declare no conflict of interest.
Nomenclature
| CFD | Computational fluid dynamics |
| q | Flow ratio of the liquid–gas ejector |
| Qp | Inflow rate at the liquid–gas ejector water inlet |
| Qs | Inflow rate at the liquid–gas ejector suction port |
| h | Pressure ratio of the liquid–gas ejector |
| Po | Outlet pressure of the liquid–gas ejector |
| Ps | Pressure at the liquid–gas ejector water inlet |
| Pp | Pressure at the liquid–gas ejector suction port |
| η | Efficiency of the liquid–gas ejector |
| S | Outlet swirl number |
| uz | Average value of axial velocity on the cross-section |
| uθ | Average value of tangential velocity on the cross-section |
| R | Diameter of the cross-section |
| r | Radius of the cross-section |
| λ | Ratio of the suction volume of the optimized model of the clean spray bar to that of the prototype |
| Qa−n | Suction volume of the optimized model (m3/h) |
| Qa−o | Suction volume of the prototype (m3/h) |
| β | Ratio of the static pressure at the inlet of the optimized model of the clean spray bar to that of the prototype |
| Pw−n | Static pressure at the inlet of the optimized model (Pa) |
| Pw−o | Static pressure at the inlet of the prototype (Pa) |
| M | Mass flow ratio of the liquid–gas ejector |
| η | Efficiency of the liquid–gas ejector |
| k | Turbulent kinetic energy |
| ε | Turbulent kinetic energy dissipation rate |
| Pk | Turbulent kinetic energy generated by the velocity gradient |
| Pb | Turbulent kinetic energy generated by buoyancy |
References
- Brdjanovic, D.; Zakaria, F.; Mawioo, P.M. eSOS®–emergency sanitation operation system. J. Water Sanit. Hyg. Dev. 2015, 5, 156–164. [Google Scholar] [CrossRef]
- Zakaria, F.; Ćurko, J.; Muratbegovic, A.; Garcia, H.A.; Hooijmans, C.M.; Brdjanovic, D. Evaluation of a Smart Toilet in an Emergency Camp. Int. J. Disaster Risk Reduct. 2018, 27, 512–523. [Google Scholar] [CrossRef]
- Bai, J.; Zhang, H.; Liu, J. Design of intelligent toilet for wheelchair-bed. Mach. Des. Res. 2010, 26, 121–124. (In Chinese) [Google Scholar]
- Kor, K.; Altun, G. Is Support Vector Regression Method Suitable for Predicting Rate of Penetration. J. Pet. Sci. Eng. 2020, 194, 107542. [Google Scholar] [CrossRef]
- Liu, Q. Research on the Anti-Interference Techniques of Control System for Intelligent Closes Tool Based on Atmega64. Master’s Thesis, Zhejiang University of Technology, Hangzhou, China, 2009. (In Chinese). [Google Scholar]
- Zhang, Y. The Design and Implementation of Smart Toilet Based on Atmega128. Master’s Thesis, Zhejiang University of Technology, Hangzhou, China, 2011. (In Chinese). [Google Scholar]
- Zhu, S.; Chen, Y.; Wang, H.; Xie, F. Design of control system for an intelligent closestool. In Proceedings of the 5th International Conference on Electrical Engineering and Automatic Control; Springer: Berlin/Heidelberg, Germany, 2016; pp. 743–749. [Google Scholar]
- Wang, H. Research of the Intelligent Network Closetool Ststem; Guangdong University of Technology: Guangzhou, China, 2005. (In Chinese) [Google Scholar]
- Cao, W. Research and Design of the Internet of Things Based on the Aging of the Smart Toilet; Hubei University of Technology: Wuhan, China, 2015. (In Chinese) [Google Scholar]
- Xu, H. The Study on the Constructing Health Life in Modern Bathroom; Jiangnan University: Wuxi, China, 2007. (In Chinese) [Google Scholar]
- Zhu, F. The Research of Skin Experience Design in Bathroom Products; Jiangnan University: Wuxi, China, 2010. (In Chinese) [Google Scholar]
- Gan, S.; Zhuang, Q.; Gong, B. Human-Computer Interaction Based Interface Design of Intelligent Health Detection Using PCANet and Multi-Sensor Information Fusion. Comput. Methods Programs Biomed. 2022, 216, 106637. [Google Scholar] [CrossRef] [PubMed]
- Wang, Z.; Wu, H.; Wei, W.; Luo, L.; Zhang, Y.; Zhao, C. Research on User Comfort of Intelligent Toilet Based on Ergonomics. In Advances in Usability, User Experience and Assistive Technology; Ahram, T.Z., Falcão, C., Eds.; Advances in Intelligent Systems and Computing; Springer International Publishing: Cham, Switzerland, 2019; pp. 664–672. [Google Scholar]
- Zhou, F.; Li, F. Design of the Appearance and Structure of an Integrated Testing Machine for Smart Toilets. Technol. Innov. Appl. 2019, 3, 89–90. [Google Scholar]
- Han, Y.; Chen, Y.; Liu, N. Fluid Simulation Analysis of Smart Toilet Seat Based on CFD Technology. Sci. Technol. Innov. 2021, 2, 75–77. (In Chinese) [Google Scholar]
- Zhang, H.; Sun, S.; Zhang, H. Design and Realization of Smart Toilet Flushing Water Temperature Performance Detection System. In Proceedings of the Third International Conference on Electronics and Communication, Network and Computer Technology (ECNCT 2021), Xiamen, China, 3–5 December 2021; pp. 239–245. [Google Scholar]
- Iyo, T.; Iwahori, K. The Effectiveness of Neutral Electrolyzed Water for Decontaminating the Spray Nozzles of Electric Tankless and Tank-Type Warm-Water Bidet Toilet Seats. Biocontrol Sci. 2022, 27, 193–200. [Google Scholar] [CrossRef]
- Iyo, T.; Asakura, K.; Omae, K. Effect of the Cleanliness of Spray Nozzle on the Concentration of Microorganisms in the Spray Water in Warm-Water Bidet Toilet Seats. Biocontrol Sci. 2022, 27, 153–162. [Google Scholar] [CrossRef]
- Zhang, H.; Zou, D.; Yang, X.; Mou, J.; Zhou, Q.; Xu, M. Liquid–Gas Jet Pump: A Review. Energies 2022, 15, 6978. [Google Scholar] [CrossRef]
- Ismagilov, A.; Spiridonov, E. Operational Process and Characteristics of Liquid-Gas Jet Pumps with the Ejected Vapor-Gas Medium. Procedia Eng. 2016, 150, 247–253. [Google Scholar] [CrossRef]
- Qiang, X.; Leijin, G. Review on Condensation Heat Transfer and Pressure Fluctuation Characteristics of Gas-Liquid Two-Phase Jet Flow. SST 2020, 50, 1274–1287. [Google Scholar]
- Miyashita, T.; Sugawa, O.; Imamura, T.; Kamiya, K.; Kawaguchi, Y. Modeling and Analysis of Water Discharge Trajectory with Large Capacity Monitor. Fire Saf. J. 2014, 63, 1–8. [Google Scholar] [CrossRef]
- Miyashita, T.; Sugawa, O.; Wada, Y.; Ishikawa, R.; Kawaguchi, Y. Development of Two-Dimensional Simple Simulation Model and Evaluation of Discharge Ability for Water Discharge of Firefighting. Bull. Jpn. Assoc. Fire Sci. Eng. 2012, 62, 13–19. [Google Scholar]
- Tsuzuki, N.; Weerachon, T.; Kikura, H. Comparison between Numerical and Experimental for UVP Measurement in Double Bent Pipe with Out-of-Plane Angle. JFCMV 2014, 2, 154–164. [Google Scholar] [CrossRef]
- Constantinescu, G.S.; Patel, V.C. Role of Turbulence Model in Prediction of Pump-Bay Vortices. J. Hydraul. Eng. 2000, 126, 387–391. [Google Scholar] [CrossRef]
- Bayeul-Lainé, A.C.; Simonet, S.; Bois, G.; Issa, A. Two-Phase Numerical Study of the Flow Field Formed in Water Pump Sump: Influence of Air Entrainment. IOP Conf. Ser. Earth Environ. Sci. 2012, 15, 022007. [Google Scholar] [CrossRef]
- Dutta, P.; Saha, S.K.; Nandi, N.; Pal, N. Numerical Study on Flow Separation in 90° Pipe Bend under High Reynolds Number by K-ε Modelling. Eng. Sci. Technol. Int. J. 2016, 19, 904–910. [Google Scholar] [CrossRef]
- Vaishnavi, G.; Ramarajan, J.; Jayavel, S. Numerical Studies of Bubble Formation Dynamics in Gas-Liquid Interaction Using Volume of Fluid (VOF) Method. Therm. Sci. Eng. Prog. 2023, 39, 101718. [Google Scholar] [CrossRef]
- Melikhov, V.I.; Melikhov, O.I.; Volkov, G.Y.; Yakush, S.E.; Salekh, B. Modelling of the Liquid Jet Discharge into a Liquid-Filled Space by the VOF Method. Therm. Eng. 2023, 70, 63–72. [Google Scholar] [CrossRef]
- Meng, L.; Gao, S.; Wei, D.; Zhao, Q.; Cui, B.; Shen, Y.; Song, Z. Particulate Flow Modelling in a Spiral Separator by Using the Eulerian Multi-Fluid VOF Approach. Int. J. Min. Sci. Technol. 2023, 33, 251–263. [Google Scholar] [CrossRef]
- Akhlaghi, M.; Mohammadi, V.; Nouri, N.M.; Taherkhani, M.; Karimi, M. Multi-Fluid VOF Model Assessment to Simulate the Horizontal Air–Water Intermittent Flow. Chem. Eng. Res. Des. 2019, 152, 48–59. [Google Scholar] [CrossRef]
- Yin, X.; Zarikos, I.; Karadimitriou, N.K.; Raoof, A.; Hassanizadeh, S.M. Direct Simulations of Two-Phase Flow Experiments of Different Geometry Complexities Using Volume-of-Fluid (VOF) Method. Chem. Eng. Sci. 2019, 195, 820–827. [Google Scholar] [CrossRef]
- Bai, Y. Flow and Performance Simulation of Liquid Jet Pump Based on Fluent; Beijing University of Chemical Technology: Beijing, China, 2021. [Google Scholar]
- Yang, X.; Long, X.; Kang, Y.; Xiao, L. Application of Constant Rate of Velocity or Pressure Change Method to Improve Annular Jet Pump Performance. Int. J. Fluid Mach. Syst. 2013, 6, 137–143. [Google Scholar] [CrossRef]
- Zhu, X.; Wang, D.; Xu, C.; Zhu, Y.; Zhou, W.; He, F. Structure Influence on Jet Pump Operating Limits. Chem. Eng. Sci. 2018, 192, 143–160. [Google Scholar] [CrossRef]
- Yang, X.; Long, X.; Yao, X. Numerical investigation on the mixing process in a steam ejector with different nozzle structures. Int. J. Therm. Sci. 2012, 56, 95–106. [Google Scholar] [CrossRef]
- Yang, X.; Zhu, C.; Zhou, Q.; Chen, J.; Mou, J. Study on Performance and Operation Mechanism of a Separation Equipment for a PWR Steam Generator. Atmosphere 2023, 14, 451. [Google Scholar] [CrossRef]
- Tang, J.; Zhang, Z.; Li, L.; Wang, J.; Liu, J.; Zhou, Y. Influence of Driving Fluid Properties on the Performance of Liquid-Driving Ejector. Int. J. Heat Mass Transf. 2016, 101, 20–26. [Google Scholar] [CrossRef]
- Zhang, J.; Dong, L.; Zhou, L.; Nieh, S. Simulation of Swirling Turbulent Flows and Heat Transfer in An Annular Duct. Numer. Heat Transf. Part A Appl. 2003, 44, 591–609. [Google Scholar] [CrossRef]
Figure 1.
Schematic diagram of the intelligent toilet’s spray bar model.

Figure 2.
Meshing of the computational domain for the model flow channel.

Figure 3.
Mesh-independent study.

Figure 4.
Structure of the simulation verification model.

Figure 5.
Results of the simulation verfication.

Figure 6.
Simulation iteration convergence results.

Figure 7.
Cross-section view of the spray bar.

Figure 8.
Streamlines of the prototype spray bar.

Figure 9.
Detailed flow of cross-section 1 in the prototype spray bar.

Figure 10.
Detailed flow of cross-section 2 in the prototype spray bar.

Figure 11.
Detailed flow of cross-section 3 in the prototype spray bar.

Figure 12.
Structures of the optimization schemes.

Figure 13.
Optimization of performance for Figure 12a.
Figure 13.
Optimization of performance for Figure 12a.

Figure 14.
Optimization of performance for Figure 12b.
Figure 14.
Optimization of performance for Figure 12b.

Figure 15.
Comparison of static pressure in the optimized scheme.

Figure 16.
Streamlines of Figure 12a (L = 1.5 mm).
Figure 16.
Streamlines of Figure 12a (L = 1.5 mm).

Figure 17.
Detailed flow of cross-section 1 in Figure 12a (L = 1.5 mm).
Figure 17.
Detailed flow of cross-section 1 in Figure 12a (L = 1.5 mm).

Figure 18.
Detailed flow of cross-section 2 in Figure 12a (L = 1.5 mm).
Figure 18.
Detailed flow of cross-section 2 in Figure 12a (L = 1.5 mm).

Figure 19.
Detailed flow of cross-section 3 in Figure 12a (L = 1.5 mm).
Figure 19.
Detailed flow of cross-section 3 in Figure 12a (L = 1.5 mm).

Figure 20.
Figure 12b (position (4)) flow line.
Figure 20.
Figure 12b (position (4)) flow line.

Figure 21.
Detailed flow of cross-section 1 in Figure 12b (position (4)).
Figure 21.
Detailed flow of cross-section 1 in Figure 12b (position (4)).

Figure 22.
Detailed flow of cross-section 2 in Figure 12b (position (4)).
Figure 22.
Detailed flow of cross-section 2 in Figure 12b (position (4)).

Figure 23.
Detailed flow of cross-section 3 in Figure 12b (position (4)).
Figure 23.
Detailed flow of cross-section 3 in Figure 12b (position (4)).

Disclaimer/Publisher’s Note: The statements, opinions and data contained in all publications are solely those of the individual author(s) and contributor(s) and not of MDPI and/or the editor(s). MDPI and/or the editor(s) disclaim responsibility for any injury to people or property resulting from any ideas, methods, instructions or products referred to in the content. |
© 2023 by the authors. Licensee MDPI, Basel, Switzerland. This article is an open access article distributed under the terms and conditions of the Creative Commons Attribution (CC BY) license (https://creativecommons.org/licenses/by/4.0/).
Share and Cite
MDPI and ACS Style
Zhou, Q.; Zhu, C.; Yang, X.; Chen, J.; Mou, J. Flow Channel Optimization to Improve the Performance of a Liquid–Gas Ejector for an Intelligent Toilet Spray Bar. Atmosphere 2024, 15, 58. https://doi.org/10.3390/atmos15010058
AMA Style
Zhou Q, Zhu C, Yang X, Chen J, Mou J. Flow Channel Optimization to Improve the Performance of a Liquid–Gas Ejector for an Intelligent Toilet Spray Bar. Atmosphere. 2024; 15(1):58. https://doi.org/10.3390/atmos15010058
Chicago/Turabian StyleZhou, Qiwei, Chenbing Zhu, Xuelong Yang, Jianchong Chen, and Jiegang Mou. 2024. "Flow Channel Optimization to Improve the Performance of a Liquid–Gas Ejector for an Intelligent Toilet Spray Bar" Atmosphere 15, no. 1: 58. https://doi.org/10.3390/atmos15010058
Note that from the first issue of 2016, this journal uses article numbers instead of page numbers. See further details here.