
Impacts of Radar Data Assimilation on the Forecast of “12.8” Extreme Rainstorm in Central China (2021)
1
College of Hydrology and Water Resources, HoHai University, Nanjing 210098, China
2
Anhui Provincial Meteorological Observation, Anhui Meteorological Bureau, Hefei 230031, China
3
Suizhou Meteorological Bureau, Hubei Meteorological Bureau, Suizhou 441300, China
4
Key Laboratory of Meteorological Disaster, Ministry of Education (KLME)/Joint International Research Laboratory of Climate and Environment Change (ILCEC)/Collaborative Innovation Center on Forecast and Evaluation of Meteorological Disasters (CIC-FEMD), School of Atmospheric Physics, Nanjing University of Information Science & Technology, Nanjing 210044, China
*
Author to whom correspondence should be addressed.
Atmosphere 2023, 14(12), 1722; https://doi.org/10.3390/atmos14121722
Submission received: 19 October 2023
/
Revised: 17 November 2023
/
Accepted: 21 November 2023
/
Published: 23 November 2023
(This article belongs to the Special Issue Data Assimilation for Predicting Hurricane, Typhoon and Storm)
Abstract
:Dual-polarization radar data are useful for numerical models to improve precipitation forecasts. For an extremely heavy precipitation event that occurred in Central China on 11 August 2021, the hydrometeor concentration and water vapor content used in the initial field of the Weather Research and Forecasting (version 4.1) model are retrieved by the statistical relationship of relative humidity with dual-polarization radar reflectivity in Suizhou City of Central China. Three experiments are conducted, and the simulation results are compared after assimilating the radar data. The results indicate that the multiple factors contributing to this extreme heavy precipitation event included the divergence of upper-level airflows, the middle- and low-level low vortex/shear, the easterly jet stream in front of the low vortex, and the continuous intrusion of cold air on the ground. In addition, with the retrieval of the hydrometeor concentration and water vapor content, the composite reflectivity forecast results are more similar to the observations. Also, the location and intensity of the short-term extremely heavy precipitation event are less different from the observations. In addition, by cyclically adjusting the hydrometeor concentration and water vapor content in the initial field, we can obtain better forecasts of the reflectivity and short-term extremely heavy precipitation, and this improvement can be maintained for approximately 3 h.
1. Introduction
Short-term extremely heavy precipitation is one of the most significant causes of meteorological disasters [1,2], and its accurate prediction is of great practical significance for facilitating smoother travel, guiding agricultural production, and preventing and mitigating disasters. At present, short-term extremely heavy precipitation forecasts mainly rely on numerical weather models. However, accurate precipitation forecasts, especially convective precipitation forecasts, remain challenging in numerical weather prediction [3,4,5], which depends on factors such as the initial field, parameterization schemes, and microphysics schemes [6,7,8,9,10,11,12]. Short-term extremely heavy precipitation is characterized by intense rainfall with a short duration, and it is closely related to mesoscale and convective-scale weather systems. The data from Doppler weather radars have high spatio-temporal resolutions, which can serve as one of the main sources of precipitation information and can provide useful indications for short-term weather prediction [13,14,15,16,17,18,19]. Therefore, Doppler weather radars play a key role in high-resolution convective and mesoscale data assimilation systems. The successful assimilation of radar data is essential for skillful convective-scale numerical prediction.
Previous studies have focused on radar data assimilation, and there are three main assimilation methods: variational assimilation, ensemble Kalman filter (EnKF) assimilation, and cloud analysis. Sun and Crook [20] (1997), Gao et al. [21] (1999), Hu et al. [22] (2006), Li et al. [23] (2009), Wan et al. [24] (2006), Shu et al. [25] (2022), and He et al. [26] (2021) have carried out variational assimilation experiments of radar reflectivity or radial velocity data. Their results indicated that heavy precipitation forecast skills were significantly improved after assimilation. Tong et al. [27] (2006) and Dowell et al. [28] (2011) used EnKFs to assimilate radar reflectivity data directly to improve storm forecasts. To improve typhoon forecasts, Zhang et al. [29] (2009) applied EnKFs for the direct assimilation of radial velocity to represent the best-track position and intensity of Hurricane Humberto. For cloud analysis, Lin et al. [30] (1993) initialized a cloud-resolving model using radar data, where the retrieved rainwater was derived from radar reflectivity, and the air pressure and temperature fields were obtained by thermodynamic retrieval. The results showed that the short-term storm forecasts were in good agreement with the observations. Takano et al. [31] (1993), Aonashi [32] (1993), Guo et al. [33] (1999), and Haase et al. [34] (2003) improved precipitation forecasts by changing the humidity and temperature profile in the initial field. Li et al. [35] (2004) used radar reflectivity data to retrieve microphysical variables and directly adjust the humidity field in the initial field, which remarkably improved the accuracy of short-term precipitation forecasts. Zhang et al. [36] (1998), Xue et al. [37] (2003), Hu et al. [22] (2006), and Schenkman et al. [38] (2011) also simulated convective storms successfully based on cloud analysis schemes.
Based on dual-polarization radar parameters, the raindrop/particle size distribution and related properties can be more accurately retrieved [39,40,41], and the classification of hydrometeors can be improved [42,43]. Jung et al. [44,45] (2008) developed observation operators for polarization parameters in response to single-parameter microphysics schemes. They found that the assimilation of polarization parameters based on an EnKF system can improve the analysis results of the model variables in the vertical direction. Using the Weather Research and Forecasting (WRF) three-dimensional variational assimilation system, Li et al. [46] (2017) indicated that the ice-phase three-dimensional variational assimilation of reflectivity factor and radial velocity could greatly improve the short-term precipitation forecasts, while assimilating a specific differential phase (KDP) had a positive effect on rain and snow weather prediction in the middle and lower layers of the troposphere. Kawabata et al. [47] (2018) developed two dual-polarization radar observation and simulation modules based on the WRF-variational system and a non-hydrostatic four-dimensional variational assimilation system. The results of a simple assimilation experiment showed good agreement with the observations in terms of reflectivity and KDP, but not for differential reflectivity.
As the dual-polarization radars were being upgraded in several Chinese provinces, such as Guangdong, Jiangsu, Hubei, and Anhui, the quality control and analysis of severe weather based on dual-polarization radar in China have shown promising results [48,49,50]. Additionally, research on quantitative precipitation estimation using dual-polarization observations has achieved significant progress [51,52]. Therefore, effectively incorporating dual-polarization radar information into numerical models holds great practical significance for improving precipitation prediction, and exploring approaches to efficiently utilize these data in high-resolution numerical simulations is crucial.
The remainder of this paper is arranged as follows. Section 2 introduces the methods used in this study. Section 3 shows the case selection and the diagnostic analysis. The numerical experiments and the simulation results are presented in Section 4. The main conclusions and discussion are shown in Section 5.
2. Methods
2.1. Hydrometeor Concentration Retrieval Method
In this research, we consider the mixing ratios of three hydrometeors, namely rain (qr), snow (qs), and graupel (qg) [28]. The equivalent radar reflectivity (Ze) is the sum of the reflectivity of these three hydrometeors, as shown in Equation (1).
Since the reflectivity factor in Equation (1) is assumed to be a function of the mixing ratios of the three hydrometeors, the reflectivity may bring more uncertainty to the mixing ratios of hydrometeors. For example, the mixing ratio of rainwater may appear at the upper level in the initial field of the model. In order to reduce the uncertainty, the retrieve operators based on the temperature in the background field are adopted [53], as presented in Equation (2).
where Tb denotes the background temperature, and it ranges from −5 °C to 5 °C. , and α varies linearly between 0 and 1. The reflectivity of rain, snow, and graupel can be calculated by Equation (3).
where x represents rain, snow, and graupel. a denotes the dielectric constant, which is 3.63 × 10⁹ for rain, 9.80 × 10⁸ for dry snow, 4.26 × 10¹¹ for wet snow, and 1.09 × 10⁹ for graupel. denotes the air density.
To distinguish the hydrometeor concentration between rainfall areas and clear-sky areas, we set the reflectivity of 20 dBZ as the threshold at the observation stations following Gao et al. [54] (2018). The retrieved hydrometeor concentration in the model’s initial field can be obtained according to Equations (2) and (3).
2.2. Water Vapor Content Retrieval Method
The water vapor content (qv) used in this experiment can be obtained by , where denotes the saturation specific humidity of the atmosphere calculated from the air pressure and air temperature. In order to distinguish the radar echoes of effective precipitation from the clear-sky echoes, the echoes exceeding 20 dBZ are considered as effective precipitation echoes, and those below 20 dBZ are taken as clear-sky echoes. For areas with reflectivity exceeding 20 dBZ, the RH is calculated by , and is given in Table 1. For the grid point with a KDP value of more than 0.3° km−1, RH is set to 100. For the grid point with KDP of less than 0.3° km−1 and ZDR of less than 0.25, RH is set as min (RHb, 50), where RHb denotes the background RH [55]. In addition, Equations (2) and (3) have also been used to adjust the hydrometeor concentration field when retrieving water vapor content.
2.3. Quality Control of Radar Data
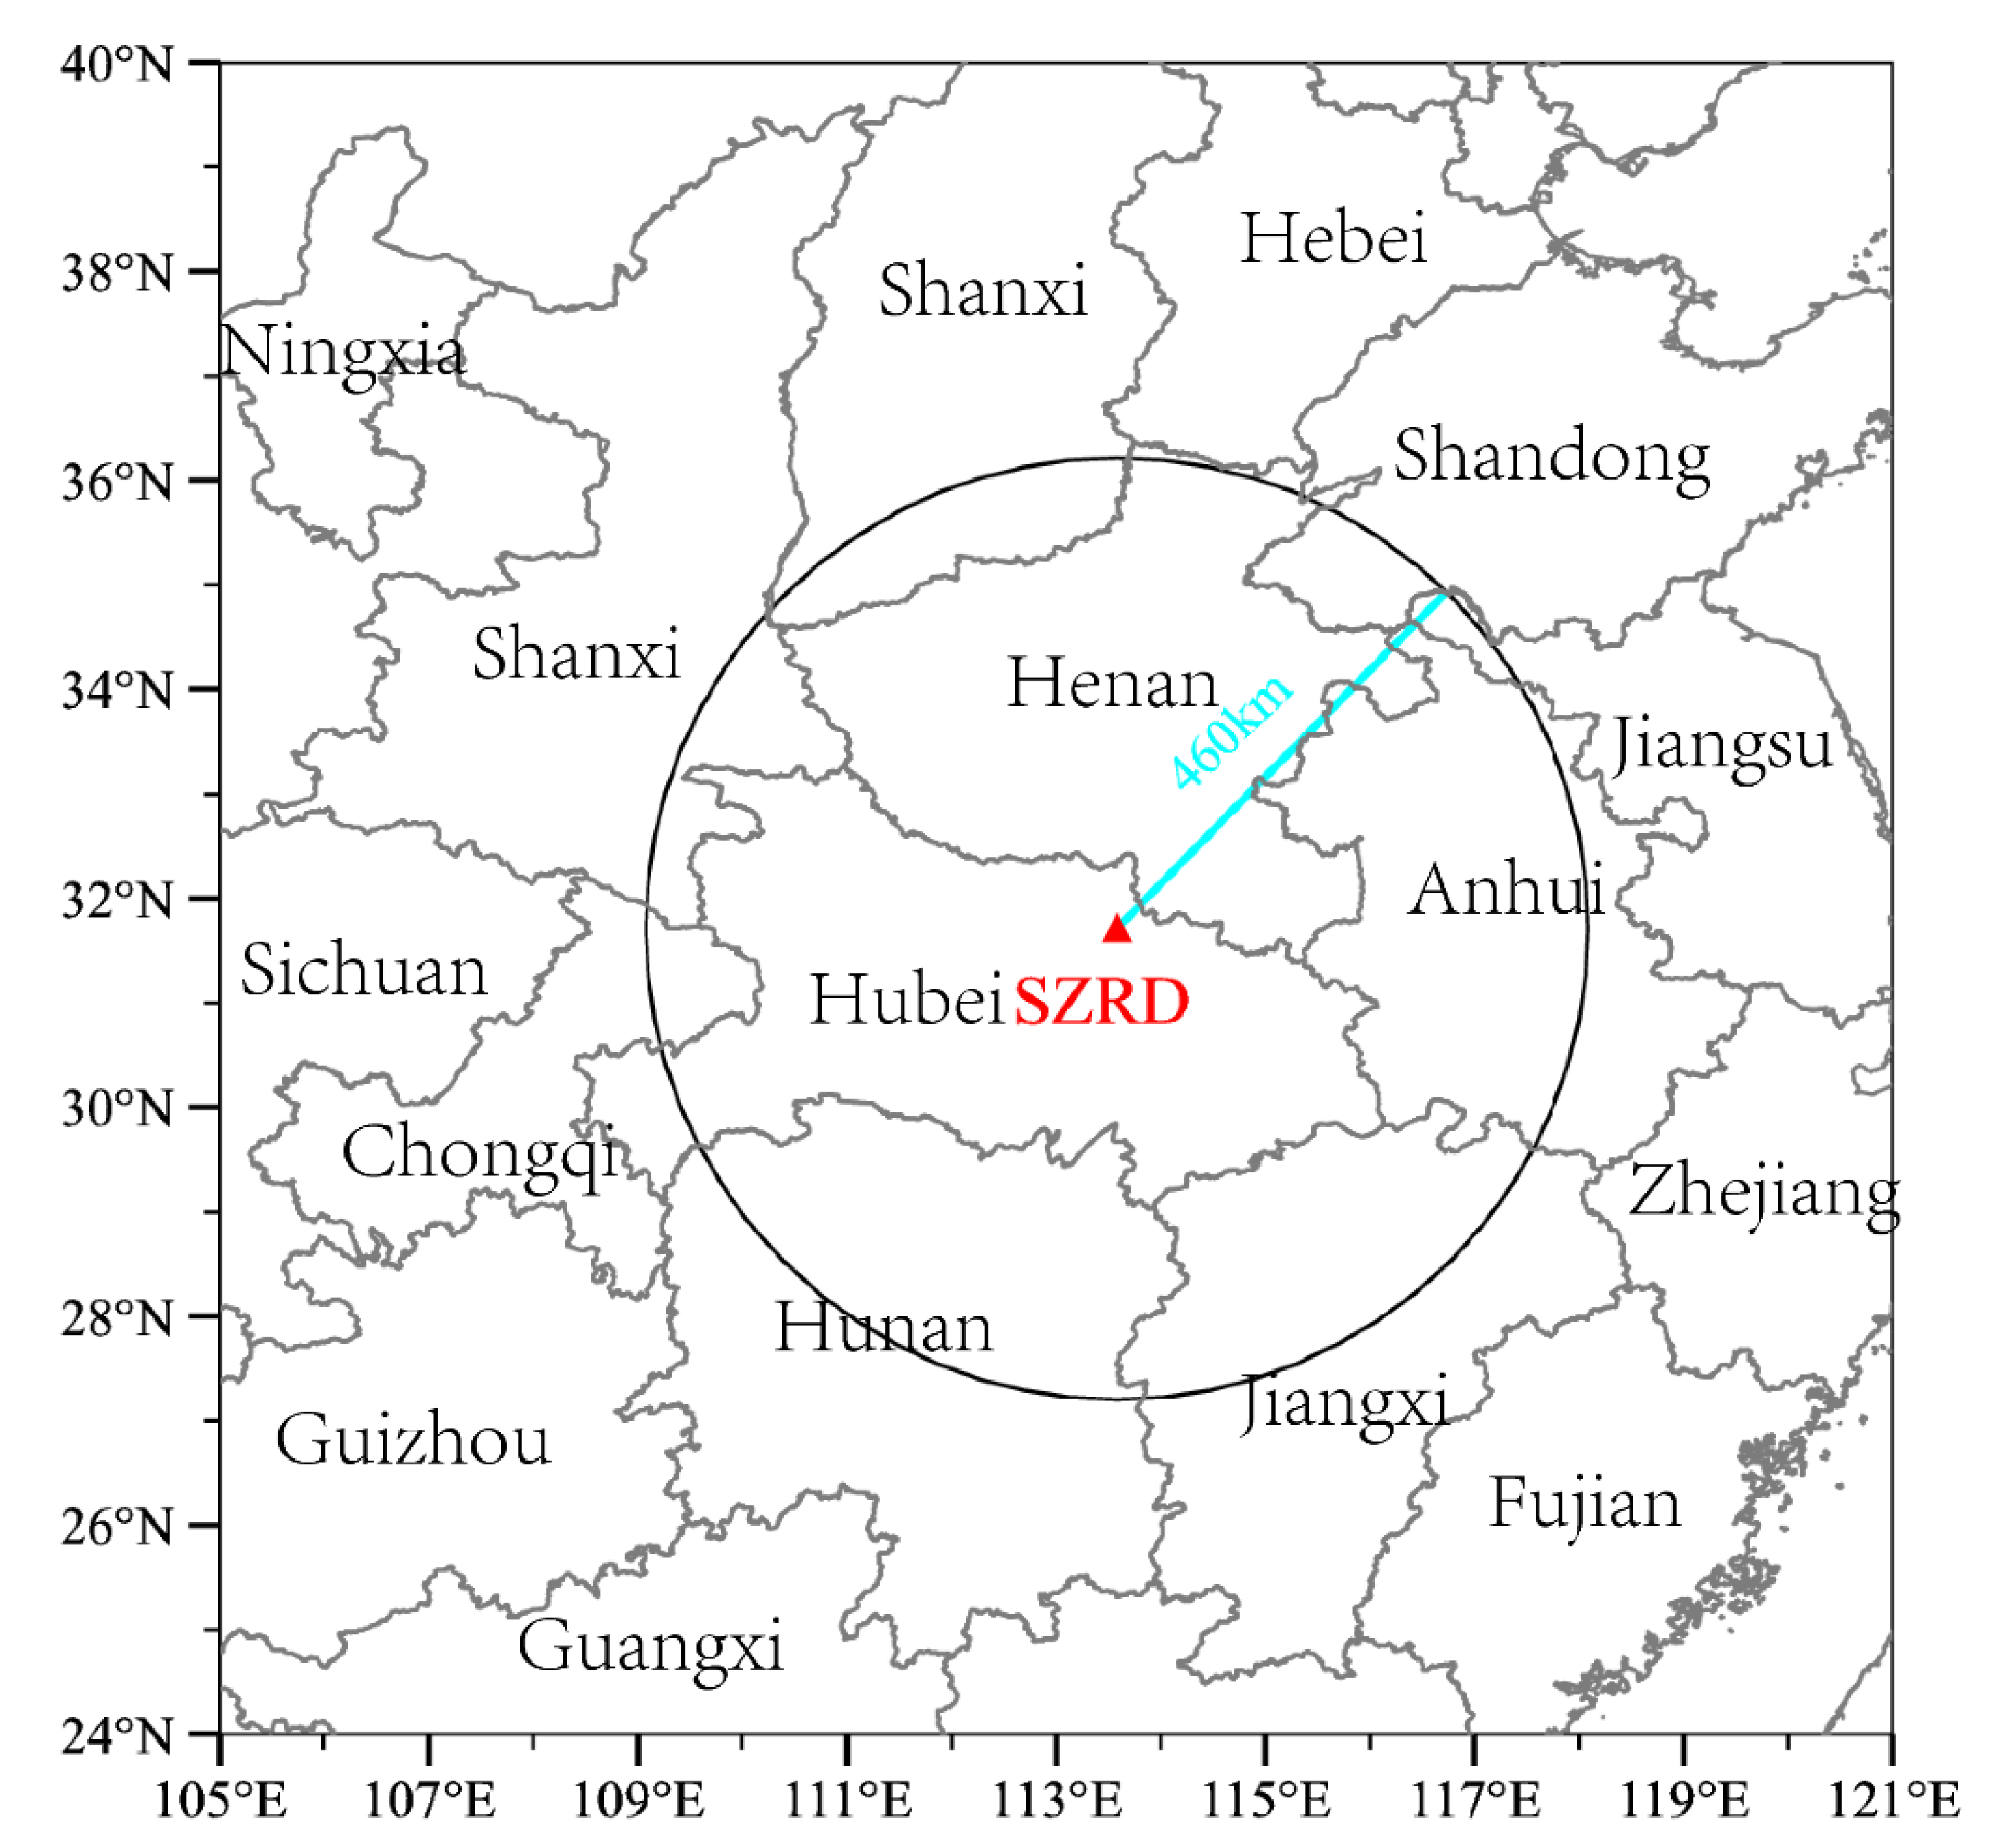
The radar data used in this study were obtained from the dual-polarization Doppler weather radar of the Suizhou Meteorological Bureau. The rainfall observations were from the Hubei Meteorological Service. The radar key parameters are shown in Table 2, and the radar detection area is shown in Figure 1. The dual-polarization radar can measure several parameters, including the reflectivity factor (Z), differential reflectivity (ZDR), differential phase (ΦDP), specific differential phase (KDP), and co-polar cross-correlation coefficient (CC). Radar data quality control, such as removing ground echoes and noise points, is critical. The quality control procedures were as follows. Firstly, if the number of valid observations was less than 4, the observation data were rejected [29]. GDBZ is regarded as the difference in the reflectivity between 0.5° elevation and 1.5° elevation. When the GDBZ exceeded 30 dBZ, the reflectivity data were removed at 0.5° elevation (Jiang et al., 2009). Additionally, reflectivity greater than 20 dBZ was considered precipitation echoes in this study [56]. The observations were excluded if the CC was less than 0.95, while a CC less than 0.9 was near the melting layer height.
3. Case Selection and Diagnostic Analysis
3.1. Overview of the Rainstorm Process
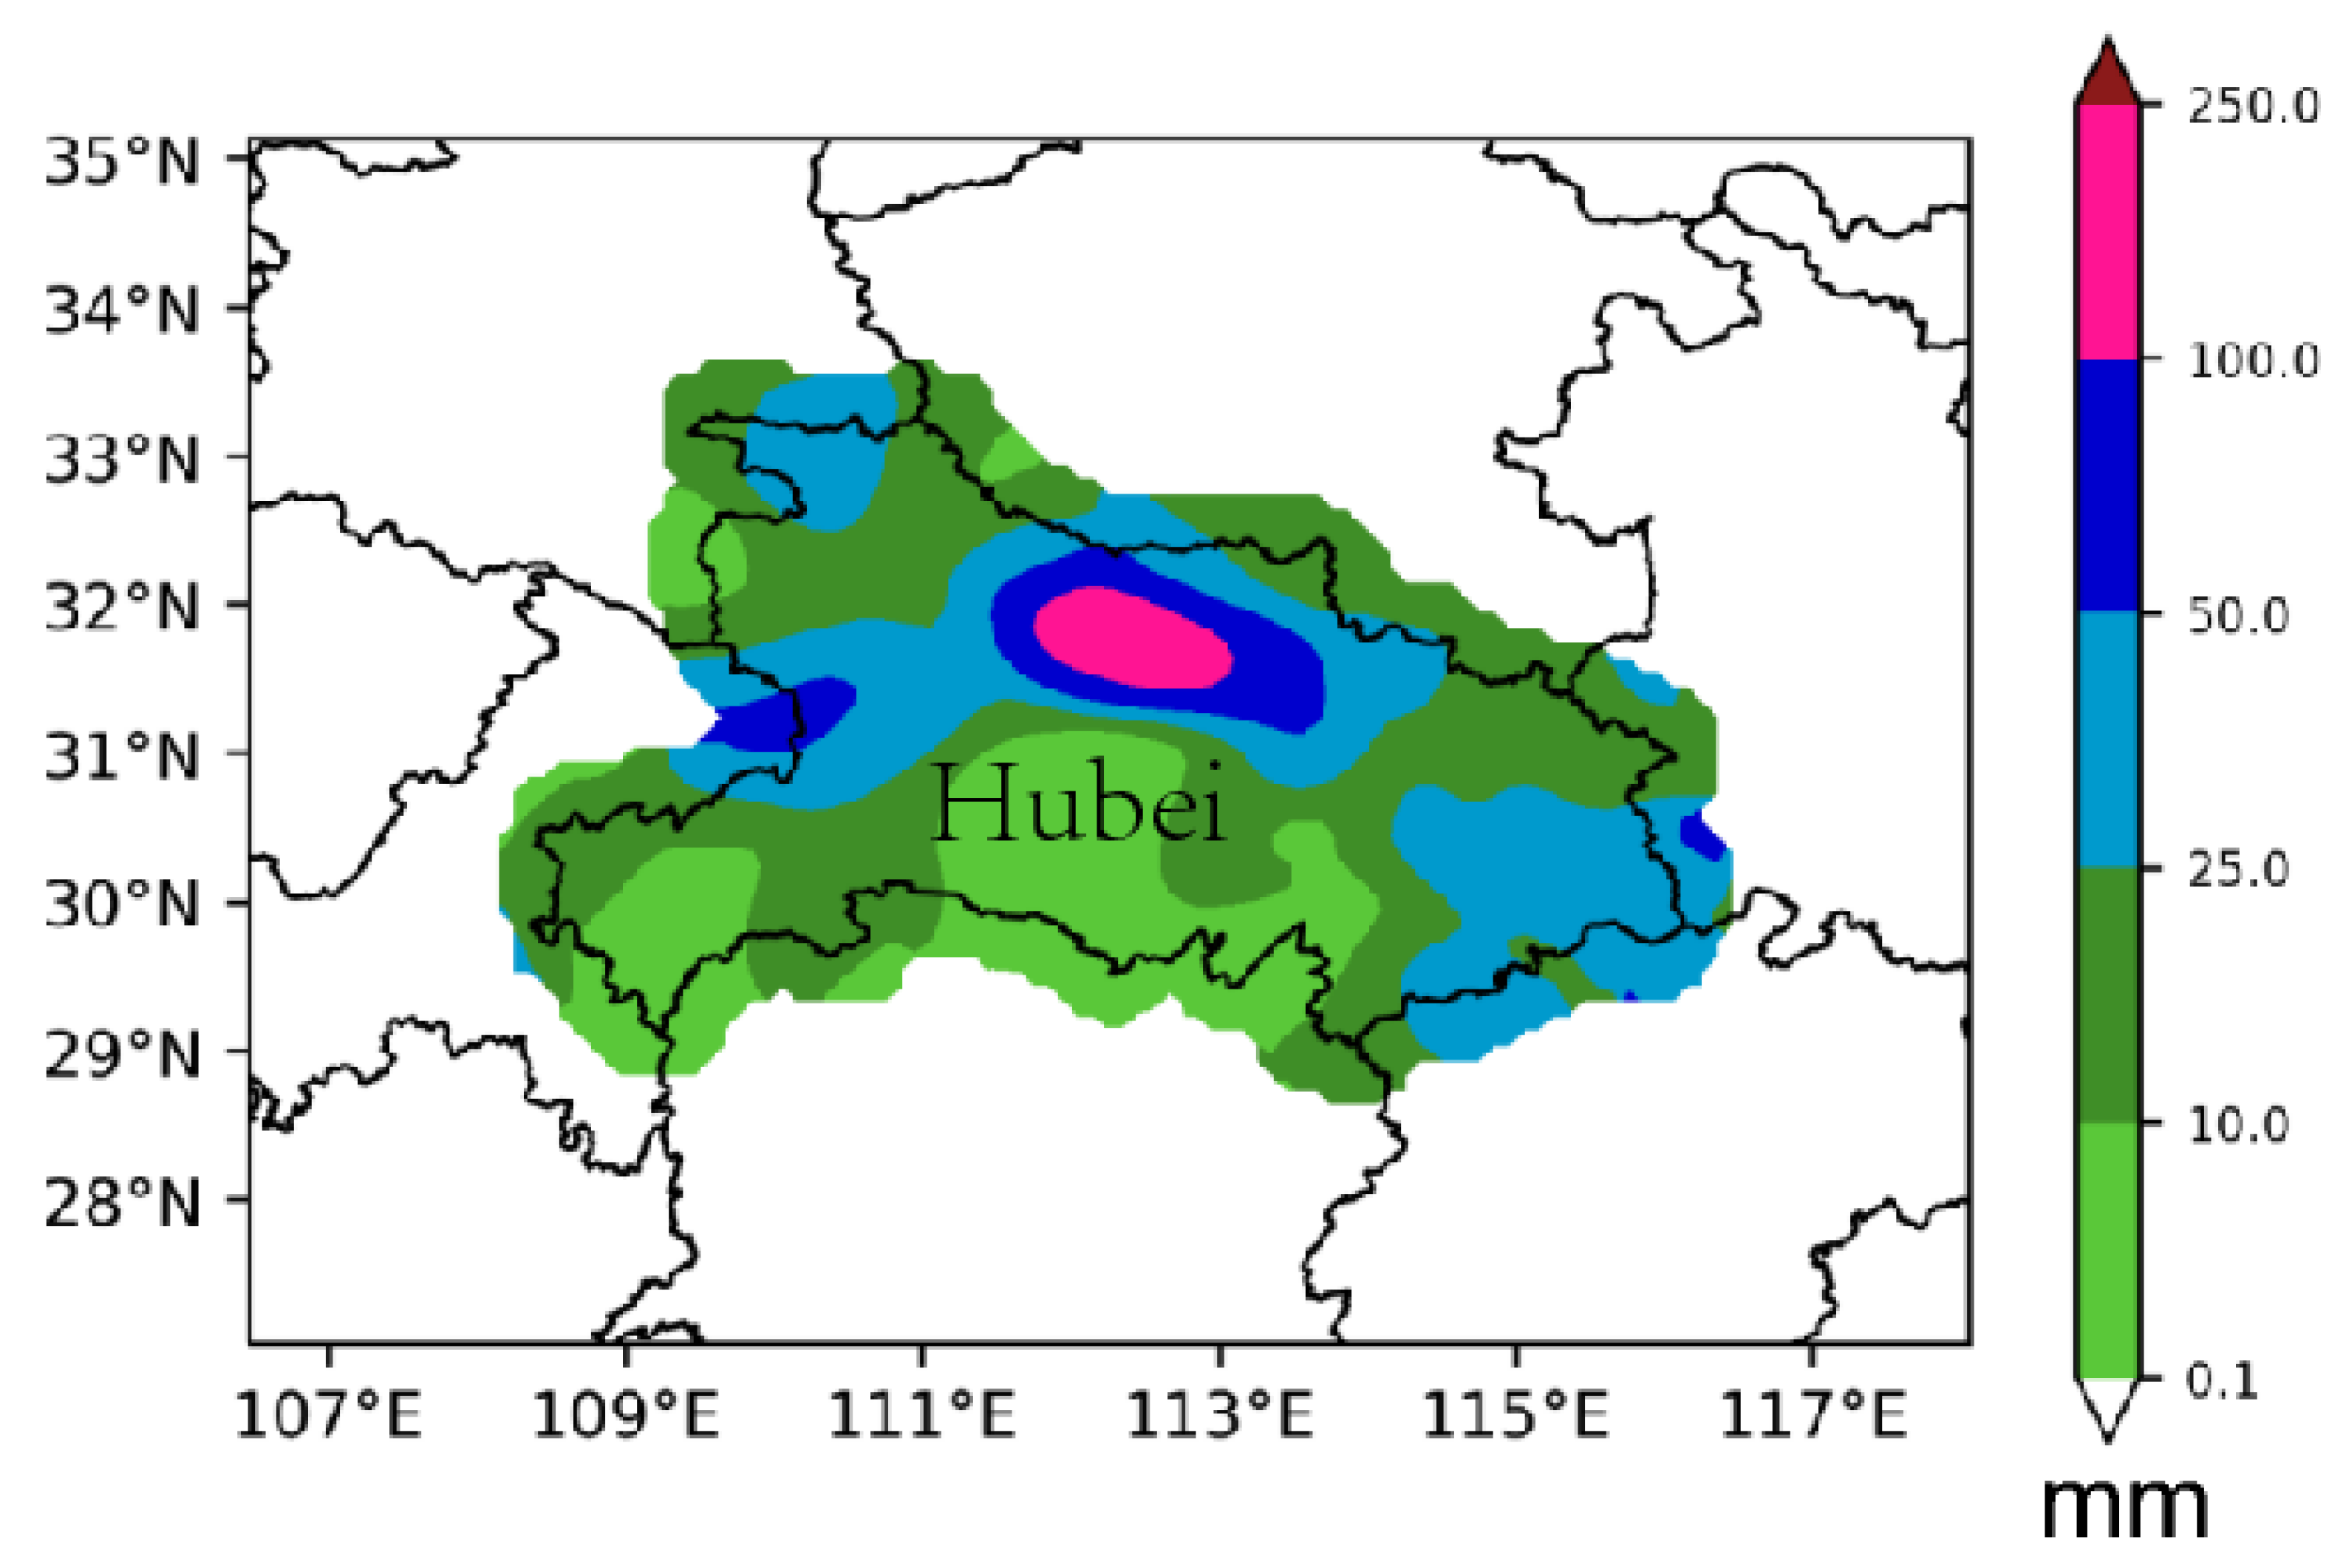
From 00:00 UTC on 11 August to 00:00 UTC on 12 August 2021, an extreme heavy precipitation event occurred in Xiangyang City and Suizhou City of Hubei Province, accompanied by extreme hourly rainfall (Figure 2). There were 64 stations with accumulated rainfall over 100 mm, and 228 stations with accumulated rainfall exceeding 50 mm during this rainstorm event. The maximum 24 h accumulated rainfall reached 474.4 mm at Yinghe Station in Yicheng City. The hourly rainfall was 105.4 mm at Liulin Station in Suizhou City (21:00–22:00 on 11 August) and 117.9 mm at Chaoyang Temple Station in Yicheng City (22:00–23:00 UTC on 11 August).
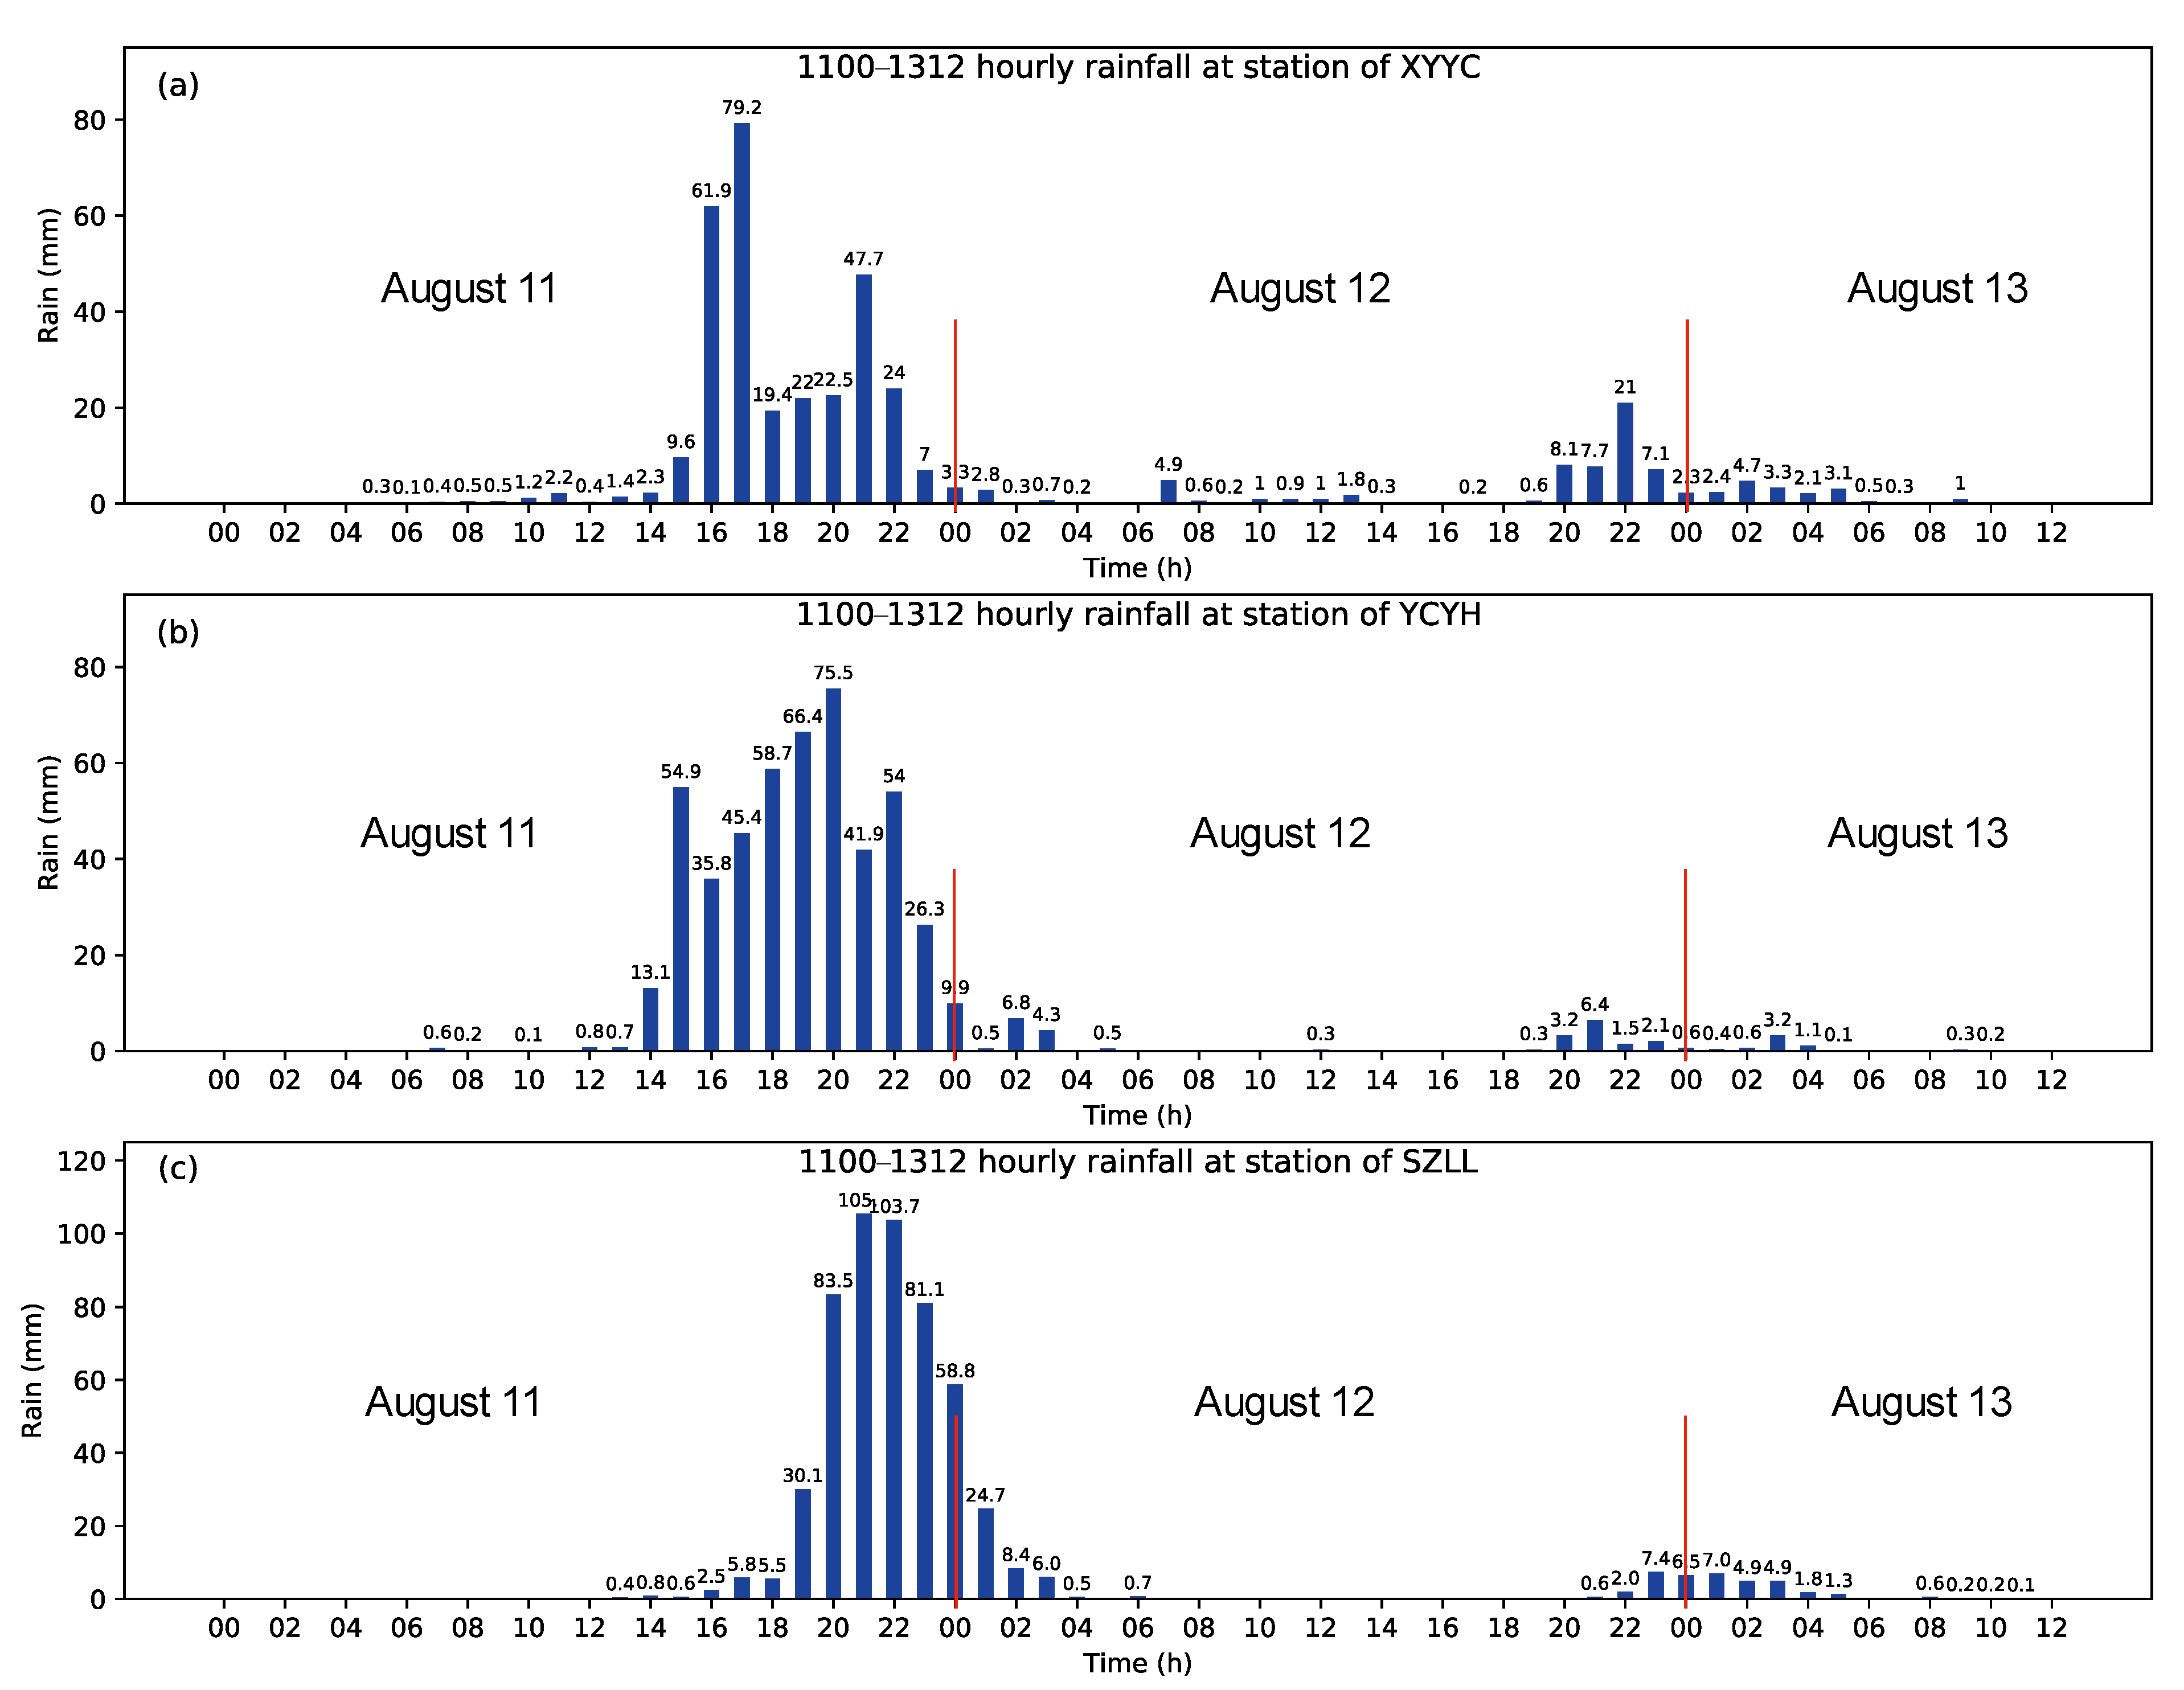
The heavy rainfall mainly occurred at night, i.e., from 16:00 UTC on 11 August to 00:00 UTC on 12 August (Figure 3). The hourly rainfall over 30 mm lasted about 3–8 h, specifically for 6–8 h at Yinghe Station and Liulin Station. Moreover, rainfall of more than 50 mm h−1 was observed from 20:00 UTC on 11 August to 00:00 UTC on 12 August at Liulin Station. Specifically, the hourly rainfall was more than 100 mm in 21:00–23:00 UTC. The 6 h of accumulated rainfall reached 462.6 mm from 18:00 UTC on 11 August to 00:00 UTC on 12 August. The extreme heavy precipitation caused flash floods in Xiangyang City and Suizhou City, resulting in severe economic losses.
3.2. Circulation Situation and Influence System
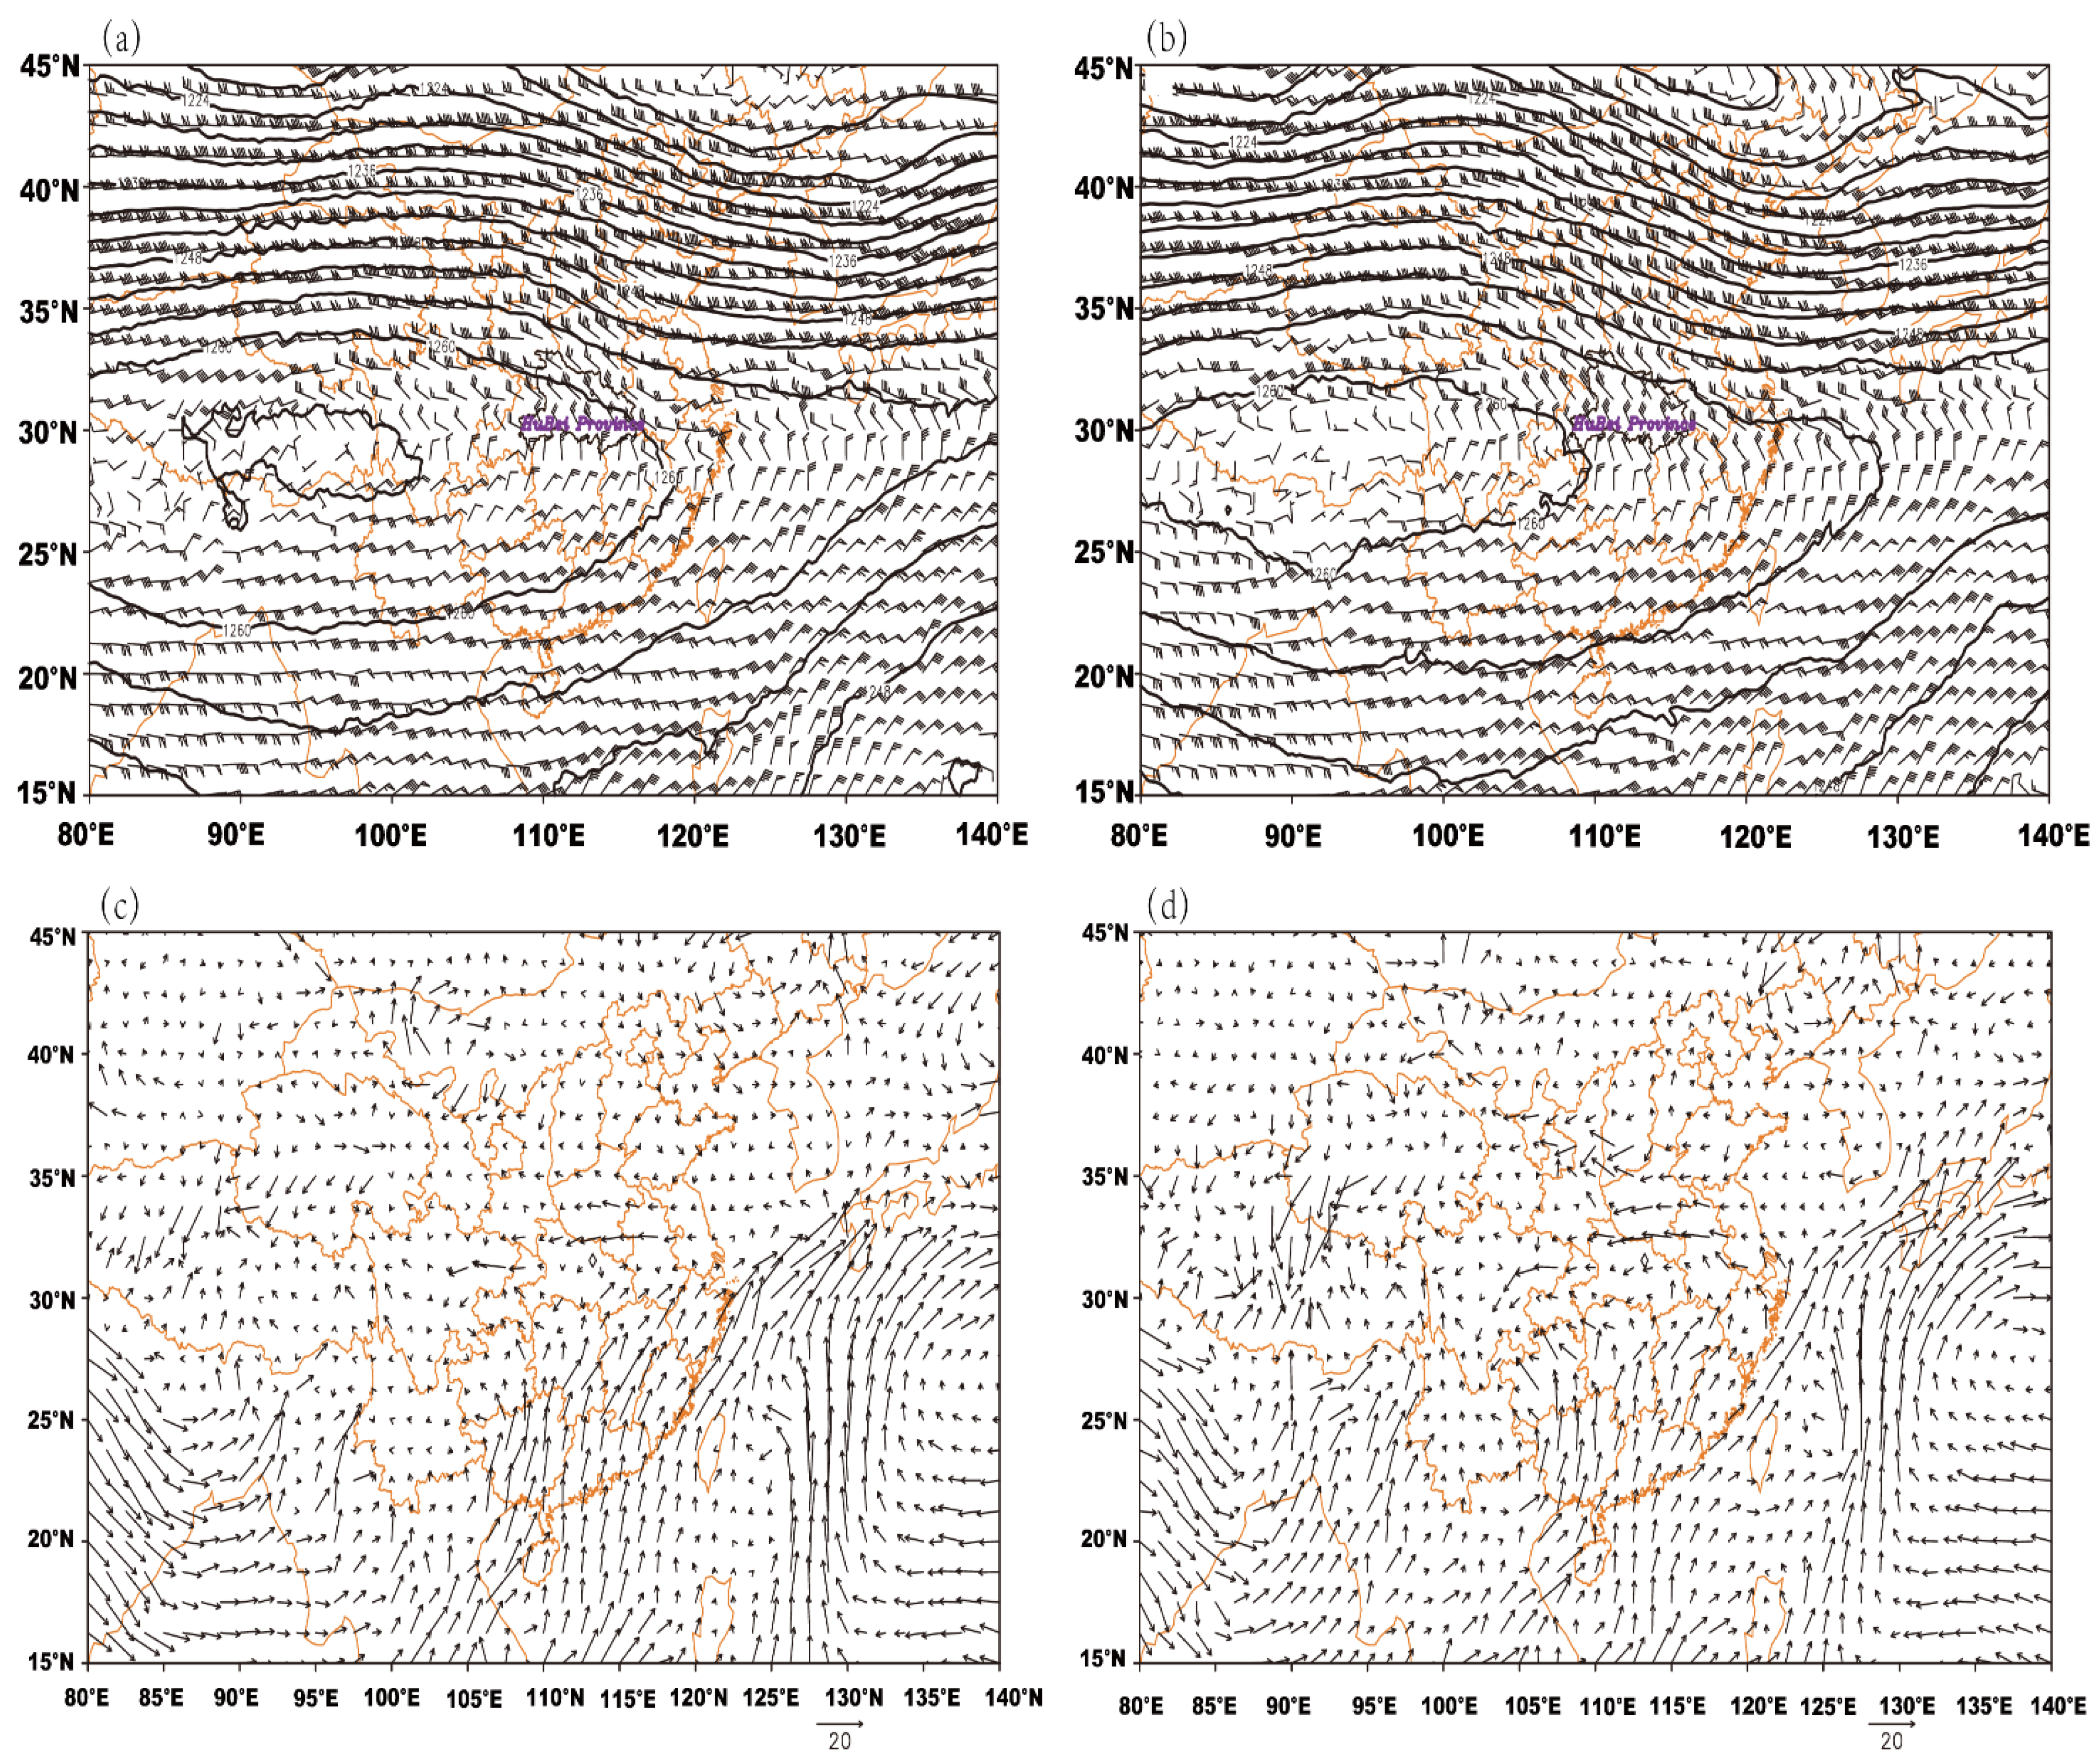
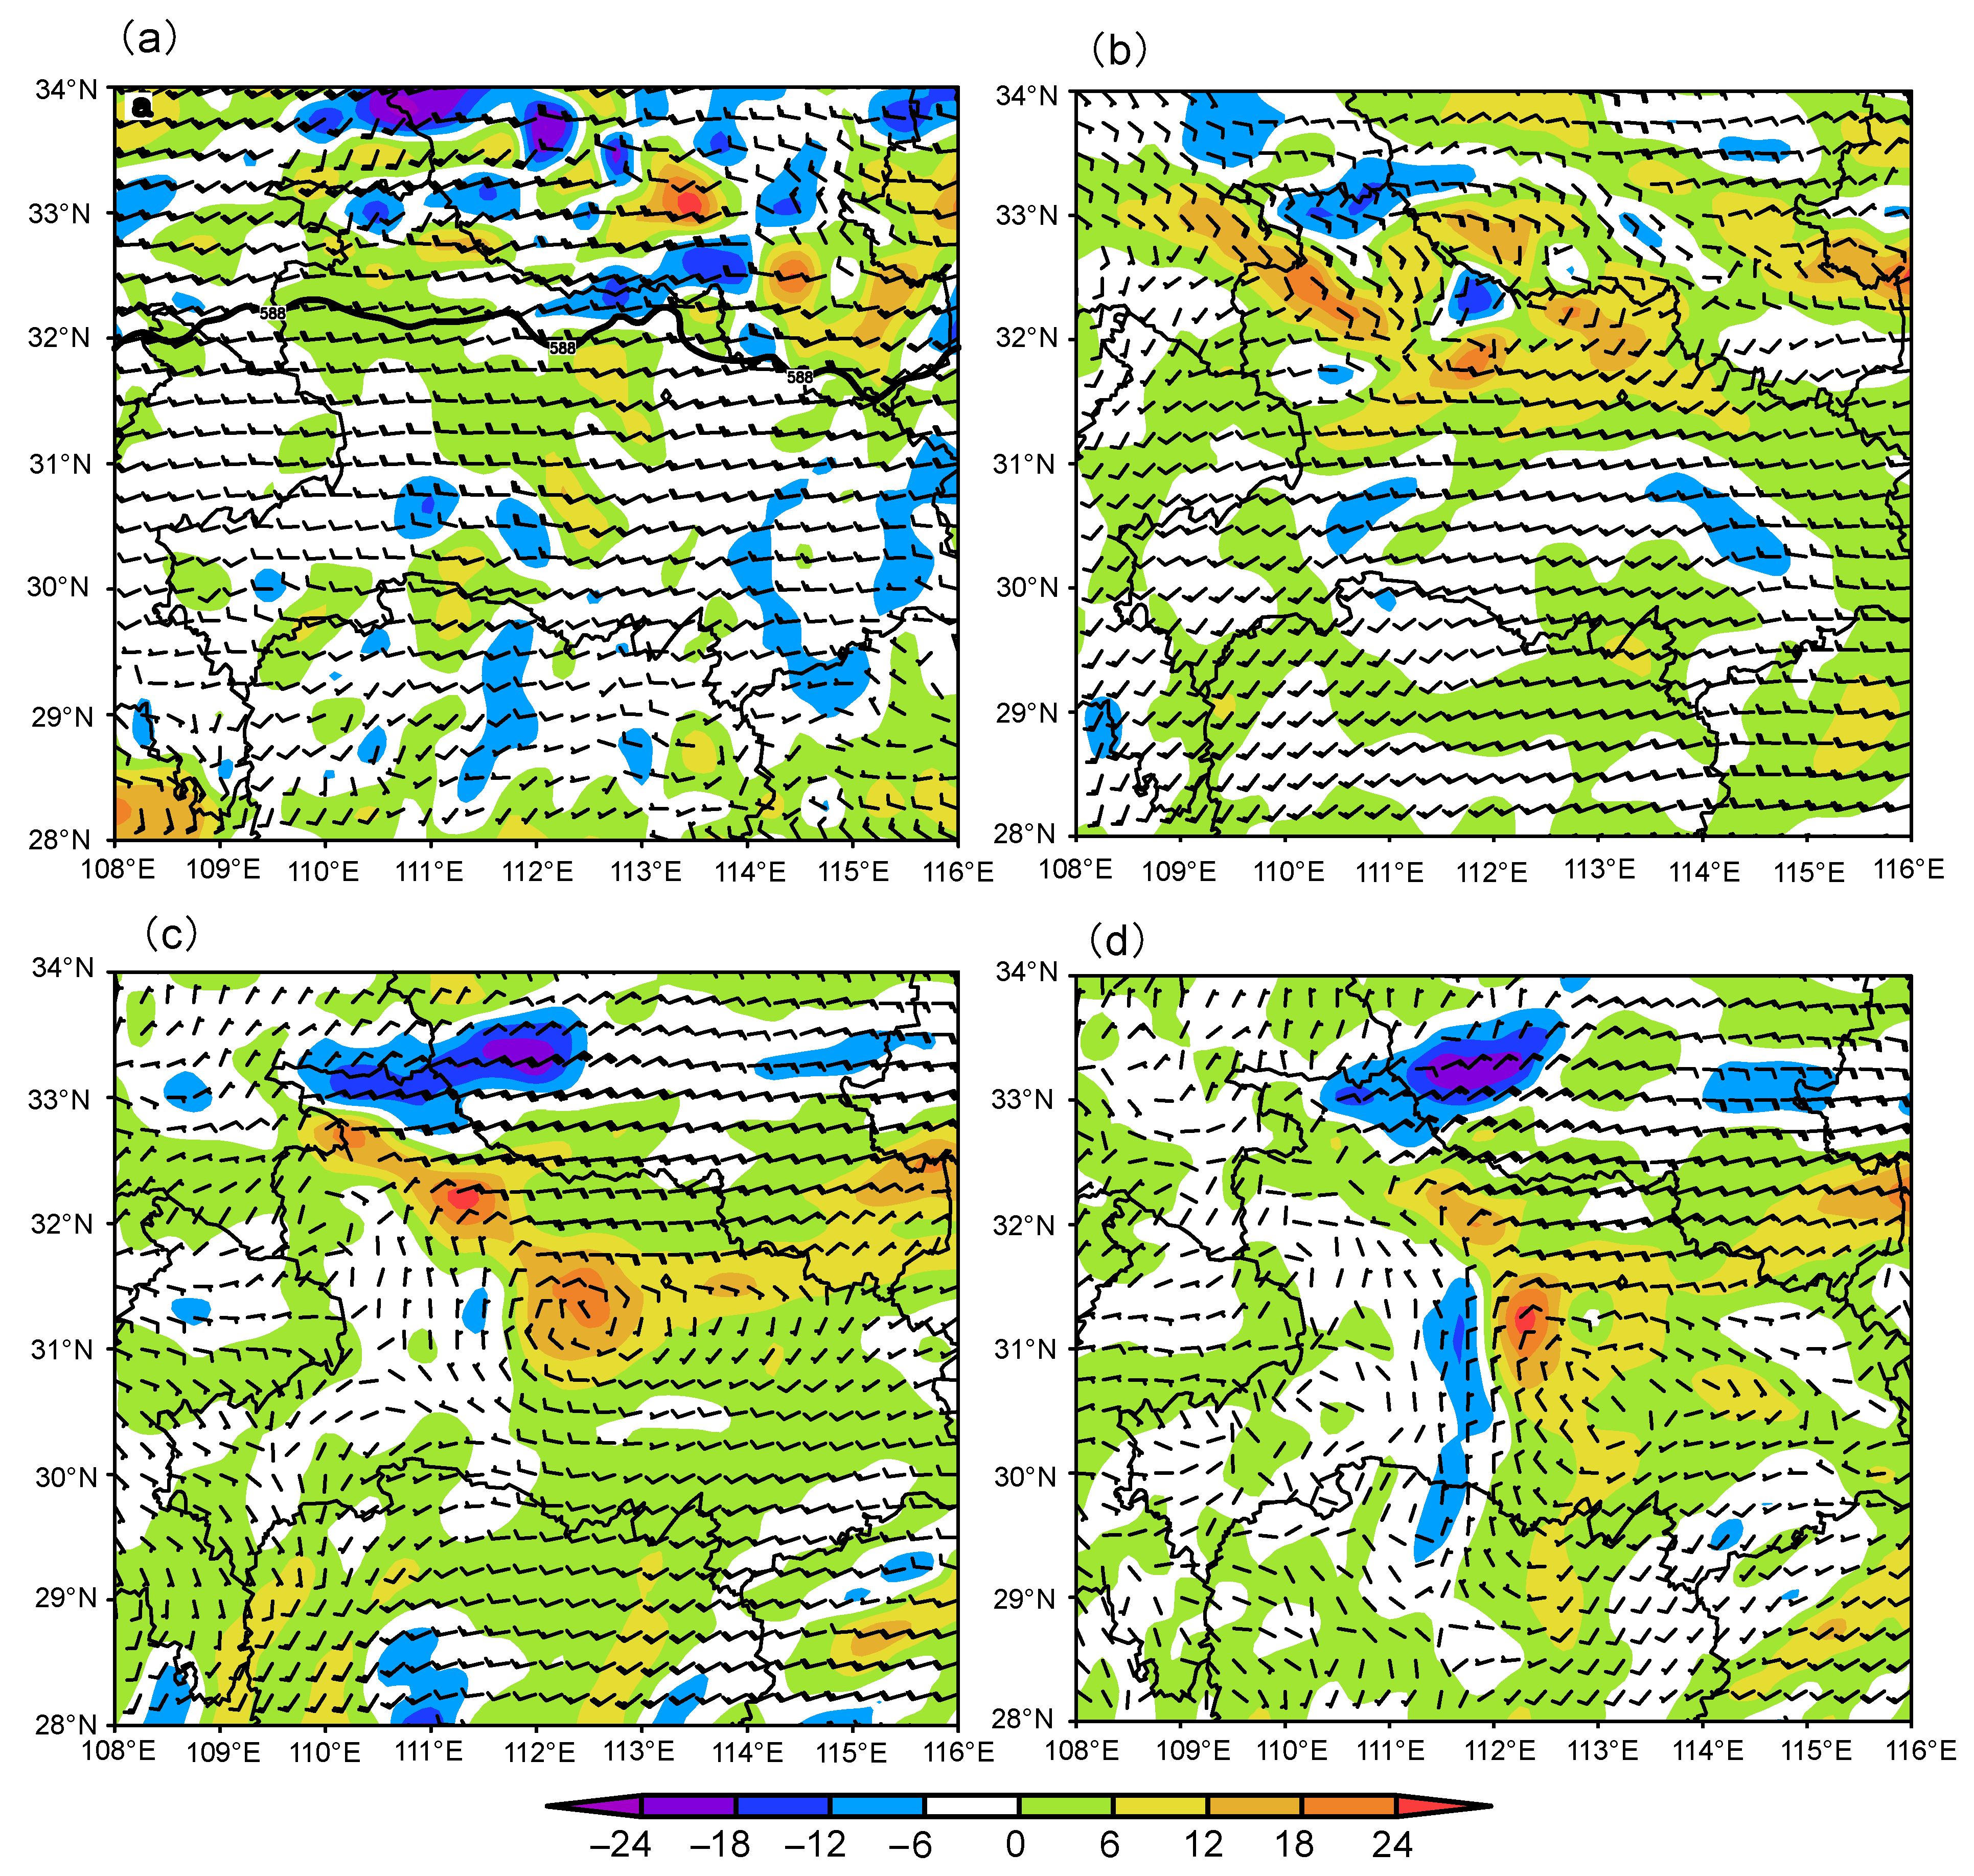
During this extreme heavy precipitation process, southern China was controlled by the strong South Asian high at 00:00 UTC on 11 August 2021 (Figure 4a). At 12:00 UTC on 11 August, the South Asian high extended eastward, and Hubei was located in the divergence zone on the eastern side of South Asian high at 200 hPa (Figure 4b). The ridge of the western Pacific subtropical high (WPSH) was located around 24 °N at 500 hPa, which was more southward than that in the same period of normal years. The WPSH ridge swung near 24 °N and was maintained for a long time. However, the southwesterly wind speed of the WPSH on its outside was weak, which could not transport large amounts of water vapor to Hubei. At the same time, the low trough located in the northern part of northeastern China consistently extended eastward at 200 hPa, and the cold air continued to propagate southward (Figure 4b). The water vapor flux transport was enhanced eastward (Figure 4c,d). The 5880 gpm line of the WPSH extended westward, and the mesoscale convective clouds inside the WPSH began to increase (Figure 5a). The shear appeared at 700 hPa in northern Hubei, and the low vortex system was located in central Hubei at 850 hPa. The positive vorticity advection in front of the low vortex strengthened the convergence uplifting movement in the middle layers (Figure 5b,c). The easterly airflow on the eastern side of the low vortex continuously transported water vapor from the western Pacific Ocean to the vicinity of the low vortex and Hubei at 925 hPa in the boundary layer (Figure 5d).
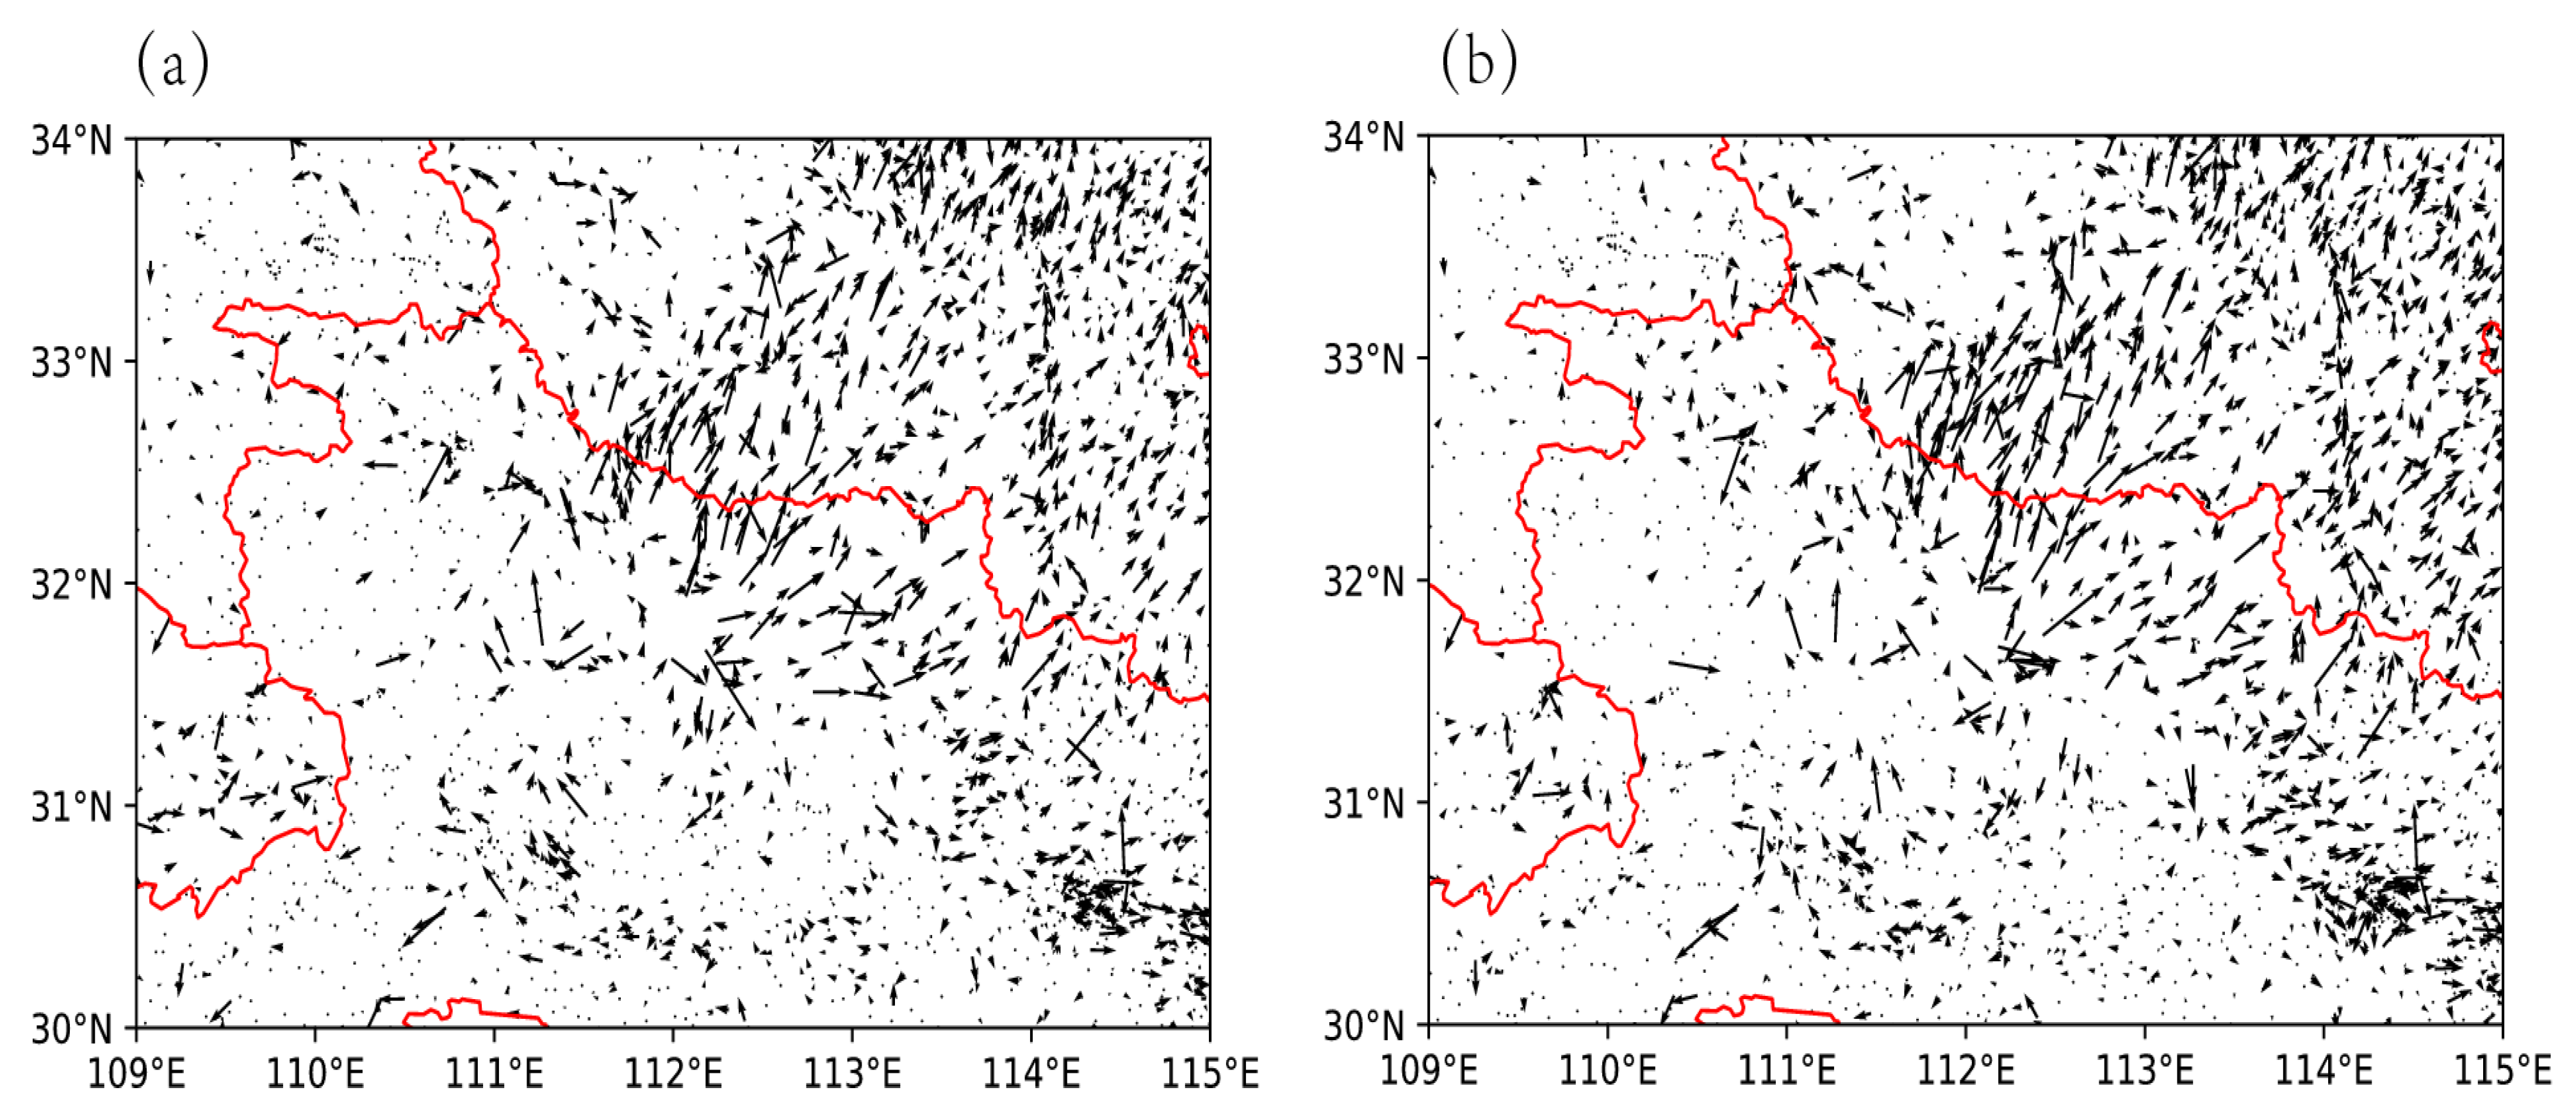
Around 21:00 UTC on 11 August, the cold air on the ground continued to invade western Hubei, passing through the Nanyang Basin, and then it entered Xiangfan, Suizhou, and other places. Meanwhile, the mesoscale low-vortex wind field appeared on the ground (Figure 6a,b).
In summary, the upper-level airflow divergence, the low- and middle-level vortex/shear, the easterly jet stream at the front of the low-level vortex, and the continuous intrusion of cold air on the ground jointly contributed to this extreme heavy precipitation event. The extreme hourly precipitation mainly occurred near the low vortex at the ground.
4. Numerical Experiments and Simulation Results
4.1. Experiment Design
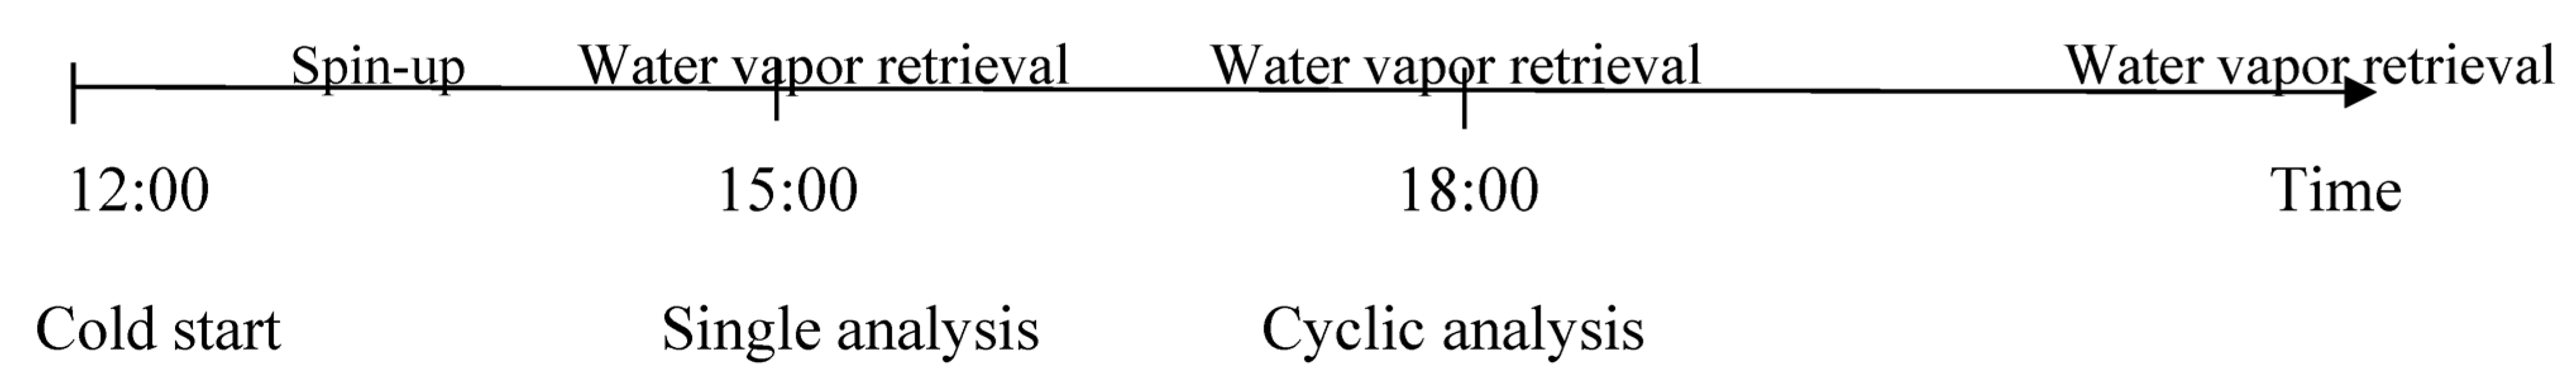
In this study, three experiments were conducted to compare the simulation results after assimilating the radar data. The experiment design is shown in Table 3, and WRF version 4.1 was used for the experiments. The model has double-layer nested grids, with an outer grid of 193 × 193 (a horizontal grid spacing of 9 km) and an inner grid of 289 × 289 (a horizontal grid spacing of 3 km). There are 35 levels in the vertical direction of the model, and the top level of the model is at 50 hPa. The parameterization scheme of the model includes the WRF single-moment 6-class microphysics scheme, the Yonsei University parameterization scheme for the boundary layer process, and the Kain–Fritsch cumulus parameterization scheme. The real-time analysis and forecast data provided by the European Center for Medium-Range Weather Forecasts to the China Meteorological Administration were used as the initial field and boundary conditions of the model. The flow chart of the assimilation experiment is shown in Figure 7.
4.2. Simulation Results
4.2.1. Simulation for Composite Reflectivity
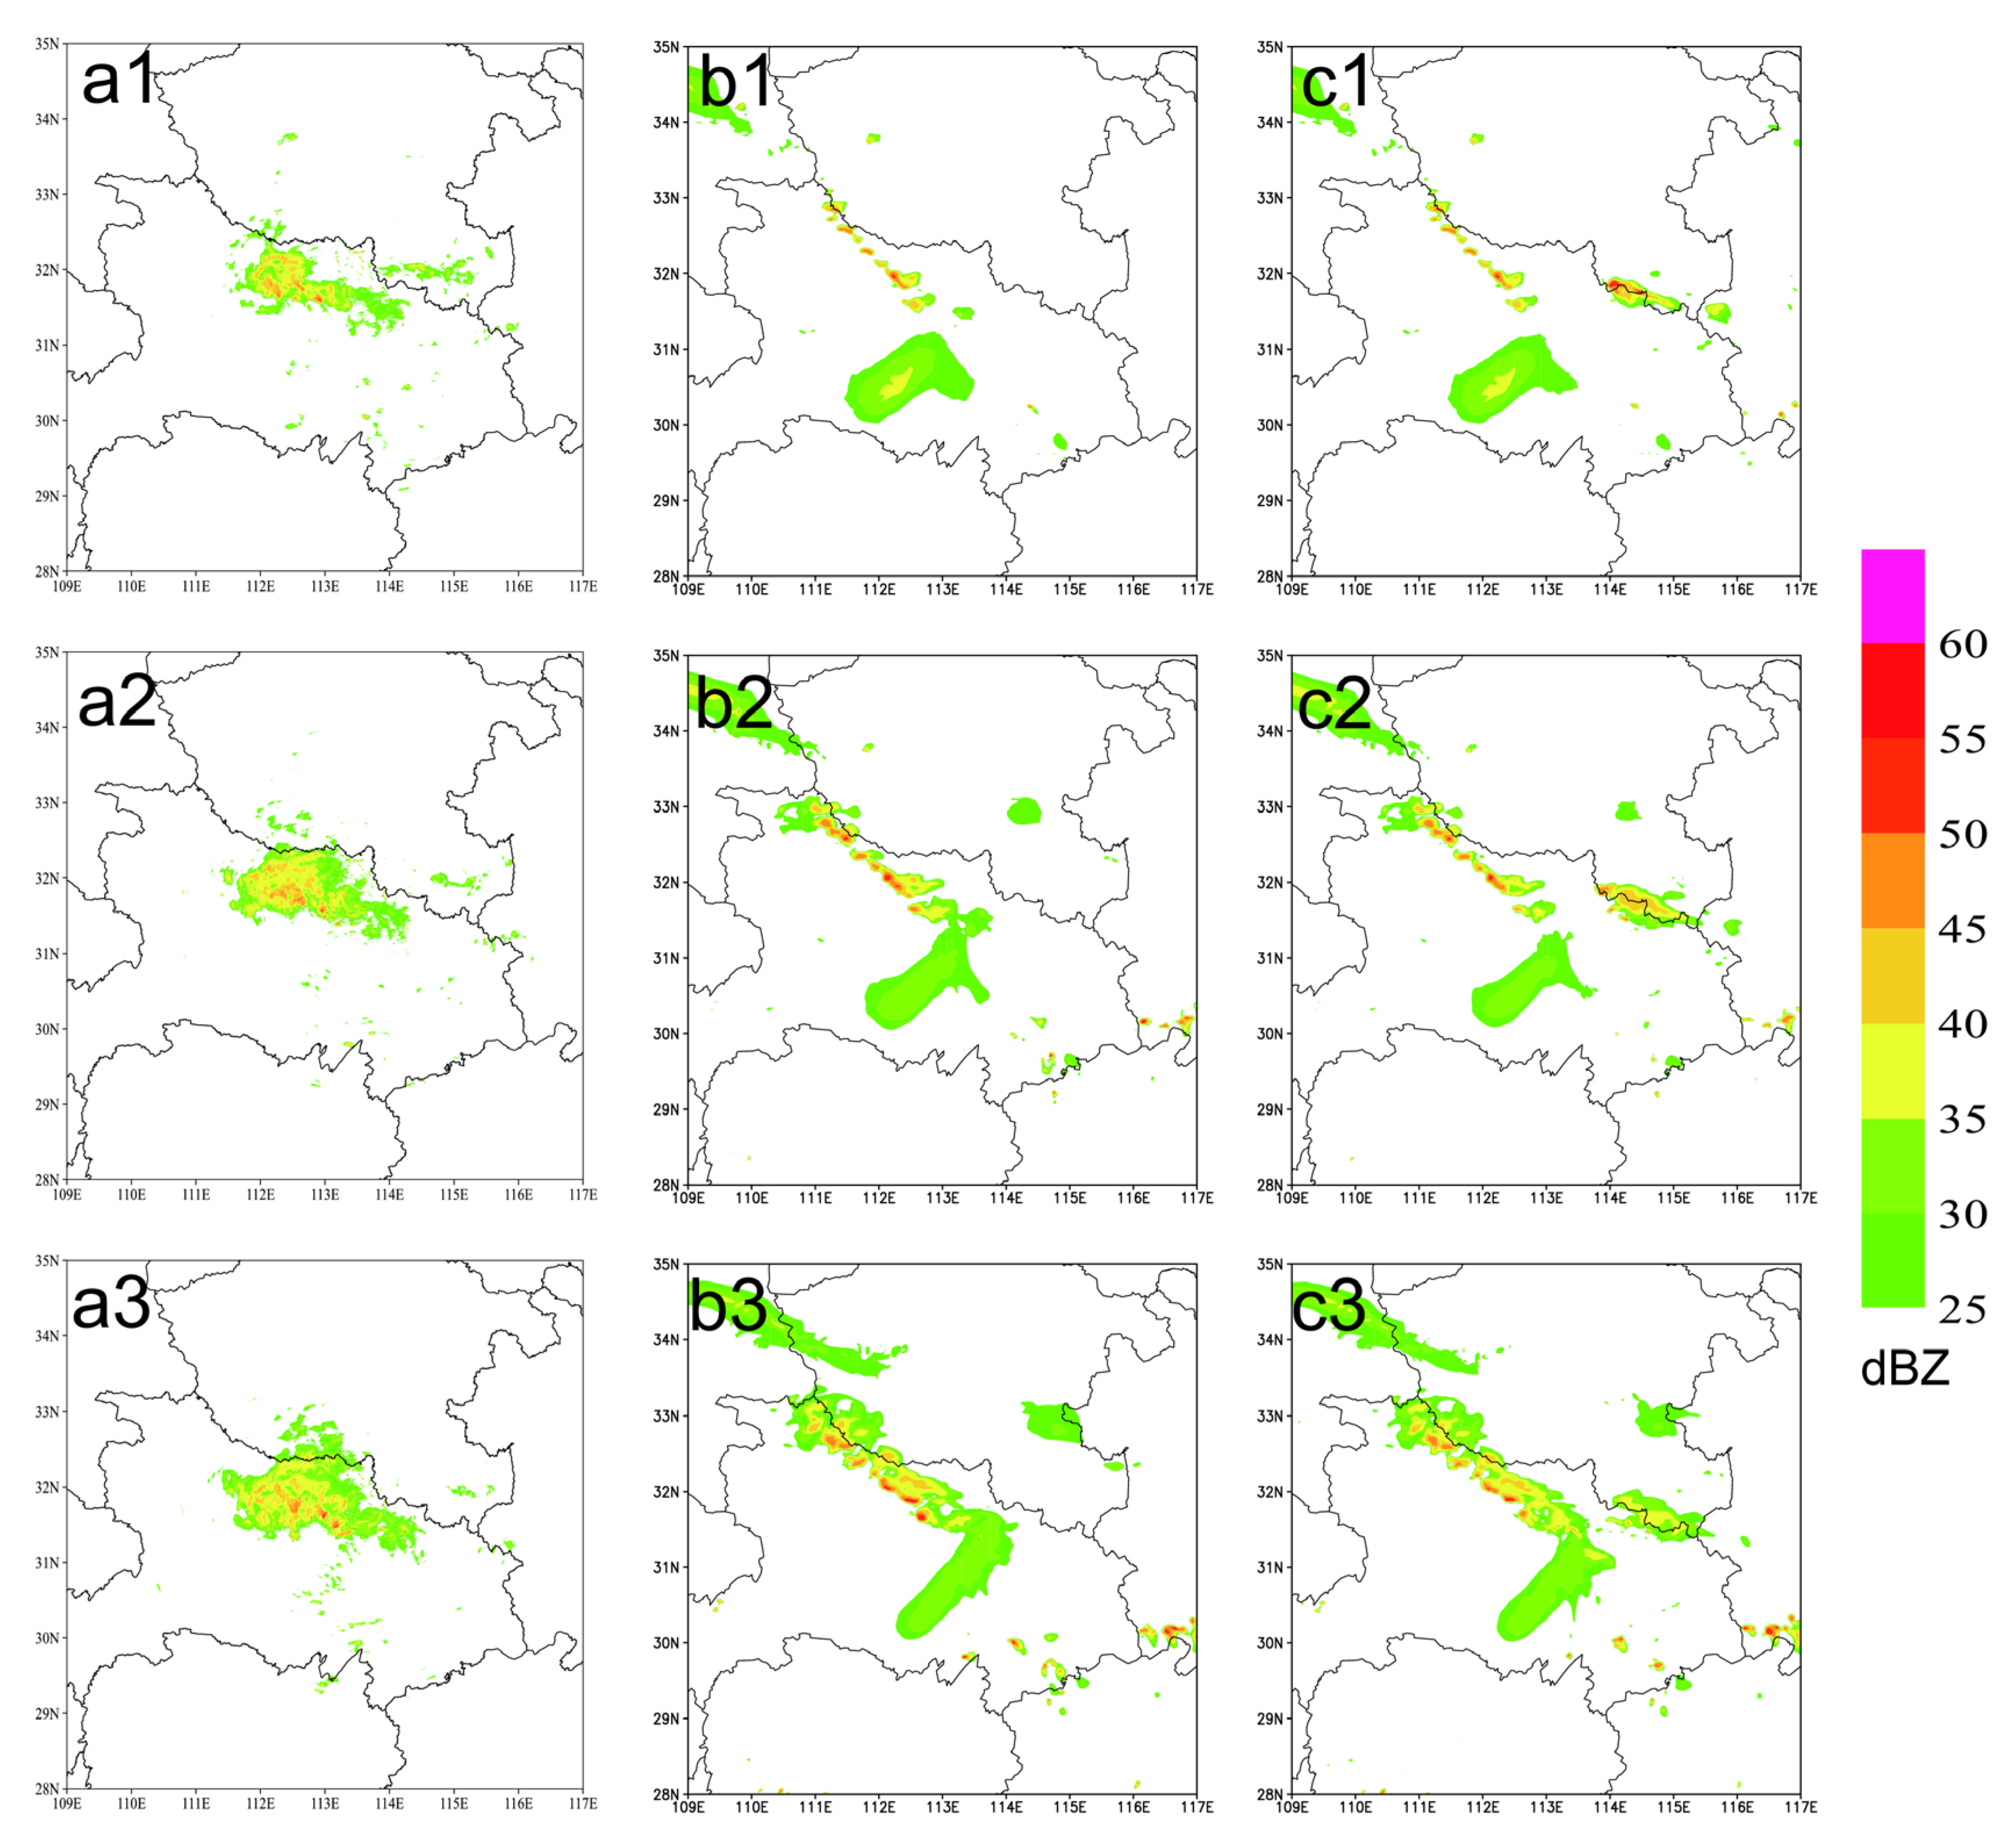
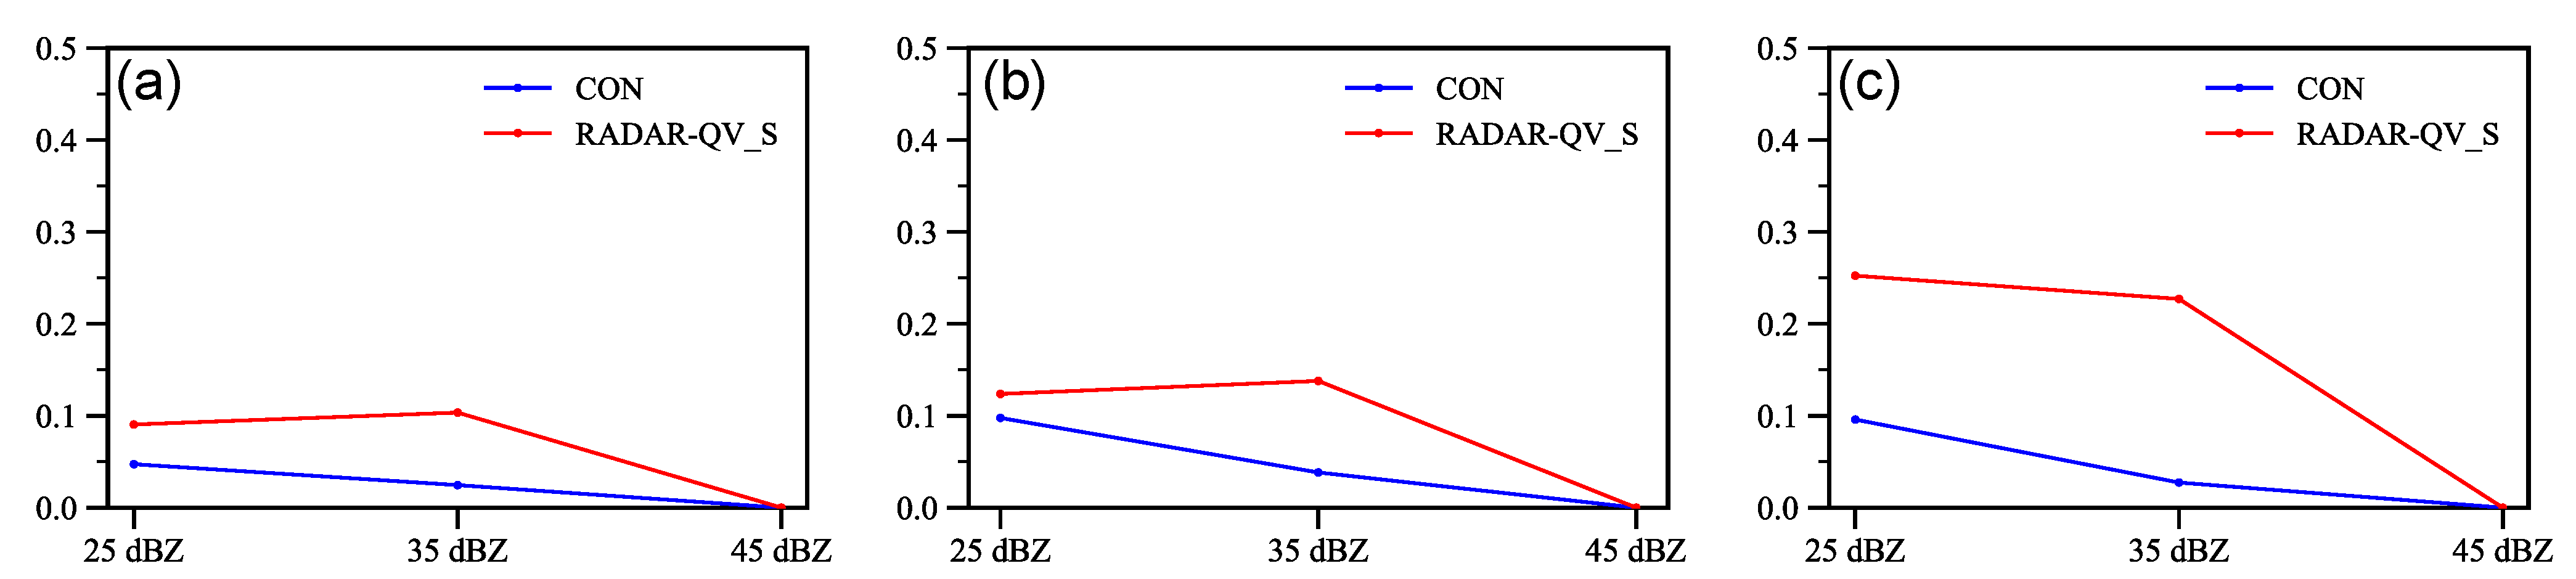
The simulated results of the composite reflectivity are shown in Figure 8. Compared to the observed composite reflectivity at 16:00, 17:00, and 18:00 on 11 August (Figure 8(a1–a3)), the intensity of echoes from both the CON experiment and the RADAR-QV_S experiment (Figure 8(b1–b3,c1–c3)) were weaker than that in the observation in northern Hubei province. In addition, the area of the simulated echo was also smaller. The echo from the RADAR-QV_S experiment at 16:00 was similar to those in the observations in southern Henan province. However, the echo of RADAR-QV was stronger than that in the observation at 17:00 and 18:00. To quantitatively assess the effectiveness of the composite reflectivity forecasts, Figure 9 shows the TS values of 1 h composite reflectivity forecast at 16:00, 17:00, and 18:00 11 August. It is obvious that the composite reflectivity forecasts of RADAR-QV_S at 18:00 generally exhibit the best quality.
4.2.2. Precipitation Simulation
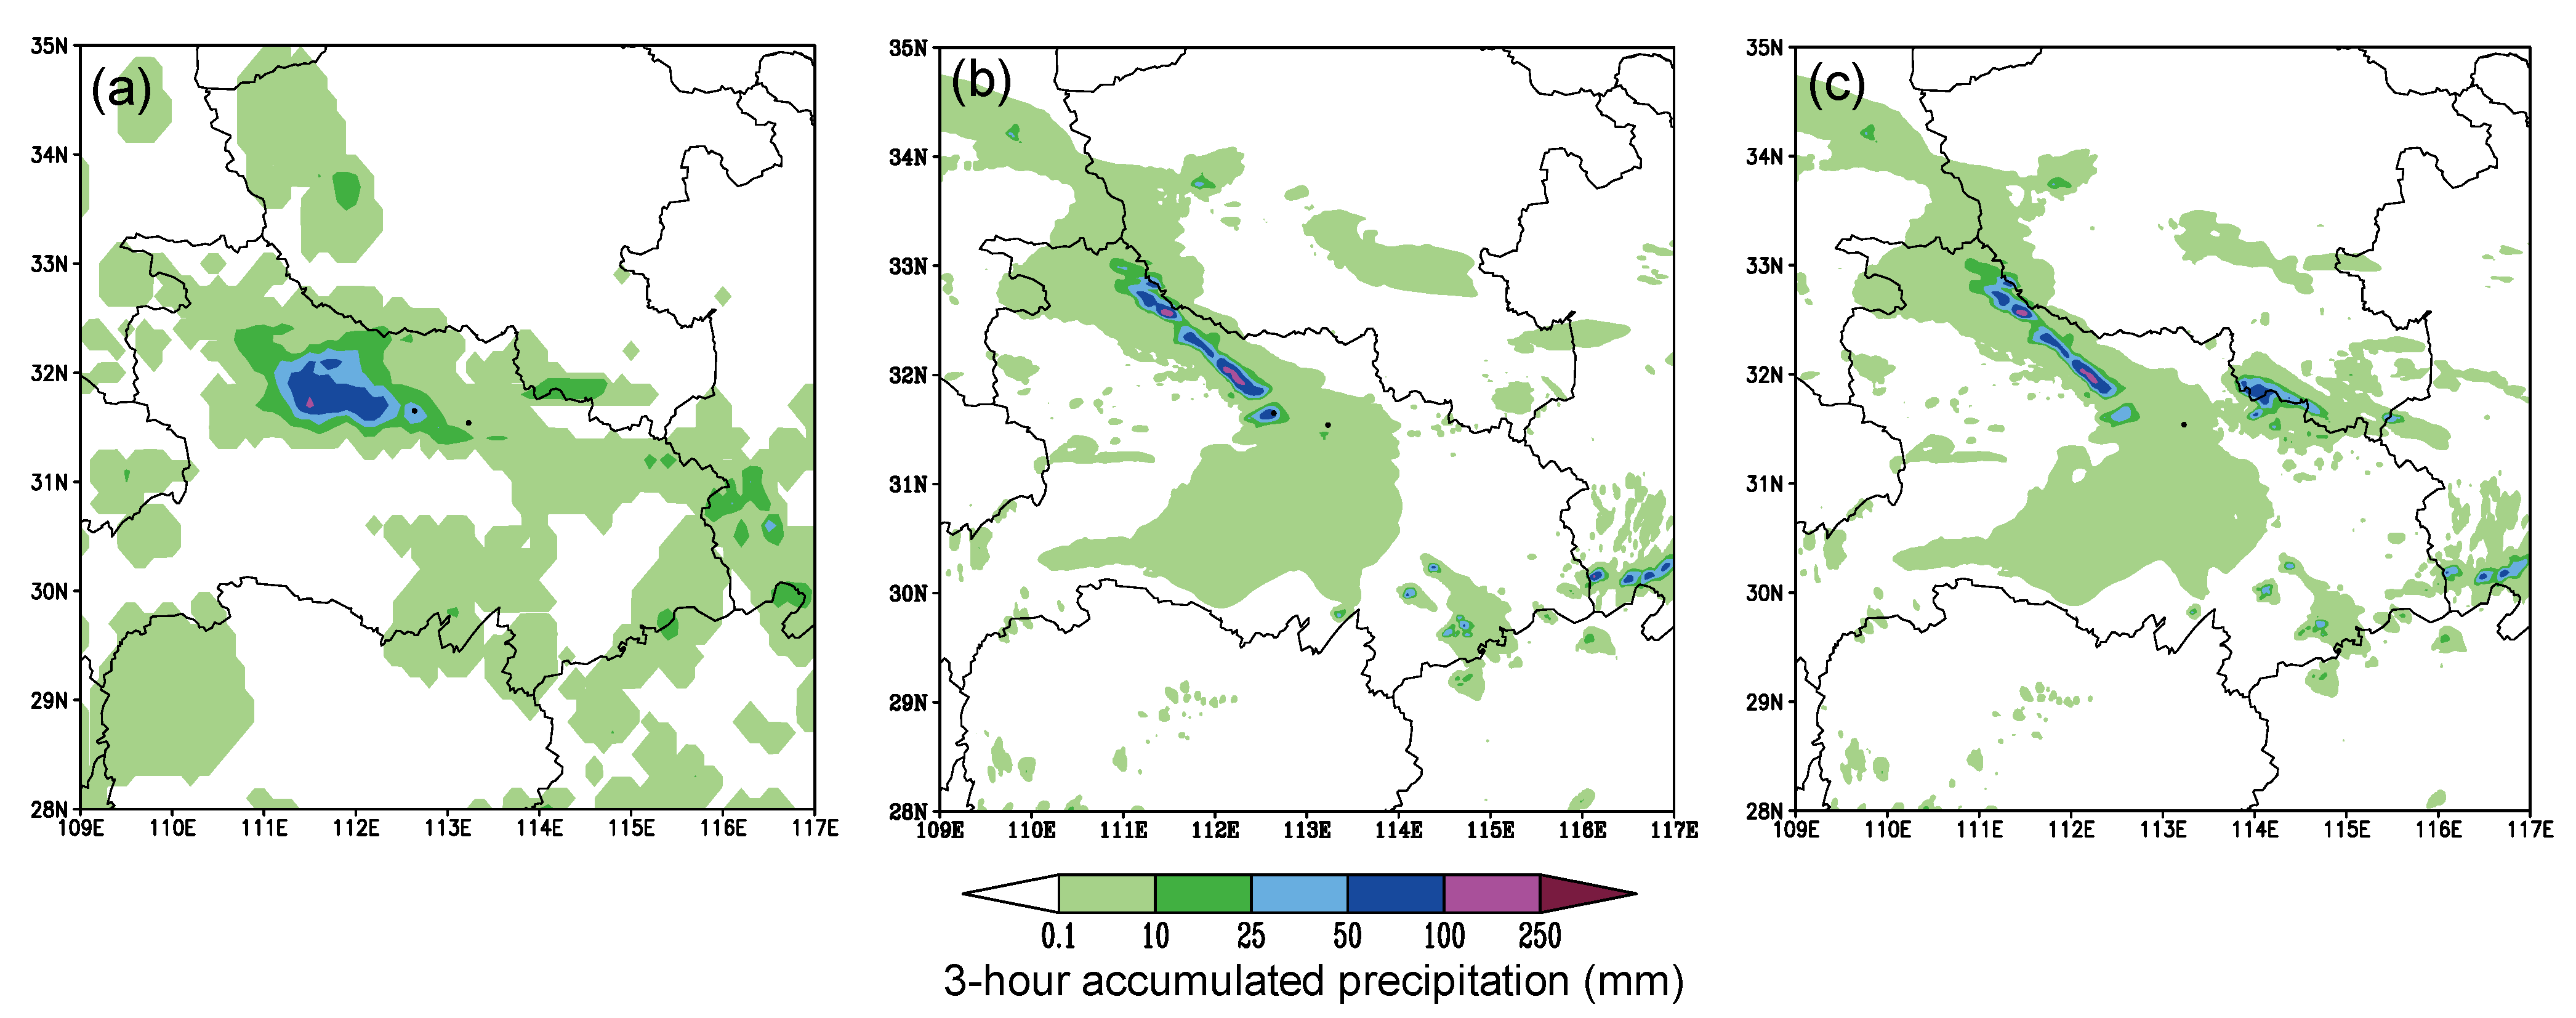
By analyzing the 3 h precipitation from 15:00 11 August to 18:00 11 August 2021 (Figure 10), it can be seen that the false precipitation in Hubei from the RADAR-QV_S experiment was weaker than that from the CON experiment. It can also be found that the precipitation from the RADAR-QV_C experiment was closer to that in the observation in northeastern Hubei province.
4.3. Simulation Results from RADAR-QV_C Experiment
4.3.1. Simulation for Composite Reflectivity
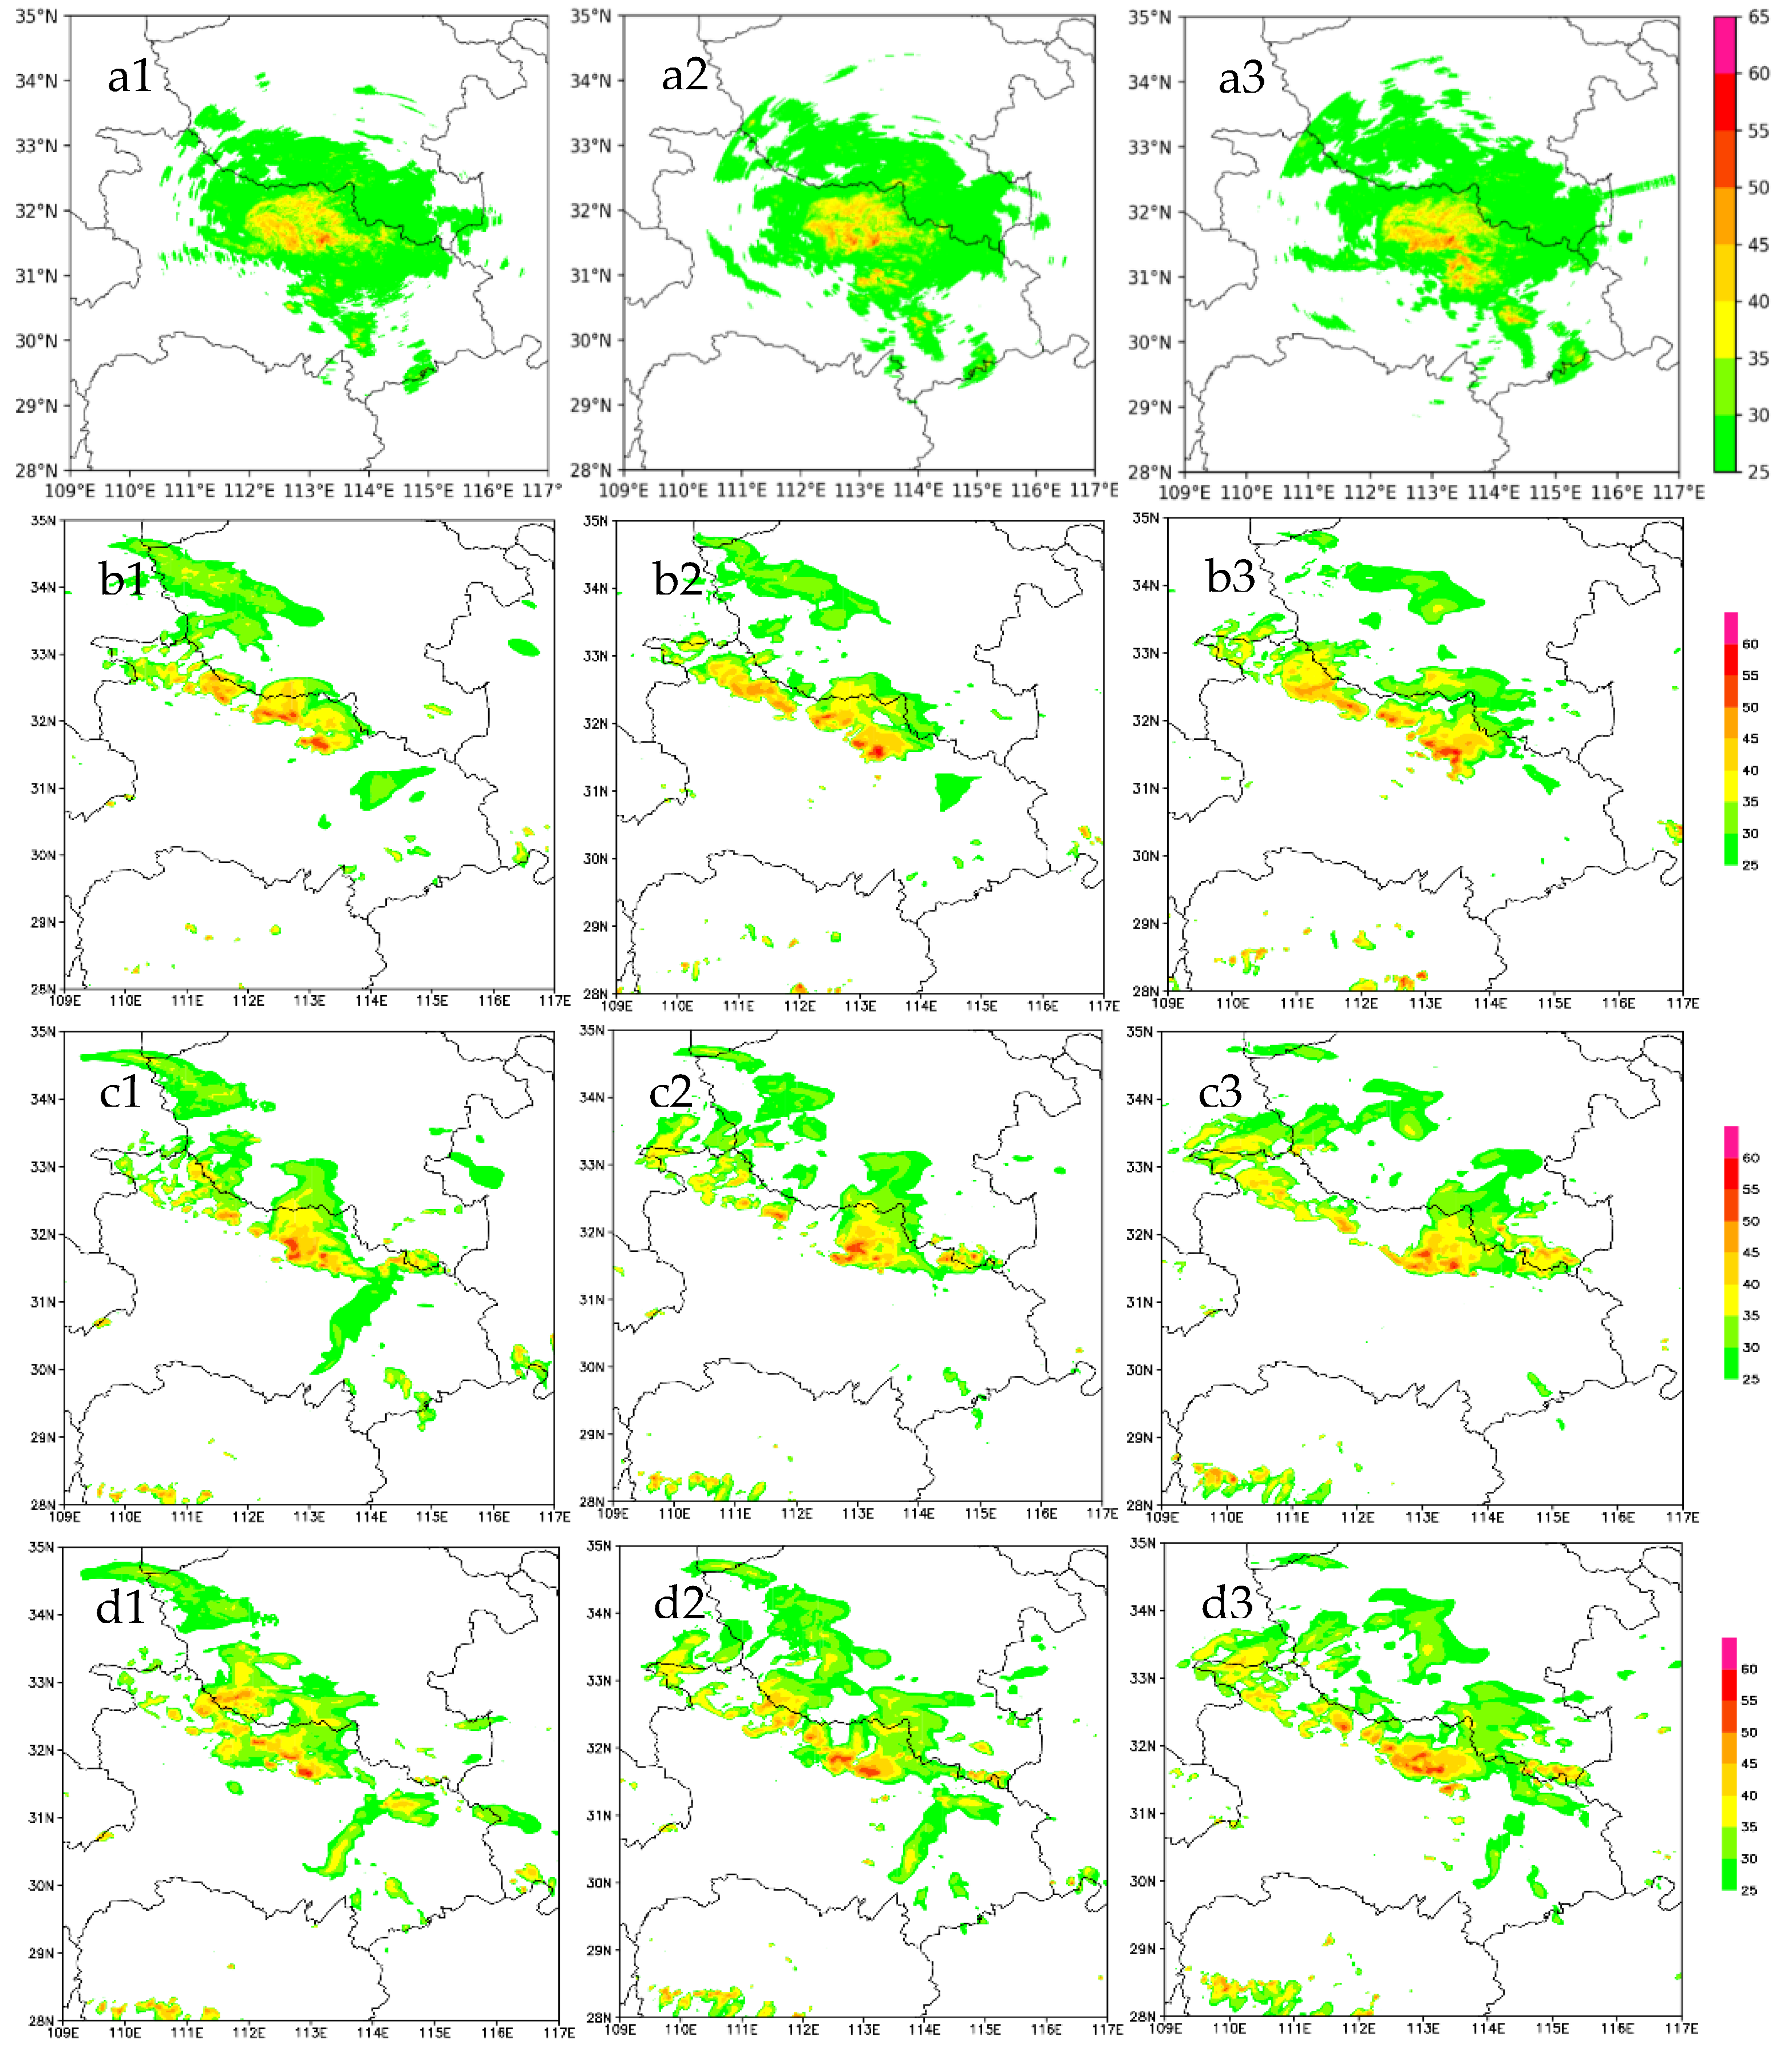
The reflectivity from the experiments is shown in Figure 10. Compared to the observations (Figure 11(a1–a3)), the composite reflectivity (Figure 11(b1–b3)) from the control (CON) experiment at 20:00 UTC, 21:00 UTC, and 22:00 UTC on 11 August is noticeably more northward and eastward than that from the RADAR-QV_S and RADAR-QV_C experiments. The comparison of the echoes between the RADAR-QV_S and RADAR-QV_C experiments shows that the composite reflectivity from the RADAR-QV_S experiment (Figure 11(c1)) and the RADAR-QV_C experiment (Figure 11(d1)) is closer to the observations in terms of the echo center of the extreme heavy precipitation in Suizhou (113.333 °E, 31.617 °N) and Yicheng (112.826 °E, 31.65 °N) at 20:00 UTC on 11 August. At 21:00 UTC, the composite reflectivity from the RADAR-QV_S experiment (Figure 11(c2)) and the RADAR-QV_C experiment (Figure 11(d2)) is closer to the observed echo in Yicheng but is slightly northward. The composite reflectivity from the RADAR-QV_S experiment is weaker and more eastward than that from the RADAR-QV_C experiment, while the results from the RADAR-QV_C experiment are closer to the observations. At 22:00 UTC, the composite reflectivity simulation in the RADAR-QV_C experiment (Figure 11(d3)) is also better than that in the RADAR-QV_S experiment (Figure 11(c2)), which is the same as the situation at 21:00 UTC. The echoes in the centers of the extreme heavy precipitation in Suizhou (113.333 °E, 31.617 °N) and Yicheng (112.826 °E, 31.65 °N) are clearly visible in the RADAR-QV_C experiment.
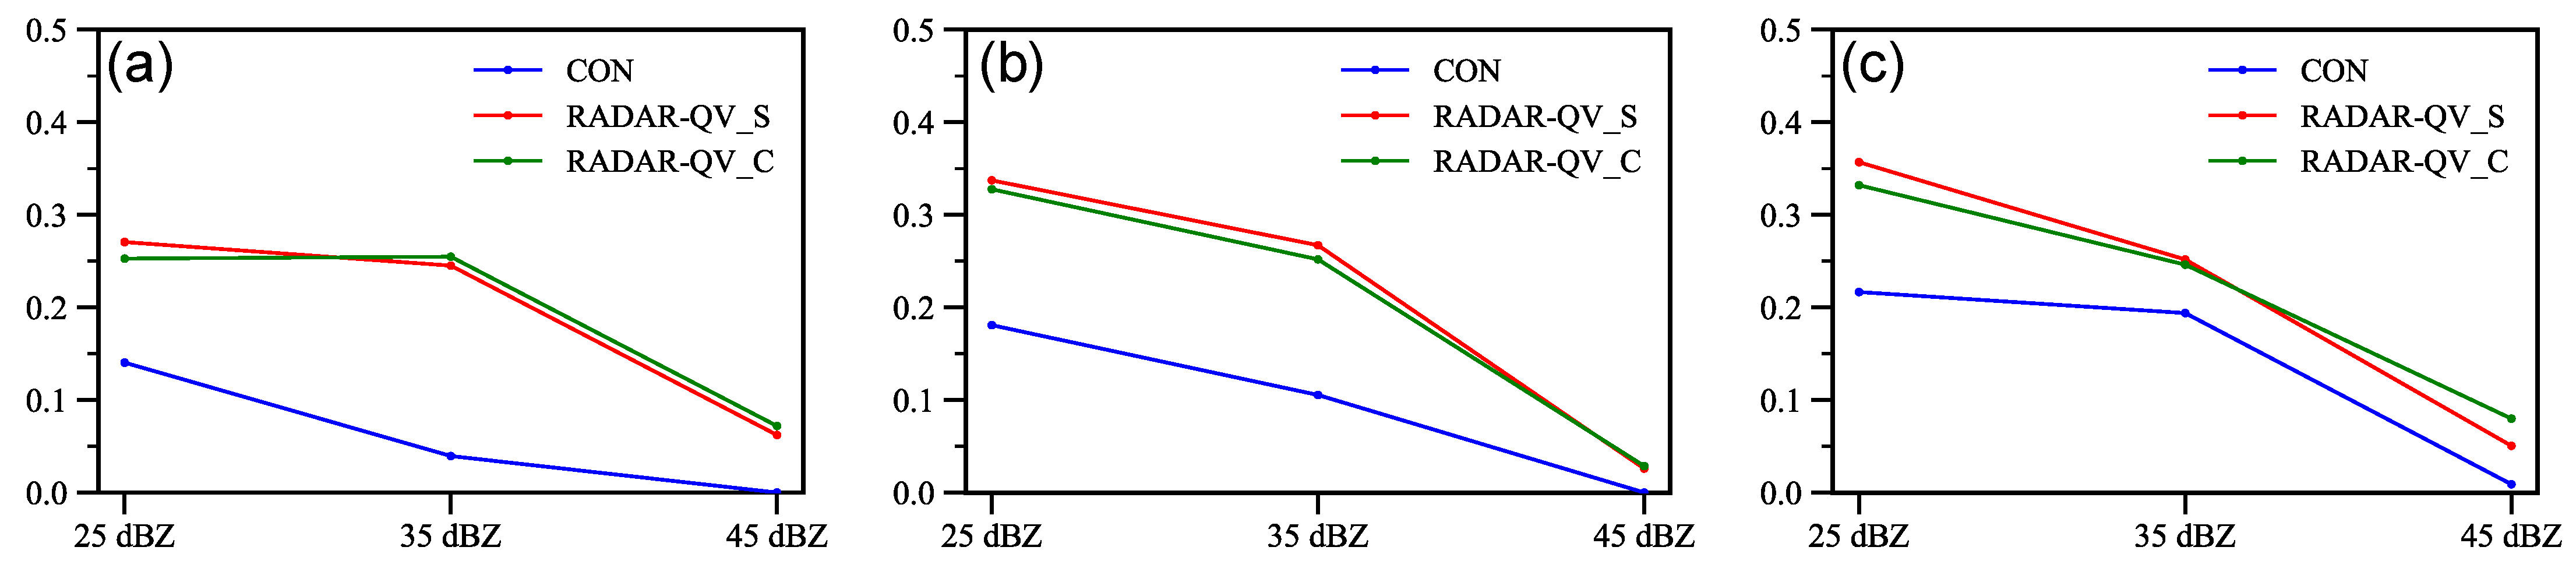
In addition, Figure 12 displays the TS values of the composite reflectivity forecasts to further assess their forecast skills. Clearly, the TS values of RADAR-QV_S and RADAR-QV_C are overall higher than those of CON, which implies that the hydrometeor and water vapor retrieval tended to improve the forecast skill. Furthermore, compared to CON and RADAR-QV_S, the RADAR-QV_C experiment has more accuracy in the reflectivity forecast at the thresholds of 25 dBZ and 35 dBZ. For the threshold of 45 dBZ, all experiments seem to depart from the truth.
Overall, the mesoscale information is better characterized by assimilating the retrieved hydrometeor concentration and water vapor content. To be specific, the simulated composite reflectivity is closer to the observed echo, leading to a more accurate rainfall forecast after assimilating the hydrometeor concentration and the water vapor content. It should also be noted that, although the predicted short-term extreme heavy precipitation is closer to the observation, the intensity of the simulated echo is slightly stronger than the observations after using the cycling retrieval scheme.
4.3.2. Precipitation Simulation
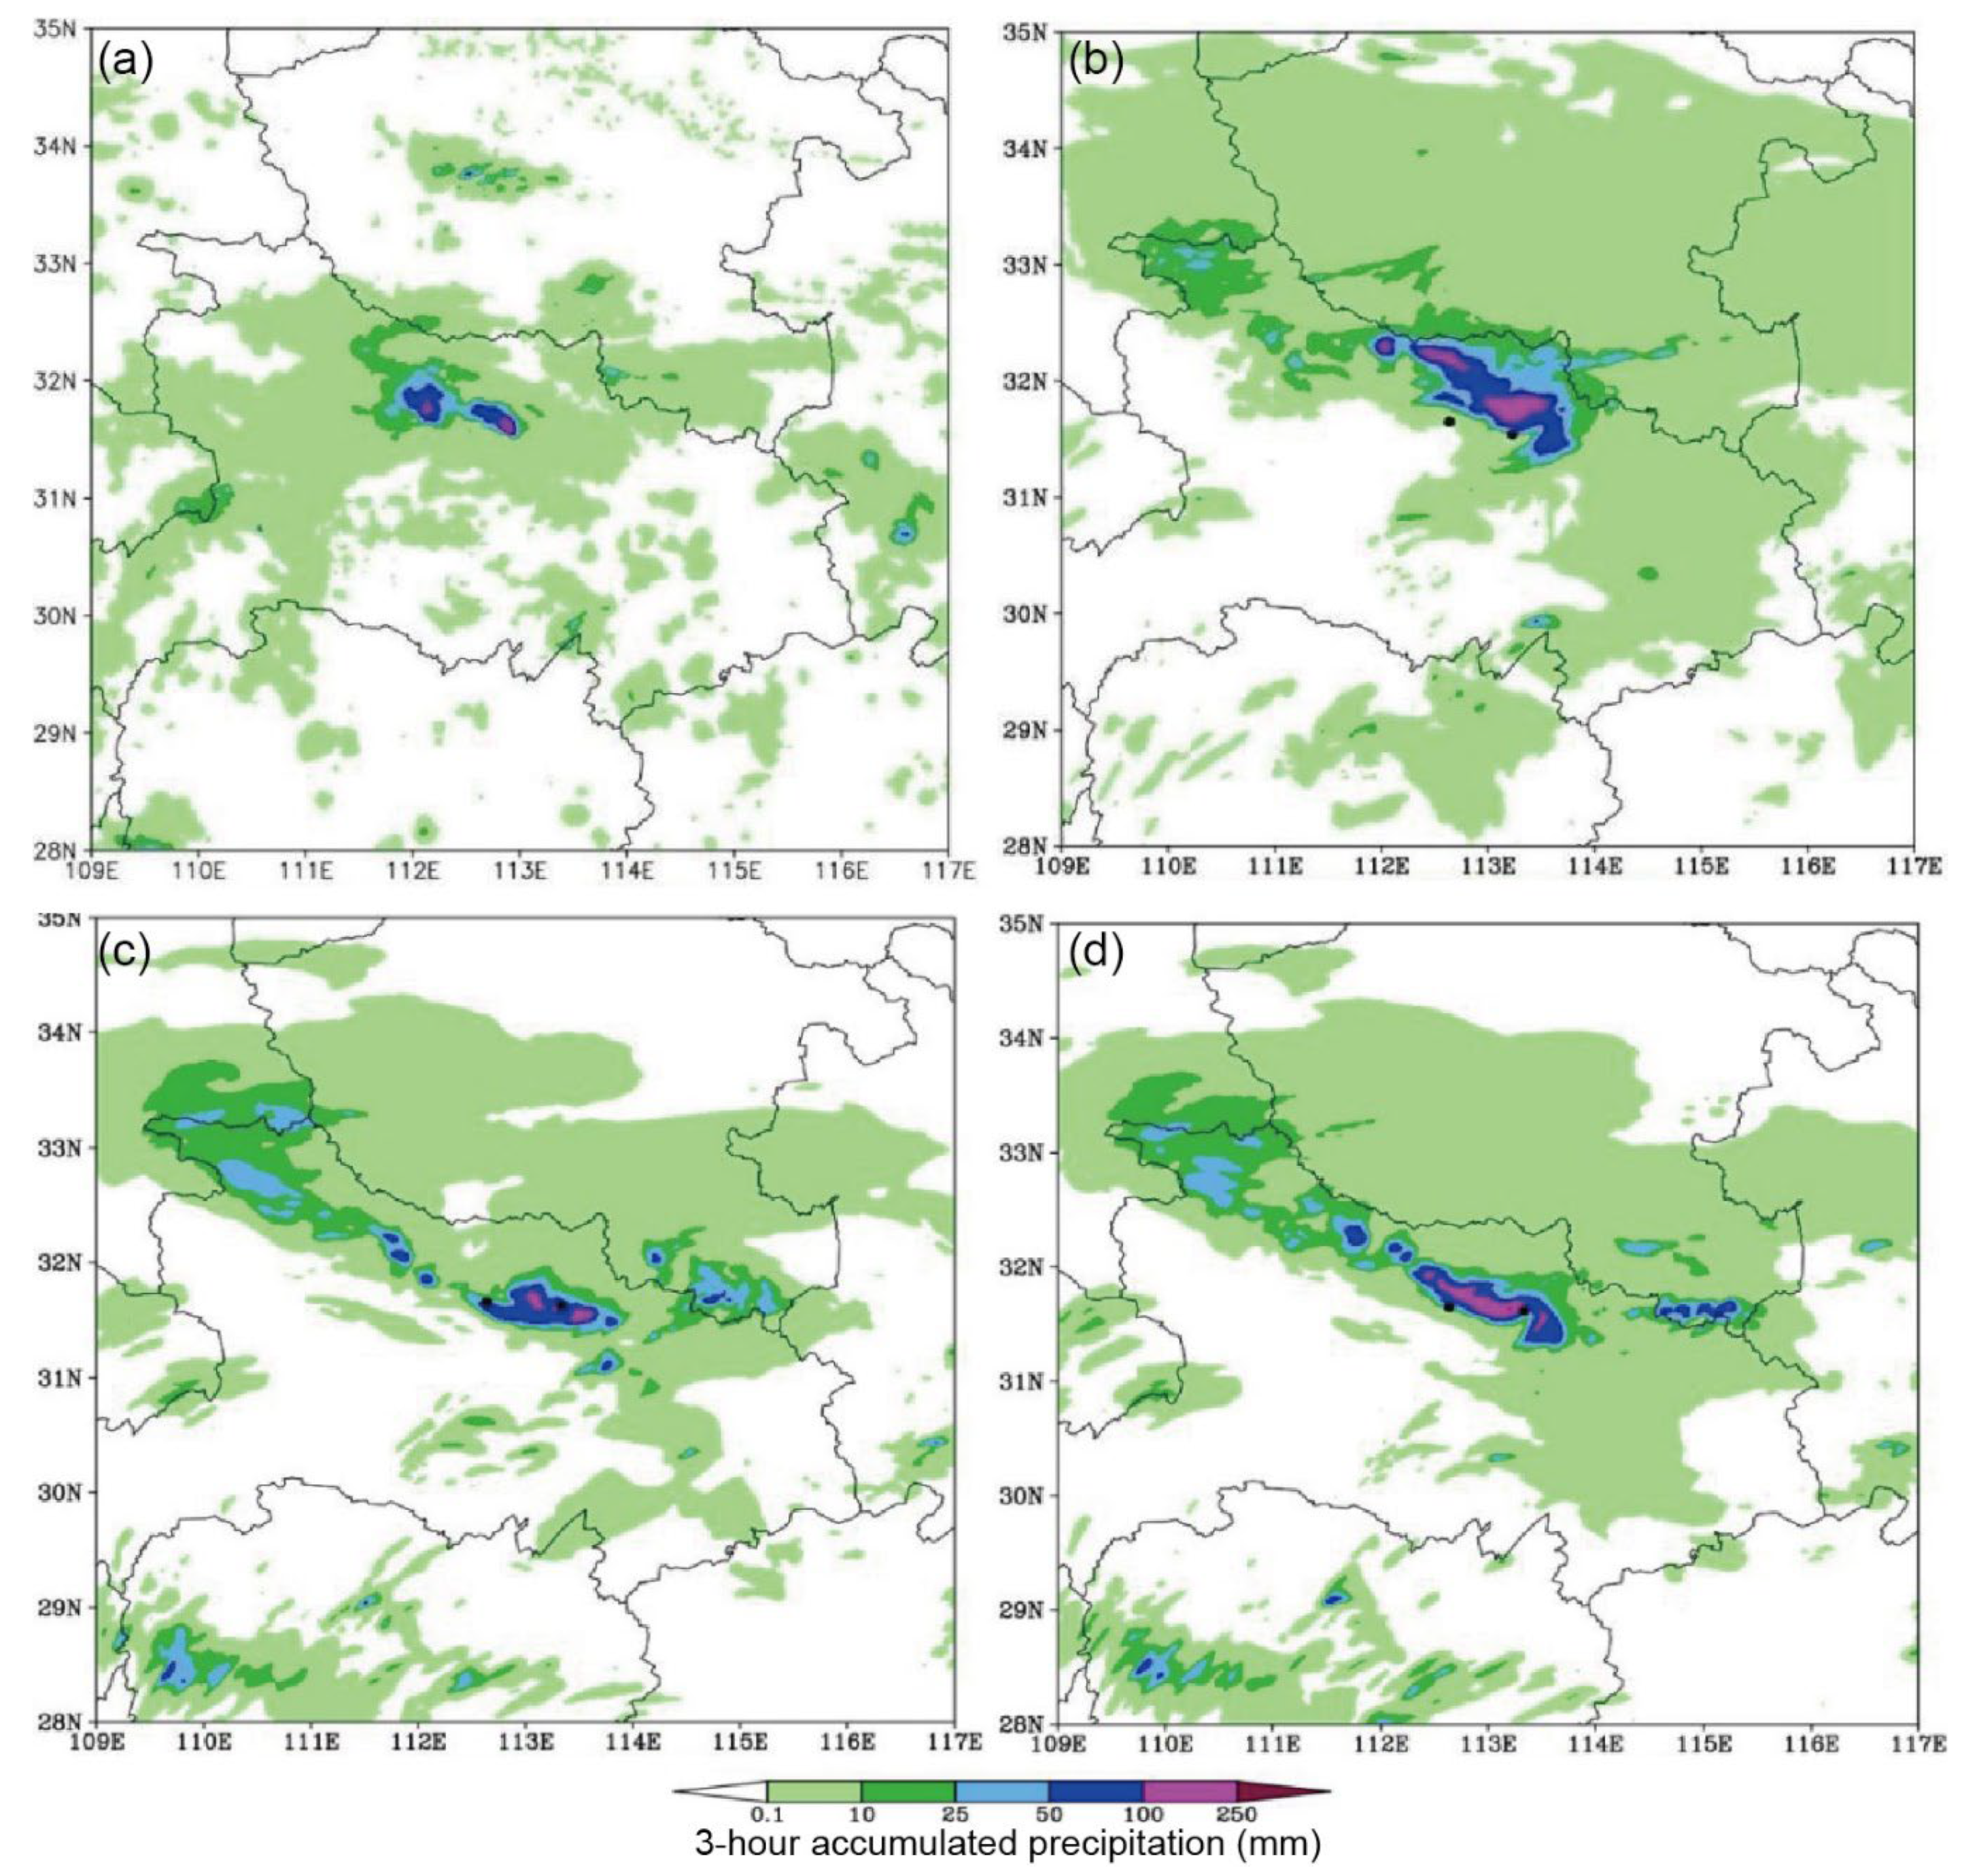
By analyzing the 3 h rainfall from 21:00 UTC on 11 August to 00:00 UTC on 12 August 2021 (Figure 13), it can be seen that the 3 h rainfall of more than 50 mm from the CON experiment is more northward than the observations. However, the forecasted precipitation in the RADAR-QV_S experiment and the RADAR-QV_C experiment agrees well with the observations. In particular, the areas with rainfall of more than 50 mm in the RADAR-QV_C experiment are more comparable to the observation than those in the RADAR-QV_S experiment.
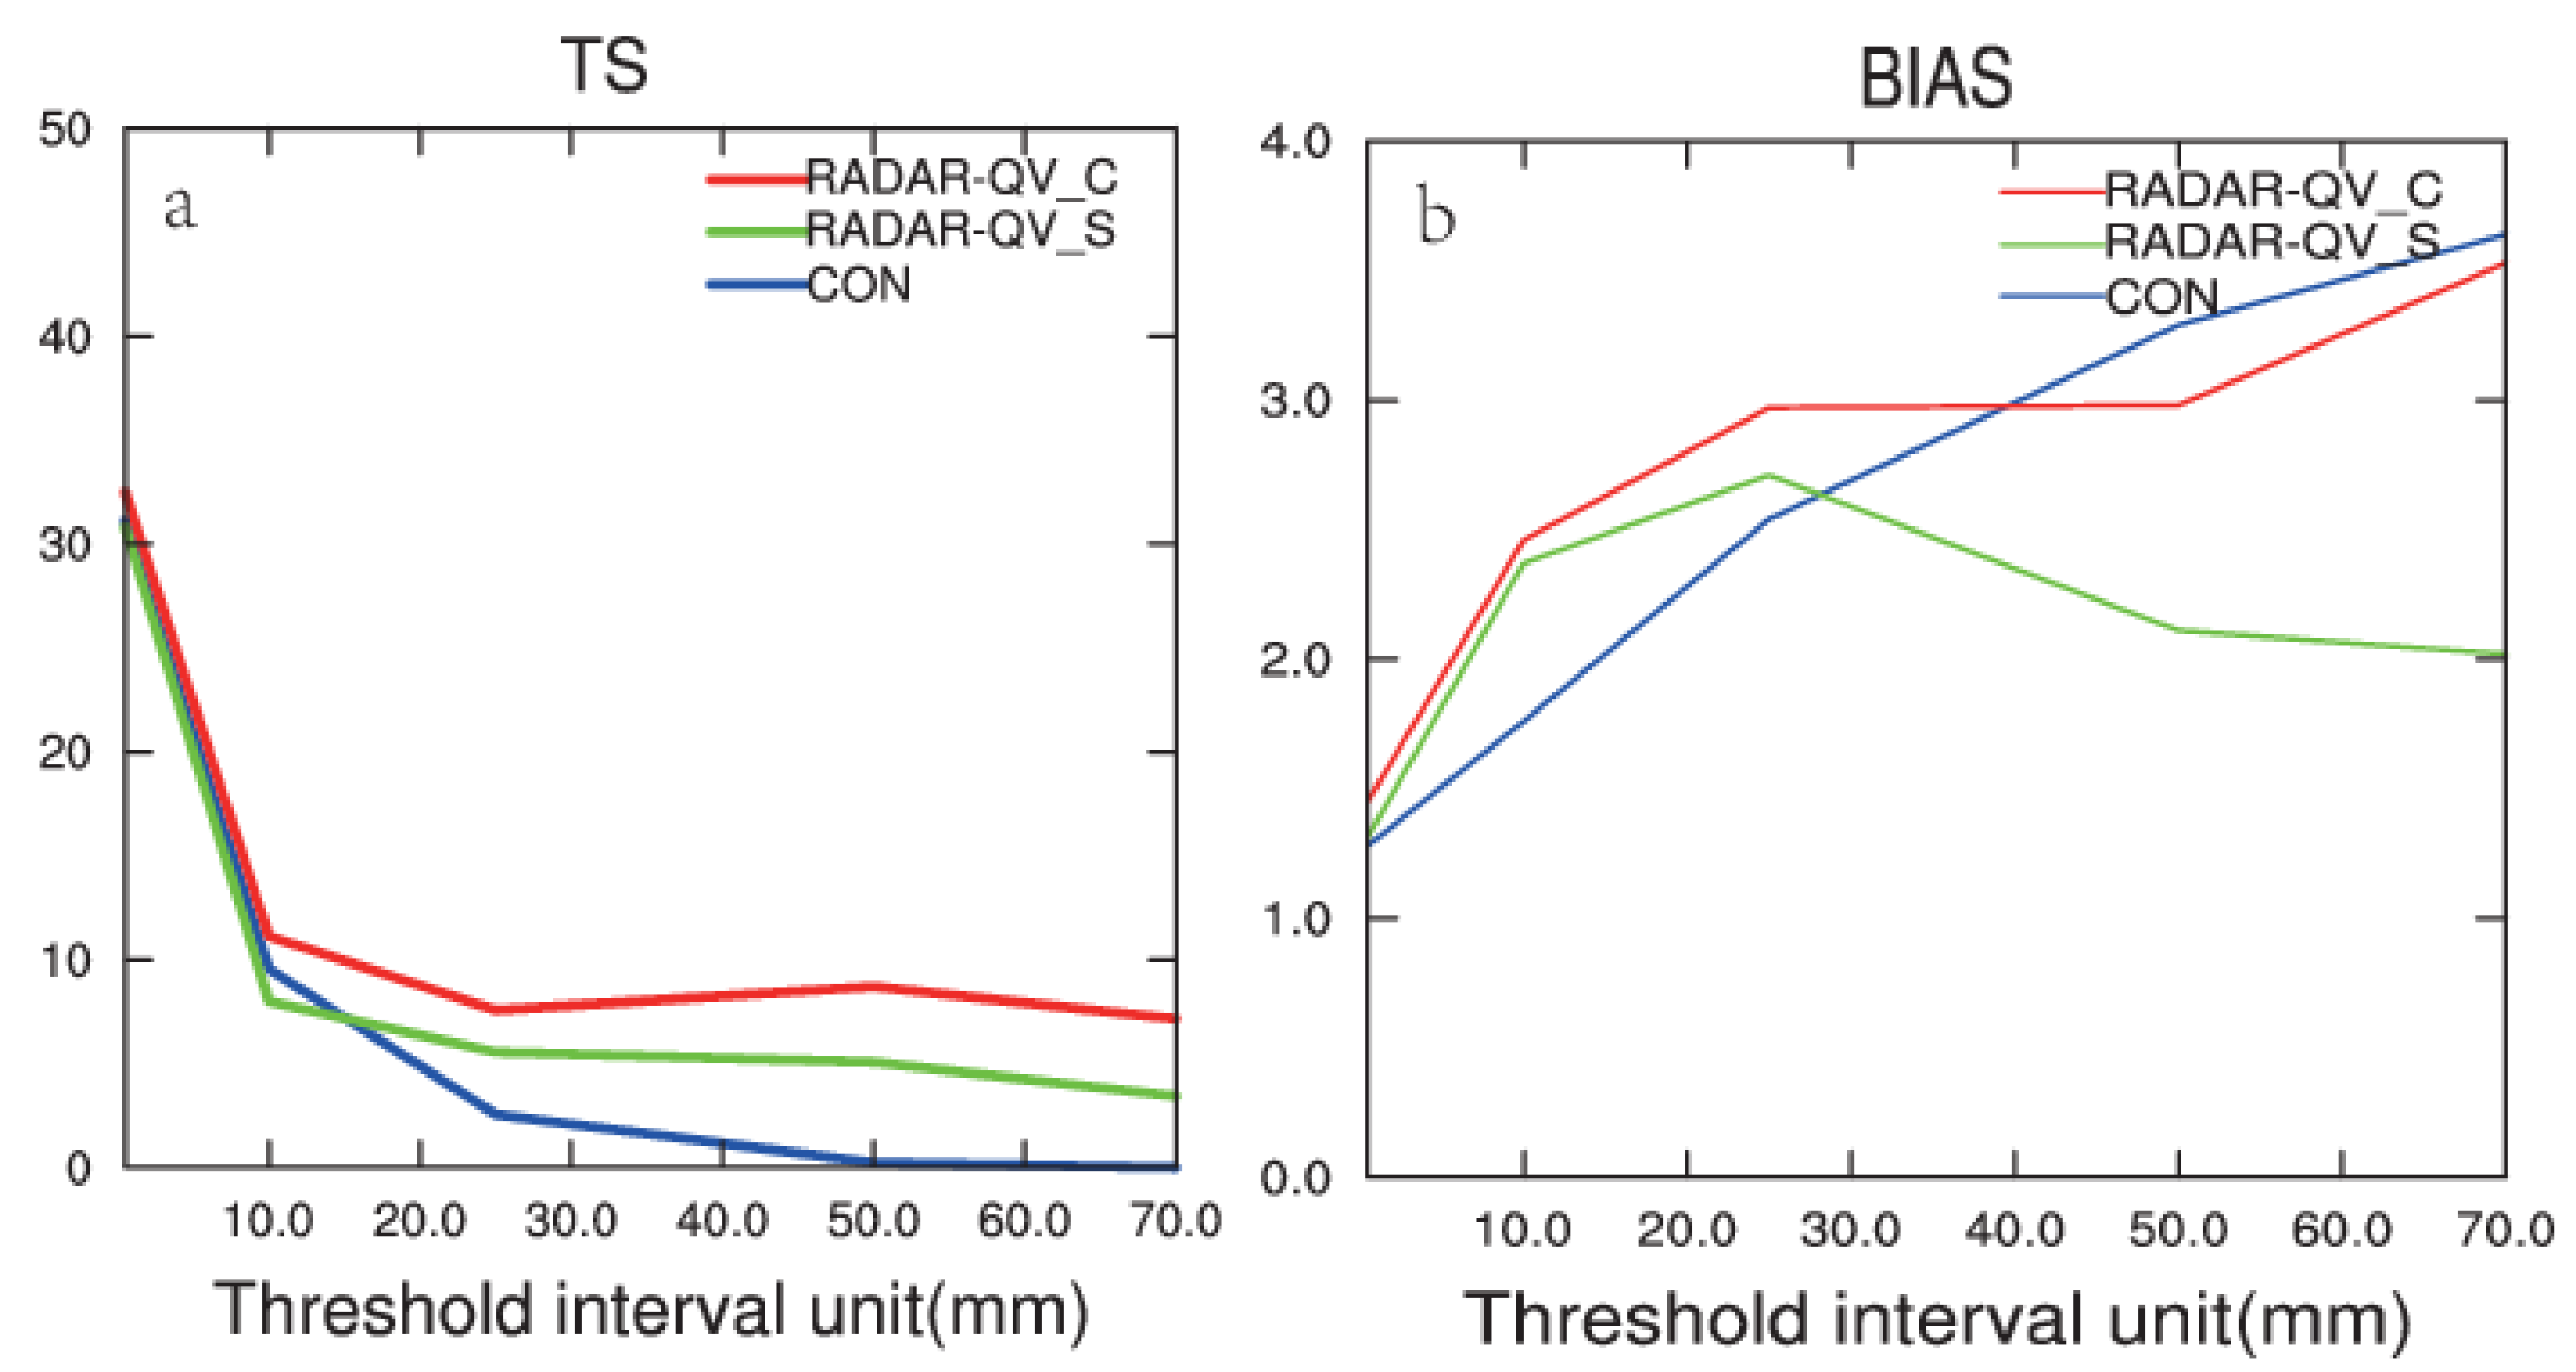
The threat score (TS) and bias score (BIAS) were used to quantitatively verify the simulation results from the three experiments.
where represents the number of stations (times) with correct forecasts, is the number of stations (times) with false alarms, and is the number of stations (times) with missing alarms. The larger the TS value, the better the forecast.
For the TS of the 3 h precipitation forecast from 21:00 UTC on 11 August to 00:00 UTC on 12 August 2021 (Figure 14a), the TS differences among the CON, RADAR-QV_S and RADAR-QV_C experiments are not obvious for the thresholds above 0.1 mm, and the TS for the CON experiment is slightly higher. For the thresholds above 5 mm, the TS values for the RADAR-QV_S and RADAR-QV_C experiments are higher than those for the CON experiment. In terms of the thresholds above 10 mm and 15 mm, the TS value for the RADAR-QV_C experiment is higher than that for the RADAR-QV_S experiment, while the TS for the CON experiment is the lowest. Also, the BIAS (Figure 14b) for the RADAR-QV_C experiment is less than that for the RADAR-QV_S experiment, and closer to 1.0.
For the case of retrieving the hydrometeor concentration and water vapor content by Z, KDP, and ZDR, the location and intensity of the short-term precipitation are the closest to the observations, and the echo features are more obvious. The precipitation forecast is better after assimilating the dual-polarization radar data in the assimilation cycle, and the positive improvement can last up to 3 h.
5. Conclusions and Discussion
In this study, numerical simulation experiments with radar data assimilations were conducted for an extreme heavy precipitation event that occurred on 11 August 2021. The hydrometeor concentration and water vapor content in the initial field of the model were retrieved by using the statistical relationship of the RH and the radar reflectivity. This is because the RH field is constrained by the KDP and ZDR, which are the dual-polarization radar parameters, and adjusting the humidity field can suppress the false alarm of convection. The main conclusions are as follows.
The extreme heavy precipitation was caused by multiple factors. The easterly jet in front of the vortex and the continuous southward cold air were the direct causes. The divergence of upper-level airflow and the middle- and lower-layer vortex/shear provided dynamic conditions for the occurrence of this extreme heavy precipitation event.
The experiment results show that the forecast of the composite reflectivity of this convective process more clearly reflects the characteristics of the mesoscale system after adjusting the hydrometeor concentration and water vapor content by the radar data. In addition, the short-term extreme heavy precipitation forecast is closer to the observation. The improvement of the assimilating radar data can be maintained for about 3 h.
The composite reflectivity forecast is consistent with the observation by cyclically adjusting the water vapor field. In addition, the 3 h precipitation rainfall area is closer to the observation after cyclically adjusting the hydrometeor concentration and water vapor content. Meanwhile, the rainfall intensity is stronger than the observation in the areas with strong echoes.
Based on the above conclusions, it is found that using polarization data as KDP and ZDR and reflectivity data retrievals of the hydrometeor concentration and water vapor content over background values can improve extreme heavy precipitation forecasts. However, there are still problems yet to be answered and considerable potential for improvement. Firstly, false precipitation still exists after adjusting the water vapor, although it is less than that in the background field. This phenomenon can be explained by the fact that only RH and Z are used in the statistical relationships. Thus, the polarization radar parameters may need to be added as constraints. Secondly, the variable balance needs to be considered after adjusting the hydrometeor concentration and water vapor content. More effective strategies, such as four-dimensional/three-dimensional variational or EnKF data assimilation methods, should be tried in future studies to correct the false alarm of convection.
This study focuses on the application of hydrometeor and water vapor retrievals, and more experiments will be planned in the future to verify the water vapor retrieval relationship in other cases. It is worth noting that the water vapor content was retrieved in this study by the statistical relationship between the radar reflectivity and the relative humidity, and the polarization parameter was mainly used to constrain the overestimation of the water vapor content. Therefore, a new retrieval relationship should be established to change the water vapor content in clouds by using KDP/ZDR. The related technique will also be considered by applying other widely used hydrological models.
Author Contributions
Conceptualization, Z.H. and J.Y.; methodology, Z.H.; software, Z.L. and J.Y.; data curation, C.L.; writing—original draft preparation, Z.H.; writing—review and editing, Z.H. and L.S. All authors have read and agreed to the published version of the manuscript.
Funding
This research was funded by the National Key R&D Program of China (Grant No. 2023YFC3007703), the Natural Science Fund of Anhui Province of China (Grant No. 2308085MD127), the Innovation and Development Project of the China Meteorological Administration (Grant No. CXFZ2021Z033), the Open Research Fund Project on Drought–Flood Disasters in the Plateau and Basin Key Laboratory of Sichuan Province (Grant No. SZKT202002), the Scientific Development Foundation of the Anhui Meteorological Service (Grant No. KM201902), the Innovation and De-velopment Project of the Anhui Meteorological Service (Grant No. CXM202205), and the Post-graduate Research & Practice Innovation Program of Jiangsu Province (KYCX23_1332). We acknowledge the High Performance Computing Center of Nanjing University of Information Science & Technology for their support of this work. We thank Nanjing Hurricane Translation for reviewing the English language quality of this paper.
Institutional Review Board Statement
Not applicable.
Informed Consent Statement
Not applicable.
Data Availability Statement
The NCEP reanalysis data is available at https://rda.ucar.edu/datasets/, accessed on 23 September 2023, and the source code of WRF and WRFDA can be downloaded from https://github.com/wrf-model, accessed on 23 September 2023. The radar observations after quality control and precipitation observations are provided by Hubei Provincial Meteorological Bureau.
Conflicts of Interest
The authors declare no conflict of interest.
References
- Barbero, R.; Fowler, H.J.; Lenderink, G.; Blenkinsop, S. Is the intensification of precipitation extremes with global warming better detected at hourly than daily resolutions? Geophys. Res. Lett. 2017, 44, 974–983. [Google Scholar] [CrossRef]
- Huang, X.; Wang, D.; Ziegler, A.D.; Liu, X.; Zeng, H.; Xu, Z.; Zeng, Z. Influence of urbanization on hourly extreme precipitation over China. Environ. Res. Lett. 2022, 17, 044010. [Google Scholar] [CrossRef]
- Zhang, X.; Xu, D.; Liu, R.; Shen, F. Impacts of FY-4A AGRI Radiance Data Assimilation on the Forecast of the Super Typhoon “In-Fa” (2021). Remote Sens. 2022, 14, 4718. [Google Scholar] [CrossRef]
- Zhang, X.; Xu, D.; Li, X. Nonlinear Bias Correction of the FY-4A AGRI Infrared Radiance Data Based on the Random Forest. Remote Sens. 2023, 15, 1809. [Google Scholar] [CrossRef]
- Luo, L.; Xiao, H.; Yang, H.; Chen, H.; Guo, J.; Sun, Y.; Feng, L. Raindrop Size Distribution and Microphysical Characteristics of a Great Rainstorm in 2016 in Beijing, China. Atmos. Res. 2020, 239, 104895. [Google Scholar] [CrossRef]
- Errico, R.M.; Bauer, P.; Mahfouf, J.F. Issues Regarding the Assimilation of Cloud and Precipitation Data. J. Atmos. Sci. 2007, 64, 3785–3798. [Google Scholar] [CrossRef]
- Chen, Y.; Wang, H.; Min, J.; Huang, X.Y.; Minnis, P.; Zhang, R.; Haggerty, J.; Palikonda, R. Variational Assimilation of Cloud Liquid/Ice Water Path and Its Impact on NWP. J. Appl. Meteorol. Climatol. 2015, 54, 1809–1825. [Google Scholar] [CrossRef]
- Shen, F.; Min, J.; Xu, D. Assimilation of radar radial velocity data with the WRF Hybrid ETKF—3DVAR system for the prediction of Hurricane Ike (2008). Atmos. Res. 2016, 169, 127–138. [Google Scholar] [CrossRef]
- Shen, F.; Xue, M.; Min, J. A comparison of limited-area 3DVAR and ETKF-En3DVAR data assimilation using radar observations at convective scale for the prediction of Typhoon Saomai (2006). Meteorol. Appl. 2017, 24, 628–641. [Google Scholar] [CrossRef]
- Shen, F.; Xu, D.; Hong, L.; Liu, R. Impact of radar data assimilation on a squall line over the Yangtze-Huaihe River Basin with a radar reflectivity operator accounting for ice-phase hydrometeors. Meteorol. Appl. 2021, 28, e1967. [Google Scholar] [CrossRef]
- Xu, D.; Liu, Z.; Fan, S.; Chen, M.; Shen, F. Assimilating all-sky infrared radiances from Himawari-8 using the 3DVar method for the prediction of a severe storm over North China. Adv. Atmos. Sci. 2021, 38, 661–676. [Google Scholar] [CrossRef]
- Xu, D.; Zhang, X.; Liu, Z.; Shen, F. All-sky infrared radiance data assimilation of FY-4A AGRI with different physical parameterizations for the prediction of an extremely heavy rainfall event. Atmos. Res. 2023, 293, 106898. [Google Scholar] [CrossRef]
- Weckwerth, T.M.; Pettet, C.R.; Fabry, F.; Weckwerth, T.M.; Pettet, C.R.; Fabry, F.; Park, S.J.; LeMone, M.A.; Wilson, J.W. Radar Refractivity Retrieval: Validation and Application to Short-Term Forecasting. J. Appl. Meteorol. 2005, 44, 285–300. [Google Scholar] [CrossRef]
- Shen, F.; Xu, D.; Min, J.; Chu, Z.; Li, X. Assimilation of radar radial velocity data with the WRF Hybrid 4DEnVar system for the prediction of Hurricane Ike (2008). Atmos. Res. 2020, 234, 104771. [Google Scholar] [CrossRef]
- Shen, F.; Song, L.; Li, H.; He, Z.; Xu, D. Effects of different momentum control variables in radar data assimilation on the analysis and forecast of strong convective systems under the background of northeast cold vortex. Atmos. Res. 2022, 280, 106415. [Google Scholar] [CrossRef]
- Shen, F.; Song, L.; He, Z.; Xu, D.; Chen, J.; Huang, L. Impacts of adding hydrometeor control variables on the radar reflectivity data assimilation for the 6–8 August 2018 mesoscale convective system case. Atmos. Res. 2023, 295, 107012. [Google Scholar] [CrossRef]
- Song, L.; Shen, F.; Shao, C.; Shu, A.; Zhu, L. Impacts of 3DEnVar-Based FY-3D MWHS-2 Radiance Assimilation on Numerical Simulations of Landfalling Typhoon Ampil (2018). Remote Sens. 2022, 14, 6037. [Google Scholar] [CrossRef]
- Song, T.; Xu, D.; Shen, F.; Shu, A.; Song, L. Forecast and Analysis of a Rainstorm Case in East China Based on the Blown-Up Theory. Atmosphere 2023, 14, 1508. [Google Scholar] [CrossRef]
- Xu, D.; Yang, G.; Wu, Z.; Shen, F.; Li, H.; Zhai, D. Evaluate Radar Data Assimilation in Two Momentum Control Variables and the Effect on the Forecast of Southwest China Vortex Precipitation. Remote Sens. 2022, 14, 3460. [Google Scholar] [CrossRef]
- Sun, J.; Crook, N.A. Dynamical and microphysical retrieval from Doppler radar observations using a cloud model and its adjoint. part I: Model development and simulated data experiments. J. Atmos. Sci. 1997, 54, 1642–1661. [Google Scholar] [CrossRef]
- Gao, J.; Xue, M.; Shapiro, A.; Droegemeier, K.K. A variational method for the analysis for three-dimensional wind fields from two Doppler radars. Mon. Weather Rev. 1999, 127, 2128–2142. [Google Scholar] [CrossRef]
- Hu, M.; Xue, M.; Bratseth, K. 3DVAR and cloud analysis with WSR-88D level-II data for the prediction of the Fort Worfh, Texas, tornadic thunderstorms. Part I: Cloud analysis and its impact. Mon. Weather Rev. 2006, 134, 675–698. [Google Scholar] [CrossRef]
- Li, G.; Xu, Y.; Cheng, W.; Cheng, R.; Gu, C. Sensitivity test of Doppler radar data assimilation for a large rainstorm process. Torrential Rain Disasters 2009, 28, 97–103. [Google Scholar]
- Wan, Q.; Xue, J. Study on the variational assimilation technique for the retrieval of wind fields from Doppler radar data. Acta Meteor. Sin. 2006, 20, 1–19. [Google Scholar]
- Shu, A.; Shen, F.; Jiang, L.; Zhang, T.; Xu, D. Assimilation of Clear-sky FY-4A AGRI radiances within the WRFDA system for the prediction of a landfalling Typhoon Hagupit (2020). Atmos. Res. 2022, 283, 106556. [Google Scholar] [CrossRef]
- He, Z.; Wang, D.; Qiu, X.; Jiang, Y.; Li, H.; Shu, A. Application of radar data assimilation on convective precipitation forecasts based on water vapor retrieval. Meteorol. Atmos. Phys. 2021, 133, 1–19. [Google Scholar] [CrossRef]
- Tong, M.; Xue, M. Ensemble Kalman filter assimilation of Doppler radar data with a compressible nonhydrostatic model: OSS experiments. Mon. Weather Rea. 2005, 133, 1789–1807. [Google Scholar] [CrossRef]
- Dowell, D.C.; Wicker, L.J.; Snyder, C. Ensemble Kalman filter assimilation of radar observations of the 8 May 2003 Oklahoma City supercell: Influences of reflectivity observations on storm scale analyses. Mon. Weather Rev. 2011, 139, 272–294. [Google Scholar] [CrossRef]
- Zhang, F.; Weng, Y.; Sippel, J.A.; Meng, Z.; Bishop, C.H. Cloud-Resolving Hurricane Initialization and Prediction through Assimilation of Doppler Radar Observations with an Ensemble Kalman Filter. Trop. Cyclone Predict. 2009, 137, 2105–2125. [Google Scholar] [CrossRef]
- Lin, Y.P.; Ray, P.S.; Johnson, K.W. Initialization of a model convective storm using Doppler radar derived fields. Mon. Weather Rev. 1993, 121, 2757–2775. [Google Scholar] [CrossRef]
- Takano, I.; Segam, I.A. Assimilation and initialization of a mesoscale model for improved spin-up of precipitation. Meteor. Soc. 1993, 71, 377–391. [Google Scholar] [CrossRef]
- Aonashi, K. An initialization method to incorporate precipitation data into a mesoscale numerical weather prediction model. Meteor. Soc. 1993, 71, 393–406. [Google Scholar] [CrossRef]
- Guo, X.; Dang, R.Q.; Ge, W.Z. The use of radar data in the numerical simulation of heavy rainfalls in the Changjiang-Huaihe River basin. J. Trop. Meteorol. 2000, 6, 212–218. [Google Scholar]
- Haase, G.; Grewell, S.; Simmer, C.; Wergen, W. Assimilation of radar data in mesoscale models: Physical initialization and latent heat nudging. Phys. Chem. Earth Part B 2003, 25, 1237–1242. [Google Scholar] [CrossRef]
- Li, Y.; Yuan, Z.; Wang, X. Adjustment of cloud microphysical variables in model atmospheres with Doppler radar reflectivity. J. Appl. Meteorol. Sci. 2004, 15, 658–664. [Google Scholar]
- Zhang, J.; Carr, F.; Brewster, K. ADAS Cloud Analysis. In Proceedings of the 12th Conference on Numerical Weather Prediction, Phoenix, AZ, USA, 11–16 January 1998; American Meteorological Society: Boston, MA, USA, 1998; pp. 185–188. [Google Scholar]
- Droegemeier, K.K. The advanced regional prediction system (ARPS), storm-scale numerical weather and data assimilation. Meteor. Atmos. Phys. 2003, 82, 139–170. [Google Scholar]
- Schenkman, A.D.; Xue, M.; Shapiro, A.; Brewster, K.; Gao, J. The Anlysis and Prediction of the 8–9 May 2007 Oklahoma Tornadic Mesoscale Convective System by Assimilating WSR-88D and CASA Radar Data Using 3DVAR. Mon. Weather Rev. 2011, 139, 224–246. [Google Scholar] [CrossRef]
- Cao, Q.; Zhang, G.; Xue, M. A Variational approach for retrieving raindrop size distribution from polarimetric radar measurements in the presence of attenuation. J. Appl. Meteorol. Climatol. 2013, 52, 169–185. [Google Scholar] [CrossRef]
- Huang, H.; Zhang, G.; Zhao, K.; Liu, S.; Wen, L.; Chen, G.; Yang, Z. Uncertainty in retrieving raindrop size distribution from polarimetric radar measurements. J. Atmos. Ocean. Technol. 2019, 36, 585–605. [Google Scholar] [CrossRef]
- Zhang, G.; Mahale, V.N.; Putnam, B.J.; Qi, Y.; Cao, Q.; Byrd, A.D.; Bukovcic, P.; Zrnic, D.S.; Gao, J.; Xue, M.; et al. Current status and future challenges of weather radar polarimetry: Bridging the gap between radar meteorology/hydrology/engineering and numerical weather prediction. Adv. Atmos. Sci. 2019, 36, 571–588. [Google Scholar] [CrossRef]
- Ryzhkov, A.V.; Zrnic, D.S. Discrimination between rain and snow with a polarimetric radar. J. Appl. Meteorol. 1998, 37, 1228–1240. [Google Scholar] [CrossRef]
- Vivekanandan, J.; Zrnic, D.S.; Ellis, S.M.; Oye, R.; Ryzhkov, A.V.; Straka, J. Cloud microphysics retrieval using S-band dual-polarization radar measurements. Bull. Am. Meteorol. Soc. 1999, 80, 381–388. [Google Scholar] [CrossRef]
- Jung, Y.; Zhang, G.; Xue, M. Assimilation of simulated polarimetric radar data for a convective storm using the ensemble Kalman filter. Part I: Observation operators for reflectivity and polarimetric variables. Mon. Weather Rev. 2008, 136, 2228–2245. [Google Scholar] [CrossRef]
- Jung, Y.; Xue, M.; Zhang, G.; Straka, J.M. Assimilation of simulated polarimetric radar data for a convective storm using the ensemble Kalman filter. Part II: Impact of polarimetric data on storm analysis. Mon. Weather Rev. 2008, 136, 2246–2260. [Google Scholar] [CrossRef]
- Li, X.; John, R.M.; Derek, P. An ice-phase microphysics forward model and preliminary results of polarimetric radar data assimilation. Mon. Weather Rev. 2017, 145, 683–708. [Google Scholar] [CrossRef]
- Kawabata, T.; Schwitalla, T.; Adachi, A.; Bauer, H.S.; Wulfmeyer, V.; Nagumo, N.; Yamauchi, H. Observational operators for dual polarimetric radars in variational data assimilation systems. Geosci. Model Dev. 2018, 11, 2493–2501. [Google Scholar] [CrossRef]
- Xiao, Y.; Wang, B.; Chen, X.; Cao, J.; Yang, X. Quality control of differential phase data from mobile X-band dual-line polarization Doppler weather radar. Plateau Meteorol. 2012, 31, 223–230. [Google Scholar]
- Lin, W.; Zhang, S.; Luo, C.; Jiang, H.; Xie, Z.; Li, D.; Chen, B. Analysis of S-band dual-polarization radar observations of strong convective cloud systems with different intensities. Meteorol. Mon. 2020, 46, 63–72. [Google Scholar]
- Yang, J.; Zheng, Y.; Xu, F. Analysis of two-line polarimetric radar observation of a hail process in Jianghuai region. Acta Meteorol. Sin. 2020, 78, 568–579. [Google Scholar]
- Wei, Q.; Hu, Z.; Liu, L.; Wu, L. C-band polarimetric radar data preprocessing and application in precipitation estimation. Plateau Meteorol. 2016, 35, 231–243. [Google Scholar]
- Chen, H.; Chandrasekar, V.; Bechini, R. An Improved Dual-Polarization Radar Rainfall Algorithm (DROPS2.0): Application in NASA IFloodS Field Campaign. J. Hydrometeorol. 2017, 18, 917–937. [Google Scholar] [CrossRef]
- Gao, J.; Stensrud, D.J. Assimilation of reflectivity data in a convective-scale, cycled 3DVAR framework with hydrometeor classification. J. Atmos. Sci. 2012, 69, 1054–1065. [Google Scholar] [CrossRef]
- Gao, S.; Sun, J.; Min, J.; Zhang, Y.; Ying, Z. A scheme to assimilate “no rain” observations from Doppler radar. Weather Forecast. 2018, 33, 71–88. [Google Scholar] [CrossRef]
- Zhang, Z.; Qi, Y.; Zhu, Z.; Li, D.; Zeng, Q.; Lan, H. Application of Shenzhen S-band and X-band dual-polarization radar in quantitative precipitation estimation. Acta Meteorol. Sin. 2021, 79, 786–803. [Google Scholar]
- Leng, L.; Huang, X.; Yang, H. Recognition and Application of Doppler Weather Radar Clear Air Echoes. Meteorol. Sci. Technol. 2012, 40, 534–541. [Google Scholar]
Figure 1.
Radar remote detection area. “SZRD” means the Suizhou radar.

Figure 2.
Accumulated rainfall (mm) from 00:00 UTC on 11 August to 00:00 UTC on 12 August 2021 in Hubei Province.
Figure 2.
Accumulated rainfall (mm) from 00:00 UTC on 11 August to 00:00 UTC on 12 August 2021 in Hubei Province.

Figure 3.
Hourly rainfall at (a) Yicheng Station in Xiangyang, (b) Yinghe Station in Yicheng, and (c) Liulin Station in Suizhou from 00:00 UTC 11 August to 12:00 UTC on 13 August (the time range is indicated as “1100–1312” in the figure). The red lines represent the dividing lines of the dates (11–13 August).

Figure 4.
Geopotential height (10 gpm) and wind (m·s−1) fields at 200 hPa at (a) 00:00 UTC and (b) 12:00 UTC on 11 August 2021, and 200 hPa water vapor flux (g·cm−1·hPa−1·s−1) at (c) 00:00 UTC and (d) 12:00 UTC on 11 August 2021.
Figure 4.
Geopotential height (10 gpm) and wind (m·s−1) fields at 200 hPa at (a) 00:00 UTC and (b) 12:00 UTC on 11 August 2021, and 200 hPa water vapor flux (g·cm−1·hPa−1·s−1) at (c) 00:00 UTC and (d) 12:00 UTC on 11 August 2021.

Figure 5.
Vorticity (shaded areas; 105 s−1) and wind field (wind vectors) at (a) 500 hPa, (b) 700 hPa, (c) 850 hPa, and (d) 925 hPa at 00:00 UTC on 12 August 2021.
Figure 5.
Vorticity (shaded areas; 105 s−1) and wind field (wind vectors) at (a) 500 hPa, (b) 700 hPa, (c) 850 hPa, and (d) 925 hPa at 00:00 UTC on 12 August 2021.

Figure 6.
Surface low-vortex wind field at (a) 21:00 UTC and (b) 22:00 UTC on 11 August 2021.

Figure 7.
Flow chart of assimilation cycle.

Figure 8.
Composite reflectivity (dBZ) at 1600 UTC, 1700 UTC, and 1800 UTC on 11 August 2021. (1, 2, and 3 denote the composite reflectivity at 1600 UTC, 1700 UTC, and 1800 UTC, respectively. (a–c) denote the observation, CON experiment, and RADAR-QV_S experiment, respectively).
Figure 8.
Composite reflectivity (dBZ) at 1600 UTC, 1700 UTC, and 1800 UTC on 11 August 2021. (1, 2, and 3 denote the composite reflectivity at 1600 UTC, 1700 UTC, and 1800 UTC, respectively. (a–c) denote the observation, CON experiment, and RADAR-QV_S experiment, respectively).

Figure 9.
TS of 1 h composite reflectivity forecasts at (a) 16:00 11 August, (b) 17:00 11 August, and (c) 18:00 11 August for the thresholds of 25 dBZ, 35 dBZ, and 45 dBZ.
Figure 9.
TS of 1 h composite reflectivity forecasts at (a) 16:00 11 August, (b) 17:00 11 August, and (c) 18:00 11 August for the thresholds of 25 dBZ, 35 dBZ, and 45 dBZ.

Figure 10.
Three hours of accumulated precipitation from 15:00 11 August to18:00 11 August 2021. (a) Observation; (b) CON experiment; (c) RADAR-QV_S experiment.
Figure 10.
Three hours of accumulated precipitation from 15:00 11 August to18:00 11 August 2021. (a) Observation; (b) CON experiment; (c) RADAR-QV_S experiment.

Figure 11.
Composite reflectivity at (a1–d1) 20:00 UTC, (a2–d2) 21:00 UTC, and (a3–d3) 22:00 UTC on 11 August 2021 from (a1–a3) the observations, (b1–b3) CON experiment, (c1–c3) RADAR-QV_S experiment, and (d1–d3) RADAR-QV_C experiment.
Figure 11.
Composite reflectivity at (a1–d1) 20:00 UTC, (a2–d2) 21:00 UTC, and (a3–d3) 22:00 UTC on 11 August 2021 from (a1–a3) the observations, (b1–b3) CON experiment, (c1–c3) RADAR-QV_S experiment, and (d1–d3) RADAR-QV_C experiment.

Figure 12.
TS of 1 h composite reflectivity forecasts at (a) 20:00 11 August, (b) 21:00 11 August, (c) 22:00 11 August for the thresholds of 25 dBZ, 35 dBZ, and 45 dBZ.
Figure 12.
TS of 1 h composite reflectivity forecasts at (a) 20:00 11 August, (b) 21:00 11 August, (c) 22:00 11 August for the thresholds of 25 dBZ, 35 dBZ, and 45 dBZ.

Figure 13.
Three hours of accumulated precipitation from 21:00 UTC on 11 August to 00:00 UTC on 12 August 2021 from (a) the observations, (b) CON experiment, (c) RADAR-QV_S experiment, and (d) RADAR-QV_C experiment.
Figure 13.
Three hours of accumulated precipitation from 21:00 UTC on 11 August to 00:00 UTC on 12 August 2021 from (a) the observations, (b) CON experiment, (c) RADAR-QV_S experiment, and (d) RADAR-QV_C experiment.

Figure 14.
(a) Threat score and (b) bias score of the accumulated precipitation from 21:00 UTC on 11 August to 00:00 UTC on 12 August 2021.
Figure 14.
(a) Threat score and (b) bias score of the accumulated precipitation from 21:00 UTC on 11 August to 00:00 UTC on 12 August 2021.


Table 1.
Statistical relationship of radar reflectivity factor Z (dBZ)—relative humidity RH (%).
| Temperature | Z-RH Relationship Function |
|---|---|
| <5 °C | RH = 100, Z > 20 |
| ≥5 °C | RH = 83.7 + 0.28Z |
Table 2.
Key parameters of the S-band polarization radar in Suizhou.
| Radar Name | Z9722 |
|---|---|
| Temporal resolution(min) | 6 |
| Grid dimensions (m) | 250 |
| Angular resolution (°) | 0.95 |
| Number of elevations | 9 |
| Lowest elevation (°) | 0.5 |
| Detection range(km) | 460 |
Table 3.
Experiment design.
| Serial Number | Experiment | Experiment Scheme | Cycle |
|---|---|---|---|
| Exp1 | Control (CON) | No-radar data | No |
| Exp2 | RADAR-QV_S | Hydrometeor and water vapor retrieval; WRF | No |
| Exp3 | RADAR-QV_C | Hydrometeor and water vapor retrieval; WRF | Yes |
Disclaimer/Publisher’s Note: The statements, opinions and data contained in all publications are solely those of the individual author(s) and contributor(s) and not of MDPI and/or the editor(s). MDPI and/or the editor(s) disclaim responsibility for any injury to people or property resulting from any ideas, methods, instructions or products referred to in the content. |
© 2023 by the authors. Licensee MDPI, Basel, Switzerland. This article is an open access article distributed under the terms and conditions of the Creative Commons Attribution (CC BY) license (https://creativecommons.org/licenses/by/4.0/).
Share and Cite
MDPI and ACS Style
He, Z.; Ye, J.; Li, Z.; Lin, C.; Song, L. Impacts of Radar Data Assimilation on the Forecast of “12.8” Extreme Rainstorm in Central China (2021). Atmosphere 2023, 14, 1722. https://doi.org/10.3390/atmos14121722
AMA Style
He Z, Ye J, Li Z, Lin C, Song L. Impacts of Radar Data Assimilation on the Forecast of “12.8” Extreme Rainstorm in Central China (2021). Atmosphere. 2023; 14(12):1722. https://doi.org/10.3390/atmos14121722
Chicago/Turabian StyleHe, Zhixin, Jinyin Ye, Zhijia Li, Chunze Lin, and Lixin Song. 2023. "Impacts of Radar Data Assimilation on the Forecast of “12.8” Extreme Rainstorm in Central China (2021)" Atmosphere 14, no. 12: 1722. https://doi.org/10.3390/atmos14121722
Note that from the first issue of 2016, this journal uses article numbers instead of page numbers. See further details here.