
Identification and Analysis of Multi-Station Atmospheric Electric Field Anomalies before the Yangbi Ms 6.4 Earthquake on 21 May 2021

1
Institute of Earthquake Forecasting, China Earthquake Administration, Beijing 100036, China
2
Key Laboratory of Earthquake Prediction, China Earthquake Administration, Beijing 100036, China
*
Author to whom correspondence should be addressed.
Atmosphere 2023, 14(10), 1579; https://doi.org/10.3390/atmos14101579
Submission received: 12 September 2023
/
Revised: 10 October 2023
/
Accepted: 11 October 2023
/
Published: 19 October 2023
(This article belongs to the Special Issue Electromagnetic Observations and Their Applications in Earthquake Research)
Abstract
:This study reports the atmospheric electric field (AEF) anomalies associated with seismic-geological activity recorded by the monitoring network in the Sichuan–Yunnan region of China during the 15–30 days prior to the Yangbi earthquake in Yunnan Province, China, on 21 May 2021. Based on the real-time AEF data from continuous observation, this study summarized the characteristics of the anomalous interference of different meteorological factors on the AEF, compared the simultaneous meteorological data of the AEF anomalies, and ruled out the influence of precipitation, wind, fog, and other weather factors on the AEF anomalies in Yangbi County prior to the Yangbi Ms 6.4 earthquake. The AEF anomalies were identified and extracted from the two-month data from 1 April to 1 June, which were from multiple days, stations, and rupture zones near the 100 km radius from the epicenter of the Yangbi Ms 6.4 main earthquake. Using time series and wavelet transform analysis methods, the obvious common features of the anomalies were summarized, and the homology of the anomalies was verified. The main outcome of the investigation in this study will be used to distinguish and characterize the AEF anomalies associated with pre-seismic geologic activity of non-meteorological elements in the near future.
1. Introduction
Earthquakes are among the most devastating disasters in nature. Throughout history, people have attempted to predict earthquakes in order to mitigate the loss of human life and property. However, despite centuries of effort by numerous scientists around the world, the question of whether earthquakes can be predicted remains a mystery [1,2,3]. Earthquakes are similar to the evolution of weather in that they are a highly complex and non-linear dynamic process. Unlike meteorological changes, earthquakes occur beneath the Earth’s crust and are not visible. Due to the inaccessibility of the Earth, the complexity of the earthquake mechanisms, the scarcity of examples of strong earthquakes, and the limitations of existing technologies, predicting earthquakes is significantly more challenging. Before an earthquake, stress and strain accumulate in the Earth’s crust, and the subsurface medium transitions are from elastic to inelastic deformation and are accompanied by a variety of dynamic processes such as pore expansion and rupture of rocks, friction on faults, and changes in subsurface fluids [4]. This leads to a series of complex geophysical, geochemical, piezomagnetic, piezoelectric, thermomagnetic, and electrokinetic effects that can produce distinct changes in the Earth’s surface and atmosphere, as observed and reported by many researchers using ground-based observations [5,6,7,8].
Currently, research on earthquake monitoring and prediction relies heavily on various precursory phenomena observed during the earthquake preparation process. These include the Earth’s electromagnetic field, GPS deformation, underground fluid, and other changes [9,10,11,12,13]. In recent decades, data obtained from increasingly sophisticated geoelectromagnetic observation instruments reveal that electromagnetic disturbance phenomena not only occur within the rock layer but also exhibit anomalies in the atmosphere and ionosphere prior to earthquakes [14,15,16,17]. However, when compared to electromagnetic anomalies in other spheres, the number of atmosphere electric field (AEF) anomalies associated with earthquake preparation is relatively limited. This discrepancy may be attributed to several influencing factors. Firstly, AEF is susceptible to meteorological factors, geological activities, and other anthropogenic factors, especially meteorological conditions. The presence of convective activities, such as strong wind, precipitation, snowfall, or lightning, can lead to significant fluctuations in AEF values, both positive and negative [18,19]. Secondly, previous studies primarily focused on single or double AEF monitoring stations that exhibited anomalies prior to earthquakes [20]. These studies failed to capture the spatial propagation features of these anomalies, making it challenging to establish a clear relationship between the earthquake preparation process and AEF changes. To address these limitations, this study utilizes data from a comprehensive 24 h monitoring network comprising over 80 spatially separated AEF stations in Yunnan and Sichuan Provinces, China. This network ensures minimal interference and noise from station-specific factors and other anthropogenic disturbances. Consequently, the findings of this study are more robust and credible.
When investigating AEF anomaly precursors prior to earthquakes, it is crucial to determine the underlying cause of these anomalies, which can enable a clear distinction between AEF anomalies resulting from seismic geological activity and those arising from meteorological changes. This differentiation allows for the extraction of relevant AEF anomalies from observations and analyses of AEF monitoring data, thereby facilitating the prediction of potential future earthquakes.
The subject of this paper is to explore and examine the identification and analysis of multi-station AEF anomalies associated with seismic geological activity in the absence of meteorological factors prior to earthquakes. Additionally, this study investigates potential sources of AEF anomalies by considering previous studies on pre-seismic geological activity and pre-seismic groundwater anomalies. Consequently, Section 2 of this paper presents the observational data obtained from the AEF monitoring network employed in this study. Then, Section 3 summarizes the pattern of AEF anomalies under different meteorological conditions based on the experience of continuous follow-up observations. Subsequently, Section 4 focuses on the identification and extraction of multi-station AEF anomalies without meteorological influence through the application of time series and wavelet analyses. Section 5 comprises a detailed discussion of this study, and Section 6 offers a conclusive summary.
2. Observation Data
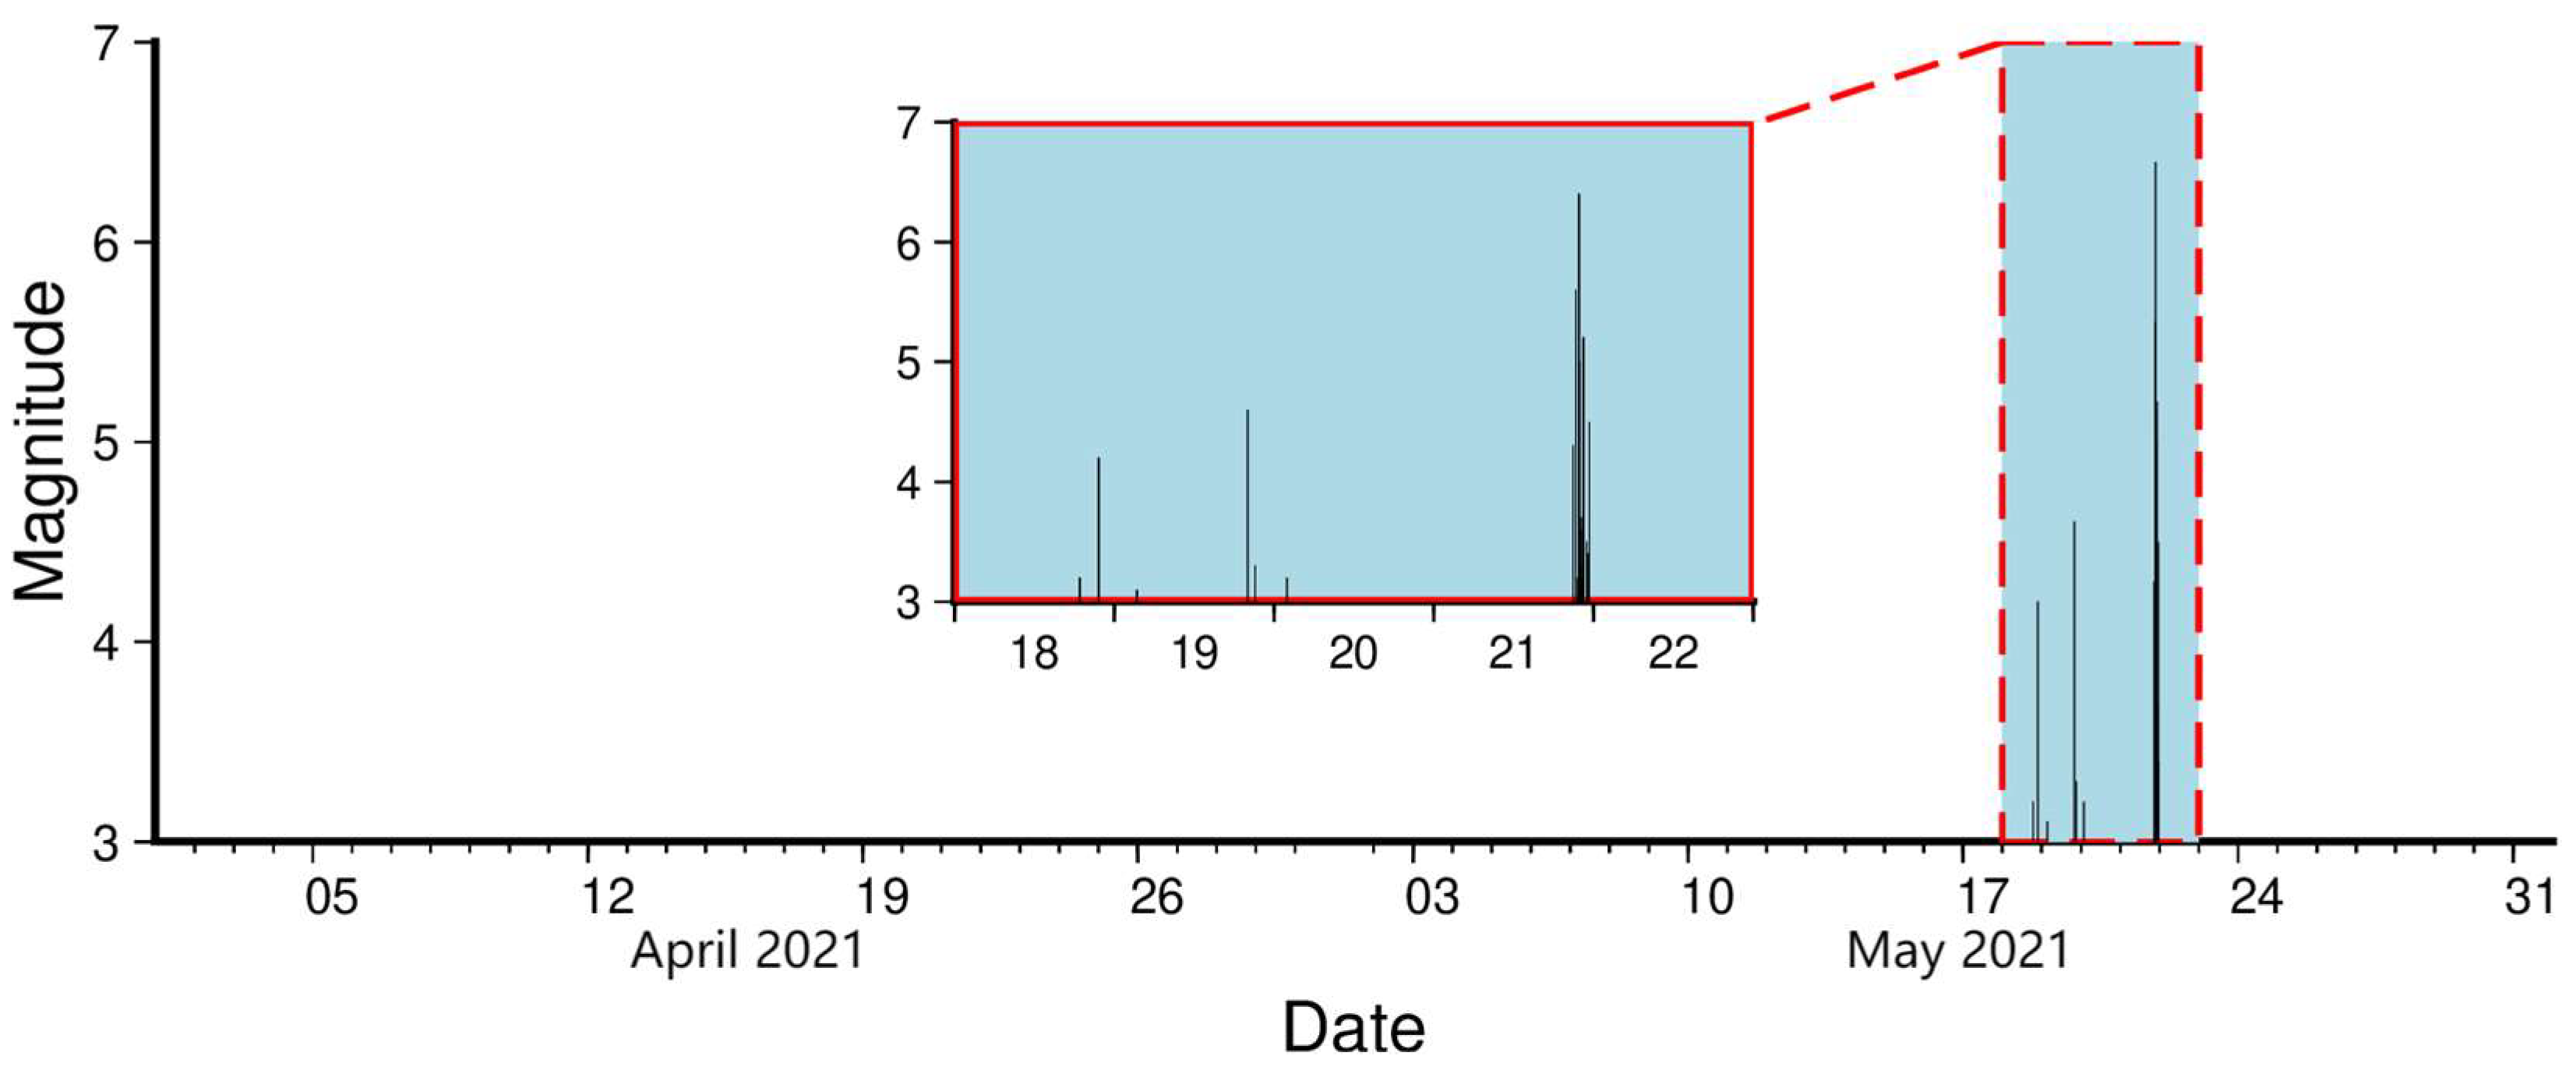
The seismic sequence data of Yangbi in this paper are from the China Earthquake Networks Center (https://www.ceic.ac.cn/, accessed on 10 October 2022). An earthquake of magnitude Ms 6.4 occurred in Yangbi County, Dali Bai Autonomous Prefecture, Yunnan Province, China, at a depth of 10 km on 21 May 2021, at 21:48:35, and the seismic sequence is shown in Figure 1. This is a typical foreshock–mainshock–aftershock earthquake, with some small earthquakes starting from 17 May, and then the small earthquakes became more and more frequent until the Ms 6.4 mainshock occurred on 21 May. In this study, this seismic sequence is zoomed in to show its foreshock–mainshock–aftershock characteristics more clearly in the blue graph in Figure 1.
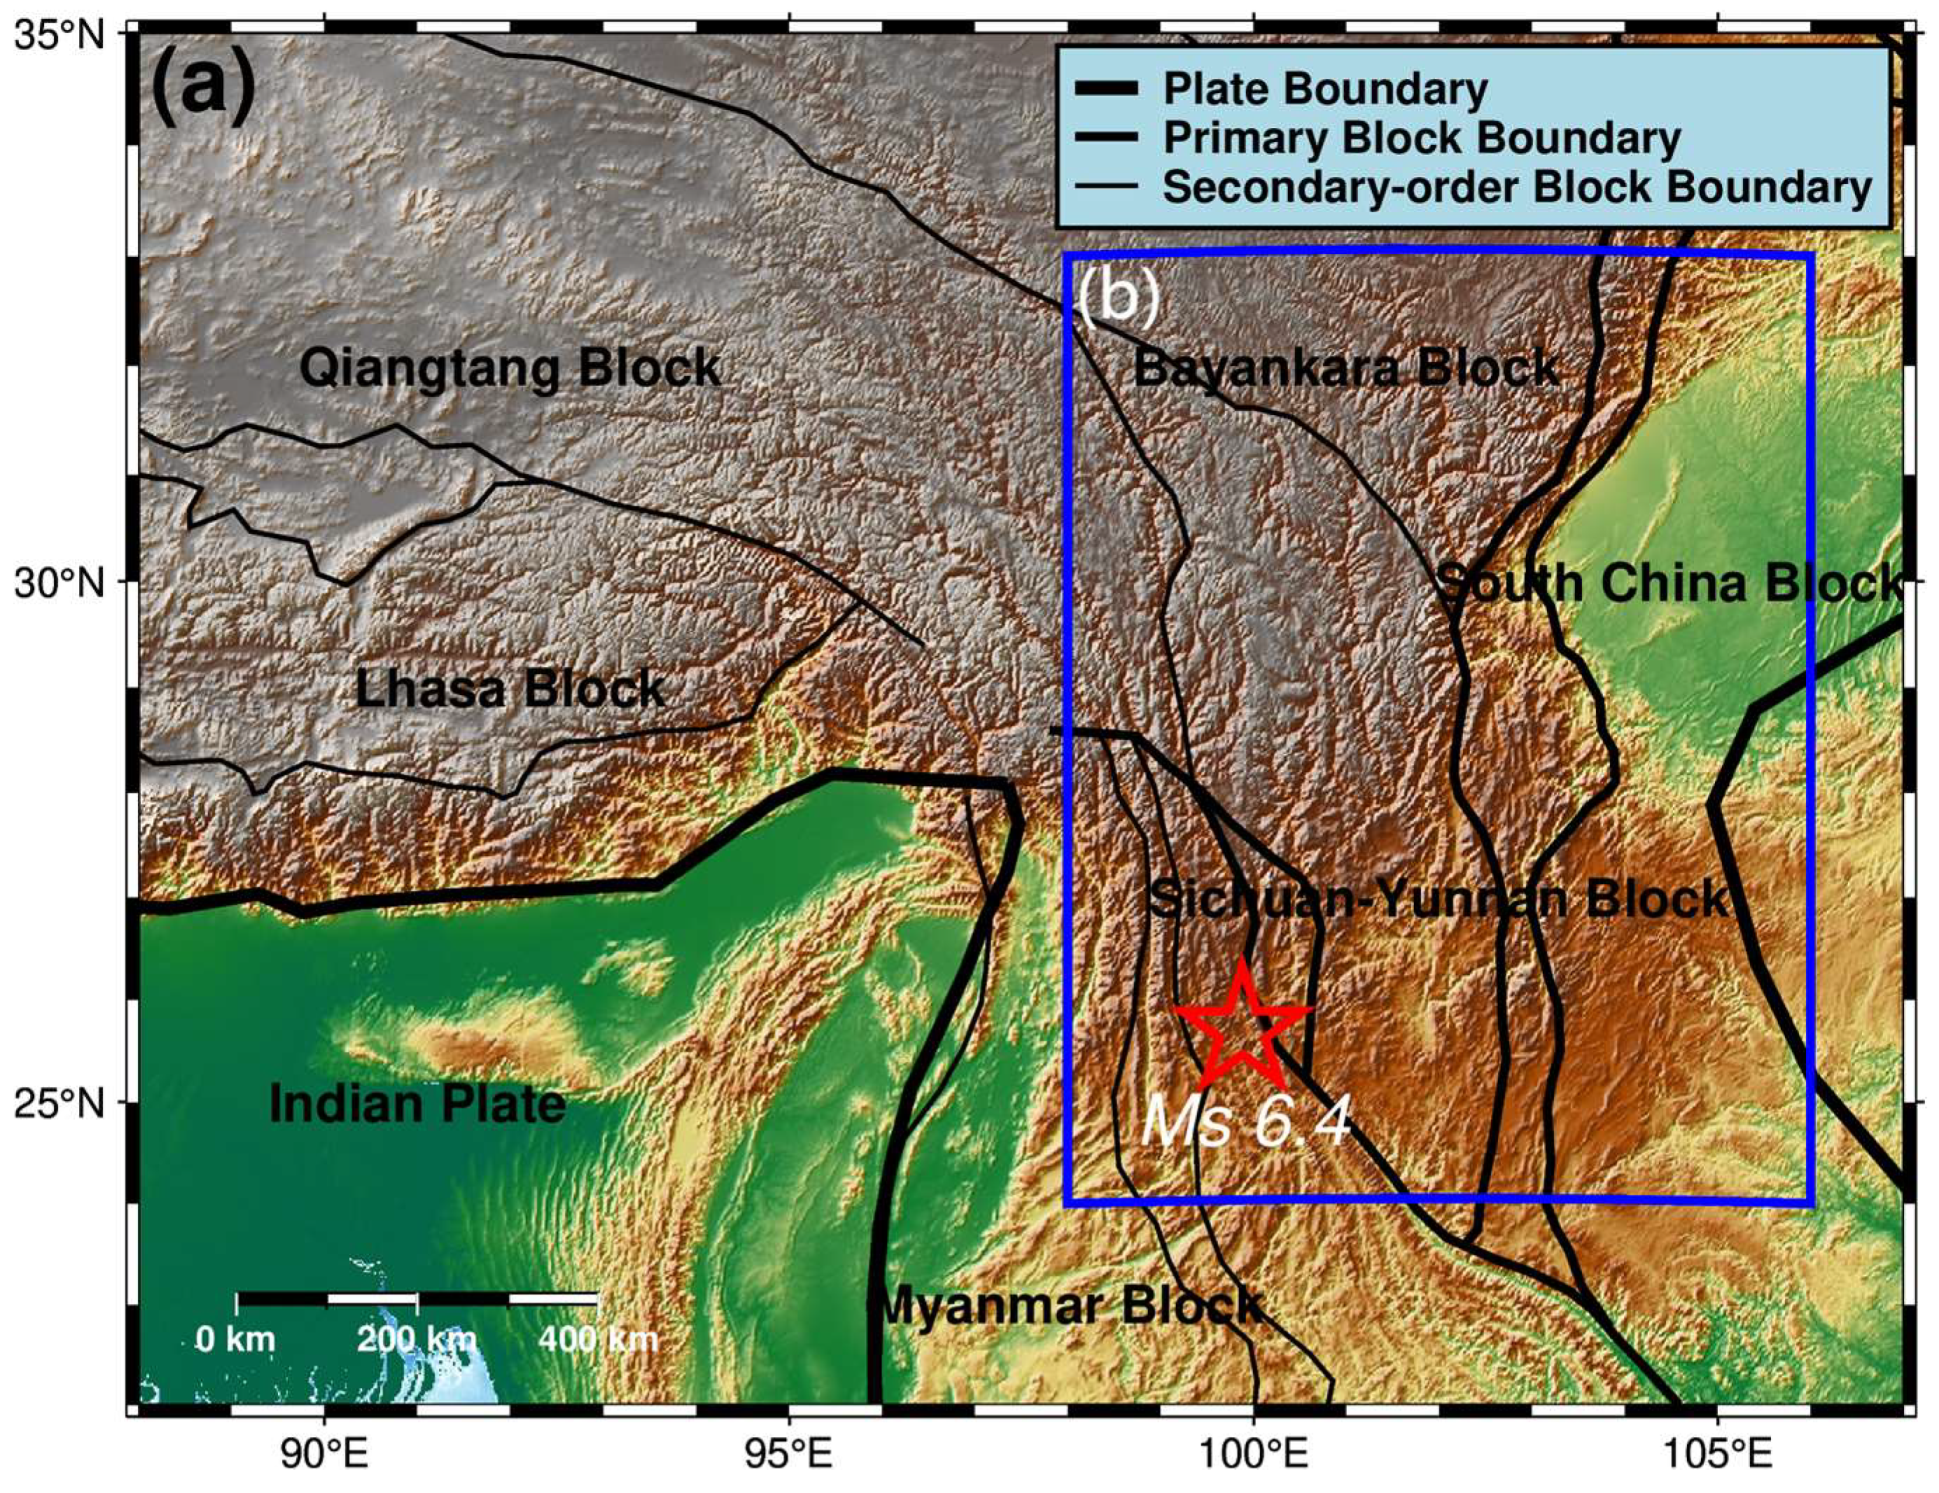
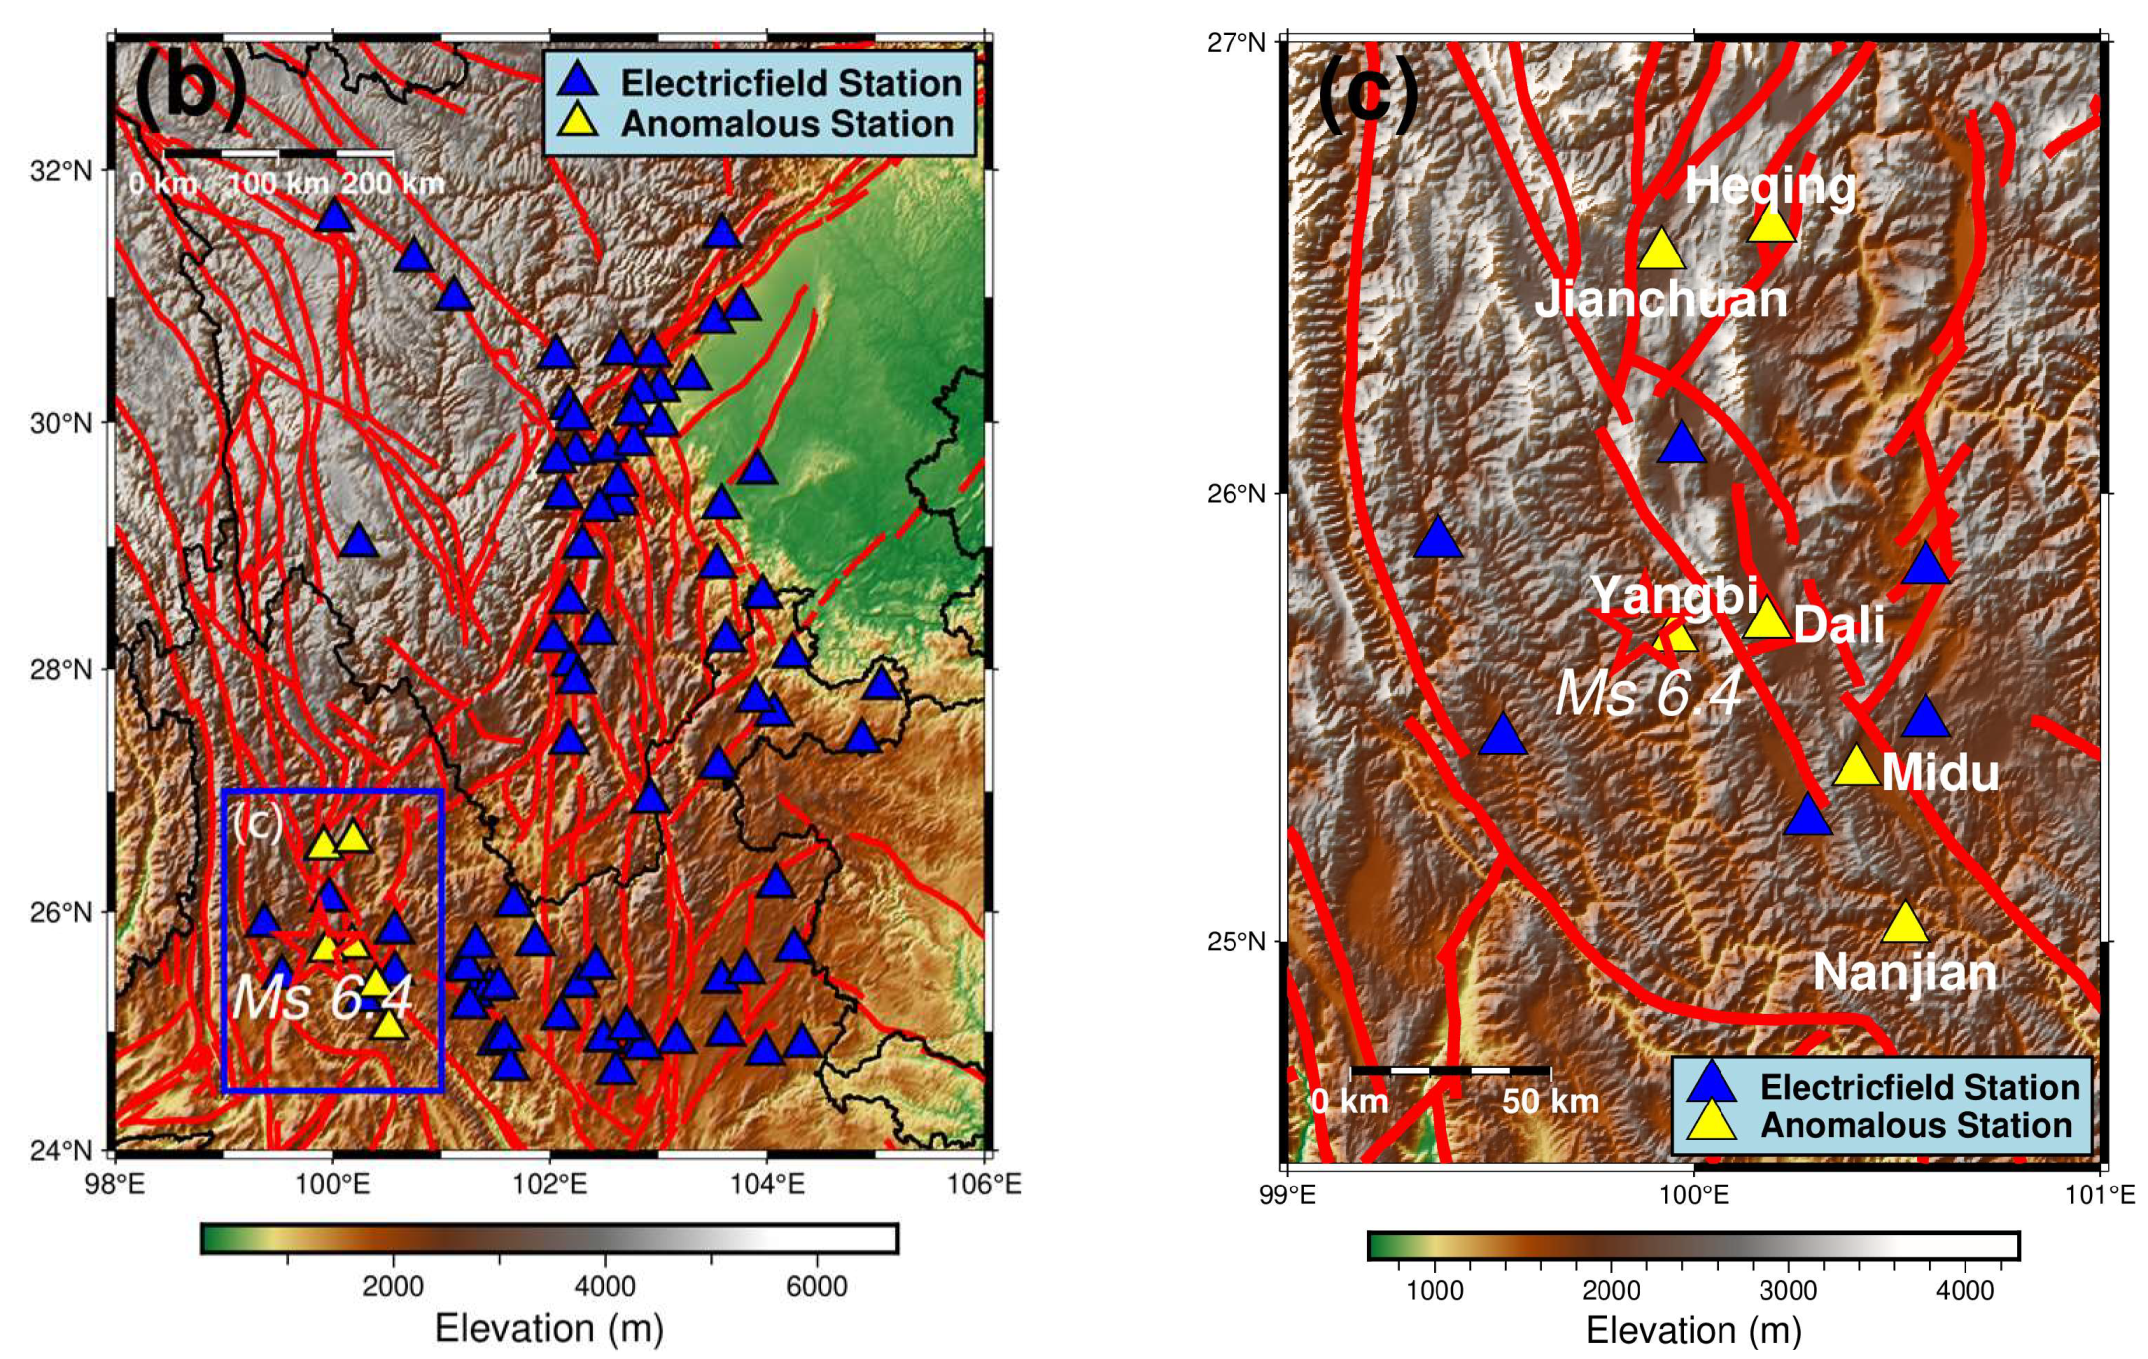
As shown in Figure 2a, the earthquake occurred at the southwest margin of the Sichuan–Yunnan Massif, and the epicenter was located about 30 km west of the Red River fault at the western boundary of the Sichuan–Yunnan Massif. The nearest active fault to the epicenter is the NW-SE trending Weixi–Qiaohou fault [21,22]. Before the Yangbi earthquake, the AEF monitoring networks in Sichuan and Yunnan (Figure 2b) had normal observations and continuous data records. The atmospheric electric field was monitored in real time at a sampling rate of 1 Hz at each station. After tracking the AEF data from 1 April to 1 June, the anomalies were observed at several stations during the 15 to 30 days before the Yangbi earthquake. The distribution of the anomalous stations is shown in Figure 2c, and the stations are located along the Longbian–Qiaohou fault, the Weixi–Qiaohou fault, and the Eryuan–Maidu fault in the NW direction [23,24,25].
3. Morphology of the AEF under Different Meteorological Conditions
The AEF serves as a crucial physical parameter that characterizes the spatial distribution of atmospheric space charge and exhibits high sensitivity to weather conditions. Therefore, when utilizing AEF anomalies preceding earthquakes for earthquake prediction purposes, one encounters a significant challenge: the substantial impact of meteorological activity on AEF measurements [26]. In natural environment recordings, the AEF curve often displays numerous abnormal peaks and valleys. These anomalies arise primarily from meteorological factors such as precipitation, wind, fog, or lightning. The abnormal variations induced by these meteorological interferences tend to overshadow anomalies resulting from geological activities. To extract the AEF anomalies, it becomes imperative to minimize the influence of the aforementioned meteorological interference factors [27,28].
Due to the unstable output of power supply voltage in the process of monitoring atmospheric electric fields using the instrument employed in this study, the rotor speed is subject to instability. Additionally, as the instrument remains exposed to the air for a prolonged period, there may be residual charged dust particles on the rotor. Therefore, in this study, the rlowess function was utilized for smoothing purposes with a span of 60 s. This smoothing technique effectively eliminates minor fluctuations, allowing for a more prominent display of atmospheric electric field anomalies influenced by meteorological factors and seismic geological activity in the presented figure.
Currently, only AEF anomalies under clear-sky atmospheric conditions can be considered seismic precursor signals [29]. In this study, the experience accumulated from the continuous monitoring of AEF data was combined with the criteria of Harrison and Nicoll, which led to the determination of clear-sky atmospheric conditions [30]. The clear-sky atmospheric criteria used in this study were visibility greater than 10 km, no precipitation, maximum surface wind speed less than 8 m/s, and maximum relative humidity less than 90%.
In order to determine whether a specific day qualifies as a clear-sky atmospheric condition, it is essential to carefully select meteorological data that accurately represent the weather conditions during the given time period. This study has chosen meteorological data from https://q-weather.info/ (accessed on 11 October 2022), which archives historical meteorological data from 10,747 ground-based observatories in China. These records provide comprehensive information on temperature, surface air pressure, relative humidity, wind speed, and direction, as well as precipitation.
After conducting over a year of continuous tracking, observation verification, and evaluation, we have found that the data obtained from this website can offer more precise local meteorological information. Moreover, the synchronization between these data and the AEF monitoring network has proven to be highly consistent.
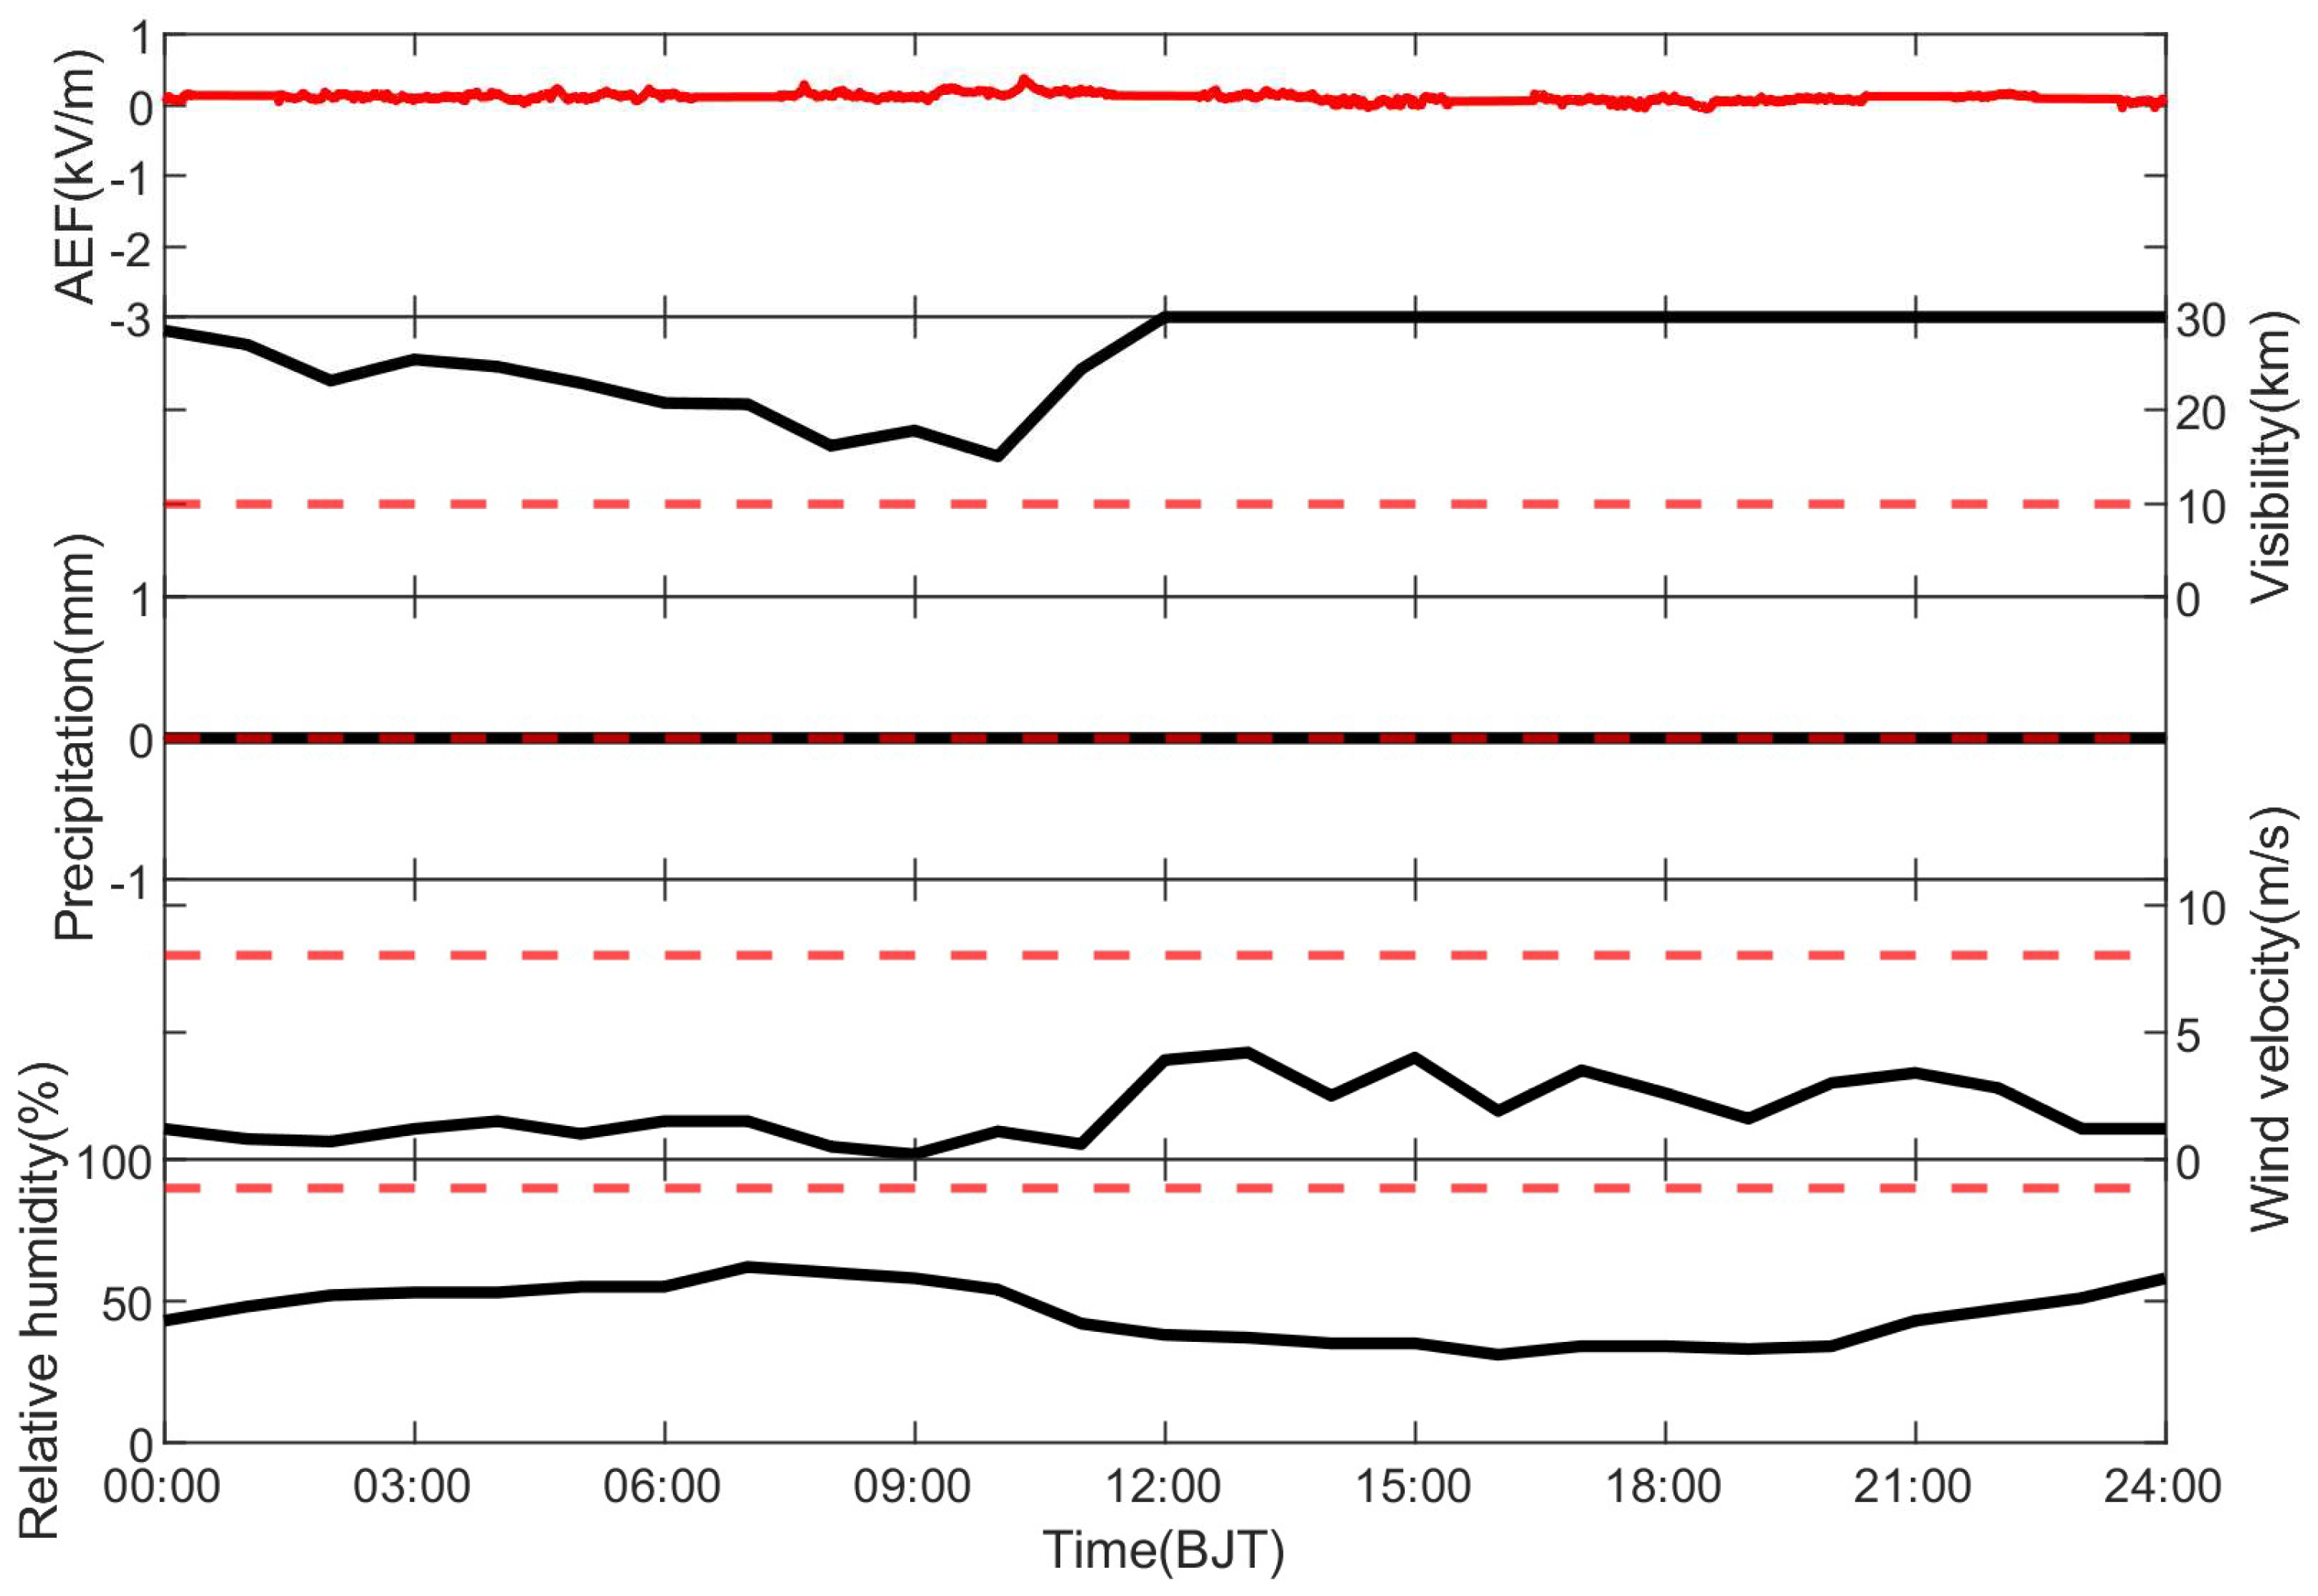
Figure 3 presents comparative images of AEF measurements and associated meteorological elements at Yangbi Station on a clear day. The figure displays the visibility, precipitation, wind velocity, and relative humidity recorded on that particular day. All of these factors meet the established criteria for a clear-sky atmosphere, as determined by this study. Correspondingly, the AEF curves exhibit a smooth pattern with insignificant fluctuations in the curve values, ranging between +100 and +300 V/m.
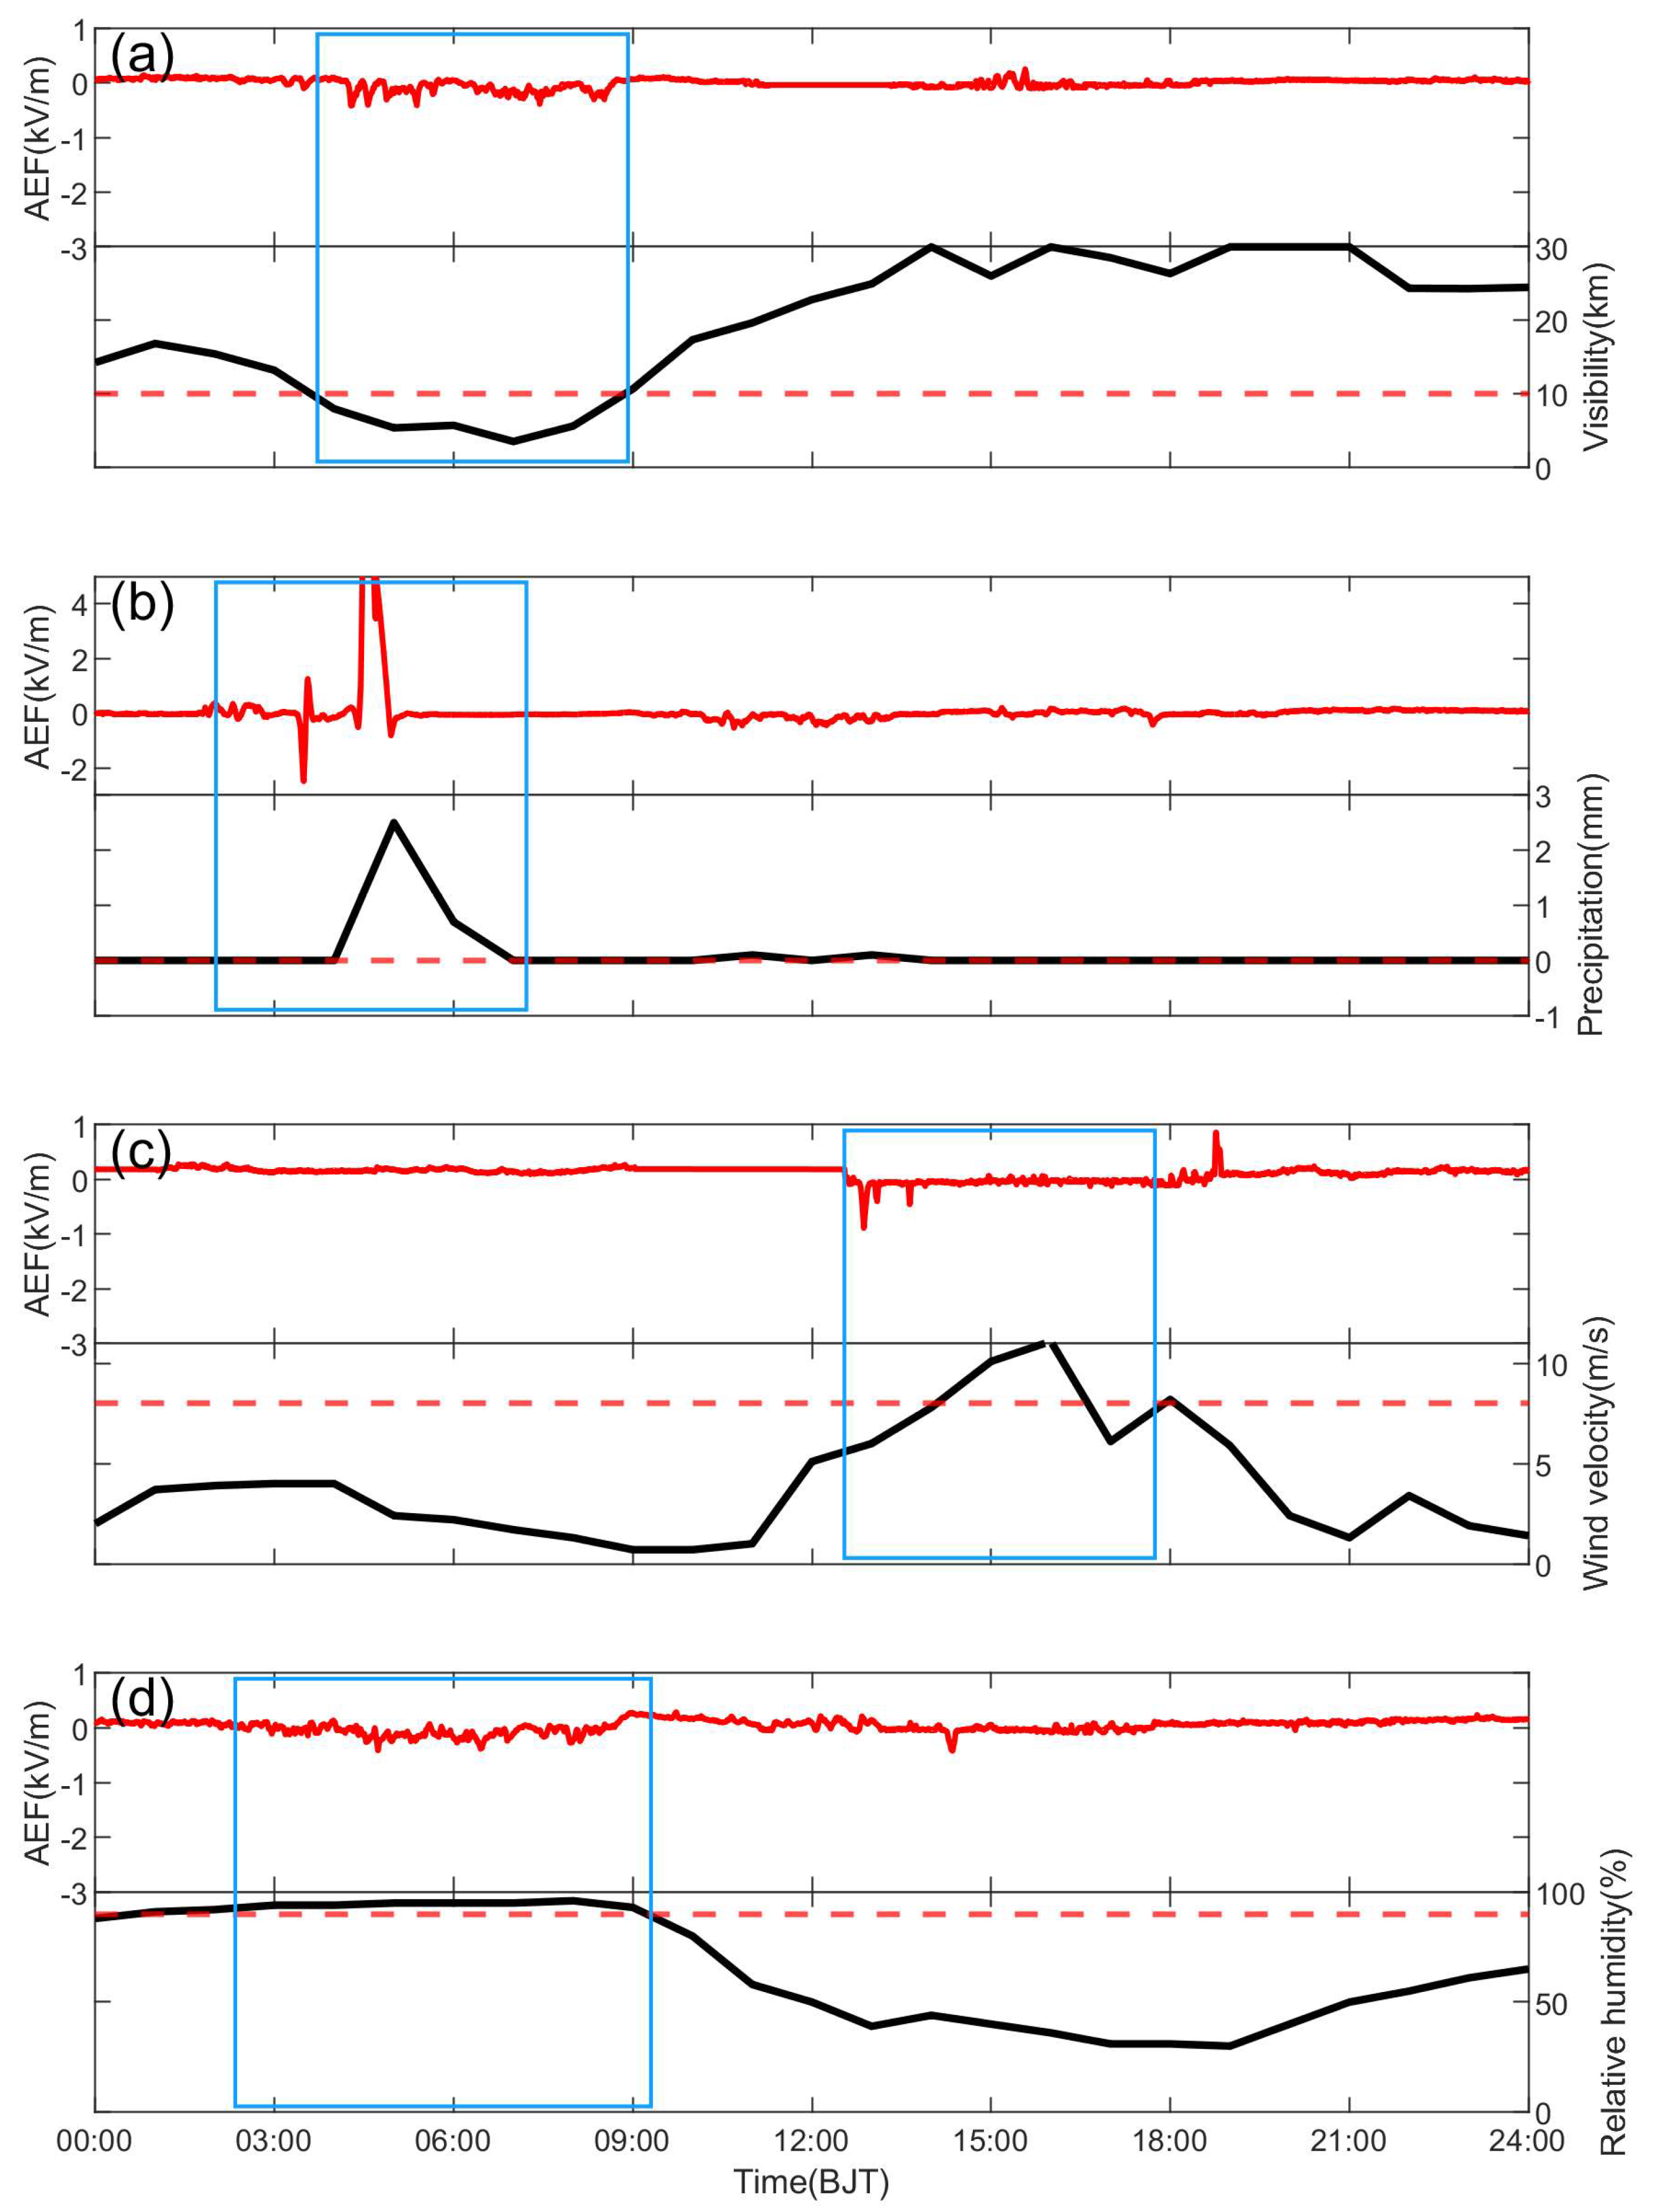
This study presents a summary of the morphological features of AEF anomalies observed under various meteorological conditions. Figure 4 provides a comparative illustration of AEF anomalies and meteorological data generated under different weather conditions. Specifically, Figure 4a demonstrates that when visibility is poor (less than 10 km), fog or dusty weather is likely to occur, which results in inverted spikes and low negative fluctuations in the AEF values. Figure 4b indicates that precipitation triggers fluctuating positive and negative AEF values or inverted spikes with low negative values. Furthermore, Figure 4c demonstrates that windy conditions can cause negative or positive needle-like abrupt changes in the AEF values. Figure 4d reveals that high relative humidity, close to 100%, is often associated with foggy weather, resulting in inverted spike-like low-negative value fluctuations in the AEF values. The characterization of AEF anomalies caused by meteorological factors presented in this study provides a solid foundation for eliminating the influence of meteorological factors on AEF observation.
4. Analysis of Anomalous AEF
4.1. Time Series Analysis Results
For each station with AEF anomalies, this study will analyze them one by one or combine them on the same day. The following figures show the results of comparing AEF data, including unprocessed and smoothed AEF data with meteorological information.
Figure 5, Figure 6, Figure 7 and Figure 8 demonstrate the time series analysis results. First of all, in Figure 5a, the first anomaly occurred at Dali Station on 11 April, that is, about 40 days before the earthquake. After that, negative AEF anomalies occurred at Midu Station and Heqing Station on 17 April and 30 April, respectively. From the above anomaly and meteorological information comparison chart, it can be seen that good weather conditions near the three stations are present when the anomaly occurs, and there are no key factors affecting the AEF anomalies, such as precipitation, except for a slight increase in wind speed. The anomaly at Dali Station is obvious, appearing three times from 9:00 to 18:00 BJT, each time lasting nearly ten to twenty minutes, with a spindle shape and a decline range from 1 kV/m to 2 kV/m, and the anomaly is obvious. However, the Midu Station anomaly appeared from 3:00 to 4:00 BJT, and the anomaly decreased slightly, nearly 1 kV/m, but the abnormal duration was close to 1 h. Such anomalies are more likely to be judged as anomalies caused by geological activities during calm weather conditions.
For Dali and Midu Station, it can be seen in Figure 2c that they are located on the Eryuan–Midu fault in the NW-SE direction, and in terms of when the AEF anomalies appeared, in Figure 5a, Dali Station is closer to the epicenter, and then we can see in the Figure 5b that the anomaly appears at Midu Station in the southern section of the fault, which accords with the micro-fracture occur in the process of fault activity before the earthquake. However, for Heqing Station, where the anomaly occurred on 30 April in Figure 5c, it is easy to see that the wind speed increased when the anomaly occurred; although the increase was not significant, it was found that the anomaly amplitude was very large by observing the anomaly shape and the negative anomaly followed by the positive anomaly, which was more in line with the comprehensive anomaly of charged cloud or cumulus cloud transit and windy weather in previous research results. By analyzing the station location, it can be seen that Heqing Station is located in the north of the Eryuan–Midu fault, belonging to the middle and late Pleistocene fault, while Dali and Midu belong to the middle and south sections of the Eryuan–Midu fault, so it is unlikely to comprehensively judge that the anomaly that occurred in Heqing on 30 April is caused by geological activities. However, the preliminary analysis of the negative AEF anomalies in Dali and Maidu on 11 April and 17 April, respectively, may be attributed to the fact that the Earth’s crust became geologically active about a month before the earthquakes.
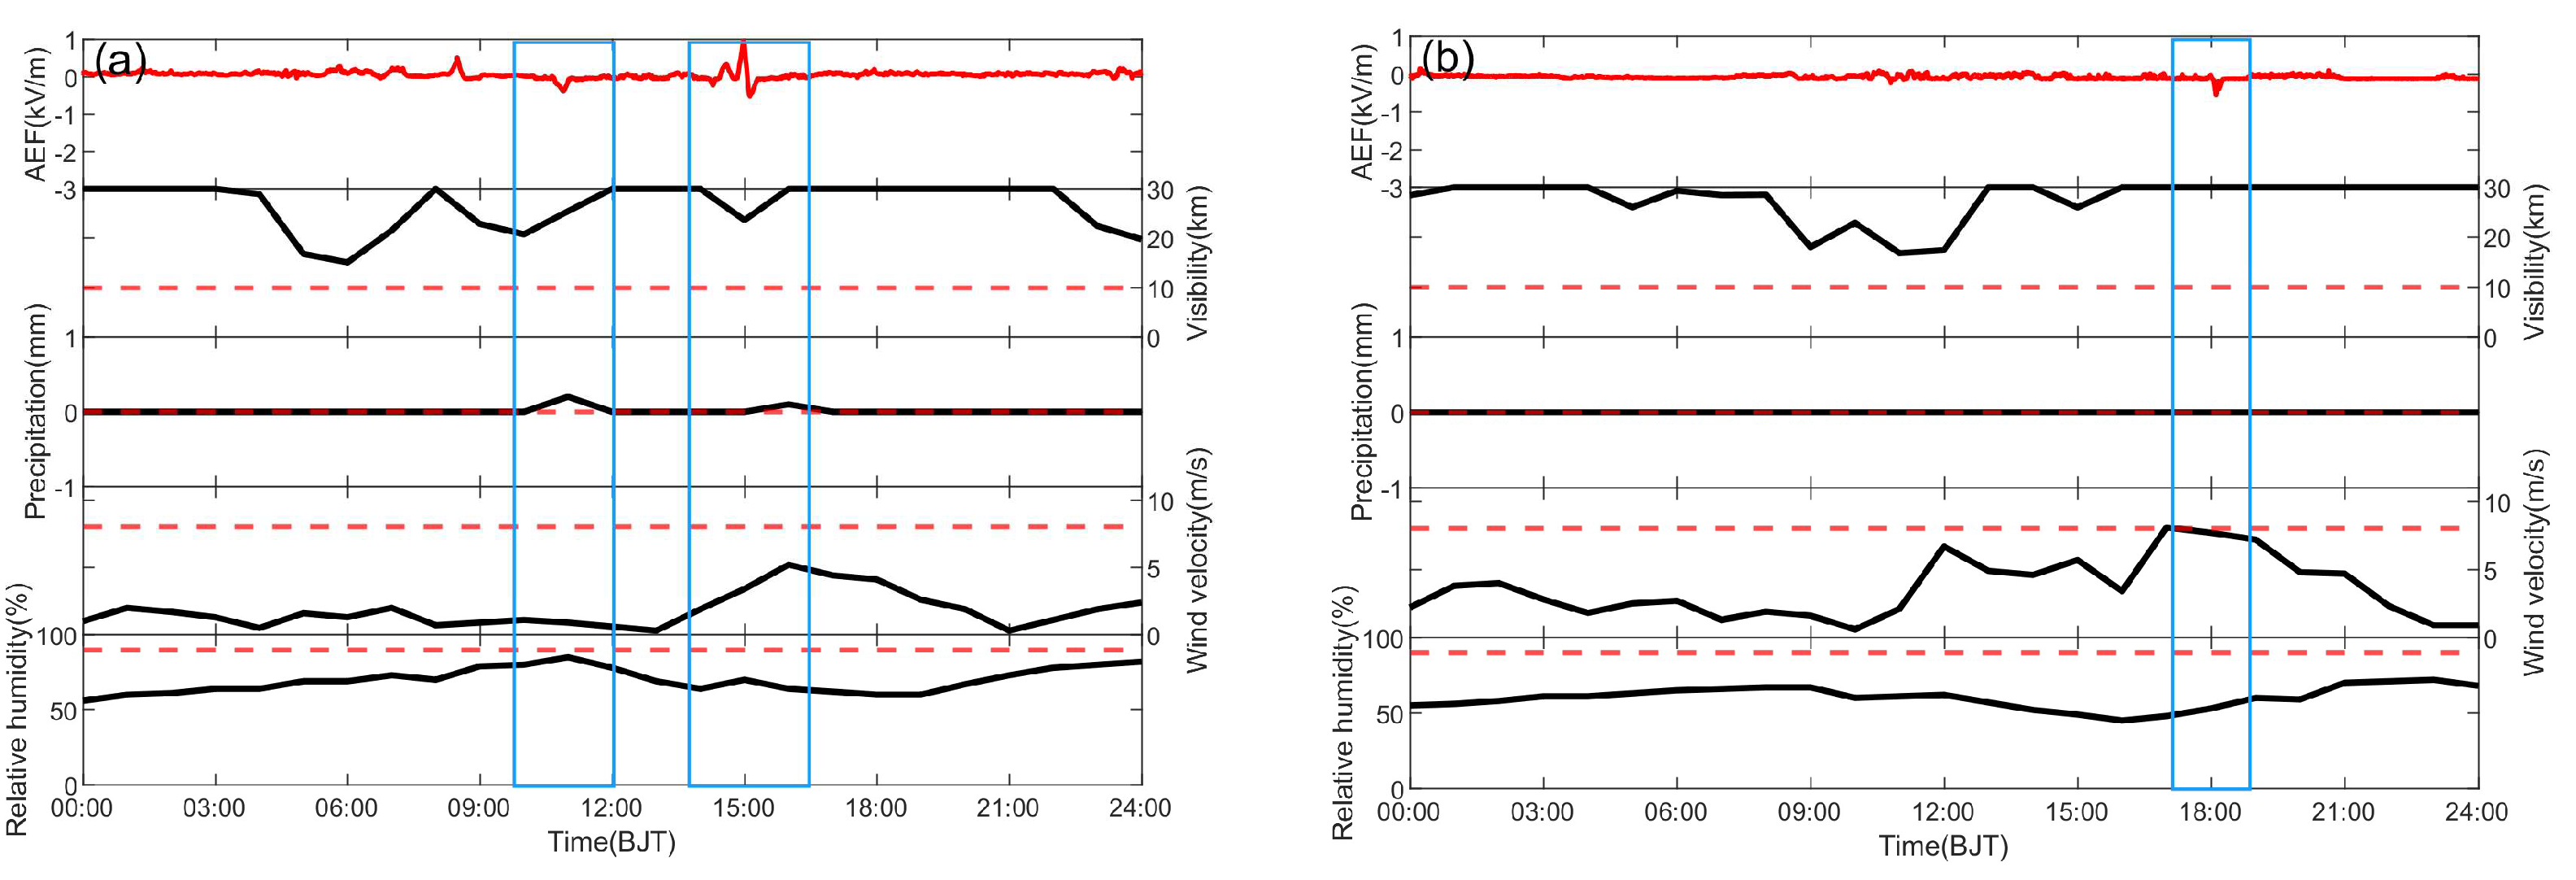
As shown in Figure 6a,b, the obvious negative anomalies were recorded at AEF stations in Midu and Nanjian on 2 May. Among them, a negative anomaly first occurred at Midu Station at about 15:00 BJT in Figure 6a and lasted nearly 30 min, and the decline was large, reaching about 2 kV/m. Comparing the meteorological information at that time and before and after the period, it can be seen that the weather was in good condition at that time; only the visibility decreased and the relative humidity increased slightly, but this situation basically could not cause such a large negative anomaly. For Nanjian Station, it is noticeable that there was gusty weather from 9:00 to 18:00 on 2 May in Figure 6b, so there are many positive anomalies with dense peaks in this period, which is in line with our understanding of the abnormal characteristics of gale weather in the continuous observation of the AEF for more than one year. However, in the process of wind speed decrease, a negative anomaly with a drop of 2 kV/m appeared from 17:00 to 18:00 BJT, and the duration was close to 1 h. Comparing the meteorological information before and after the period, it can be seen that the weather condition is very good, so it is ruled out that the negative anomaly in Midu and Nanjian Stations on 2 May was caused by the poor weather conditions in the area.
Combined with the negative anomalies of the AEF in the Dali and Midu in mid-to-late April, we can see in Figure 2c that Nanjian is located several kilometers southeast of the Eryuan–Midu fault. Although the fault does not extend to the vicinity of Nanjian, whether the fault extends to the vicinity of Nanjian or there is a deep fault in Nanjian during the block activity needs further field study. Even so, the anomaly occurrence sequence of the Dali–Midu–Nanjian connection still makes us believe that the anomalies in these three places were caused by geological activities before the Yangbi earthquake.
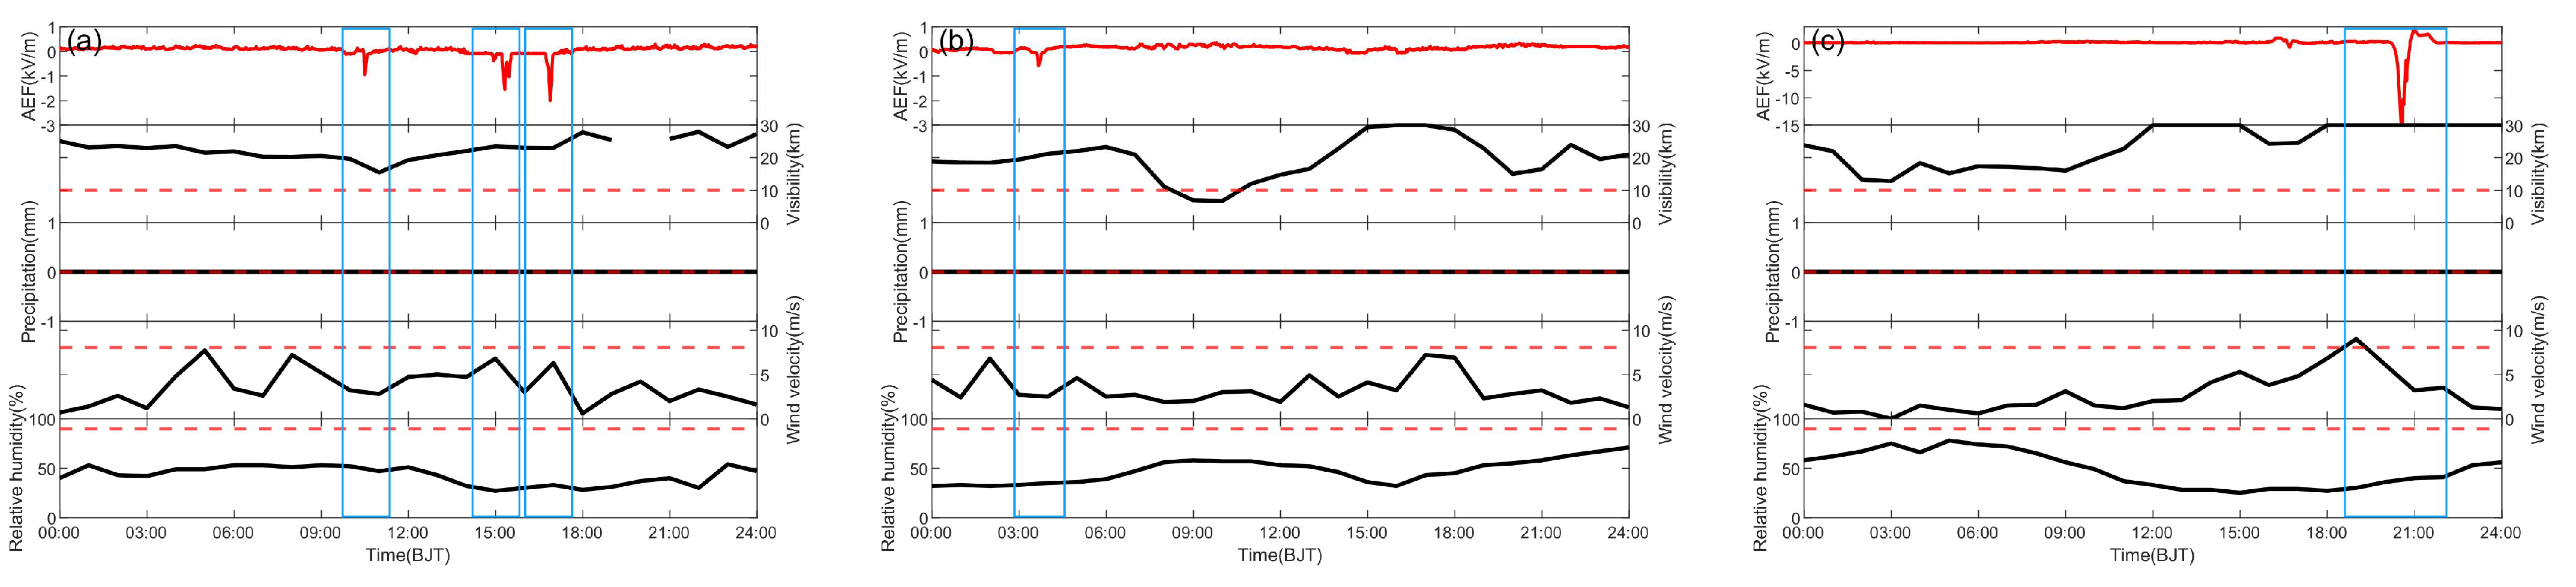
5 May was the day with the highest amount of AEF stations with negative anomalies before the Yangbi earthquake. As shown in Figure 7a–c, the negative anomalies of the AEF appeared in Dali, Midu, and Yangbi during the period from 12:00 to 16:00 BJT on this day. In Figure 7a, a negative anomaly was first observed in Dali on 5 May, which lasted for one hour and decreased by more than 3 kV/m. Two hours later, in Figure 7b, a negative anomaly with a similar shape and duration to Dali Station was also recorded at Midu Station, and decreased by more than 3 kV/m. Although a larger positive and negative anomaly appeared in Midu after the anomaly appeared, it can be seen that precipitation occurred in this period by comparing the precipitation chart of the same period. the profound effect of the rainfall on the AEF measurements is apparent, frequently leading to negative AEF values extending to thousands of volts per meter [30]. Therefore, the subsequent anomalies can be determined to be caused by precipitation, but the single negative anomaly at 14:00 BJT can be compared with meteorological information, which is basically in line with sunny atmospheric conditions. After that, in Figure 7c, a negative anomaly appeared at Yangbi Station around 16:00 BJT, which lasted for more than 30 min and decreased by more than 2 kV/m. Compared with meteorological information, it can be seen that the visibility near Yangbi is 30 km, the rainfall is 0, and the relative humidity is lower than 50%. Although the wind speed in Yangbi is slightly higher in the afternoon, there are two positive anomalies with a small increase by observing the fluctuation curve of the AEF. A slightly higher wind speed can produce anomalies with similar amplitude, but it is unlikely to produce negative anomalies exceeding 2 kV/m, so the negative anomaly of the AEF on 5 May in Yangbi can also be judged as an anomaly caused by geological activities. Then, in Figure 7a, the negative anomaly of the AEF appeared again in Dali. Although positive fluctuation appeared in the unprocessed data, it appeared an obvious negative anomaly after smoothing treatment, which lasted for nearly one hour and decreased by nearly 2 kV/m. The anomaly on 5 May occurred in the triangle area of Dali, Midu, and Yangbi, which is also very close to the epicenter area of the Yangbi Ms 6.4 earthquake. It is comprehensively judged that the AEF anomalies recorded by the three stations were caused by geological activities.
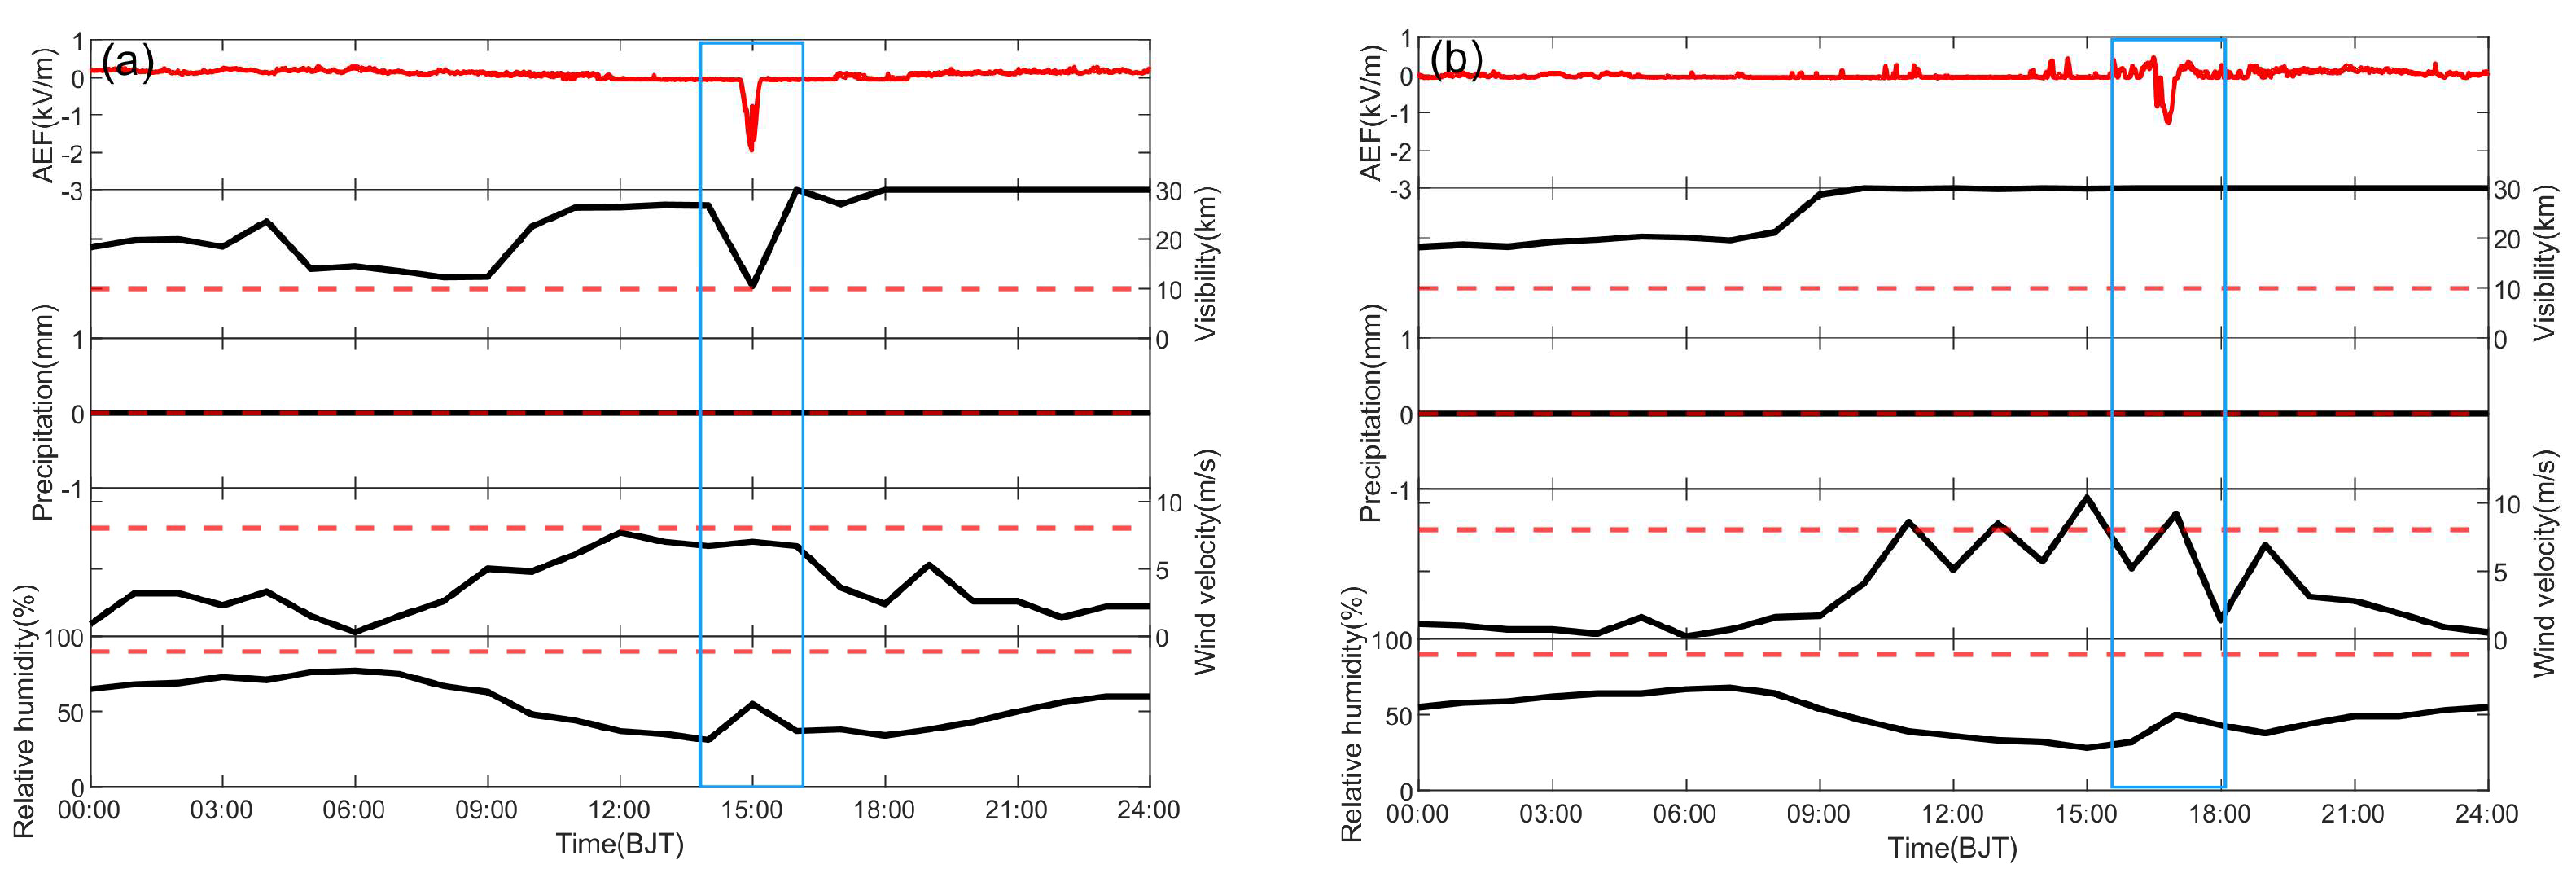
As shown in Figure 8a,b, the AEF anomalies were observed in Yangbi and Jianchuan on 7 May. At about 11:00 BJT, the negative anomaly of the AEF appeared again in Yangbi in Figure 8a, but compared with meteorological information, it is clear that the anomaly occurred during periods of precipitation, so it can be judged as an anomaly caused by meteorological factors. Seven hours later, a negative anomaly of the AEF was recorded in Jianchuan in Figure 8b. The anomaly lasted for a short time, about 20 min, and the decline was less than 1 kV/m. However, compared with the meteorological information, it is obvious that the overall weather condition was good except for the slightly higher wind speed. This anomaly in Jianchuan is different from the anomaly with a long duration and a large decline in other stations, so it cannot be accurately judged as an anomaly caused by geological activities. However, Jianchuan is also located on the Longpan–Qiaohou fault connected with the Eryuan–Midu fault, and micro-ruptures from pre-seismic block activity may also occur on this fault, affecting AEF fluctuation, so it is comprehensively inferred as a mixed anomaly of meteorological and geological activities.
In summary, by eliminating the influence of meteorological factors, such as rainfall, under relatively good local meteorological and spatial weather conditions, the anomalies at Dali Station on 11 April, Midu on 17 April, Midu and Nanjian on 2 May, and Dali, Midu, and Yangbi on 5 May are likely to be AEF anomalies caused by geological activities in the seismogenic area before the Yangbi Ms 6.4 earthquake.
4.2. Wavelet Analysis Results
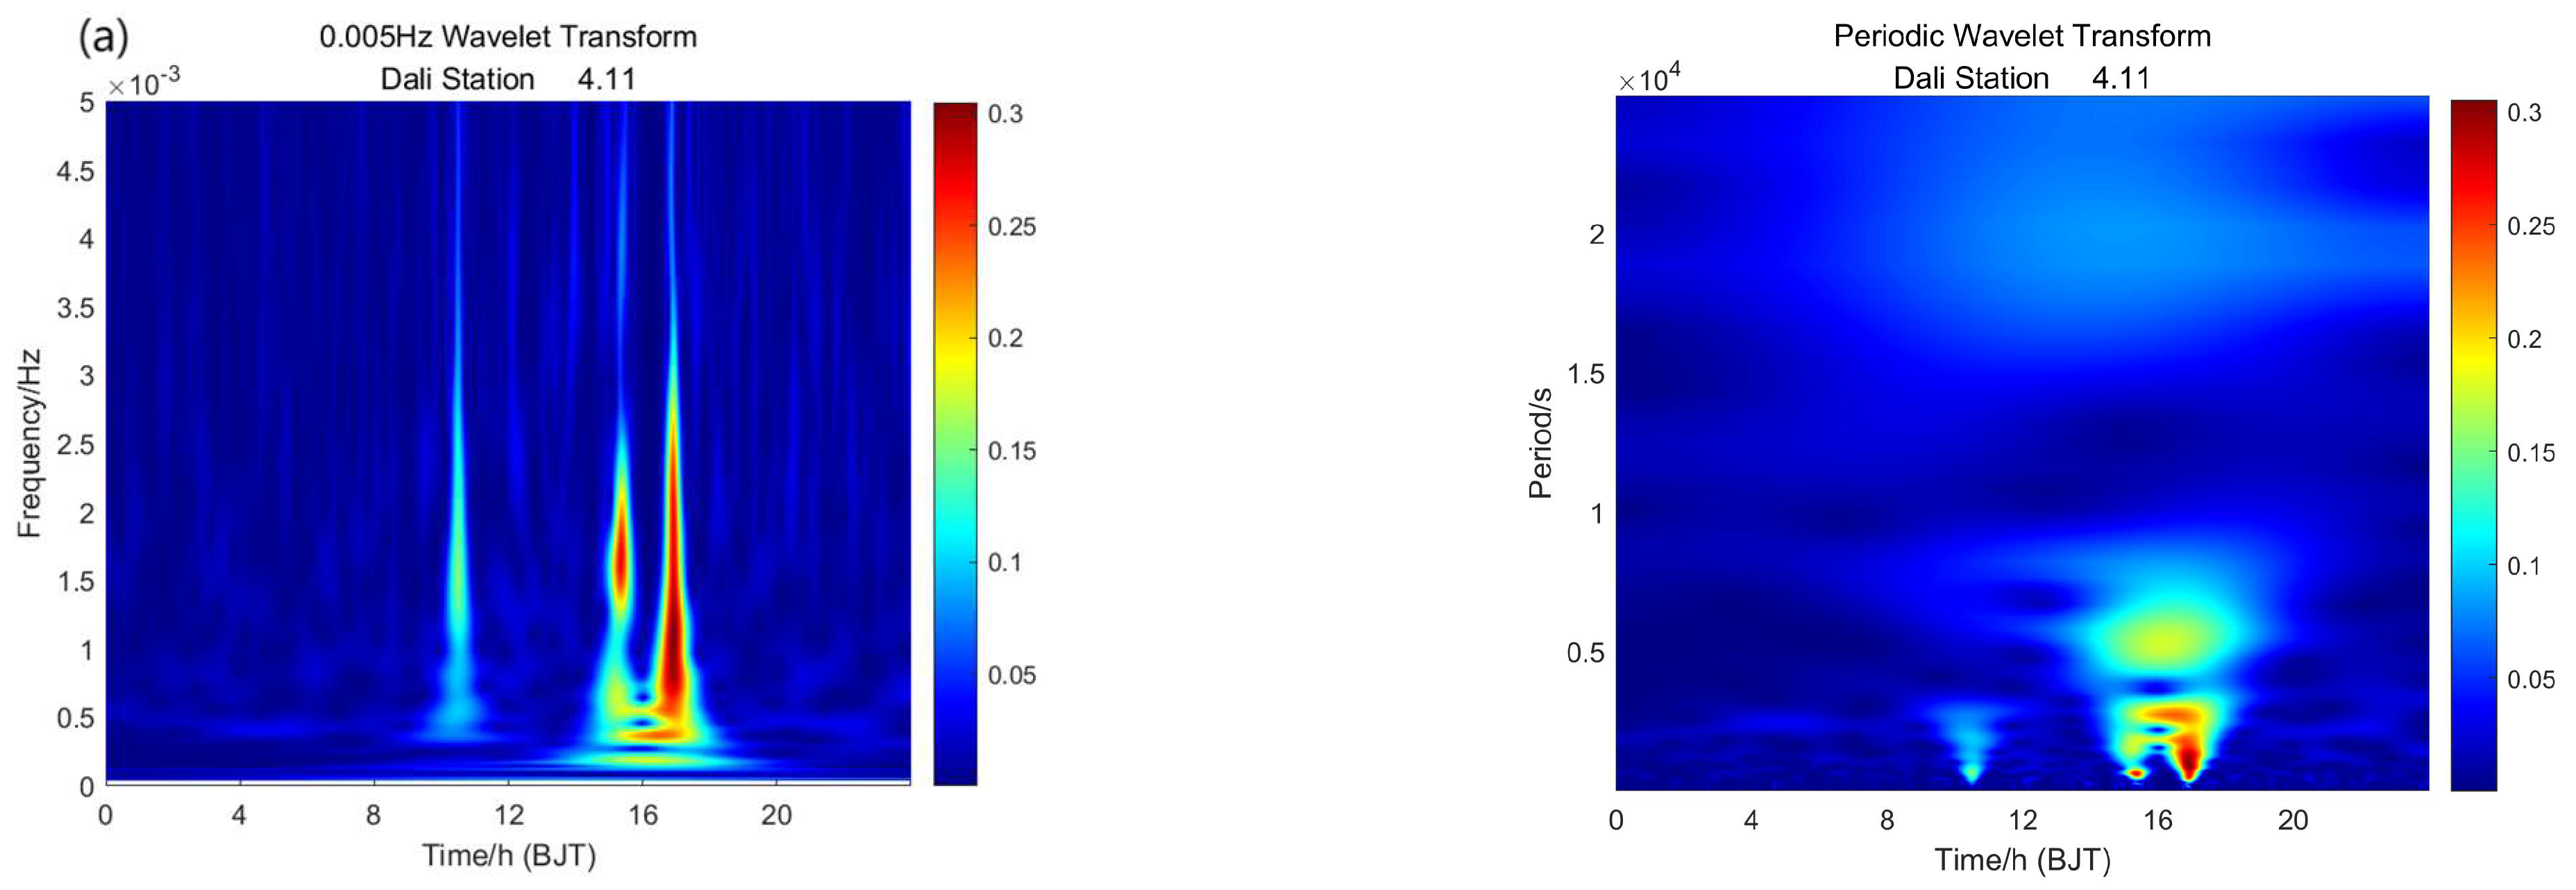
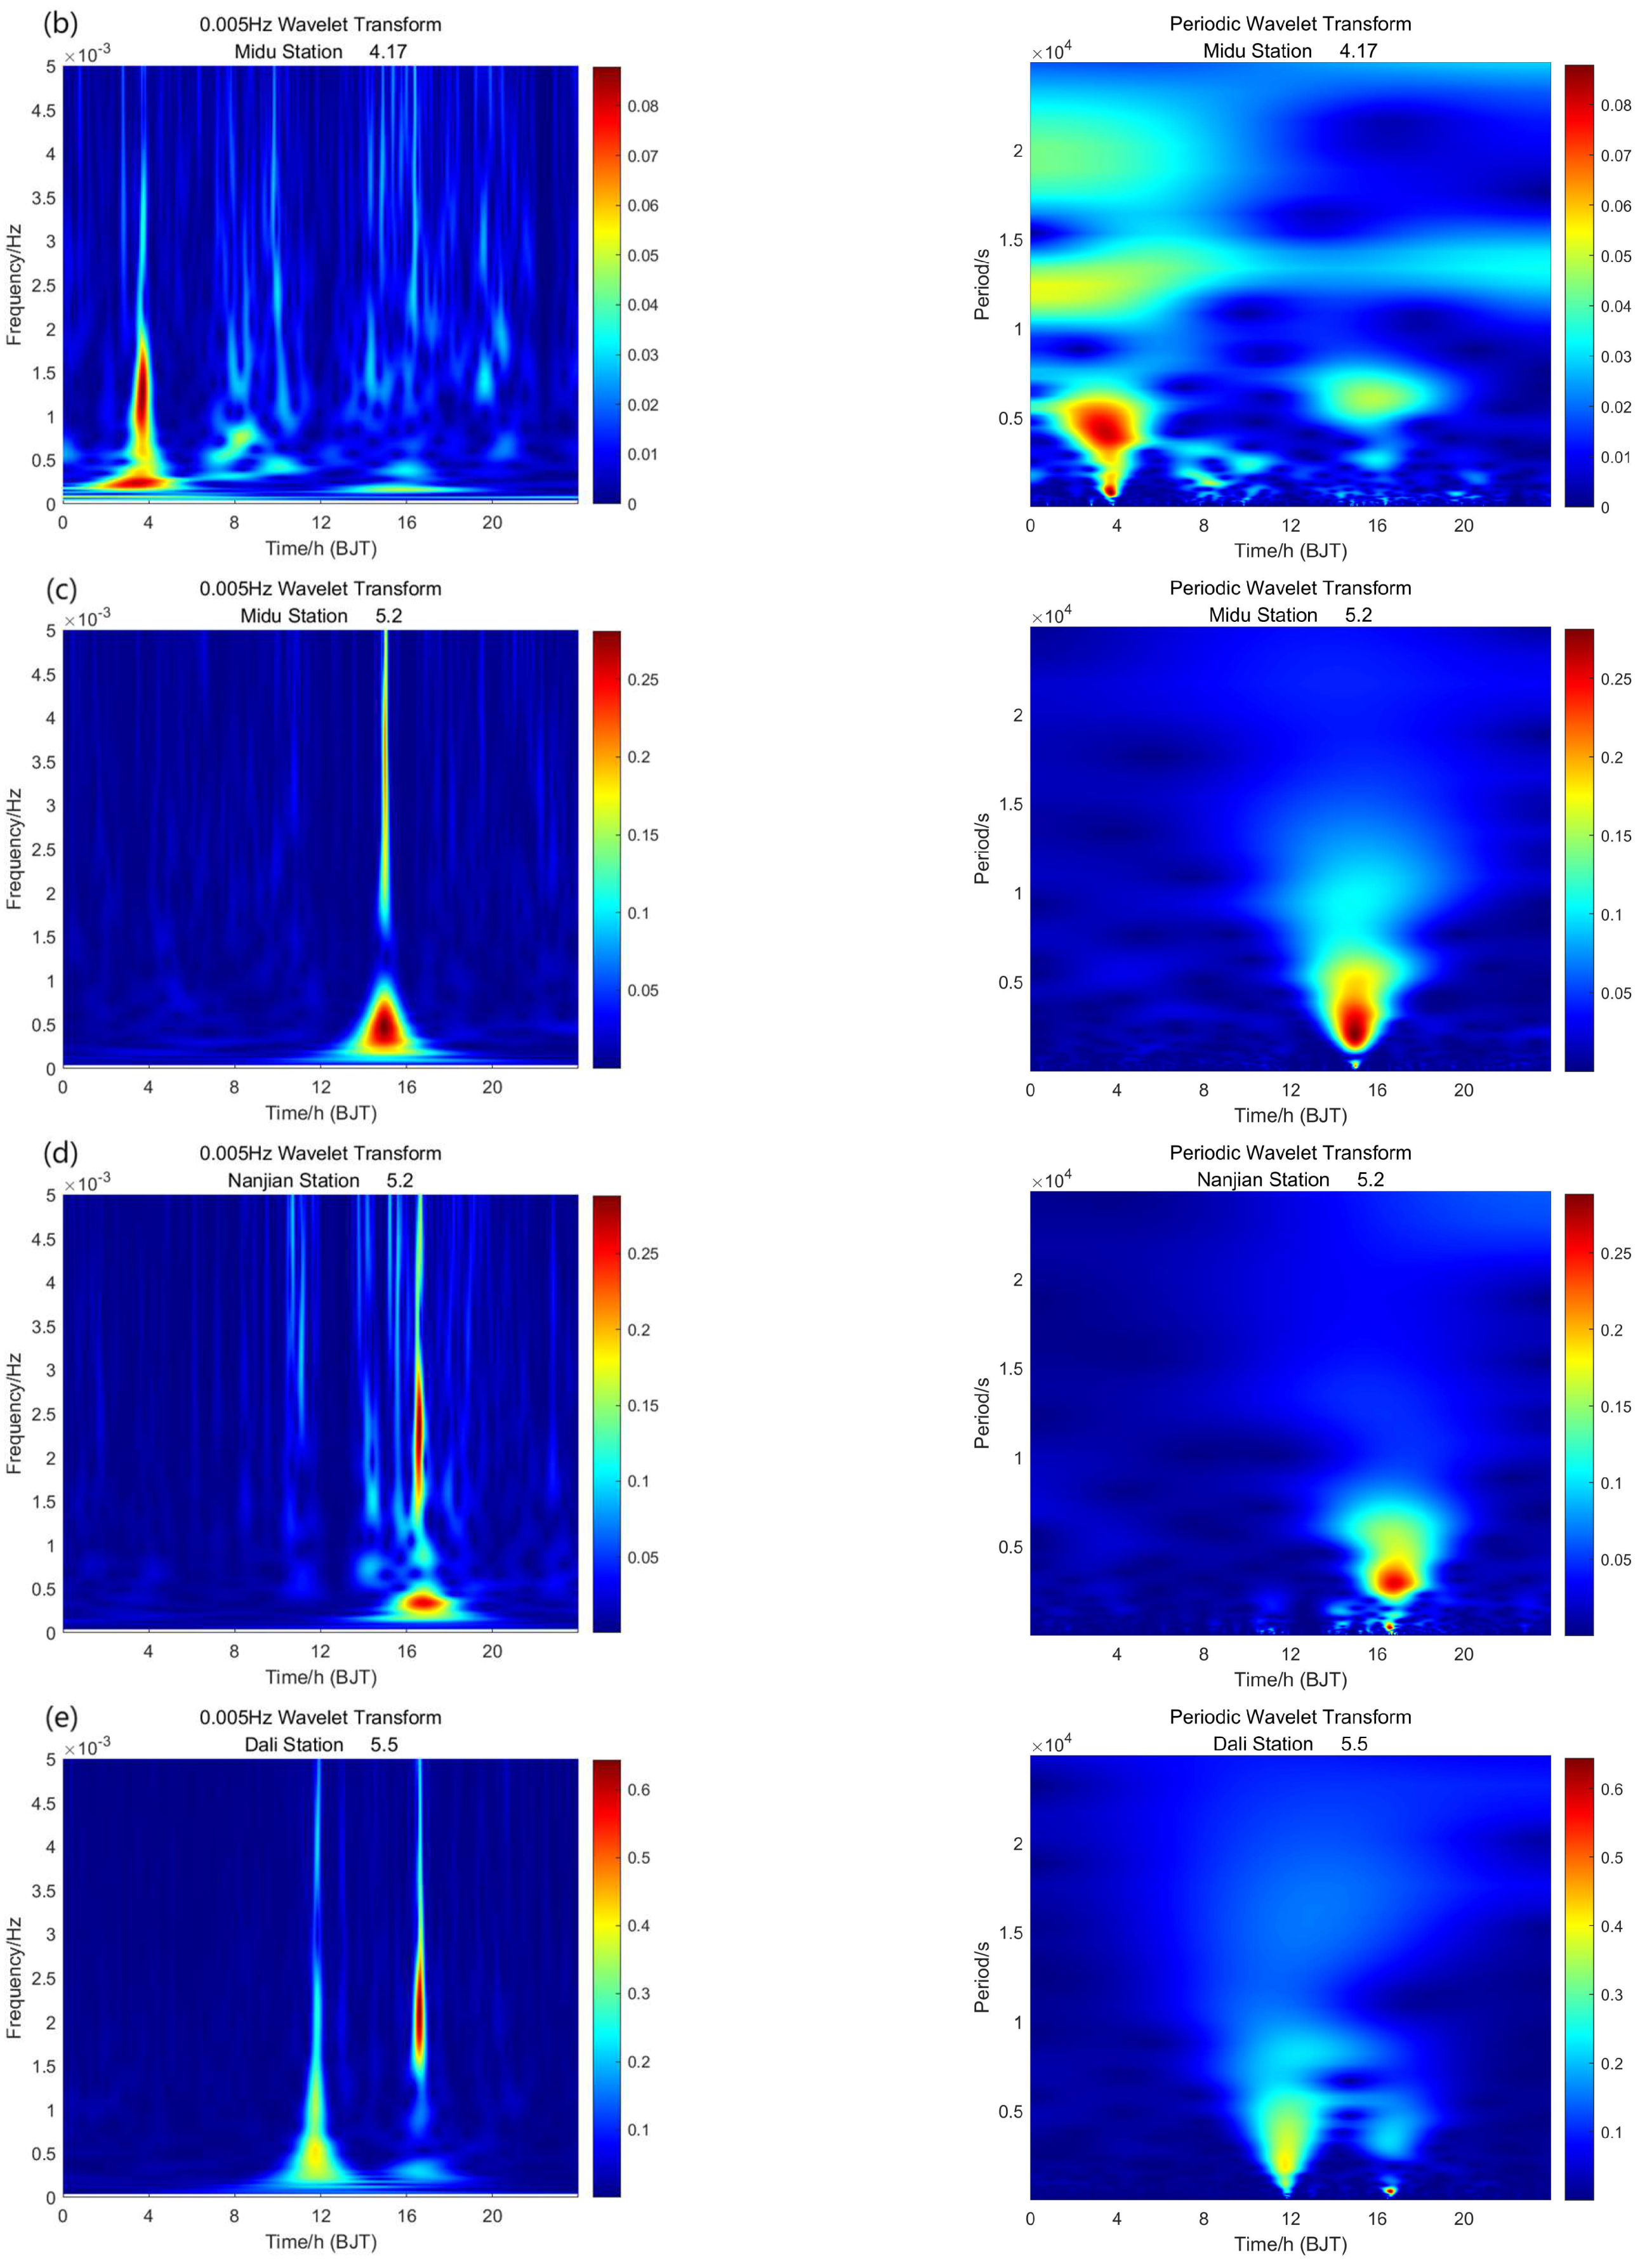
For the above-extracted AEF anomalies, we performed wavelet analysis, and the results are shown in Figure 9. The results of the wavelet analysis in Figure 9a show a large enhancement between 0.5 mHz and 1 mHz for Dali on 11 April. Figure 9b demonstrates that the anomaly for Midu on 17 April is much more enhanced at 0.2 mHz and between 1 and 1.5 mHz. The results of the wavelet analysis of the anomalies that appeared at Midu and Nanjian on 2 May are shown in Figure 9c,d, and they are enhanced at frequencies of 0.5 mHz and 0.3 mHz, respectively. On 5 May, in Figure 9e–g, when anomalies occur most frequently, their wavelet transform results are also very consistent. Except for the enhancement caused by meteorological factors near 2 mHz, Dali, Midu, and Yangbi, all have enhancement near 0.5 mHz, while Yangbi has a greater increase, which also corresponds to the result that the main Yangbi Ms 6.4 earthquake occurred half a month later. In summary, it is evident that the frequency of these AEF anomalies is enhanced near 0.5 mHz, especially at Midu and Nanjian, where anomalies appeared on 2 May in Figure 9c,d, which are pretty obvious at 0.5 mHz. Although they are also enhanced near 2 mHz, they can be considered abnormal disturbances caused by weather factors after comparison with AEF anomaly images.
In a previous study on the pre-seismic AEF, Smirnov conducted a statistical analysis of 103 cases of a bay-like depression in the strength of the Ez component of the quasistatic electric field in the near-Earth atmosphere. These observations were made in Kamchatka from 1997 to 2002. The study revealed that the most common duration of a bay was between 40 and 60 min [31]. This finding aligns with the results presented in this paper. Marapulets and Rulenko also conducted a comprehensive analysis of joint anomalies involving high-frequency acoustic emission and the AEF at the ground–atmosphere boundary in Kamchatka. These anomalies manifested as increases in acoustic emission in the mHz frequency range and bay-like decreases in the AEF that occurred simultaneously during calm weather conditions [32].
The wavelet analysis results presented in this paper are consistent with the statistical analysis conducted by previous researchers. The anomalies observed in both studies exhibited durations ranging from 30 to 60 min, and their frequencies fell within the mHz frequency range. Consequently, the AEF anomalies identified in this study can be attributed to non-meteorological anomalies associated with pre-seismic geological activities.
5. Discussion
This study focuses on examining the atmospheric quasi-electrostatic field, which is characterized by several key attributes. First, the AEF is capable of effective propagation in various media, including vacuums. Secondly, it possesses low energy but high potential energy. Lastly, its ability to generate the accumulation of surface charges on the high-conductivity layer surface substantially enhances the local field. Leveraging these inherent features, coupled with vertical electric field monitoring, enables researchers to overcome the challenges of identifying and extracting weak seismic electric fields while mitigating the impact of strong horizontal interference, which is difficult to eliminate, so atmospheric vertical electrostatic field monitoring has been recognized as an effective method for reliably extracting earthquake precursors by scientists in many countries [33].
The atmosphere, as a highly interconnected component of the Earth system, is influenced by various factors such as external space, the ionosphere, and the rock layer. The intricate nature of atmospheric dynamics, coupled with its sensitivity to these influences, presents a significant challenge for achieving precise observations. Despite the remarkable advancements in modern science and technology, which provide an array of observation methods, attaining 100 percent accuracy in weather prediction remains elusive.
The same principle applies to variations in the AEF within the atmosphere, as it is influenced by multiple factors such as thunderstorm activity [34,35], atmospheric pollutants [36,37], geomagnetic activity [38], and climate change [39]. Therefore, this study employed detailed meteorological data from multiple stations in Yunnan in conjunction with long-term observation experience. The time series analysis was conducted to eliminate the influence of meteorological activities on the AEF. After that, the wavelet analysis was performed on the remaining AEF anomalies suspected to be induced by geologic activities. The results indicate that these anomalies exhibit enhanced signals within the same frequency domain and demonstrate periodic energy enhancement lasting 30–60 min, providing evidence for their homogeneity.
In contrast to previous studies on AEF anomalies before earthquakes, most of the identified anomalies were limited to single stations or double stations or anomalies occurring on the same day [40]. For instance, Bleier et al. observed that the air conductivity sensors they deployed exhibited a saturation time exceeding 14 h in the morning and evening before the Alum Rock Mw 5.4 earthquake [41]. An et al. also investigated the synchronous abnormal changes in electric field gradient at Wenjiang District and Pixian County stations several hours to several days prior to the Wenchuan Ms 8.0 earthquake [42]. However, when these anomalies manifest in the records of individual stations, they are prone to being attributed to environmental noise or instrument-related faults. Deploying multiple sensors or instrument arrays for AEF monitoring within the same area can help mitigate such uncertainties [43]. In light of the extensive dataset available, this study utilizes time series analysis and wavelet analysis methods to validate the occurrence of AEF anomalies during the pre-seismic phase. The identified anomalies are characterized by greater intensity, prominence, and spatial extent, and can be detected by modern advanced observational equipment prior to the main shock.
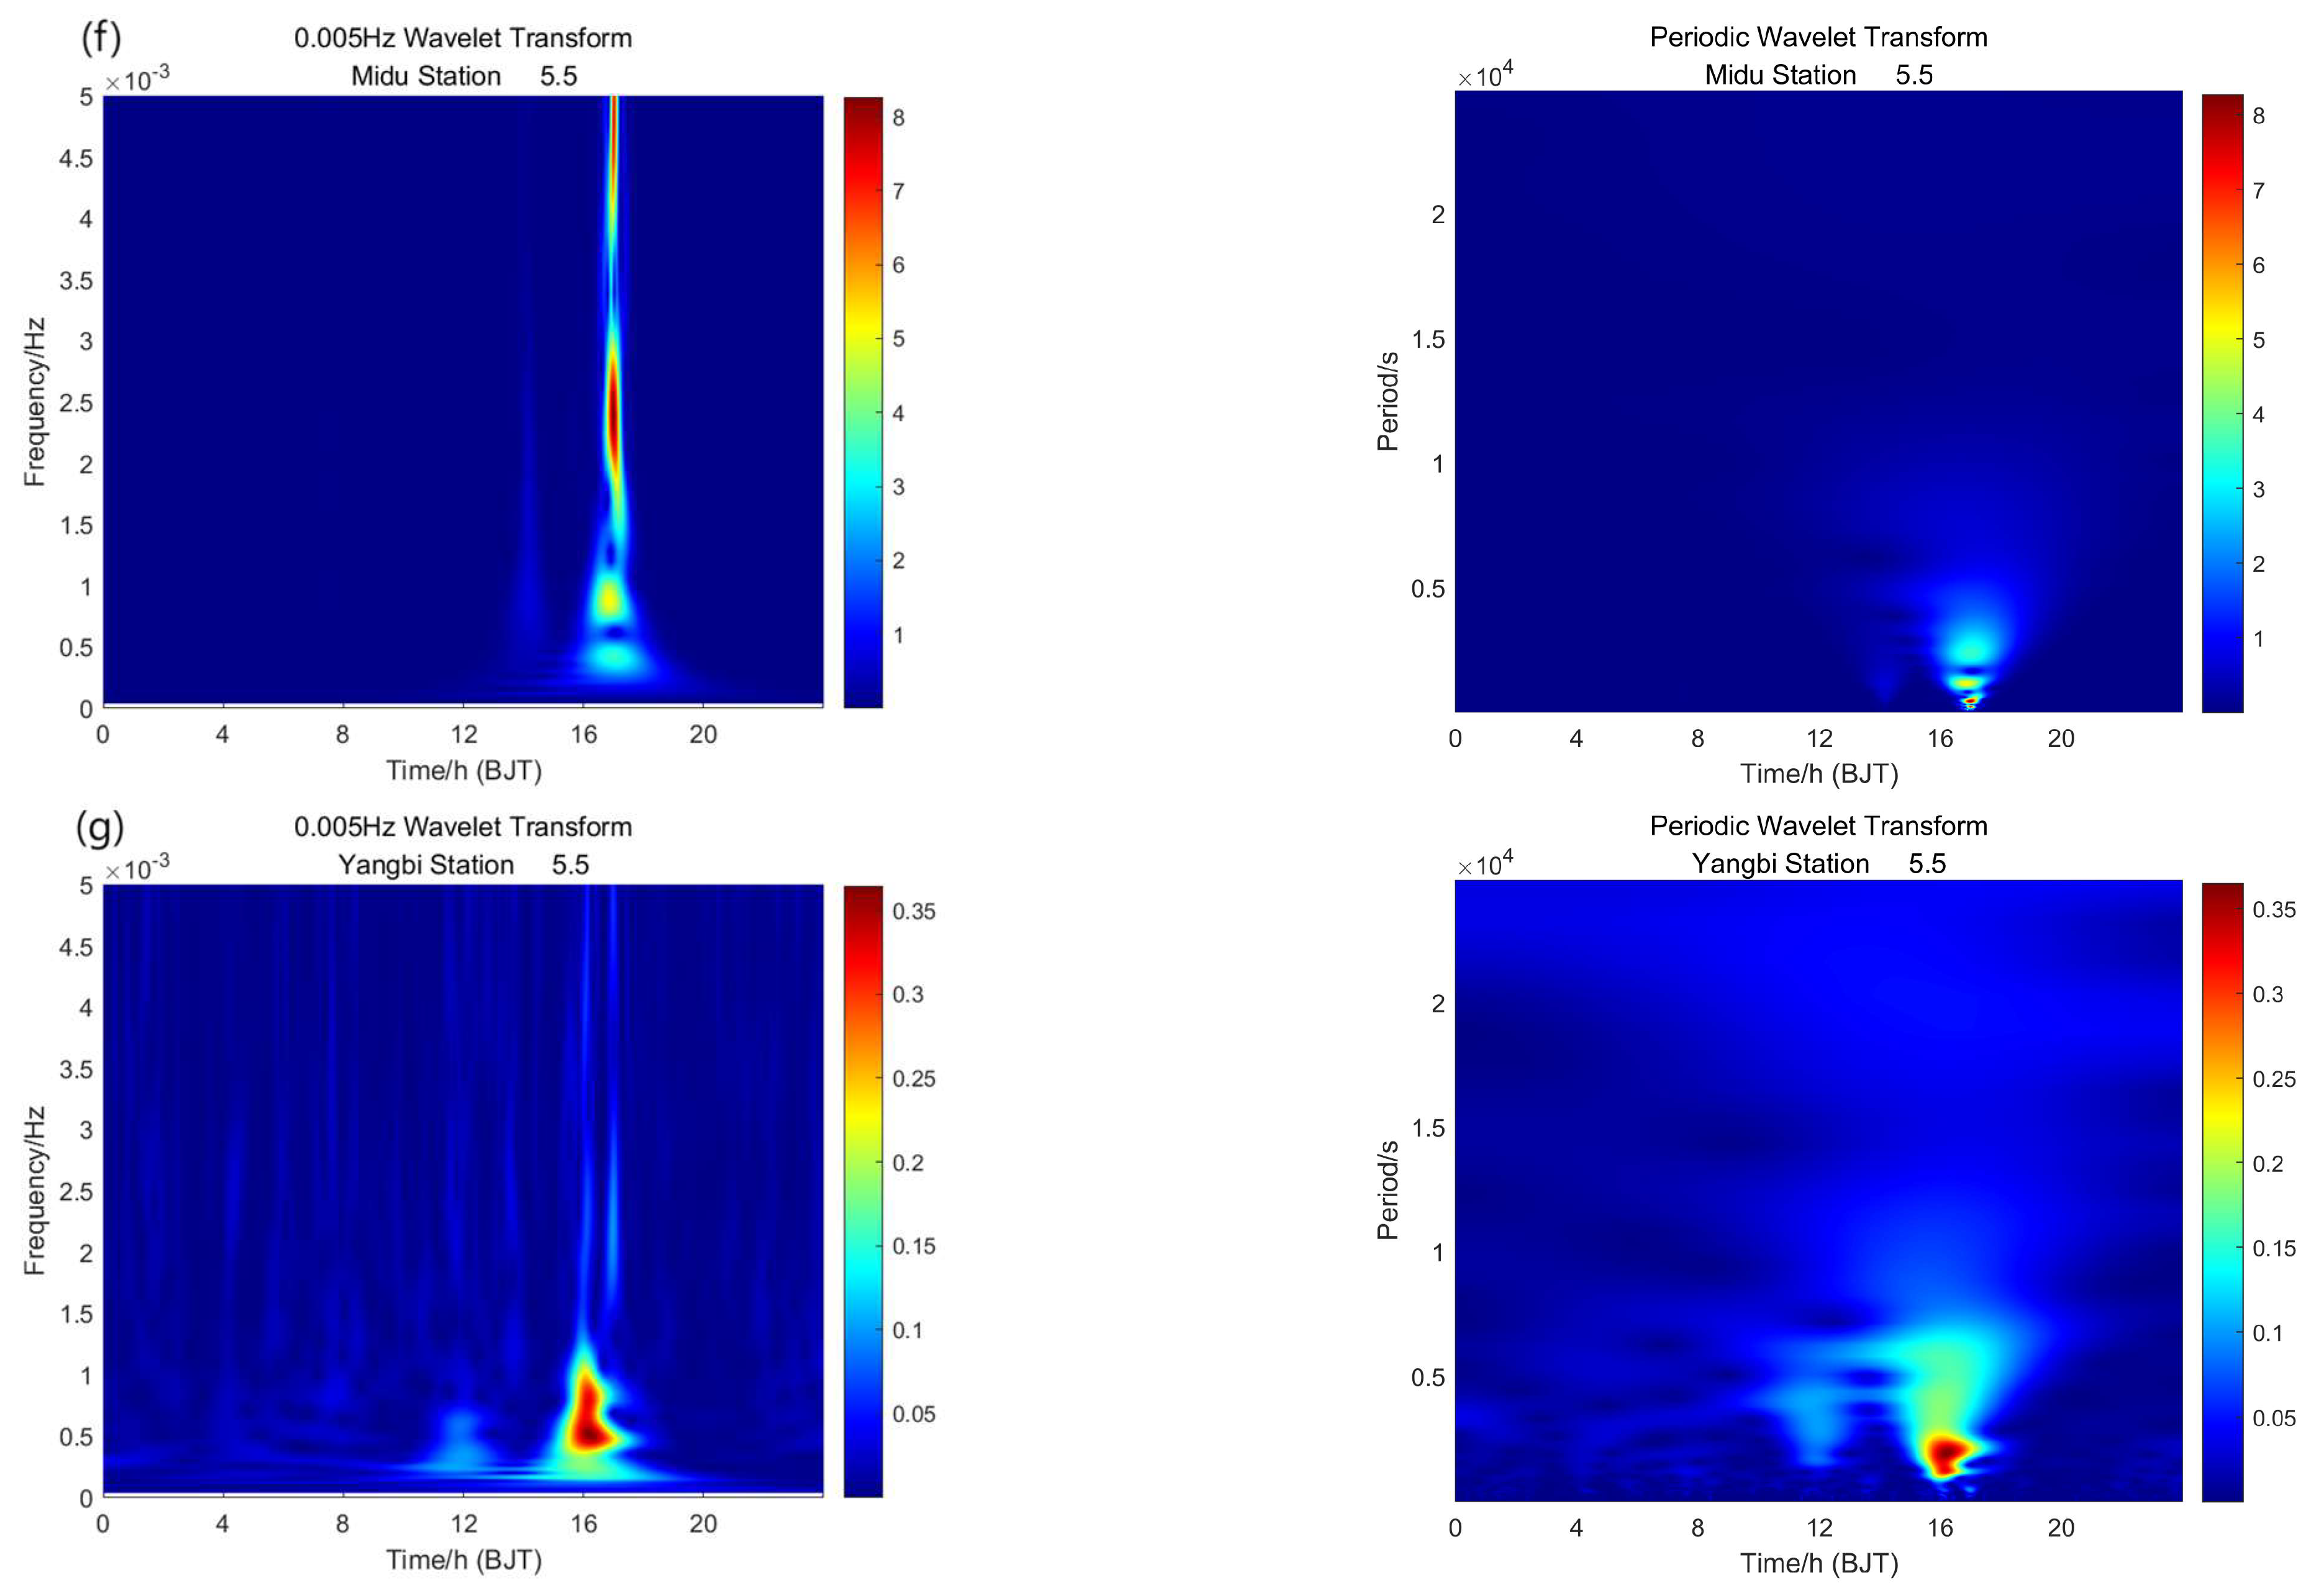
This study investigates the anomalies of each station to demonstrate the correlation between the time of appearance of AEF anomalies, epicentral distance, and anomaly amplitude preceding the Yangbi earthquake. Detailed information regarding each anomaly identified at every station is documented in Table 1. Meanwhile, the results are visualized in Figure 10. Figure 10a illustrates the relationship between the appearance time of AEF anomalies and their magnitude decline (absolute value). It shows that the AEF anomalies first appeared approximately 40 days before the earthquake, briefly subsided, and then reappeared at many stations about 15–20 days before the earthquake. Subsequently, no anomalies occurred until the small earthquakes and the mainshock took place. Notably, the amplitude decline of these anomalies was concentrated at 1–3 kV/m. Interestingly, as the earthquake approached, the magnitude and frequency of the anomalies increased. Figure 10b displays the relationship between the occurrence time of the AEF anomalies and the distance from the epicenter of the anomalous sites. The plot shows that the anomalies appeared 30–40 days before the earthquake, gradually moving away from the epicenter. After that, the anomalies that appeared 20 days before the earthquake moved closer to the epicenter. This suggests that the anomalies may have arisen as a result of the spread of anomalies along fracture zones from the vicinity of the main earthquake’s epicenter, ultimately converging at the epicenter of the main earthquake. Finally, Figure 10c demonstrates a clear relationship between the anomaly decline magnitude of the AEF anomaly (absolute value) and the epicenter distance. Specifically, the plot indicates that the anomaly decline magnitude of the AEF anomalies increases with decreasing epicenter distance. Therefore, the closer the epicenter of the mainshock is to the epicenter of the anomalies, the more prominently these anomalies appear.
It is noteworthy that the AEF anomalies observed in Figure 2c are distributed in a northwest–southeast direction along the Weixi–Qiaohou fault. Based on meteorological background data during the occurrence of AEF anomalies in Dali Prefecture, it can be seen that these anomalies corresponded with alternating northwesterly and southeasterly winds. This pattern facilitated the spread of anomalies as atmospheric compositional anomalies along airflows to nearby AEF monitoring stations. The highly correlated data from several AEF stations that produced anomalies before the Yangbi earthquake are likely related to the seismogenic process of this event, based on their locations in the “preparation area” associated with the earthquake’s seismogenic process [44]. This study’s findings offer new insights and evidence for exploring the relationship between seismic geological activities and the AEF.
Currently, multiple explanations exist regarding the abnormal AEF observed prior to earthquakes. One prevailing explanation suggests that during the preparation and occurrence of an earthquake, physical phenomena, such as the piezoelectric effect, may generate electric charges in the crust near the epicenter [45,46,47,48,49] or have an electric effect [50], which can excite electromagnetic radiation to generate the seismogenic electric fields into the atmosphere and even upload them to outer space, such as the ionosphere. St-Laurent et al. and Freund et al. comprehensively described the direct relationship between the electrical anomaly generated during the seismogenic process in the solid earth before the earthquake and the positively charged “holes” generated along with the compression process in igneous rocks during the seismogenic process [51,52]. Another explanation is that a radon anomaly before earthquakes is considered one of the main physical mechanisms of electromagnetic precursor phenomena [53,54]. A plethora of research findings have consistently demonstrated that significant changes occur in the crustal structure near the epicenter prior to major earthquakes. These changes involve slight fracturing of numerous rocks, potential interconnection between rock channels, and minor surface fractures. Inert gases, such as radon, are released through cracks in soil or rocks, and the subsequent decay of radon emits a substantial number of particles. These particles generate a large number of ion pairs in the air through radioactive ionizing radiation, leading to the formation of a polarization electric field that opposes fair weather conditions. Considering the exclusion of meteorological variations and other factors that may influence the negative anomaly of the AEF, it is plausible to attribute the negative anomaly of the AEF in seismogenic areas to abnormal signals arising from the extensive micro-fracturing of rocks induced by large-scale geological tectonic activities [55,56,57].
In 2004, research teams led by Japanese scientist Hayakawa [58] and Russian scientist Pulinets [59] proposed the multi-path lithosphere–atmosphere–ionosphere coupling model (LAIC) and the unified circle coupling model, respectively. Both models posit that the AEF anomaly observed in the atmosphere serves as a crucial aspect of the model and originates from the geological activities preceding an earthquake [60,61,62]. Regarding the Yangbi earthquake, subsequent field explorations conducted by Chinese scholars revealed varying degrees of changes in radon, mercury content, chloride ion, and sulfate ion concentrations in underground and hot spring water before and after the Ms 6.4 earthquake. These findings further support the idea that geological activity plays an integral role in precursory phenomena associated with earthquakes [63]. The overall performance of the earthquake area was that the radon and mercury concentration in most hot spring water increased before the earthquake, while the content of each component in hot spring water decreased significantly after the earthquake [64,65]. Ma et al. systematically summarized the observation data of underground fluid near the epicenter. The results showed that the water temperature of the Eryuan well was abnormal on 24 February 2021 [66]. Fu et al. systematically sorted out and reviewed the fluid observation anomalies before the Ms 6.4 earthquake in Yangbi, Yunnan Province, and showed that most of the fluid anomalies before the earthquake in Yangbi were centered in the half-year time scale. The pre-earthquake fluid anomalies in Yunnan are concentrated within 200 km of the epicenter, and the fluid anomalies are gradually contracted from the periphery to the epicenter, which is similar to the observation of the AEF anomalies in this study [67]. After analyzing the data from geoelectric field stations within 500 km of the epicenter of the Yangbi earthquake, Xin and Zhang also found that there were pre-earthquake anomalies of azimuth and amplitude at more stations about ten days before the impending earthquake [68]. After the Yangbi earthquake, Hou et al. retrospectively analyzed the data of geoelectric field stations within 200 km of the epicenter and found that geoelectric field anomalies began to appear at Eryuan and Xiangyun from about fifteen days to twenty days before the earthquake [69]. For the study of anomalous disturbance of other physical parameters of the Yangbi Ms 6.4 earthquake, many scholars have extracted and identified various earthquake precursors in the ionosphere, including the anomalies of electron density and electric fields in the ionosphere [70] and GIM TEC and GPS TEC anomalies [71], and the anomaly time is also concentrated in about 15 days. At the same time, other studies have pointed out that the radon emanation decreases the AEF by 40%, influencing the maximum strength of the AEF by 10 kV/m, which is enough to trigger ionospheric disturbances. These changes are within the ranges observed or explain electromagnetic phenomena associated with large earthquakes [72]. Drawing on previous research, this paper identifies significant large-scale AEF anomalies within 15–30 days preceding the Yangbi earthquake. These findings are consistent in both time and space with prior studies. After comparing and evaluating other researchers’ analyses of geological activities and precursory anomalies in subsurface fluids before the Yangbi earthquake, it is evident that the AEF anomalies observed in this study are a product of pre-seismic geologic activity. However, further analysis is required in the future to fully understand the precise linkages that give rise to these AEF anomalies, in conjunction with various geophysical and chemical covariates. Nevertheless, this study provides reliable evidence for determining the sources and propagation paths of ionospheric anomalies detected by scholars prior to the earthquake. It also serves as an excellent example for validating the complete link between the DC electric field and the coupling model.
6. Conclusions
In this study, an analysis of AEF anomalies was conducted using time series and wavelet analysis methods for the April and May 2021 Yangbi earthquakes. Through continuous long-term observation of real-time AEF data, this study summarizes the effects of various meteorological elements on the AEF and characterizes the resulting anomalous disturbances. By combining the detected anomalous AEF anomalies with meteorological observations from local stations, this study aims to eliminate the influence of meteorological factors such as precipitation, high winds, and fog on the AEF anomalies. Consequently, it was found that non-meteorological AEF anomalies associated with pre-seismic geological activities were recorded in the AEF monitoring network in the Sichuan–Yunnan region of China approximately 15–30 days before the occurrence of the Yangbi earthquake. These anomalies appeared primarily within a 100 km radius from the epicenter of the main earthquake and exhibited characteristics such as multiple occurrences spanning several days, stations, and fault zones. Notably, the anomalies appeared more frequently with greater magnitudes around 15 days prior to the earthquake. A time series and wavelet analysis of these anomalies revealed common features. (1) The anomalies typically appeared about 15–30 days before the Yangbi earthquake; (2) the anomalies followed a consistent trend, with the electric field initially decreasing following sunny days before rising again, showcasing a decrease of approximately 1–3 kV/m; and (3) the duration of anomaly fluctuations concentrated within a range of 30–60 min. Furthermore, there was a discernible correlation between the appearance time of AEF anomalies, epicentral distance, and anomaly amplitude before the Yangbi earthquake. These identified features validate the similarity of the anomalies and can assist future researchers in accurately identifying and extracting AEF anomalies associated with pre-seismic geological activities. However, the source of these anomalies requires further explanation, taking into consideration multiple physical parameters.
Author Contributions
Conceptualization, X.Z. and L.N.; methodology, L.N.; software, L.N.; validation, X.Z. and L.N.; formal analysis, X.Z. and L.N.; investigation, L.N.; resources, X.Z.; data curation, X.Z. and L.N.; writing—original draft preparation, L.N.; writing—review and editing, X.Z.; visualization, L.N.; supervision, X.Z.; project administration, X.Z.; funding acquisition, X.Z. All authors have read and agreed to the published version of the manuscript.
Funding
This research was funded by the Special Fund of China Seismic Experimental Site (No. CEAIEF20230401), NSFC project (No. 41674156), ISSI-BJ (2019IT#33), and Dragon-5 project (No. 59308).
Institutional Review Board Statement
Not applicable.
Informed Consent Statement
Not applicable.
Data Availability Statement
The data presented in the study are available from the corresponding author by request.
Acknowledgments
The AEF data are provided by the AEF network data center in NSSC, CAS. The historical precipitation data of Dali Prefecture were obtained from the China National Meteorological Center and the Yunnan Dali Prefecture Weather Station. The Yangbi earthquake sequence data were obtained from the China Earthquake Network Center (https://news.ceic.ac.cn/, accessed on 10 October 2022). The hourly meteorological data were obtained from https://q-weather.info/ (accessed on 11 October 2022).
Conflicts of Interest
The authors declare no conflict of interest.
References
- Jordan, T.H.; Chen, Y.-T.; Gasparini, P.; Madariaga, R.; Main, I.; Marzocchi, W.; Papadopoulos, G.; Sobolev, G.; Yamaoka, K.; Zschau, J. Operational Earthquake Forecasting: State of Knowledge and Guidelines for Utilization. Ann. Geophys. 2011, 54, 315–391. [Google Scholar] [CrossRef]
- Field, E.H.; Arrowsmith, R.J.; Biasi, G.P.; Bird, P.; Dawson, T.E.; Felzer, K.R.; Jackson, D.D.; Johnson, K.M.; Jordan, T.H.; Madden, C.; et al. Uniform California Earthquake Rupture Forecast, Version 3 (UCERF3)—The Time-Independent Model. Bull. Seismol. Soc. Am. 2014, 104, 1122–1180. [Google Scholar] [CrossRef]
- Varotsos, P.A.; Sarlis, N.V.; Skordas, E.S. Self-organized criticality and earthquake predictability: A long-standing question in the light of natural time analysis. EPL 2020, 132, 29001. [Google Scholar] [CrossRef]
- Wu, L.; Qi, Y.; Mao, W.; Lu, J.; Ding, Y.; Peng, B.; Xie, B. Scrutinizing and rooting the multiple anomalies of Nepal earthquake sequencein 2015 with the deviation-time-space criterion and homologous lithosphere-coversphere-atmosphere-ionosphere coupling physics. Nat. Hazards Earth Syst. Sci. 2023, 23, 231–249. [Google Scholar] [CrossRef]
- Ding, J.; Shen, X.; Pan, W.; Zhang, J.; Yu, S.; Li, G.; Guan, H. Seismo-electromagnetism precursor research progress. Chin. J. Radio Sci. 2006, 21, 791–801. [Google Scholar]
- Pierce, E.T. Atmospheric electricity and earthquake prediction. Geophys. Res. Lett. 1976, 3, 185–188. [Google Scholar] [CrossRef]
- King, C.Y. Radon emanation on San-Andreas fault. Nature 1978, 271, 516–519. [Google Scholar] [CrossRef]
- Sarlis, N.V.; Varotsos, P.A.; Skordas, E.S.; Uyeda, S.; Zlotnicki, J.; Nagao, T.; Rybin, A.; Lazaridou-Varotsos, M.S.; Papadopoulou, K.A. Seismic electric signals in seismic prone areas. Earthq. Sci. 2018, 31, 44–51. [Google Scholar] [CrossRef]
- Leary, P.C. Ground deformation events preceding the Homestead Valley earthquakes. Bull. Seismol. Soc. Am. 1984, 74, 1799–1817. [Google Scholar] [CrossRef]
- Mogi, K.; Mochizuki, H.; Kurokawa, Y.J.T. Temperature changes in an artesian spring at Usami in the Izu Peninsula (Japan) and their relation to earthquakes. Tectonophysics 1989, 159, 95–108. [Google Scholar] [CrossRef]
- Biagi, P.F.; Ermini, A.; Cozzi, E.; Khatkevich, Y.M.; Gordeev, E.I.J.N.H. Hydrogeochemical Precursors in Kamchatka (Russia) Related to the Strongest Earthquakes in 1988–1997. Nat. Hazards 2000, 21, 263–276. [Google Scholar] [CrossRef]
- Fujiwara, H.; Kamogawa, M.; Ikeda, M.; Liu, J.Y.; Sakata, H.; Chen, Y.I.; Ofuruton, H.; Muramatsu, S.; Chuo, Y.J.; Ohtsuki, Y.H. Atmospheric anomalies observed during earthquake occurrences. Geophys. Res. Lett. 2004, 31, 159–180. [Google Scholar] [CrossRef]
- Varotsos, P.A.; Sarlis, N.V.; Skordas, E.S. Phenomena preceding major earthquakes interconnected through a physical model. Ann. Geophys. 2019, 37, 315–324. [Google Scholar] [CrossRef]
- Hayakawa, M.; Hobara, Y. Current status of seismo-electromagnetics for short-term earthquake prediction. Geomat. Nat. Hazards Risk 2010, 1, 115–155. [Google Scholar] [CrossRef]
- Uyeda, S.; Nagao, T.; Kamogawa, M. Short-term earthquake prediction: Current status of seismo-electromagnetics. Tectonophysics 2009, 470, 205–213. [Google Scholar] [CrossRef]
- Hayakawa, M.; Kasahara, Y.; Nakamura, T.; Muto, F.; Horie, T.; Maekawa, S.; Hobara, Y.; Rozhnoi, A.A.; Solovieva, M.; Molchanov, O.A. A statistical study on the correlation between lower ionospheric perturbations as seen by subionospheric VLF/LF propagation and earthquakes. J. Geophys. Res. Space Phys. 2010, 115, A09305. [Google Scholar] [CrossRef]
- Zhu, F.; Wu, Y.; Zhou, Y.; Lin, J. A statistical investigation of pre-earthquake ionospheric TEC anomalies. Geod. Geodyn. 2011, 2, 61–65. [Google Scholar] [CrossRef]
- Wu, J.; Zou, Z.; Chen, T.; Li, Y.; Lu, Y.; Ti, S.; Li, L. Diurnal variation of the fair-weather atmospheric electric field in Binchuan, China. J. Atmos. Sol.-Terr. Phys. 2023, 242, 105985. [Google Scholar] [CrossRef]
- Li, L.; Chen, T.; Su, J.; Li, W.; Ti, S.; Wu, H.; Luo, J.; Wang, S.; Li, R. Influence of Charged Clouds on the Distribution of Atmospheric Electric Field with Altitude. Chin. J. Space Sci. 2022, 42, 414–421. [Google Scholar]
- Jin, X.; Zhang, L.; Bu, J.; Qiu, G.; Ma, L.; Liu, C.; Li, Y. Discussion on anomaly of atmospheric electrostatic field in Wenchuan Ms8.0 earthquake. J. Electrost. 2020, 104, 103423. [Google Scholar] [CrossRef]
- Chang, Z.; Chang, H.; Zang, Y.; Dai, B. Recent active features of Weixi-Qiaohou fault and its relationship with the Honghe fault. J. Geomech. 2016, 22, 517–530. [Google Scholar]
- Sun, Q.; Zhang, W.; Guo, X.; Wang, L. Preliminary study of seismogenic structure and rupture process of the Yangbi Ms6.4 earthquake sequence from May 2021. Acta Geol. Sin. 2023, 97, 349–363. [Google Scholar] [CrossRef]
- Deng, Q.; Ran, Y.; Yang, X.; Min, W.; Chu, Q. Map of Active Tectonics in China (1:4,000,000); Seismological Press: Beijing, China, 2007. [Google Scholar]
- Deng, Q.D.; Zhang, P.Z.; Ran, Y.K.; Yang, X.P.; Min, W.; Chu, Q.Z. Basic characteristics of active tectonics of China. Sci. China Ser. D-Earth Sci. 2003, 46, 356–372. [Google Scholar] [CrossRef]
- Tapponnier, P.; Molnar, P. Active faulting and tectonics in China. J. Geophys. Res. 1977, 82, 2905. [Google Scholar] [CrossRef]
- Serrano, C.; Reis, A.H.; Rosa, R.; Lucio, P.S. Influences of cosmic radiation, artificial radioactivity and aerosol concentration upon the fair-weather atmospheric electric field in Lisbon (1955–1991). Atmos. Res. 2006, 81, 236–249. [Google Scholar] [CrossRef]
- Li, R.; Chen, T.; Luo, J.; Zhou, L.; He, Z.; Wang, C.; Sun, Y. Enhancement of High Energy Electron Fluxes and Variation of Atmospheric Electric Field in the Antarctic Region. Chin. J. Space Sci. 2016, 36, 40–48. [Google Scholar] [CrossRef]
- Frank-Kamenetsky, A.V.; Makarova, L.N.; Morozov, V.N.; Shirochkov, A.V.; Burns, G.B. On the connection between the atmospheric electric field measured at the surface and the ionospheric electric field in the Central Antarctica. J. Atmos. Sol.-Terr. Phys. 2010, 72, 419–424. [Google Scholar] [CrossRef]
- Chen, T.; Zhang, X.; Zhang, X.; Jin, X.; Wu, H.; Ti, S.; Li, R.; Li, L.; Wang, S. Imminent estimation of earthquake hazard by regional network monitoring the near surface vertical atmospheric electrostatic field. Chin. J. Geophys.-Chin. Ed. 2021, 64, 1145–1154. [Google Scholar]
- Harrison, R.G.; Nicoll, K.A. Fair weather criteria for atmospheric electricity measurements. J. Atmos. Sol.-Terr. Phys. 2018, 179, 239–250. [Google Scholar] [CrossRef]
- Smirnov, S. Association of the negative anomalies of the quasistatic electric field in atmosphere with Kamchatka seismicity. Nat. Hazards Earth Syst. Sci. 2008, 8, 745–749. [Google Scholar] [CrossRef]
- Marapulets, Y.; Rulenko, O. Joint Anomalies of High-Frequency Geoacoustic Emission and Atmospheric Electric Field by the Ground-Atmosphere Boundary in a Seismically Active Region (Kamchatka). Atmosphere 2019, 10, 267. [Google Scholar] [CrossRef]
- Rycroft, M.J.; Nicoll, K.A.; Aplin, K.L.; Harrison, R.G. Recent advances in global electric circuit coupling between the space environment and the troposphere. J. Atmos. Sol.-Terr. Phys. 2012, 90–91, 198–211. [Google Scholar] [CrossRef]
- Mach, D.M.; Blakeslee, R.J.; Bateman, M.G. Global electric circuit implications of combined aircraft storm electric current measurements and satellite-based diurnal lightning statistics. J. Geophys. Res.-Atmos. 2011, 116, D05201. [Google Scholar] [CrossRef]
- Blakeslee, R.J.; Mach, D.M.; Bateman, M.G.; Bailey, J.C. Seasonal variations in the lightning diurnal cycle global electric circuit. Atmos. Res. 2014, 135, 228–243. [Google Scholar] [CrossRef]
- Zhang, H.; Zhang, Y.; Yang, S.; Zhao, G.; Li, F.; Li, Q. Characteristics of Atmospheric Electric Field in Taiyuan and Its Relationship with Atmospheric Pollutants. Enuivon. Sci. Technol. 2013, 36, 66–69. [Google Scholar]
- Li, J.; Chen, X.; Cheng, Y.; Li, R.; Dong, F. A Preliminary Study on the Relationship between Atmospheric Electric Field and Atmospheric Pollutants in Beijing. Plateau Meteorol. 2021, 40, 209–218. [Google Scholar]
- Nicoll, K.A.; Readle, A.; Al Kamali, A.; Harrison, R.G. Surface atmospheric electric field variability at a desert site. J. Atmos. Sol.-Terr. Phys. 2022, 241, 105977. [Google Scholar] [CrossRef]
- Burns, G.B.; Frank-Kamenetsky, A.V.; Troshichev, O.A.; Bering, E.A.; Reddell, B.D. Interannual consistency of bi-monthly differences in diurnal variations of the ground-level, vertical electric field. J. Geophys. Res.-Atmos. 2005, 110, D10106. [Google Scholar] [CrossRef]
- Silva, H.G.; Oliveira, M.M.; Serrano, C.; Bezzeghoud, M.; Reis, A.H.; Rosa, R.N.; Biagi, P.F. Influence of seismic activity on the atmospheric electric field in Lisbon (Portugal) from 1955 to 1991. Ann. Geophys. 2012, 55, 193–197. [Google Scholar] [CrossRef]
- Bleier, T.; Dunson, C.; Maniscalco, M.; Bryant, N.; Bambery, R.; Freund, F. Investigation of ULF magnetic pulsations, air conductivity changes, and infra red signatures associated with the 30 October Alum Rock M5.4 earthquake. Nat. Hazards Earth Syst. Sci. 2009, 9, 585–603. [Google Scholar] [CrossRef]
- An, Z.; Du, X.; Tan, D.; Fan, Y.; Liu, J.; Cui, T. Study on the geo-electric field variation of Sichuan Lushan M(s)7. 0 and Wenchuan M(s)8. 0 earthquake. Chin. J. Geophys.-Chin. Ed. 2013, 56, 3868–3876. [Google Scholar] [CrossRef]
- Warden, S.; Bleier, T.; Kappler, K. Long term air ion monitoring in search of pre-earthquake signals. J. Atmos. Sol.-Terr. Phys. 2019, 186, 47–60. [Google Scholar] [CrossRef]
- Dobrovolsky, I.P.; Zubkov, S.I.; Miachkin, V.I.J.P.; Geophysics, A. Estimation of the size of earthquake preparation zones. Pure Appl. Geophys. 1979, 117, 1025–1044. [Google Scholar] [CrossRef]
- Ikeya, M.; Takaki, S. Electromagnetic fault for earthquake lightning. Jpn. J. Appl. Phys. Part 2-Lett. 1996, 35, L355–L357. [Google Scholar] [CrossRef]
- Yoshida, S.; Uyeshima, M.; Nakatani, M. Electric potential changes associated with slip failure of granite: Preseismic and coseismic signals. J. Geophys. Res.-Solid Earth 1997, 102, 14883–14897. [Google Scholar] [CrossRef]
- Okubo, K.; Takayama, M.; Takeuchi, N. Electrostatic field variation in the atmosphere induced by earth potential difference variation during seismic wave propagation. IEEE Trans. Electromagn. Compat. 2007, 49, 163–169. [Google Scholar] [CrossRef]
- Schultz, C.J.; Petersen, W.A.; Carey, L.D. Lightning and Severe Weather: A Comparison between Total and Cloud-to-Ground Lightning Trends. Weather Forecast. 2011, 26, 744–755. [Google Scholar] [CrossRef]
- Huang, Q. Rethinking earthquake-related DC-ULF electromagnetic phenomena: Towards a physics-based approach. Nat. Hazards Earth Syst. Sci. 2011, 11, 2941–2949. [Google Scholar] [CrossRef]
- Saroso, S.; Hattori, K.; Ishikawa, H.; Ida, Y.; Shirogane, R.; Hayakawa, M.; Yumoto, K.; Shiokawa, K.; Nishihashi, M. ULF geomagnetic anomalous changes possibly associated with 2004-2005 Sumatra earthquakes. Phys. Chem. Earth 2009, 34, 343–349. [Google Scholar] [CrossRef]
- St-Laurent, F.; Derr, J.S.; Freund, F.T. Earthquake lights and the stress-activation of positive hole charge carriers in rocks. Phys. Chem. Earth 2006, 31, 305–312. [Google Scholar] [CrossRef]
- Freund, F.T.; Takeuchi, A.; Lau, B.W.S. Electric currents streaming out of stressed igneous rocks—A step towards understanding pre-earthquake low frequency EM emissions. Phys. Chem. Earth 2006, 31, 389–396. [Google Scholar] [CrossRef]
- Rulenko, O.P.; Marapulets, Y.V.; Kuz’min, Y.D.; Solodchuk, A.A. Joint Perturbation in Geoacoustic Emission, Radon, Thoron, and Atmospheric Electric Field Based on Observations in Kamchatka. Izv.-Phys. Solid Earth 2019, 55, 766–776. [Google Scholar] [CrossRef]
- Shuleikin, V.N. Quantitative Study of Relationships of Hydrogen, Methane, Radon, and the Atmospheric Electric Field. Izv. Atmos. Ocean. Phys. 2018, 54, 794–804. [Google Scholar] [CrossRef]
- Xu, T.; Zhang, H.; Hu, Y.; Wu, J. Electric field penetration into the ionosphere in the presence of anomalous radon emanation. Adv. Space Res. 2015, 55, 2883–2888. [Google Scholar] [CrossRef]
- Surkov, V.V. Pre-seismic variations of atmospheric radon activity as a possible reason for abnormal atmospheric effects. Ann. Geophys. 2015, 58, A0554. [Google Scholar] [CrossRef]
- Ahmad, N.; Gurmani, S.F.; Qureshi, R.M.; Iqbal, T. Preliminary results of fair-weather atmospheric electric field in the proximity of Main Boundary Thrust, Northern Pakistan. Adv. Space Res. 2019, 63, 927–936. [Google Scholar] [CrossRef]
- Hayakawa, M. Electromagnetic phenomena associated with earthquakes: A frontier in terrestrial electromagnetic noise environment. Recent Res. Dev. Geophys. 2004, 6, 81–112. [Google Scholar]
- Pulinets, S.; Ouzounov, D. Lithosphere-Atmosphere-Ionosphere Coupling (LAIC) model—An unified concept for earthquake precursors validation. J. Asian Earth Sci. 2011, 41, 371–382. [Google Scholar] [CrossRef]
- Zhang, X.; Shen, X. The development in seismo-ionospheric coupling mechanism. Prog. Earthq. Sci. 2022, 52, 193–202, (In Chinese with English Abstract). [Google Scholar] [CrossRef]
- Korsunova, L.P.; Khegai, V.V.; Mikhailov, Y.M.; Smirnov, S.E. Regularities in the Manifestation of Earthquake Precursors in the Ionosphere and Near-Surface Atmospheric Electric Fields in Kamchatka. Geomagn. Aeron. 2013, 53, 227–233. [Google Scholar] [CrossRef]
- Zhang, X.; Chen, C.-H. Lithosphere-Atmosphere-Ionosphere Coupling Processes for Pre-, Co-, and Post-Earthquakes. Atmosphere 2023, 14, 4. [Google Scholar] [CrossRef]
- Li, J.; Zhang, X.; Yang, Z. Analysis of Chemical Composition Characteristics of Hot Spring Water in Dali Area Before and After the Yangbi M6.4 Earthquake. South China J. Seismol. 2022, 42, 36–47, (In Chinese with English Abstract). [Google Scholar]
- Inan, S.; Balderer, W.P.; Leuenberger-West, F.; Yakan, H.; Ozvan, A.; Freund, F.T. Springwater chemical anomalies prior to the Mw = 7.2 Van Earthquake (Turkey). Geochem. J. 2012, 46, E11–E16. [Google Scholar] [CrossRef]
- Liu, J.L.; Song, Z.J.; Cao, S.Y.; Zhai, Y.F.; Wang, A.J.; Gao, L.; Xiu, Q.Y.; Cao, D.H. The dynamic setting and processes of tectonic and magmatic evolution of the oblique collision zone between Indian and Eurasian plates: Exemplified by the tectonic evolution of the Three River region, eastern Tibet. Acta Petrol. Sin. 2006, 22, 775–786. [Google Scholar]
- Ma, Y.; Yan, R.; Hu, X. The anomaly characteristics of water temperature in the Eryuan well before the 2021 Yangbi MS6.4 earthquake in Yunnan, China. Acta Seismol. Sin. 2021, 43, 674–677, (In Chinese with English Abstract). [Google Scholar] [CrossRef]
- Fu, H.; Liu, Z.; Hu, X. Tracking analysis of seismic anomalies of the 2021 Yangbi, Yunnan Ms6.4 earthquake. J. Seismol. Res. 2021, 44, 301–308, (In Chinese with English Abstract). [Google Scholar]
- Xin, J.; Zhang, C. Geoelectric field changes before the Yangbi Ms6.4 and Maduo Ms7.4 earthquakes. China Earthq. Eng. J. 2021, 43, 818–825. [Google Scholar] [CrossRef]
- Hou, Z.; An, Z.; Fan, Y.; Fu, A.; Tan, D.; Wei, L. Retrospective analysis of geoelectric field anomalies before the Yangbi Ms6.4 earthquake in Yunnan Province. China Earthq. Eng. J. 2021, 43, 807–817. [Google Scholar] [CrossRef]
- Du, X.; Zhang, X. Ionospheric Disturbances Possibly Associated with Yangbi Ms6.4 and Maduo Ms7.4 Earthquakes in China from China Seismo Electromagnetic Satellite. Atmosphere 2022, 13, 438. [Google Scholar] [CrossRef]
- Dong, L.; Zhang, X.; Du, X. Analysis of Ionospheric Perturbations Possibly Related to Yangbi Ms6.4 and Maduo Ms7.4 Earthquakes on 21 May 2021 in China Using GPS TEC and GIM TEC Data. Atmosphere 2022, 13, 1725. [Google Scholar] [CrossRef]
- Omori, Y.; Yasuoka, Y.; Nagahama, H.; Kawada, Y.; Ishikawa, T.; Tokonami, S.; Shinogi, M. Anomalous radon emanation linked to preseismic electromagnetic phenomena. Nat. Hazards Earth Syst. Sci. 2007, 7, 629–635. [Google Scholar] [CrossRef]
Figure 1.
M-t diagram for the events (Ms ≥ 3.0) in the Yangbi Ms 6.4 earthquake sequence. The black vertical lines indicate the earthquakes that occurred in this sequence, and the blue graph in the figure shows a zoomed-in view of the sequence from 18 to 22 May.
Figure 1.
M-t diagram for the events (Ms ≥ 3.0) in the Yangbi Ms 6.4 earthquake sequence. The black vertical lines indicate the earthquakes that occurred in this sequence, and the blue graph in the figure shows a zoomed-in view of the sequence from 18 to 22 May.

Figure 2.
Geological structure map of the Sichuan–Yunnan area in China (a), distribution of the AEF monitoring network in the Sichuan–Yunnan area (b), and distribution of stations with anomalies before the Yangbi Ms 6.4 earthquake (c). The red lines show the faults in the Sichuan–Yunnan area in China. The red stars in the each subfigure (a–c) are the mainshock epicener of the Yangbi Ms 6.4 earthquake. The blue triangles in the subfigure (b,c) are the electricfield stations. The yellow triangles in the subfigure (b,c) are the stations which appeared the AEF anomalies.


Figure 3.
Comparison of AEF and meteorological information images under clear−sky atmospheric conditions. The red curve is the smoothed result of the AEF. The red dotted lines are the clear−sky atmospheric criteria set for this study, i.e., visibility greater than 10 km, no precipitation, maximum surface wind speed less than 8 m/s, and maximum relative humidity less than 90%. The black curves in other panels are the local meteorological information.

Figure 4.
Morphological characteristics of AEF anomalies under different meteorological conditions: (a) visibility; (b) precipitation; (c) wind velocity; (d) relative humidity. AEF anomalies for different meteorological conditions are shown in the blue box. The red curves in the top panel of each subfigure (a–d) show the smoothed results of the AEF. The red dotted lines represent the clear−sky atmospheric criteria. The black curves in other panels are the local meteorological information.

Figure 5.
Comparison of the time series of AEF data with local meteorological information for Dali on 11 April (a), Midu on 17 April (b), and Heqing on 30 April (c). The AEF anomalies are shown in the blue box. The red curve in the top panel of each subfigure (a–c) shows the smoothed result of the AEF. The black curves in other panels are the local meteorological information. The red dotted lines represent the clear−sky atmospheric criteria.

Figure 6.
Comparison of the time series of AEF values and local meteorological information for Midu on 2 May (a) and Nanjian on 2 May (b). The AEF anomalies are shown in the blue box. The red curves in the top panel of each subfigure (a,b) show the smoothed results of the AEF. The black curves in other panels are the local meteorological information. The red dotted lines are the clear−sky atmospheric criteria.

Figure 7.
Comparison of the time series of AEF values and local meteorological information for Dali on 5 May (a), Midu on 5 May (b), and Yangbi on 5 May (c). The AEF anomalies are shown in the blue box. The red curves in the top panel of each subfigure (a–c) show the smoothed results of the AEF. The black curves in other panels are the local meteorological information. The red dotted lines are the clear−sky atmospheric criteria.

Figure 8.
Comparison of the time series of AEF values and local meteorological information for Yangbi on 7 May (a) and Jianchuan on 7 May (b). The AEF anomalies are shown in the blue box. The red curves in the top panel of each subfigure (a,b) show the smoothed results of the AEF. The black curves in other panels are the local meteorological information. The red dotted lines are the clear−sky atmospheric criteria.

Figure 9.
Extracted wavelet analysis results of non-meteorological pre-seismic AEF anomalies in the frequency (left panel) and period domains (right panel): (a) Dali on 11 April, (b) Midu on 17 April, (c) Midu on 2 May, (d) Nanjian on 2 May, (e) Dali on 5 May, (f) Midu on 5 May, (g) Yangbi on 5 May.


Figure 10.
Correlation analysis of the appearance time, epicenter distance, and anomaly amplitude (absolute value) of the AEF anomalies before the Yangbi earthquake. (a) the relationship between the appearance time of AEF anomalies and their magnitude decline (absolute value), (b) the relationship between the occurrence time of the AEF anomalies and the distance from the epicenter of the anomalous sites, (c) the relationship between the anomaly decline magnitude of the AEF anomalies (absolute value) and the epicenter distance. Red dots are the appearance of anomalies.


Table 1.
Detailed information regarding each anomaly identified at every station.
| Station | Epicentral Distance (km) | Abnormal Time (BJT) | Abnormal Amplitude (kV/m) |
|---|---|---|---|
| Dali | 26.74 | 11 April 2021 10:31:11 | −0.918 |
| Dali | 26.74 | 11 April 2021 15:28:30 | −1.045 |
| Dali | 26.74 | 11 April 2021 16:53:45 | −2.48 |
| Midu | 56.61 | 17 April 2021 03:40:54 | −0.598 |
| Midu | 56.61 | 2 May 2021 14:56:35 | −2.003 |
| Nanjian | 88.06 | 2 May 2021 16:47:43 | −1.54 |
| Dali | 26.74 | 5 May 2021 11:46:45 | −3.862 |
| Dali | 26.74 | 5 May 2021 16:26:01 | −1.403 |
| Midu | 56.61 | 5 May 2021 14:11:06 | −5.148 |
| Yangbi | 6.53 | 5 May 2021 16:04:09 | −1.982 |
Disclaimer/Publisher’s Note: The statements, opinions and data contained in all publications are solely those of the individual author(s) and contributor(s) and not of MDPI and/or the editor(s). MDPI and/or the editor(s) disclaim responsibility for any injury to people or property resulting from any ideas, methods, instructions or products referred to in the content. |
© 2023 by the authors. Licensee MDPI, Basel, Switzerland. This article is an open access article distributed under the terms and conditions of the Creative Commons Attribution (CC BY) license (https://creativecommons.org/licenses/by/4.0/).
Share and Cite
MDPI and ACS Style
Nie, L.; Zhang, X. Identification and Analysis of Multi-Station Atmospheric Electric Field Anomalies before the Yangbi Ms 6.4 Earthquake on 21 May 2021. Atmosphere 2023, 14, 1579. https://doi.org/10.3390/atmos14101579
AMA Style
Nie L, Zhang X. Identification and Analysis of Multi-Station Atmospheric Electric Field Anomalies before the Yangbi Ms 6.4 Earthquake on 21 May 2021. Atmosphere. 2023; 14(10):1579. https://doi.org/10.3390/atmos14101579
Chicago/Turabian StyleNie, Lei, and Xuemin Zhang. 2023. "Identification and Analysis of Multi-Station Atmospheric Electric Field Anomalies before the Yangbi Ms 6.4 Earthquake on 21 May 2021" Atmosphere 14, no. 10: 1579. https://doi.org/10.3390/atmos14101579
Note that from the first issue of 2016, this journal uses article numbers instead of page numbers. See further details here.