Article

Assessing the Influence Factors of Agricultural Soils’ CH4/N2O Emissions Based on the Revised EDGAR Datasets over Hainan Island in China

1
Key Laboratory of Agro-Forestry Environmental Processes and Ecological Regulation of Hainan Province, Hainan University, Haikou 570228, China
2
College of Ecology and Environment, Hainan University, Haikou 570228, China
3
Power China Huadong Engineering Corporation Limited, Hangzhou 311122, China
*
Author to whom correspondence should be addressed.
Atmosphere 2023, 14(10), 1547; https://doi.org/10.3390/atmos14101547
Submission received: 27 August 2023 / Revised: 1 October 2023 / Accepted: 7 October 2023 / Published: 10 October 2023

Abstract

:
Global warming poses a significant environmental challenge, which is primarily driven by the increase in greenhouse gas concentrations. In this study, we aimed to investigate the factors influencing CH4/N2O emissions from agricultural soils over Hainan Island, China, from 2009 to 2018. To achieve this, we selected air temperature, precipitation, and solar radiation as climate factors and categorized farmland as paddy or non-paddy, using revised EDGAR greenhouse gas datasets involving the bias correction method, and geographical detector analysis, multiple linear regression models, and bias sensitivity analysis were used to quantify the sensitivity of climate and land use. The maximum air temperature emerged as the primary factor influencing CH4 emissions, while the mean air temperature predominantly affected N2O emissions. The ratio of paddy field area to city area emerged as the second most influential factor impacting CH4/N2O emissions. The mean CH4/N2O emission intensity from paddy fields was significantly higher (0.42 t·hm−2/0.0068 t·hm−2) compared to that of non-paddy fields (0.04 t·hm−2/0.002 t·hm−2). Changes in maximum air temperature under global warming and crop irrigation practices profoundly affect greenhouse gas emissions on Hainan Island. Specifically, the emission intensities of CH4 and N2O increased by 14.2% and 11.14% for each Kelvin warmer, respectively.

1. Introduction

The results of the sixth IPCC report indicate that, in high-emission scenarios, near-surface air temperature is projected to rise by +4.0 °C above pre-industrial levels [1]. This temperature increase is expected to exacerbate a range of climate-related issues, including extreme droughts and floods, heat waves, and rising sea levels that threaten the safety of coastal cities [2,3,4]. Global warming also profoundly affects the soil microbial activity and soil organic carbon [5]. Numerous studies have shown that the continuous increase in greenhouse gas emissions (GHGe) is the primary driver of global warming [6,7]. Carbon dioxide (CO2), methane (CH4), and nitrous oxide (N2O) are the three most significant greenhouse gases responsible for global warming. CH4 and N2O, also known as non-carbon-dioxide greenhouse gases (GHG-NCO2), have warming potentials 25 and 298 times greater than CO2 over a 100-year period, respectively [8]. In recent years, GHG-NCO2 have received significant attention in the fields of atmospheric science and ecology due to the challenges associated with accurately calculating emissions and the wide range of sources of these gases [9,10].
Agriculture is a significant contributor to greenhouse gas (GHG) emissions in the atmosphere [10]. Globally, agricultural activities account for 24% of total GHGe [11]. In China, the growth of GHGe from agricultural activities was higher than the global average from 1993 to 2007 [12]. The emission percentages of CH4 and N2O originating from agricultural activities in China were 40.2% and 59.5%, respectively [13]. Further analysis of a single species of GHGe found that 50% (10%) of agricultural CH4 (N2O) emissions resulted from paddy fields [14]. Paddy fields, including irrigated and rain-fed paddy, are important sources of GHGe caused by human activities. As a populous country, China experiences a constant and increasing demand for food, and paddy production accounts for approximately 43.7% of the country’s total grain production [15]. The main paddy fields are located in the south of China (southeastern coastal, Yangtze River basin) in a sub-tropical/tropical humid climate region and the northeast of China in a sub-humid and temperate climate region. Due to the different climatic conditions in China, paddy yields are higher in the tropical/sub-tropical humid region compared to the temperate region [16]. In addition, the use of irrigation methods in southern China results in higher GHGe compared to rain-fed practices in the same region, especially from paddy fields [7].
GHGe from agricultural soil are strongly correlated with temperature and precipitation [17,18]. Soil microorganisms play a critical role in driving biochemical processes that lead to GHGe and are sensitive to temperature changes [19,20]. Temperature changes can affect the microbial decomposition rate, carbon/nitrogen mineralization, bacterial activity, and other factors, resulting in corresponding changes in GHGe [21]. Global warming is expected to affect rice growing and GHGe from paddy fields [22]. Multi-site experiments in China have shown a parabolic relationship between CH4 emissions from major paddy fields and background air temperature [23]. However, the impact of climate change on regional-scale GHGe remains unclear, and the intensity of emissions (GHGintensity) from various crops in different regions may vary in warmer conditions [24]. Prolonged warming can hamper crop growth and increase GHGe if temperatures exceed a certain threshold, particularly in hot–humid climates [25]. Some ecosystem models estimate the relationship between GHGe and environmental factors. In the Dynamic Land Ecosystem Model (DLEM), the fluxes of CH4 and N2O are mainly affected by annual climate variations. Annual precipitation is an important factor in determining annual CH4 emissions, while annual mean temperature and precipitation are strongly correlated with annual N2O emissions [26]. GHGe from agricultural soil are also influenced by land use and management practices such as irrigation type, fertilization, and weeding. Irrigation is the second largest contributor to the total carbon footprint of crop production in China (22%) [12]. Different management practices may also influence GHGe from agricultural soil. For example, Wang et al. assessed GHGe from irrigation processes based on irrigation management practices [27], while Lamb et al. evaluated the potential to reduce GHGe through land use management [28]. Although numerous studies have investigated the effects of climatic and land use factors on GHGe, relatively few studies have investigated the combined effects of these factors.
There are two main ways to investigate GHGe. The top-down approach is based on monitoring atmospheric GHG concentrations and simulations of chemical processes [29,30,31], while the “bottom-up” approach involves point/field-scale ground observations [32]. The Emission Database for Global Atmospheric Research (EDGAR) bottom-up emissions inventories developed by the Joint Research Centre (JRC) is a well-known and widely used emissions inventory that provides monthly emission grid data with a resolution of 0.1° for each sector and country, making it ideal for atmospheric modeling and GHG emissions studies [33]. EDGAR can be used to assess the effects of high emissions and is also used as input for air quality modeling software [34]. However, previous studies have shown that the EDGAR data may not be accurate; thus, bias correction is required [35].
Although a series of studies on GHGe have been conducted, the specific factors influencing GHGintensity in paddy and non-paddy fields in tropical regions remain unclear. This study aims to address this gap by investigating GHGintensity in agricultural soils using EDGAR data on Hainan Island. The specific objectives of this study are as follows: (1) to investigate the extent to which climate and land use factors influence GHGe in agricultural soils; (2) to use a multiple linear regression (MLR) method to construct a model between paddy/non-paddy areas and GHGintensity; and (3) to identify the primary climate drivers affecting GHGintensity in paddy fields.

2. Materials and Methods
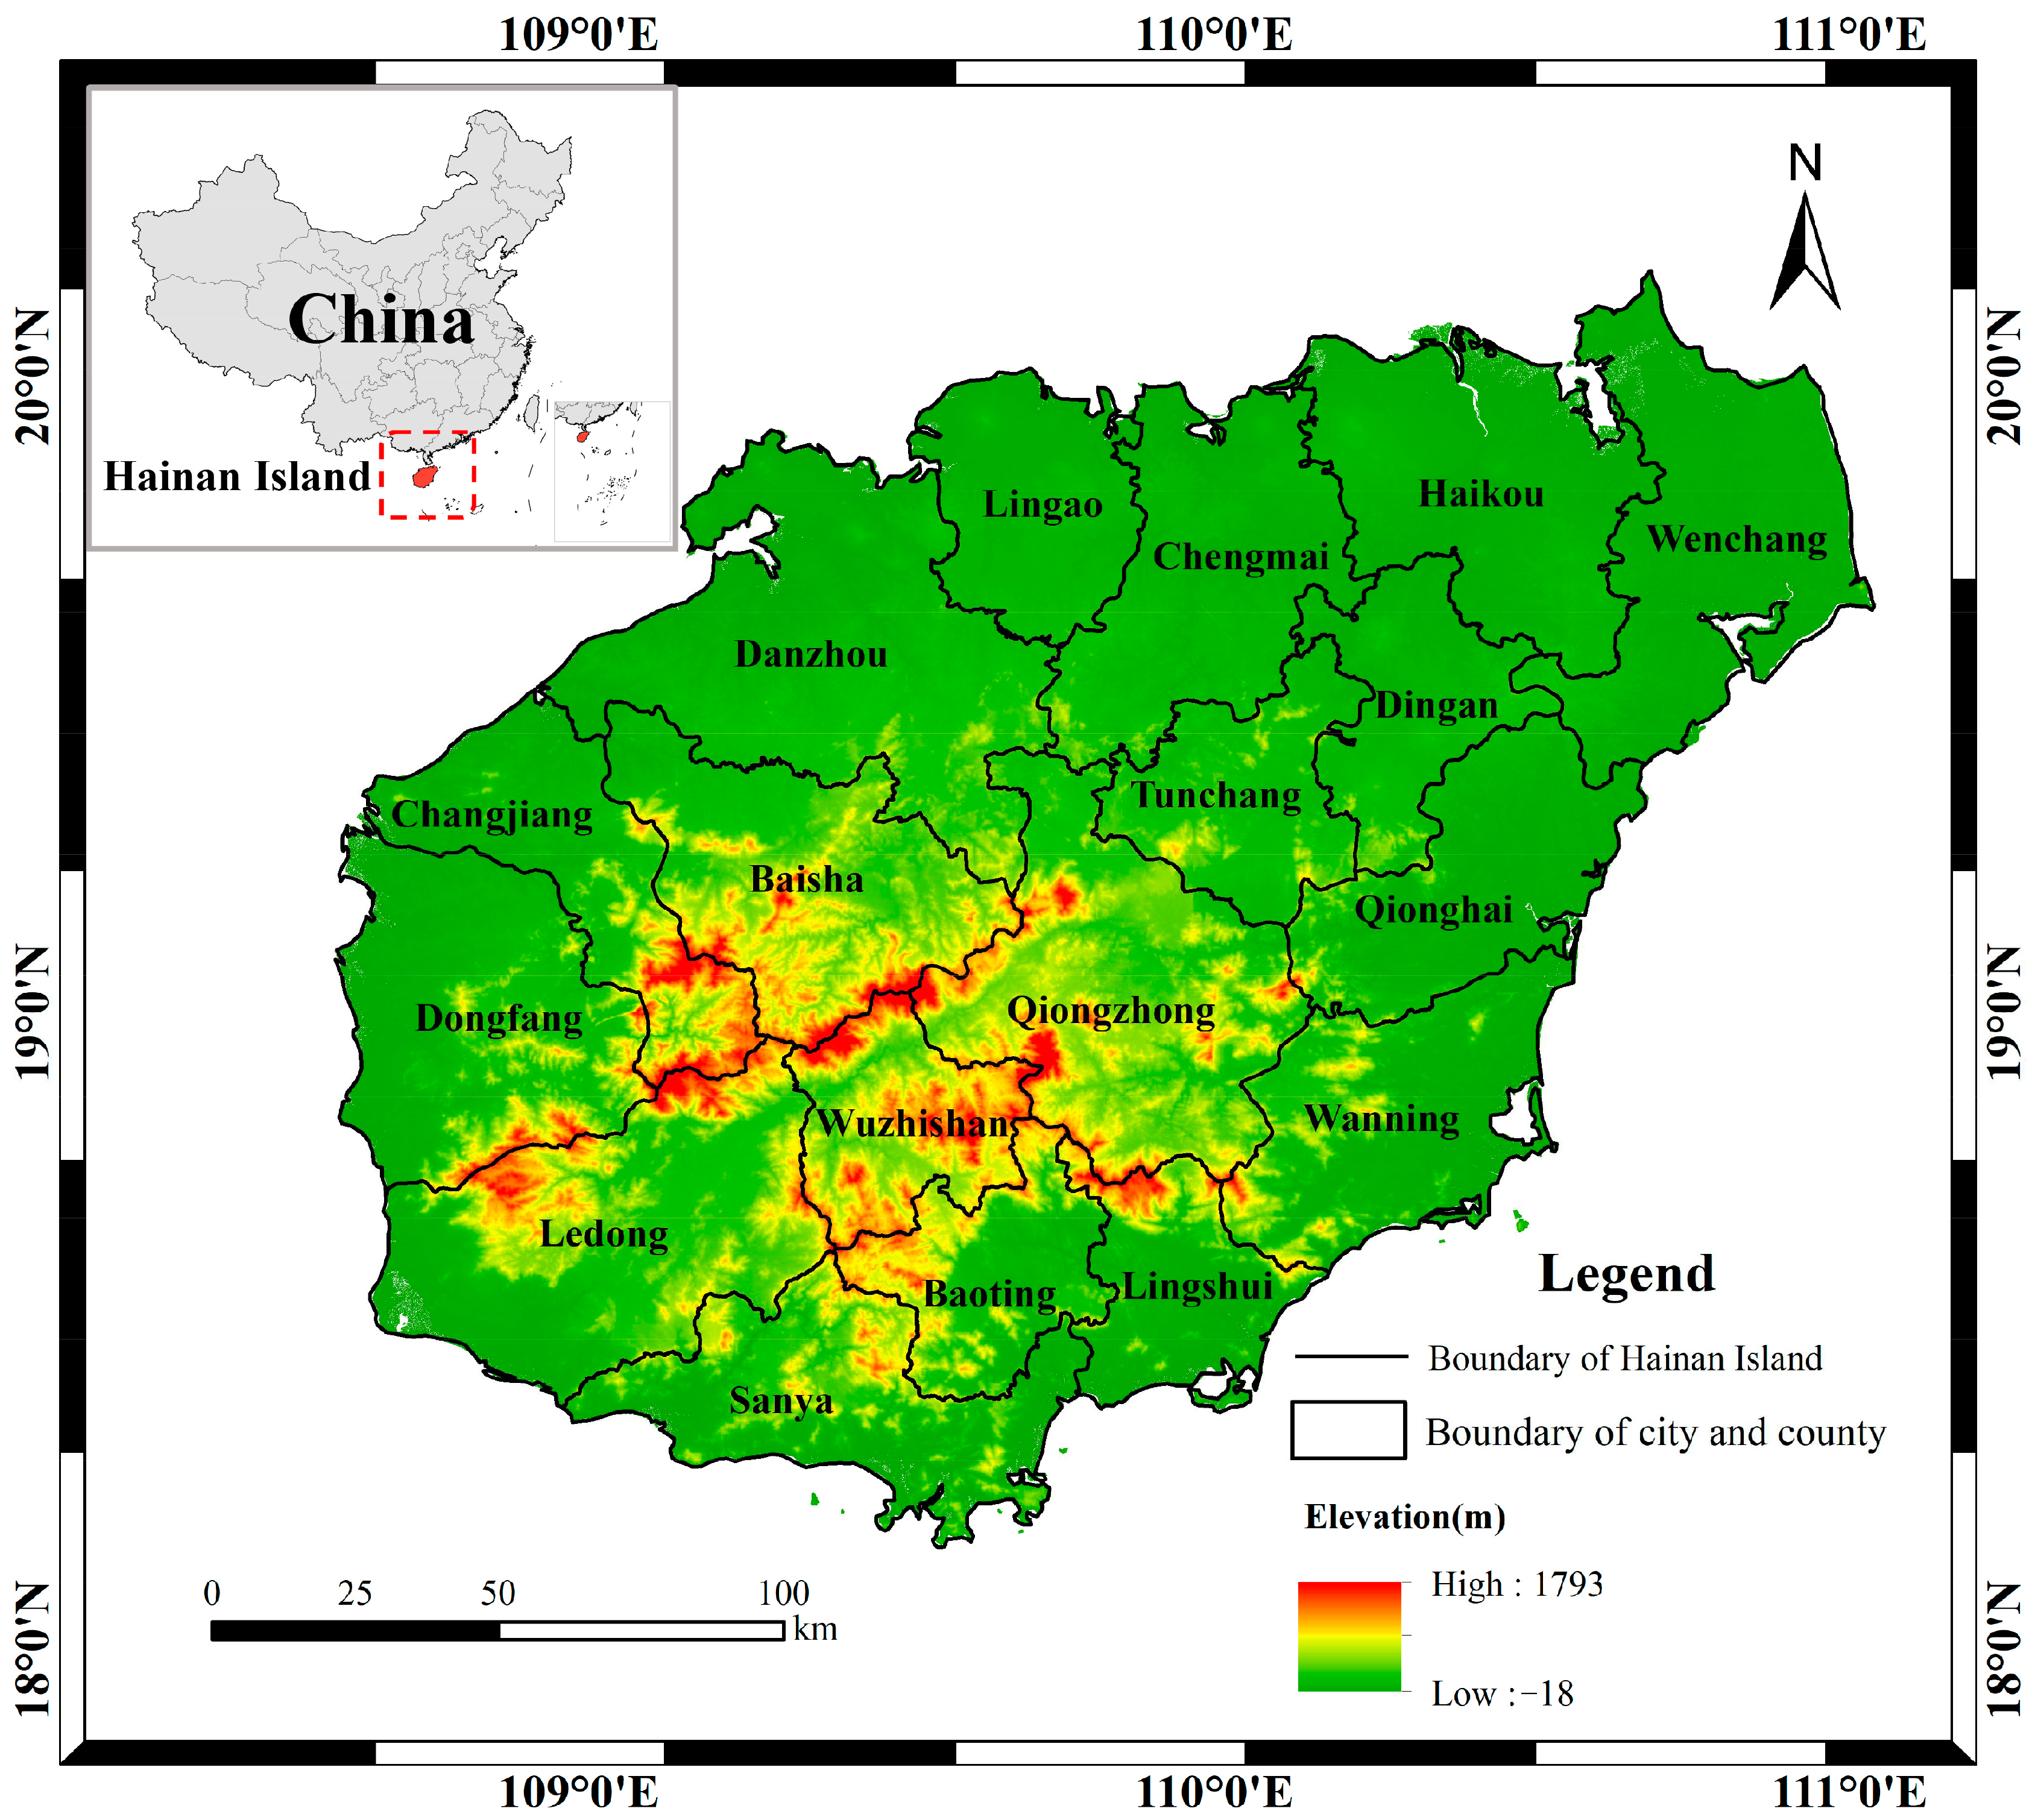
2.1. Study Domain

Located at the southernmost point of China, Hainan Island spans geographical coordinates from 18°10′ to 20°07′ N and 108°37′ to 111°03′ E. With an estimated area of 34,000 km2, it comprises 18 cities, as illustrated in Figure 1. This island presents a tropical monsoon maritime climate, with a median air temperature fluctuating between 23.8 °C and 26.2 °C and regional annual rainfall quantities fluctuating between 1000 mm and 2500 mm. The major soil type is latosol and rice soil (pH ≈ 5.0) [36]. A variety of agricultural practices are implemented throughout Hainan Island due to these diverse hydrothermal and geographical conditions, predominantly in paddy and non-paddy fields [37,38]. The primary crop cultivated here, rice, flourishes in paddy fields. In contrast, non-paddy fields are mostly used for the cultivation of soybeans, maize, and other crops, with most of the cultivable land being located along the coastlines.

2.2. Study Data

2.2.1. GHG Data

In this study, the monthly data on agricultural soil emissions were acquired from the Emissions Database for Global Atmospheric Research (EDGAR) version 6.0 [34], with a spatial resolution of 0.1° and a temporal resolution of monthly scales. EDGAR v6.0 provides emission products from 1970 to 2018. The EDGAR emission source inventory is divided into countries and spatial grids, including power, industrial, residential, agriculture, surface transport, and shipping sectors for greenhouse gases such as CO, NOx, SO2, etc. The data are recorded in grid points as emission intensity in kg·m−2·s−1. As several studies have pointed out, the EDGAR database exists with uncertainty compared with the various observed datasets. This study revised the raw EDGAR data based on a correction coefficient to ensure the credibility of the result analysis.

2.2.2. Climate Data

The climate data used in this study were collected from the China Meteorological Forcing Dataset (CMFD) [39]. CMFD is China’s first regional multi-meteorological forcing dataset developed for the study of land surface processes, with long time series and high spatial, including daily products of precipitation (Prec, mm), air temperature (°C), and downward shortwave radiation (Srad, w·m−2). The follow-up study utilized the highest, mean, and lowest values of daily data to calculate the annual maximum air temperature (Tmax), annual mean air temperature (Tmean), and annual minimum air temperature (Tmin). The mean of the daily data was used to represent the annual data for all other climate factors. The spatial resolution of the data is 0.1°. All climate data ranged from 2009 to 2018.

2.2.3. Land Use and Land Cover Change Data

The land use and land cover change (LUCC) data were derived from the Hainan Statistical Yearbook [40], which includes the city area (CA, ha), cultivated land area (CL, ha), and paddy field area (PF, ha). All the above data are annual data from 2009 to 2018 for 18 different cities in Hainan. The non-paddy field area (NF) was calculated using CL−PF. The ratio of cultivated land area to city area (RC) was calculated using CL/CA. The ratio of paddy field area to cultivated land area (RP) was calculated using PF/CL.

2.3. Methodology

2.3.1. Coefficient Bias Correction Method

In this study, we used a coefficient bias correction method to revise the raw EDGAR data [41]. Generally, when the GHGe of EDGAR (EDGARChina) are consistent with the GHGe of existing research (GHG-NCO2results), the data used in this study do not need to be corrected. However, if the EDGARChina is significantly higher or lower than GHG-NCO2results, it is necessary to correct the GHG data of EDGAR to improve the accuracy and credibility of the results.
β j = G H G N C O 2 r e s u l t s , j EDGAR C h i n a , j
where GHG-NCO2results is the GHGe of existing research in a given year j. It should be noted that there are significant differences in the coefficients β for different years. EDGARChina is the annual GHGe in China extracted from the raw EDGAR global data.
Therefore, this study used averaged annual value β to systematically correct the EDGAR data from 2009 to 2018. If there was more than one coefficient value of β for the same year, the mean value for that year was calculated first, and then the annual average β was calculated to ensure consistent correction weights for each typical year involved in the calculation. The revised EDGAR can be bias-corrected as follows:
E D G A R R e v i s e d = β ¯ · E D G A R H N
where EDGARRevised is the GHG-NCO2 emissions of Hainan Island following bias correction from 2009 to 2018, and EDGARHN is Hainan Island data extracted from EDGAR raw data used in follow-up research.

2.3.2. Geographical Detector

Spatial differentiation is an essential feature of geographical phenomena. Geographic detectors are statistical tools that are used to detect spatial differentiation and reveal its drivers. This study uses two common sub-modules: factor detector and interaction detector [42].
The factor detector measures the degree of influence of geographical factor X on the dependent variable Y using the q-value. X represents 9 factors (CL, PF, RC, RP, Tmax, Tmin, Tmean, Prec, and Srad); Y represents the GHGintensity.
q = 1 h = 1 L N h σ h 2 N σ 2
where q is the explanatory power of each influencing factor X on the variable Y, taking values in the range of [0, 1], and its more considerable value indicates the more decisive influence of X on the spatial variation of Y; h = 1, …, L, where L represents the stratification of X and Y; Nh and N refer to the number of layers h and the units of the whole region, respectively; and σ2h and σ2 are the variances of Y in layer h and the whole region, respectively.
The interaction detectors can be used to identify interactions between different geographic factors X; that is, whether the combined effect of geographic factor 1 (such as Prec) and geographic factor 2 (such as Srad) enhances or weakens their explanatory power on variable Y or the effects of these influences on variable Y will be independent of each other. The first step of the evaluation method is to calculate the q-values of geographic factors, respectively: q (X1) and q (X2), then calculate the q-values of factor interactions: q (X1 ∩ X2) and finally compare q (X1), q (X2) and q (X1 ∩ X2). The five interactions of the two factors are shown in Table 1.

2.3.3. Multiple Linear Regression

Multiple linear regression models (MLR) are statistical models that are used to explain the dependent variable with multiple independent variables. They can be applied to predict GHGe by analyzing the relationship between environmental and soil properties. This study considers GHGe as the dependent variable (Y) and the areas of paddy and non-paddy fields as the independent variables (X1 and X2, respectively). The formula for the MLR model is presented below:
Y i = α 1 X 1 + α 2 X 2 + ε   ( i = 1 , 2 , · · · , n )
where i is the year; Yi is the GHGe in each year; X1 and X2 are the areas of paddy and non-paddy fields in each year; α1 and α2 are the regression coefficients, which mean the GHGintensity factors for paddy and non-paddy fields, respectively; and ε (i = 1, 2, ···, n) is the residual; since the GHG has no emissions in the no-till scenario, this study forces an intercept of 0 in the model construction.

2.3.4. Pearson Correlation Analysis

Pearson correlation analysis is an empirical formula that is used to obtain a correlation coefficient that reflects the linear relationship between two or more variables. The differences were considered to be statistically significant when p < 0.05 or 0.01. This study was used to calculate the correlation between climate factors and GHGintensity. The formula is calculated as follows:
R xy = i = 1 n ( x i x ¯ ) ( y i y ¯ ) n = 1 n ( x i x ¯ ) 2 n = 1 n ( y i y ¯ ) 2
where Rxy is the correlation coefficient between two variables x and y; x is the climate factors; y is the GHGintensity.

2.3.5. Bias Sensitivity Analysis

This study used a climate sensitivity factor to measure the effect of temperature change on GHGintensity from agricultural soils. The climate sensitivity factor was defined as the emission rate ratio to the temperature change rate. The formula is calculated as follows:
S x = lim x / x i ( E / E x / x ) = E x · x E
where Sx is the dimensionless sensitivity factor of GHGintensity with regard to the temperature factor x, and E is the potential GHGintensity rate. The advantage of this equation is that the climate factor is dimensionless through the rate of change, which can facilitate comparison between different studies [43]. The larger the absolute value of the sensitivity factor, the greater the effect of the climate variable on GHGintensity.

3. Results

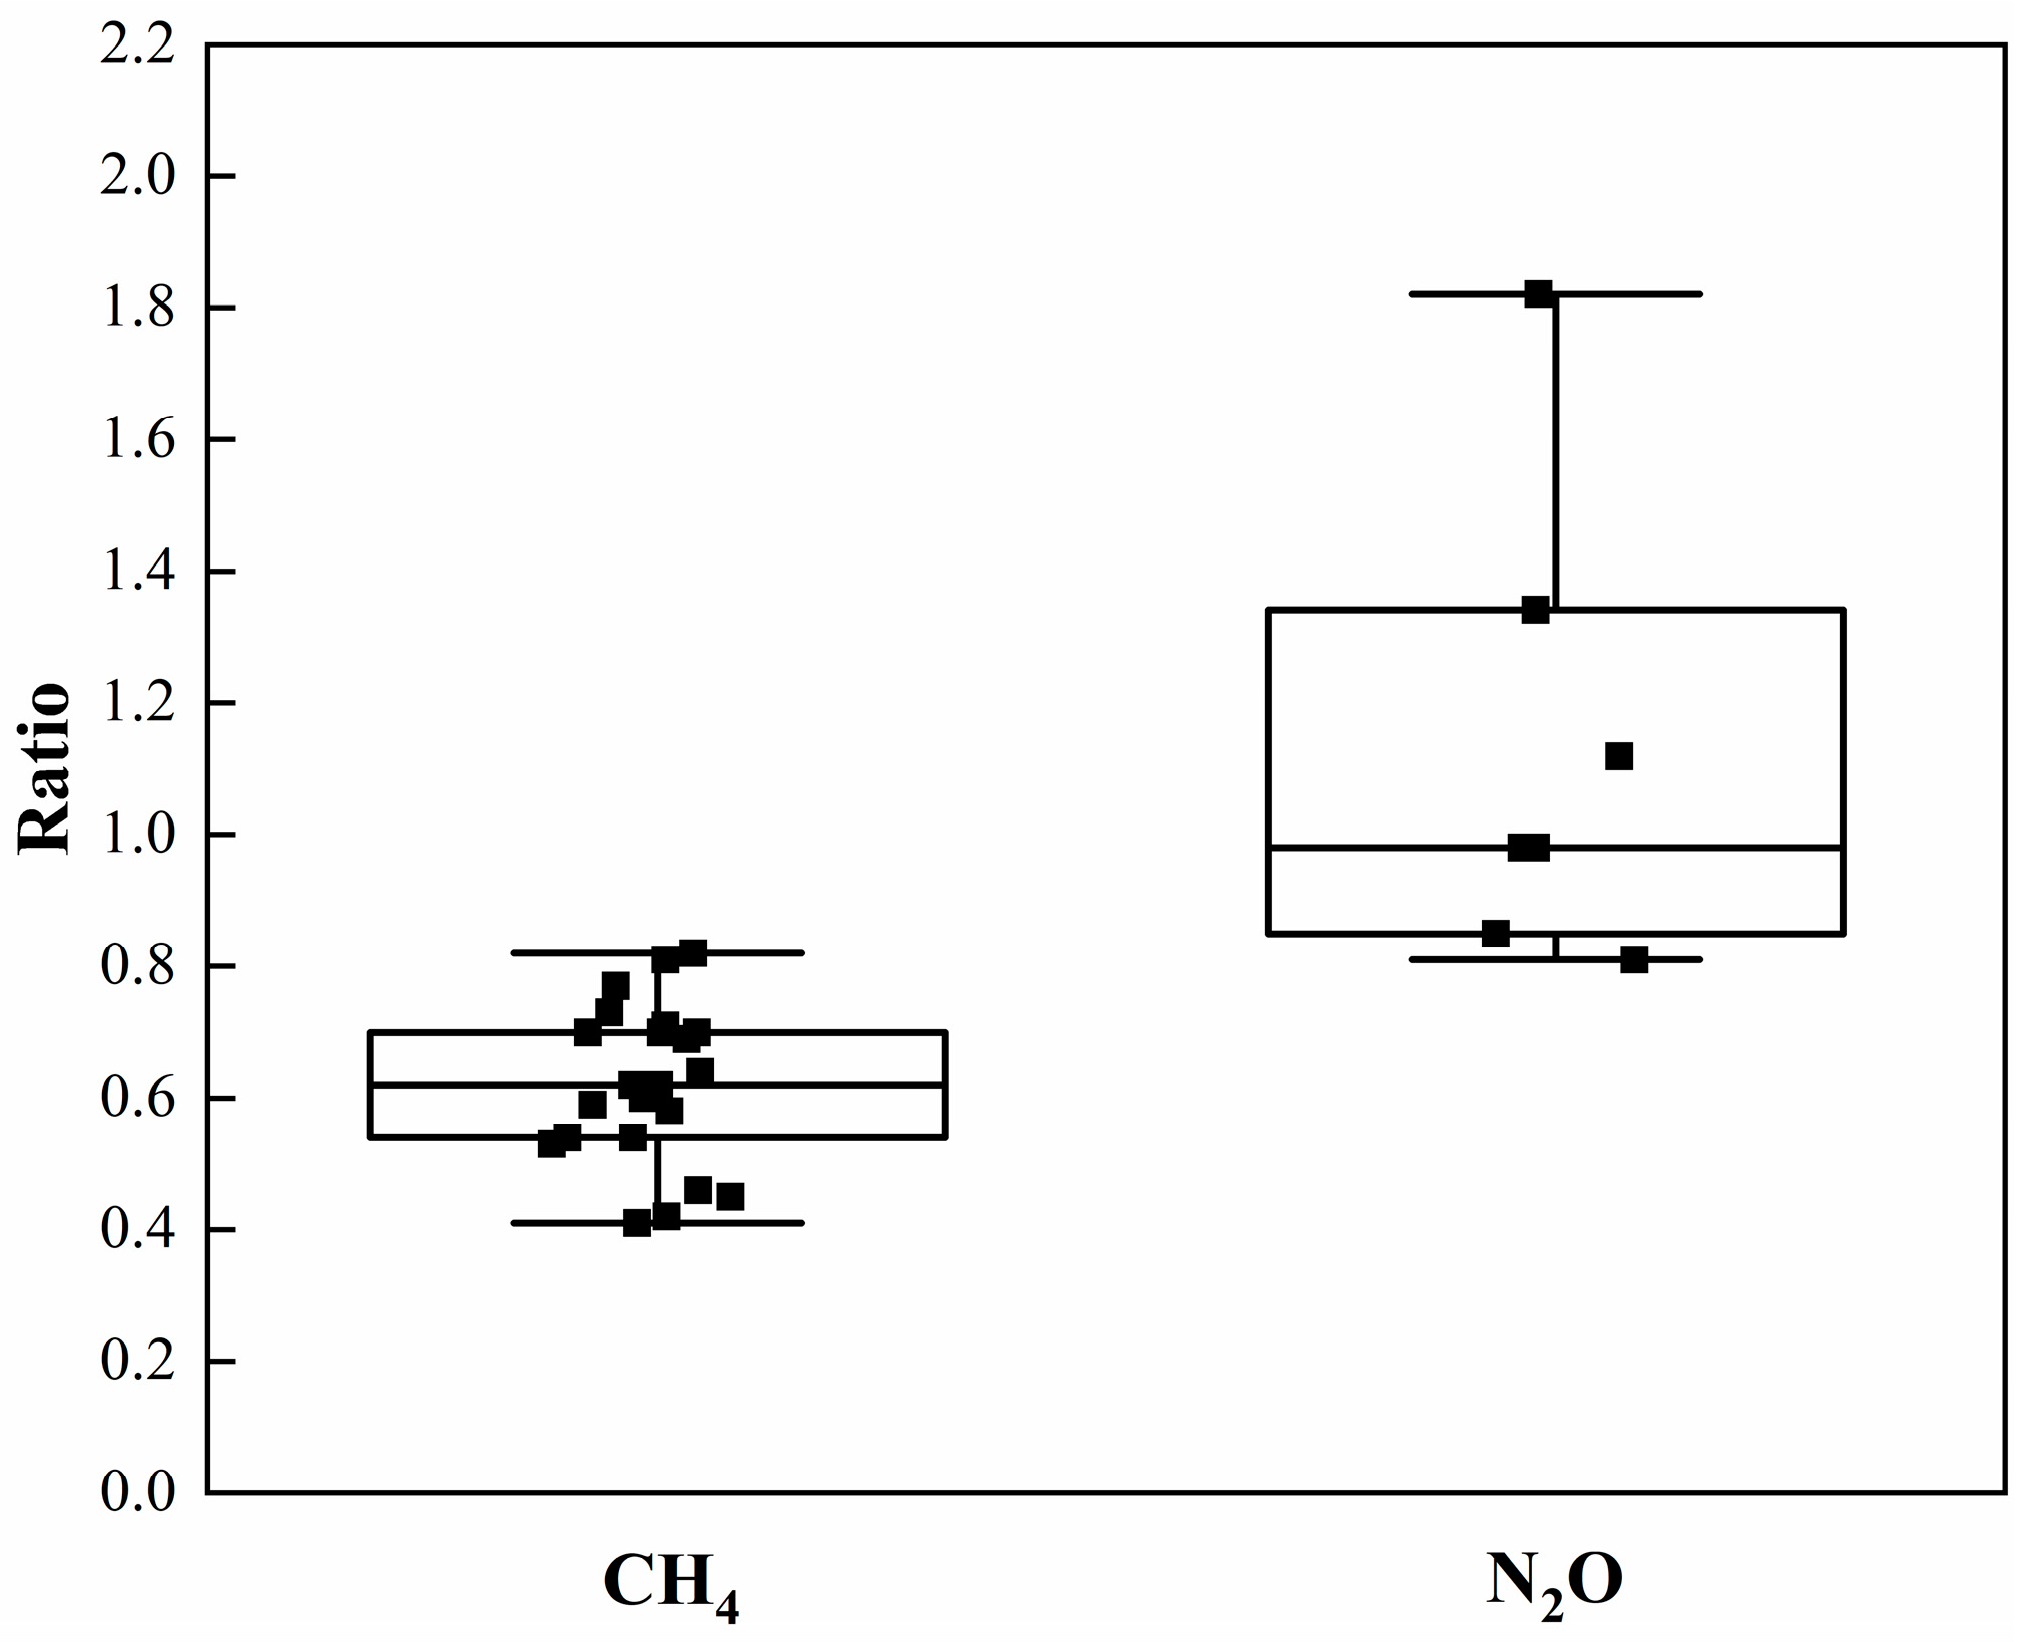
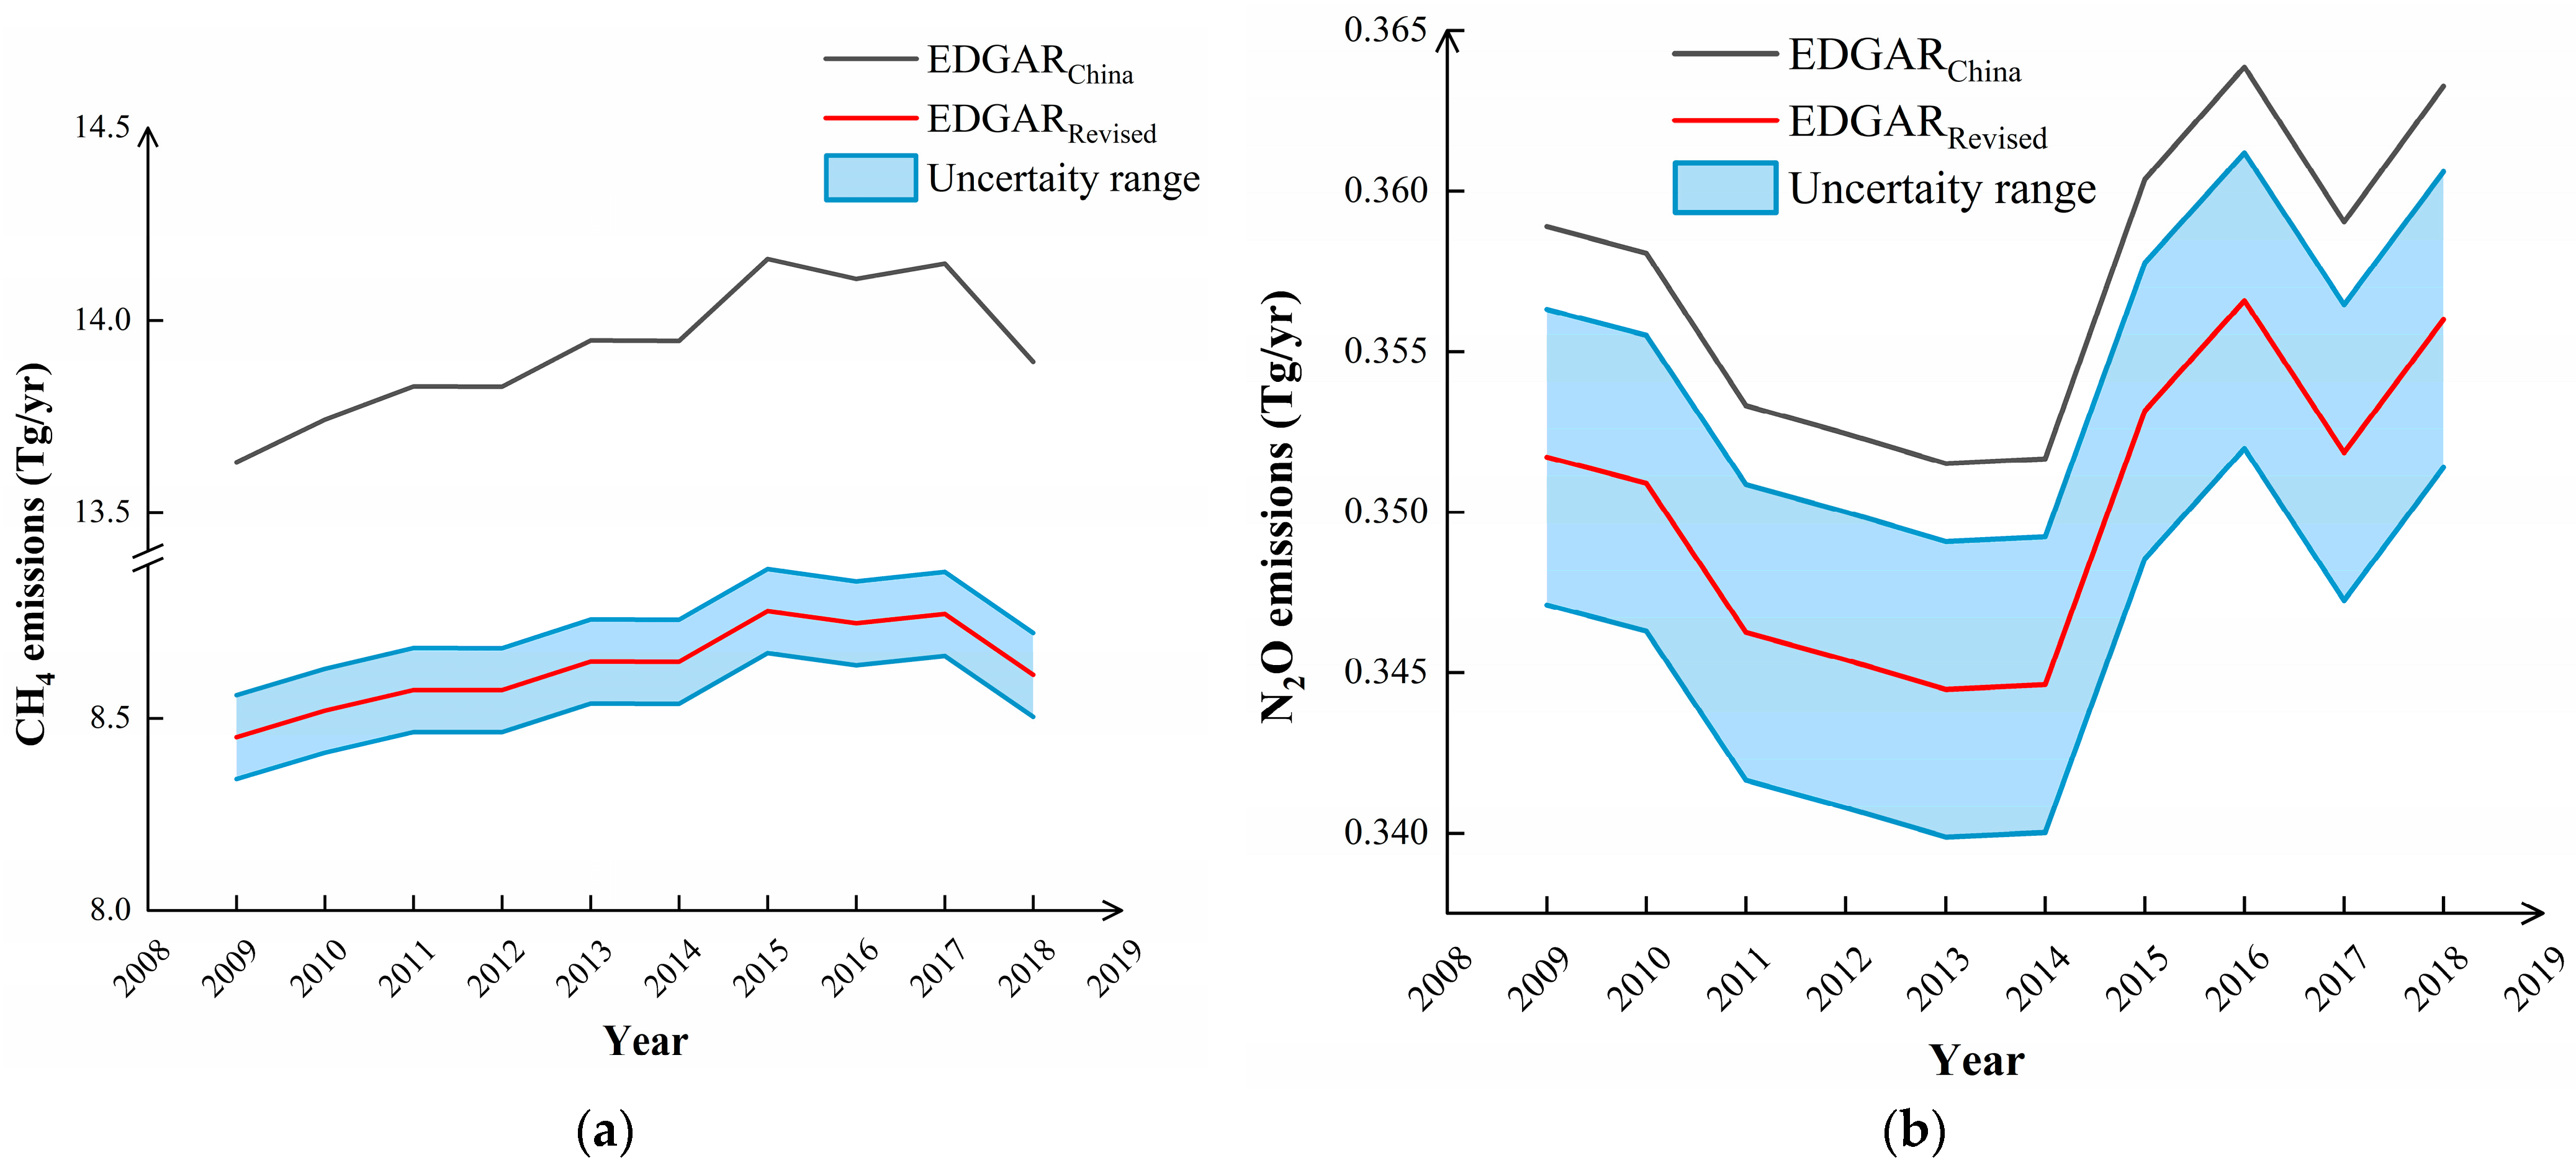
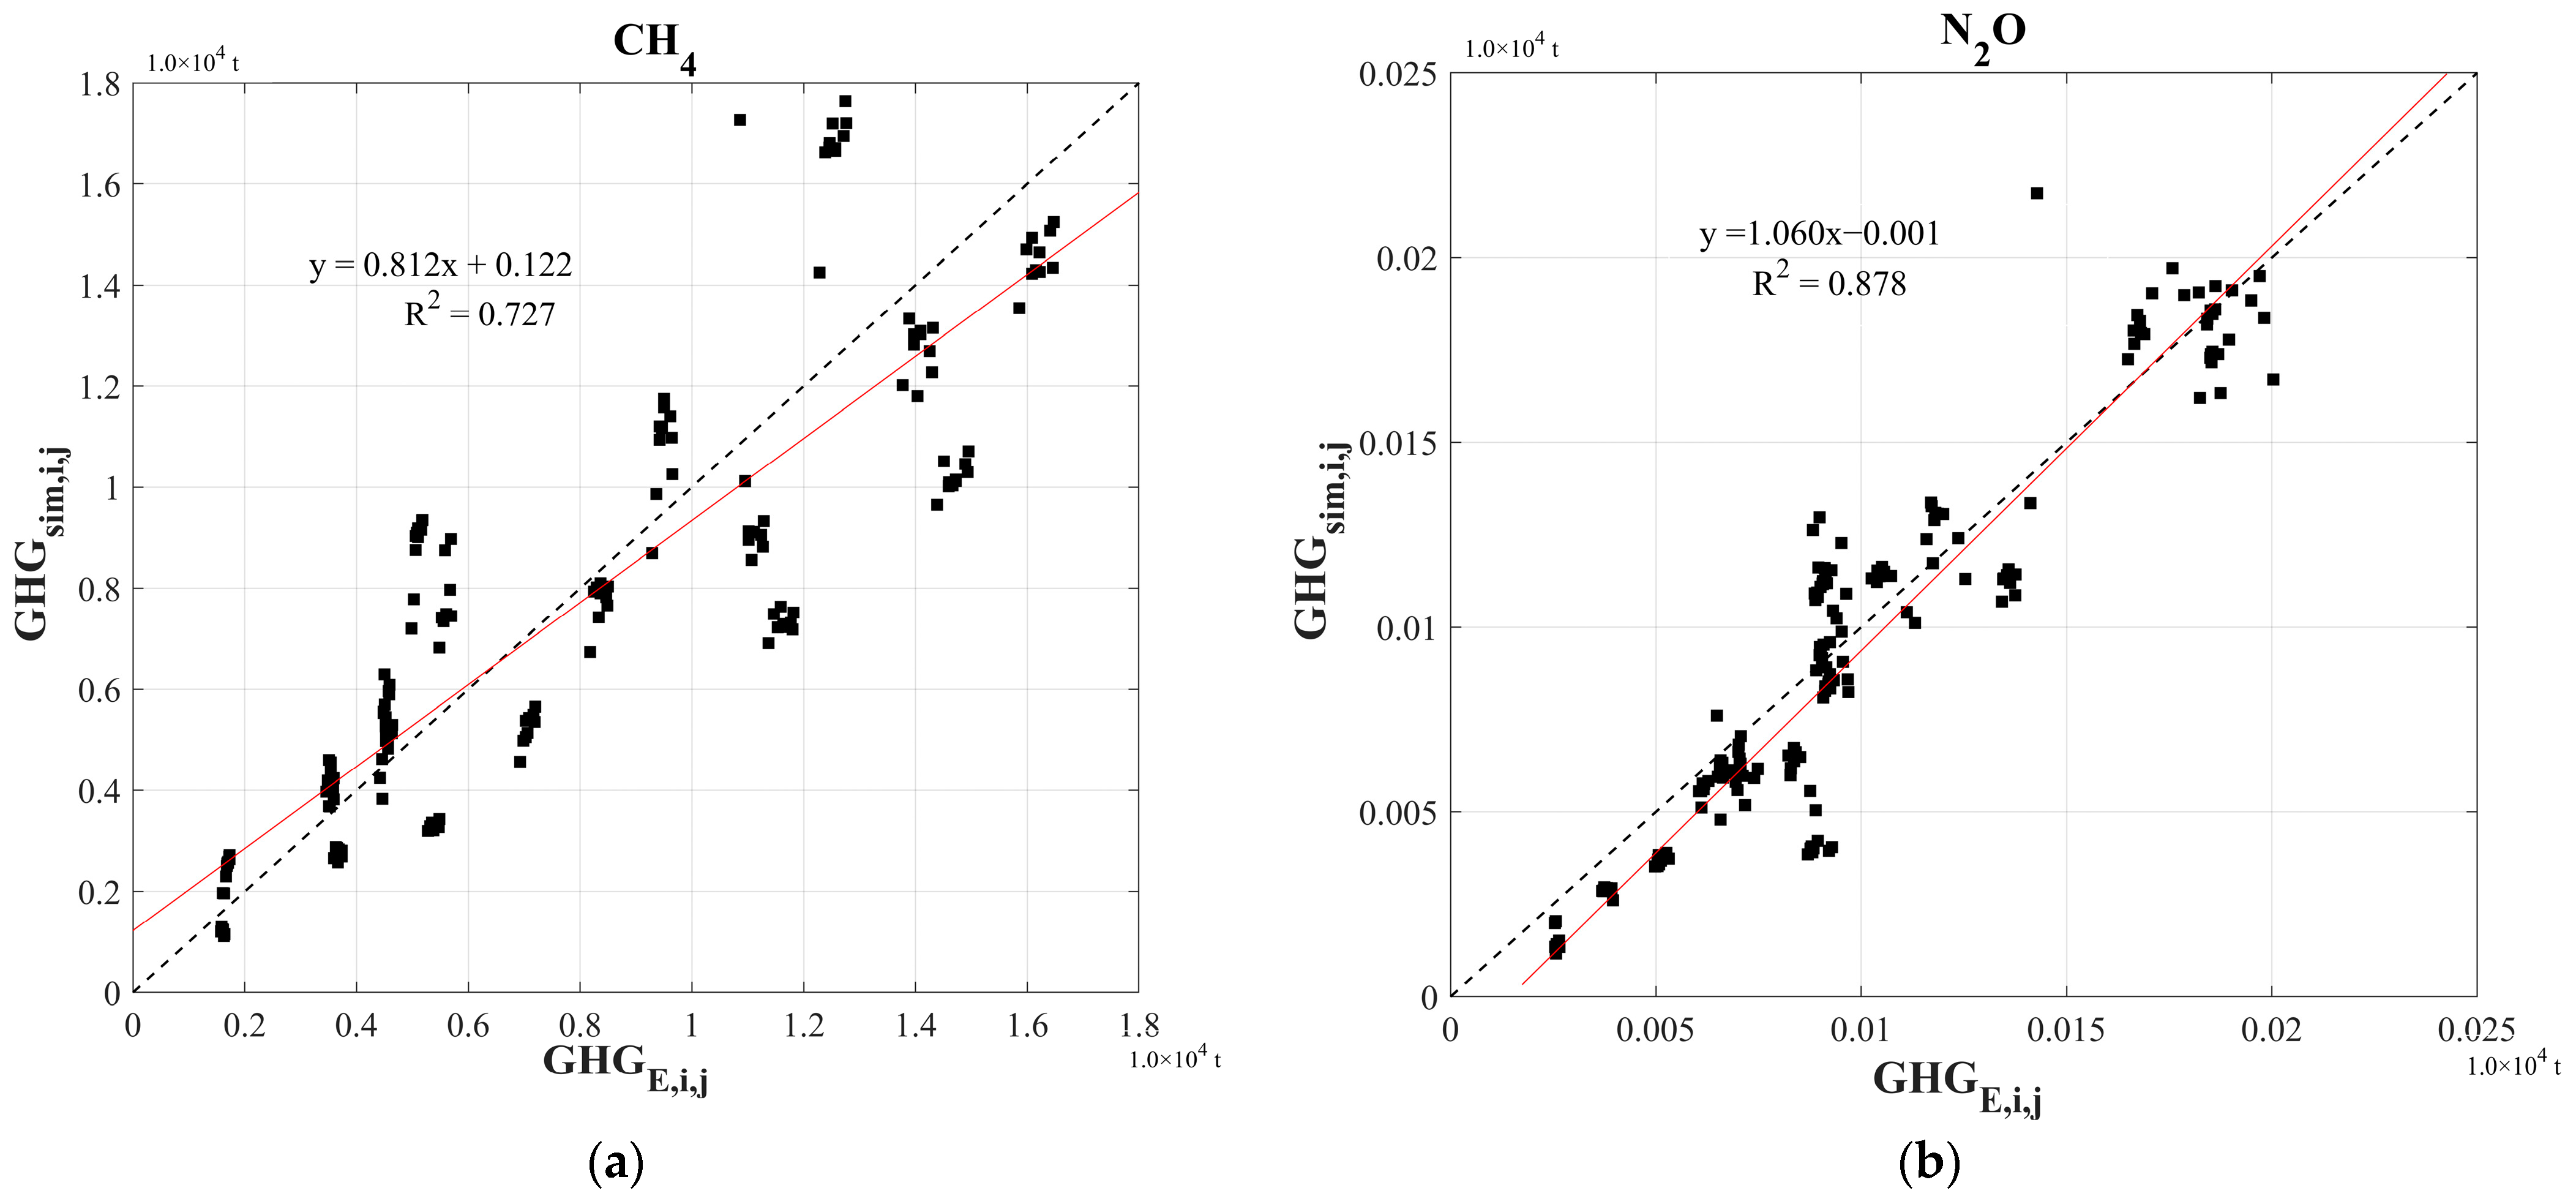
3.1. Bias Correction and Uncertainty of Agricultural Soil from EDGAR Data

We included the results of previous studies for agricultural soil GHGe from different years to the greatest extent possible, and then calculated the corresponding annual GHGe of EDGAR for the same year. In this study, we summarized results including two different periods with fourteen typical years of CH4 ranging from 1980 to 2018 (Table 2) and five typical years of N2O (Table 3) ranging from 1990 to 2007. In this study, we used a coefficient bias correction method to correct the raw EDGAR data, and the bias correction coefficient of β can be calculated by Equation (1), and the revised EDGAR can be bias-corrected as in Equation (2).
The averaged bias correction coefficients of β illustrate the differences between two greenhouse gases. The coefficient of CH4 (0.62) is much less than one, indicating that the agricultural soil CH4 emissions from EDGAR are seriously overestimated. Although the bias correction coefficient of N2O (0.98) is close to one, the fluctuation range of the coefficient is larger than that of CH4, and the uncertainty of the data on agricultural soil N2O emissions is higher (in Figure 2).
A comparison of total GHGe pre and post correction suggests that EDGAR tends to overestimate the CH4 emission intensity from agricultural soils, as depicted in Figure 3a. Taking 2018 as an example, the emissions dropped from 14.05 million tons per year before correction to 8.71 million tons per year post correction. CH4 emissions steadily increased from 2009 through 2015 before tapering off slightly in 2016. Despite a brief resurgence from 2016 to 2017, there was a decline from 2017 to 2018. As the bias correction coefficient for N2O emissions is 0.98 (indicating β is very close to 1), the total N2O emissions before correction closely mirrored the EDGARRevised data from 1990 to 2018. Notable trends include a significant decrease from 2009 to 2014 and an increase from 2014 to 2016, with a clear inflection point and the lowest value over the past decade recorded in 2017, as shown in Figure 3b.

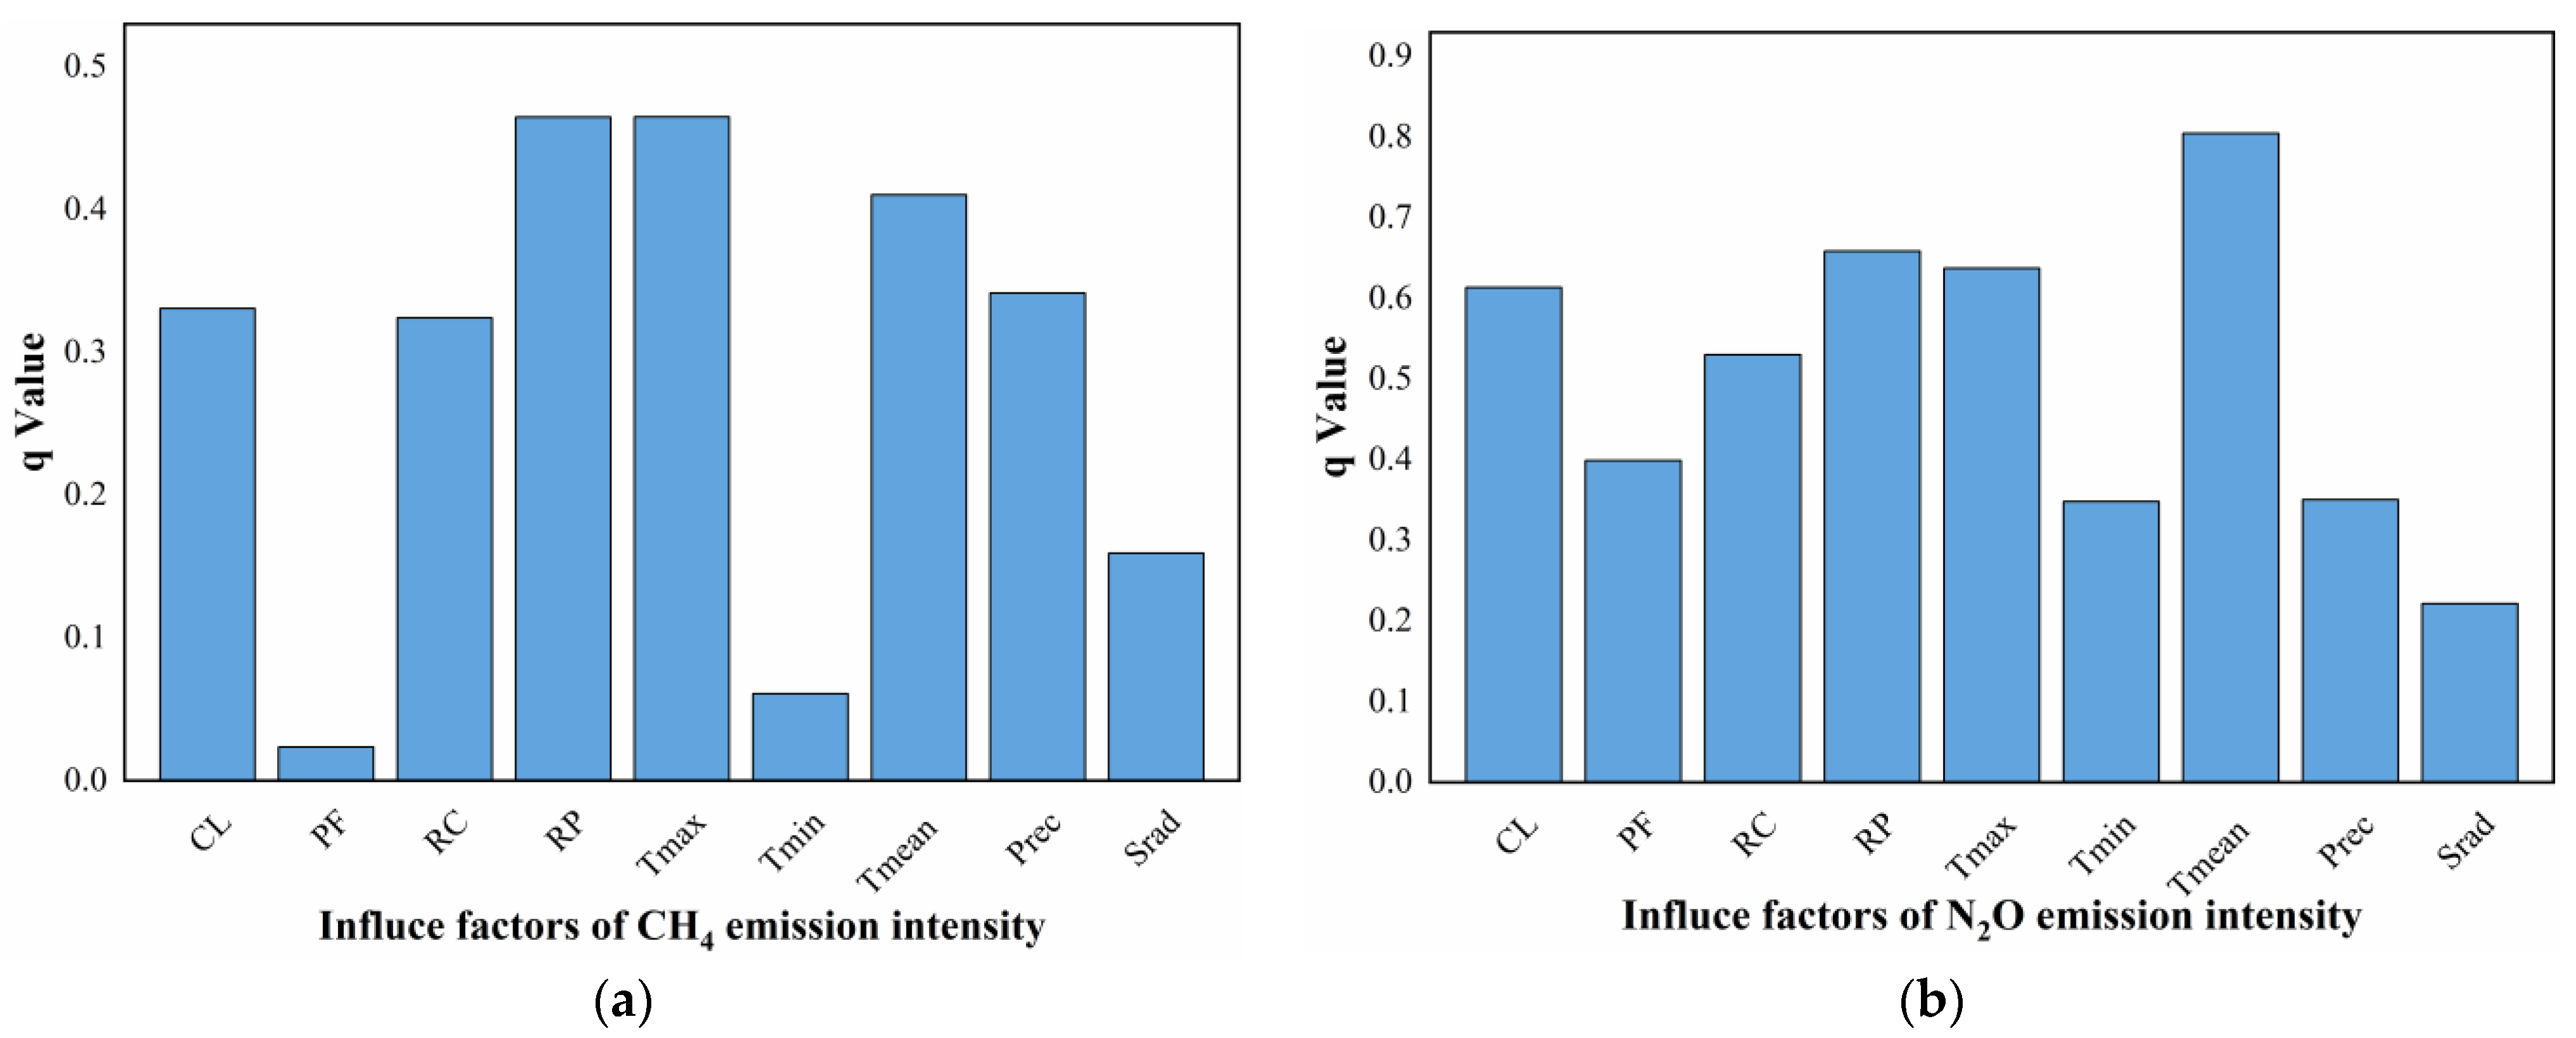
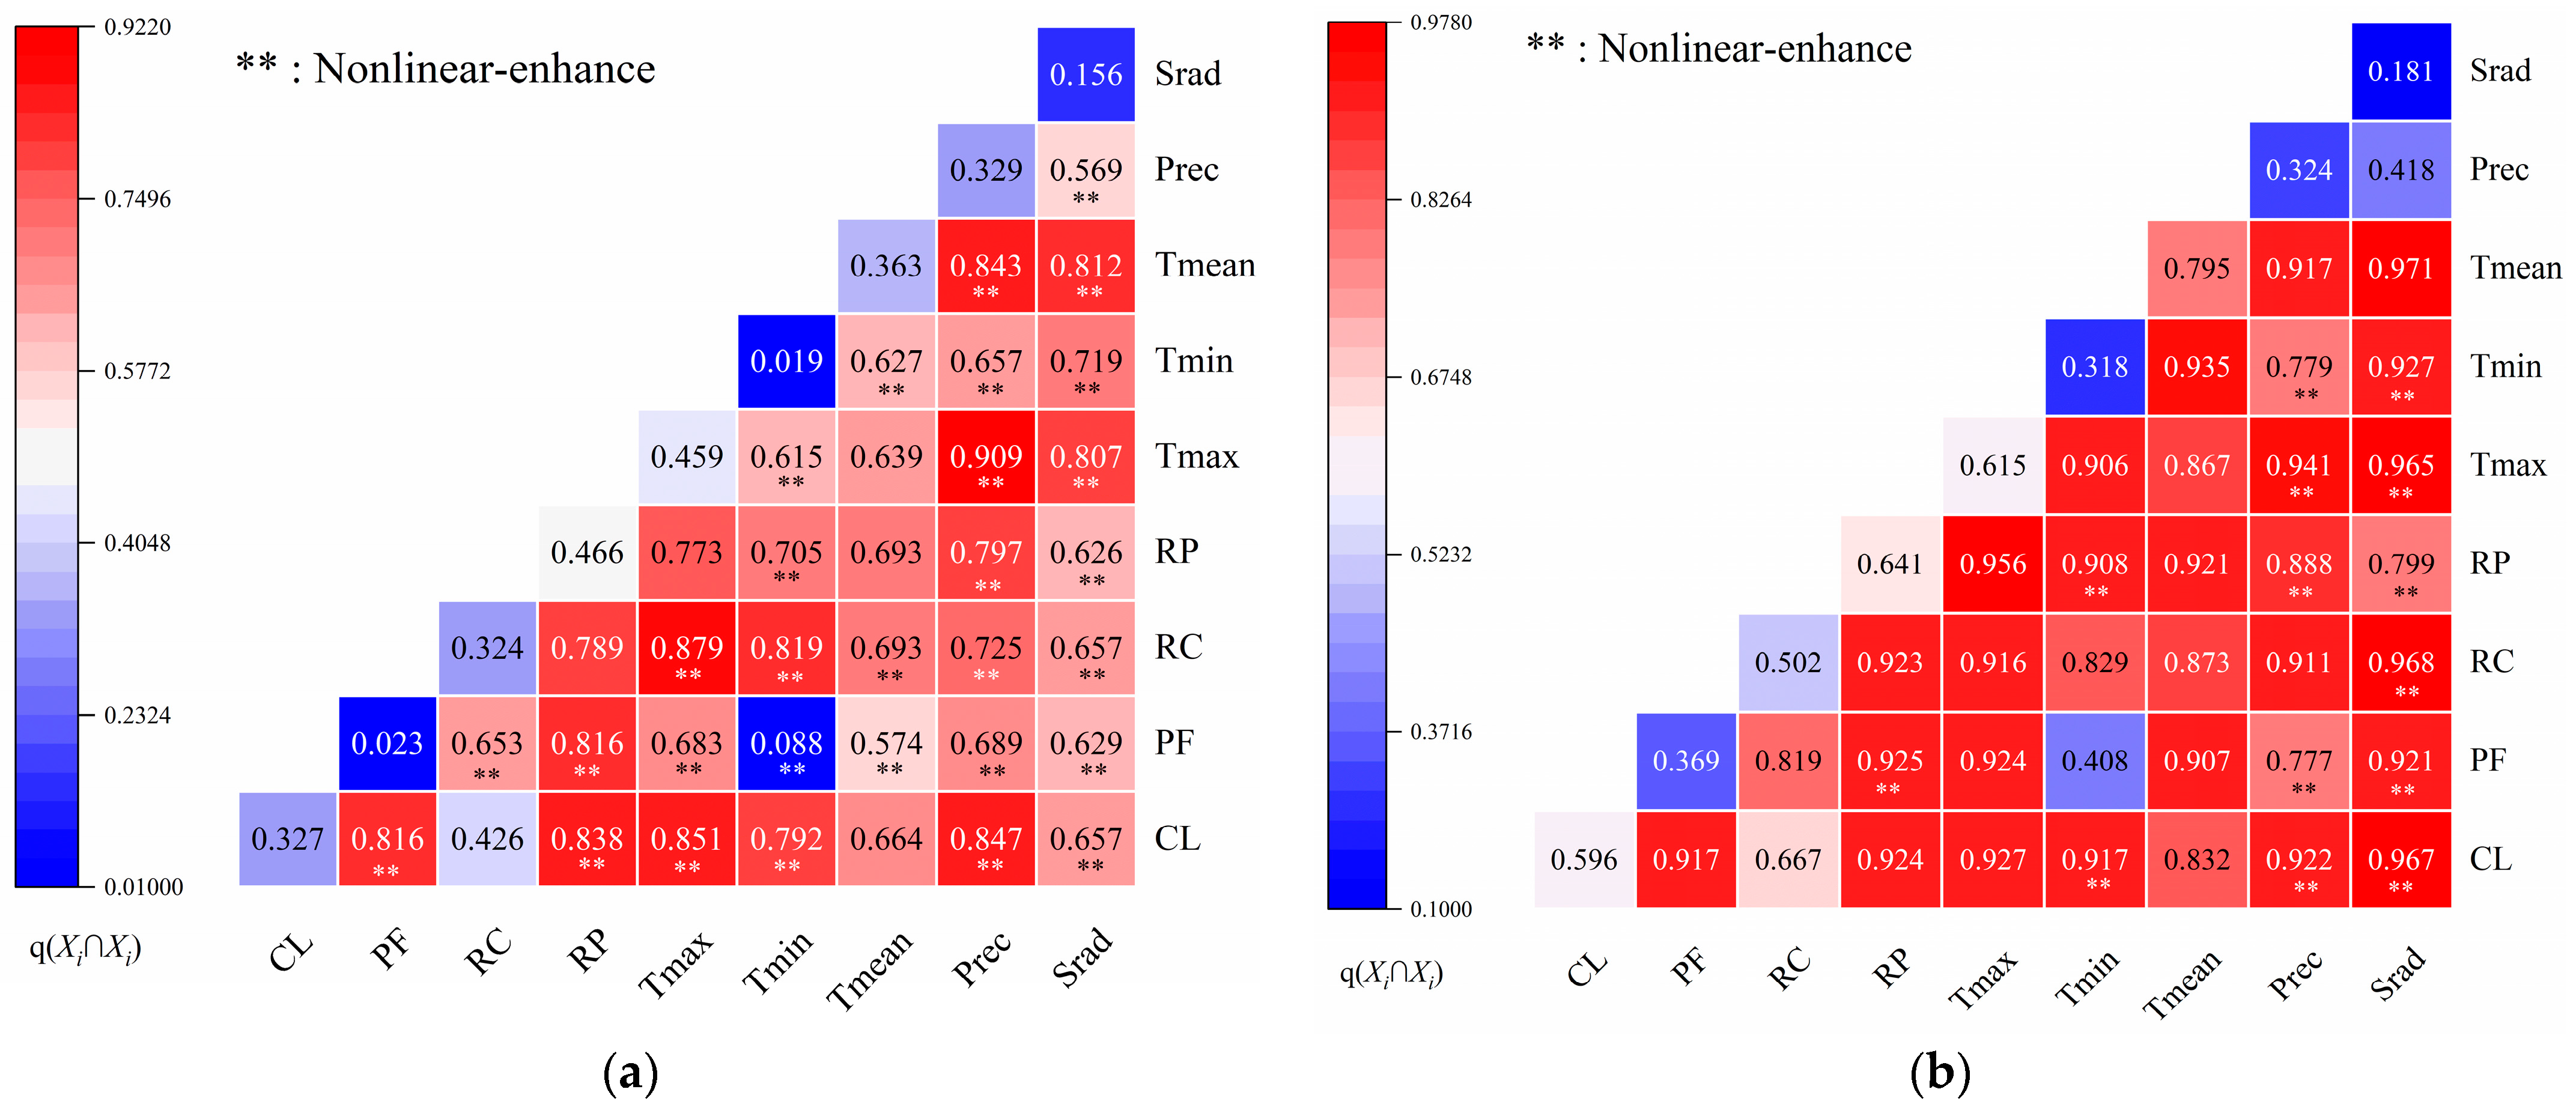
3.2. Quantification of the Influencing Factors of GHGintensity and Their Interactions

Using a geographical detector (in Figure 4a,b), we have quantified the main factors that affect GHGintensity in agricultural soil. The ratio of paddy field area to the total cultivated land area (RP) was identified as the most vital explanatory factor (q = 0.46) in influencing CH4 emission intensity, succeeded by maximum air temperature (Tmax) (q = 0.46). These variables demonstrated significantly stronger explanatory power than others, such as the total paddy field area (PF) and minimum air temperature (Tmin). Major factors impacting N2O emission intensity included average temperature (Tmean) (q = 0.80), total cultivated land area (CL) (q = 0.60), RP (q = 0.65), and Tmax (q = 0.63).
To further investigate the effect of the interaction between the nine factors mentioned above on the GHGintensity, an interaction detector was used for the analysis. This detector can assess the strength of the interaction between two independent factors based on their ability to explain surface temperature. Our results are presented in Figure 5. In CH4, the interaction between Prec and Tmax explains the largest extent of CH4 emission intensity, reaching 0.909. This indicates that the interaction between Prec and Tmax is the main factor influencing the spatial distribution pattern and heterogeneity of GHGintensity on Hainan Island. In terms of N2O, the interaction between Srad and Tmean was the strongest in relation to the intensity of N2O emissions, with an explanation of 0.971, followed by Srad and RC, with an explanation of 0.968. We found that the interaction between Prec/Srad of CH4 and arbitrary natural factors showed a non-linear enhancement. This suggests that the interaction between Prec/Srad and any natural factor has a greater impact on the GHGintensity than the sum of their individual effects, which is also reflected for N2O.

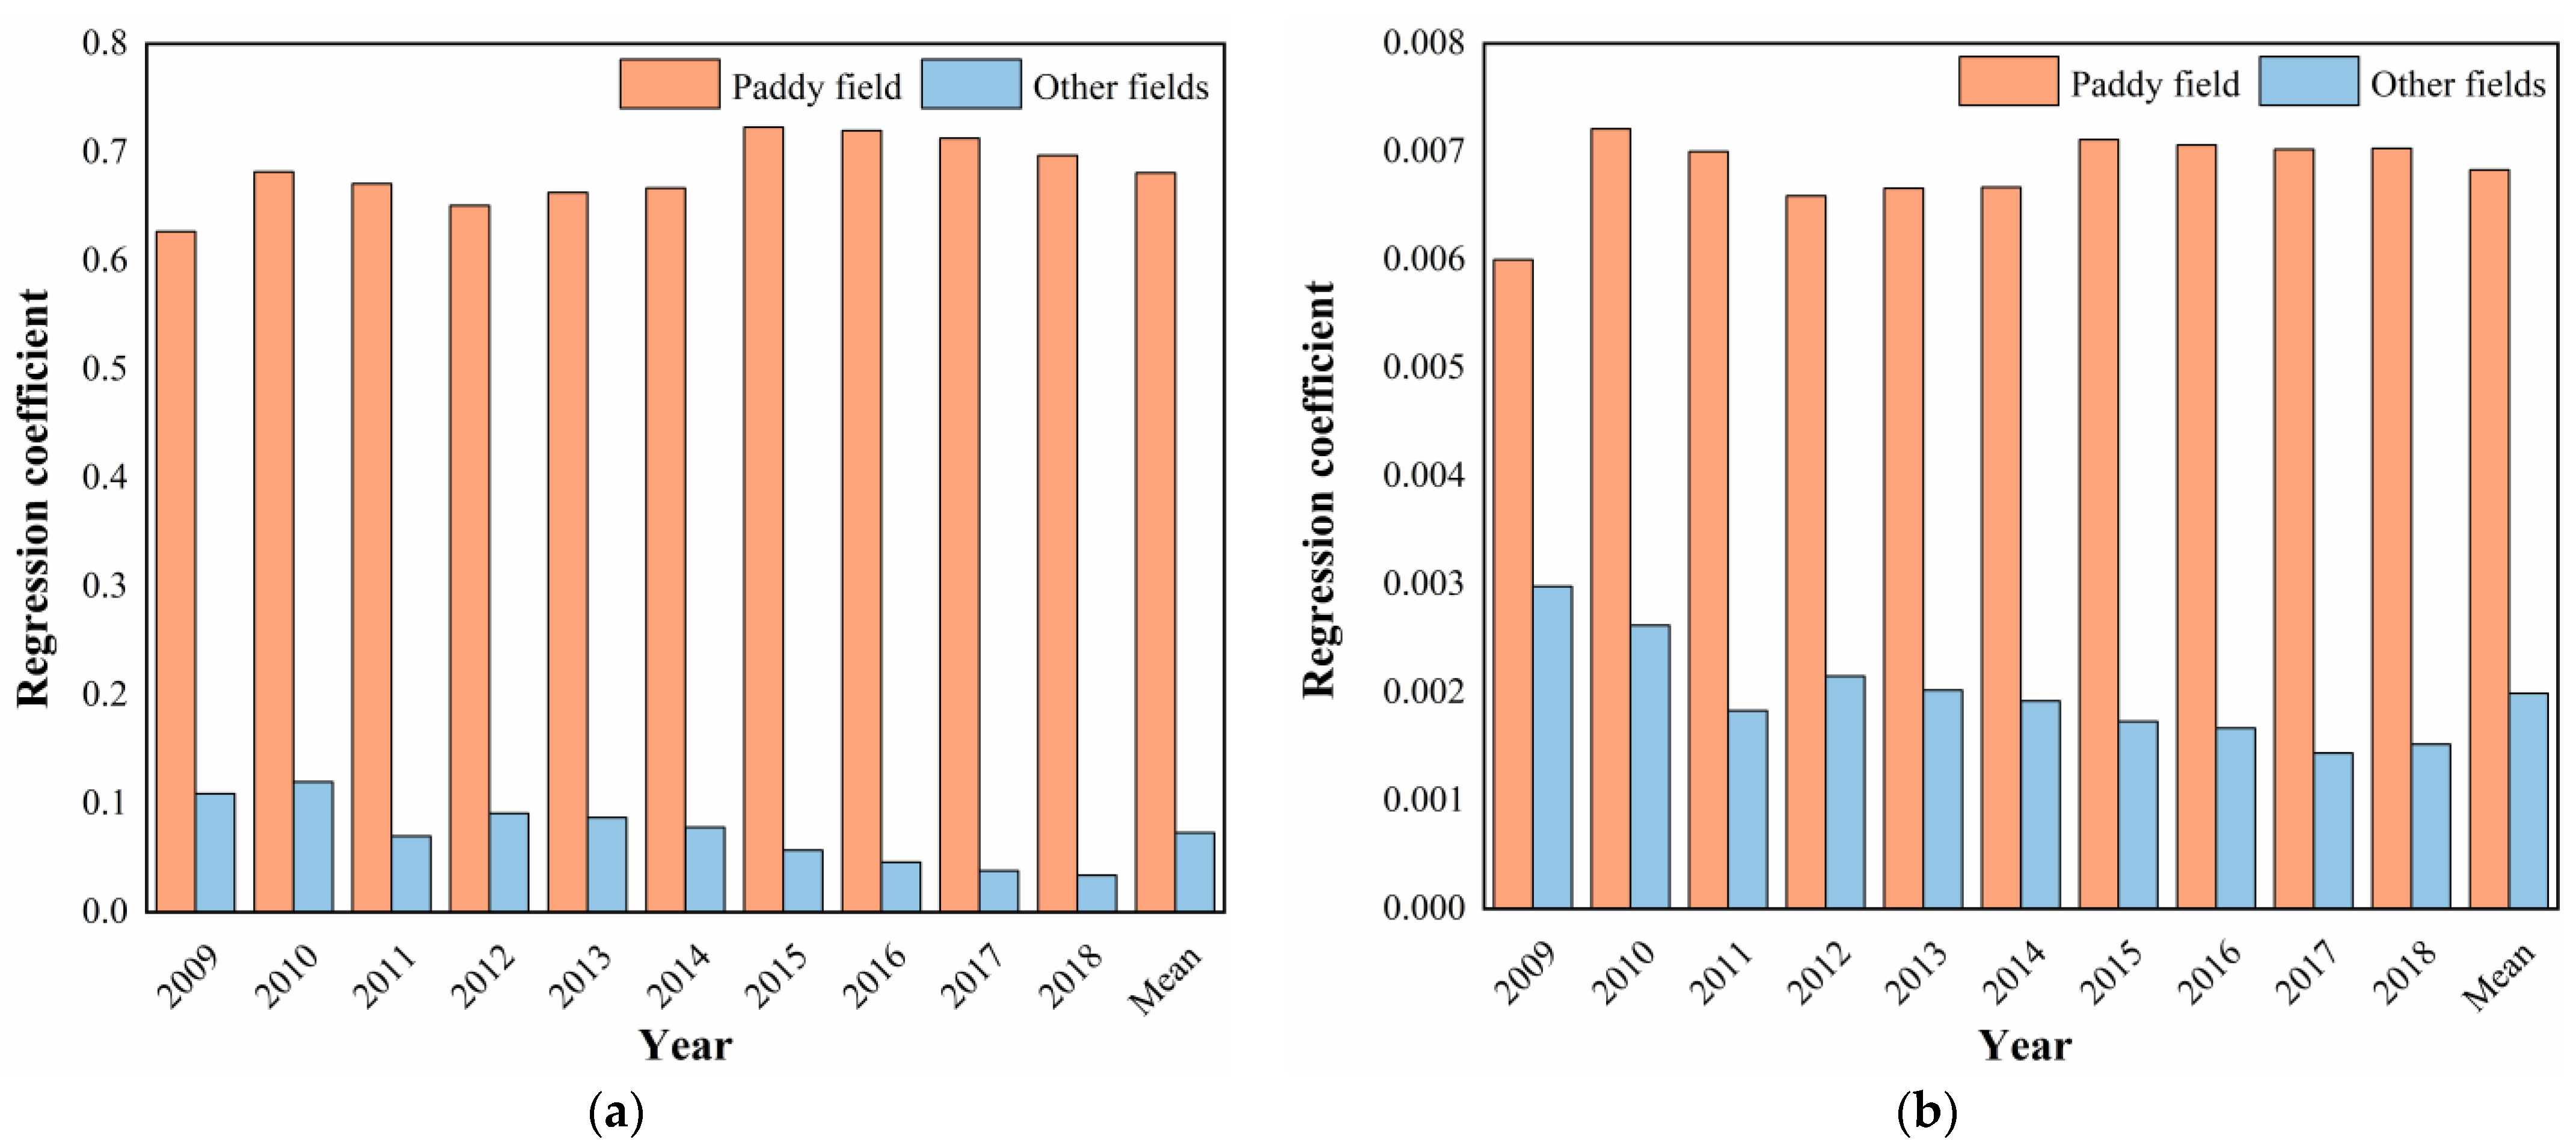
3.3. Quantifying the Sensitivity of GHGe in Different Types of Cultivated Land

According to different irrigation conditions, cultivated land is divided into three categories: dry land, dry field, and paddy field, as recommended by the Hainan County Statistical Yearbook. As dry lands and dry fields are associated with rain-fed cultivated lands, we further integrated these two types of land use into non-paddy fields. Non-paddy fields accounted for 60% of the total area of cultivated land on Hainan Island in 2018, although they failed to provide an adequate water supply during the dry season. To investigate the difference in agricultural soil GHGintensity between paddy fields and non-paddy fields, a multiple linear regression model was used to separate CH4 and N2O emission intensity in the two different cultivation methods.
The scatterplots depicting the simulated and measured results from the model demonstrate that the CH4 model (in Figure 6a) meets the requirements of model construction in terms of both stability (with a slope of 0.81, close to the 1:1 line) and accuracy (R2 = 0.727, p < 0.01). Similarly, the N2O model (in Figure 6b) exhibits stability (with a slope of 1.1, close to the 1:1 line) and accuracy (R2 = 0.878, p < 0.01) that meet the criteria for model development. Notably, the simulation effect of the N2O model was superior to that of the CH4 model.
G H G s i m , i , j = α j a r e a p a d d y , i , j + β j a r e a n o n p a d d y , i , j
GHG E , i , j = Intensity r a w E , i , j · a r e a c ity , i · β
where GHGsim,i,j represents the GHGe after MLR simulation in a given city i and a given year j. The variable αj represents α1 in Equation (4), which denotes the GHGintensity of paddy fields. Similarly, the variable βj represents α2 in Equation (4), indicating the GHGintensity of non-paddy fields. Further, areapaddy,i,j and areanon-paddy,i,j represent the areas of paddy fields and non-paddy fields. GHGE,i,j represents the revised EDGAR emissions data in a given city i and a given year j, and IntensityrawE,i,j is the emission intensity of the raw EDGAR data in a given city i and a given year j. We use the grid data in each city to calculate the mean value, which represents the emission intensity of the city, and areacity,i is the area of city i. β represents the correction coefficient.
A multiple regression model was used to analyze the GHGintensity from paddy and non-paddy fields. In Figure 7, the orange bars represent paddy field emission intensity, and the blue bars represent non-paddy field emission intensity. The range of CH4 emission intensity from paddy fields was 0.39 to 0.49 t·hm−2, while the range for non-paddy fields was 0.02 to 0.07 t·hm−2. Similarly, the range of N2O emission intensity from paddy fields was 0.006 to 0.0072 t·hm−2, while the range for non-paddy fields was 0.0014 to 0.0029 t·hm−2. The CH4 emission intensity from non-paddy fields decreased over time, indicating an increasing difference in emission intensity over a ten-year period. Similarly, the difference in N2O emission intensity also increased. The average CH4 emission intensity from paddy fields was 0.42 t·hm−2, while the average from non-paddy fields was 0.04 t·hm−2. The ratio of CH4 emission intensity between paddy and non-paddy fields (Ratio-CH4) was 9.3. The mean N2O emission intensity from paddy fields was 0.0068 t·hm−2, while the average from non-paddy fields was 0.002 t·hm−2. The ratio of N2O emission intensity between paddy and non-paddy fields (Ratio-N2O) was 3.4. Notably, Ratio-CH4 was 2.75 times larger than Ratio-N2O, indicating that GHGe are dependent on soil moisture.

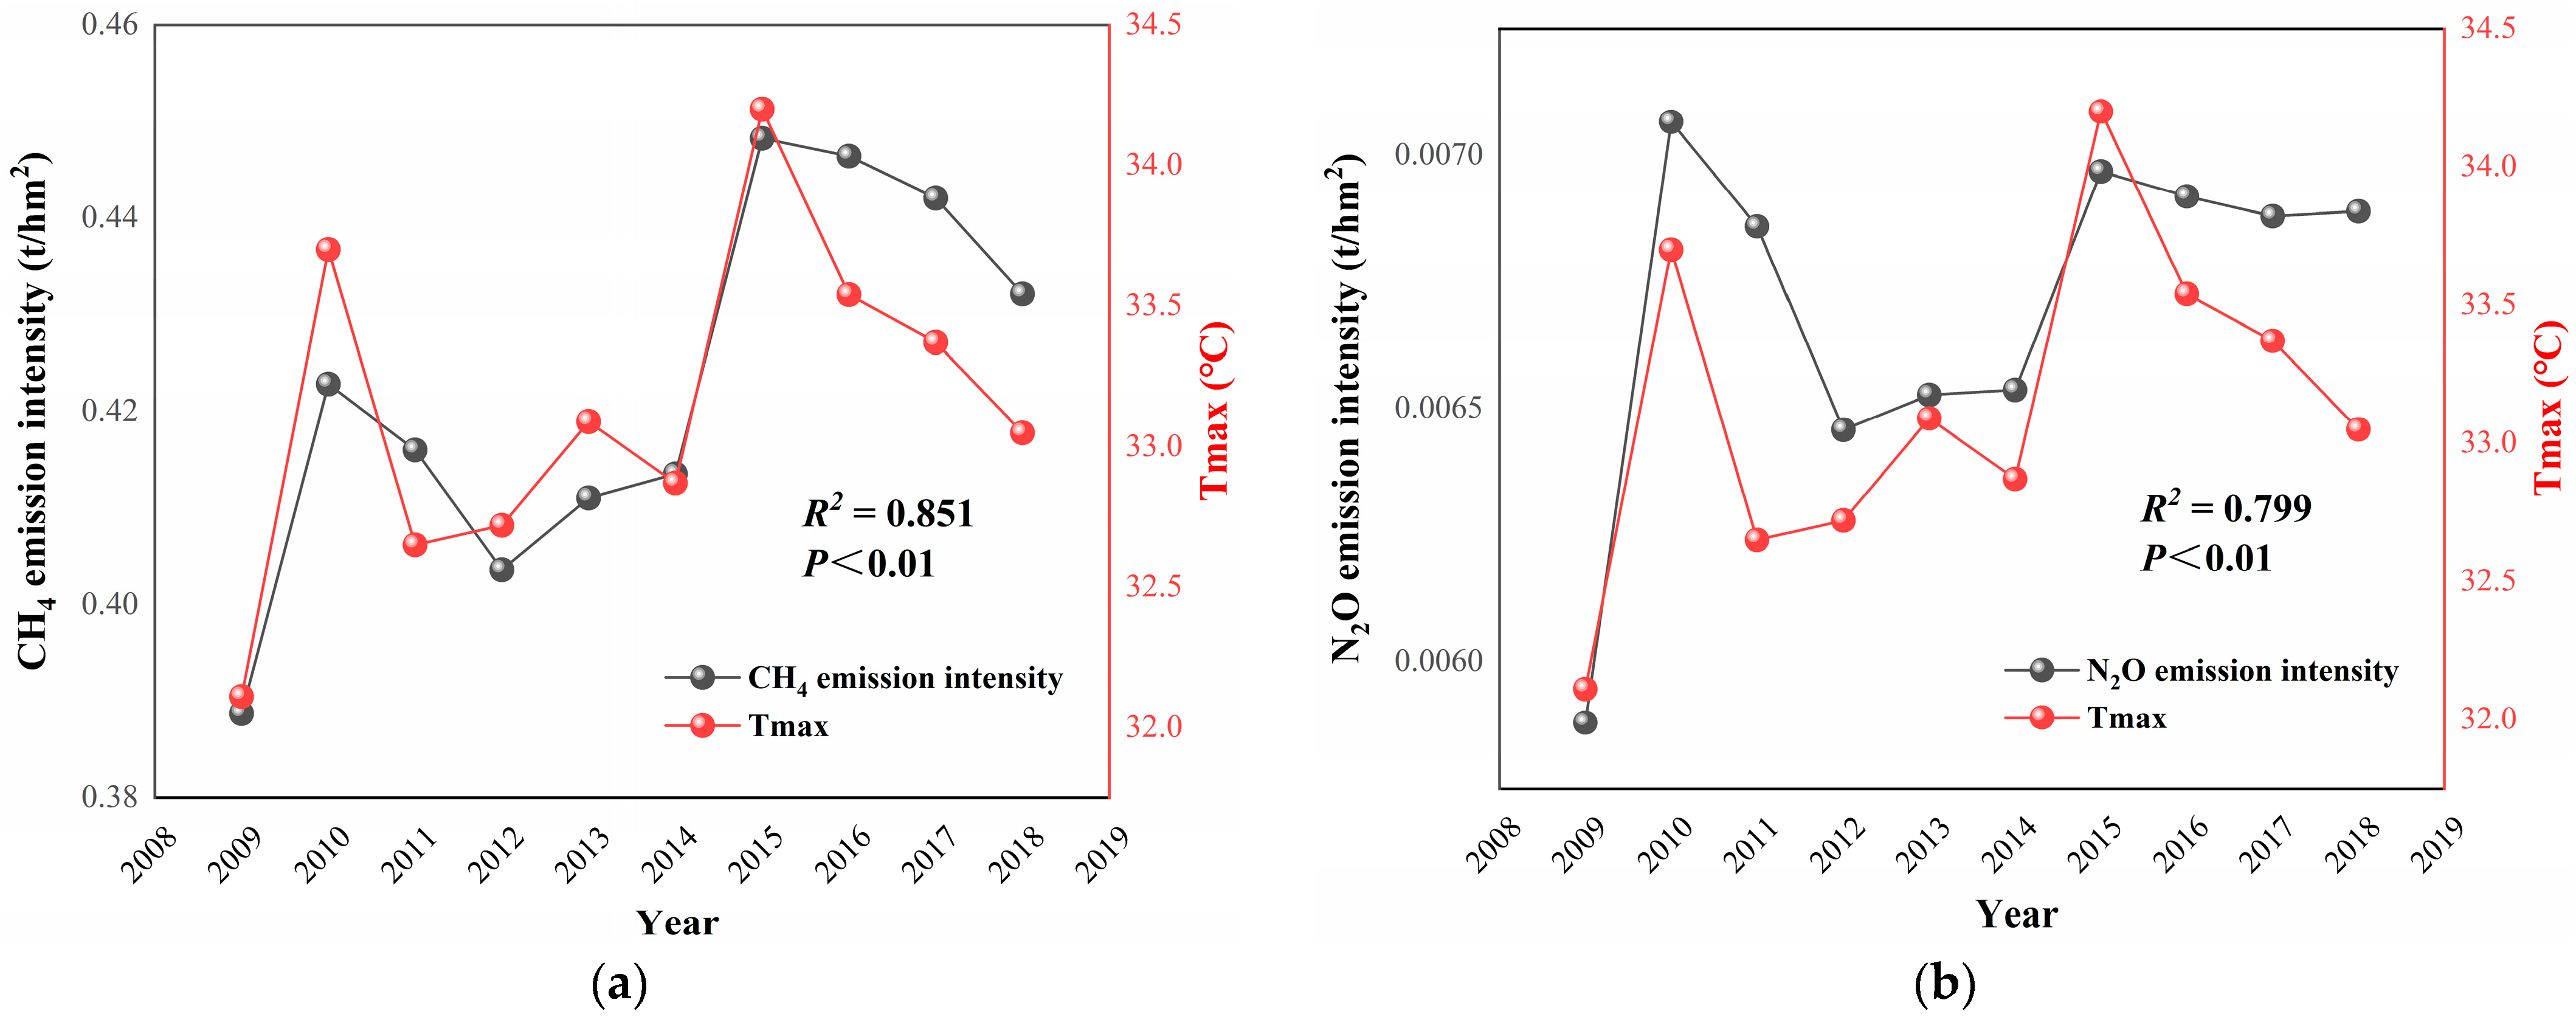
3.4. The Main Climate-Driven Forces for GHGe from Paddy Fields

Our study found that GHGe mainly derive from paddy fields. Thus, we present a comparative analysis of paddy field emission intensity below. The geodetector results in Section 3.1 indicate that paddy fields are also important LUCC indicators. Hence, we further investigate which climate factor determines paddy field emission intensity. This study correlated CH4 and N2O emission intensity trends from 2009 to 2018 with trends in key climate factors, including Tmax, Tmin, Tmean, Prec, and Srad (Table 4). We found that all trends in CH4 emission intensity from paddy fields showed a highly significant positive correlation with trends in Tmax (r = 0.92, p < 0.01). However, there was no significant correlation between CH4 emission intensity and other climate factors. Similarly, all trends in N2O emission intensity from paddy fields showed a highly significant positive correlation with Tmax (r = 0.89, p < 0.01), with no significant correlation with other climate factors.
From 2009 to 2018, there was a strong consistency between the fluctuation of Tmax and CH4 emission intensity (R2 = 0.851, p < 0.01, Figure 8a). Similarly, N2O emission intensity was also highly correlated over the same ten-year period (R2 = 0.799, p < 0.01, Figure 8b), further validating that Tmax is the most sensitive climate factor affecting GHGe on Hainan Island. Next, we quantified the sensitivity of GHGintensity to global warming using Equation (6), as mentioned in Section 2.3.4. The sensitivity coefficient Sx for CH4 was 0.0557, and, for N2O, it was 0.0007. These results suggest that each per Kelvin increase in temperature would result in an increase of 14.2% and 11.14% in CH4 and N2O emission intensity, respectively.

4. Discussion

4.1. The Sensitivity of Climate Change to GHG from Agricultural Soils

GHGe from agricultural soils are strongly influenced by climate conditions and soil status. Soil microorganisms are the drivers of many biochemical processes, and the microbial activity of CH4 and N2O in the soil is also regulated by the hydrothermal conditions of the environment, including denitrifying bacteria, nitrifying, methanogenic and methane-oxidizing, etc. [19,20]. Deposition of unstable C and N in root secretions and soil provides the main substance source for GHG-NCO2 production. In previous studies, it was found that the increase in soil surface temperature can increase the content of organic carbon in soil and then promote the increase in soil N2O and CH4 emissions [67]. When the number of methanogens did not change, the soil CH4 emission rate was the fastest in the season with the highest temperature [68]. It is also believed that the emission of CH4 in paddy fields is affected by the increase in temperature. The increase in temperature below 2 °C can promote CH4 emission, while, above 2 °C, it will inhibit CH4 emission [69]. In addition, experimental field studies have shown a positive correlation between CH4 emissions and the temperature of continuously flooded rice paddies with sufficient organic matter [15]. This study found that Tmax was the primary climate factor influencing CH4 emissions, while Tmean was the primary influence factor for N2O emissions. We also confirmed a notable correlation between Tmax and GHGintensity, with a 14.2% increase in CH4 emission intensity and an 11.14% increase in N2O emission intensity in paddy fields per Kelvin Tmax increase. The results were similar to the previous study [70]. For every 10 °C increase in paddy field temperature, CH4 emissions would increase by 25 times in this study. These observations may be due to the increased activity of microorganisms in a warm environment, resulting in changes in their respiration rate and activity, thereby changing the GHGintensity.
Soil moisture content is also an important factor in environmental aspects, which are mainly regulated by precipitation and evapotranspiration in nature [71]. Rapid increases in soil water content due to rainfall disrupt the soil aggregate structure, creating an anaerobic environment that stimulates the activity of methanogenic and denitrifying bacteria, leading to the release of carbon and nitrogen [72]. However, excessive rainfall impedes GHG releases [73]. This study observed a negative correlation between precipitation and paddy field intensity. It may be due to frequent rainfall maintaining high humidity, lowering temperatures, and suppressing GHGintensity. It may also be the case that the paddy fields are mostly irrigated with reliable water sources and irrigation facilities, and fluctuations in precipitation do not adversely impact GHGintensity.

4.2. Comparison of CH4 and N2O Emission Intensity in Different Farming Practices

Paddy fields with irrigation are a strong source of greenhouse gases. Management practices in agricultural cultivation have a significant impact on CH4 and N2O emission intensity, especially water management practices [74]. CH4 emissions from rice-plant-mediated transport account for 80% of the total emissions from paddy fields [75]. A large amount of water is required during rice cultivation, creating an anaerobic environment that inhibits N2O production but promotes the growth of methanogens, resulting in a large amount of CH4 emissions [76]. Meanwhile, in rain-fed non-paddy fields, the utilization of nitrogen fertilizer and improved soil drainage conditions might contribute to an increase in N2O emissions [77]. These studies showed that the presence or absence of artificial irrigation practices plays a key role in GHG emissions from agricultural soils, and the same is also reflected in the current study. We showed that the GHGe of 18 cities is largely determined by the proportion of the total area of paddy fields and that, under conditions of adequate water supply (usually provided by irrigation), the emission intensities of CH4 and N2O from paddy fields were 9.3 times and 3.4 times higher, respectively, than those from non-paddy fields. This suggests that the difference in the emission intensity of N2O between the two farming practices is smaller compared to the emission intensity of CH4 under different farming practices. Soil permeability is a major factor affecting CH4 emission [78], and diffusion of CH4 in soil can limit the rate of CH4 oxidation [79]. This may lead to the fact that, in agroecosystems, the CH4 emission from non-paddy fields is much smaller than that from paddy fields. Under flooded conditions, 87% of N2O emissions were transported through rice plants and 18% were transported under non-flooded conditions [80]. Owing to their different rates of microbial decomposition and material cycling in different farming practices and physicochemical properties such as soil water content, pH, carbon, and nitrogen content, there are some differences between the emission mechanisms of CH4 and N2O. The differences between Ratio-CH4 and Ratio-N2O in this study also confirmed this point. Wang et al. [81] also concluded that dryland fields emit more N2O and less CH4 than paddy fields and that the overall global warming potential has decreased.
Therefore, the conversion of paddy fields to non-paddy fields may be beneficial in reducing GHGe from agricultural soils. This conclusion can be used as a basis for adjusting land use strategies. The tropics are an important source of CH4 emissions, with the region accounting for about 60% of total global CH4 emissions [82]. So, we can mitigate the increase in global warming by adjusting the cultivation structure of the tropics to reduce GHGe. The use of rice varieties affects yield and GHGe. Rice variety replacement in 2000 significantly increased rice yields and reduced GHG emissions compared to 1960 varieties [83]. The advocacy for modern rice varieties emerges as a novel approach to mitigating environmental impacts. For example, the water-saving and drought-resistant rice with dry cultivation (D-WDR) cropping model can achieve GHGe mitigation and yield stabilization [74]. For rice producers, it is also a win–win model that balances rice yield and GHGe reduction.

4.3. Limitations

The results of this study are more reliable, but there are some limitations. First, the geographic detectors exploring GHGintensity selected whether to use irrigation measures as an influencing factor of farmland management measures; however, different farming practices and fertilization measures may affect the results of the study [84]. Then, the research objects selected in this study to explore GHGe are mainly paddy fields and non-paddy fields; however, other crop types and different soil types have also contributed to GHGe [21]. Finally, this study investigated the correlation between air temperature and GHGe, and the relationship between soil temperature and GHGe can be considered because soil temperature influences the decomposition cycle process of microorganisms in the soil, which may lead to different research results. Therefore, in future studies, more environmental indicators and whether there are correlations and interactions between different anthropogenic cropping choices and farm management practices on GHGe emissions could be considered.

5. Conclusions

The EDGAR agricultural soil data were bias-corrected to produce annual correction coefficients, with average bias correction coefficients of 0.62 for CH4 and 0.98 for N2O. The maximum air temperature constituted the primary climatic factor influencing CH4 emissions, whereas the mean air temperature prominently affected N2O emissions. Regarding land use, the ratio of the paddy field area to the total region was a significant component influencing both CH4 and N2O emissions. The mean CH4/N2O emission intensity of paddy under sufficient water supply conditions is 0.42 t·hm−2/0.0068 t·hm−2, while that of non-paddy is 0.04 t·hm−2/0.002 t·hm−2, with Ratio-CH4 and Ratio-N2O being 9.3 and 3.4, respectively. The Tmax showed the greatest consistency with GHGintensity from paddy (CH4: R2 = 0.851, p < 0.01; N2O: R2 = 0.799, p < 0.01). The per Kelvin increase in temperature heightened the CH4 and N2O emission intensity in paddy fields by 14.2% and 11.14%. This emission intensity is anticipated to manifest non-stable positive feedback within the context of global warming.

Author Contributions

Conceptualization, J.Z. and J.W.; data curation, F.Z. and H.Z.; formal analysis, W.Z.; funding acquisition, J.Z.; investigation, J.W.; methodology, J.S.; resources, J.W.; software, W.Z.; supervision, W.L.; visualization, W.Z.; writing—original draft preparation, J.S.; writing—review and editing, J.Z. and J.S. All authors have read and agreed to the published version of the manuscript.

Funding

This research was funded by Hainan Province Science and Technology Special Fund (No. ZDYF2023SHFZ092), the National Natural Science Foundation of China (No. 42261005), and the Hainan Provincial Natural Science Foundation of China (Nos. 420RC601 and 421RC738).

Institutional Review Board Statement

Not applicable.

Informed Consent Statement

Not applicable.

Data Availability Statement

Not applicable.

Conflicts of Interest

The authors declare no conflict of interest.

References

  1. IPCC. Climate Change 2021: Contribution of Working Group I to the Sixth Assessment Report of the Intergovernmental Panel on Climate Change; Cambridge University Press: Cambridge, UK, 2021. [Google Scholar]
  2. Siegert, M.; Alley, R.B.; Rignot, E.; Englander, J.; Corell, R. Twenty-first century sea-level rise could exceed IPCC projections for strong-warming futures. One Earth 2020, 3, 691–703. [Google Scholar] [CrossRef]
  3. Mukherjee, S.; Mishra, A.K. Increase in Compound Drought and Heatwaves in a Warming World. Geophys. Res. Lett. 2021, 48, e2020GL090617. [Google Scholar] [CrossRef]
  4. Taniguchi, K.; Minobe, Y. Impact of Global Warming on Extreme Heavy Rainfall in the Present Climate: Case Study of Heavy Rainfall in Kinugawa, Japan (2015). Atmosphere 2020, 11, 220. [Google Scholar] [CrossRef]
  5. Xu, H.; Huang, L.; Chen, J.; Zhou, H.; Wan, Y.; Qu, Q.; Wang, M.; Xue, S. Changes in soil microbial activity and their linkages with soil carbon under global warming. Catena 2023, 232, 107419. [Google Scholar] [CrossRef]
  6. Carlson, K.M.; Gerber, J.S.; Mueller, N.D.; Herrero, M.; MacDonald, G.K.; Brauman, K.A.; Havlik, P.; O’Connell, C.S.; Johnson, J.A.; Saatchi, S.; et al. Greenhouse gas emissions intensity of global croplands. Nat. Clim. Chang. 2017, 7, 63–68. [Google Scholar] [CrossRef]
  7. Zhang, J.; Tian, H.; Shi, H.; Zhang, J.; Wang, X.; Pan, S.; Yang, J. Increased greenhouse gas emissions intensity of major croplands in China: Implications for food security and climate change mitigation. Glob. Chang. Biol. 2020, 26, 6116–6133. [Google Scholar] [CrossRef]
  8. Montzka, S.A.; Dlugokencky, E.J.; Butler, J.H. Non-CO2 greenhouse gases and climate change. Nature 2011, 476, 43–50. [Google Scholar] [CrossRef]
  9. Liao, B.; Wu, X.; Yu, Y.; Luo, S.; Hu, R.; Lu, G. Effects of mild alternate wetting and drying irrigation and mid-season drainage on CH4 and N2O emissions in rice cultivation. Sci. Total Environ. 2020, 698, 134212. [Google Scholar] [CrossRef]
  10. Ge, P.; Chen, M.; Cui, Y.; Nie, D. The Research Progress of the Influence of Agricultural Activities on Atmospheric Environment in Recent Ten Years: A Review. Atmosphere 2021, 12, 635. [Google Scholar] [CrossRef]
  11. IPCC. Climate Change and Land: An IPCC Special Report on Climate Change, Desertification, Land Degradation, Sustainable Land Management, Food Security, and Greenhouse Gas Fluxes in Terrestrial Ecosystems; Cambridge University Press: Cambridge, UK, 2019. [Google Scholar]
  12. Cheng, K.; Pan, G.; Smith, P.; Luo, T.; Li, L.; Zheng, J.; Zhang, X.; Han, X.; Yan, M. Carbon footprint of China’s crop production-An estimation using agro-statistics data over 1993–2007. Appl. Soil. Ecol. 2011, 142, 231–237. [Google Scholar] [CrossRef]
  13. National Communication. The People’s Republic of China Second Biennial Update Report on Climate Change. Available online: https://www.mee.gov.cn/ywgz/ydqhbh/wsqtkz/201907/P020190701765971866571.pdf (accessed on 10 May 2023). (In Chinese)
  14. Feng, Z.Y.; Qin, T.; Du, X.Z.; Sheng, F.; Li, C.F. Effects of irrigation regime and rice variety on greenhouse gas emissions and grain yields from paddy fields in central China. Agric. Water Manag. 2021, 250, 106830. [Google Scholar] [CrossRef]
  15. Yao, F.; Xu, Y.; Lin, E.; Yokozawa, M.; Zhang, J. Assessing the impacts of climate change on rice yields in the main rice areas of China. Clim. Chang. 2007, 80, 395–409. [Google Scholar] [CrossRef]
  16. Xiong, X.; Houweling, S.; Wei, J.; Maddy, E.; Sun, F.; Barnet, C. Methane plume over south Asia during the monsoon season: Satellite observation and model simulation. Atmos. Chem. Phys. 2009, 9, 783–794. [Google Scholar] [CrossRef]
  17. Fatumah, N.; Munishi, L.K.; Ndakidemi, P.A. Variations in Greenhouse Gas Fluxes in Response to Short-Term Changes in Weather Variables at Three Elevation Ranges, Wakiso District, Uganda. Atmosphere 2019, 10, 708. [Google Scholar] [CrossRef]
  18. Li, L.; Zheng, Z.; Wang, W.; Biederman, J.A.; Xu, X.; Ran, Q.; Qian, R.; Xu, C.; Zhang, B.; Wang, F.; et al. Terrestrial N2O emissions and related functional genes under climate change: A global meta-analysis. Glob. Chang. Biol. 2020, 26, 931–943. [Google Scholar] [CrossRef] [PubMed]
  19. Knief, C. Diversity of Methane-cycling Microorganisms in Soils and Their Relation to Oxygen. Curr. Issues Mol. Biol. 2019, 33, 23–56. [Google Scholar] [CrossRef]
  20. Prosser, J.I.; Hink, L.; Gubry-Rangin, C.; Nicol, G.W. Nitrous oxide production by ammonia oxidizers: Physiological diversity, niche differentiation and potential mitigation strategies. Glob. Chang. Biol. 2020, 26, 103–118. [Google Scholar] [CrossRef]
  21. Shakoor, A.; Shakoor, S.; Rehman, A.; Ashraf, F.; Abdullah, M.; Shahzad, S.M.; Farooq, T.H.; Ashraf, M.; Manzoor, M.A.; Altaf, M.M.; et al. Effect of animal manure, crop type, climate zone, and soil attributes on greenhouse gas emissions from agricultural soils—A global meta-analysis. J. Clean. Prod. 2021, 278, 124019. [Google Scholar] [CrossRef]
  22. Van Groenigen, K.J.; Van Kessel, C.; Hungate, B.A. Increased greenhouse-gas intensity of rice production under future atmospheric conditions. Nat. Clim. Chang. 2013, 3, 288–291. [Google Scholar] [CrossRef]
  23. Qian, H.; Zhang, N.; Chen, J.; Chen, C.; Hungate, B.A.; Ruan, J.; Huang, S.; Cheng, K.; Song, Z.; Hou, P.; et al. Unexpected Parabolic Temperature Dependency of CH4 Emissions from Rice Paddies. Environ. Sci. Technol. 2022, 56, 4871–4881. [Google Scholar] [CrossRef]
  24. Jain, N.; Arora, P.; Tomer, R.; Mishra, S.V.; Bhatia, A.; Pathak, H.; Chakraborty, D.; Kumar, V.; Dubey, D.S.; Harit, R.C.; et al. Greenhouse gases emission from soils under major crops in Northwest India. Sci. Total Environ. 2016, 542, 551–561. [Google Scholar] [CrossRef] [PubMed]
  25. Rath, A.K.; Ramakrishnan, B.; Sethunathan, N. Temperature dependence of methane production in tropical rice soils. Geomicrobiol. J. 2002, 19, 581–592. [Google Scholar] [CrossRef]
  26. Tian, H.; Xu, X.; Liu, M.; Ren, W.; Zhang, C.; Chen, G.; Lu, C. Spatial and temporal patterns of CH4 and N2O fluxes in terrestrial ecosystems of North America during 1979–2008: Application of a global biogeochemistry model. Biogeosciences 2010, 7, 2673–2694. [Google Scholar] [CrossRef]
  27. Wang, J.; Rothausen, S.G.S.A.; Conway, D.; Zhang, L.; Xiong, W.; Holman, I.P.; Li, Y. China’s water-energy nexus: Greenhouse-gas emissions from groundwater use for agriculture. Environ. Res. Lett. 2012, 7, 014035. [Google Scholar] [CrossRef]
  28. Lamb, A.; Green, R.; Bateman, I.; Broadmeadow, M.; Bruce, T.; Burney, J.; Carey, P.; Chadwick, D.; Crane, E.; Field, R.; et al. The potential for land sparing to offset greenhouse gas emissions from agriculture. Nat. Clim. Chang. 2016, 6, 488–492. [Google Scholar] [CrossRef]
  29. Kozicka, K.; Gozdowski, D.; Wójcik-Gront, E. Spatial-Temporal Changes of Methane Content in the Atmosphere for Selected Countries and Regions with High Methane Emission from Rice Cultivation. Atmosphere 2021, 12, 1382. [Google Scholar] [CrossRef]
  30. Wu, X.; Zhang, X.; Chuai, X.; Huang, X.; Wang, Z. Long-Term Trends of Atmospheric CH4 Concentration across China from 2002 to 2016. Remote Sens. 2019, 11, 538. [Google Scholar] [CrossRef]
  31. Wang, J.; Luo, Y.; Quan, Q.; Ma, F.; Tian, D.; Chen, W.; Wang, S.; Yang, L.; Meng, C.; Niu, S. Effects of warming and clipping on CH4 and N2O fluxes in an alpine meadow. Agric. For. Meteorol. 2021, 297, 108278. [Google Scholar] [CrossRef]
  32. Yan, X.; Ohara, T.; Akimoto, H. Bottom-up estimate of biomass burning in mainland China. Atmos. Environ. 2006, 40, 5262–5273. [Google Scholar] [CrossRef]
  33. Crippa, M.; Solazzo, E.; Huang, G.; Guizzardi, D.; Koffi, E.; Muntean, M.; Schieberle, C.; Friedrich, R.; Janssens-Maenhout, G. High resolution temporal profiles in the Emissions Database for Global Atmospheric Research. Sci. Data 2020, 7, 121. [Google Scholar] [CrossRef]
  34. Kedia, S.; Das, S.K.; Islam, S.; Hazra, A.; Kumar, N. Aerosols impact on the convective and non-convective rain distribution over the Indian region: Results from WRF-Chem simulation. Atmos. Environ. 2019, 202, 64–74. [Google Scholar] [CrossRef]
  35. Madrazo, J.; Clappier, A.; Carlos Belalcazar, L.; Cuesta, O.; Contreras, H.; Golay, F. Screening differences between a local inventory and the Emissions Database for Global Atmospheric Research (EDGAR). Sci. Total Environ. 2018, 631–632, 934–941. [Google Scholar] [CrossRef] [PubMed]
  36. Gong, C.; Ma, L.; Cheng, H.; Liu, Y.; Xu, D.; Li, B.; Liu, F.; Ren, Y.; Liu, Z.; Zhao, C. Characterization of the particle size fraction associated heavy metals in tropical arable soils from Hainan Island, China. J. Geochem. Explor. 2014, 139, 109–114. [Google Scholar] [CrossRef]
  37. Sun, R.; Wu, Z.; Chen, B.; Yang, C.; Qi, D.; Lan, G.; Fraedrich, K. Effects of land-use change on eco-environmental quality in Hainan Island, China. Ecol. Indic. 2020, 109, 105777. [Google Scholar] [CrossRef]
  38. Wu, W.; Zhang, J.; Sun, Z.; Yu, J.; Liu, W.; Yu, R.; Wang, P. Attribution analysis of land degradation in Hainan Island based on geographical detector. Ecol. Indic. 2022, 141, 109119. [Google Scholar] [CrossRef]
  39. He, J.; Yang, K.; Tang, W.; Lu, H.; Qin, J.; Chen, Y.; Li, X. The first high-resolution meteorological forcing dataset for land process studies over China. Sci. Data 2020, 7, 25. [Google Scholar] [CrossRef]
  40. Hainan Provincial Bureau of Statistics. Hainan Statistical Yearbook. Available online: https://www.hainan.gov.cn/hainan/tjnj/list3.shtml (accessed on 16 October 2022). (In Chinese)
  41. Turco, M.; Jose Rosa-Canovas, J.; Bedia, J.; Jerez, S.; Pedro Montavez, J.; Carmen Llasat, M.; Provenzale, A. Exacerbated fires in Mediterranean Europe due to anthropogenic warming projected with non-stationary climate-fire models. Nat. Commun. 2018, 9, 3821. [Google Scholar] [CrossRef]
  42. Wang, J.; Xu, C. Geodetector: Principle and prospective. Acta Geogr. Sin. 2017, 72, 116–134. (In Chinese) [Google Scholar]
  43. Zheng, H.; Zhang, L.; Zhu, R.; Liu, C.; Sato, Y.; Fukushima, Y. Responses of streamflow to climate and land surface change in the headwaters of the Yellow River Basin. Water Resour. Res. 2009, 45, W00A19. [Google Scholar] [CrossRef]
  44. Zhang, X.; Wang, J.; Zhang, T.; Li, B.; Yan, L. Assessment of methane emissions from China’s agricultural system and low carbon measures. Environ. Sci. Technol. 2021, 44, 200–208. (In Chinese) [Google Scholar]
  45. Huang, M.; Wang, T.; Zhao, X.; Xie, X.; Wang, D. Estimation of atmospheric methane emissions and its spatial distribution in China during 2015. Acta Sci. Circumst. 2019, 39, 1371–1380. (In Chinese) [Google Scholar]
  46. Gong, S.; Shi, Y. Evaluation of comprehensive monthly-gridded methane emissions from natural and anthropogenic sources in China. Sci. Total Environ. 2021, 784, 147116. [Google Scholar] [CrossRef] [PubMed]
  47. Du, M.; Zhu, Q.; Wang, X.; Li, P.; Yang, B.; Chen, H.; Wang, M.; Zhou, X.; Peng, C. Estimates and Predictions of Methane Emissions from Wastewater in China from 2000 to 2020. Earths Future 2018, 6, 252–263. [Google Scholar] [CrossRef]
  48. Wang, Z.; Zhang, X.; Liu, L.; Wang, S.; Zhao, L.; Wu, X.; Zhang, W.; Huang, X. Estimates of methane emissions from Chinese rice fields using the DNDC model. Agric. For. Meteorol. 2021, 303, 15. [Google Scholar] [CrossRef]
  49. Shang, J.; Yang, G.; Yu, F. Agricultural greenhouse gases emissions and influencing factors in China. Chin. J. Eco-Agric. 2015, 23, 354–364. (In Chinese) [Google Scholar]
  50. Peng, S.; Piao, S.; Bousquet, P.; Ciais, P.; Li, B.; Lin, X.; Tao, S.; Wang, Z.; Zhang, Y.; Zhou, F. Inventory of anthropogenic methane emissions in mainland China from 1980 to 2010. Atmos. Chem. Phys. 2016, 16, 14545–14562. [Google Scholar] [CrossRef]
  51. National Communication. The People’s Republic of China Third National Communication on Climate Change. Available online: https://www.ccchina.org.cn/archiver/NCCCen/UpFile/Files/Default/20200723171538290568.pdf (accessed on 10 May 2023). (In Chinese).
  52. Chen, T.; Pan, J. Estimation and temporal and spatial pattern of anthropogenic CH4 emissions in China. China Environ. Sci. 2022, 42, 5549–5560. (In Chinese) [Google Scholar]
  53. Chen, H.; Zhu, Q.a.; Peng, C.; Wu, N.; Wang, Y.; Fang, X.; Jiang, H.; Xiang, W.; Chang, J.; Deng, X.; et al. Methane emissions from rice paddies natural wetlands, lakes in China: Synthesis new estimate. Glob. Chang. Biol. 2013, 19, 19–32. [Google Scholar] [CrossRef]
  54. Kai, F.M.; Tyler, S.C.; Randerson, J.T. Modeling methane emissions from rice agriculture in China during 1961–2007. J. Integr. Environ. Sci. 2010, 7, 49–60. [Google Scholar] [CrossRef]
  55. Zhang, B.; Chen, G. Methane emissions in China 2007. Renew. Sust. Energ. Rev. 2014, 30, 886–902. [Google Scholar] [CrossRef]
  56. Yue, Q.; Zhang, G.; Wang, Z. Preliminary estimation of methane emission and its distribution in China. Geogr. Res. 2012, 31, 1559–1570. (In Chinese) [Google Scholar]
  57. National Communication. The People’s Republic of China Second National Communication on Climate Change. Available online: https://www.mee.gov.cn/ywgz/ydqhbh/wsqtkz/201904/P020190419524738708928.pdf (accessed on 10 May 2023). (In Chinese)
  58. Fu, C.; Yu, G. Estimation and Spatiotemporal Analysis of Methane Emissions from Agriculture in China. Environ. Manag. 2010, 46, 618–632. [Google Scholar] [CrossRef] [PubMed]
  59. Xie, M.; Wang, T. Modeling of CH4 emission from rice paddies and CO emission from biomass burning and their effects on tropospheric oxidizing capacity in China. Acta. Ecol. Sin. 2007, 27, 4803–4814. (In Chinese) [Google Scholar]
  60. Streets, D.G.; Bond, T.; Carmichael, G.; Fernandes, S.; Fu, Q.; He, D.; Klimont, Z.; Nelson, S.; Tsai, N.; Wang, M.Q. An inventory of gaseous and primary aerosol emissions in Asia in the year 2000. J. Geophys. Res. 2003, 108, 8809. [Google Scholar] [CrossRef]
  61. Zhang, Q.; Ju, X.; Zhang, F. Re-estimation of direct nitrous oxide emission from agricultural soils of China via revised IPCC2006 guideline method. Chin. J. Eco-Agric. 2010, 18, 7–13. (In Chinese) [Google Scholar] [CrossRef]
  62. Lu, Y.; Huang, Y.; Zou, J.; Zheng, X. An inventory of N2O emissions from agriculture in China using precipitation-rectified emission factor and background emission. Chemosphere 2006, 65, 1915–1924. [Google Scholar] [CrossRef]
  63. Yan, X.; Akimoto, H.; Ohara, T. Estimation of nitrous oxide, nitric oxide and ammonia emissions from croplands in East, Southeast and South Asia. Glob. Chang. Biol. 2003, 9, 1080–1096. [Google Scholar] [CrossRef]
  64. Xing, G. N2O emission from cropland in China. Nutr. Cycl. Agroecosyst. 1998, 52, 249–254. [Google Scholar] [CrossRef]
  65. Wang, X.; Li, C. N2O emission from agriculture soil in China. Acta Sci. Circumst. 2000, 20, 483–488. (In Chinese) [Google Scholar]
  66. Li, C.; Zhuang, Y.; Cao, M.; Crill, P.; Dai, Z.; Frolking, S.; Moore, B.; Salas, W.; Song, W.; Wang, X. Comparing a process-based agro-ecosystem model to the IPCC methodology for developing a national inventory of N2O emissions from arable lands in China. Nutr. Cycl. Agroecosyst. 2001, 60, 159–175. [Google Scholar] [CrossRef]
  67. Voigt, C.; Lamprecht, R.E.; Marushchak, M.E.; Lind, S.E.; Novakovskiy, A.; Aurela, M.; Martikainen, P.J.; Biasi, C. Warming of subarctic tundra increases emissions of all three important greenhouse gases–carbon dioxide, methane, and nitrous oxide. Glob. Chang. Biol. 2017, 23, 3121–3138. [Google Scholar] [CrossRef] [PubMed]
  68. Schütz, H.; Seiler, W.; Conrad, R. Processes involved in formation and emission of methane in rice paddies. Biogeochemistry 1989, 7, 33–53. [Google Scholar] [CrossRef]
  69. Schrope, M.; Chanton, J.; Allen, L.; Baker, J. Effect of CO2 enrichment and elevated temperature on methane emissions from rice, Oryza sativa. Glob. Chang. Biol. 1999, 5, 587–599. [Google Scholar] [CrossRef]
  70. Wei, L.; Zhu, Z.; Liu, S.; Xiao, M.; Wang, J.; Deng, Y.; Kuzyakov, Y.; Wu, J.; Ge, T. Temperature sensitivity (Q10) of stable, primed and easily available organic matter pools during decomposition in paddy soil. Appl. Soil. Ecol. 2021, 157, 103752. [Google Scholar] [CrossRef]
  71. Gao, J.; Yan, Y.; Hou, X.; Liu, X.; Zhang, Y.; Huang, S.; Wang, P. Vertical distribution and seasonal variation of soil moisture after drip-irrigation affects greenhouse gas emissions and maize production during the growth season. Sci. Total Environ. 2021, 763, 142965. [Google Scholar] [CrossRef] [PubMed]
  72. Borken, W.; Matzner, E. Reappraisal of drying and wetting effects on C and N mineralization and fluxes in soils. Glob. Chang. Biol. 2009, 15, 808–824. [Google Scholar] [CrossRef]
  73. Li, C.; Xiong, Y.; Huang, Q.; Xu, X.; Huang, G. Impact of irrigation and fertilization regimes on greenhouse gas emissions from soil of mulching cultivated maize (Zea mays L.) field in the upper reaches of Yellow River, China. J. Clean. Prod. 2020, 259, 120873. [Google Scholar] [CrossRef]
  74. Zhang, X.; Zhou, S.; Bi, J.; Sun, H.; Wang, C.; Zhang, J. Drought-resistance rice variety with water-saving management reduces greenhouse gas emissions from paddies while maintaining rice yields. Agric. Ecosyst. Environ. 2021, 320, 107592. [Google Scholar] [CrossRef]
  75. Jia, Z.; Cai, Z. Effects of rice plants on methane emission from paddy fields. J. Appl. Ecol. 2003, 14, 2049–2053. (In Chinese) [Google Scholar]
  76. Akter, M.; Deroo, H.; Kamal, A.M.; Kader, M.A.; Verhoeven, E.; Decock, C.; Boeckx, P.; Sleutel, S. Impact of irrigation management on paddy soil N supply and depth distribution of abiotic drivers. Agric. Ecosyst. Environ. 2018, 261, 12–24. [Google Scholar] [CrossRef]
  77. Shcherbak, I.; Millar, N.; Robertson, G.P. Global metaanalysis of the nonlinear response of soil nitrous oxide (N2O) emissions to fertilizer nitrogen. Proc. Natl. Acad. Sci. USA 2014, 111, 9199–9204. [Google Scholar] [CrossRef] [PubMed]
  78. Li, J.; Nie, M.; Pendall, E. An incubation study of temperature sensitivity of greenhouse gas fluxes in three land-cover types near Sydney, Australia. Sci. Total Environ. 2019, 688, 324–332. [Google Scholar] [CrossRef] [PubMed]
  79. Potter, C.S.; Davidson, E.A.; Verchot, L.V. Estimation of global biogeochemical controls and seasonality in soil methane consumption. Chemosphere 1996, 32, 2219–2246. [Google Scholar] [CrossRef]
  80. Yan, X.; Shi, S.; Du, L.; Xing, G. Pathways of N2O emission from rice paddy soil. Soil Boil. Biochem. 2000, 32, 437–440. [Google Scholar] [CrossRef]
  81. Wang, C.; Li, X.; Min, Q.; Wang, W.; Sardans, J.; Zeng, C.; Tong, C.; Peñuelas, J. Responses of greenhouse-gas emissions to land-use change from rice to jasmine production in subtropical China. Atmos. Environ. 2019, 201, 391–401. [Google Scholar] [CrossRef]
  82. Feng, L.; Palmer, P.I.; Zhu, S.; Parker, R.J.; Liu, Y. Tropical methane emissions explain large fraction of recent changes in global atmospheric methane growth rate. Nat. Commun. 2022, 13, 1378. [Google Scholar] [CrossRef]
  83. Zhang, Y.; Jiang, Y.; Tai, A.P.; Feng, J.; Li, Z.; Zhu, X.; Chen, J.; Zhang, J.; Song, Z.; Deng, A. Contribution of rice variety renewal and agronomic innovations to yield improvement and greenhouse gas mitigation in China. Environ. Res. Lett. 2019, 14, 114020. [Google Scholar] [CrossRef]
  84. Linquist, B.A.; Adviento-Borbe, M.A.; Pittelkow, C.M.; van Kessel, C.; van Groenigen, K.J. Fertilizer management practices and greenhouse gas emissions from rice systems: A quantitative review and analysis. Field Crops Res. 2012, 135, 10–21. [Google Scholar] [CrossRef]
Figure 1. The location of Hainan Island in China.
Atmosphere 14 01547 g001
Figure 2. Boxplot of the ratio of CH4 and N2O per reference to EDGAR data.
Atmosphere 14 01547 g002
Figure 3. EDGARRvised and the uncertainty range of ±σ (σ: standard deviation) for CH4 (a) and N2O (b).
Atmosphere 14 01547 g003
Figure 4. Factor detection results in CH4 (a) and N2O (b).
Atmosphere 14 01547 g004
Figure 5. Detecting results of interaction detector between CH4 (a) and N2O (b).
Atmosphere 14 01547 g005
Figure 6. (a) Scatterplots of the revised CH4 EDGAR emissions data (GHGE,i,j) and CH4 emissions after MLR simulation (GHGsim,i,j). (b) Scatterplots of the revised N2O EDGAR emissions data (GHGE,i,j) and N2O emissions after MLR simulation (GHGsim,i,j).
Atmosphere 14 01547 g006
Figure 7. (a) The regression coefficient of paddy/non-paddy fields area and CH4 emissions. (b) The regression coefficient of paddy/non-paddy fields area and N2O emissions.
Atmosphere 14 01547 g007
Figure 8. GHGintensity and Tmax of CH4 (a) and N2O (b).
Atmosphere 14 01547 g008
Table 1. Interaction relationship between two geographical factors.
InteractionCriteria
Nonlinear–weakenq (X1 ∩ X2) < Min [q (X1), q (X2)]
Unilinear–weakenMin [q (X1), q (X2)] < q (X1 ∩ X2) < Max [q (X1), q (X2)]
Bivariate–enhanceMax [q (X1), q (X2)] < q (X1 ∩ X2)
Independentq (X1 ∩ X2) = q (X1) + q (X2)
Nonlinear–enhanceq (X1 ∩ X2) > q (X1) + q (X2)
Table 2. CH4 emissions datasets of EDGAR and references (unit: Tg yr−1).
YearEDGARReferencesEmissionsBias Correction Coefficient (β)
201813.89Zhang et al. [44]6.400.46
201514.16Huang et al. [45]9.770.69
Gong and Shi [46]11.450.81
201413.95CSBUR 1 [13]7.350.53
Du et al. [47]5.780.41
201213.82Wang et al. [48]8.200.59
201113.83Shang et al. [49]9.690.70
201013.74Shang et al. [49]9.580.70
Peng et al. [50]7.400.54
TNCCC 2 [51]8.730.64
200913.63Shang et al. [49]9.610.71
Chen and Pan [52]11.160.82
200813.42Chen et al. [53]8.100.60
Shang et al. [49]9.530.71
200713.17Kai et al. [54]7.670.58
Zhang et al. [55]5.540.42
200512.87Yue et al. [56]6.990.54
SNCCC 3 [57]7.930.62
200311.59Fu and Yu. [58]5.250.45
200012.65Xie and Wang [59]9.260.73
Streets et al. [60]9.780.77
199016.23Peng et al. [50]10.000.62
198018.88Peng et al. [50]11.200.59
Mean13.99 0.62
1 CSBUR: The People’s Republic of China second biennial update report on climate change. 2 TNCCC: The People’s Republic of China third national communication on climate change. 3 SNCCC: The People’s Republic of China second national communication on climate change.
Table 3. N2O emission datasets of EDGAR and references (unit: Tg yr−1).
YearEDGARReferencesEmissionsBias Correction Coefficient (β)
20070.35Zhang and Jv [61]0.290.81
20050.37SNCCC 1 [57]0.671.82
19970.34Lu et al. [62]0.290.85
19950.36Yan et al. [63]0.481.34
Xing [64]0.401.12
19900.32Wang and Li [65]0.310.98
Li et al. [66]0.310.98
Mean0.35 0.98
1 SNCCC: The People’s Republic of China second national communication on climate change.
Table 4. Correlation between climate factors and GHGintensity from 2009 to 2018 over Hainan Island.
Climate FactorCH4N2O
R2pSxR2pSx
Tmax0.8510.002 *14.20%0.7990.006 *11.14%
Tmin−0.0250.946 −0.1630.652
Tmean0.4190.228 0.2030.575
Prec−0.5040.137 −0.3420.333
Srad0.3600.307 0.1500.680
* Correlation is significant at the 0.01 level.
Disclaimer/Publisher’s Note: The statements, opinions and data contained in all publications are solely those of the individual author(s) and contributor(s) and not of MDPI and/or the editor(s). MDPI and/or the editor(s) disclaim responsibility for any injury to people or property resulting from any ideas, methods, instructions or products referred to in the content.

