Article

A Comparative Investigation of Light Scattering and Digital Holographic Imaging to Measure Liquid Phase Cloud Droplets

School of Mechanical and Precision Instrument Engineering, Xi’an University of Technology, Xi’an 710048, China
*
Author to whom correspondence should be addressed.
Atmosphere 2023, 14(9), 1381; https://doi.org/10.3390/atmos14091381
Submission received: 20 July 2023 / Revised: 25 August 2023 / Accepted: 29 August 2023 / Published: 31 August 2023
(This article belongs to the Special Issue Microphysics of Cloud Processes (MCP))

Abstract

:
The measurement of cloud microphysical parameters plays an important role in describing characteristics of liquid phase clouds and investigating mutual relationships between clouds and precipitation. In this paper, cloud microphysical parameters at Liupan Mountain Weather Station in Ningxia are measured with a high-resolution coaxial digital holographic imager and a fog monitor 120. There are differences in the measurement results between the two instruments. The number concentration measured by the digital holographic imager is about 1.5 times that of the fog monitor 120. However, their Pearson correlation coefficient is above 0.9. Through analysis, we found that the measurement results of the digital holographic imager and fog monitor 120 are differences in 2–4 µm and 7–50µm. For the droplets with the diameters of 4–7 µm, their measurement results have good consistency. By analyzing the influence of wind field and detection sensitivity on the measurement principle, the reasons which caused the difference are proposed. Advice is given to observe topographic clouds by using the above two instruments. In addition, the differences in liquid water content and visibility are analyzed due to the absence of small and large droplets. The study provides data support for improving the accuracy of instruments in measuring cloud droplets and is useful for research in the field of cloud microphysical processes.

1. Introduction

Covering 60–70% of the earth’s surface, clouds are one of the main factors affecting the radiation balance of the earth-atmosphere system [1,2,3,4,5] and climate change [6,7,8,9,10]. Meanwhile, the cloud in the atmosphere remains one of the biggest uncertainties in weather and climate predictions. As cloud microphysical parameters, number concentration (NC), median volume diameter (MVD) and liquid water content (LWC) are important parameters to investigate cloud droplet condensation growth [11,12,13,14], cloud droplet collision growth [15] and turbulence in clouds [16,17]. A deep understanding for cloud microphysical processes plays an essential role in studying precipitation mechanism [18], improving the accuracy of weather forecasts [19] and artificial weather modification [20]. Therefore, obtaining accurate cloud microphysical parameters is increasingly a concern of researchers.
Ground-based and spaceborne remote sensing techniques have been developed considerably over the past few decades. In remote sensing methods, power spectrum data measured by satellites and radars is used to invert to obtain cloud microphysics parameters [21,22,23,24,25,26,27,28,29,30]. Remote sensing methods have the advantage of detecting high-altitude clouds from a long distance [31,32]. However, in the progress of data inversion, properties of cloud droplets need to be assumed [33,34]. Therefore, realistic droplet spectrum and cloud microphysical parameters cannot be obtained, and their measurement accuracy needs to be further verified.
Presently, in situ measurement is still the most accurate method to detect droplets in liquid clouds. Methods for in situ measurement include light scattering and holographic imaging. The measurement methods based on light scattering exploit the intensity of forward scattered light from individual droplets to determine the size of droplets [35]. Instruments based on the method are, for example, the fog monitor 100 (FM100) and the fog monitor 120 (FM120). An important feature of the fog monitor is that tiny cloud droplets down to 2 µm can be detected using forward scattering technology. However, Spiegel et al. [36] found that FM100 had the potential for droplet loss during sampling from surrounding air and calculated the loss efficiency through theoretical derivation. As a non-contact three-dimensional measurement technology, digital holographic imaging has been successfully used in the field of three-dimensional motion of particles [37,38,39,40,41,42], cloud droplets detection [43,44] and biological cell imaging [45,46,47,48,49]. Madeline et al. [43] observed the space structure and droplet size distribution at the smallest turbulence by using airborne holographic imaging. Henneberger et al. [44] used in-line digital holography to insitu image cloud droplets in a defined sample volume. However, for these holographic instruments, the detection limit of the minimum droplet is above 6 µm because of the limit of optical magnification.
In this paper, a coaxial digital holographic imager (DHI) with a high optical magnification is used to detect cloud droplets of 2–50 µm in warm clouds. We compare the DHI with the FM120 by three parallel measurements. Firstly, the correlation analysis of the cloud microphysical parameters measured by them is performed to verify the reliability of the measurement results. Then we compare the drop size distribution (DSD) from DHI and FM120, and find FM120 may exist in the circumstance for droplet loss. We make a reasonable analysis of the causes of droplet loss. In addition, the differences in liquid water content and visibility are analyzed due to the absence of small and large droplets. The study result of this paper provides data support for improving the accuracy of instruments in measuring cloud droplets and contributes to investigation in the field of cloud microphysical processes and artificial weather modification.

2. Theory

According to cloud microphysics theory, common cloud microphysical parameters that can characterize cloud and fog are NC, MVD and LWC. They are obtained from
NC = N V MVD = d m LWC = i = 1 N 4 π ρ c 3 V d i 2 3 ,
where V is the volume of the sampling space, N is the total number of droplets in the sampling space, ρc is the density of liquid water. The MVD is the size of the droplet, below which 50% of the total volume of droplets reside. All the droplets in the sampling space are arranged in ascending order, like this d1 < d2 < d3 <…< di <…< dN, where di is the diameter of the i-th particle. When Equation (2) is satisfied, the diameter of the m-th particle (dm) is the MVD. Equation (2) is given by
1 2 i = 1 N 4 3 π d i 2 3 = i = 1 m 4 3 π d i 2 3 .
In addition, the visibility is one of the important meteorological parameters, which reflects the number concentration of small droplets. It can be obtained as [50]
R m = 2.99 k ex k ex = i = 1 k π d 2 2 N C ,
where Rm is the visibility, kex is the extinction coefficient. The observed droplets are categorized into 30 size bins from 2 µm to 50 µm. The average diameter of droplets in every size bin is expressed as d′, the NC′ is the number concentration of droplets in each size bin, k is the number of bin sizes (k = 30). To accurately obtain these cloud microphysical parameters, we need to obtain V, N and the diameter of each particle in the sampling space. Digital holographic imaging measurement and forward Mie scattering measurement can realize this.
Due to its advantages such as large recording range, high space bandwidth utilization, large information density and simple optical path, coaxial DHI is widely used in the three-dimensional measurement of tiny objects. When droplets are irradiated by a plane light wave, the diffracted light of droplets (as the object light wave) interferes with the plane light (as the reference light wave) to form hologram images, which are recorded by a Complementary Metal Oxide Semiconductor (CMOS). Unlike the two-dimensional imaging, holograms record three-dimensional information of droplets. A reconstruction image with the reconstruction distance zr can be formed by using numerical reconstruction, given by [51]
U R u , v = 1 j λ R x , y I H x , y exp j k u x 2 + v y 2 + z r 2 u x 2 + v y 2 + z r 2 d x d y ,
where λ is the laser wavelength, R(x, y) is the intensity of reference light, IH(x, y) is the intensity of holograms, k is the wave number, zr is the reconstruction distance. On the reconstruction plane, droplets with the reconstruction distance zr are focused, but the other droplets are out of focus. Focused droplets on reconstruction images are identified by the image detection algorithm to obtain the three-dimensional coordinates and diameter of droplets.
Mie scattering theory shows that when irradiated by a laser beam, a spherical tiny droplet can scatter light in all directions centered on the droplet. The intensity of the scattered light is related to the size of the droplets within a certain small angle, and the power of the scattered light is obtained from [52]
P = I 0 λ 2 2 π θ 1 θ 2 1 2 S 1 x , m , θ 2 + S 2 x , m , θ 2 sin θ d θ ,
where I0 is the intensity of the laser beam, λ is the laser wavelength, θ1 and θ2 are the collection angle of the scattered light. The S1(x, m, θ) and S2(x, m, θ) are the Mie scattering complex amplitude functions, calculated by using Mie equations [53]. The complex refractive index of droplets is expressed as m. The x is the scale parameter of the droplet, given by
x = π d p λ ,
where dp is the diameter of the droplet. By Equations (4) and (5), when I0, λ, θ1, θ2 and m are determined, the P is only related to dp. Tsonis et al. [54] calculated the scattering intensity of 1 µm–50 µm spherical droplets with the forward scattering angle of 3°–12.7°. Due to the quantitative relationship between scattering intensity and the diameter of droplets, the Mie scattering intensity can be used to inverse the diameter of droplets. However, the relationship is non-monotonic, i.e., droplets of different sizes can produce the same scattering intensity in multiple size ranges, which can lead to inaccuracy of measurements.

3. Methods

The study to verify and compare FM120 with DHI was conducted at the Liupan Mountain weather station (35°40′ N, 106°12′ E) in the Ningxia Hui Autonomous, China, from 15 July to 15 September 2022. The station is located in the southern mountains of Liupan Mountain, at an altitude of 2840 m, which suits in-cloud measurement well. The measurement data required for this study, including number concentration, median volume diameter, liquid water content, droplets size distribution and visibility, is all derived from real cloud weather processes. The inspiratory sampling method of the FM120 can disturb the surrounding airflow field. In order to avoid the influence, the distance between DHI and FM120 is set to 5 m, as shown in Figure 1.

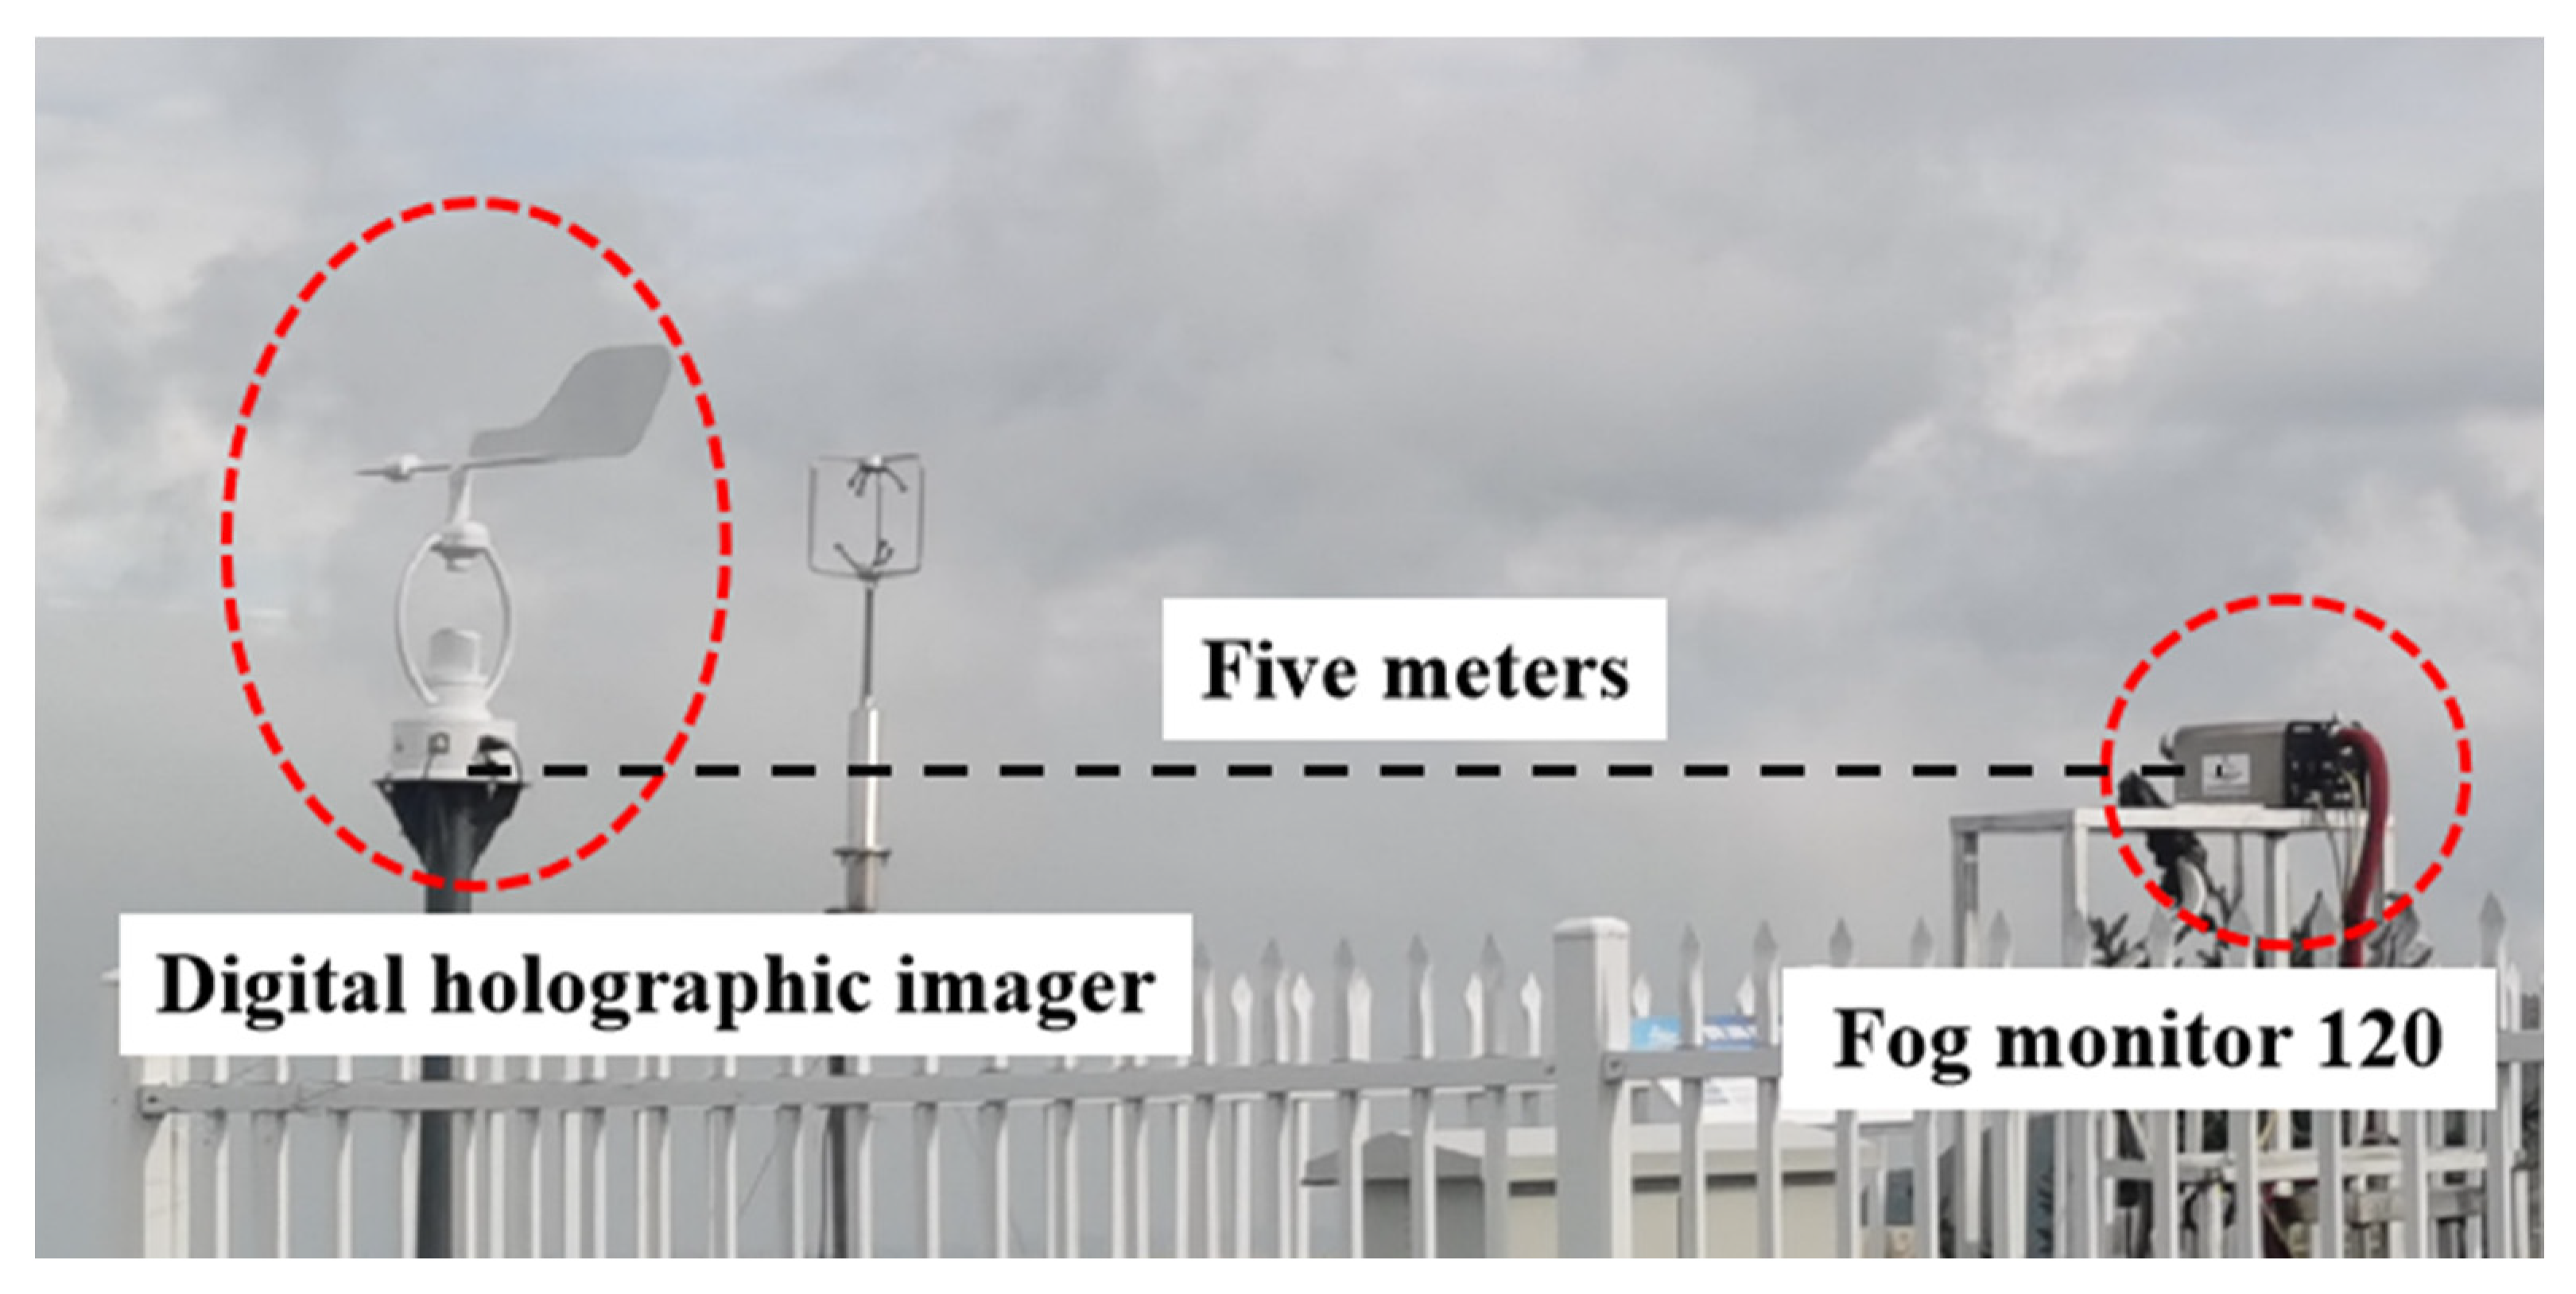
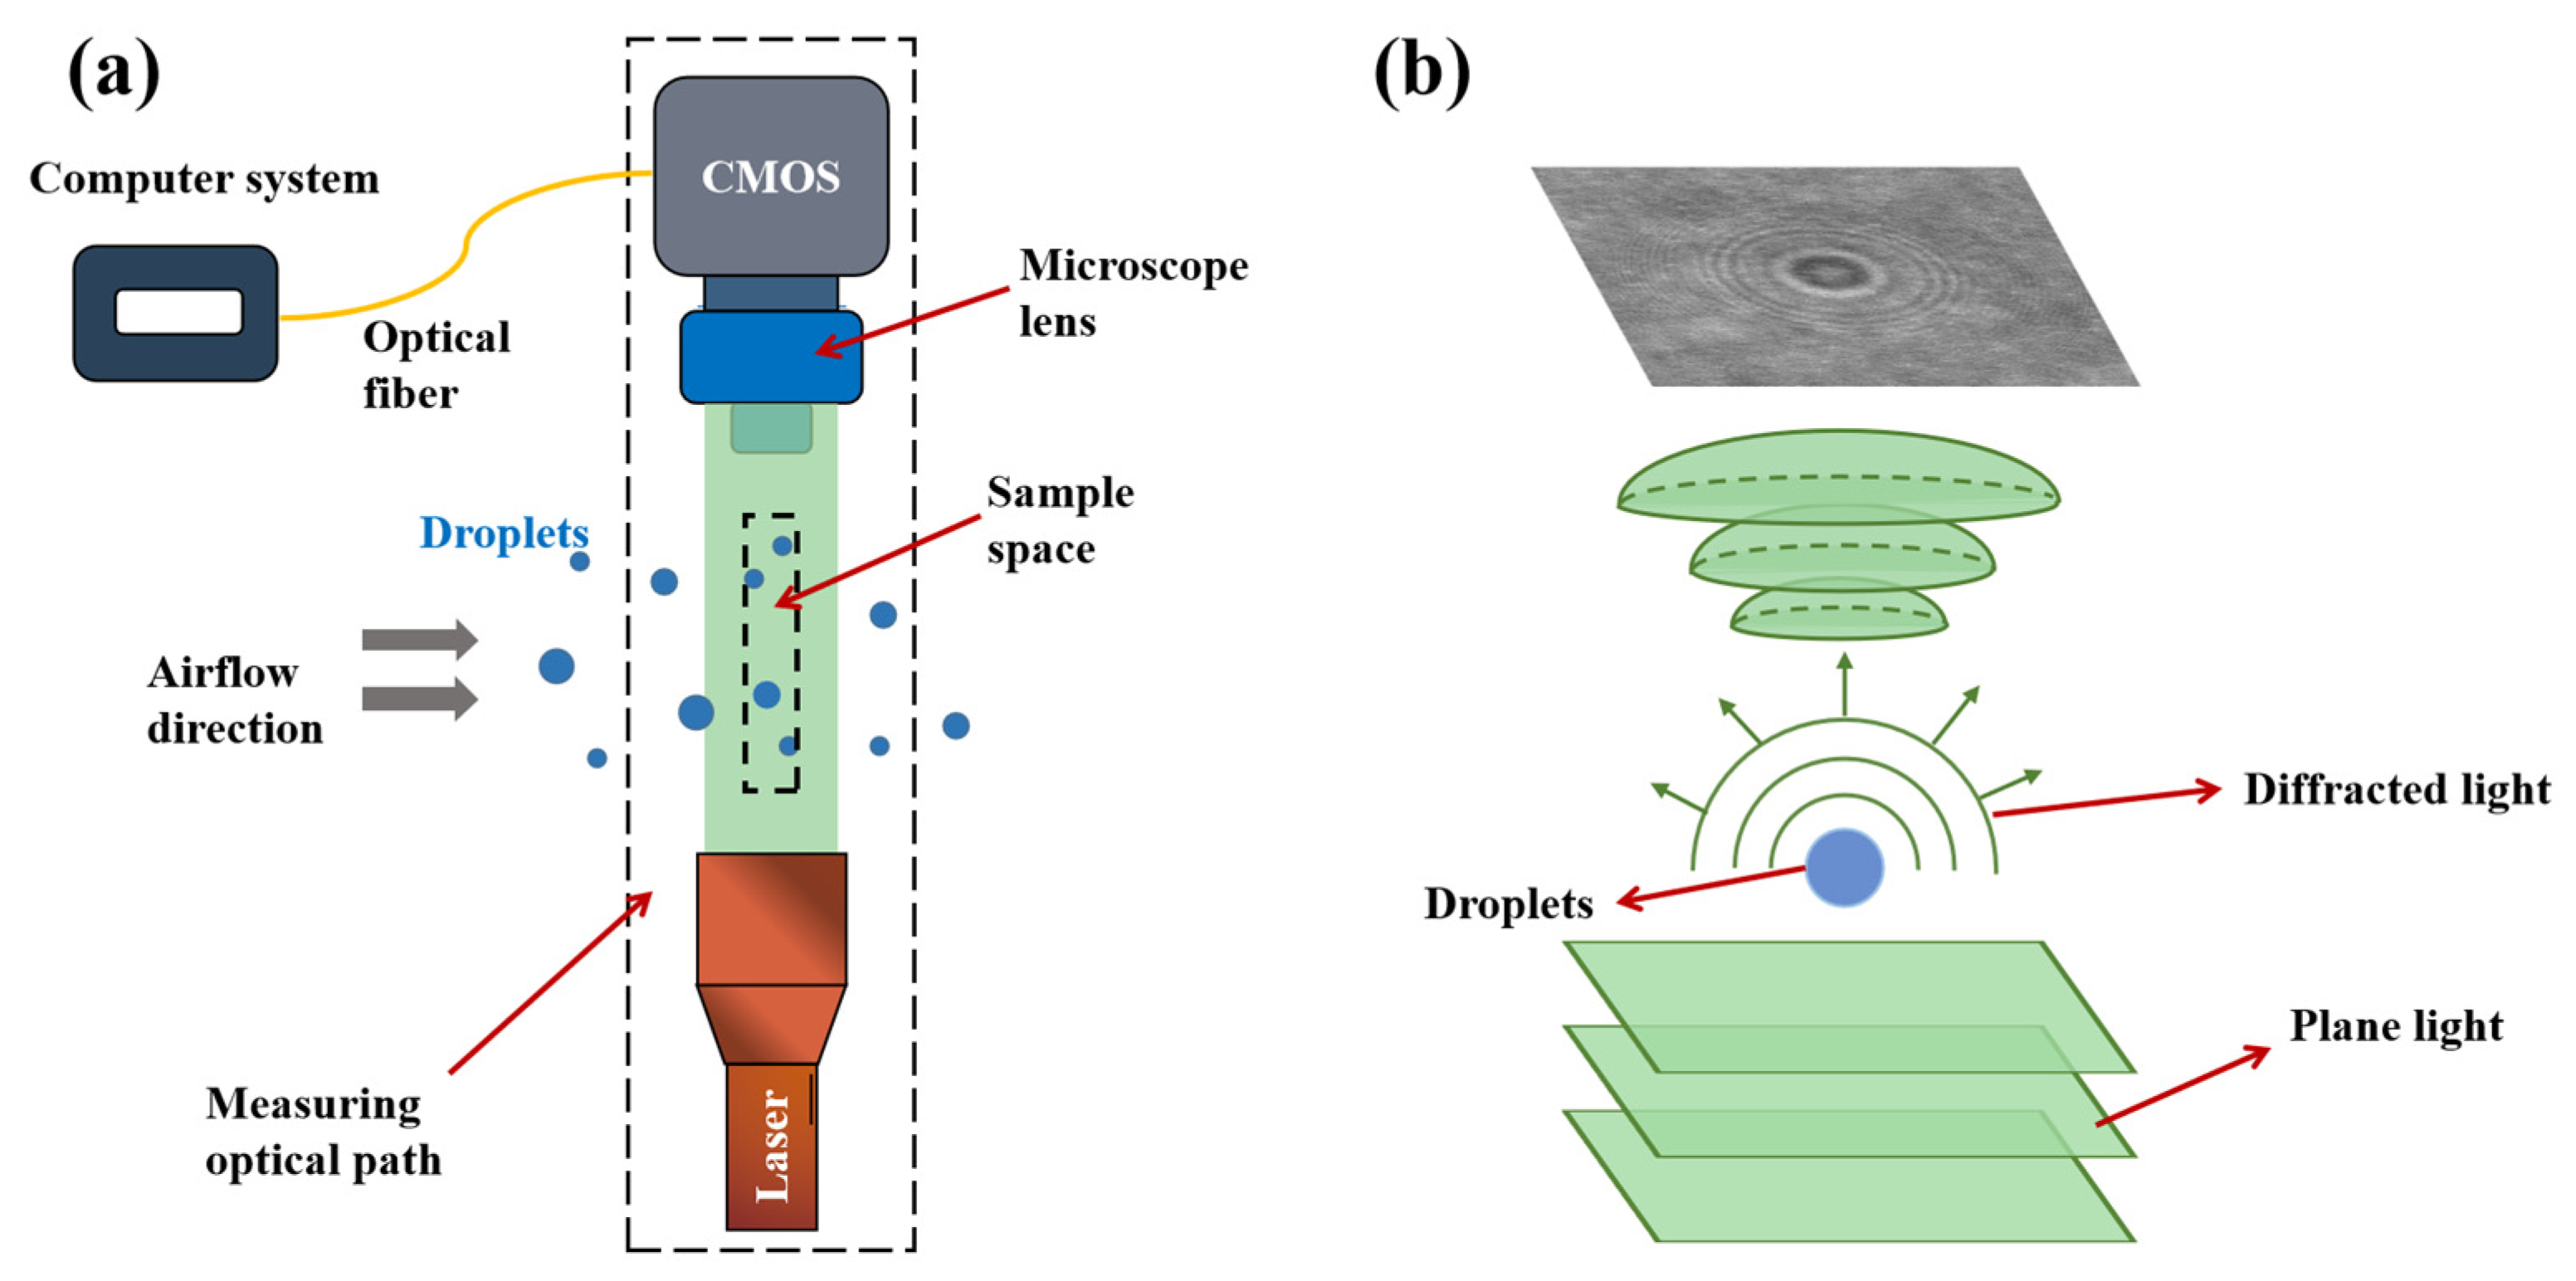
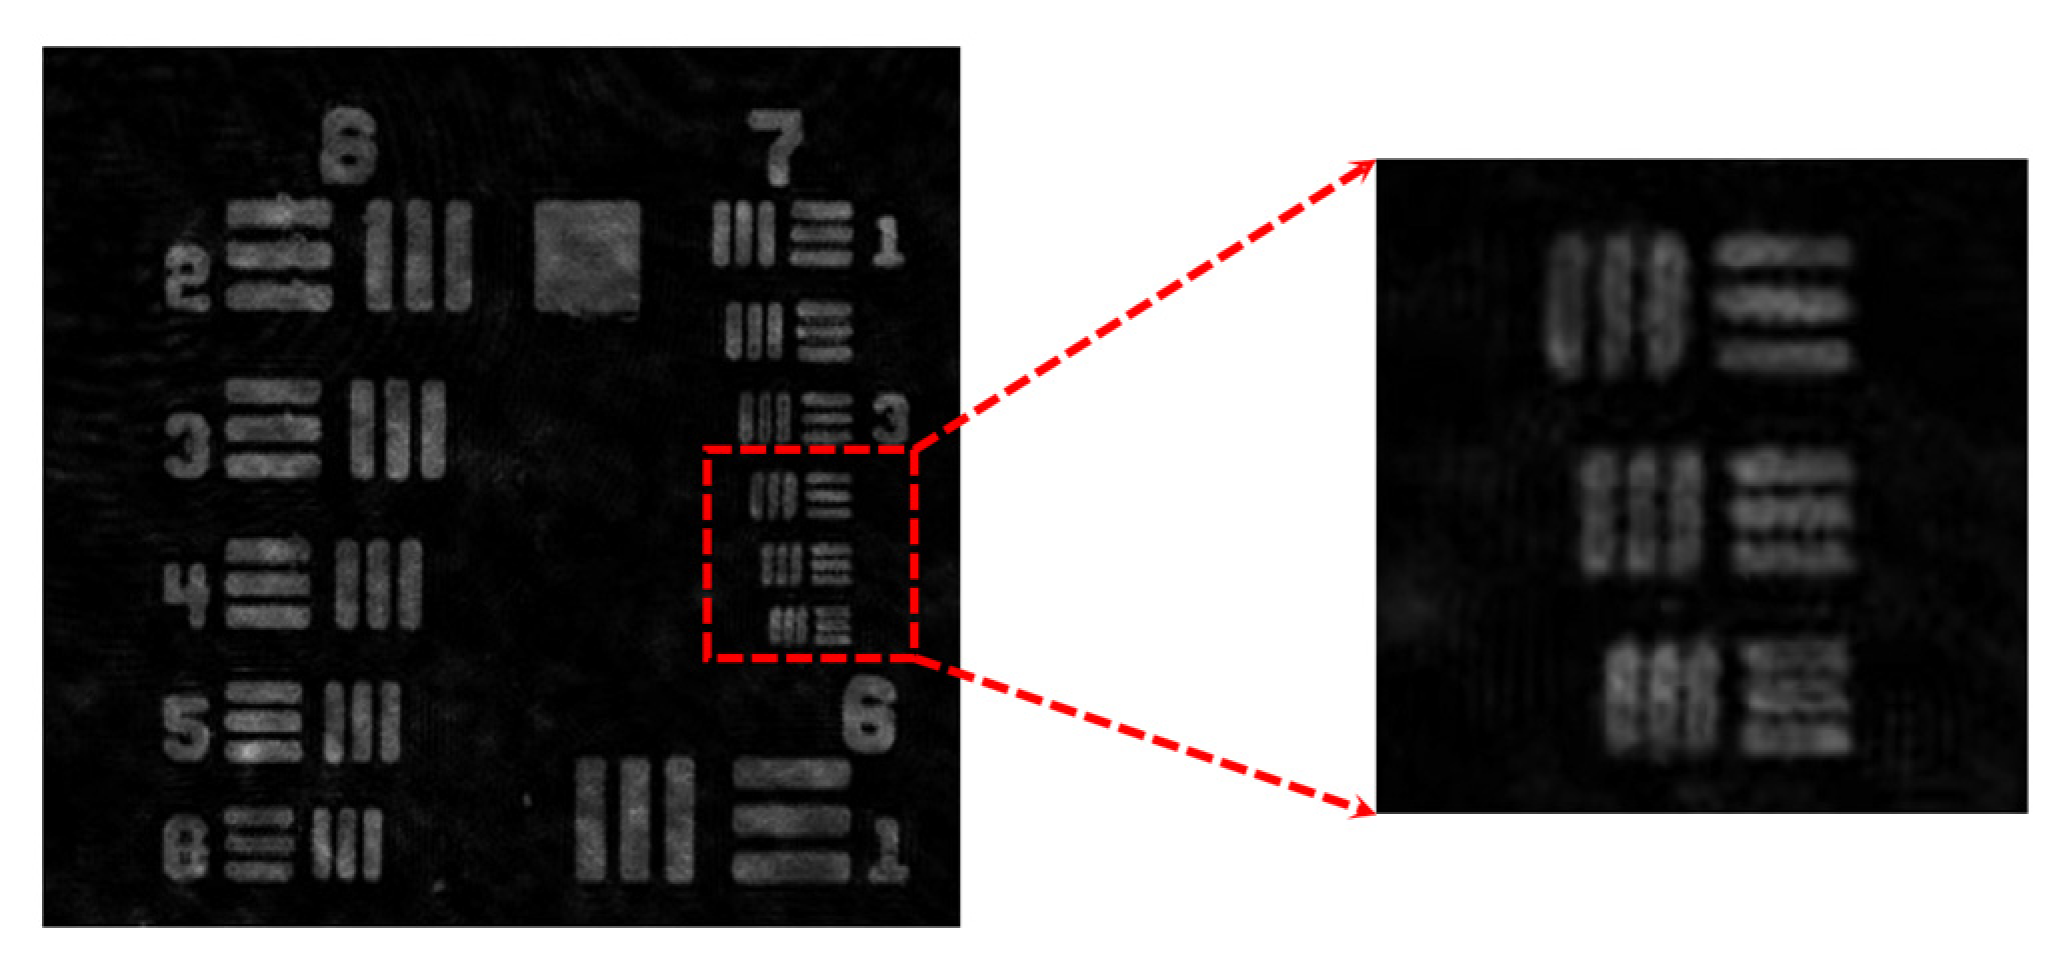
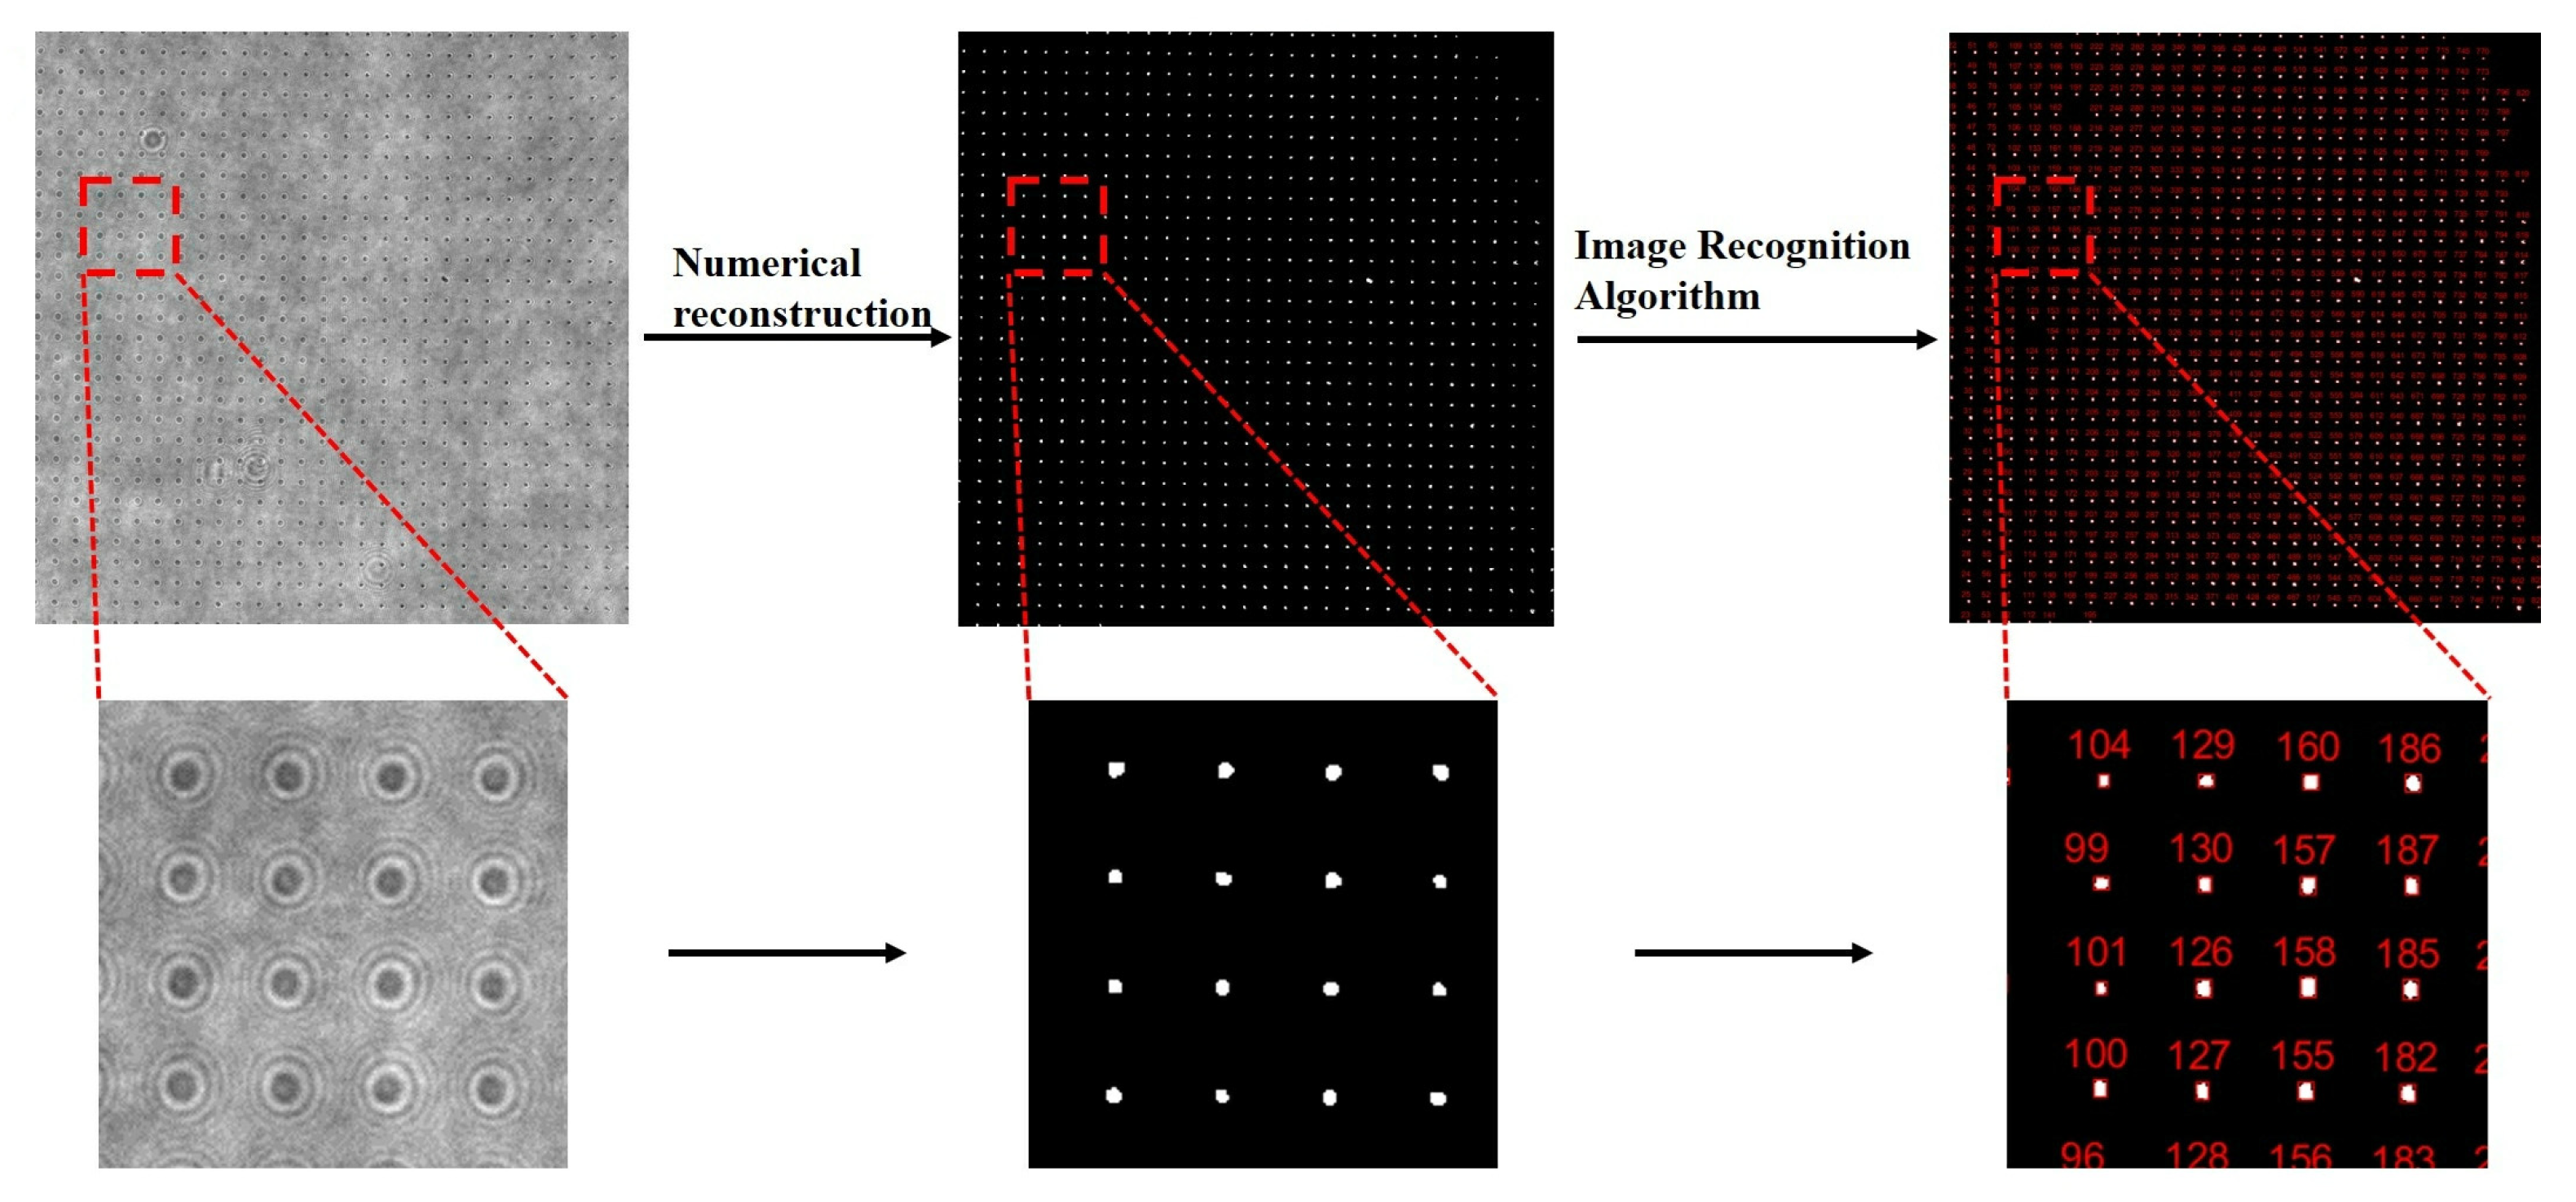
3.1. Digital Holographic Imager (DHI)

The schematic of the working function of DHI is shown in Figure 2a. A semiconductor pulsed laser is used as the light source. Figure 2b shows the recording process of holograms. The plane light emitted by the laser irradiates the measured cloud droplets. The droplet diffracted light interferes with the plane light to form an interference image (hologram image), which is magnified by a microscope lens. When droplets get through the sampling space, holograms containing particles information are recorded by a CMOS, and are transmitted to the computer system for numerical reconstruction. The background of the original hologram is subtracted, and the preprocessed grayscale image is numerically reconstructed to obtain binarized reconstruction images using algorithm software based on Gao, P. [55]. The droplet recognition algorithm is used for cloud droplet detection in reconstruction images. By droplet identification, the x, y and z axis coordinates and diameters of droplets are obtained. The CMOS is connected to the computer system through an optical fiber to realize the real-time processing of holograms.
To verify the optical resolution of DHI within the sampling space, the measuring optical path shown in Figure 2a is used to observe the USAF1951 resolution plate. The direction along the laser beam is the z-axis. The zero point of the z-axis is set on the focal plane of the microscope lens. Figure 3 shows a reconstructed image of the USAF1951 resolution plate at 0 mm on the z-axis. The thinnest distinguishable line is labeled 7–6, and the corresponding line width is 2.19 µm. Therefore, the size of the minimum particle that DHI can detect is about 2 µm. In addition, to verify the accuracy of spherical particles recognition under the condition of high number concentration, particles of 2 µm on the standard particle diffraction plate are observed. Those particles are arranged in a square matrix at a distance of 16 µm. Figure 4 shows the holographic reconstruction results of the 2 µm standard particle diffraction plate and the reconstruction process of particles. There are a total of 840 particles on the standard particle diffraction plate. In Figure 4, there are 798 particles identified and their average diameter is 2.05 µm. The accuracy of particles recognition is 95%. In clouds of natural environment, the number of droplets of different sizes in the sampling space of DHI is usually less than 30. Therefore, the accuracy of particles recognition in the natural environment will be higher.

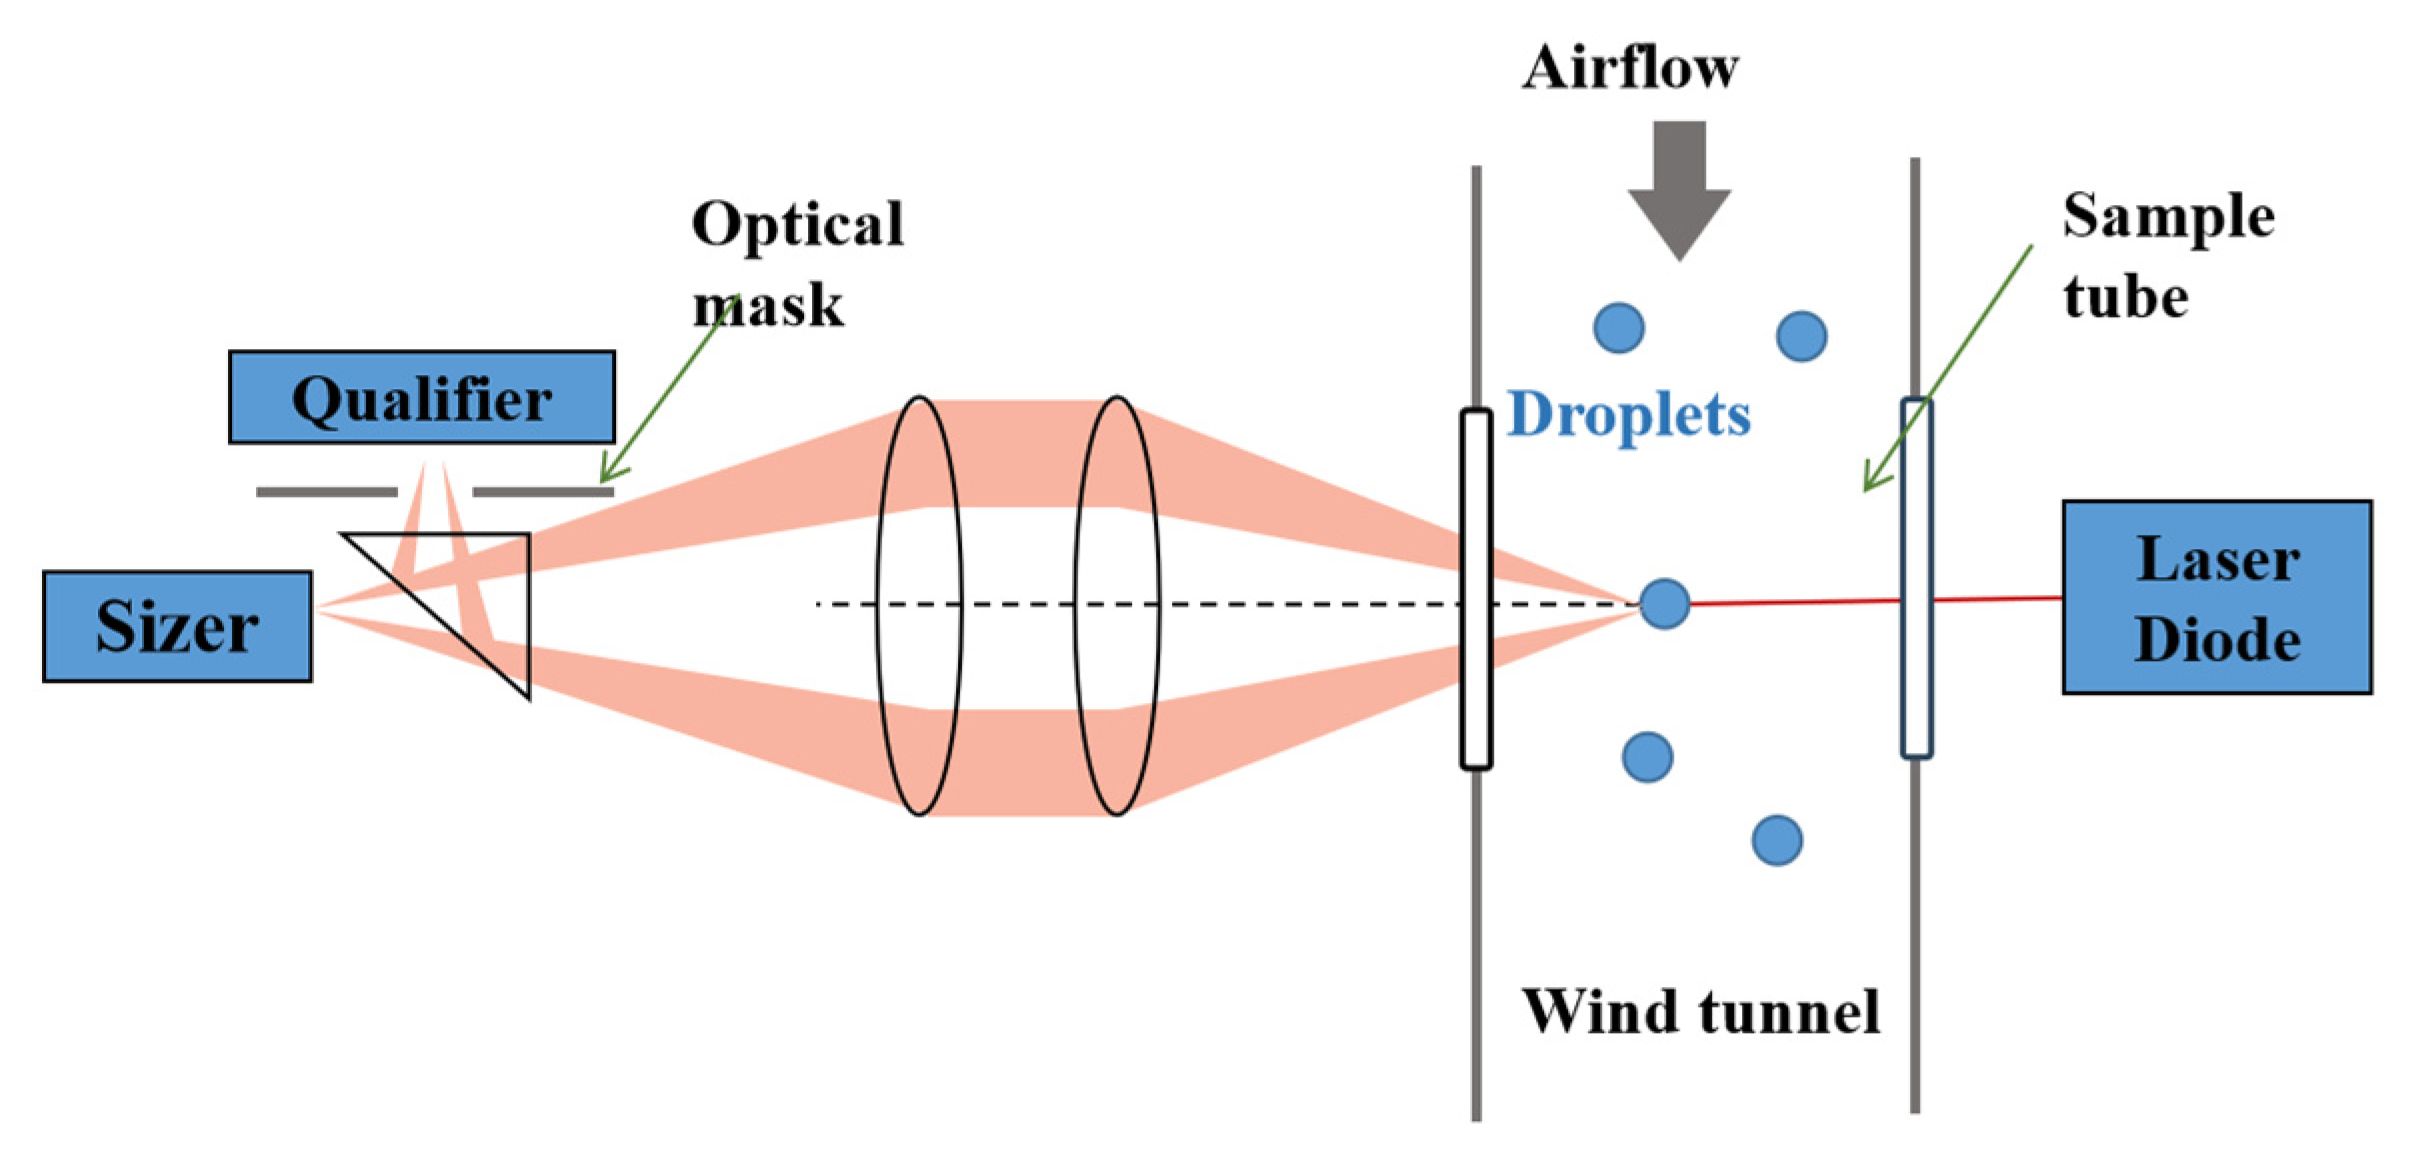
3.2. The Fog Monitor (FM120)

FM120 (a forward scattering optical spectrometer), produced by American DMT company, can continuously sample and measure the surrounding air filled with cloud and fog droplets. Its measurement range of droplets is 2 µm–50 µm. So far, FM120 has been widely used in alpine stations for detection of meteorological parameters [56,57,58]. The schematic of the working function of FM120 is shown in Figure 5. Cloud droplets are pumped into the wind tunnel of the instrument and reach the measuring region inside the sample tube. As they pass through the laser beam, photons are scattered in all directions. The forward-scattered light on a cone is collected, and directed to a beam splitting prism, and finally transmitted to a pair of photodetectors, Size and Qualifier. Photon detectors convert photon pulses into voltage pulses and record them. If the voltage pulse signal from the Qualifier detector is bigger than half of the pulse signal from the Size detector, the droplets will be considered to be in the Depth of Field. The intensity of the pulse from photon detectors is described by the scattering cross-section, and the quantitative relationships between the diameter of droplets and the scattering cross-section are established by using Mie theory.

4. Results and Analysis

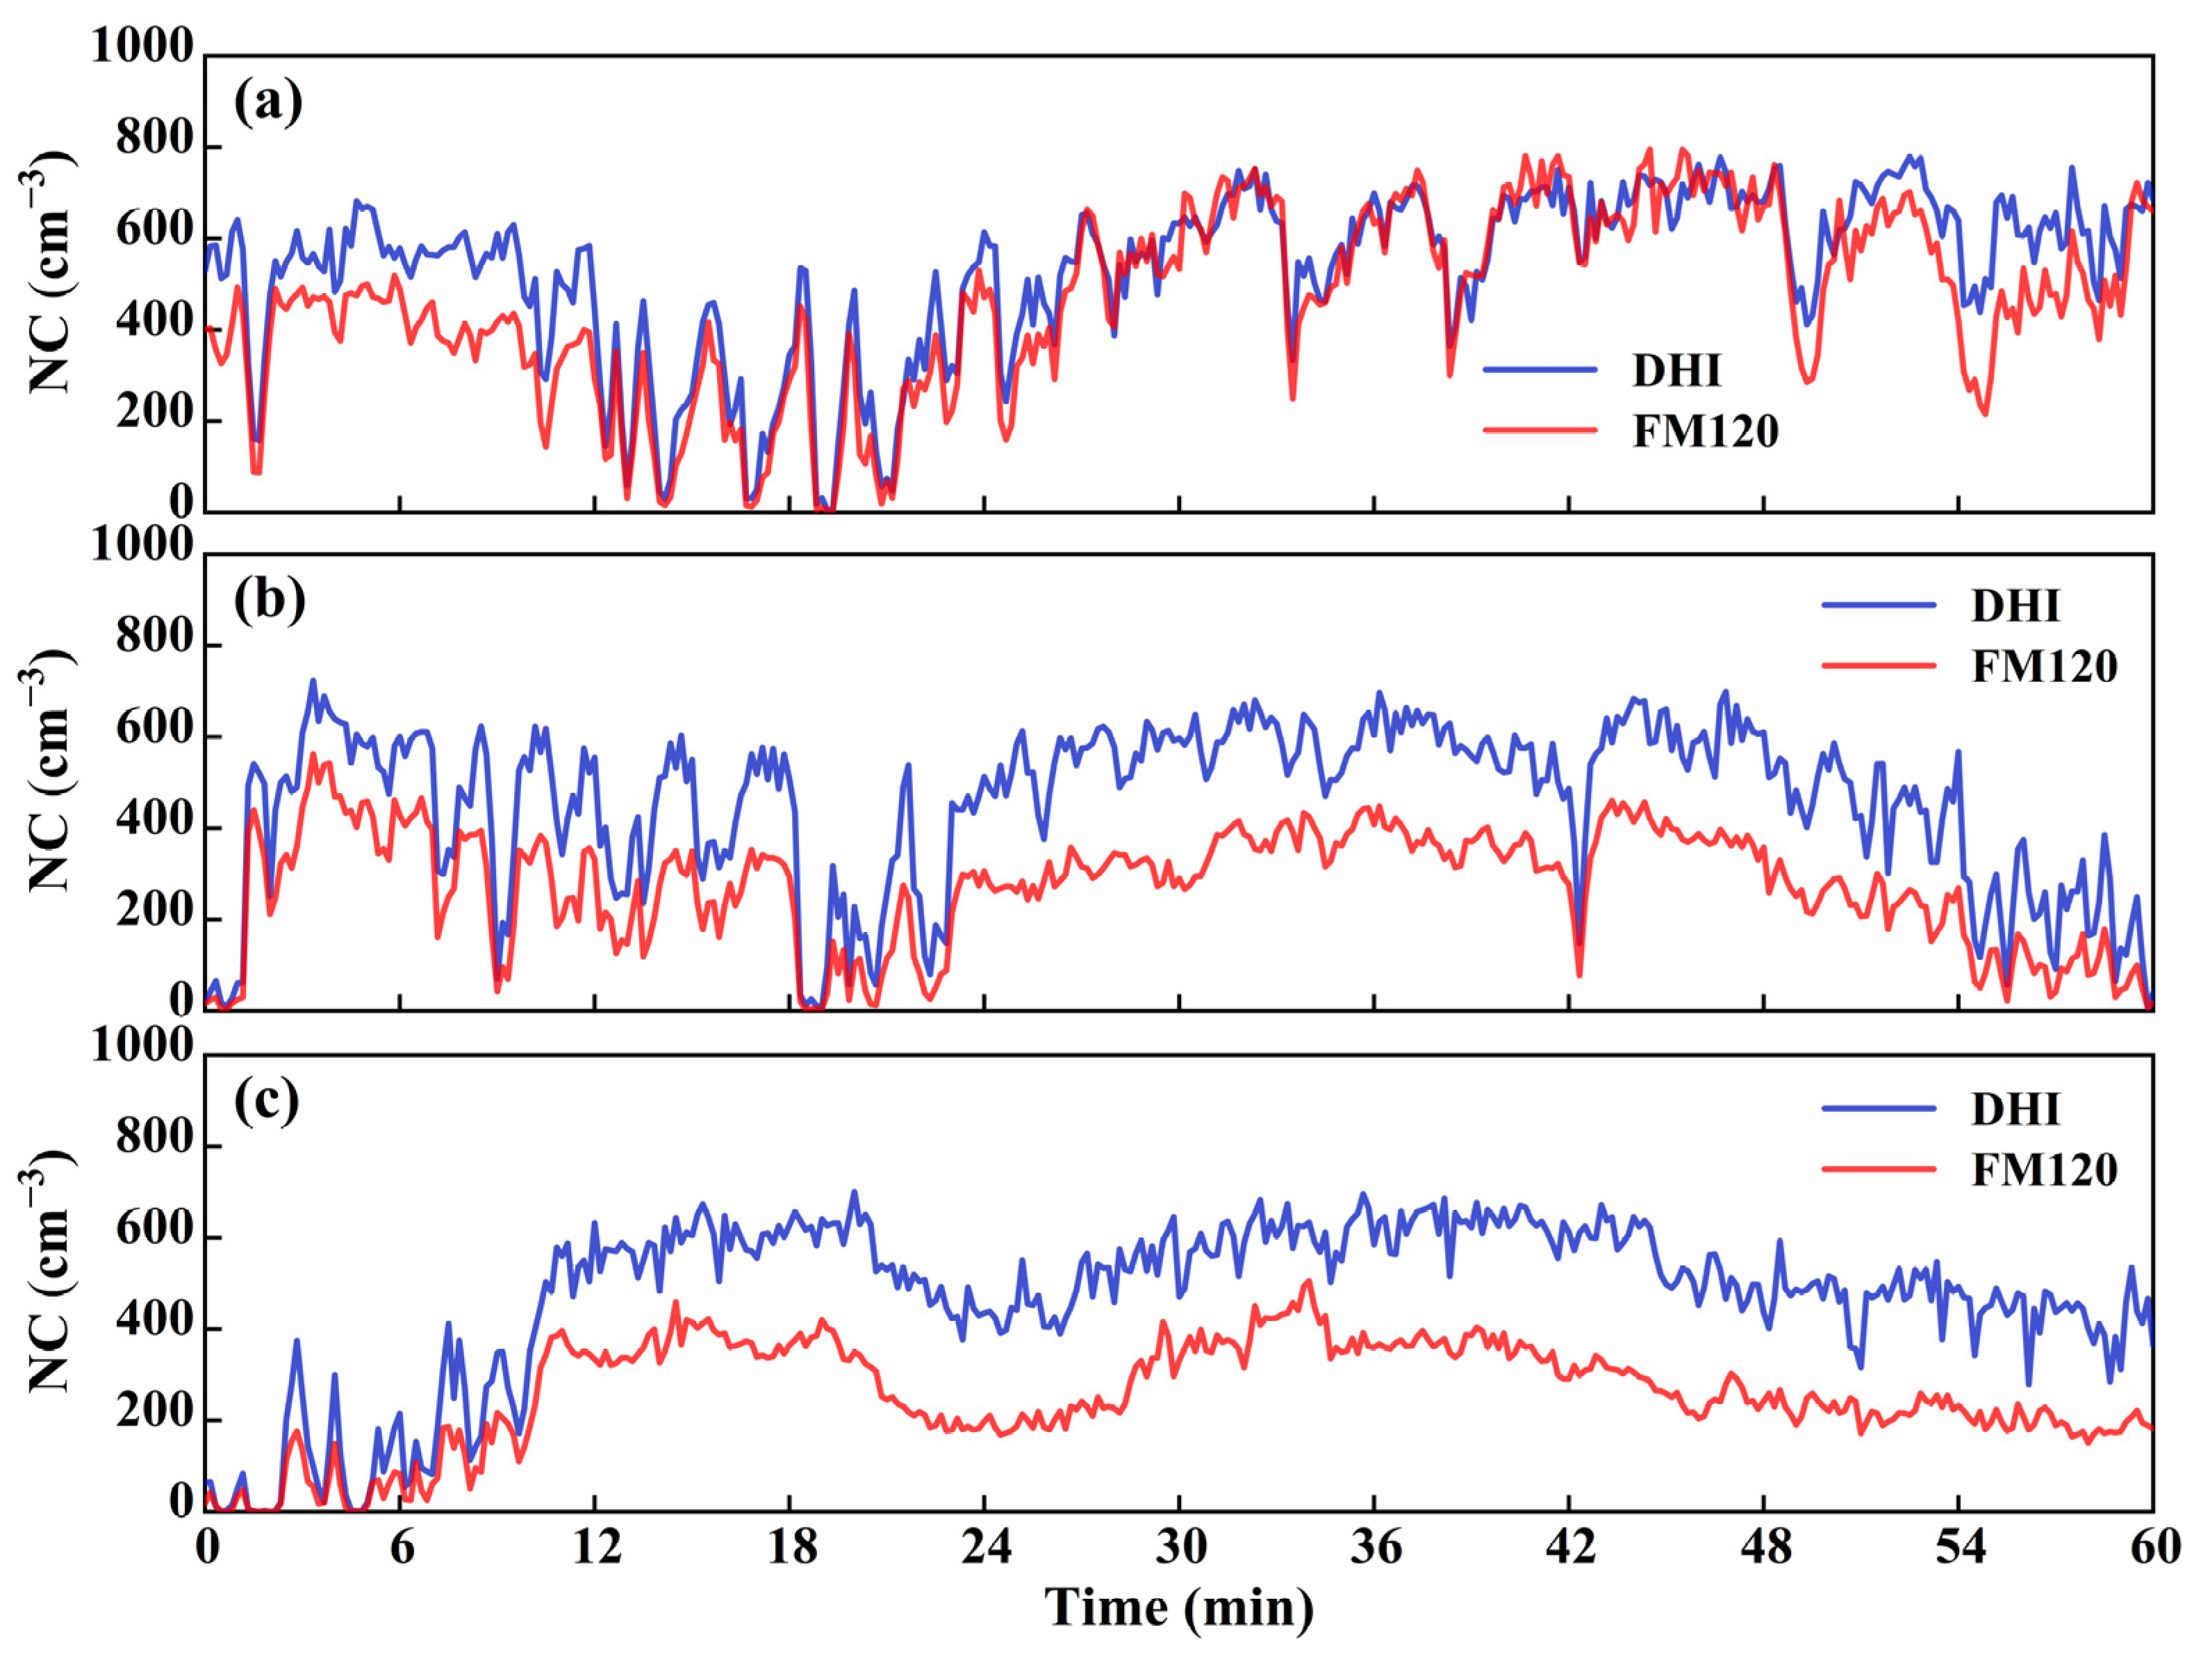
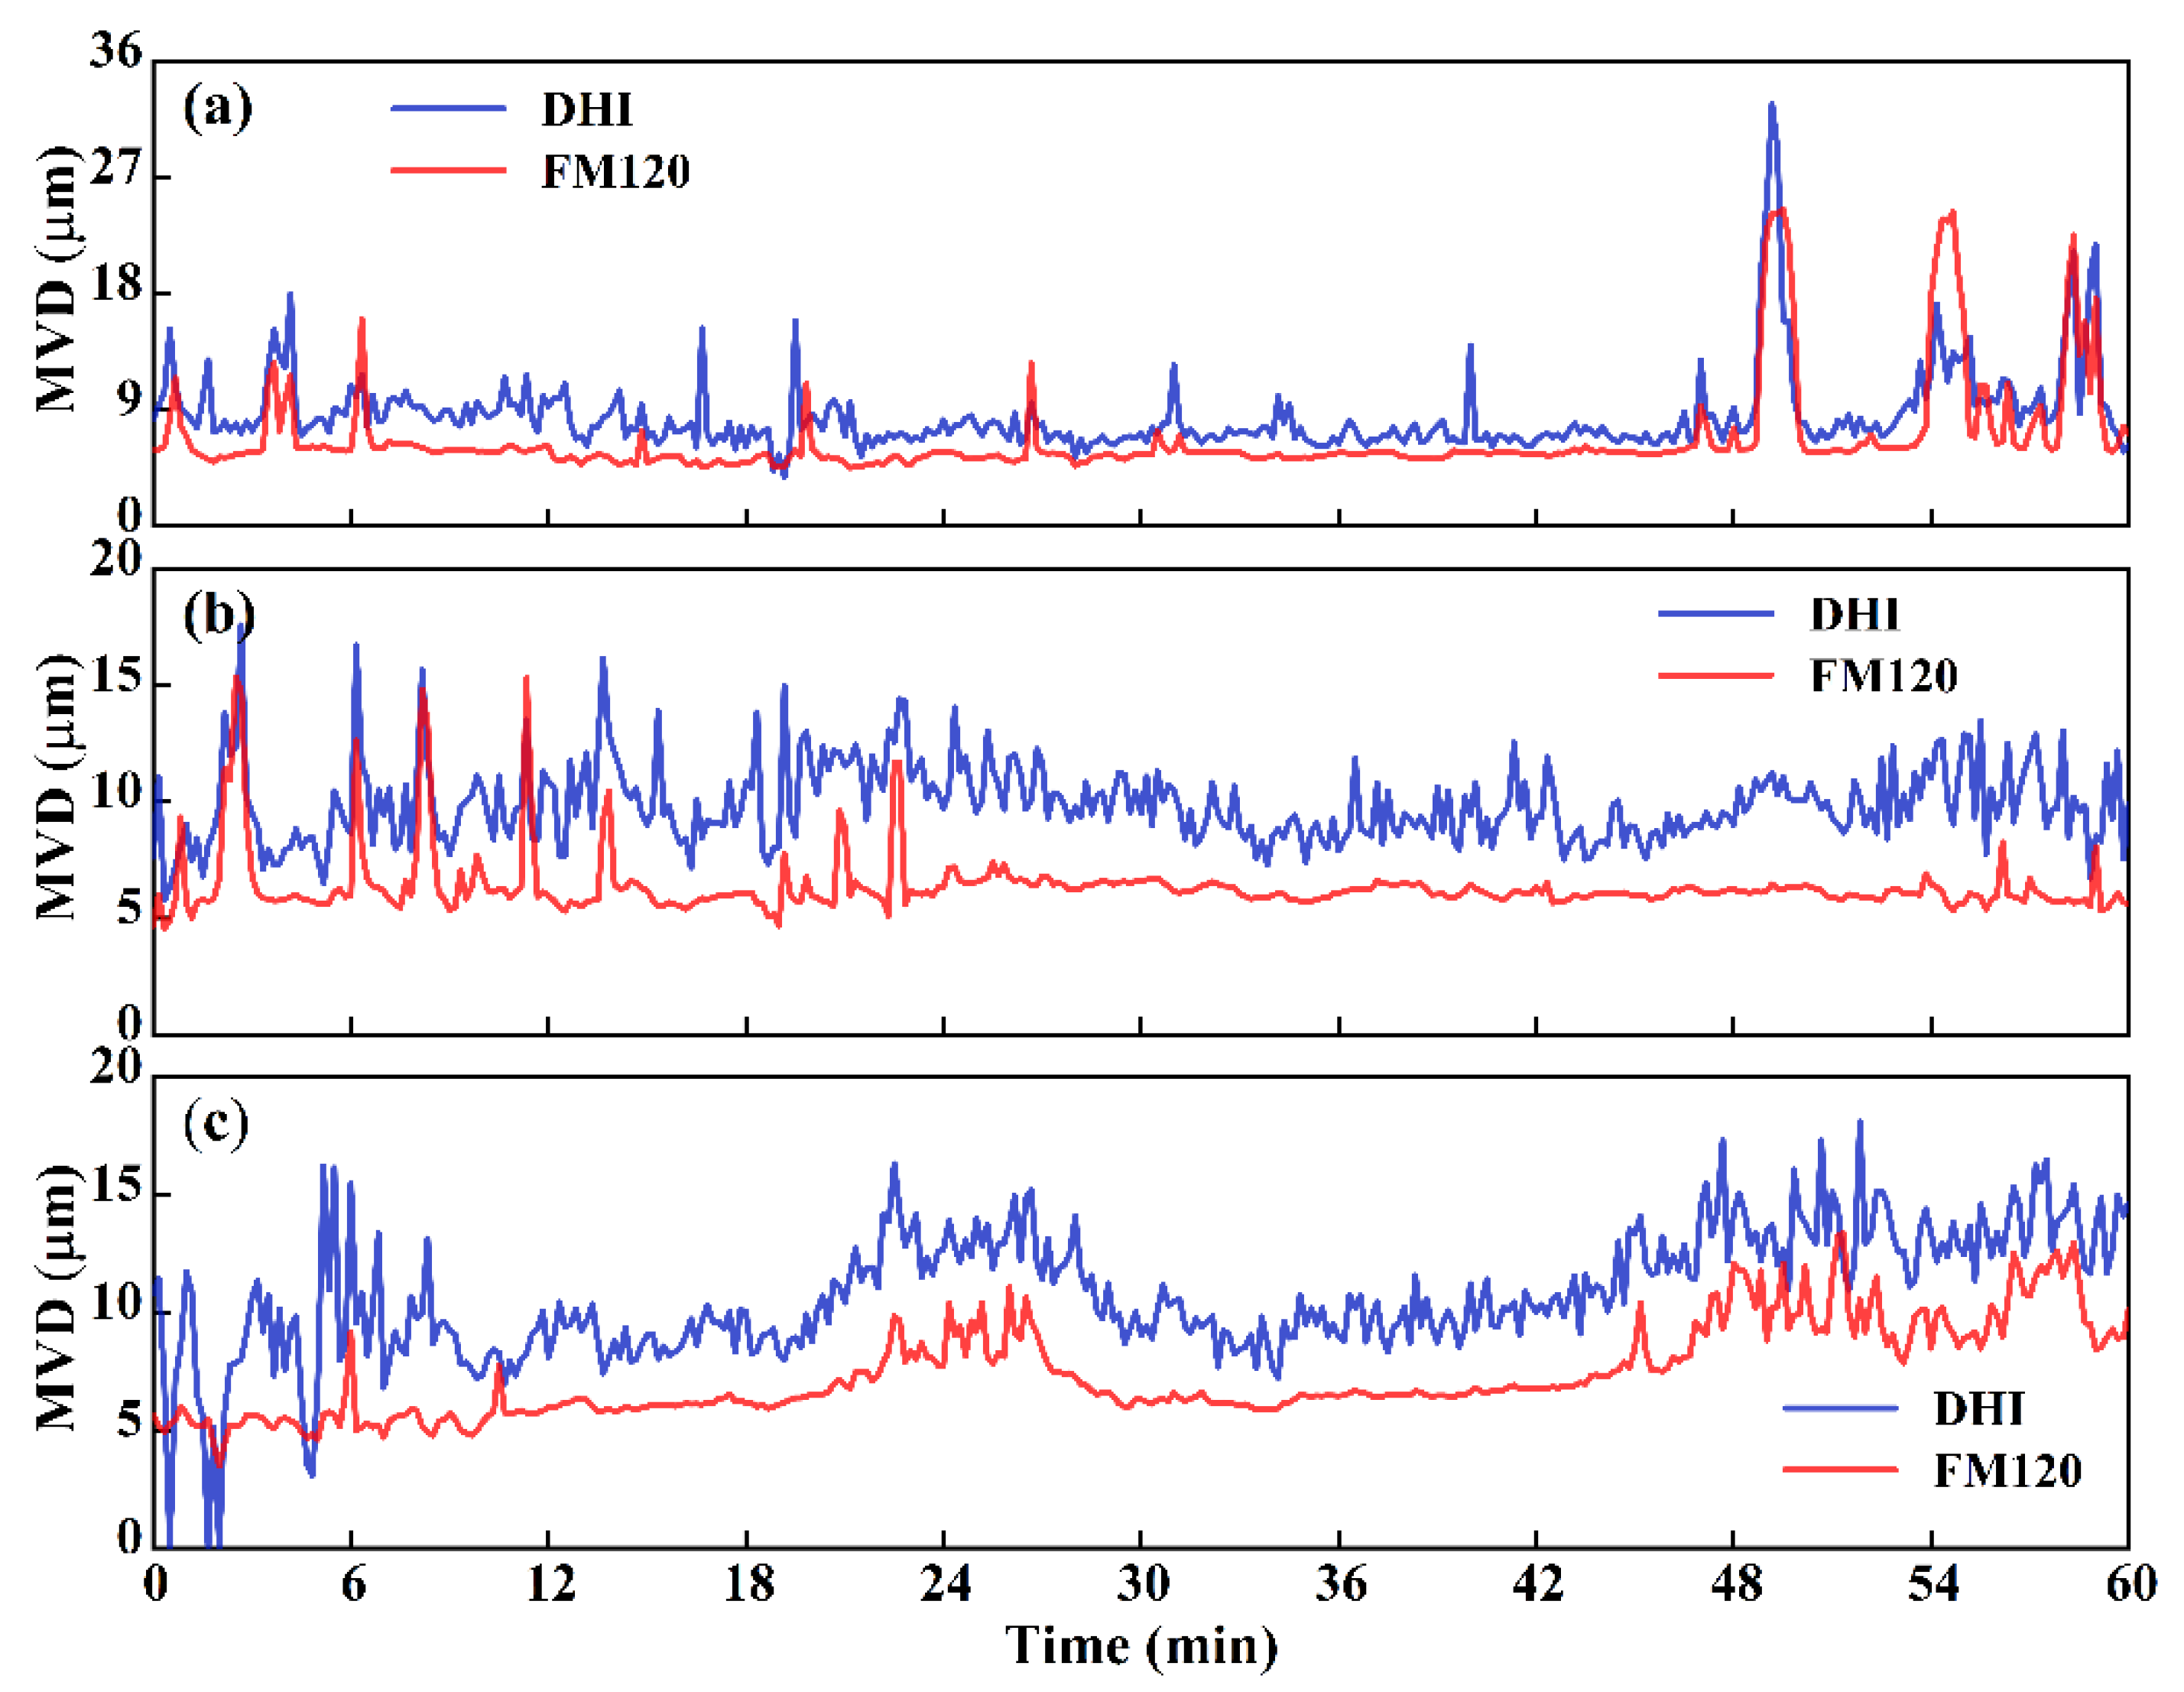
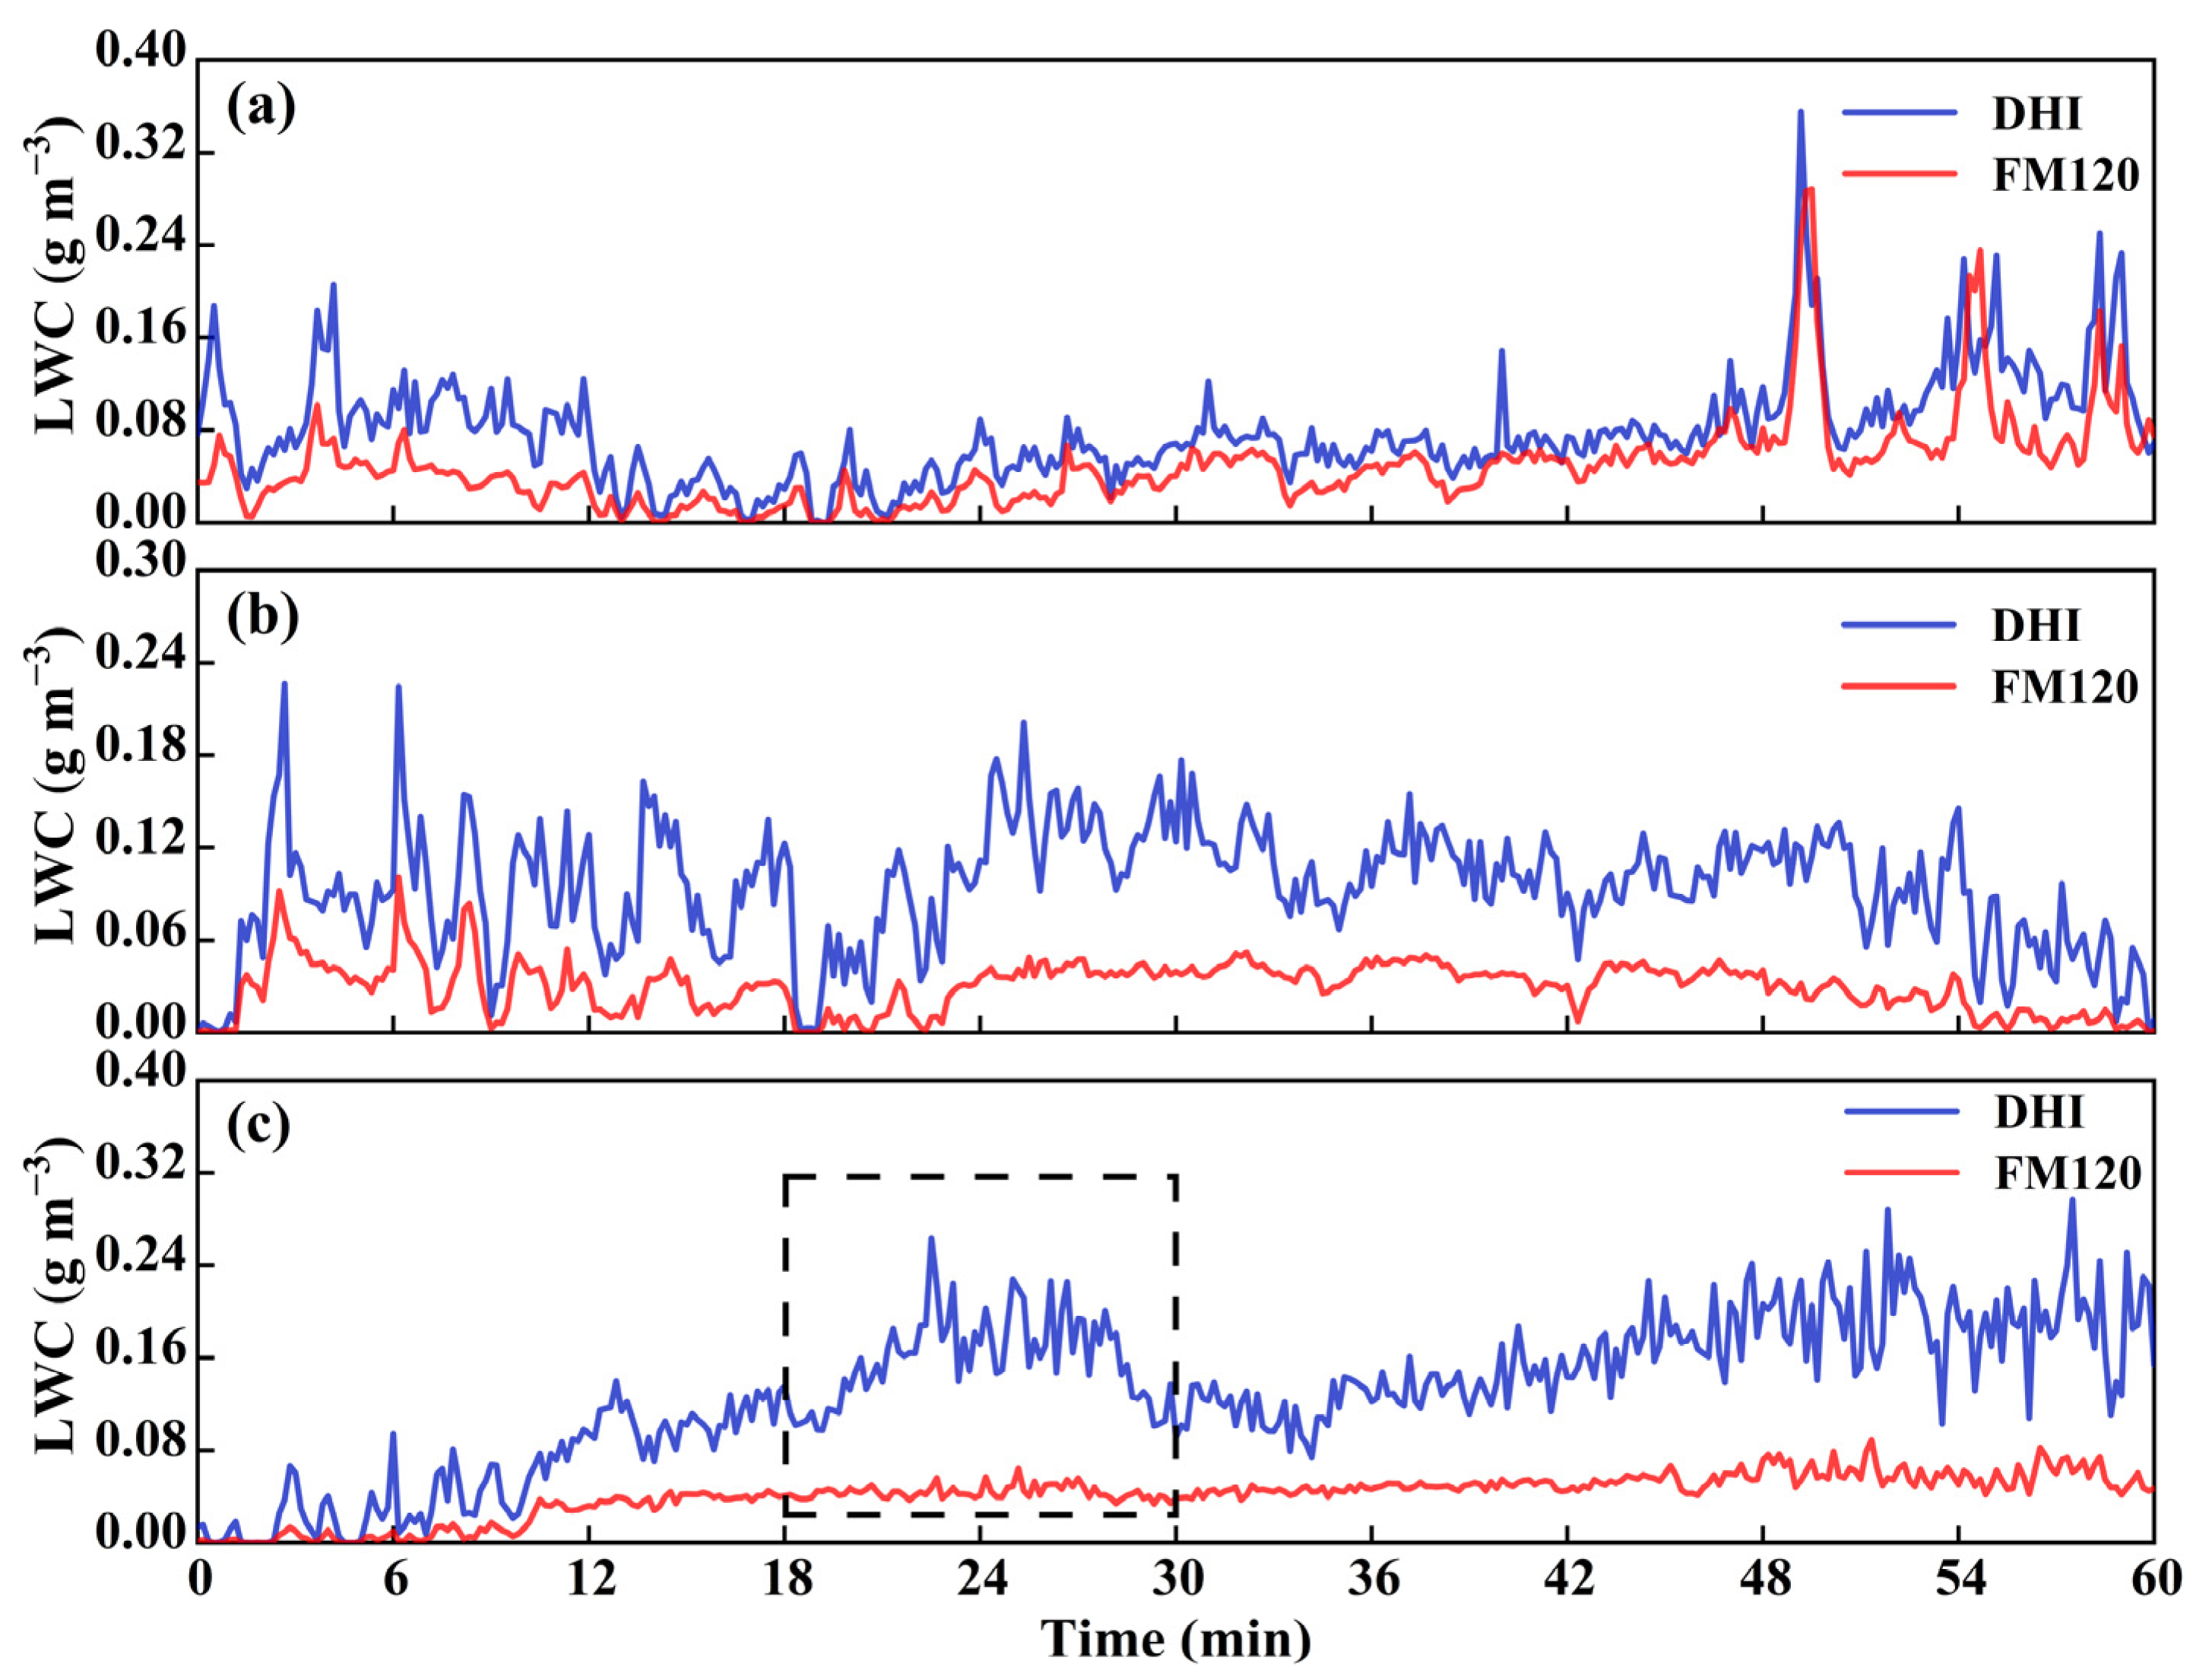
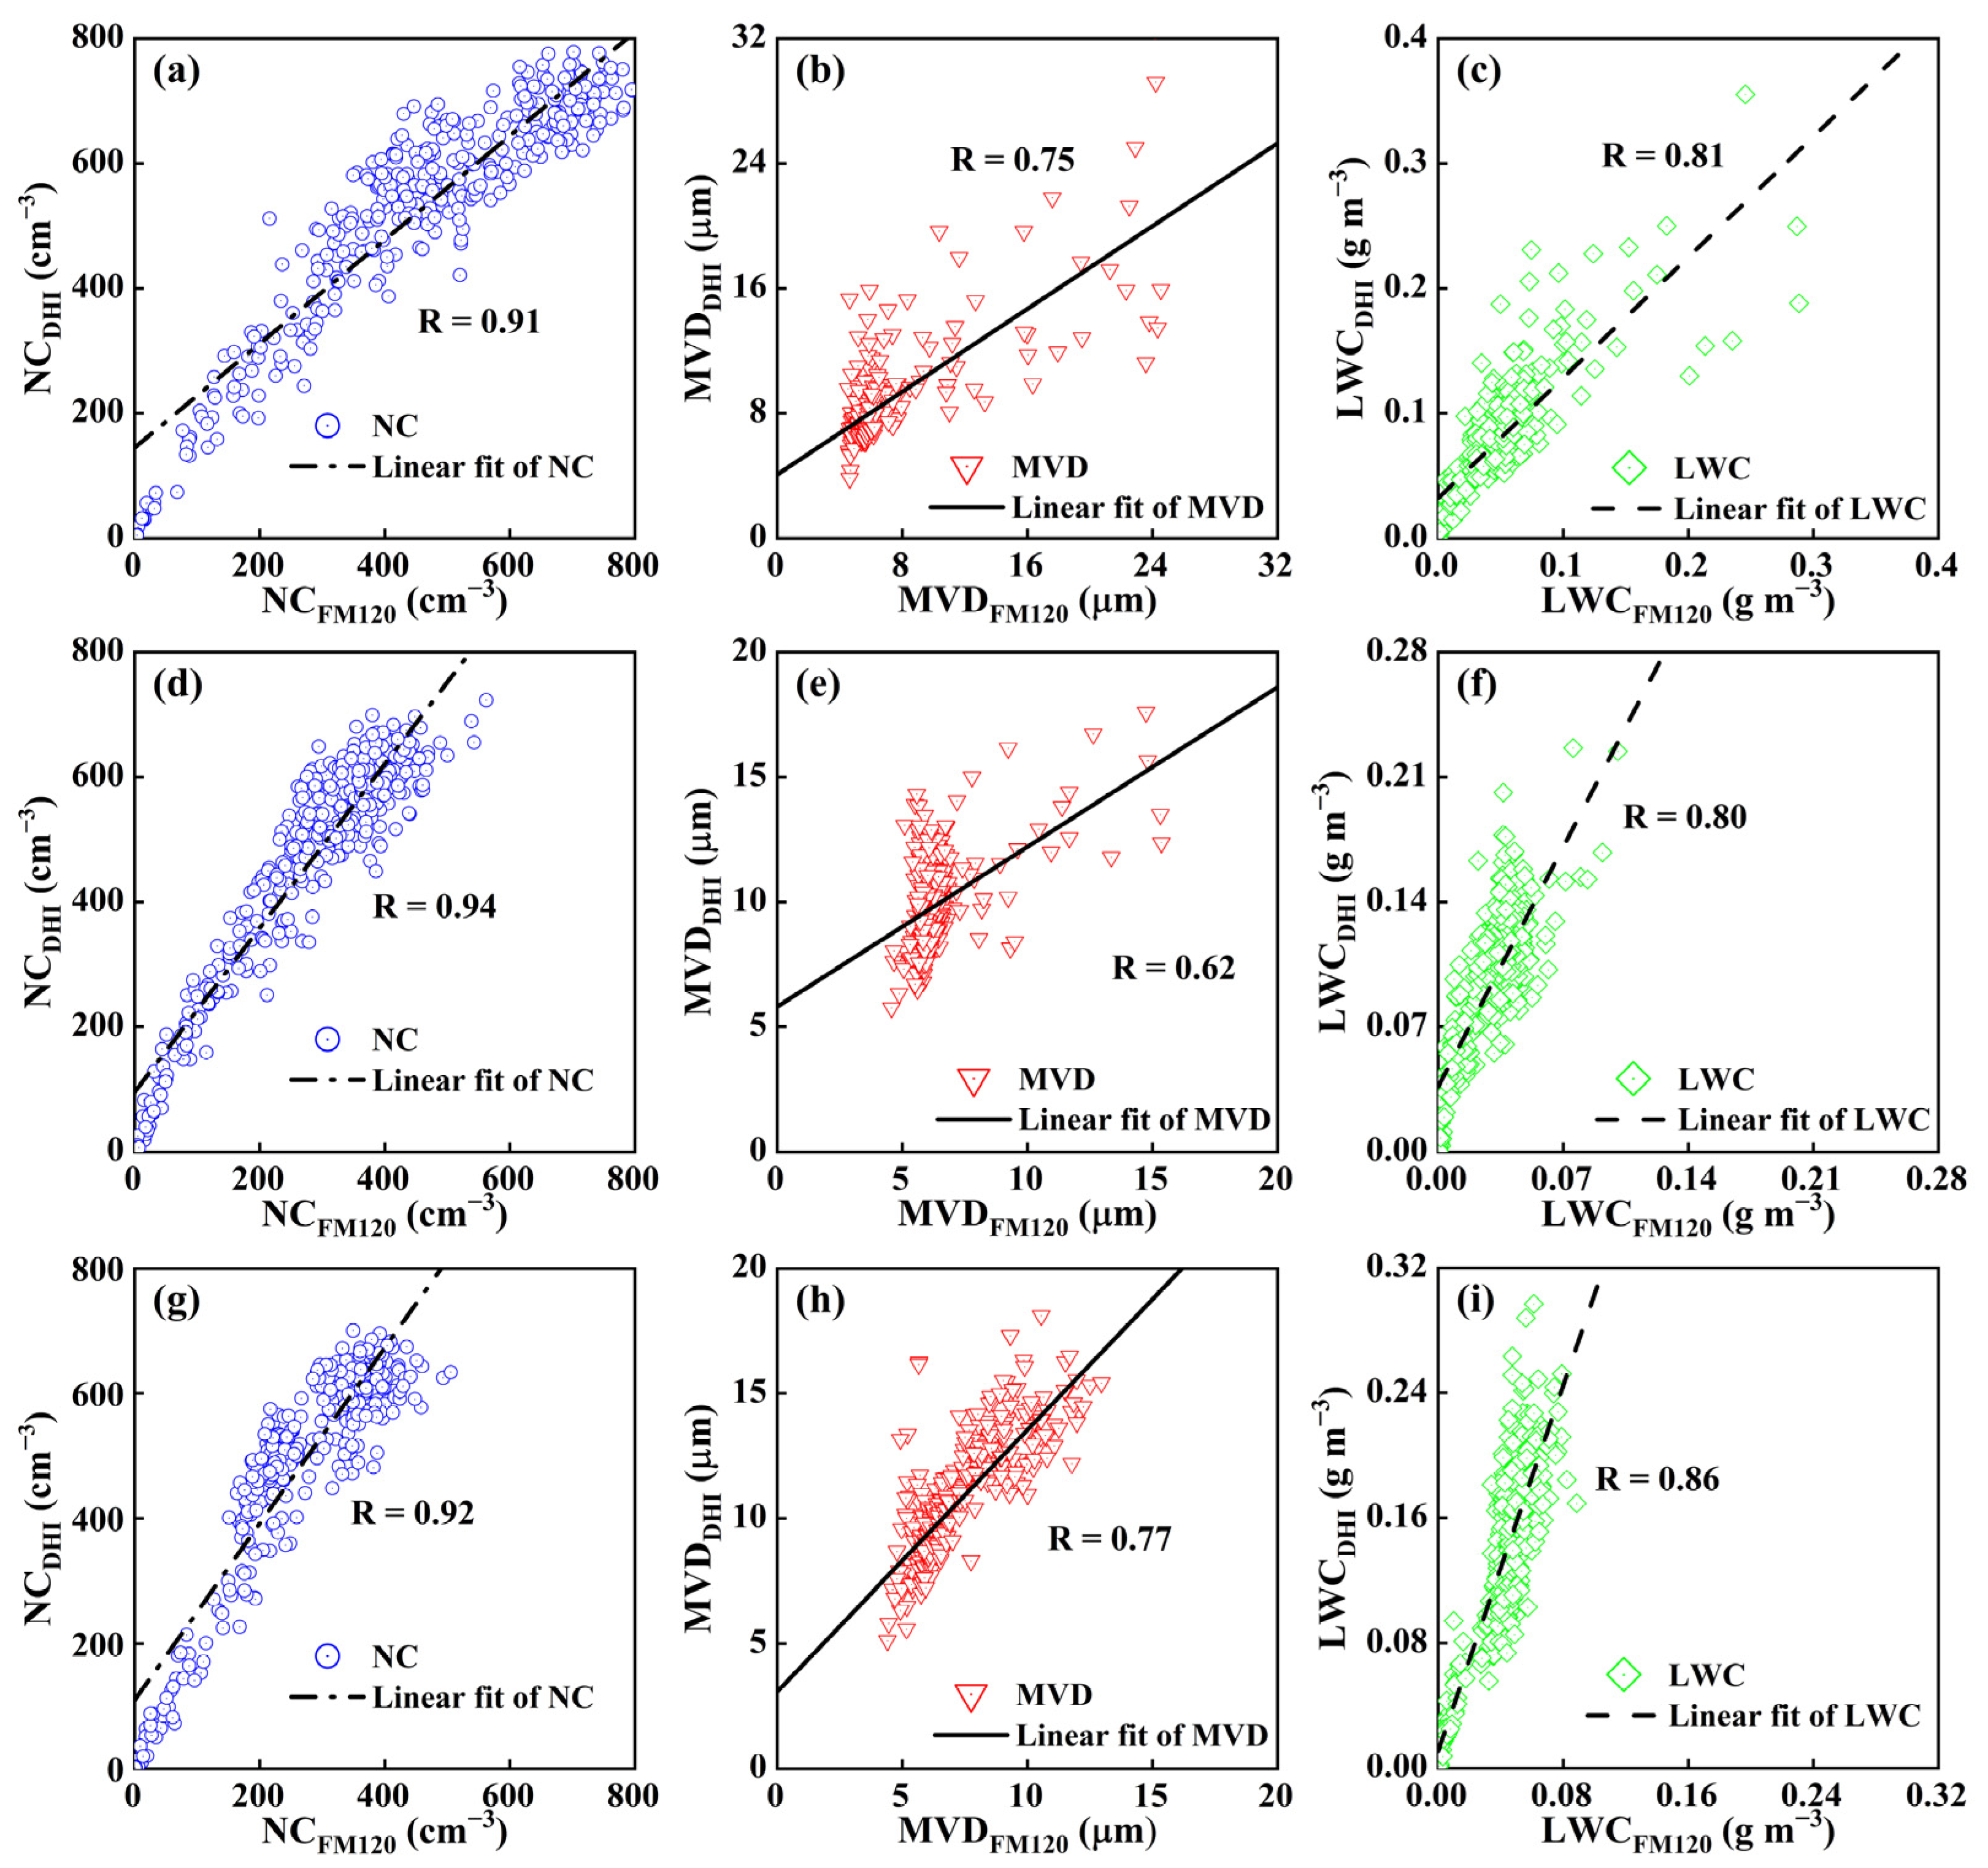
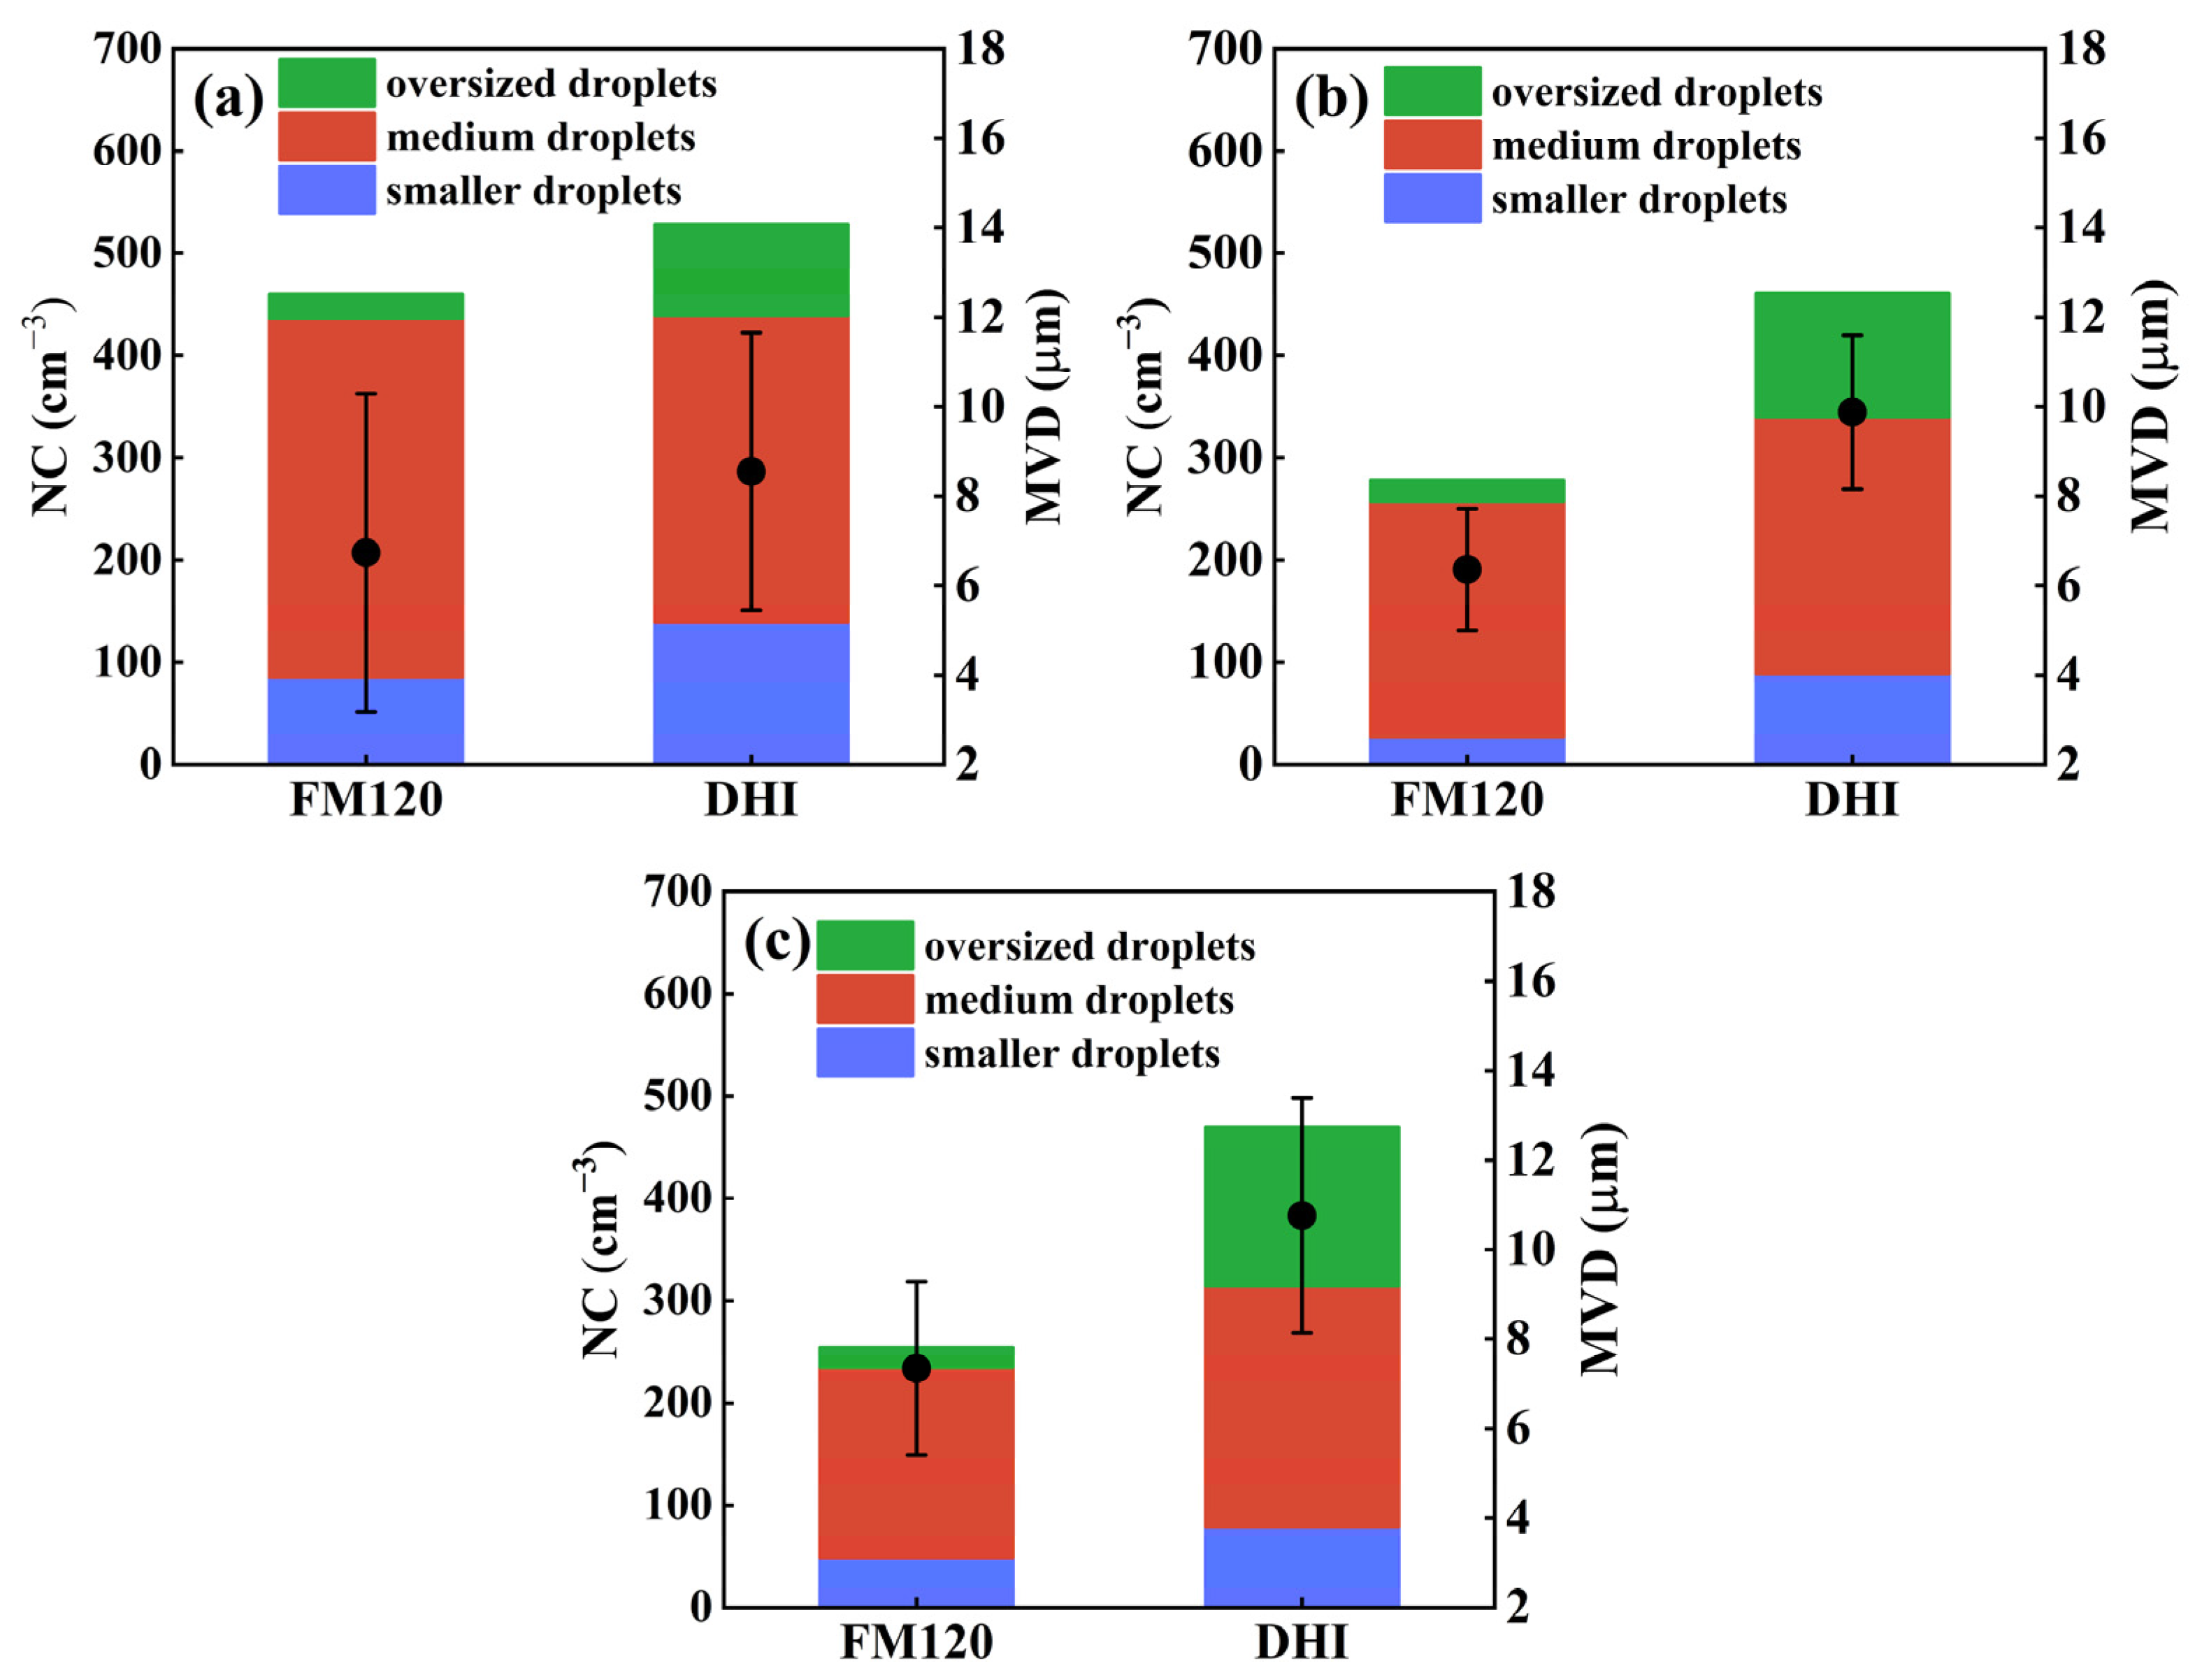
4.1. Correlation Analysis of Cloud Microphysical Parameters

Three cloud events on 27 August 2022 were chosen to intercompare the DHI and the FM120 in details. Below we refer to these three cloud events as three experiments. The integration time of the two instruments is set to 10 s. In Figure 6a–c, the comparison of NC between DHI and FM120 in three experiments is shown. The fluctuation trends of NCDHI and NCFM120 are highly consistent, which show the measurement results of DHI are reliable. However, the ratios of NCDHI to NCFM120 in the three experiments are 1.25 ± 0.32, 1.81 ± 0.48 and 1.93 ± 0.49, respectively. The above results indicate that DHI measures more droplets than FM120.
The MVD is mainly used to describe the size features of droplets. In Figure 7a–c, the comparison of MVD between DHI and FM120 in three experiments is shown. The fluctuation trends of MVDDHI and MVDFM120 are consistent. The ratios of MVDDHI to MVDFM120 in the three experiments are 1.33 ± 0.29, 1.57 ± 0.26 and 1.48 ± 0.27, respectively.
In Figure 8, the comparison of LWC between DHI and FM120 in three experiments is shown. In these three experiments, change trends between LWCDHI and LWCFM120 are different. In Figure 5a, the ratio of LWCDHI to LWCFM120 is 2.09 ± 1.19, and their change trends are similar. However, in Figure 5b,c, the ratio rises to 4.07 ± 2.88, 3.49 ± 1.63. The upward and downward amplitude of LWCDHI is much greater than LWCFM120, and the consistency of changing trends between them becomes poor. Especially in the dotted area in Figure 8c, an ascending and a descending process of LWC are recorded by the curve of LWCDHI. However, the curve of LWCFM120 is almost unchanged during the time.
The Pearson correlation coefficient is usually used to describe the degree of linear correlation between two variables, denoted as R. For these three experiments, the linear fitting results between NCDHI and NCFM120 are shown in Figure 9a,d,g. Because the R of NC in the three fitting results is above 0.91, there is an extremely high positive correlation between NCDHI and NCFM120. In the analysis of Figure 6, the change trend of NCDHI and NCFM120 curves is highly similar, which is the embodiment of the positive correlation. This shows that the measurement results of DHI can be considered reliable. In Figure 9b,e,h, the R of MVD is 0.75, 0.62 and 0.77, respectively. The R of LWC is shown in Figure 9c,f,i, which are 0.81, 0.80 and 0.86, respectively. The above results show the linear fitting effect of NC, LWC, MVD presents a decreasing trend in the correlation degree from strong to soft.

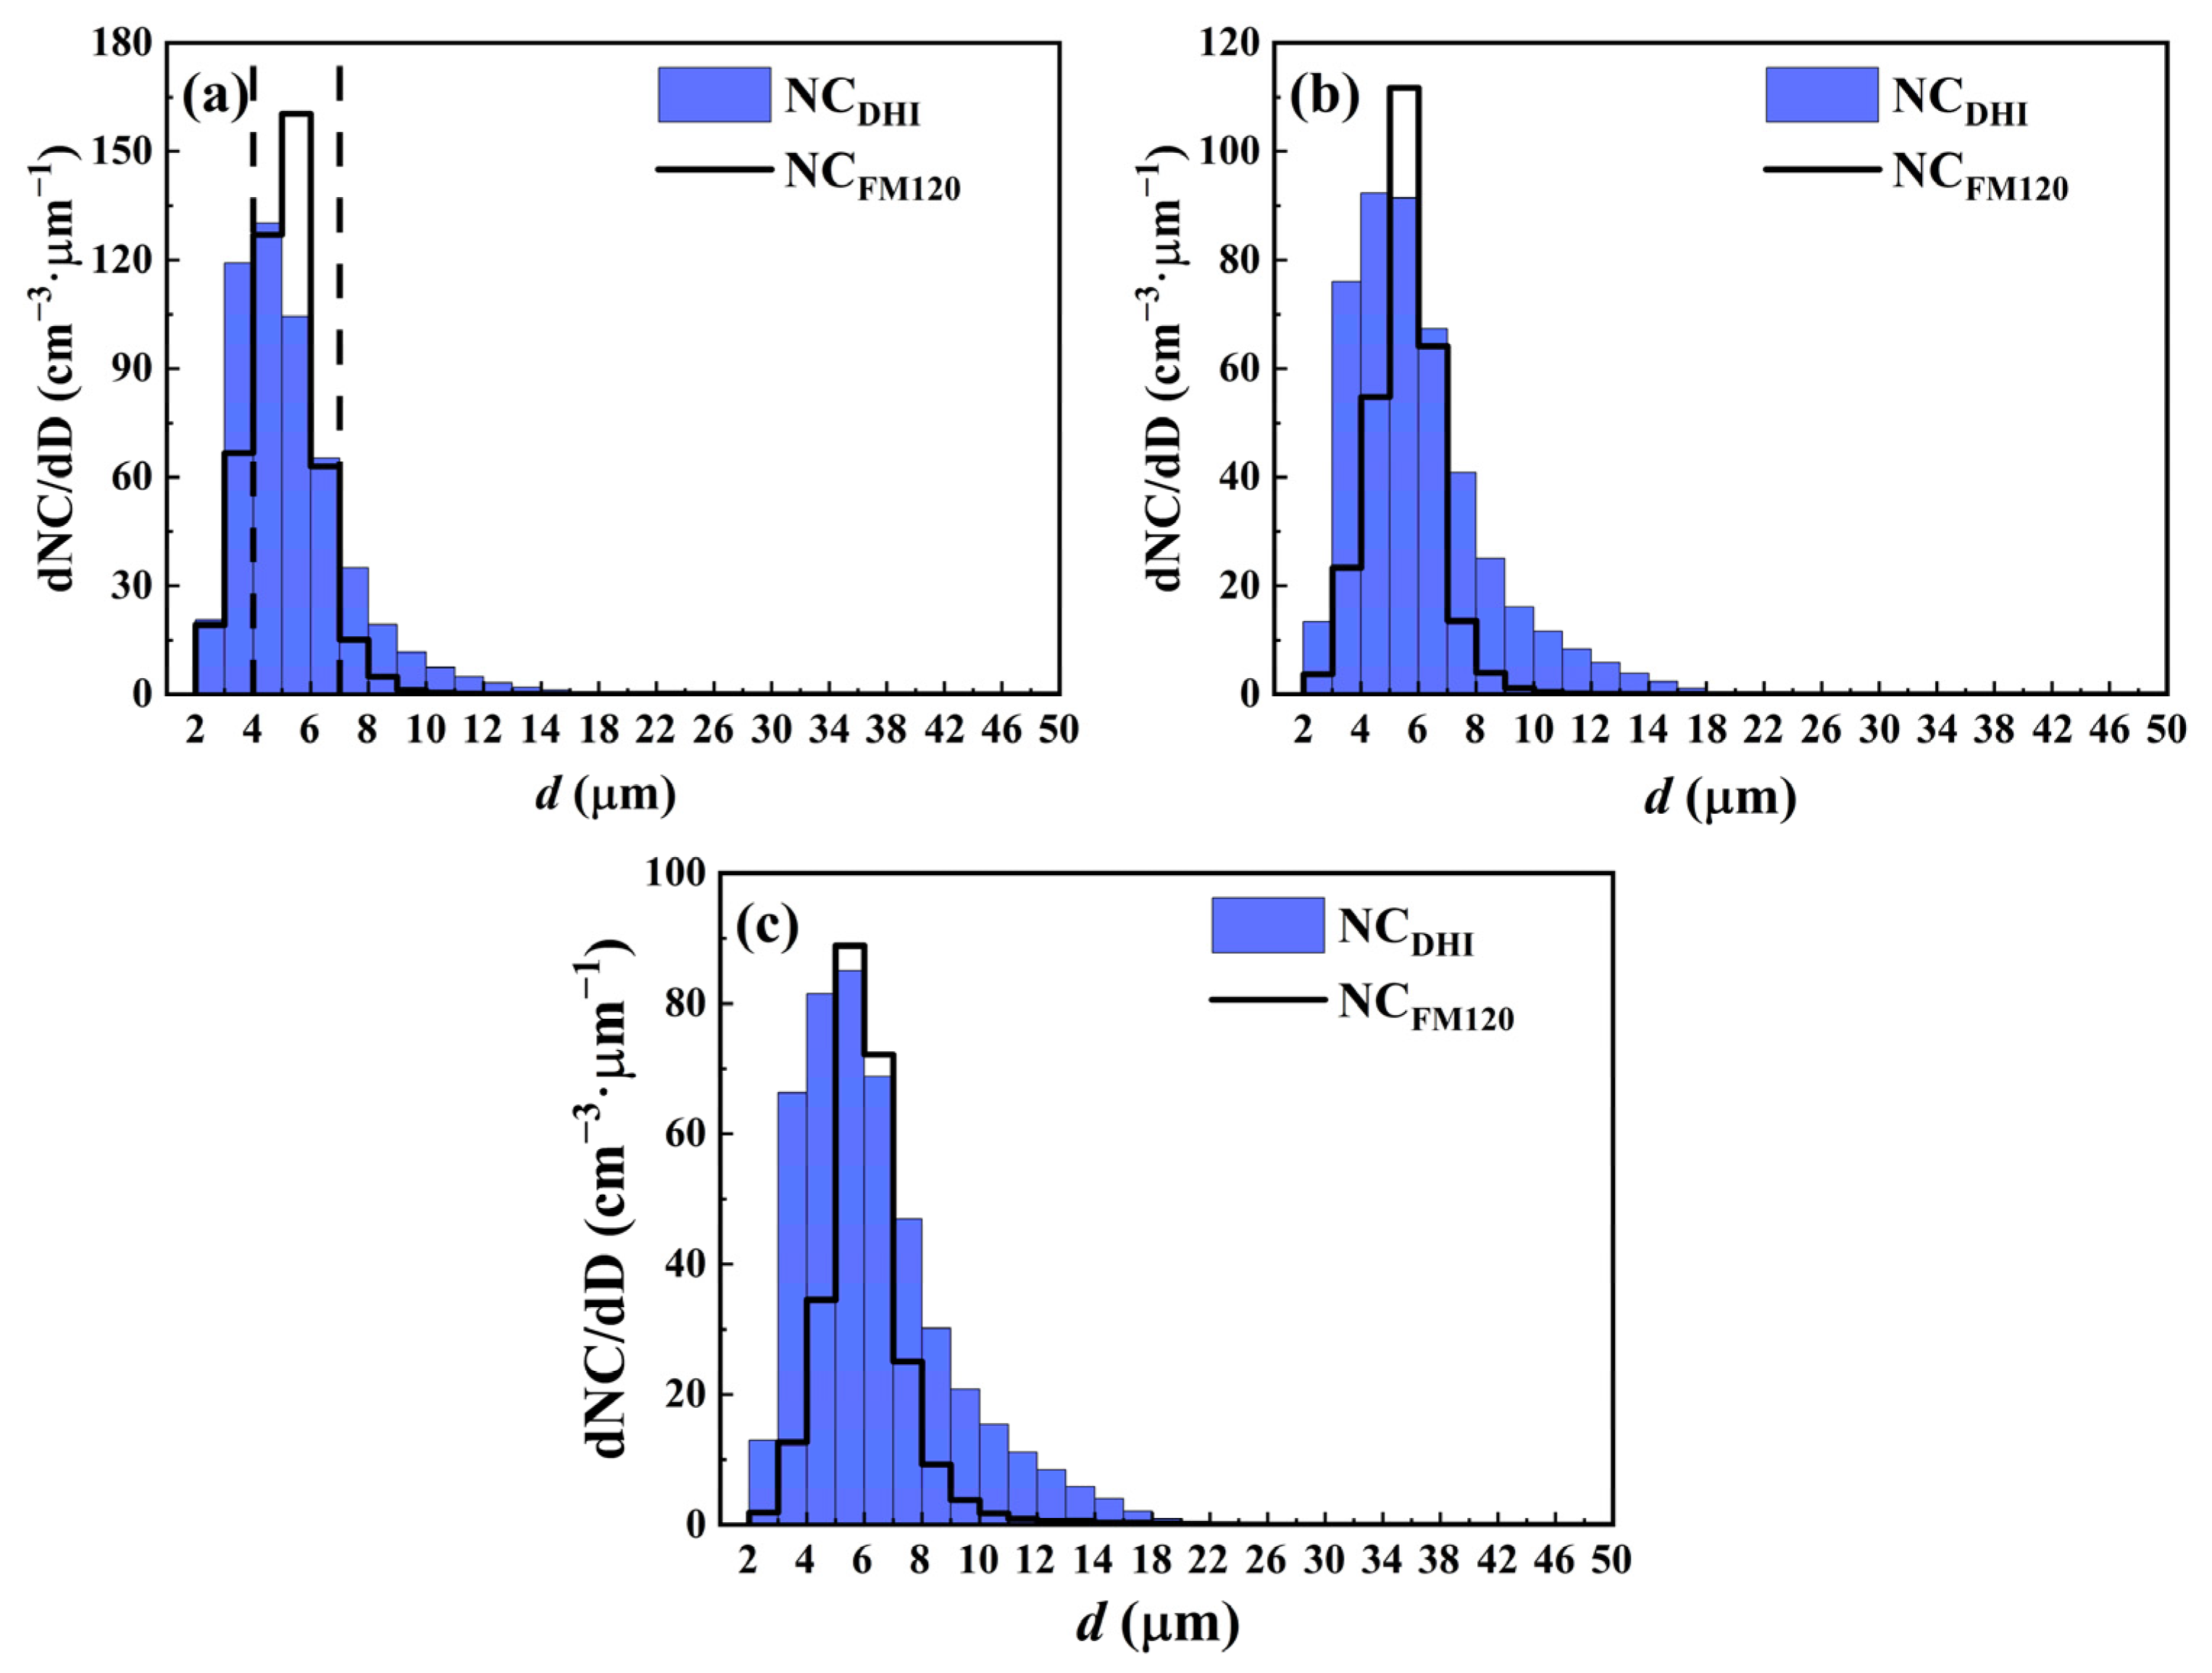
4.2. The Analysis of Droplets Size Distribution

DSD can be obtained by counting the diameter of all droplets, and features of the droplet distribution are reflected by the shape of the DSD. Droplets measured by the two instruments from 2 to 50 µm are sorted into 30 droplet channel bins according to their size. The width of the 1st to 12th droplet channel bin is 1 micron and the width of the 13th to 30th droplet channel bin is 2 microns. The number of droplets in each bin is normalized by dividing by the sample volume to obtain the NC in each bin. For the quantitative comparison between the two instruments, it is necessary to divide the NC of each bin by its width D to obtain the DSD. The average DSD is obtained by counting the DSD on each time point in the experiment, as shown in Figure 10. The measurement result of the FM120 is represented by a black ladder chart and the measurement result of DHI is represented by a blue bar graph. According to the size of droplets, the DSD is divided into small droplets (2 µm–4 µm), medium droplets (4 µm–7 µm) and oversize droplets (7 µm–50 µm). Droplets are mainly distributed in 2 µm–20 µm, and there are very few droplets in 20 µm–50 µm. As can be seen from Figure 10, the average number concentration of oversize and small droplets measured by FM120 is lower than DHI. Especially, droplets in 11 µm–20 µm are almost completely undetected by FM120. The above results account for the problem of why NCDHI is higher than NCFM120 in Figure 3a–c.
In Figure 11, the height of the histogram represents the number concentration, and the average and standard deviation of the MVD are represented by the bold black line. In the three experiments, for number concentration of medium droplets, the measurement results of FM120 are 116.84%, 91.86% and 83.10% of DHI. However, for number concentration of small droplets, the measurement results of FM120 are 61.54%, 30.24% and 18.39% of DHI. For number concentration of oversize droplets, the measurement results of FM120 are 26.90%, 16.79% and 28.57% of DHI.
In the measurement results of DHI, the proportion of oversize droplets in three experiments are 16.75%, 26.13% and 33.01%. However, in the measurement results of FM120, the proportion of oversize droplets are 5.17%, 7.28% and 17.01%. Therefore, the large proportion of oversize droplets of DHI leads to the increase of MVD, which accounts for the problem of why MVDDHI is higher than MVDFM120 in Figure 7a–c.
The above analysis of Figure 10 and Figure 11 shows there may be droplet loss during the measurement process of FM120. As seen from Figure 10, the larger the droplet diameter is, the more severe the droplet loss is. In the first experiment, the proportion of oversize droplets is small; therefore, the gap of measurement results between the two devices is small. In the second and third experiment, the proportion of oversize droplets is large, and the gap of measurement results is large. This is consistent with the analysis of cloud microphysical parameters in Figure 6, Figure 7 and Figure 8.

4.3. The Analysis of Reasons Causing the Difference

For the reasons causing the droplets loss of FM120, a conjecture that may lead to this phenomenon is proposed. During the measurement of the FM120, cloud droplets are sucked into the measuring region (the measuring region is a plane of 0.24 mm2) and then measured one by one. When the droplets concentration is high, multiple droplets reach the measuring region of FM120 at the same time, which can cause the wrong measurement that only one particle is considered to be in the measuring region. To verify the hypothesis, the data of DHI is modified. The modification algorithm is shown in Figure 12. The sampling space of DHI is a cuboid of 1.5 × 1.5 × 14 mm, which is divided into nine small cuboids on average. The cross-sectional area of each small cuboid is 0.25 mm2, which is approximately equal to the area of the measuring region of the FM120. The droplets in these small cuboids pass through the FM120 measurement area, keeping the relative position in the space unchanged. If two or more droplets pass through the measuring region at the same time, only one particle will be randomly retained and the others will be deleted.
According to the modification algorithm, the data of DHI in the third experiment is modified to get the comparison of three number concentrations, as shown in Figure 13. The result shows that the modified NCDHI is not significantly reduced compared to the original NCDHI. When the original NCDHI is below 400 cm−3, the modified NCDHI decreases by only 1.40%. With the increase of NCDHI, the decrease gradually rises to 4.14%. This means that the increase of droplets number concentration slightly increases the probability that the droplets are present in the FM120 measuring region simultaneously. But the probability is still low. Therefore, this is a minor reason why the NCDHI is higher than NCFM120.
In order to investigate the main reason causing the droplets loss of FM120, we analyze the sampling method of FM120 and the structure of the sampling transport tube of FM120. The sampling transport tube consists of the shrinkage zone and the wind tunnel, as shown in Figure 14. Droplets in the air are sucked into the sampling transport tube. For larger droplets, they are heavy and, therefore, are influenced by the gravity and inertia easily. Because of their large size and volume, they do not necessarily follow exactly the same tracks gas molecules would. Under the influence of suction and inertia, some droplets will hit and adhere to the tube wall during the process of sampling and transport. This results in the droplets loss. The difference in measurement results between FM120 and DHI may be caused by particles loss in FM120. From the results of Figure 10, the size of droplets affects droplets loss efficiency. The larger the droplet is, the higher droplets loss efficiency is. Wind direction and wind speed also cause different droplets loss efficiency. Tiitta et al. [35] found that the bigger the angular deviation from the coaxial structure, the greater the droplets loss. The average wind speed on the mountain station is 10 m/s, and the wind direction is variable. Cloud droplets will suffer from extra loss during the sampling process if the inlet of FM120 is not facing the direction of the prevailing wind. However, DHI does not have such a problem. The sampling method of DHI is open. Its sampling space is directly exposed to the cloud. Under the action of wind, cloud droplets freely enter the sampling space, and are recorded by the COMS. This does not destroy the original three-dimensional spatial distribution of cloud droplets and does not cause droplets loss. Therefore, DHI is more accurate for measuring large droplets.
The composition of fog and clouds is similar, as both are composed of liquid droplets. The difference lies in the fact that fog is in a near-stable state with a wind speed of approximately 0, while topographic clouds are in motion with a higher wind speed. In this study, the wind speed measured by the three-dimensional ultrasonic anemometer on the mountain station is approximately 10 m/s. Therefore, what is observed in this study is clouds, not fog. During the measurement of fog, the inhalation direction of the FM120 can be fixed. Because the fog is in a near-stable state. The influence of wind speed and wind direction can be ignored. However, in the observation of topographic clouds, the swivel-head inlet must be used, which can reduce the influence of wind direction and wind speed. In addition, raindrops will fall on the CMOS, which can lead to incorrect measurements of DHI. Therefore, measurements in the rain should be avoided.
The loss of small droplets may be caused by the following reasons. Since FM120 relies on the forward scattered light of droplets to identify the droplet diameter, as the droplet size decreases, the detection efficiency and accuracy of FM120 are reduced. Some small particles may not be detected because the intensity of the scattered light is weak.

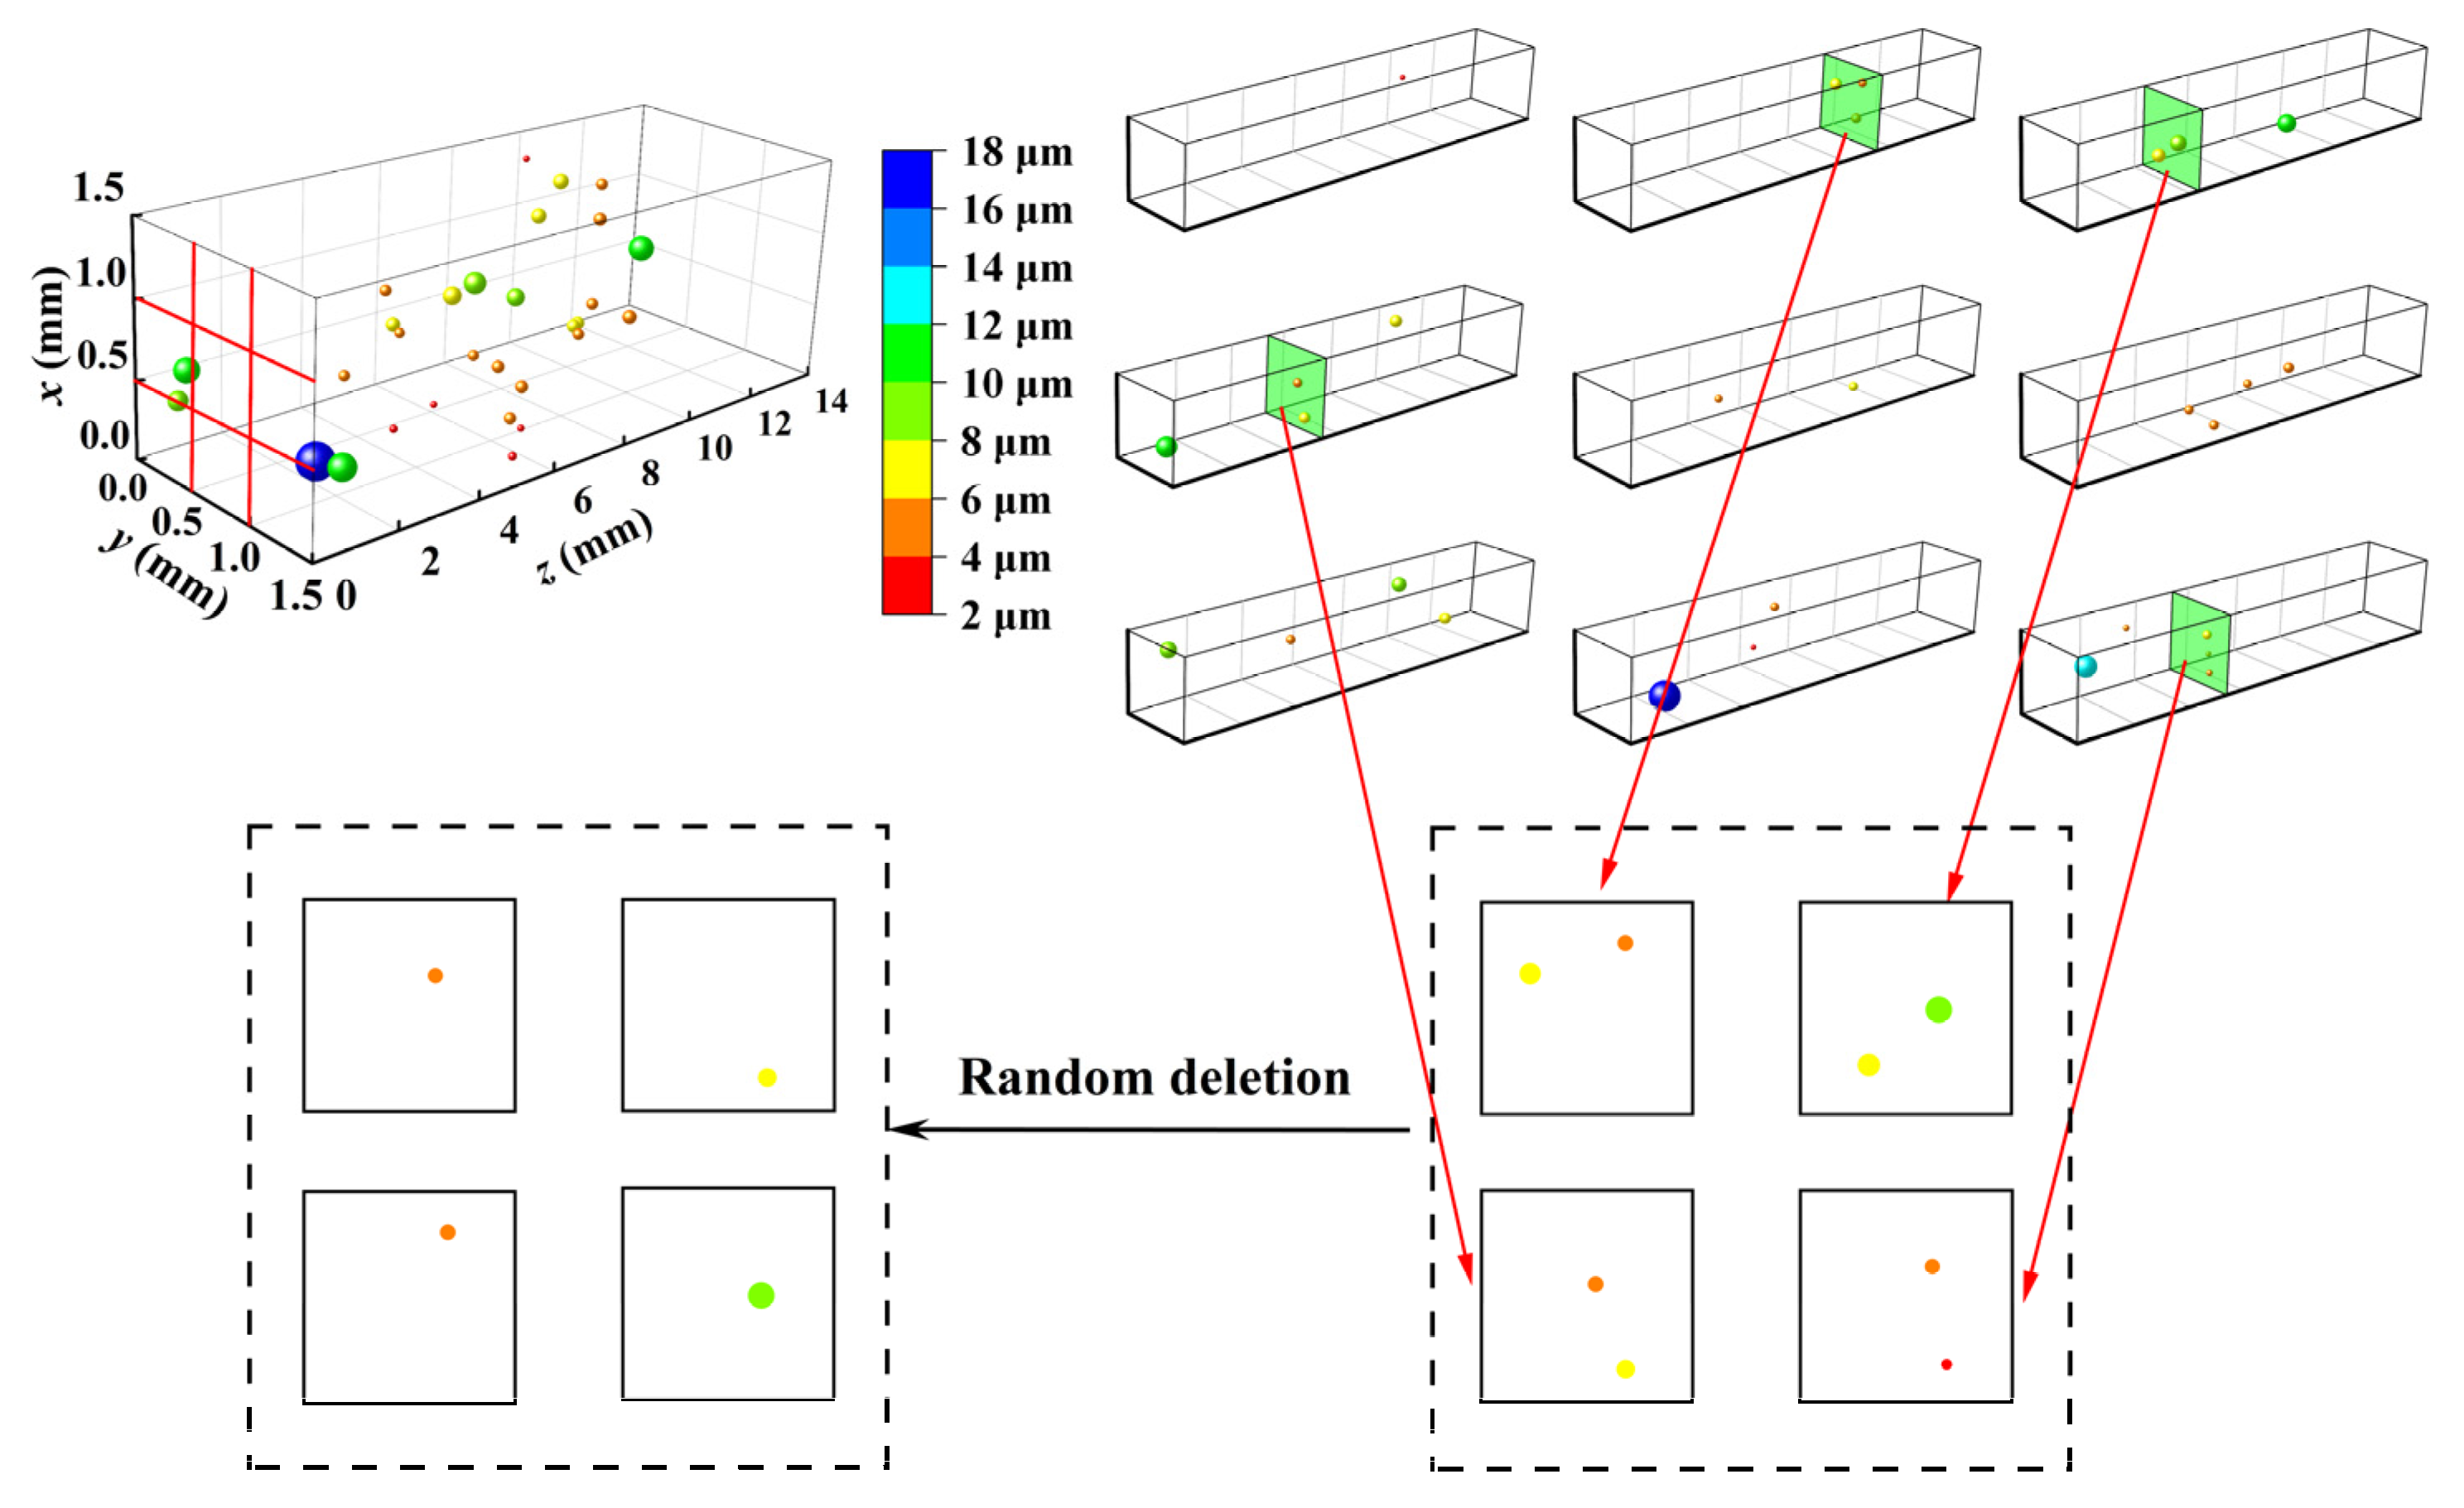
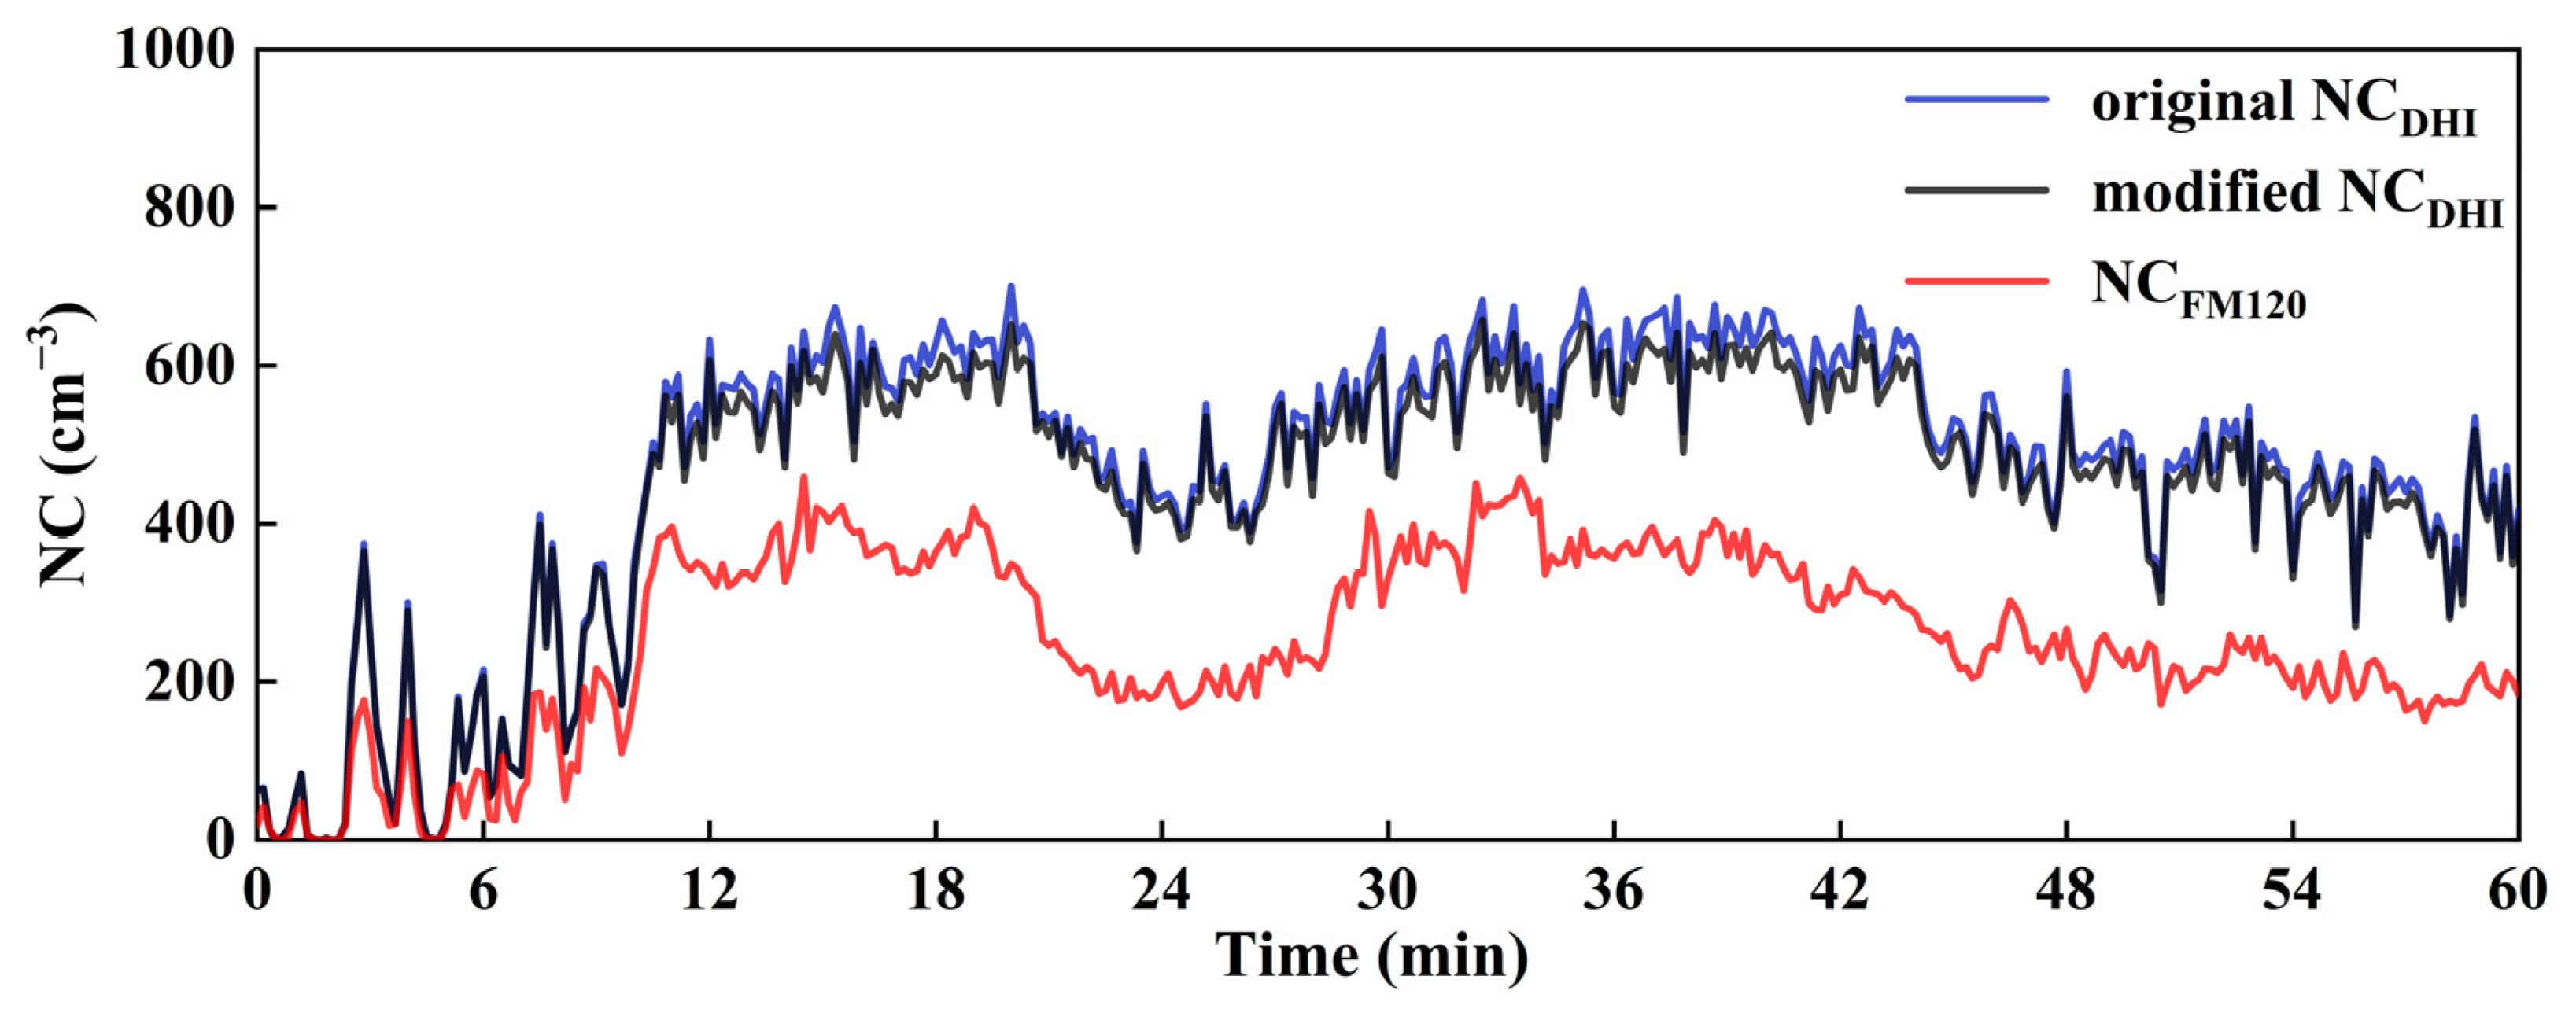
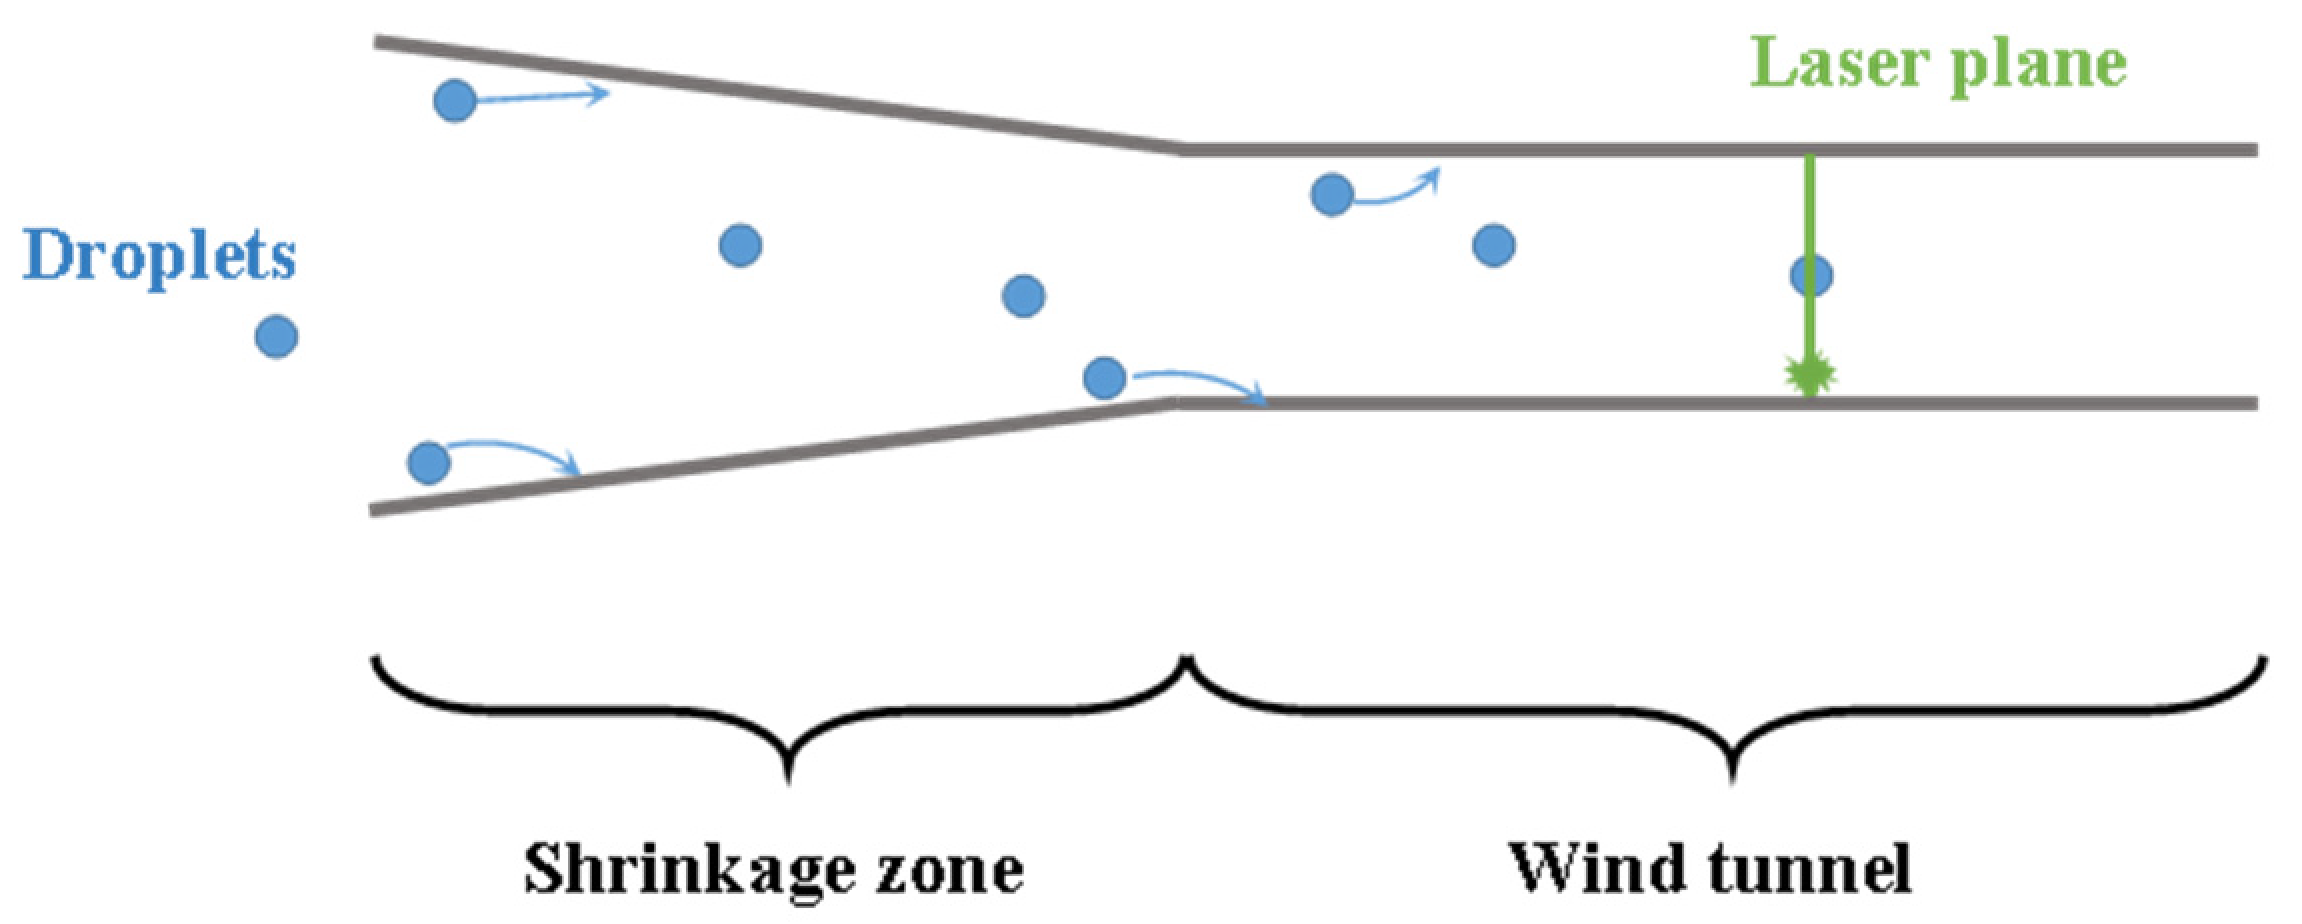
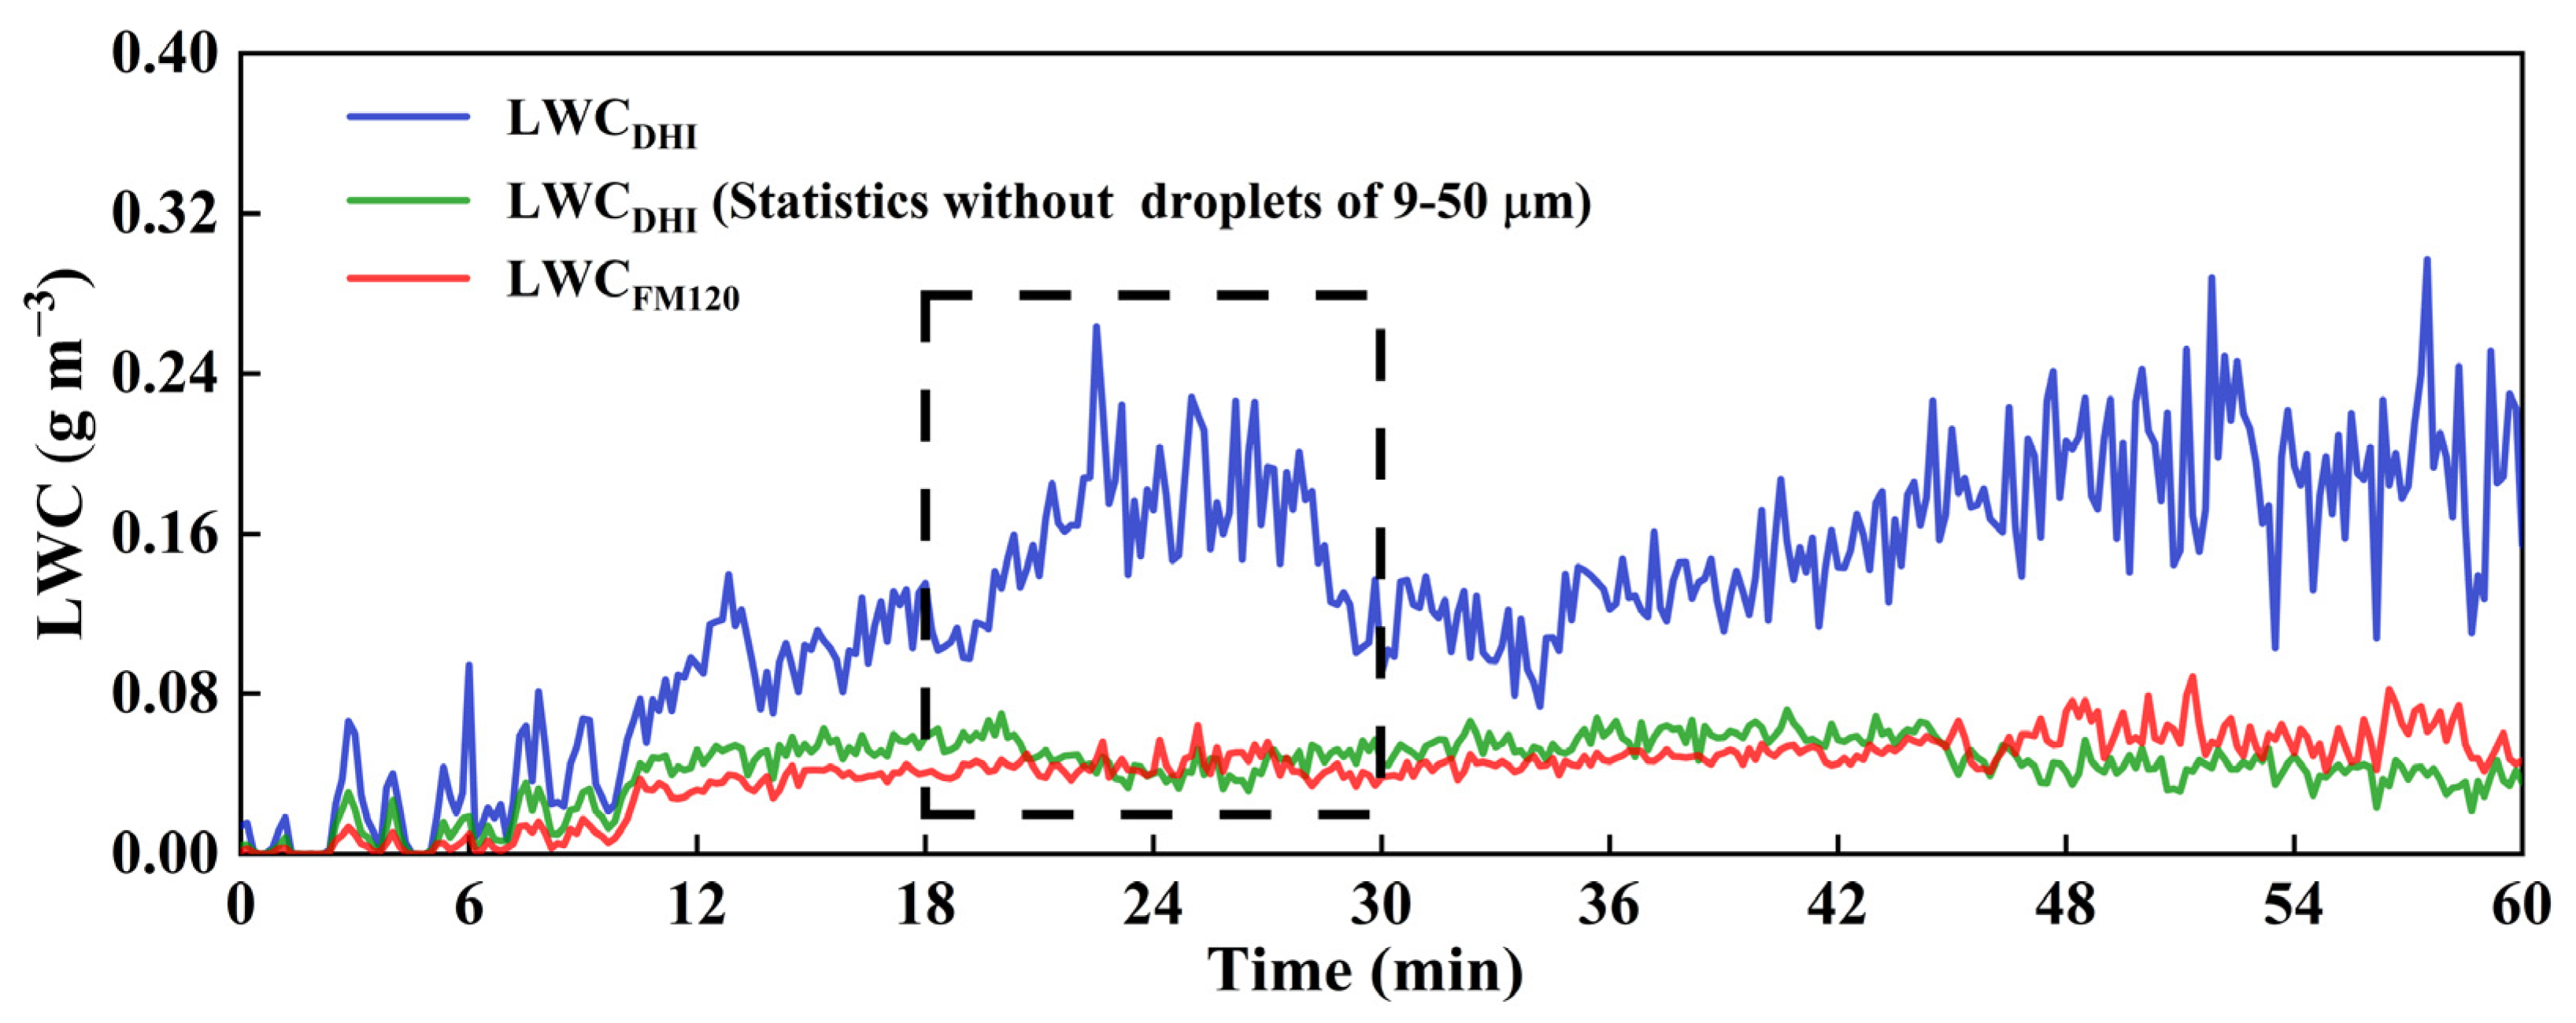
4.4. The Effects Caused by Droplets Loss

In order to investigate the effect of large droplets loss on the LWC, the droplets of 9–50 µm are deleted, as shown in Figure 15. The original LWCDHI is 3.49 ± 1.63 times LWCFM120. However, for the LWC without droplets of 9–50 µm, the ratio is reduced to 1.23 ± 0.56. From the dotted area in Figure 15, the original LWCDHI records ascending and descending processes during 18–30 min. However, for the LWCDHI without droplets of 9–50 µm, the variation at 18–30 min is different from the change trend of the original LWCDHI, but it is similar to LWCFM120. The statistical result shows that the loss of large droplets seriously affects the measurement results of the LWC and reduces the reliability of observation data to cloud microphysical processes.
Visibility is used to describe the maximum horizontal distance at which a person can identify an object from the sky background under the prevailing weather conditions. According to Equation (4), visibility is mainly affected by small droplets. Therefore, it is used to characterize the measurement result of small droplets in clouds. The visibility calculated by observation data from the FM120 and DHI is compared with the visibility measured by the forward scatter visibility instrument (FSV), as shown in Table 1. The visibility of DHI is closer to the measurement of FSV than FM120 at three different moments. This result shows that the loss of small droplets reduces the accuracy of visibility.

5. Conclusions and Discussion

In this paper, we intercompare the DHI and FM120 in liquid clouds and find that measurement results performed by the DHI and the FM120 show good correlations. However, whether NC, MVD or LWC, measurement results of DHI are higher than FM120 to a different degree. Further analysis and comparison of DSD reveal that the above differences mainly concentrated in large droplets and small droplets. DHI measures more droplets than FM120, which may be caused by droplets loss during sampling. In order to find reasons causing droplets loss, we propose the hypothesis that multiple particles exist simultaneously in the measurement region, which may lead to measurement errors. By modification of the data, the measurement error caused by the hypothesis is 4.14%, which indicates the hypothesis is a minor reason. The analysis results of the structure of the sampling transport tube of FM120 reveal that the droplet loss may be caused by the inspiratory sampling method of FM120. The loss of large droplets seriously affects the measurement results of the LWC and reduces the reliability of observation data on cloud microphysical processes. The loss of small droplets reduces the accuracy of visibility. The sampling method of DHI is open, which does not cause droplets loss and does not disrupt the spatial distribution of droplets. Both large and small droplets can be detected by DHI. The research in this paper provides technical and data support for more accurate measurement of cloud microphysical parameters and for the study of artificial weather modification. In future research, DHI will be developed into an airborne instrument capable of accurately measuring clouds at specific positions in the atmosphere. This can provide accurate calibration data for ground remote sensing technology.

Author Contributions

Statistics support was provided by C.Z. and C.Y. Writing assistance was provided by C.Z. Theory support was provided by J.L. Experiment support was provided by H.Z. Data analysis support was provided by J.W. and D.H. All authors have read and agreed to the published version of the manuscript.

Funding

This work was supported by the National Natural Science Foundation of China (NSFC) (42375126, 52127802 and 41975045).

Institutional Review Board Statement

Not applicable.

Informed Consent Statement

Not applicable.

Data Availability Statement

Not applicable.

Conflicts of Interest

The authors declare no conflict of interest.

References

  1. Ramanathan, V.; Barkstrom, B.R.; Harrison, E.F. Climate and the Earth’s Radiation Budget. Phys. Today 1989, 42, 22–32. [Google Scholar] [CrossRef]
  2. Rossow, W.B.; Lacis, A.A. Global, Seasonal Cloud Variations from Satellite Radiance Measurements. Part II. Cloud Properties and Radiative Effects. J. Clim. 1990, 3, 1204–1253. [Google Scholar] [CrossRef]
  3. Bergman, J.W.; Salby, M.L. The Role of Cloud Diurnal Variations in the Time-Mean Energy Budget. J. Clim. 1997, 10, 1114–1124. [Google Scholar] [CrossRef]
  4. Pinto, I.; Jack, C.; Lennard, C.; Tilmes, S.; Odoulami, R.C. Africa’s Climate Response to Solar Radiation Management With Stratospheric Aerosol. Geophys. Res. Lett. 2020, 47, e2019GL086047. [Google Scholar] [CrossRef]
  5. Zheng, X.; Xi, B.; Dong, X.; Logan, T.; Wang, Y.; Wu, P. Investigation of aerosol–cloud interactions under different absorptive aerosol regimes using Atmospheric Radiation Measurement (ARM) southern Great Plains (SGP) ground-based measurements. Atmos. Chem. Phys. 2020, 20, 3483–3501. [Google Scholar] [CrossRef]
  6. Zhao, C.; Chen, Y.; Li, J.; Letu, H.; Su, Y.; Chen, T.; Wu, X. Fifteen-year statistical analysis of cloud characteristics over China using Terra and Aqua Moderate Resolution Imaging Spectroradiometer observations. Int. J. Climatol. 2019, 39, 2612–2629. [Google Scholar] [CrossRef]
  7. Li, D.; Zhao, C.; Yue, Z.; Liu, C.; Sun, Y.; Cohen, J.B. Response of Cloud and Precipitation Properties to Seeding at a Supercooled Cloud-Top Layer. Earth Space Sci. 2022, 9, e2021EA001791. [Google Scholar] [CrossRef]
  8. Stevens, B.; Feingold, G. Untangling aerosol effects on clouds and precipitation in a buffered system. Nature 2009, 461, 607–613. [Google Scholar] [CrossRef]
  9. Dessler, A.E. Cloud variations and the Earth’s energy budget. Geophys. Res. Lett. 2011, 38, L19701. [Google Scholar] [CrossRef]
  10. Kauppinen, J.; Heinonen, J.; Malmi, P. Influence of Relative Humidity and Clouds on the Global Mean Surface Temperature. Energy Environ. 2014, 25, 389–399. [Google Scholar] [CrossRef]
  11. Tisler, P.; Zapadinsky, E.; Kulmala, M. Initiation of rain by turbulence-induced condensational growth of cloud droplets. Geophys. Res. Lett. 2005, 32, L06806. [Google Scholar] [CrossRef]
  12. Wacker, U.; Herbert, F. On different moisture variables in the constitutive equation for condensation growth of cloud drops. Geophys. Res. Lett. 1998, 25, 4473–4476. [Google Scholar] [CrossRef]
  13. Yang, F.; Xue, H.; Deng, Z.; Zhao, C.; Zhang, Q. A closure study of cloud condensation nuclei in the North China Plain using droplet kinetic condensational growth model. Atmos. Chem. Phys. 2012, 12, 5399–5411. [Google Scholar] [CrossRef]
  14. Jensen, J.B.; Nugent, A.D. Condensational Growth of Drops Formed on Giant Sea-Salt Aerosol Particles. J. Atmos. Sci. 2017, 74, 679–697. [Google Scholar] [CrossRef]
  15. Devenish, B.J.; Bartello, P.; Brenguier, J.L.; Collins, L.R.; Grabowski, W.W.; Ijzermans, R.H.A.; Malinowski, S.P.; Reeks, M.W.; Vassilicos, J.C.; Wang, L.P.; et al. Droplet growth in warm turbulent clouds. Q. J. R. Meteorol. Soc. 2012, 138, 1401–1429. [Google Scholar] [CrossRef]
  16. Kumar, B.; Götzfried, P.; Suresh, N.; Schumacher, J.; Shaw, R.A. Scale Dependence of Cloud Microphysical Response to Turbulent Entrainment and Mixing. J. Adv. Model. Earth Syst. 2018, 10, 2777–2785. [Google Scholar] [CrossRef]
  17. Thomas, S.; Ovchinnikov, M.; Yang, F.; van der Voort, D.; Cantrell, W.; Krueger, S.K.; Shaw, R.A. Scaling of an Atmospheric Model to Simulate Turbulence and Cloud Microphysics in the Pi Chamber. J. Adv. Model. Earth Syst. 2019, 11, 1981–1994. [Google Scholar] [CrossRef]
  18. Cannon, F.; Cordeira, J.M.; Hecht, C.W.; Norris, J.R.; Michaelis, A.; Demirdjian, R.; Ralph, F.M. GPM Satellite Radar Observations of Precipitation Mechanisms in Atmospheric Rivers. Mon. Weather Rev. 2020, 148, 1449–1463. [Google Scholar] [CrossRef]
  19. Wang, Y.; Gueye, M.; Greybush, S.J.; Greatrex, H.; Whalen, A.J.; Ssentongo, P.; Zhang, F.; Jenkins, G.S.; Schiff, S.J. Verification of operational numerical weather prediction model forecasts of precipitation using satellite rainfall estimates over Africa. Meteorol. Appl. 2023, 30, e2112. [Google Scholar] [CrossRef]
  20. Guo, X.; Fu, D.; Li, X.; Hu, Z.; Lei, H.; Xiao, H.; Hong, Y. Advances in cloud physics and weather modification in China. Adv. Atmos. Sci. 2015, 32, 230–249. [Google Scholar] [CrossRef]
  21. Wang, Y.; Qiu, Z.; Zhao, D.; Ali, M.A.; Hu, C.; Zhang, Y.; Liao, K. Automatic Detection of Daytime Sea Fog Based on Supervised Classification Techniques for FY-3D Satellite. Remote Sens. 2023, 15, 2283. [Google Scholar] [CrossRef]
  22. Zhang, Y.; Chen, S.; Tan, W.; Chen, S.; Chen, H.; Guo, P.; Sun, Z.; Hu, R.; Xu, Q.; Zhang, M.; et al. Retrieval of Water Cloud Optical and Microphysical Properties from Combined Multiwavelength Lidar and Radar Data. Remote Sens. 2021, 13, 4396. [Google Scholar] [CrossRef]
  23. Lei, S.; Zhu, X.; Ling, Y.; Teng, S.; Yao, B. Tropical Tropopause Layer Cloud Properties from Spaceborne Active Observations. Remote Sens. 2023, 15, 1223. [Google Scholar] [CrossRef]
  24. Gong, S.; Wang, Y.; Guo, J.; Chen, W.; Zhang, Y.; Li, F.; Xun, Y.; Xu, J.; Cheng, X.; Yang, G. Clouds in the Vicinity of the Stratopause Observed with Lidars at Midlatitudes (40.5–41°N) in China. Remote Sens. 2022, 14, 4938. [Google Scholar] [CrossRef]
  25. Schmidt, J.; Wandinger, U.; Malinka, A. Dual-field-of-view Raman lidar measurements for the retrieval of cloud microphysical properties. Appl. Opt. 2013, 52, 2235–2247. [Google Scholar] [CrossRef]
  26. Dupont, J.-C.; Haeffelin, M.; Wærsted, E.; Delanoe, J.; Renard, J.-B.; Preissler, J.; O’Dowd, C. Evaluation of Fog and Low Stratus Cloud Microphysical Properties Derived from In Situ Sensor, Cloud Radar and SYRSOC Algorithm. Atmosphere 2018, 9, 169. [Google Scholar] [CrossRef]
  27. Vishwakarma, P.; Delanoë, J.; Jorquera, S.; Martinet, P.; Burnet, F.; Bell, A.; Dupont, J.C. Climatology of estimated liquid water content and scaling factor for warm clouds using radar–microwave radiometer synergy. Atmos. Meas. Tech. 2023, 16, 1211–1237. [Google Scholar] [CrossRef]
  28. Liao, L.; Sassen, K. Investigation of relationships between Ka-band radar reflectivity and ice and liquid water contents. Atmos. Res. 1994, 34, 231–248. [Google Scholar] [CrossRef]
  29. Di, H.; Yuan, Y.; Yan, Q.; Xin, W.; Li, S.; Wang, J.; Wang, Y.; Zhang, L.; Hua, D. Determination of atmospheric column condensate using active and passive remote sensing technology. Atmos. Meas. Tech. 2022, 15, 3555–3567. [Google Scholar] [CrossRef]
  30. Zhang, H.; Bu, L.; Gao, H.; Huang, X.; Kumar, K.R. Retrieving homogeneous liquid cloud microphysical properties using multiple-field-of-view lidar. J. Appl. Remote Sens. 2018, 12, 046021. [Google Scholar] [CrossRef]
  31. Marinou, E.; Voudouri, K.A.; Tsikoudi, I.; Drakaki, E.; Tsekeri, A.; Rosoldi, M.; Ene, D.; Baars, H.; O’Connor, E.; Amiridis, V.; et al. Geometrical and Microphysical Properties of Clouds Formed in the Presence of Dust above the Eastern Mediterranean. Remote Sens. 2021, 13, 5001. [Google Scholar] [CrossRef]
  32. Xiong, J.; Liu, X.; Wang, J. Study on the Vertical Structure and the Evolution of Precipitation Particle Spectrum Parameters of Stratocumulus Clouds over North China Based on Aircraft Observation. Remote Sens. 2023, 15, 2168. [Google Scholar] [CrossRef]
  33. Deng, M.; Mace, G.G. Cirrus Microphysical Properties and Air Motion Statistics Using Cloud Radar Doppler Moments. Part I: Algorithm Description. J. Appl. Meteorol. Climatol. 2006, 45, 1690–1709. [Google Scholar] [CrossRef]
  34. Austin, R.T.; Stephens, G.L. Retrieval of stratus cloud microphysical parameters using millimeter-wave radar and visible optical depth in preparation for CloudSat: 1. Algorithm formulation. J. Geophys. Res. Atmos. 2001, 106, 28233–28242. [Google Scholar] [CrossRef]
  35. Tiitta, P.; Leskinen, A.; Kaikkonen, V.A.; Molkoselkä, E.O.; Mäkynen, A.J.; Joutsensaari, J.; Calderon, S.; Romakkaniemi, S.; Komppula, M. Intercomparison of holographic imaging and single-particle forward light scattering in situ measurements of liquid clouds in changing atmospheric conditions. Atmos. Meas. Tech. 2022, 15, 2993–3009. [Google Scholar] [CrossRef]
  36. Spiegel, J.K.; Zieger, P.; Bukowiecki, N.; Hammer, E.; Weingartner, E.; Eugster, W. Evaluating the capabilities and uncertainties of droplet measurements for the fog droplet spectrometer (FM-100). Atmos. Meas. Tech. 2012, 5, 2237–2260. [Google Scholar] [CrossRef]
  37. Flewellen, J.L.; Minoughan, S.; Garcia, I.L.; Tolar, P. Digital holography-based 3D particle localization for single-molecule tweezer techniques. Biophys. J. 2022, 121, 2538–2549. [Google Scholar] [CrossRef]
  38. Liu, Z.; Takahashi, T.; Lindsay, D.; Thevar, T.; Sangekar, M.; Watanabe, H.K.; Burns, N.; Watson, J.; Thornton, B. Digital In-Line Holography for Large-Volume Analysis of Vertical Motion of Microscale Marine Plankton and Other Particles. IEEE J. Ocean. Eng. 2021, 46, 1248–1260. [Google Scholar] [CrossRef]
  39. Rathod, S.; Ghosh, A.; Kulkarni, R. Fast and accurate autofocusing algorithm in digital holography based on particle swarm optimization. Optik 2021, 247, 167946. [Google Scholar] [CrossRef]
  40. Huang, J.; Cai, W.; Wu, Y.; Wu, X. Recent advances and applications of digital holography in multiphase reactive/nonreactive flows: A review. Meas. Sci. Technol. 2022, 33, 022001. [Google Scholar] [CrossRef]
  41. Tahara, T.; Kozawa, Y.; Oi, R. Single-path single-shot phase-shifting digital holographic microscopy without a laser light source. Opt. Express 2022, 30, 1182–1194. [Google Scholar] [CrossRef] [PubMed]
  42. Farzam Rad, V.; Moradi, A.-R. Flat Wall Proximity Effect on Micro-Particle Sedimentation in Non-Newtonian Fluids. Sci. Rep. 2020, 10, 2741. [Google Scholar] [CrossRef]
  43. Beals, M.J.; Fugal, J.P.; Shaw, R.A.; Lu, J.; Spuler, S.M.; Stith, J.L. Holographic measurements of inhomogeneous cloud mixing at the centimeter scale. Science 2015, 350, 87–90. [Google Scholar] [CrossRef]
  44. Henneberger, J.; Fugal, J.P.; Stetzer, O.; Lohmann, U. HOLIMO II: A digital holographic instrument for ground-based in situ observations of microphysical properties of mixed-phase clouds. Atmos. Meas. Tech. 2013, 6, 2975–2987. [Google Scholar] [CrossRef]
  45. Byeon, H.; Lee, J.; Doh, J.; Lee, S.J. Hybrid bright-field and hologram imaging of cell dynamics. Sci. Rep. 2016, 6, 33750. [Google Scholar] [CrossRef]
  46. vom Werth, K.L.; Kemper, B.; Kampmeier, S.; Mellmann, A. Application of Digital Holographic Microscopy to Analyze Changes in T-Cell Morphology in Response to Bacterial Challenge. Cells 2023, 12, 762. [Google Scholar] [CrossRef]
  47. Wang, Y.; Zhai, W.-d.; Wu, C. Algal cell viability assessment: The role of environmental factors in phytoplankton population dynamics. Mar. Pollut. Bull. 2023, 189, 114743. [Google Scholar] [CrossRef]
  48. Carney, S.; Khoo, T.C.; Sheikhsofla, A.; Ghazanfarpour, S.; Sharikova, A.; Mahajan, S.D.; Khmaladze, A.; Petruccelli, J.C. Quantitative phase imaging comparison of digital holographic microscopy and transport of intensity equation phase through simultaneous measurements of live cells. Opt. Lasers Eng. 2023, 166, 107581. [Google Scholar] [CrossRef]
  49. Pais, D.A.M.; Galrão, P.R.S.; Kryzhanska, A.; Barbau, J.; Isidro, I.A.; Alves, P.M. Holographic Imaging of Insect Cell Cultures: Online Non-Invasive Monitoring of Adeno-Associated Virus Production and Cell Concentration. Processes 2020, 8, 487. [Google Scholar] [CrossRef]
  50. Nebuloni, R. Empirical relationships between extinction coefficient and visibility in fog. Appl. Opt. 2005, 44, 3795–3804. [Google Scholar] [CrossRef]
  51. Thomas, M.K. Frequency analysis of digital holography with reconstruction by convolution. Opt. Eng. 2002, 41, 1829–1839. [Google Scholar] [CrossRef]
  52. Hovenac, E.A.; Lock, J.A. Calibration of the Forward-scattering Spectrometer Probe: Modeling Scattering from a Multimode Laser Beam. J. Atmos. Ocean. Technol. 1993, 10, 518–525. [Google Scholar] [CrossRef]
  53. Wiscombe, W.J. Improved Mie scattering algorithms. Appl. Opt. 1980, 19, 1505–1509. [Google Scholar] [CrossRef]
  54. Tsonis, A.A.; Leaitch, W.R.; Couture, M.D. The Effect of Calibration of the Forward-Scattering Spectrometer Probe on the Sizing of Cloud Droplets. J. Atmos. Ocean. Technol. 1987, 4, 518–526. [Google Scholar] [CrossRef]
  55. Gao, P.; Wang, J.; Gao, Y.; Liu, J.; Hua, D. Observation on the Droplet Ranging from 2 to 16 µm in Cloud Droplet Size Distribution Based on Digital Holography. Remote Sens. 2022, 14, 2414. [Google Scholar] [CrossRef]
  56. La, I.; Yum, S.S.; Gultepe, I.; Yeom, J.M.; Song, J.I.; Cha, J.W. Influence of Quasi-Periodic Oscillation of Atmospheric Variables on Radiation Fog over A Mountainous Region of Korea. Atmosphere 2020, 11, 230. [Google Scholar] [CrossRef]
  57. Boudala, F.S.; Wu, D.; Isaac, G.A.; Gultepe, I. Seasonal and Microphysical Characteristics of Fog at a Northern Airport in Alberta, Canada. Remote Sens. 2022, 14, 4865. [Google Scholar] [CrossRef]
  58. Tav, J.; Masson, O.; Burnet, F.; Paulat, P.; Bourrianne, T.; Conil, S.; Pourcelot, L. Determination of Fog-Droplet Deposition Velocity from a Simple Weighing Method. Aerosol Air Qual. Res. 2018, 18, 103–113. [Google Scholar] [CrossRef]
Figure 1. DHI and FM120 at Liupan Mountain weather station. The distance between DHI and FM120 is 5 m.
Atmosphere 14 01381 g001
Figure 2. (a) The schematic of working function of DHI. (b) The recording process of holograms.
Atmosphere 14 01381 g002
Figure 3. The reconstructed image of the USAF1951 resolution plate.
Atmosphere 14 01381 g003
Figure 4. The holographic reconstruction results of 2 µm standard particle diffraction plate.
Atmosphere 14 01381 g004
Figure 5. The schematic of working function of FM120.
Atmosphere 14 01381 g005
Figure 6. Comparison of NC between DHI and FM120. (a) NC in the first experiment. (b) NC in the second experiment. (c) NC in the third experiment.
Atmosphere 14 01381 g006
Figure 7. Comparison of MVD between DHI and FM120. (a) MVD in the first experiment. (b) MVD in the second experiment. (c) MVD in the third experiment.
Atmosphere 14 01381 g007
Figure 8. Comparison of LWC between DHI and FM120. (a) LWC in the first experiment. (b) LWC in the second experiment. (c) LWC in the third experiment.
Atmosphere 14 01381 g008
Figure 9. Correlation analysis of microphysical parameters between DHI and FM120 in three experiments. The R is Pearson correlation coefficient. (a,d,g) show the relationship between NC, (b,e,h) show the relationship between MVD, (c,f,i) show the relationship between LWC.
Atmosphere 14 01381 g009
Figure 10. Average DSD. (a) The size distribution in the first experiment. (b) The size distribution in the second experiment. (c) The size distribution in the third experiment.
Atmosphere 14 01381 g010
Figure 11. Average number concentration of three size styles of droplets: smaller, medium and oversized droplet. (a) In the first experiment. (b) In the second experiment. (c) In the third experiment.
Atmosphere 14 01381 g011
Figure 12. The schematic diagram of droplets deduplication.
Atmosphere 14 01381 g012
Figure 13. Comparison of NC in the third experiment. Blue line represents original NCDHI, red line represents NCFM120 and black line represents modified NCDHI.
Atmosphere 14 01381 g013
Figure 14. Schematic diagram of the sampling transport tube.
Atmosphere 14 01381 g014
Figure 15. Comparison of LWC in the third experiment. Blue line represents original LWCDHI, red line represents NCFM120 and green line represents LWCDHI without droplets of 9–50 µm.
Atmosphere 14 01381 g015
Table 1. Visibility of FSV, DHI and FM120 at different times.
TimeVisibility of FSV (m)Visibility of DHI (m)Visibility of FM120 (m)
13:20325598
18:006394184
20:006978256
Disclaimer/Publisher’s Note: The statements, opinions and data contained in all publications are solely those of the individual author(s) and contributor(s) and not of MDPI and/or the editor(s). MDPI and/or the editor(s) disclaim responsibility for any injury to people or property resulting from any ideas, methods, instructions or products referred to in the content.

