Article

Study of Methane Emission and Geological Sources in Northeast China Permafrost Area Related to Engineering Construction and Climate Disturbance Based on Ground Monitoring and AIRS

1
National Demonstration Center for Experimental Civil Engineering Education, Hunan City University, Yiyang 413002, China
2
Hunan Engineering Research Center of Structural Safety and Disaster for Urban Underground Infrastructure, Hunan City University, Yiyang 413002, China
3
Grouting Engineering Technology Research Center, Hunan City University, Yiyang 413002, China
4
Field Scientific Observation and Research Station of the Ministry of Education-Geological Environment System of Permafrost Area in Northeast China, Northeast Forestry University, Harbin 150040, China
5
Key Technology Laboratory of Digital Urban Rural Spatial Planning in Hunan Province, Hunan City University, Yiyang 413002, China
6
Key Laboratory of Urban Planning Information Technology in Hunan Province, Hunan City University, Yiyang 413002, China
7
Key Laboratory of Disaster Prevention and Mitigation Engineering and Protection Engineering in Colleges of Heilongjiang Province, Northeast Petroleum University, Daqing 163318, China
8
Key Laboratory of Structural Catastrophe and Control, Ministry of Education, Harbin Institute of Technology, Harbin 150040, China
*
Authors to whom correspondence should be addressed.
Atmosphere 2023, 14(8), 1298; https://doi.org/10.3390/atmos14081298
Submission received: 28 June 2023 / Revised: 30 July 2023 / Accepted: 10 August 2023 / Published: 16 August 2023
(This article belongs to the Section Air Quality)

Abstract

:
China’s largest high-latitude permafrost distribution zone is in Northeast China. With the intensification of global warming and engineering construction, the carbon stored in permafrost will gradually thaw and be released in the form of methane gas. However, research on the changes in methane concentration and emission sources in this area is still unclear. In this paper, the AIRS (Atmospheric Infrared Sounder) data carried by the Aqua satellite were used to analyze the distribution and change trends in the overall methane concentration in the near-surface troposphere in Northeast China from 2003 to 2022. These data, combined with national meteorological and on-site monitoring data, were used to study the methane emission characteristics and sources in the permafrost area in Northeast China. The results show that the methane concentration in the near-surface troposphere of Northeast China is mainly concentrated in the permafrost area of the Da and Xiao Xing’an Mountains. From 2003 to 2022, the methane concentration in the near-surface troposphere of the permafrost area in Northeast China showed a rapid growth trend, with an average linear trend growth rate of 4.787 ppbv/a. In addition, the methane concentration in the near-surface troposphere of the permafrost area shows a significant bimodal seasonal variation pattern. The first peak appears in summer (June–August), with its maximum value appearing in August, and the second peak appears in winter (December–February), with its maximum value appearing in December. Combined with ground surface methane concentration monitoring, it was found that the maximum annual ground surface methane concentration in degraded permafrost areas occurred in spring, causing the maximum average growth rate in methane concentration, also in spring, in the near-surface troposphere of permafrost areas in Northeast China (with an average value of 6.05 ppbv/a). The growth rate of methane concentration in the southern permafrost degradation zone is higher than that in the northern permafrost stable zone. In addition, with the degradation of permafrost, the geological methane stored deep underground (methane hydrate, coal seam, etc., mainly derived from the accumulation of ancient microbial origin) in the frozen layer will become an important source of near-surface troposphere methane in the permafrost degradation area. Due to the influence of high-permeability channels after permafrost degradation, the release rate of methane gas in spring is faster than predicted, and the growth rate of methane concentration in the near-surface troposphere of permafrost areas can be increased by more than twice. These conclusions can provide a data supplement for the study of the carbon cycle in permafrost areas in Northeast China.

1. Introduction

According to the sixth assessment report on global climate change of the IPCC (Intergovernmental Panel on Climate Change), global temperatures have rapidly grown from 1850 to 2020, with the MAAT (mean annual air temperature) rising by about 1 °C; this increase was even greater in high-altitude and high-latitude areas [1], posing a great threat to the stability of high-latitude permafrost in Northeast China. The permafrost area of Northeast China is located on the southern edge of the Eurasia continuous permafrost zone and is the largest high-latitude permafrost zone in China. Its permafrost layer has a high temperature, a thin thickness, and an unstable thermal state and is vulnerable to interference from the external environment, both from climate and human factors [2,3]. Studies have shown that since 1980, the continuous permafrost area in China has decreased from 70~80% to 30~50% and the permafrost area in Northeast China has decreased from 3.9 × 10⁵ km2 to 2.4 × 10⁵ km2 [4,5,6,7,8]. The degradation characteristics of permafrost are characterized by a gradual increase in the thickness of the active layer. The degradation modes of permafrost include the simultaneous degradation of the upper and lower layers and partial degradation between layers, where the rising speed of the lower limit is greater than the falling speed of the upper limit [8,9,10,11].
With the gradual degradation of permafrost, a large amount of carbon stored in permafrost will gradually be released. Permafrost accounts for approximately 25% of the land in the northern hemisphere ((22 ± 3) × 106 km2), containing approximately 1700 Gt (1 Gt = 1015 g) of carbon, almost twice the current atmospheric carbon. Methane is an important form of carbon emission in permafrost areas [10]. In addition to the recent methane produced by wetland methanogens, the ancient carbon stored in permafrost will also be discharged in the form of methane. At present, scholars have found the existence of methane hydrate in the Mohe basin and other areas in Northeast China [11,12,13]. Studies have shown that the total reserves of the methane hydrate stable zone in permafrost areas in China are about 2.995 × 10¹² m3 to 5.081 × 10¹² m3, with a best estimate of 4.002 × 10¹² m3. The reserve range of the methane hydrate stable zone in the permafrost area of Northeast China is represented by the Mohe basin and ranges from 0.49 × 10¹² m3 to 0.79 × 10¹² m3 [12,13].
Studies have shown that the stability of geological methane represented by methane hydrate has reached its critical point in the global carbon cycle, and some even believe that methane hydrate reservoirs are no longer within the stable state [14,15,16]. Therefore, it is crucial to accurately monitor the spatiotemporal distribution of methane concentration in the permafrost area of Northeast China. At present, the monitoring methods for air methane concentration mainly include ground- and space-based methods and satellite remote sensing methods. Satellite remote sensing methods can provide stable, long time series, wide space area, ground, or high-altitude three-dimensional atmospheric monitoring information, which can effectively make up for the lack of near-ground observation [15,16]. Commonly used methane thermally enhanced infrared detectors include SCIAMACHY (Scanning Imaging Absorption Spectrometer for Atmospheric Chartography), AIRS (Atmospheric Infrared Sounder), IASI (Infrared Atmospheric Sounding Interferometer), etc. Studies have shown that AIRS detectors have the highest correlation with ground-based observations in China [17,18,19,20,21,22,23,24]. Therefore, in this study, we used AIRS detector observation data from 2003 to 2022 and national meteorological station data, combined with on-site monitoring results in the study area, to study the spatiotemporal distribution characteristics of methane concentration in the permafrost area of Northeast China. Afterwards, we analyzed the geological sources of methane release to generate data for the estimation of methane emissions in the permafrost area of Northeast China.

2. Materials and Methods

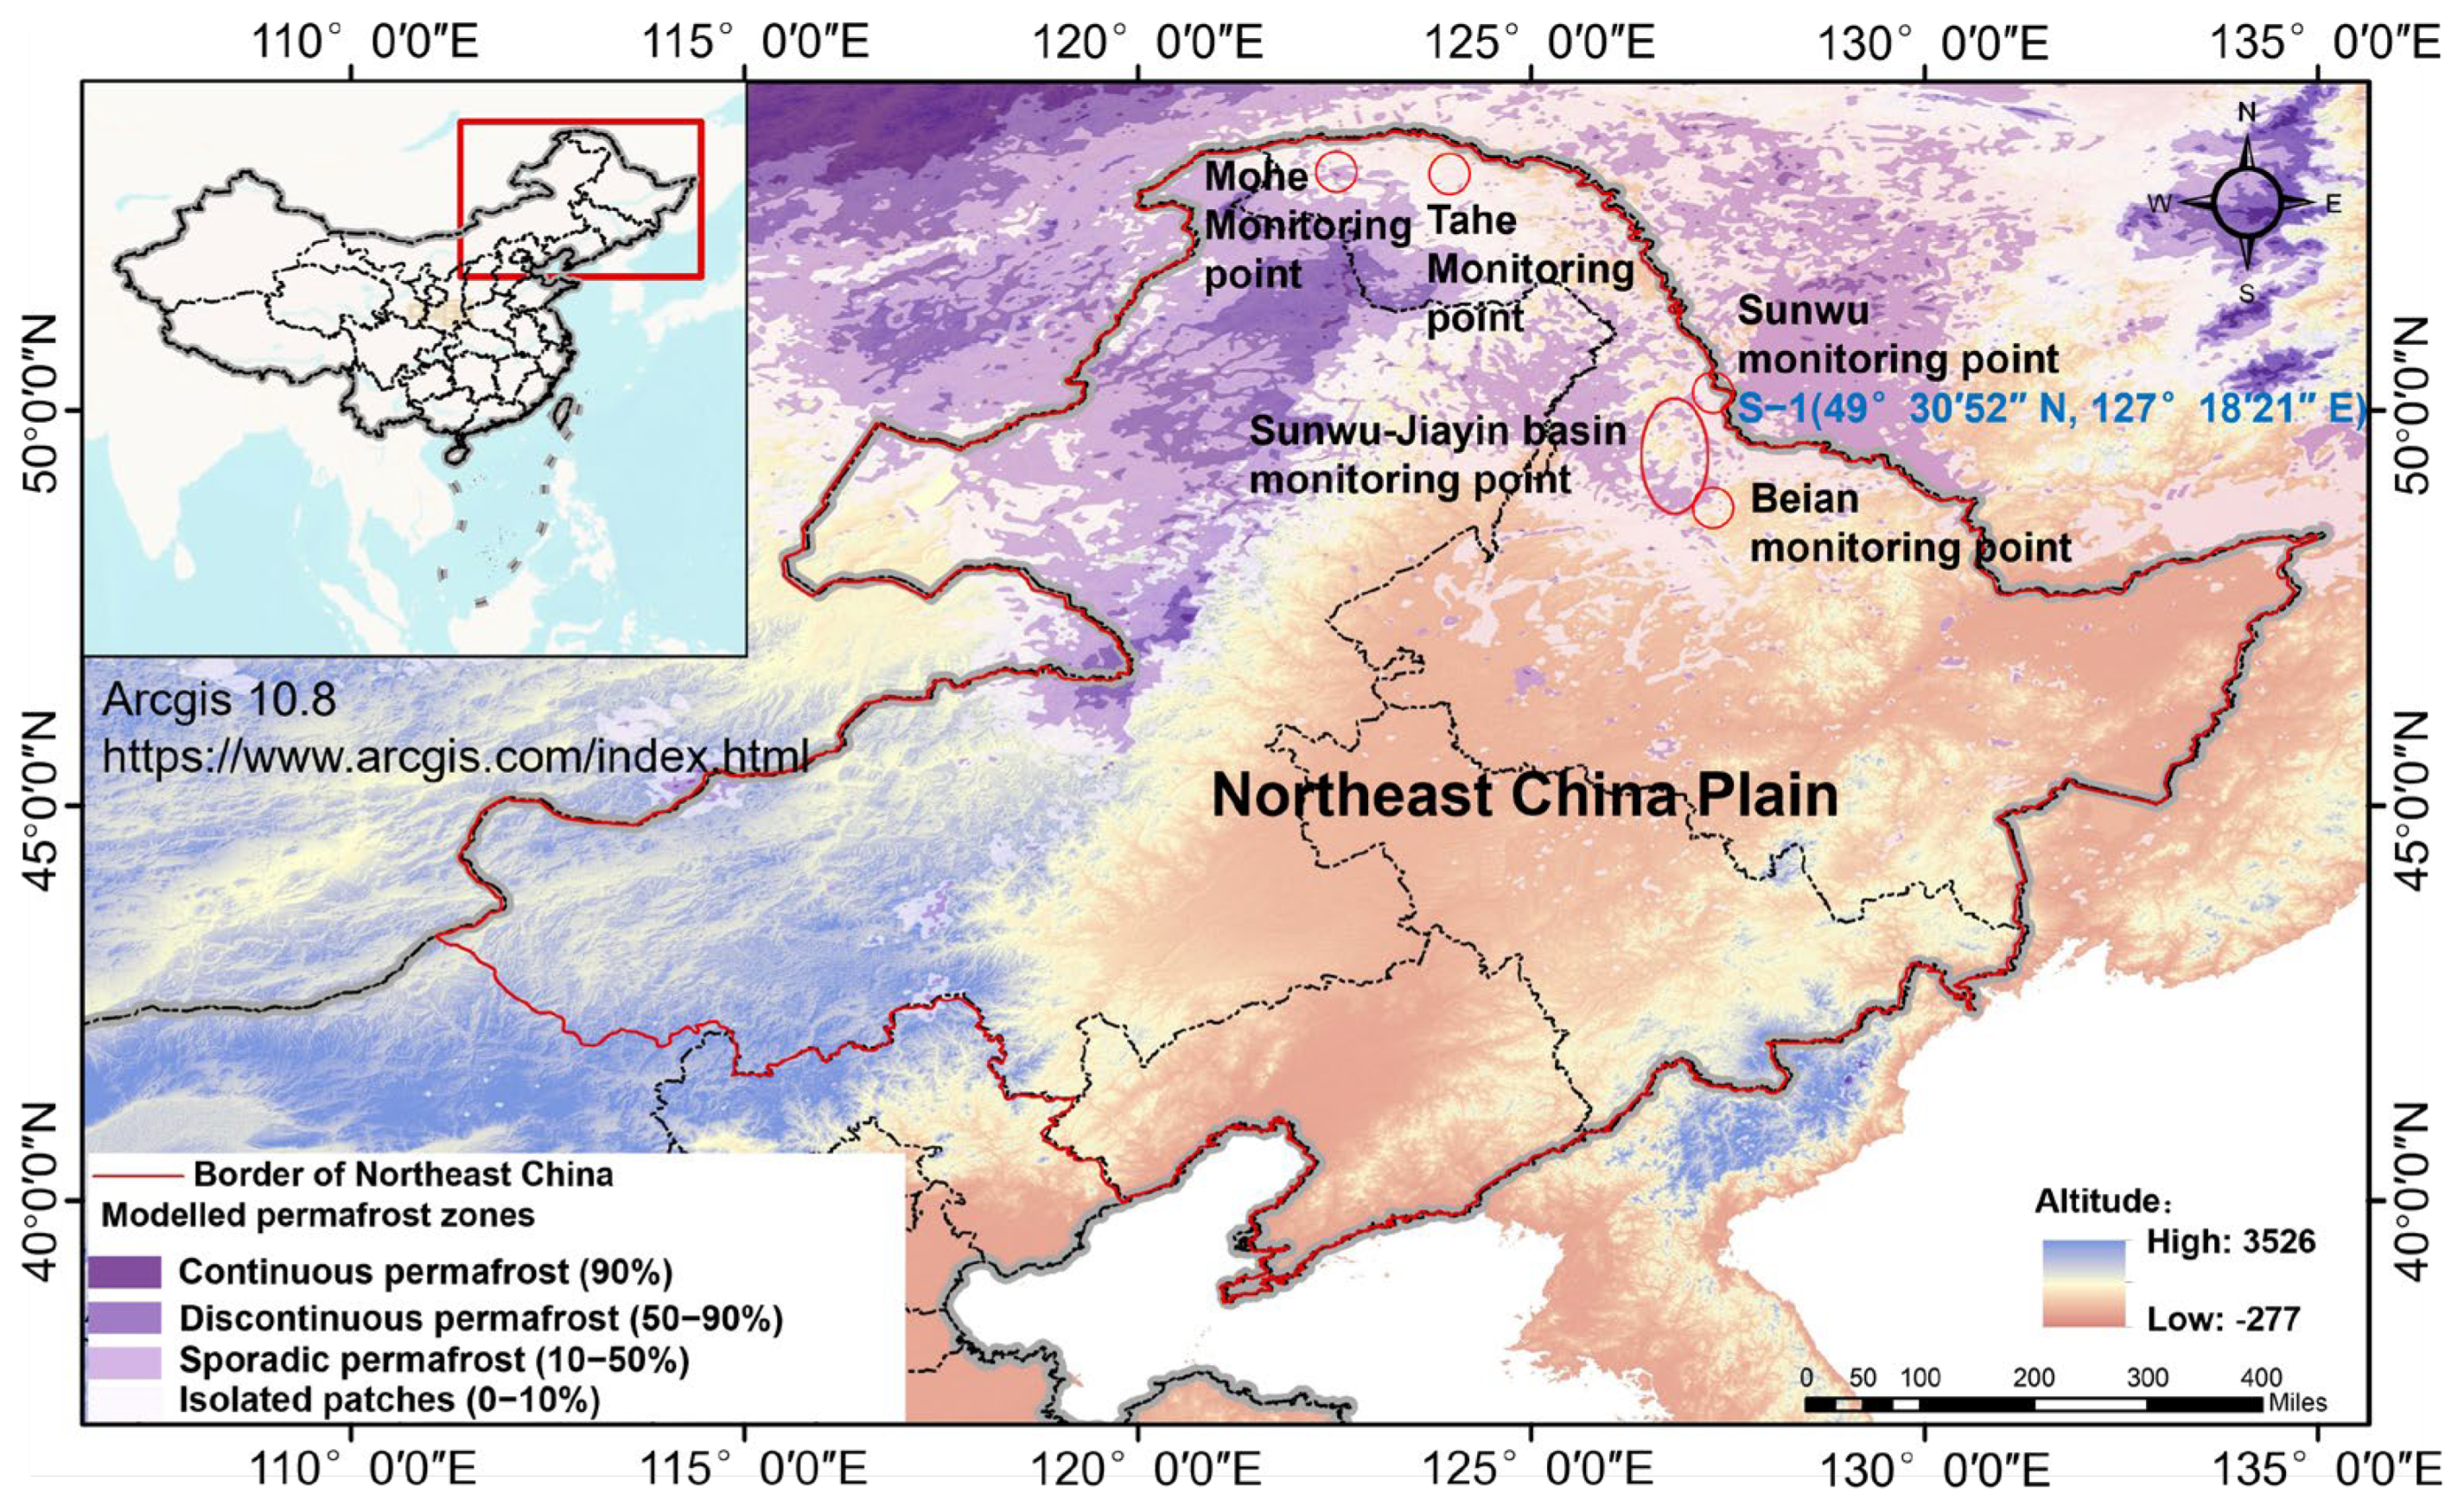
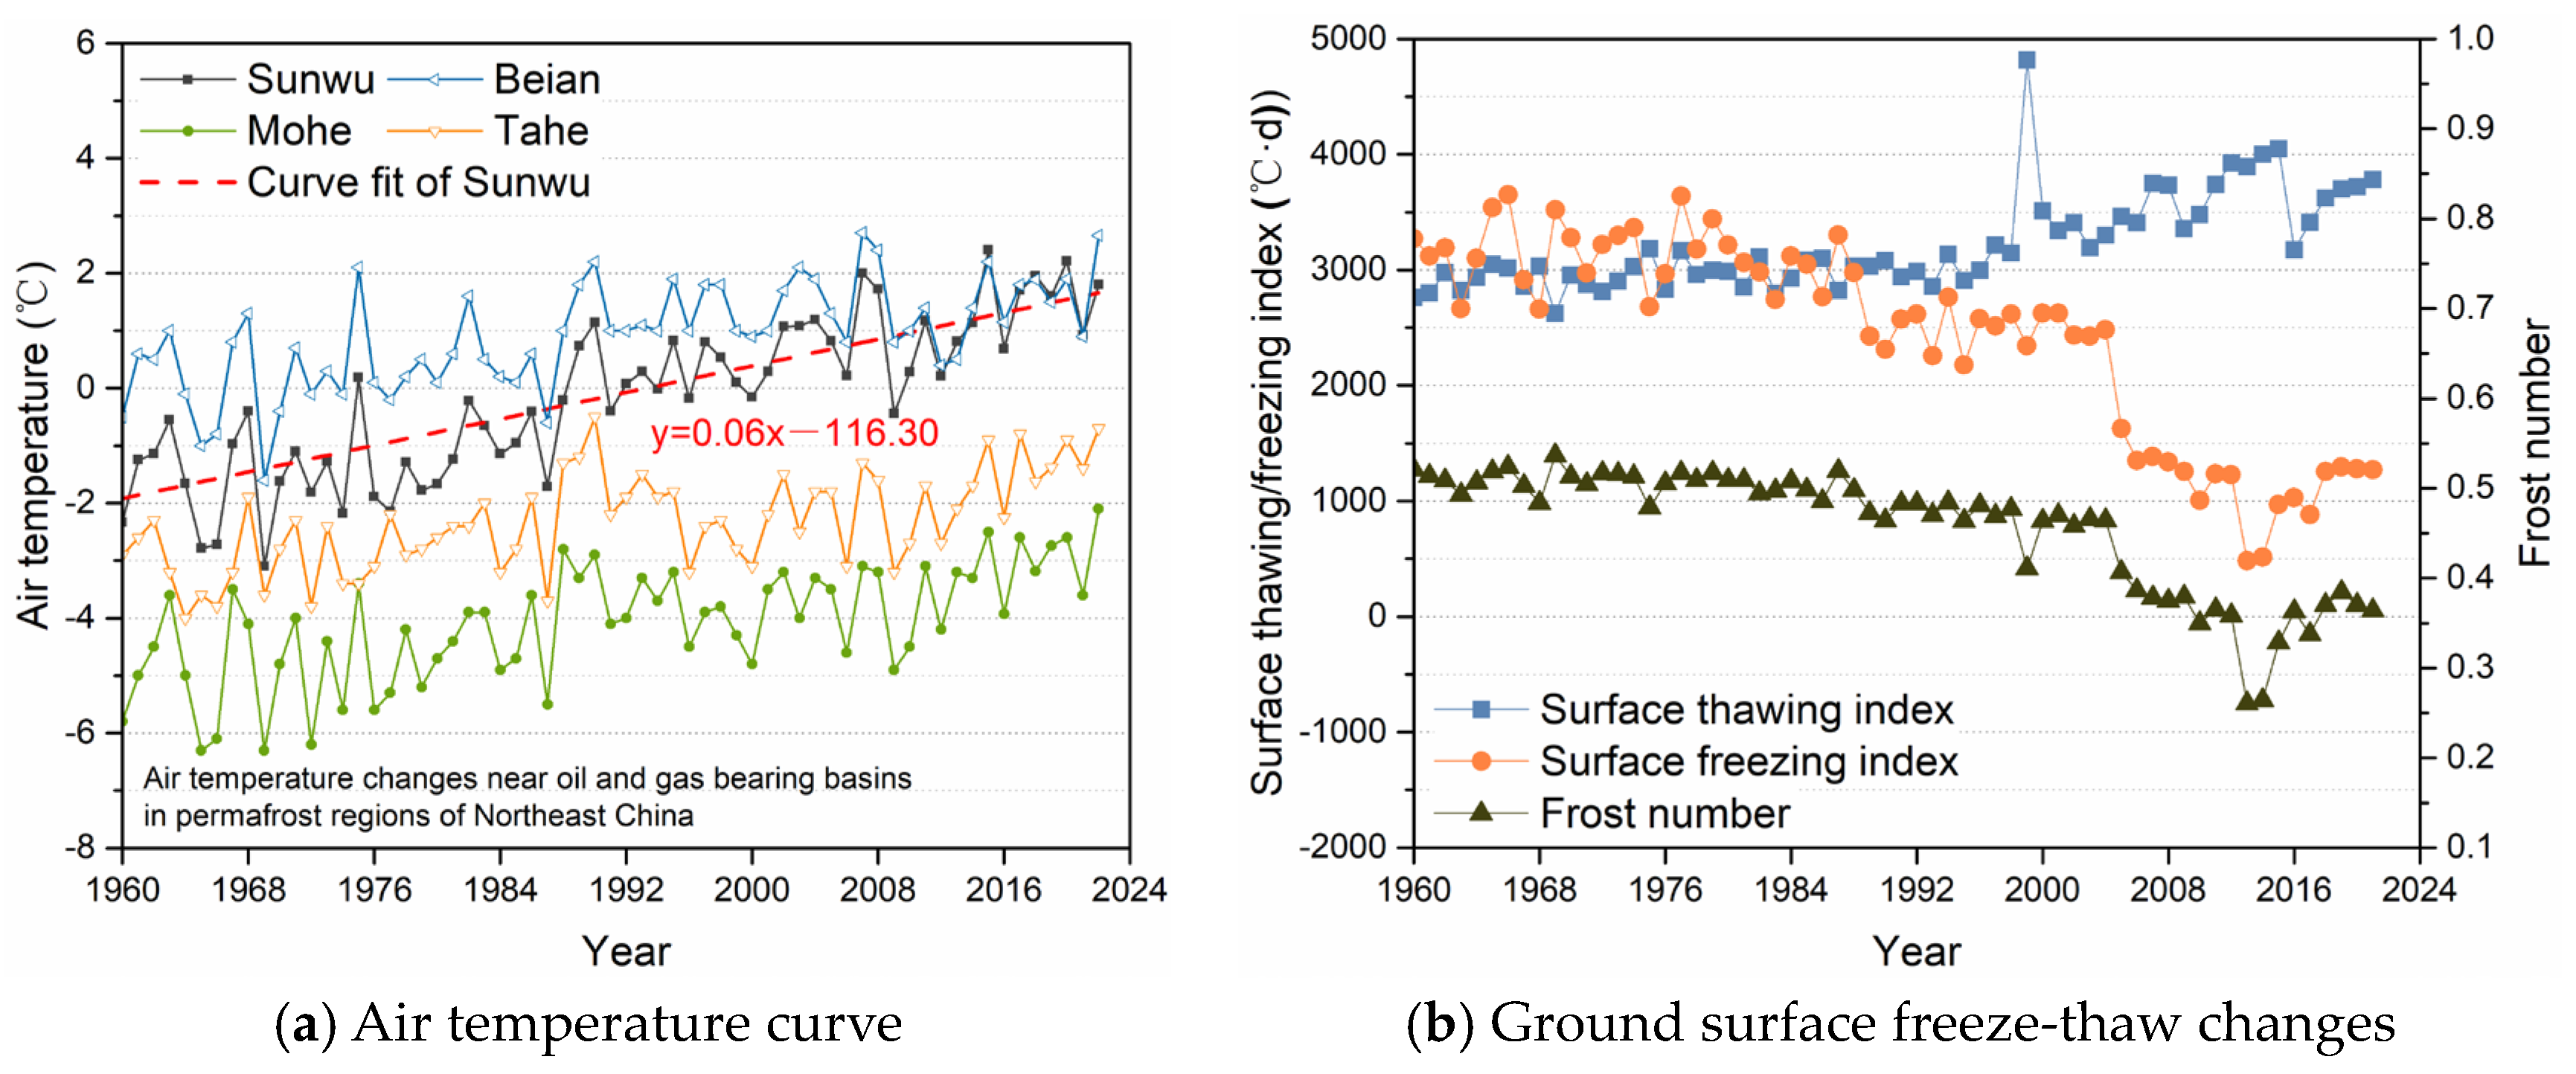
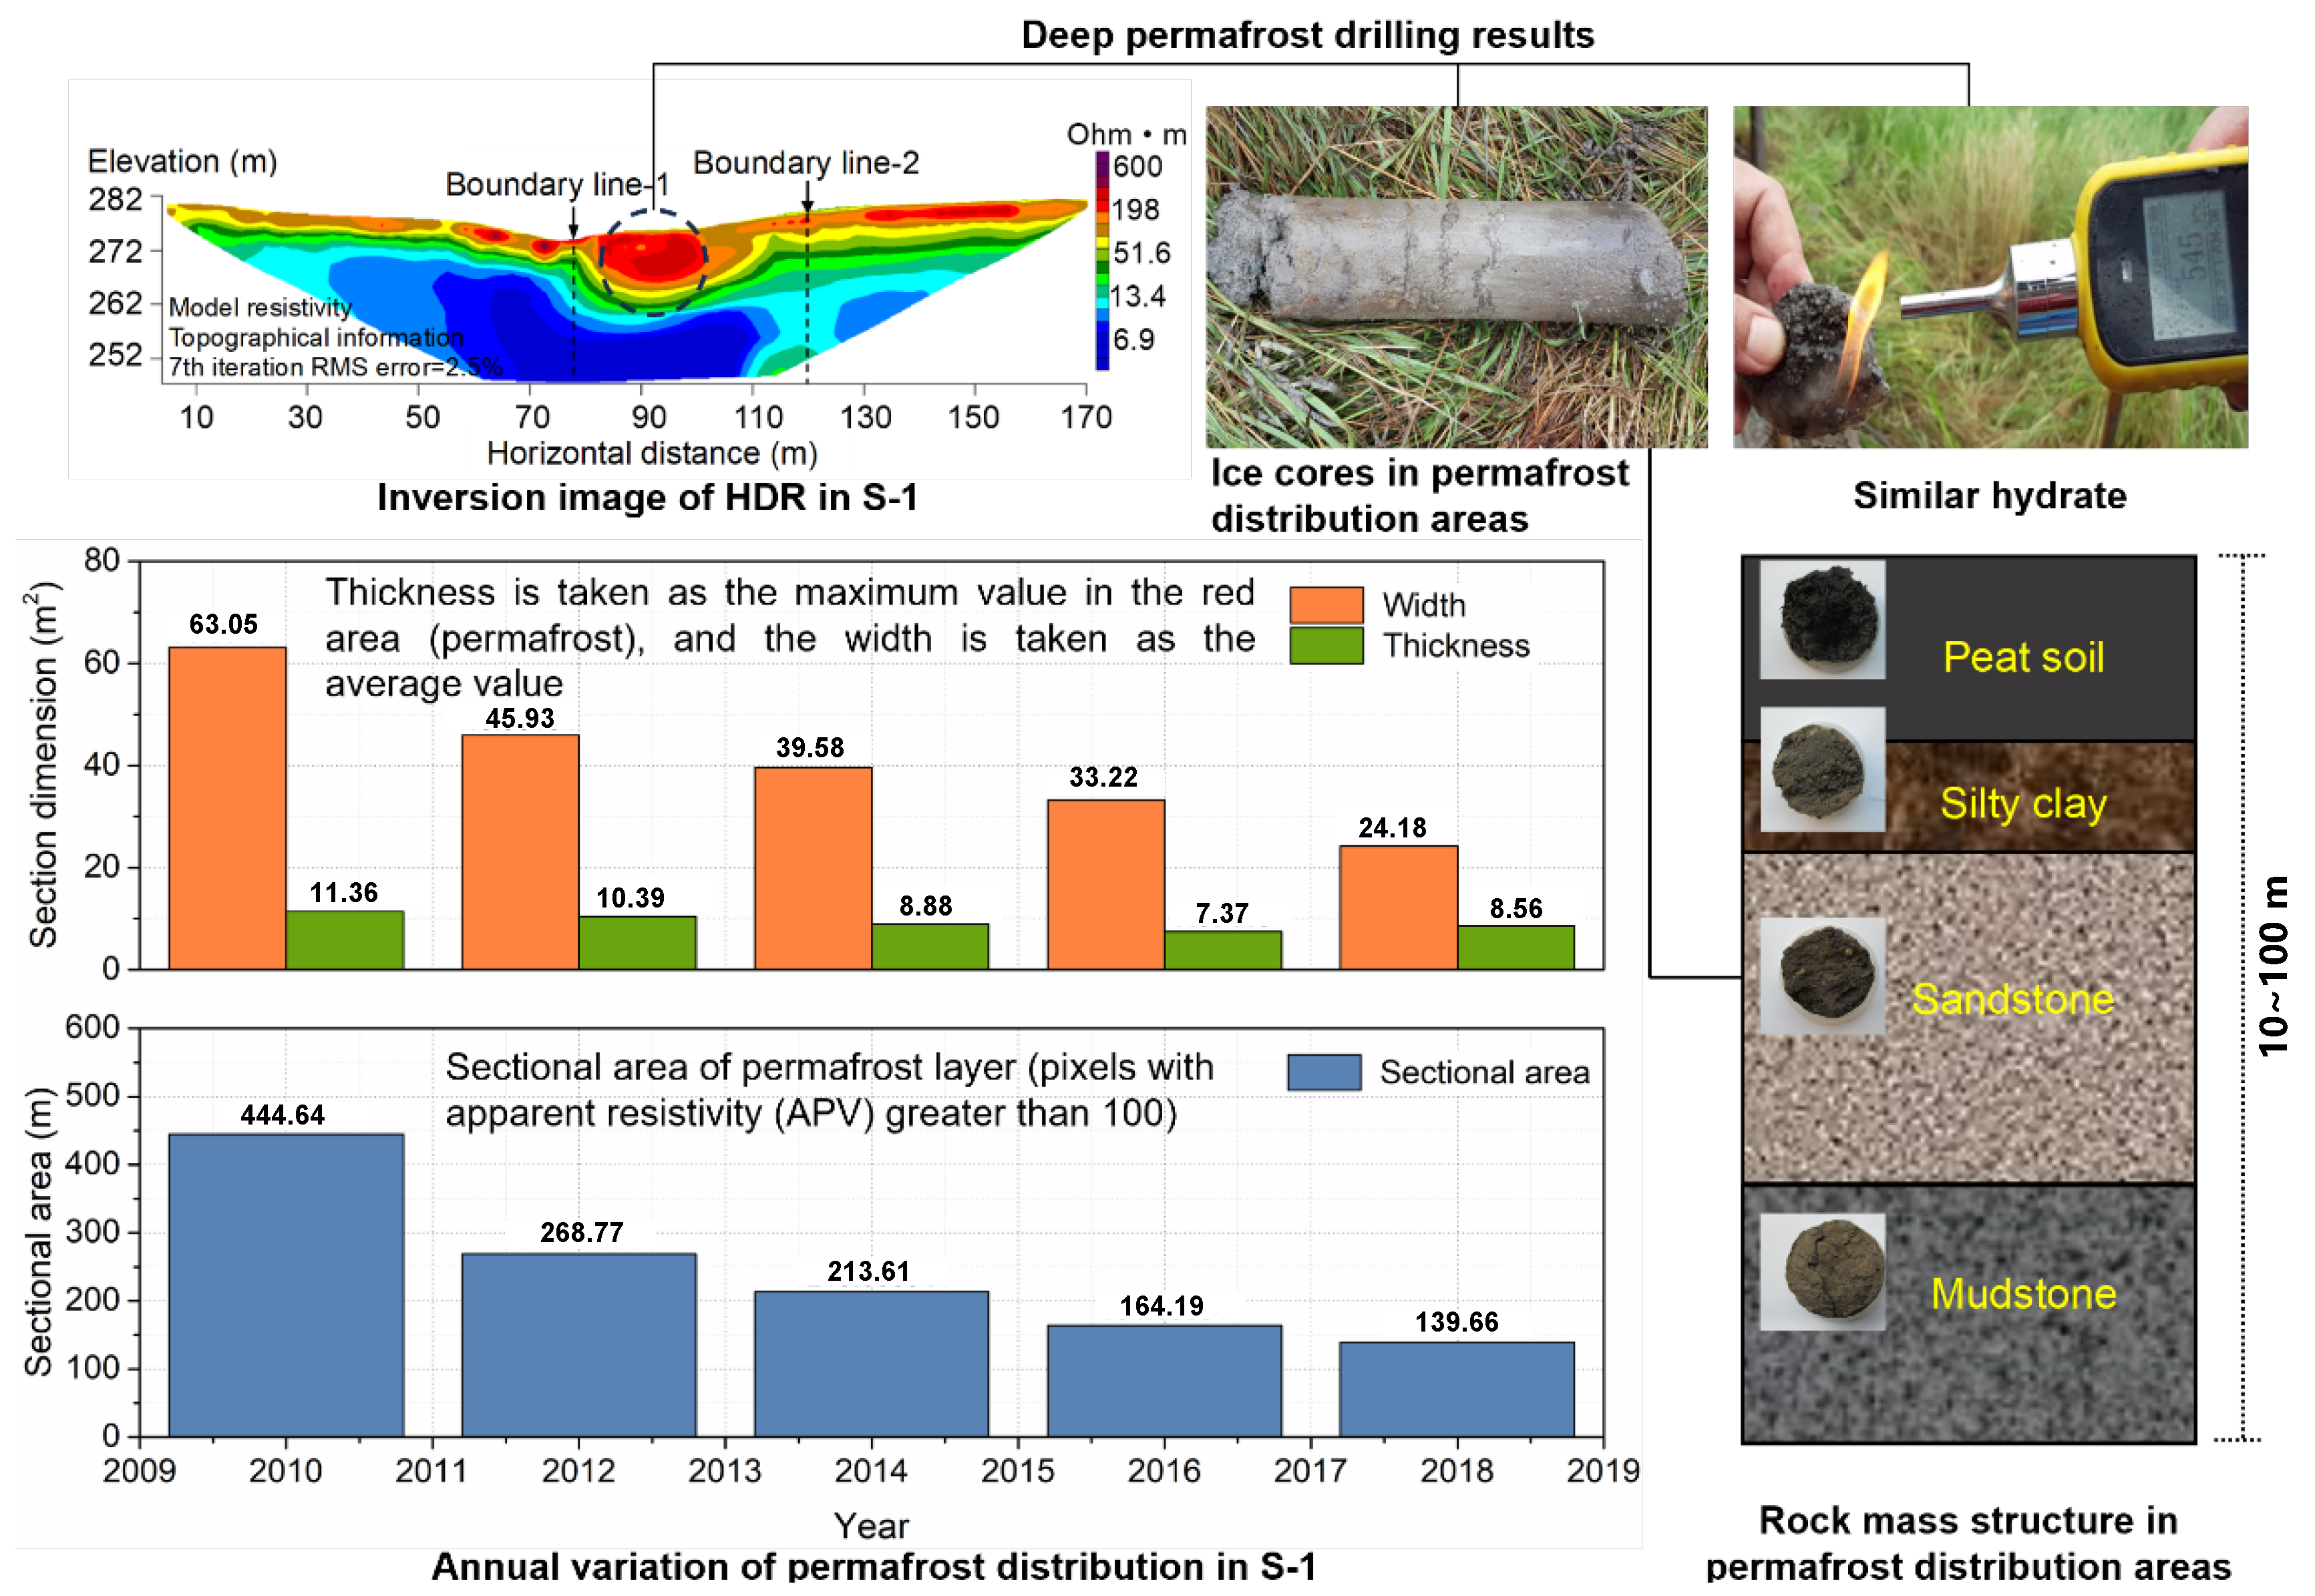
2.1. Introduction to Study Area

In this study, we selected the permafrost area of Northeast China as the study area and set up on-site monitoring points in areas such as the Sunwu-Jiayin basin. The Northeast China permafrost area is on the southern edge of Eurasia’s permafrost area, which is in the transition zone between the mid-temperate zone and the cold temperate zone. Affected by the high and low pressures of the ocean and inland areas and alternating monsoons, the mean annual air temperature is low and the annual range is large. Due to its high latitude and closeness to the cold winter wind sources of northern Asia, the winter is cold and long, with a cold and humid climate, exhibiting a continental monsoon climate. The distribution characteristics of permafrost from north to south mainly show continuous permafrost, discontinuous permafrost, sporadic permafrost, and isolated patches (Figure 1).
In recent years, the degradation characteristics of permafrost in Northeast China have been characterized by a gradual increase in ground temperature, an increase in the thickness of the active layer, and an increase in the melting zone. The permafrost exhibits a decrease in the upper limit and an increase in the lower limit, and the degradation mode of the permafrost changes the upper and lower limits simultaneously, with the lower limit rising faster than the upper limit falls [4,5,6]. In the past 50 years, the air temperature in Northeast China has increased by 0.9~2.2 °C, which has caused the southern edge of the Eurasia permafrost zone to obviously move northward. The area of permafrost in Northeast China has decreased by 35~37% compared with that in the 1970s [7].

2.2. Methods and Data Validation

This paper mainly uses a combination of ground-surface meteorological station monitoring and AIRS remote sensing data to study the spatiotemporal distribution of methane concentration in the permafrost area of Northeast China. Ground surface monitoring was conducted by setting up on-site observation points in areas such as the Sunwu-Jiayin basin and selecting representative permafrost degradation areas S-1(49°30′52″ N, 127°18′21″ E, altitude 278 m) to arrange methane concentration sensors, soil pore water pressure sensors, air temperature sensors, and ground temperature sensors. The related parameters in the study area S-1 have been monitored since January 2009. Simultaneously using HDR (high-density electrical method) for exploration and conducting on-site drilling (Figure 2).
For the meteorological station, we adopted a monitoring system (http://www.qixiangshuju.com/, accessed on 1 January 2023) to monitor meteorological data in real time. The meteorological station model (GD24-YCXQ, equipment model) is composed of a data acquisition host, a data analysis system, a data transmission system, IoT sensors, a ground-penetrating radar wireless transmission system, a solar power supply system, etc. The data collector, controlled by the CPU, collected data in real time. After linearization and quantization processing, the transformation from process variables to elements was achieved. The working environment temperature of the meteorological station was −30~+70 °C, and it stores 64 GB of data per hour. The system mainly included ground surface methane concentration sensors (QT21-BX80-CH4, equipment model) and air temperature sensors (GD51-KWSY, equipment model). The methane concentration sensor (QT21-BX80-CH4, equipment model) has a measurement range of 0–1000 ppm, a measurement accuracy of ± 1% (F.S., full scale), a resolution of 0.1 ppm, and a working temperature range of −25~+45 °C. The air temperature sensor (GD51-KWSY, equipment model) has a measurement range of −30~+75 °C, a measurement accuracy of ± 0.2 °C, a resolution of 0.1 °C, and an operating temperature range of −40~+75 °C.
Remote sensing data were obtained from the atmospheric infrared detector AIRS on the Aqua satellite. AIRS uses multi-aperture, stepped infrared grating array light-splitting technology to observe and analyze infrared light from the Earth’s atmosphere and ground surface. The infrared spectrum area observed by the detector covers 650~2700 cm−1 and is divided into 2378 channels. The average spectral resolution (λ/Δλ) of AIRS is about 1200, which is divided into three bands: 3.74~4.61, 6.20~8.22, and 8.80~15.4 μm, covering the 7.66 μm methane detection zone. AIRS observations can cover the world twice a day [21,22,23,24]. The analysis was conducted using a dataset from January 2003 to December 2022, with a horizontal resolution of 1° × 1° (URL: https://airs.jpl.nasa.gov/data/get_data, accessed on 1 January 2023). In addition, due to the relatively uneven vertical mixing of methane concentrations in the troposphere, a range of 700 hPa to 200 hPa was selected for analysis. To verify the reliability of the remote sensing data, we used observation data from global atmospheric background monitoring stations such as Waliguan (WLG, 100.90° E, 36.28° N, altitude: 3816 m) and Ulan Ule (UUM, 111.09° E, 44.45° N, altitude: 1007 m) from 2003 to 2021 for the quantitative and qualitative comparative comparison of AIRS secondary support products (Figure 3).
A Pearson correlation analysis [26] was conducted on methane concentrations at the AIRS and atmospheric background monitoring stations at the same time and latitude using SPSS STATISTICS statistical analysis software (Table 1). From Table 1, the monthly average methane concentration correlation coefficients between the AIRS and atmospheric background monitoring stations in the WLG are 0.712 (200 hPa), 0.721 (300 hPa), 0.747 (400 hPa), 0.731 (600 hPa), and 0.768 (700 hPa); the annual average methane concentration correlation coefficients between the AIRS and atmospheric background monitoring stations in the WLG are 0.968 (200 hPa), 0.960 (300 hPa), 0.963 (400 hPa), 0.961 (600 hPa), and 0.959 (700 hPa). The monthly average methane concentration correlation coefficients between the AIRS and atmospheric background monitoring stations in the UUM are 0.490 (200 hPa), 0.503 (300 hPa), 0.542 (400 hPa), 0.512 (600 hPa), and 0.528 (700 hPa). The annual average methane concentration correlation coefficients between the AIRS and atmospheric background monitoring stations in the UUM are 0.963 (200 hPa), 0.952 (300 hPa), 0.949 (400 hPa), 0.966 (600 hPa), and 0.954 (700 hPa). The correlation analysis passed α = 0.01, so the methane concentration data from the AIRS and atmospheric background monitoring stations are significantly positively correlated overall, and the mutation points are consistent, which can be used for the analysis of methane concentration distribution characteristics.
Further combining the MODIS data, the surface frost number Fn is given, as shown in Equation (1), which can be used to evaluate the distribution of permafrost and determine the plane distribution boundaries between permafrost and seasonal permafrost, as well as between continuous and discontinuous permafrost intervals in permafrost regions. DDT is the surface melting index, calculated from the daily cumulative value of surface temperature above 0 °C between 1 January and 31 December of each year, as shown in Equation (2); DDF is the surface freezing index, calculated from the cumulative daily absolute value of surface temperature below 0 °C between 1 July and 30 June of the following year, as shown in Equation (3).
F n = D D F D D F + D D T
D D T = 1 n T               T > 0   ° C
D D F = 182 n   T y   + 1 181   T y + 1         T < 0   ° C
The surface frost number Fnc under the influence of vegetation factor Et is shown in Equation (4).
F n c = E t × F n

3. Results and Discussion

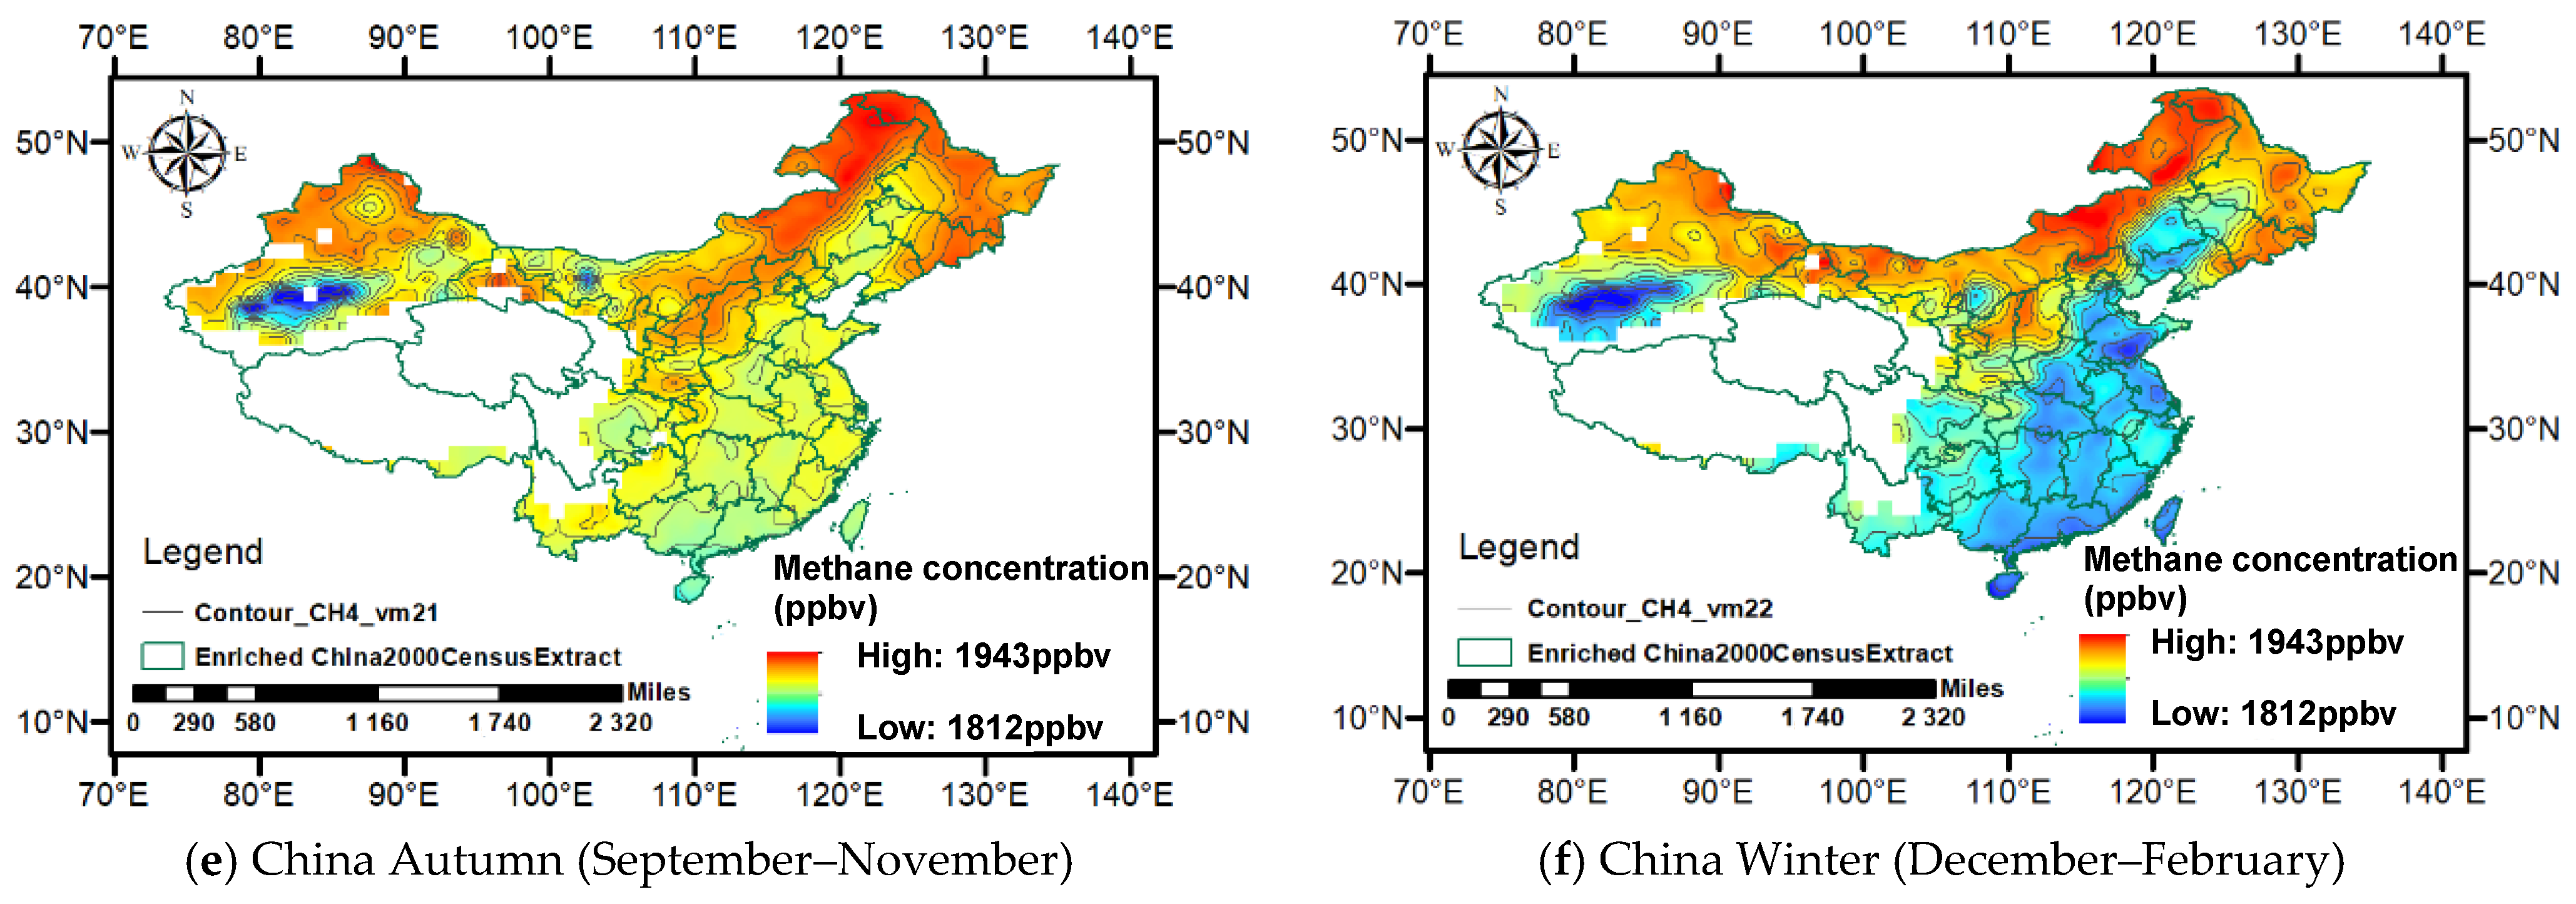
3.1. Spatiotemporal Distribution Characteristics of Near-Surface Troposphere Methane Concentration in China and Northeast China

The spatiotemporal distribution of methane concentration in the near surface troposphere of China and Northeast China at different altitudes from 2003 to 2022 is shown in Figure 4 (850 hPa; Supplementary Materials: Figure S1 (400 hPa) and Figure S2 (600 hPa)). It can be seen that the overall spatiotemporal distribution of methane concentration at different tropospheric heights is basically consistent. The distribution characteristics of methane concentration in the troposphere of China are low in the south and high in the north. The high-value areas are mainly concentrated in the northwest, southwest, and northeast areas, with the highest values reaching 1903 ppbv (400 hPa), 1937 ppbv (600 hPa), and 1943 ppbv (850 hPa). Among them, the rice planting area in Heilongjiang Province of Northeast China accounts for more than 10% of the national total [27,28,29], so rice planting plays a major role in the tropospheric methane concentration in Northeast China, but the tropospheric methane concentration in Northeast China is mainly distributed in the Da and Xiao Xing’an Mountains permafrost area rather than the rice planting area in the Northeast China Plain, as shown in Figure 4 (850 hPa; Supplementary Materials: Figure S1 (400 hPa) and Figure S2 (600 hPa)).
There is significant seasonal variation in methane concentrations in the near-surface troposphere of China. In spring, the near-surface tropospheric methane concentration is mainly concentrated in the Northeast China high-latitude permafrost zone, southwest Sichuan, and northern Xinjiang, while the methane concentration in the Northeast China plain and the Qinghai–Tibet Plateau is relatively low. In summer, the near-surface tropospheric methane concentrations are relatively high at mid-to-high latitudes, with only relatively low methane concentrations in the northwest Qinghai–Tibet Plateau and southern China. In autumn, the near-surface tropospheric methane concentration in South China is higher than that in North China, and the methane concentration in Southwest China is the highest. In winter, the near-surface tropospheric methane concentration is generally low, with high values mainly concentrated in the permafrost area of Northeast China, as shown in Figure 4 (850 hPa); Supplementary Materials: Figure S1 (400 hPa) and Figure S2 (600 hPa)).
Further refinement of the distribution status of permafrost regions in Northeast China (Figure 5a,b) reveals that as latitude increases, permafrost undergoes a transition from sporadic distribution to island-like and continuous permafrost distribution. The south boundary of the Northeast China permafrost is W shaped, extending southward to the Aershan Mountains and eastward to Yichun. The continuous permafrost in Northeast China is mainly distributed in the northwest of the Da Xing’an Mountains. From 2003 to 2019, the ground surface frost number in the Da and Xiao Xing’an Mountains regions showed a downward trend, among which the average ground frost number in the north of the southern boundary of the Northeast China permafrost decreased by 0.014, the average ground frost number in the Da Xing’an Mountain decreased by 0.020, and the average frost number in the Da Xing’an Mountain was greater than that in the Xiao Xing’an Mountain. Using the ground surface frost number Fnc under the influence of ground surface vegetation factors as the standard to classify the stability types of permafrost in Northeast China, permafrost in Northeast China can be divided into extremely stable permafrost, with Fnc ≥ 0.66; stable permafrost, 0.55 ≤ Fnc < 0.66; sub-stable permafrost, 0.51 < Fnc < 0.55; transitional and unstable permafrost, 0.49 ≤ Fnc ≤ 0.51; and seasonal frozen soil (maximum frozen depth > 1.8 m), 0.40 ≤ Fnc < 0.49 (Figure 5c,d).
Based on the distribution status of permafrost regions in Northeast China (Figure 5) and the distribution of methane concentration in the near-surface troposphere of Northeast China (Figure 4b), it was found that the overall distribution of methane concentration is consistent with the distribution of permafrost regions, and the methane concentration in the northern part of the Da and Xiao Xing’an Mountains in Northeast China is the highest in the continuous permafrost regions (stable and sub-stable permafrost regions), up to 1937 ppbv (400 hPa). This is because this area is located in the hinterland of the forest region, with a high soil carbon content and a large geological methane basin, Mohe. The discontinuous permafrost regions and sporadic permafrost (transitional and unstable permafrost regions) have higher methane concentrations in the near-surface troposphere of Northeast China, up to 1902 ppbv (400 hPa), while the isolated patches in the southernmost region (seasonal permafrost regions) have lower methane concentrations in the near-surface troposphere of Northeast China, up to 1822 ppbv (400 hPa).
Further analysis of the growth rate of methane concentration in the near-surface troposphere of Northeast China revealed that the discontinuous permafrost regions and sporadic permafrost regions (transitional and unstable permafrost regions) and the isolated patches (seasonal permafrost regions) in the southernmost region actually had a higher growth rate of methane concentration, up to 9.151 ppbv/a and 8.158 ppbv/a. However, the growth rate of methane concentration in the near-surface troposphere of Northeast China in the continuous permafrost region (stable and sub-stable permafrost regions) in the north of the Da and Xiao Xing’an Mountains is relatively low, up to 4.638 ppbv/a. The growth rate of methane concentration in the near-surface troposphere in Northeast China permafrost regions gradually increases with the accelerated degradation of permafrost; that is, the growth rate of methane concentration in the southern permafrost degradation zone is higher than that in the northern permafrost stable zone.

3.2. Changes in near-Surface Tropospheric Methane Concentration in Northeast China

The methane concentration in the near-surface troposphere of Northeast China has shown a gradual upward trend since 2003 (Figure 6a). The average methane concentration at 200 hPa increased from 1783 ppbv to 1874 ppbv, with a linear growth rate of 4.791 ppbv/a. The average methane concentration at 400 hPa increased from 1800 ppbv to 1900 ppbv, with a linear trend growth rate of 5.263 ppbv/a. The average methane concentration at 600 hPa increased from 1829 ppbv to 1919 ppbv, with a linear trend growth rate of 4.737 ppbv/a. The average methane concentration at 850 hPa increased from 1857 ppbv to 1936 ppbv, with a linear trend growth rate of 4.158 ppbv/a. The methane concentration in the troposphere gradually increased with the decrease in height.
The methane concentration monthly average variation in the near-surface troposphere in Northeast China shows significant bimodal seasonal variation (Figure 6b). The first peak occurs in summer (June–August), and the maximum methane concentrations occur in August, when the methane concentrations are 1842 ppbv (200 hPa), 1867 ppbv (400 hPa), 1890 ppbv (600 hPa), and 1913 ppbv (850 hPa). The second peak occurs in winter (December–February), and the maximum methane concentrations occur in December, with methane concentrations of 1823 ppbv (200 hPa), 1844 ppbv (400 hPa), 1871 ppbv (600 hPa), and 1894 ppbv (850 hPa).
Methane concentration in the near-surface troposphere in Northeast China shows an upward trend in each season (Figure 7), which is consistent with the overall trend of methane concentration in the troposphere in Northeast China. However, the growth rate varies with seasonal changes, with the highest growth rates of methane concentration in the near-surface troposphere in spring being 5.86 ppbv/a (400 hPa), 6.12 ppbv/a (600 hPa), and 6.16 ppbv/a (850 hPa). The growth rates of methane concentration in the near-surface troposphere in autumn and winter take second place, with linear trend growth rates of 6.14 ppbv/a (400 hPa), 5.83 ppbv/a (600 hPa), and 5.34 ppbv/a (850 hPa) in autumn and 5.73 ppbv/a (400 hPa), 5.47 ppbv/a (600 hPa), and 4.89 ppbv/a (850 hPa) in winter. The growth rate of methane concentration in the near-surface troposphere in summer is the lowest, with linear trend growth rates of 4.75 ppbv/a (400 hPa), 4.03 ppbv/a (600 hPa), and 3.14 ppbv/a (850 hPa). It can be seen that in recent years, the main methane release activities in the near-surface troposphere of Northeast China have been concentrated in the spring.

3.3. Changes in Ground Surface Methane Concentration in Permafrost Area of Northeast China

To further analyze the methane emission characteristics and sources of the permafrost area of Northeast China, on-site observation points were selected in areas such as the Sunwu-Jiayin basin, and representative permafrost degradation areas S-1 were selected to install methane concentration sensors. The results are shown in Figure 8.
From Figure 8, it can be seen that the annual maximum ground surface methane concentration occurs every spring overall (reaching the sensor limit of 1000 ppm; among them, the low methane concentration in spring 2016 was due to the occurrence of spring wildfires, which affected the release of surface methane and caused some methane to burn), which is consistent with the results of the AIRS remote sensing data. The overall surface methane concentration shows a decreasing trend year by year due to the gradual reduction in soil carbon after the thawing of permafrost.
The release of methane each year is mainly divided into three stages. The first stage of methane release is the high-concentration short-term emission stage (from March to May, frozen to melted, the release cycle is about 10 days, and the ground surface methane concentration exceeds 1000 ppm (red triangle)), and the peak is around March 25 each year. In winter, due to the obstruction of snow and the frozen layer on the ground, methane in the soil is difficult to release and gradually accumulates under the frozen layer. This form of methane gas mainly comes from geological methane and microbial methane stored in permafrost. When the temperature gradually increases in spring, the snow and frozen layer on the ground gradually thaw, which promotes the release of methane (the ice layer isolates oxygen, leading to insufficient oxidation of methane under the ice in winter and outbreaks of methane emissions [30]). The second stage of methane release is the high-concentration, long-term stable emission stage (the surface is not frozen in summer from June to August, the release cycle is more than two months of continuous emission, and the ground surface concentration can reach 453 ppm). In this stage, the air temperature gradually rises to the highest throughout the year, marsh methanogens produce methane, and the geological methane represented by hydrates in the frozen layer decomposes to produce methane, causing the ground surface methane concentration to be high and stable. In addition, due to the high temperatures in this stage, methanogens are relatively active, so the proportion of methanogen methane in this stage increases. However, due to relatively slow methanogenesis, the surface methane concentration in this stage is lower than that in the first stage. The third stage of methane release is the higher-concentration short-term emission stage (from September to November, melted to frozen, the release cycle is about 3 days, and the ground surface concentration can reach 326 ppm). In this stage, the air temperature gradually decreases, the methane production capacity of the marsh decreases, the depth of the active layer reaches its maximum, the geological methane and methanogen methane between the active layer and the permafrost upper limit gradually release, and the ground surface once again experiences short-term, highly concentrated methane emissions.

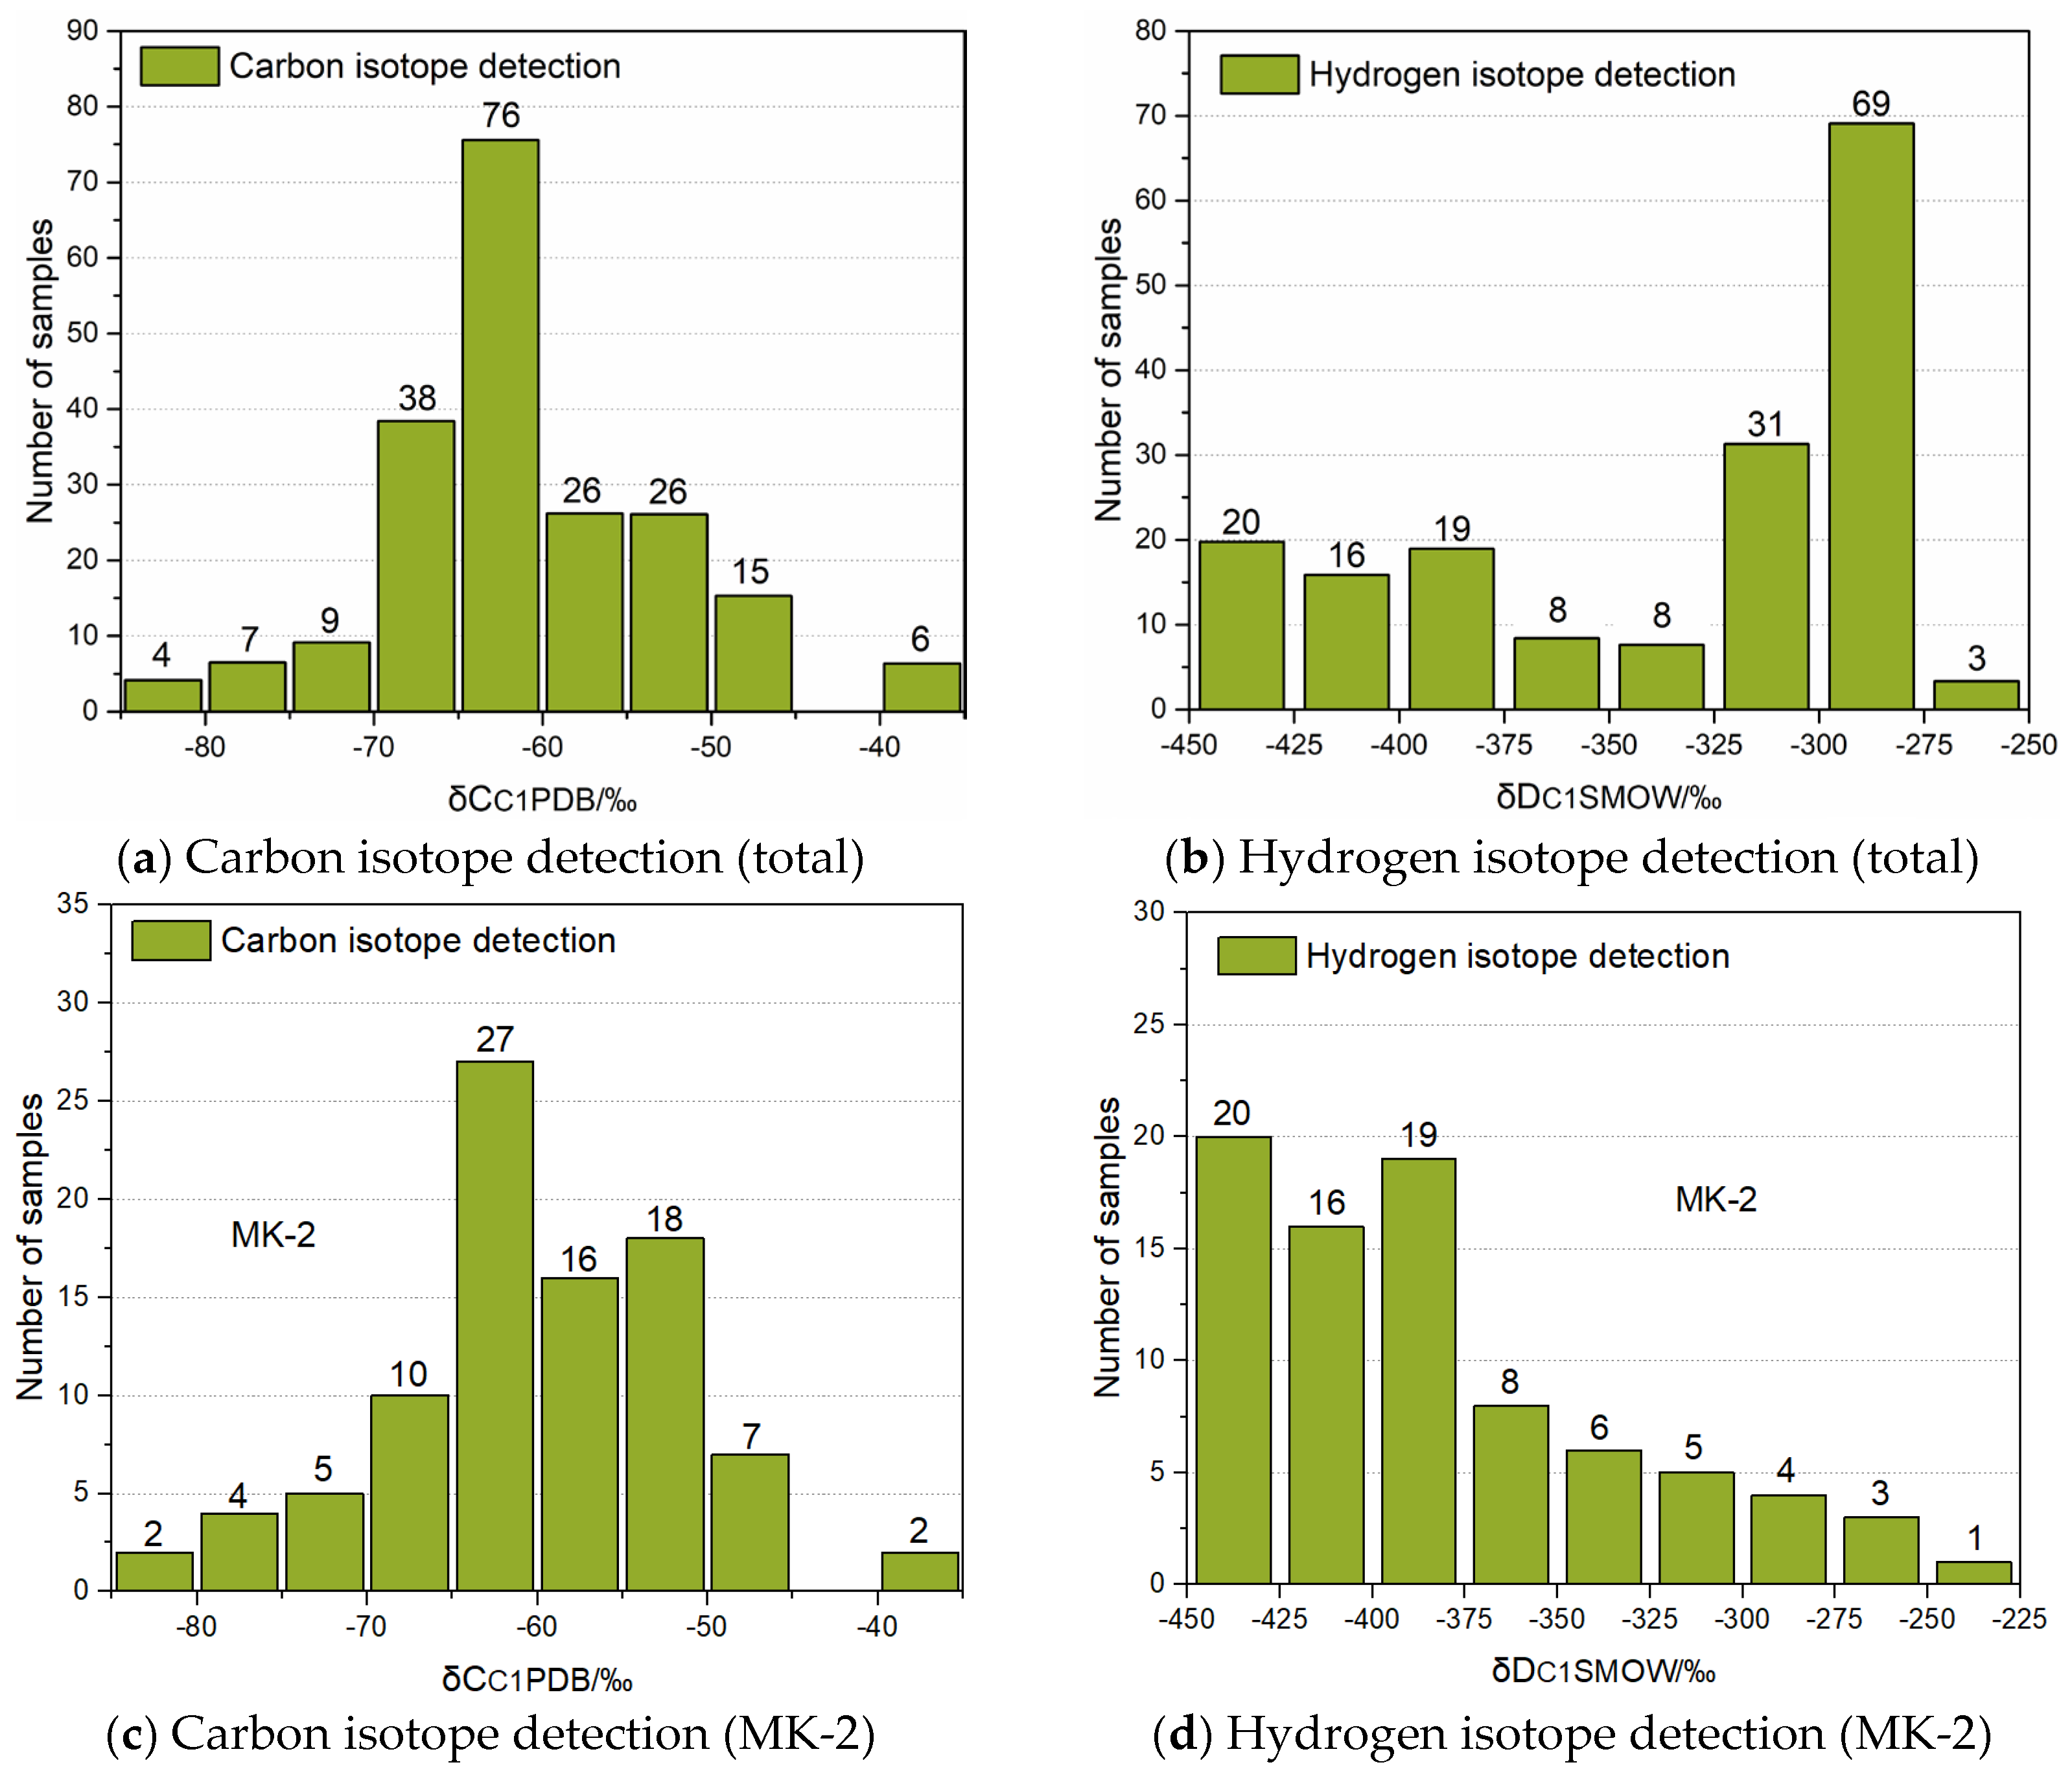
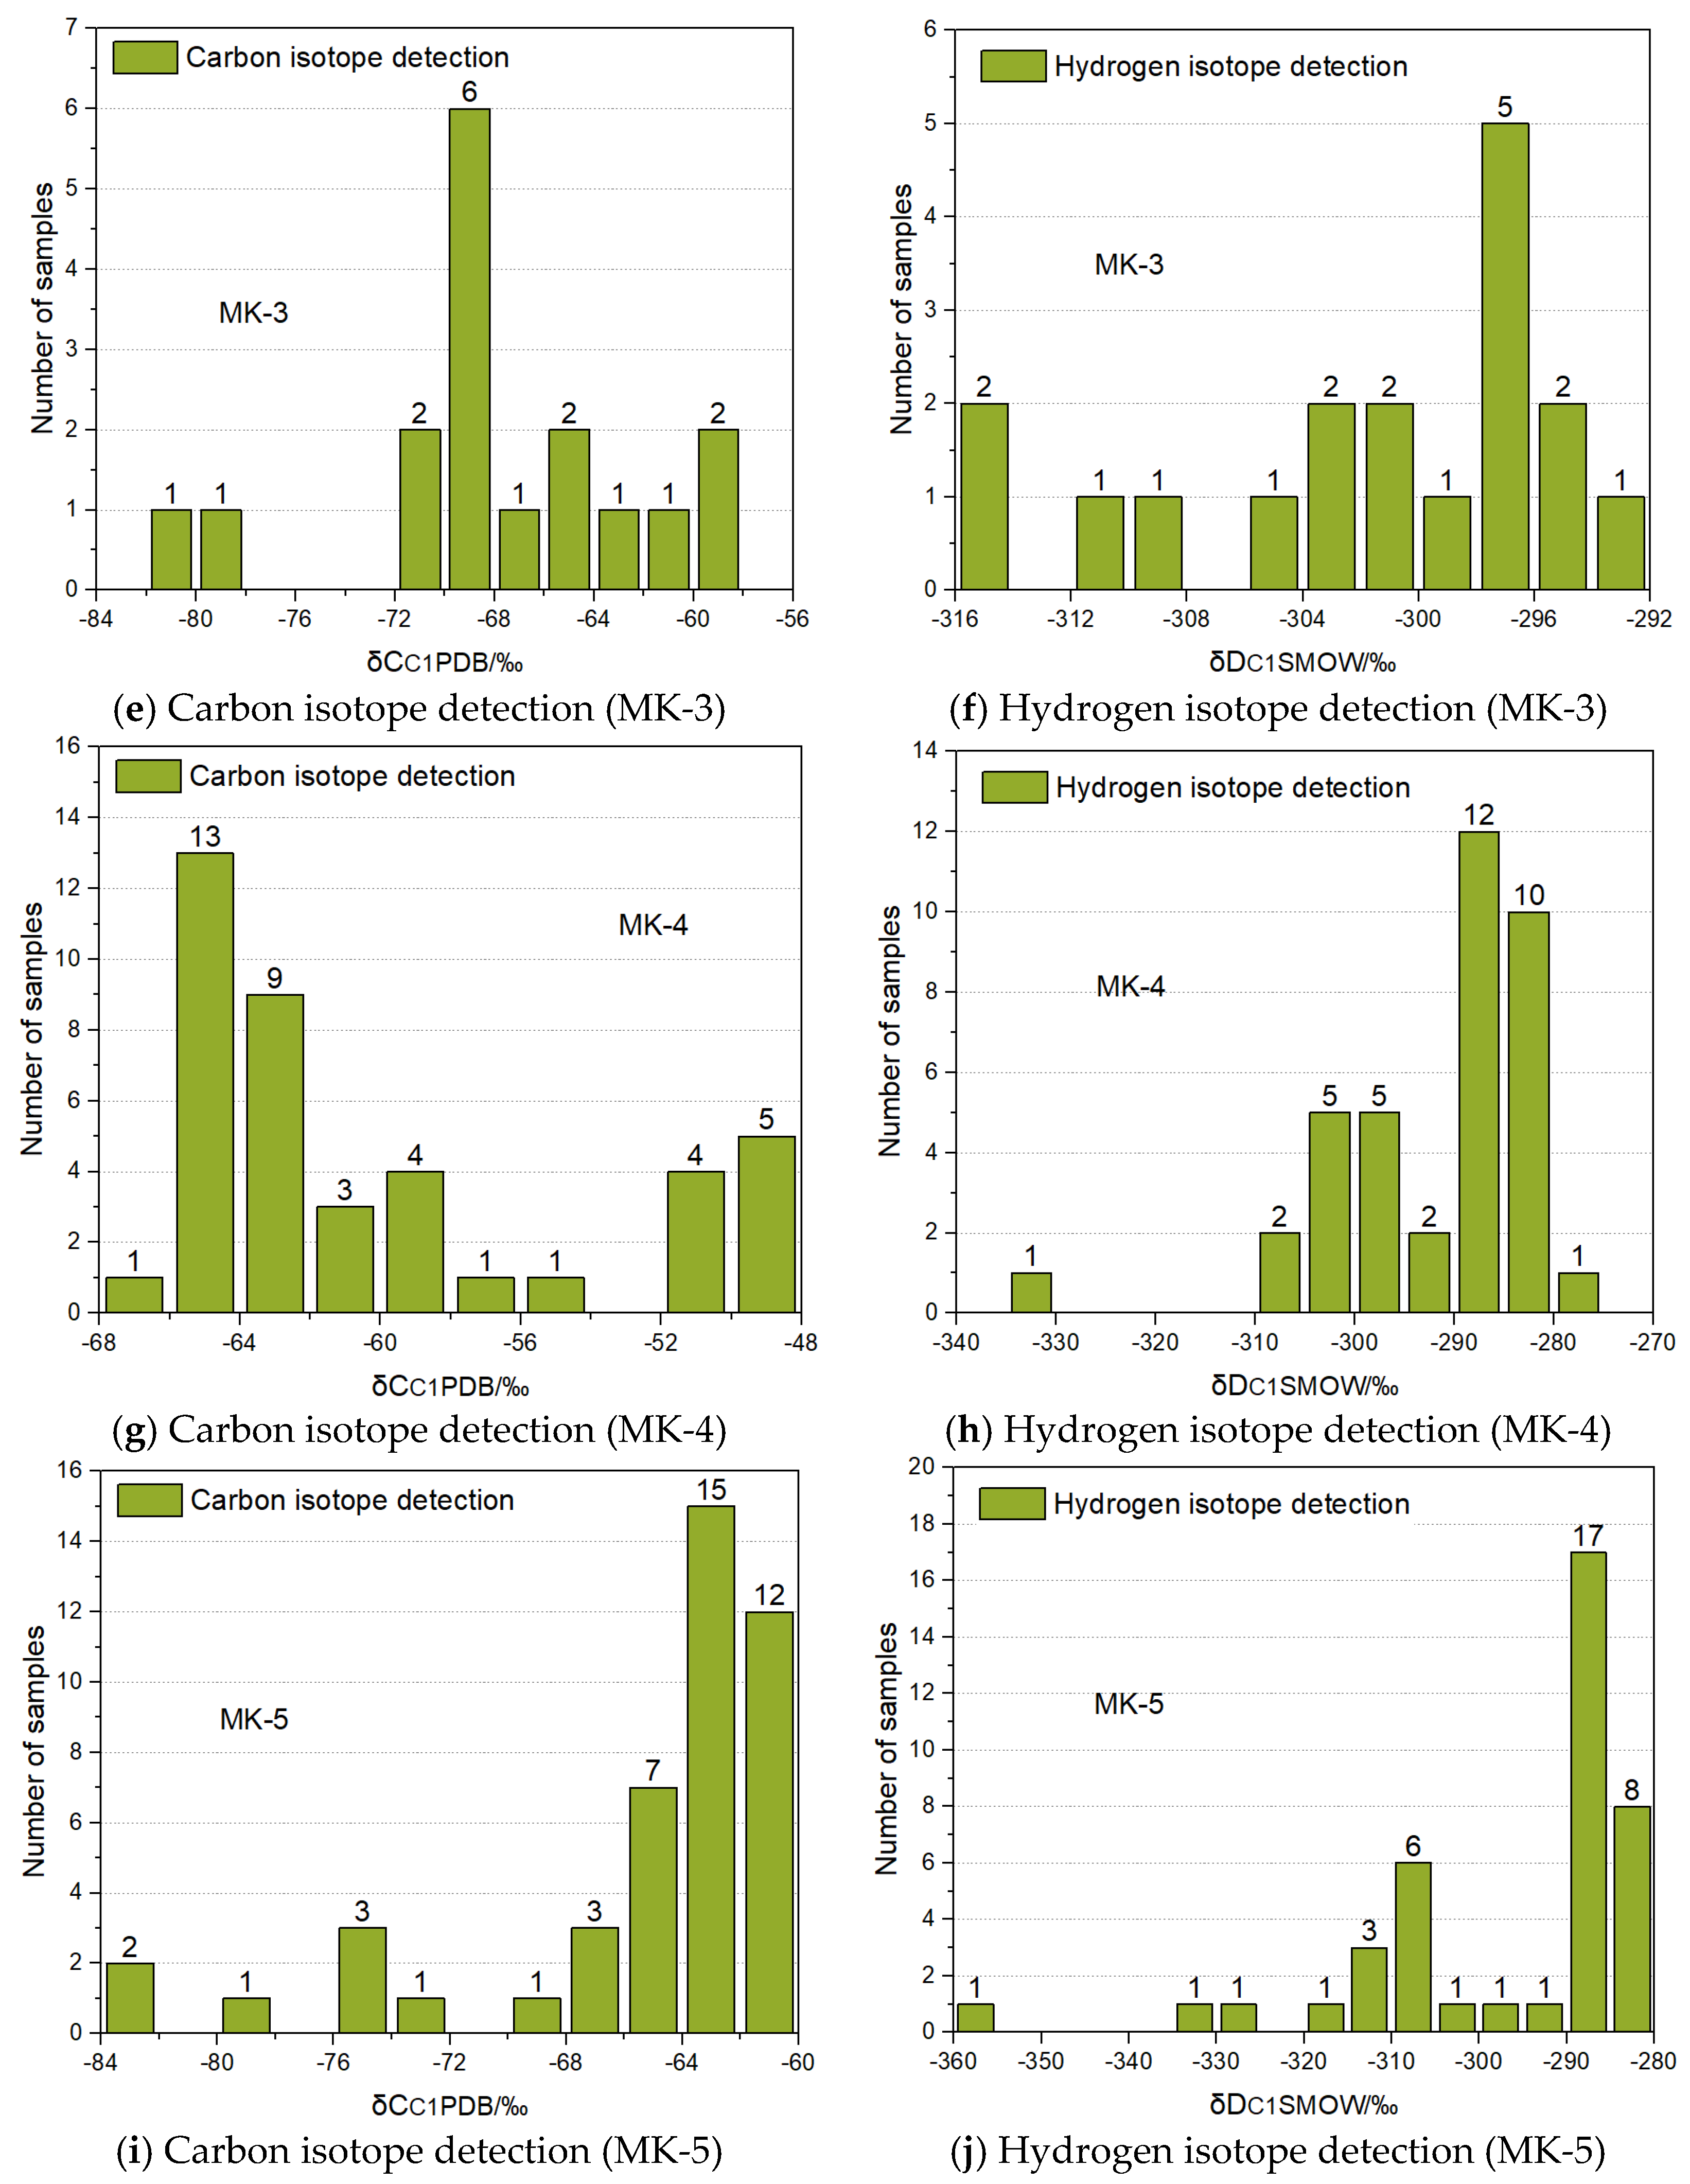
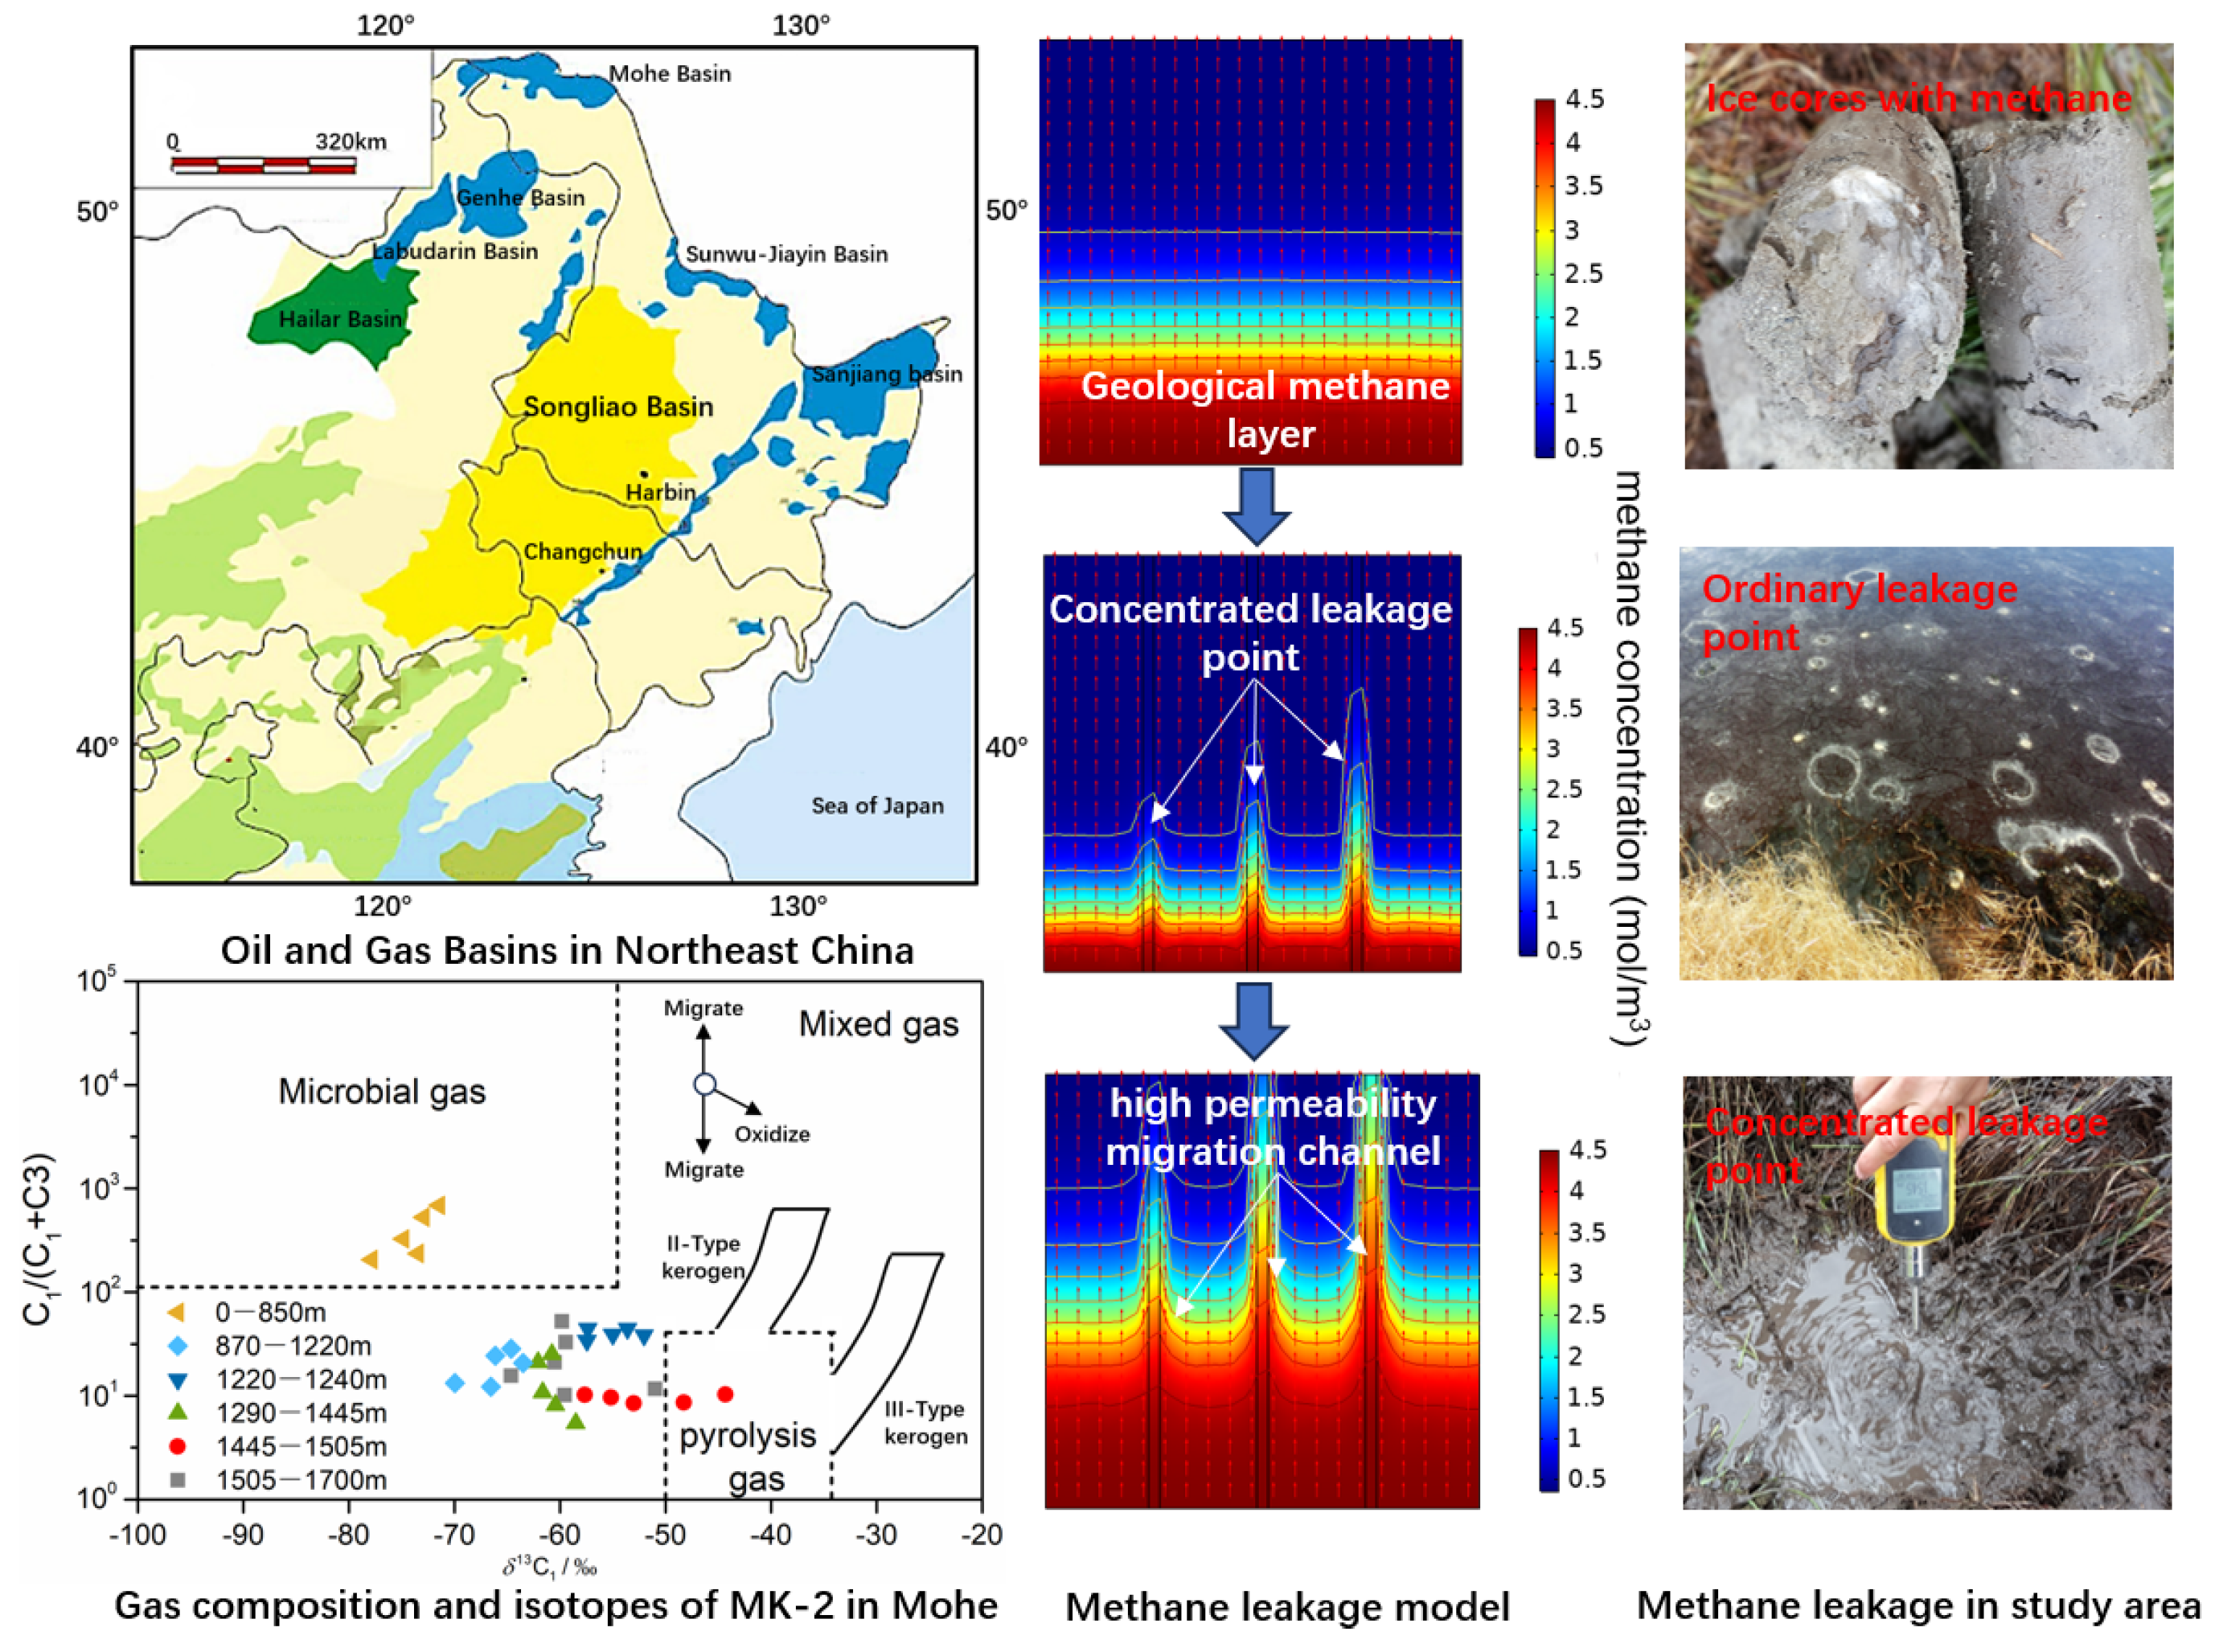
3.4. Analysis of Geological Methane Sources in Northeast China Permafrost Degradation Areas

Permafrost accounts for approximately 25% of the land in the northern hemisphere ((22 ± 3) × 106 km2), containing approximately 1700 Gt (1 Gt = 1015 g) of carbon, almost twice the current air carbon, and methane is an important form of carbon emissions in permafrost areas [4,10]. To further analyze the degradation of permafrost in Northeast China over the years, data from Sunwu (48°42′ N, 126°31′ E), Bei’an (47°42′ N, 127°51′ E), Mohe (52°58′ N, 122°31′ E), and Tahe (51°48′ N, 124°33′ E) National Meteorological Stations located on the southern edge of the permafrost degradation zone in Northeast China were selected (these areas have obvious characteristics of permafrost degradation), and the seasonal changes of permafrost were analyzed using the high-density resistivity method (Figure 9).
From Figure 9a, it can be seen that the annual average air temperature in the study area S-1 was relatively stable from 1954 to 1979. After 1980, the annual average air temperature in the study area S-1 began to experience greater fluctuations. Selecting the Sunwu monitoring point located on the southern edge of the permafrost area in Northeast China, the linear fitting curve shows that the annual average air temperature growth rate in the Sunwu area is 0.58 °C/10a, which is about 4.2 times the predicted (0.13 ± 0.03) °C/10a in the sixth evaluation report of the IPCC [1]. From Figure 9b, it can be seen that from 1960 to 1988, the ground surface freezing index and ground surface melting index values in the study area were consistently close and fluctuating. Since 1988, the ground surface freezing index has experienced accelerated changes, showing a continuous and slow downward trend during the fluctuation process. The ground surface frost number has decreased to below 0.5 and fluctuated around 0.46~0.48. In addition, since 2004, the ground surface melting index has continued to fluctuate and rise, with a sharp decrease in the ground surface freezing index, a rapid decrease in the ground surface frost number, and a rapid degradation of permafrost. To summarize, with the impact of climate change and engineering activities, the atmospheric temperature in Northeast China is rising rapidly, the permafrost is melting rapidly, and its depth and area are shrinking rapidly. With the melting of frozen soil, its internal frozen carbon will enter the atmosphere in the form of methane. The growth rate of methane emissions is proportional to the air temperature and surface thawing index and inversely proportional to the surface freezing index and frost number.
Studies have shown that a large source of methane in the permafrost degradation area of Northeast China is caused by spring frozen layer thawing, where the maximum hourly emission rate is 48.6 g C m−2 h−1, which is three orders of magnitude higher than the methane emission rate observed regularly during the growing season. In some sporadic observations of “hotspots”, the spring thawing effect resulted in a potent methane source of 31.3 ± 10.1 g C m−2 h−1, which is approximately 80% of the previously calculated annual methane emissions in the same study area [29]. In addition, the ice layer isolates air oxygen in winter, leading to insufficient oxidation of the methane under the ice layer. When the frozen surface completely thaws in the following spring, the stored methane is released into the air in a short period of time. Calculations indicate that the impact of spring thawing on air methane concentration may multiply it by as many as 167–1002 times, and the high methane emission rate during spring thawing may have multiple causes [29].
Further exploration was conducted with the high-density resistivity method in the study area S-1 from 2010 to 2018, and the results showed that the area of permafrost (dark yellow and red areas) significantly decreased, and the overall increase in the lower limit was significantly higher than the decrease in the upper limit. In addition, from 2010 to 2018, the width and thickness of island-shaped permafrost deteriorated by 62.4% and 36.9%, with a width degradation rate 7–14 times that of the thickness. The state of island-shaped permafrost changed from elliptical to nearly circular (Figure 10).
The soil structure in the deep permafrost layer (dark yellow and red areas) includes silty clay, sandstone, and mudstone. It was found that there was a large amount of methane gas trapped in the permafrost layer after drilling. On the ground surface, we observed that in the annual plant growth season, the growth of green plants in areas with high methane concentration is worse than that in areas with low methane concentration, which is due to the reduction of soil oxygen content caused by the accumulation of high methane concentration [30,31,32,33,34,35]. Methane in permafrost is generated during geological processes during geological history, where a large number of organisms, such as biological remains, are buried and then form methane under the collective fermentation and synthesis of microorganisms, or underground thermal degradation. After the formation of methane, it is blocked by the dense frozen soil layer during the process of rising along underground rock layers or soil layer cracks, making it difficult to overflow, and is sealed under the frozen soil layer.
In a broad sense, methane stored in permafrost is mainly of biogenic origin, including the microbial origin of microbial metabolism and the pyrolysis of residual organic matter. To study the source of methane in the permafrost layer in Northeast China, we carried out methane gas isotope analysis based on existing data, which were obtained from field observation and the China Geological Survey (https://en.cgs.gov.cn/, accessed on 1 January 2023). The study data are represented by the Mohe basin and other places, which have a large and deep permafrost area in Northeast China. Due to the similar geological structure of permafrost in Northeast China, the causes of methane formation in permafrost layers are similar. A study has shown that the methane carbon δ13CCH4 and hydrogen δDCH4 isotope values stored in the permafrost layers of Northeast China, represented by the Mohe basin and other regions, are relatively low, with obvious negative shift characteristics. The carbon isotope values δ13CCH4 are mostly less than −60‰, with the lowest reaching −82.9‰. The majority of hydrogen isotope values δDCH4 are below −350‰, with a minimum of −450‰, as shown in Figure 11. Further drilling reveals that the negative migration of methane carbon stable isotope in the permafrost layer of the Northeast permafrost region represented by the Mohe basin and other places is mainly related to the microbial origin of methane, while the negative shifts of stable hydrogen isotope are the results of a combined effect of Rayleigh distillation during the evaporation of surface water or an atmospheric condensation process driven by the basin’s unique climate at higher latitudes, and methane production through acetate fermentation.
Permafrost degradation, engineering construction, and oil field development play an important role in the growth of methane emissions in Northeast China. In the geological history of Northeast China, many sedimentary basins were formed, and a large amount of carbon was deposited to form geological methane (such as methane hydrate, etc.). The cryosphere was formed, completely sealing the geological methane, after several ice ages. However, with the gradual degradation of permafrost, the southern boundary is gradually moving northward, exposing the ancient geological carbon stored under the permafrost.
At present, in addition to observation points in S-1 (Sunwu-Jiayin Basin), many large oilfields have been found in Northeast China, including Daqing oil field and Jilin oil field, and scholars have found massive reserves of methane hydrate in the Mohe basin and other areas in Northeast China [13,28,36,37,38]. The total reserves of methane hydrate stable zone in the permafrost regions of China are about 2.995 × 10¹² m3 to 5.081 × 10¹² m3, with a best estimate of 4.002 × 10¹² m3, and the reserves of methane hydrate in the Northeast China permafrost region represented by the Mohe basin range from 0.49 × 10¹² m3 to 0.79 × 10¹² m3 [13,28,37,38]. The distribution and proportion of hydrocarbons in the Mohe basin and Sunwu-Jiayin basin are shown in Table 2 and Table 3 [28,39,40,41,42,43,44,45], the data for which are from the China Geological Survey (https://en.cgs.gov.cn/, accessed on 1 January 2023).
In addition, through on-site exploration and theoretical analysis, we have established a geological methane leakage model for permafrost degradation areas, as shown in Figure 12 and Figure 13. The modeling process is shown in the Supplementary Materials. It was found that the phase changes after the degradation of the permafrost layer will exacerbate the heterogeneity of the overlying layer, and combined with the rapid migration of gas, a high-permeability migration channel will be formed. The permeability of this migration channel is much larger than that of ordinary permeability areas, which will further accelerate the migration of geological methane gas into the air (Figure 12 and Figure 13). This part of geological methane gas will lead to a rapid increase in near-surface troposphere methane concentration in Northeast China, which can increase more than twice.

4. Conclusions

This paper used AIRS detector observation data, MODIS data, and national meteorological station data combined with on-site monitoring results in the study area of the Sunwu-Jiayin basin to study the spatiotemporal distribution characteristics and seasonal variability of methane concentration in the near-ground surface troposphere of the permafrost regions of Northeast China, studied the relationship between methane concentration and the distribution of permafrost, and analyzed geological methane release sources in permafrost regions. The specific conclusions are as follows:
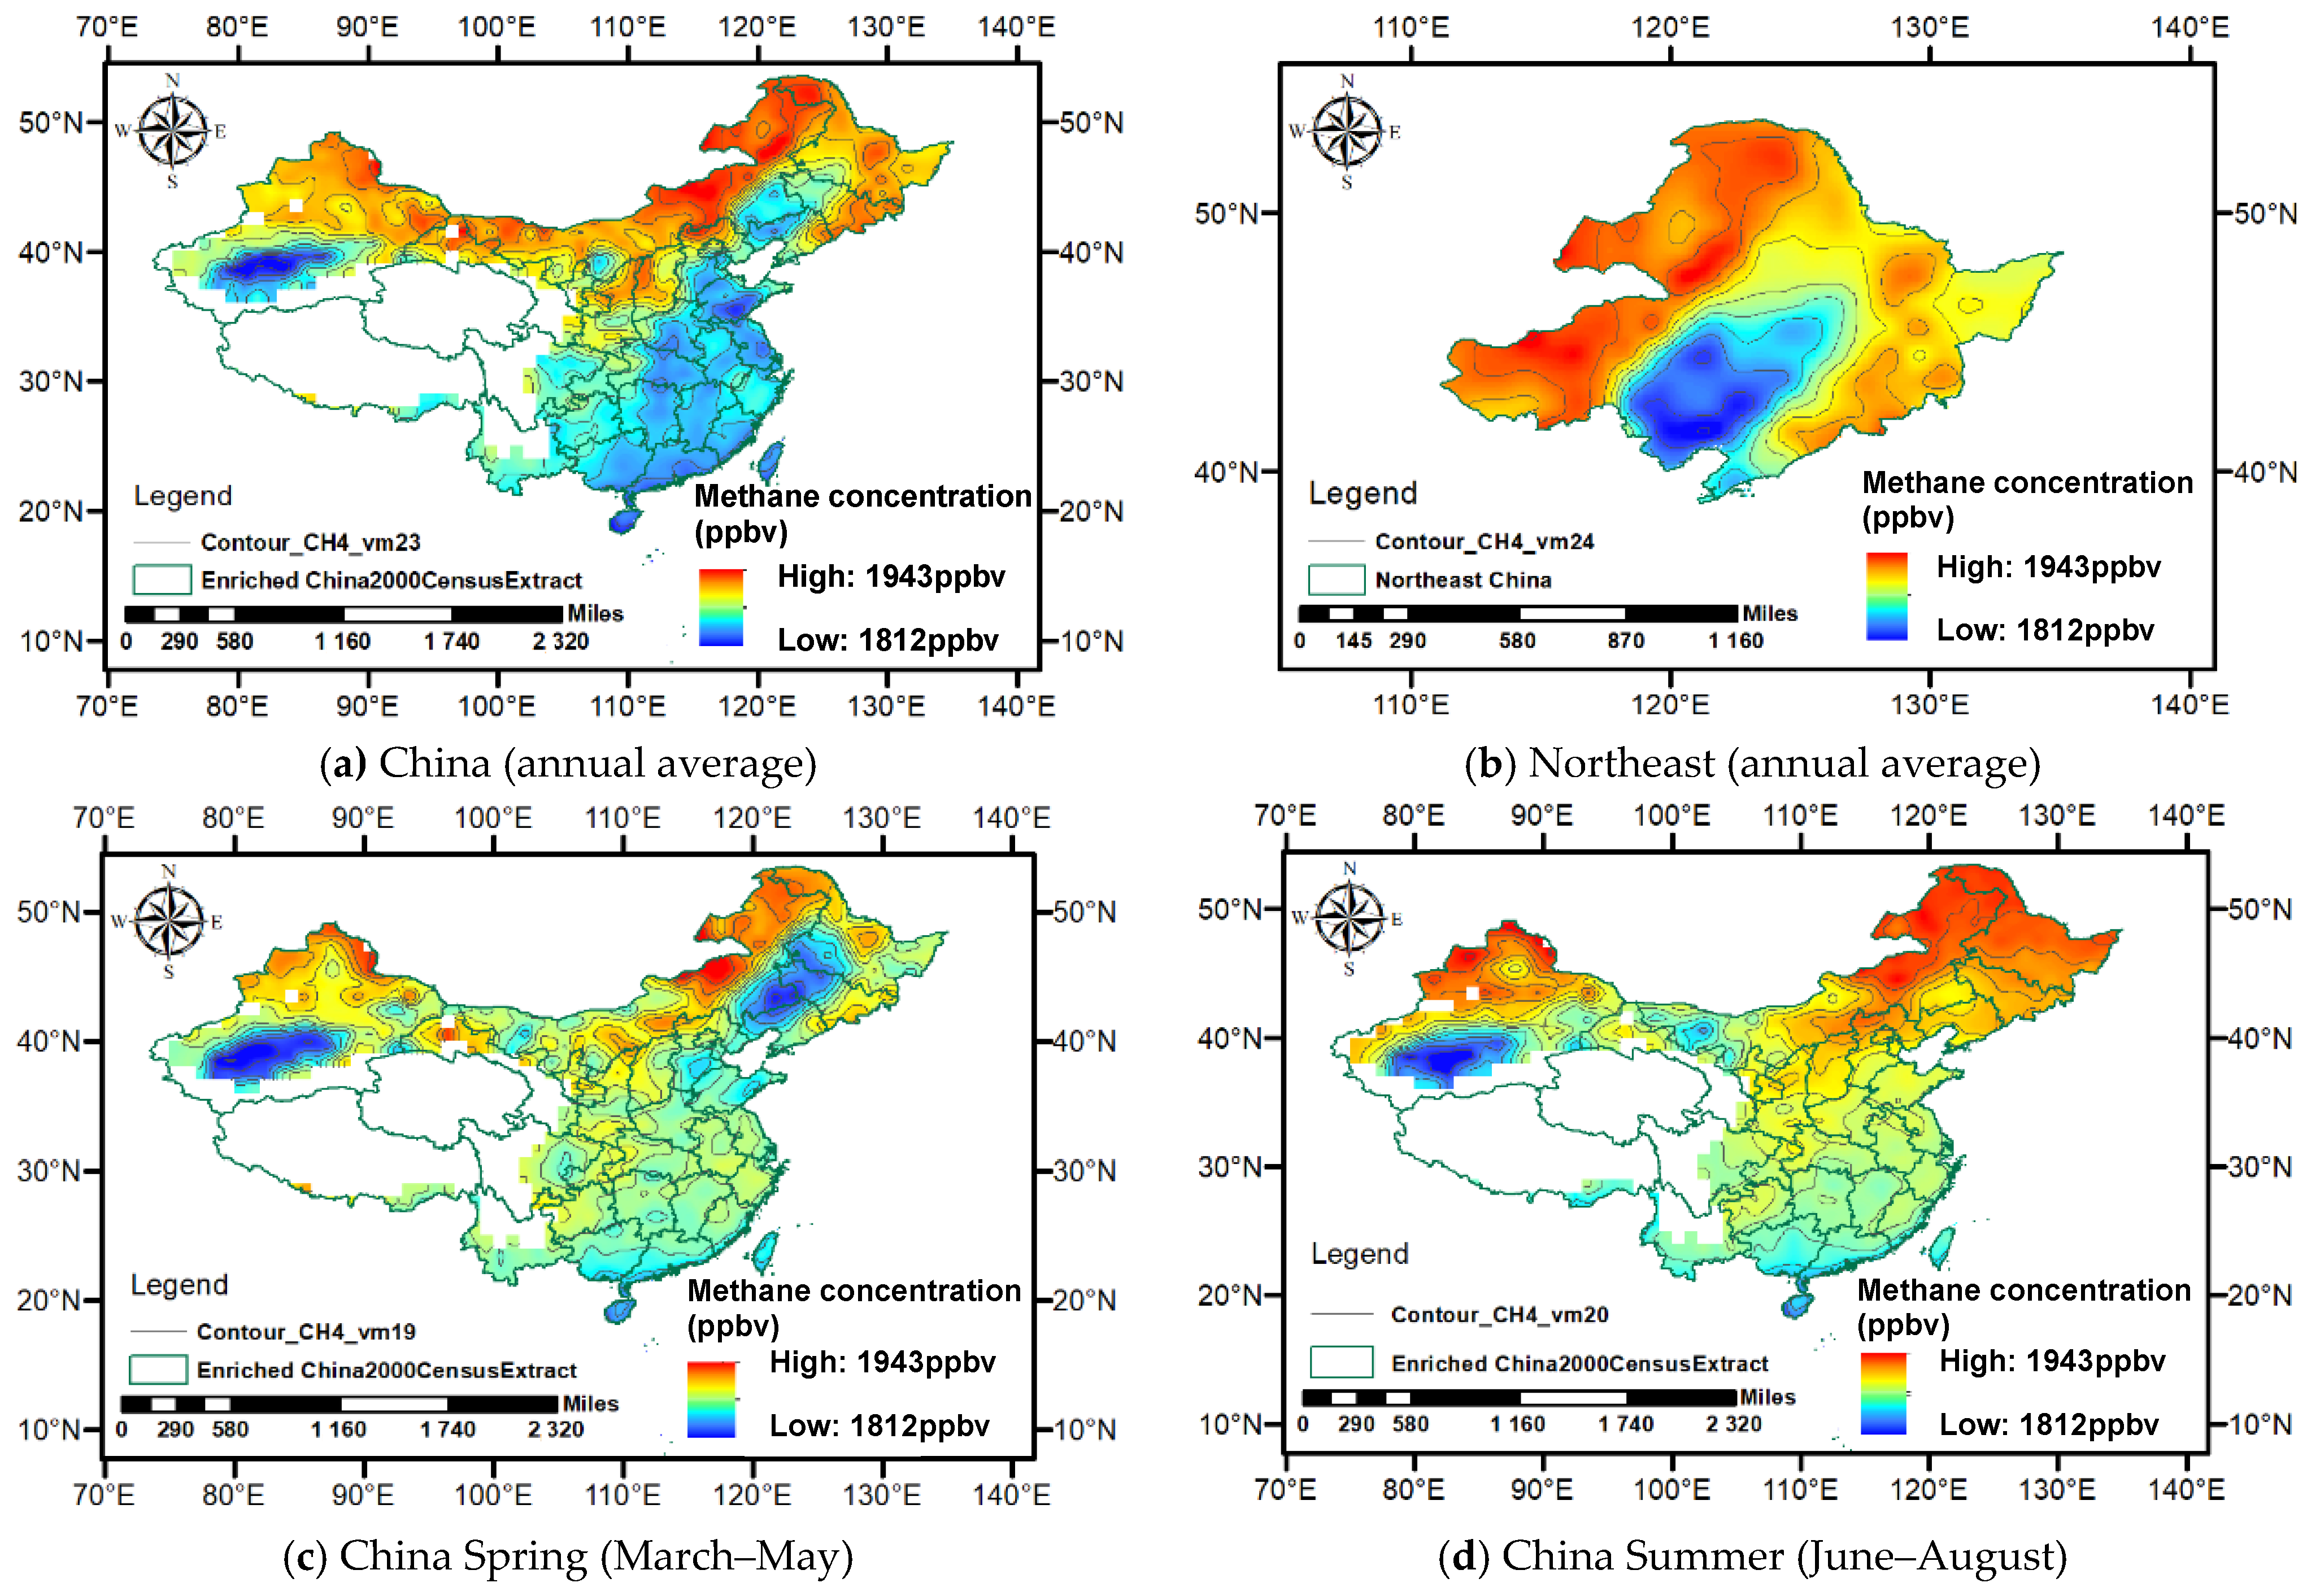
  • Based on the AIRS data, from 2003 to 2022, Northeast China, especially the high-latitude permafrost zone, had a high methane emission capacity in all four seasons. The near-surface troposphere methane concentration shows significant seasonal variation, with two peaks. The first peak appears in summer (June–August), with its maximum appearing in August, and the second peak appears in winter (December–February), with its maximum appearing in December.
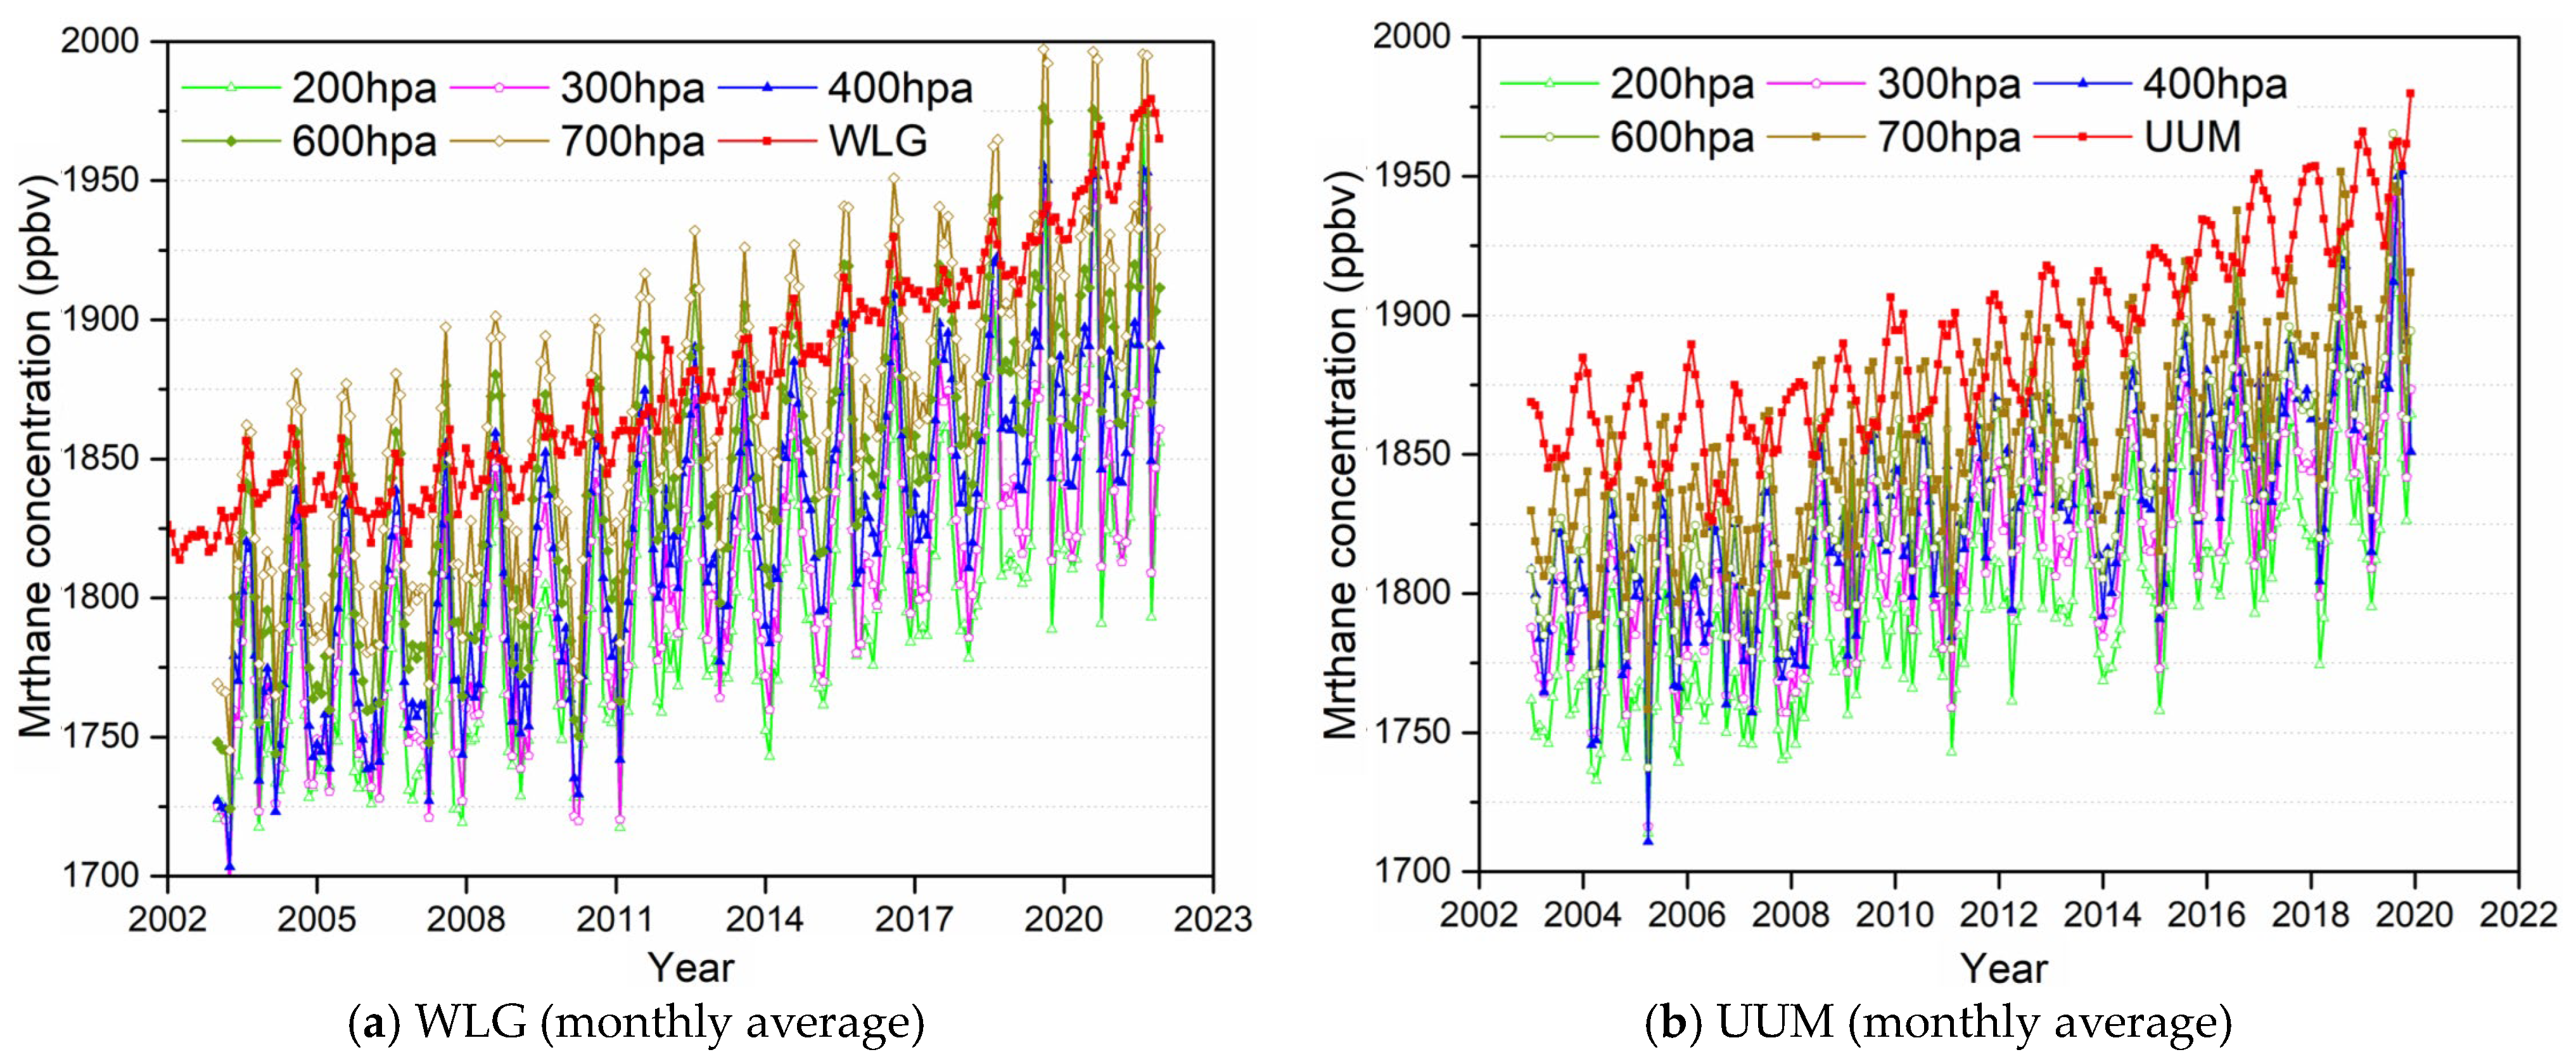
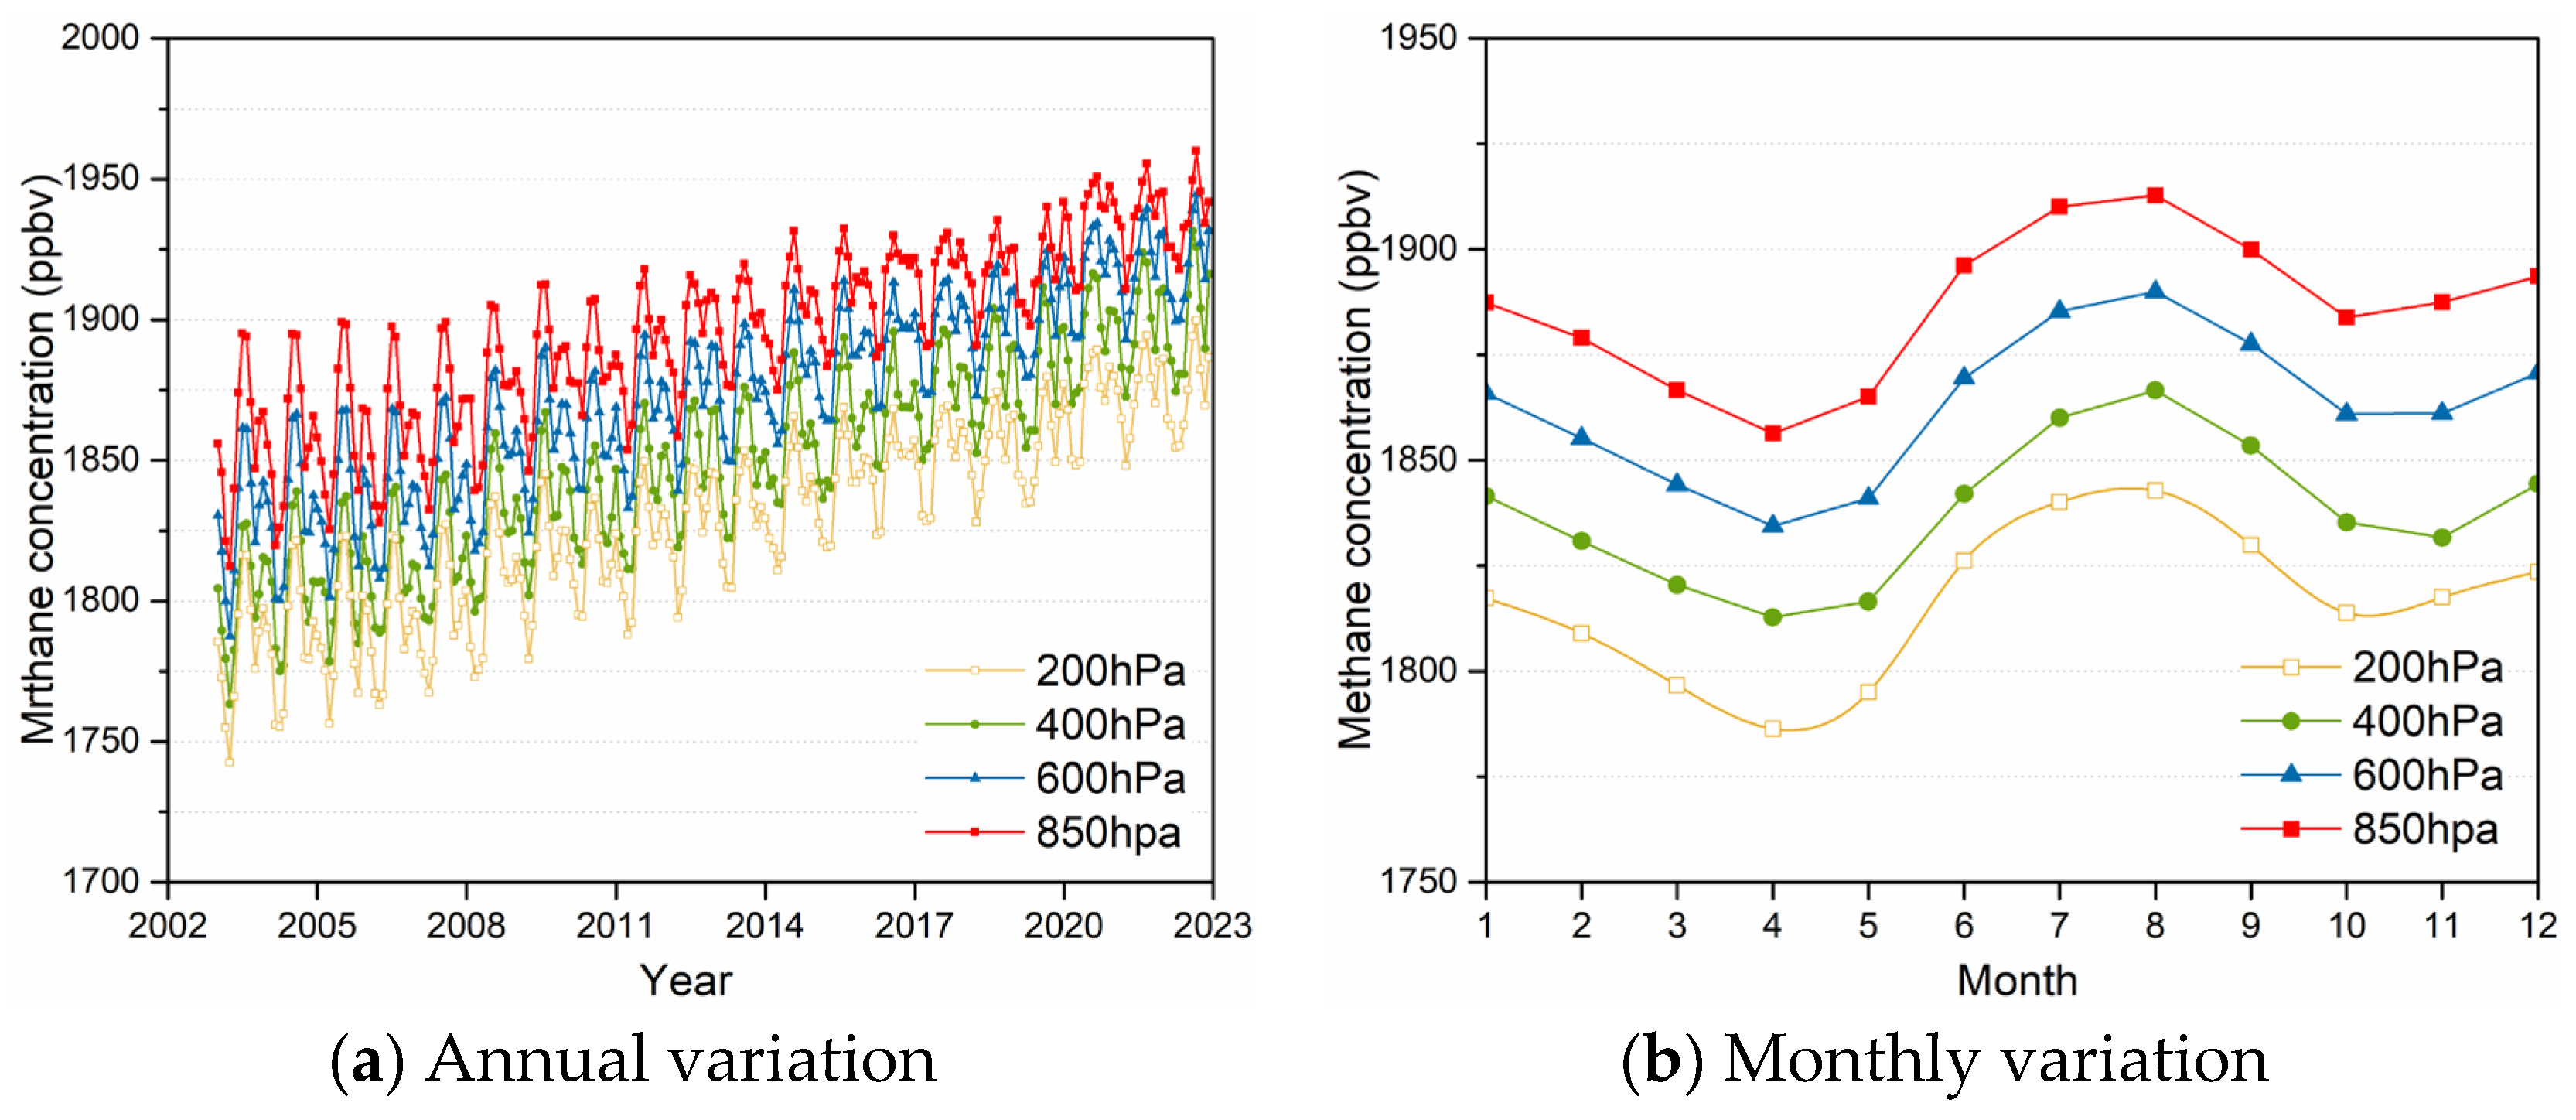
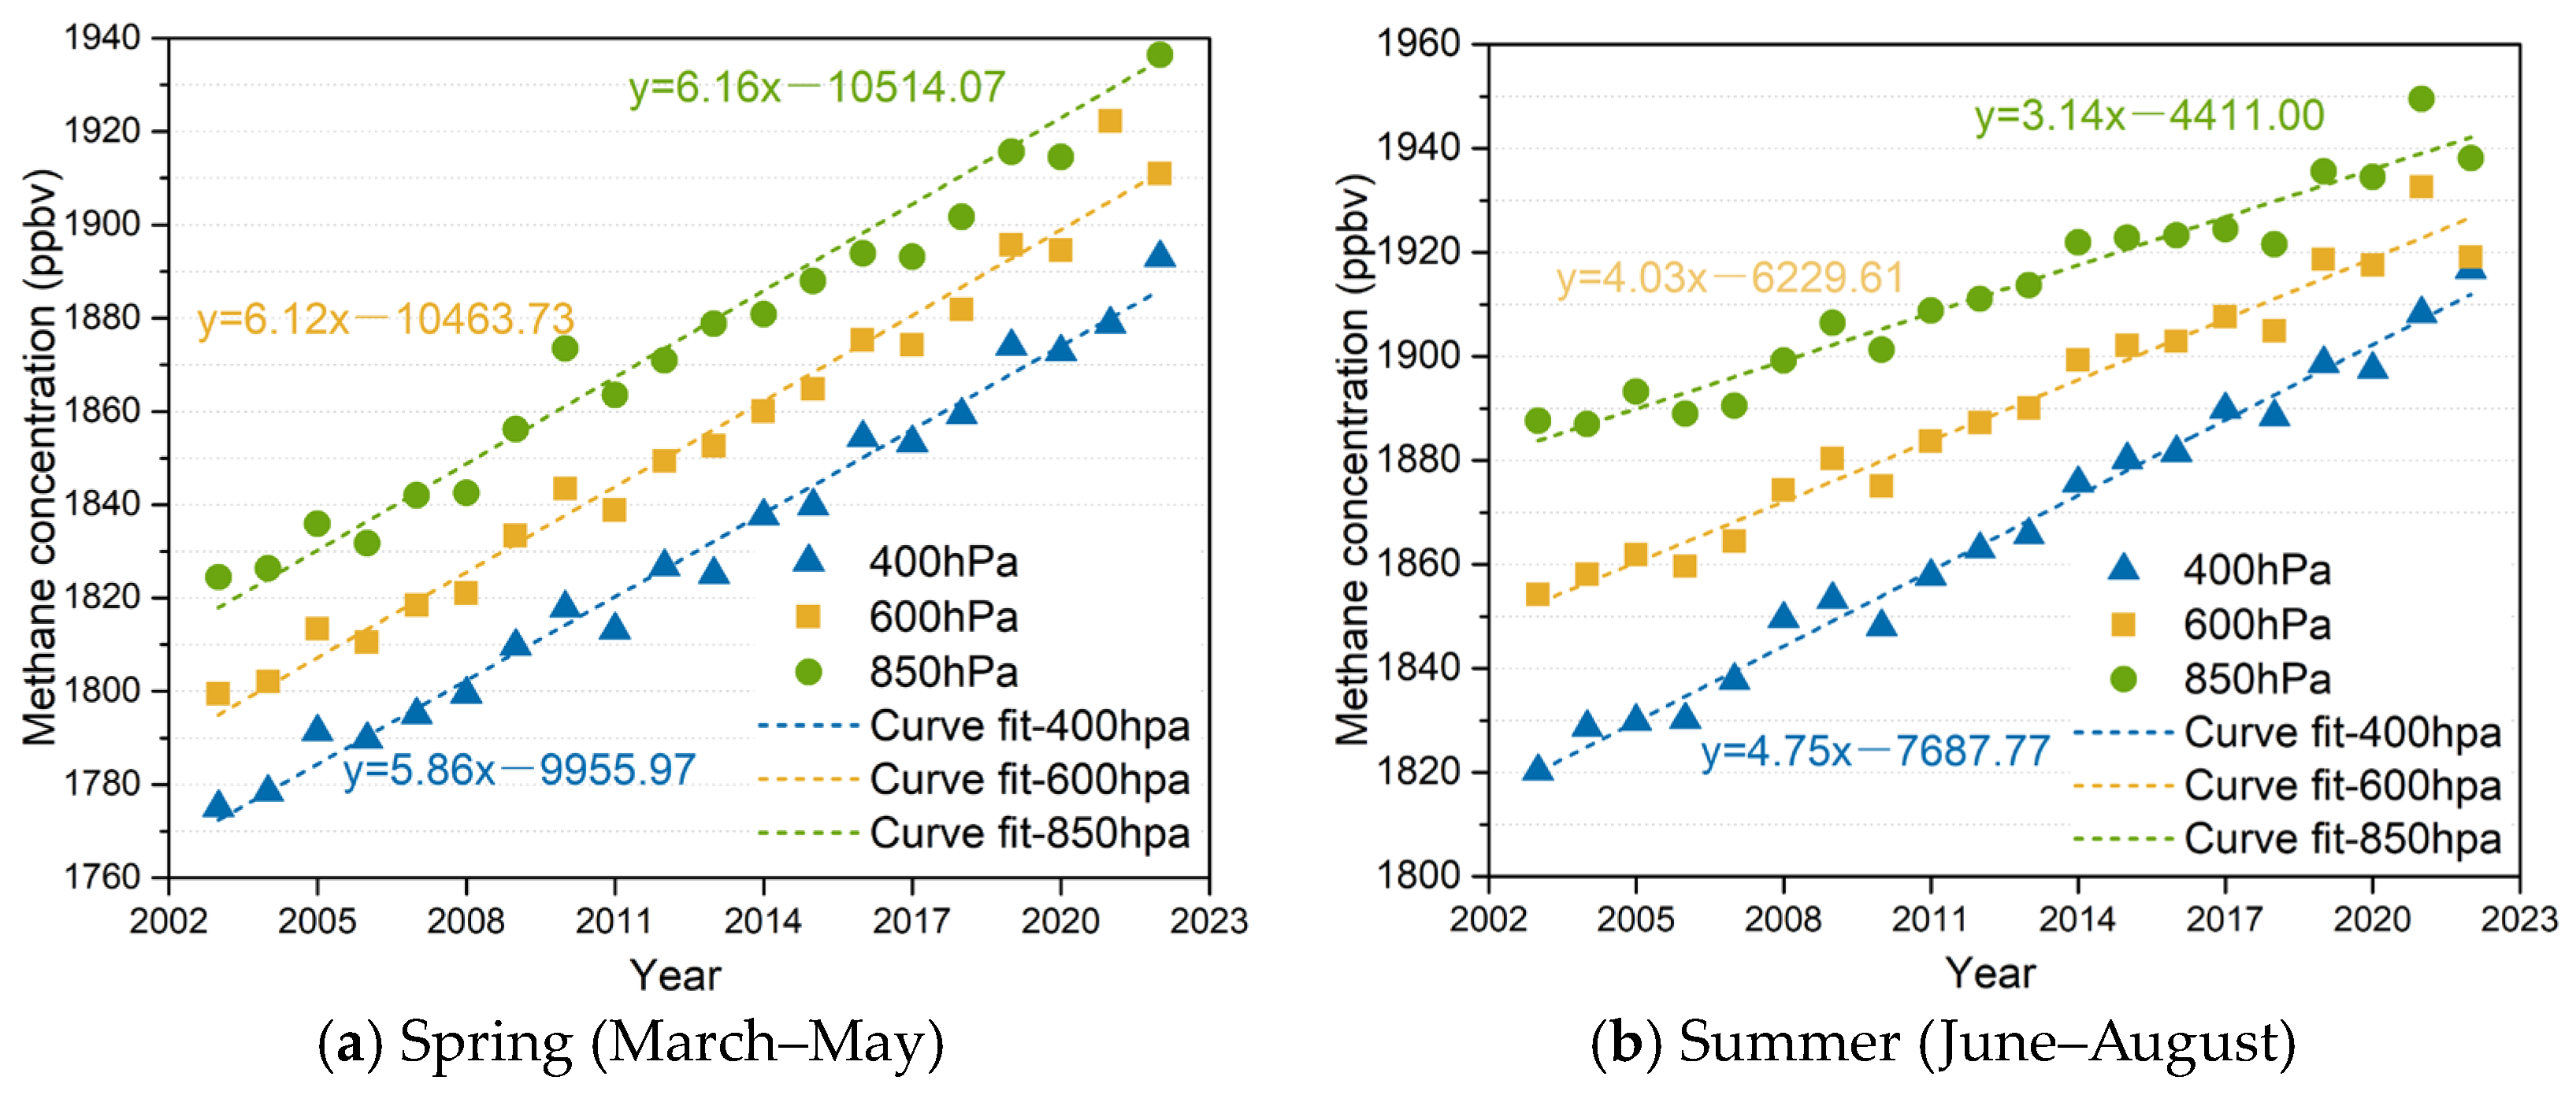
  • Based on the AIRS data, from 2003 to 2022, the methane concentration in the near-surface troposphere of Northeast China shows an increasing trend; the linear growth rates are 4.791 ppbv/a (200 hPa), 5.263 ppbv/a (400 hPa), 4.737 ppbv/a (600 hPa), and 4.158 ppbv/a (850 hPa), and the methane concentration in the troposphere gradually increased with the decrease in height overall.
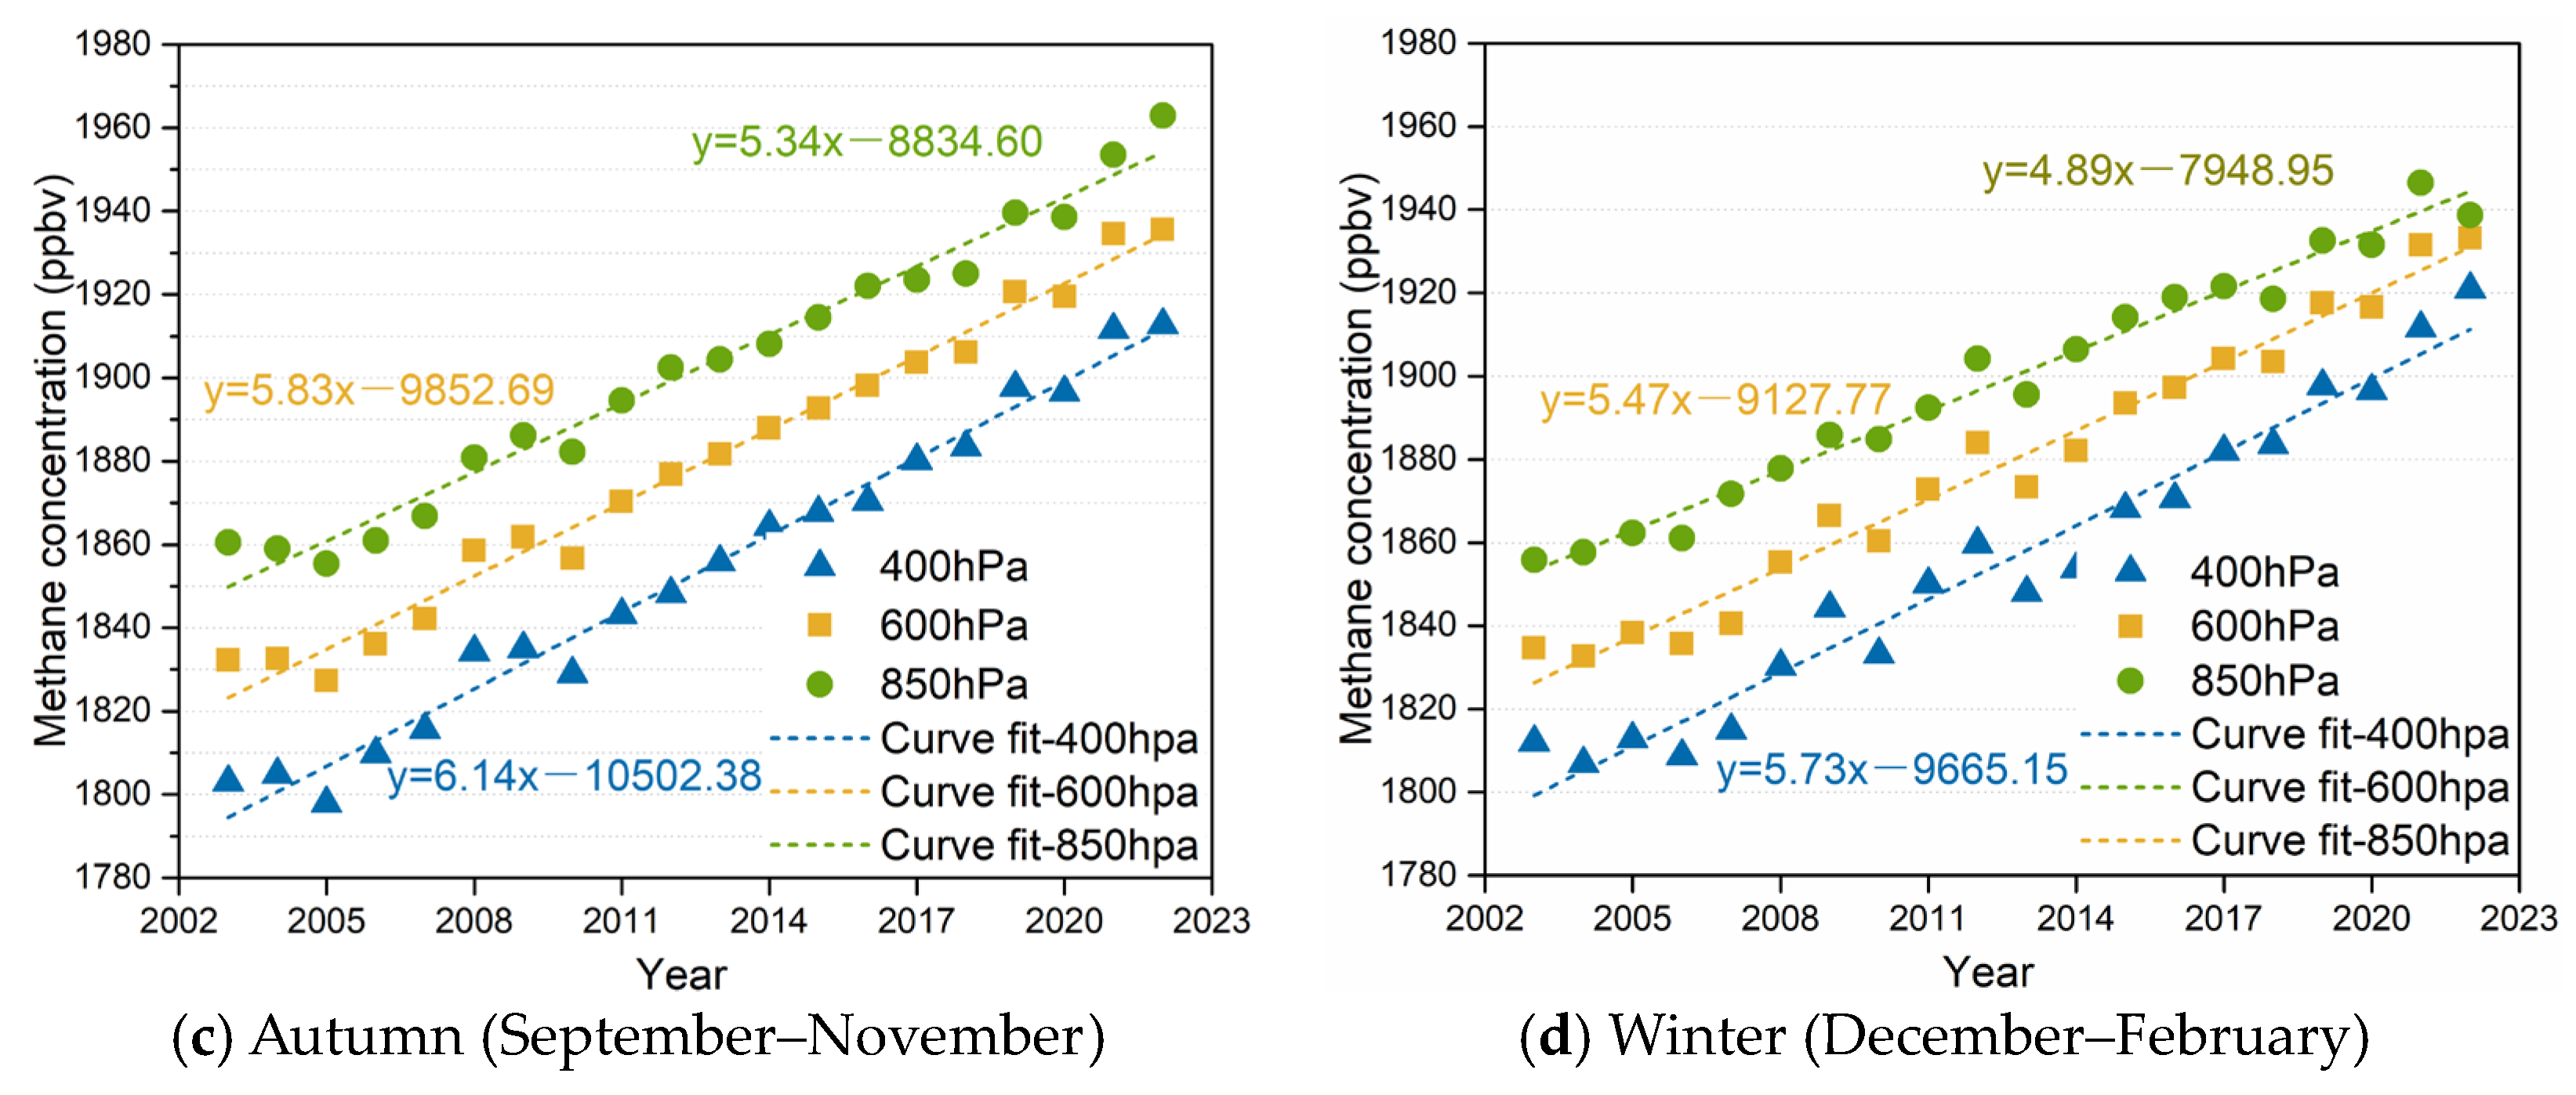
  • Based on the AIRS data, from 2003 to 2022, the growth rate of methane concentration in the near-surface troposphere of Northeast China varied with the seasons. Overall, the average growth rate of methane concentration in spring is the largest (6.05 ppbv/a), followed by that in autumn (5.77 ppbv/a) and winter (5.36 ppbv/a). The average growth rate of methane concentration in the summer is the lowest (3.97 ppbv/a).
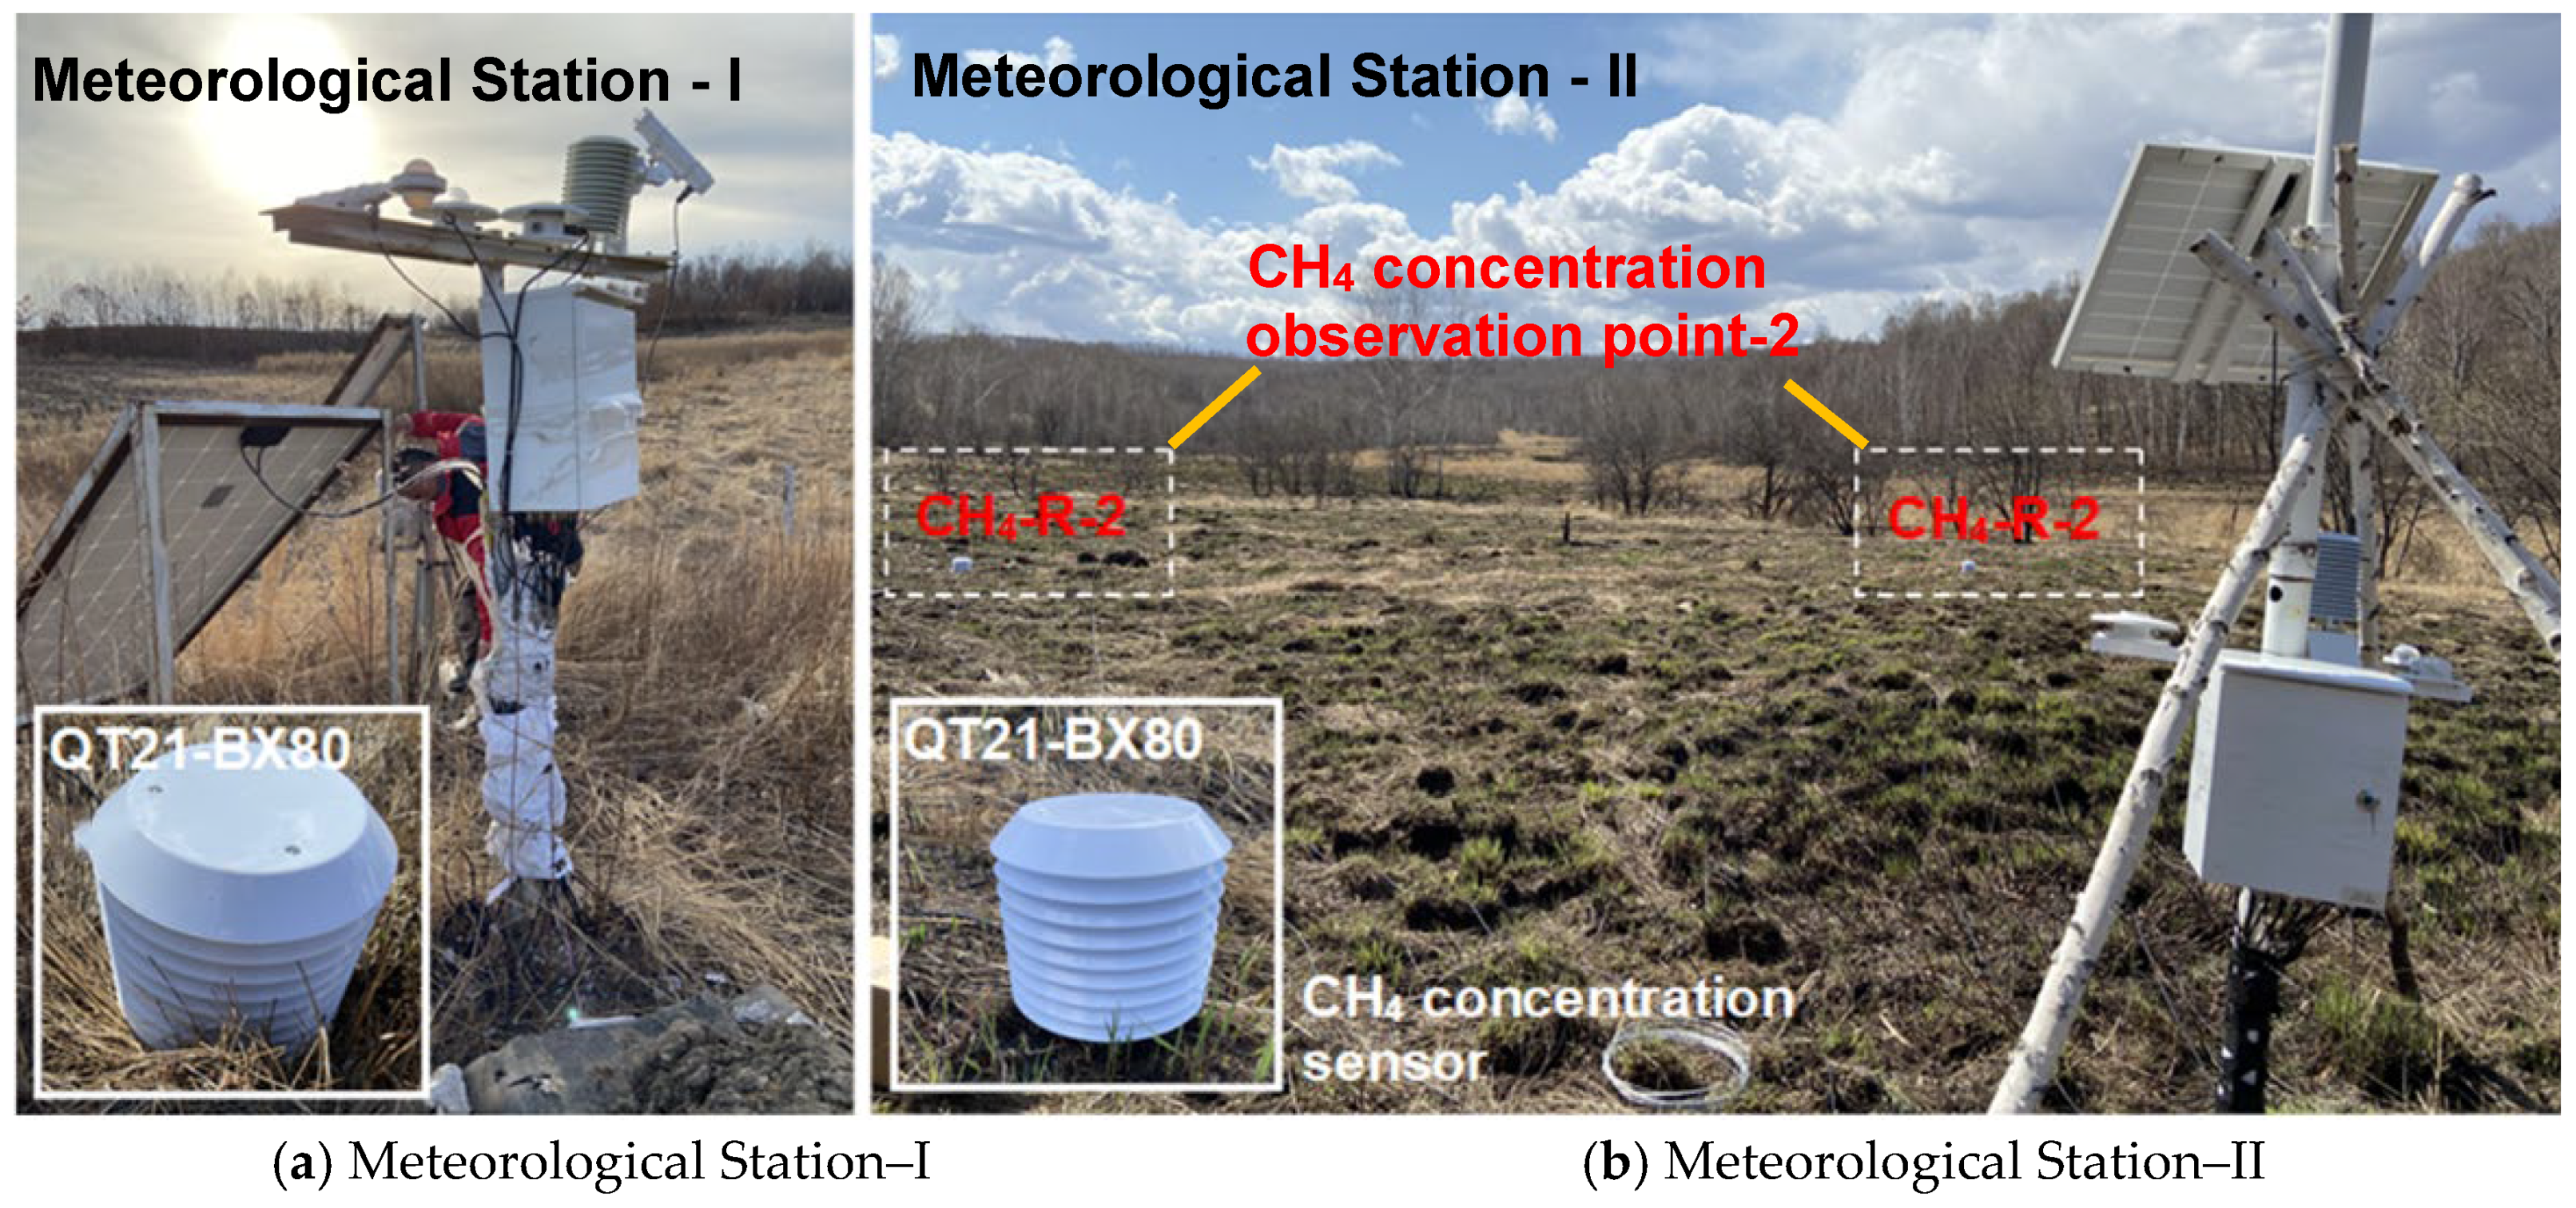
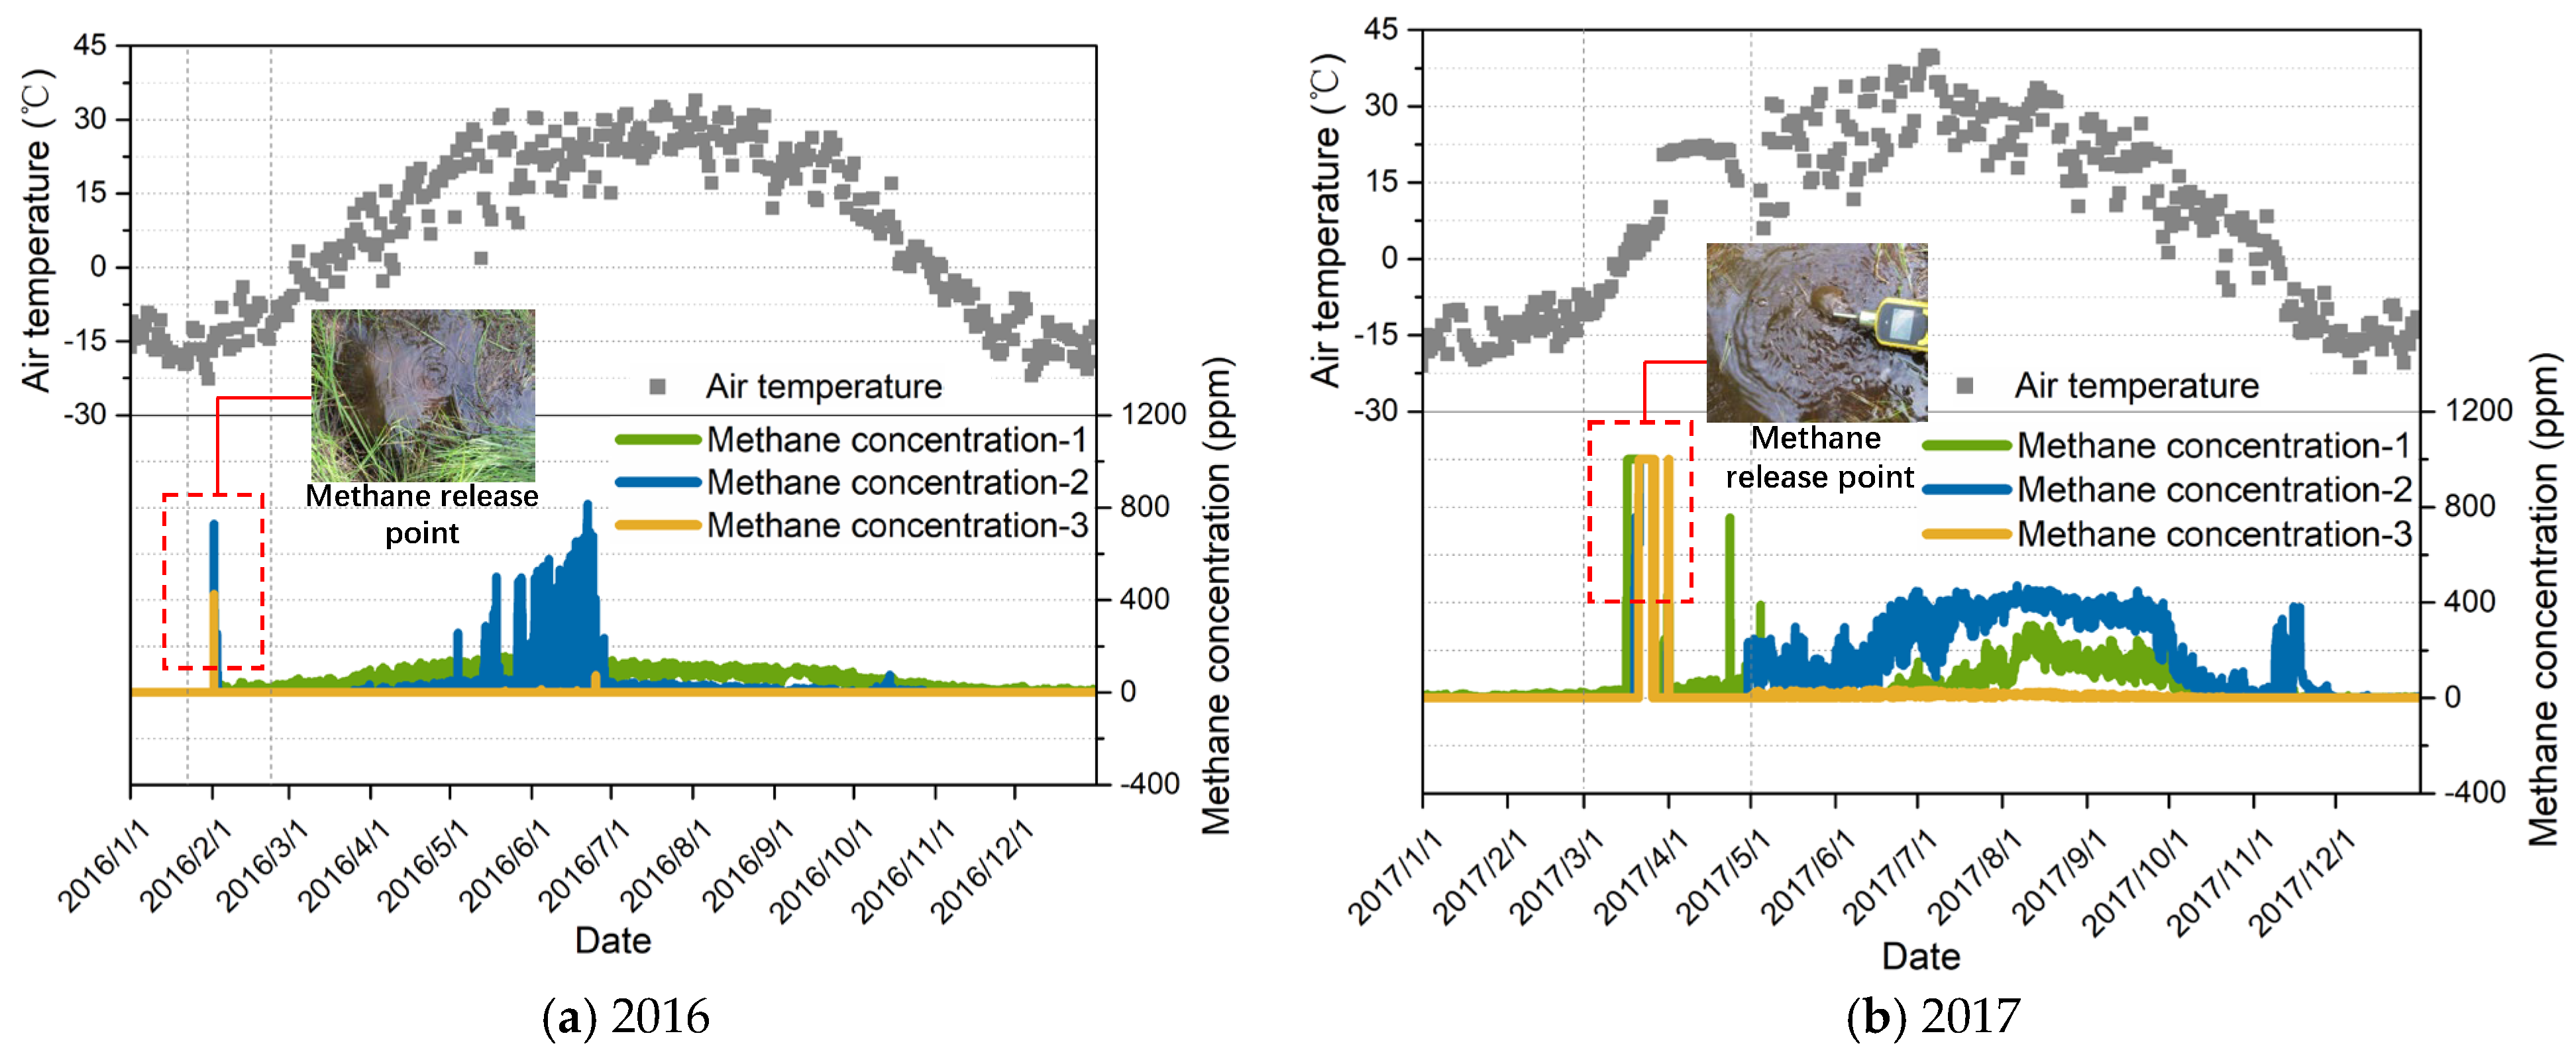
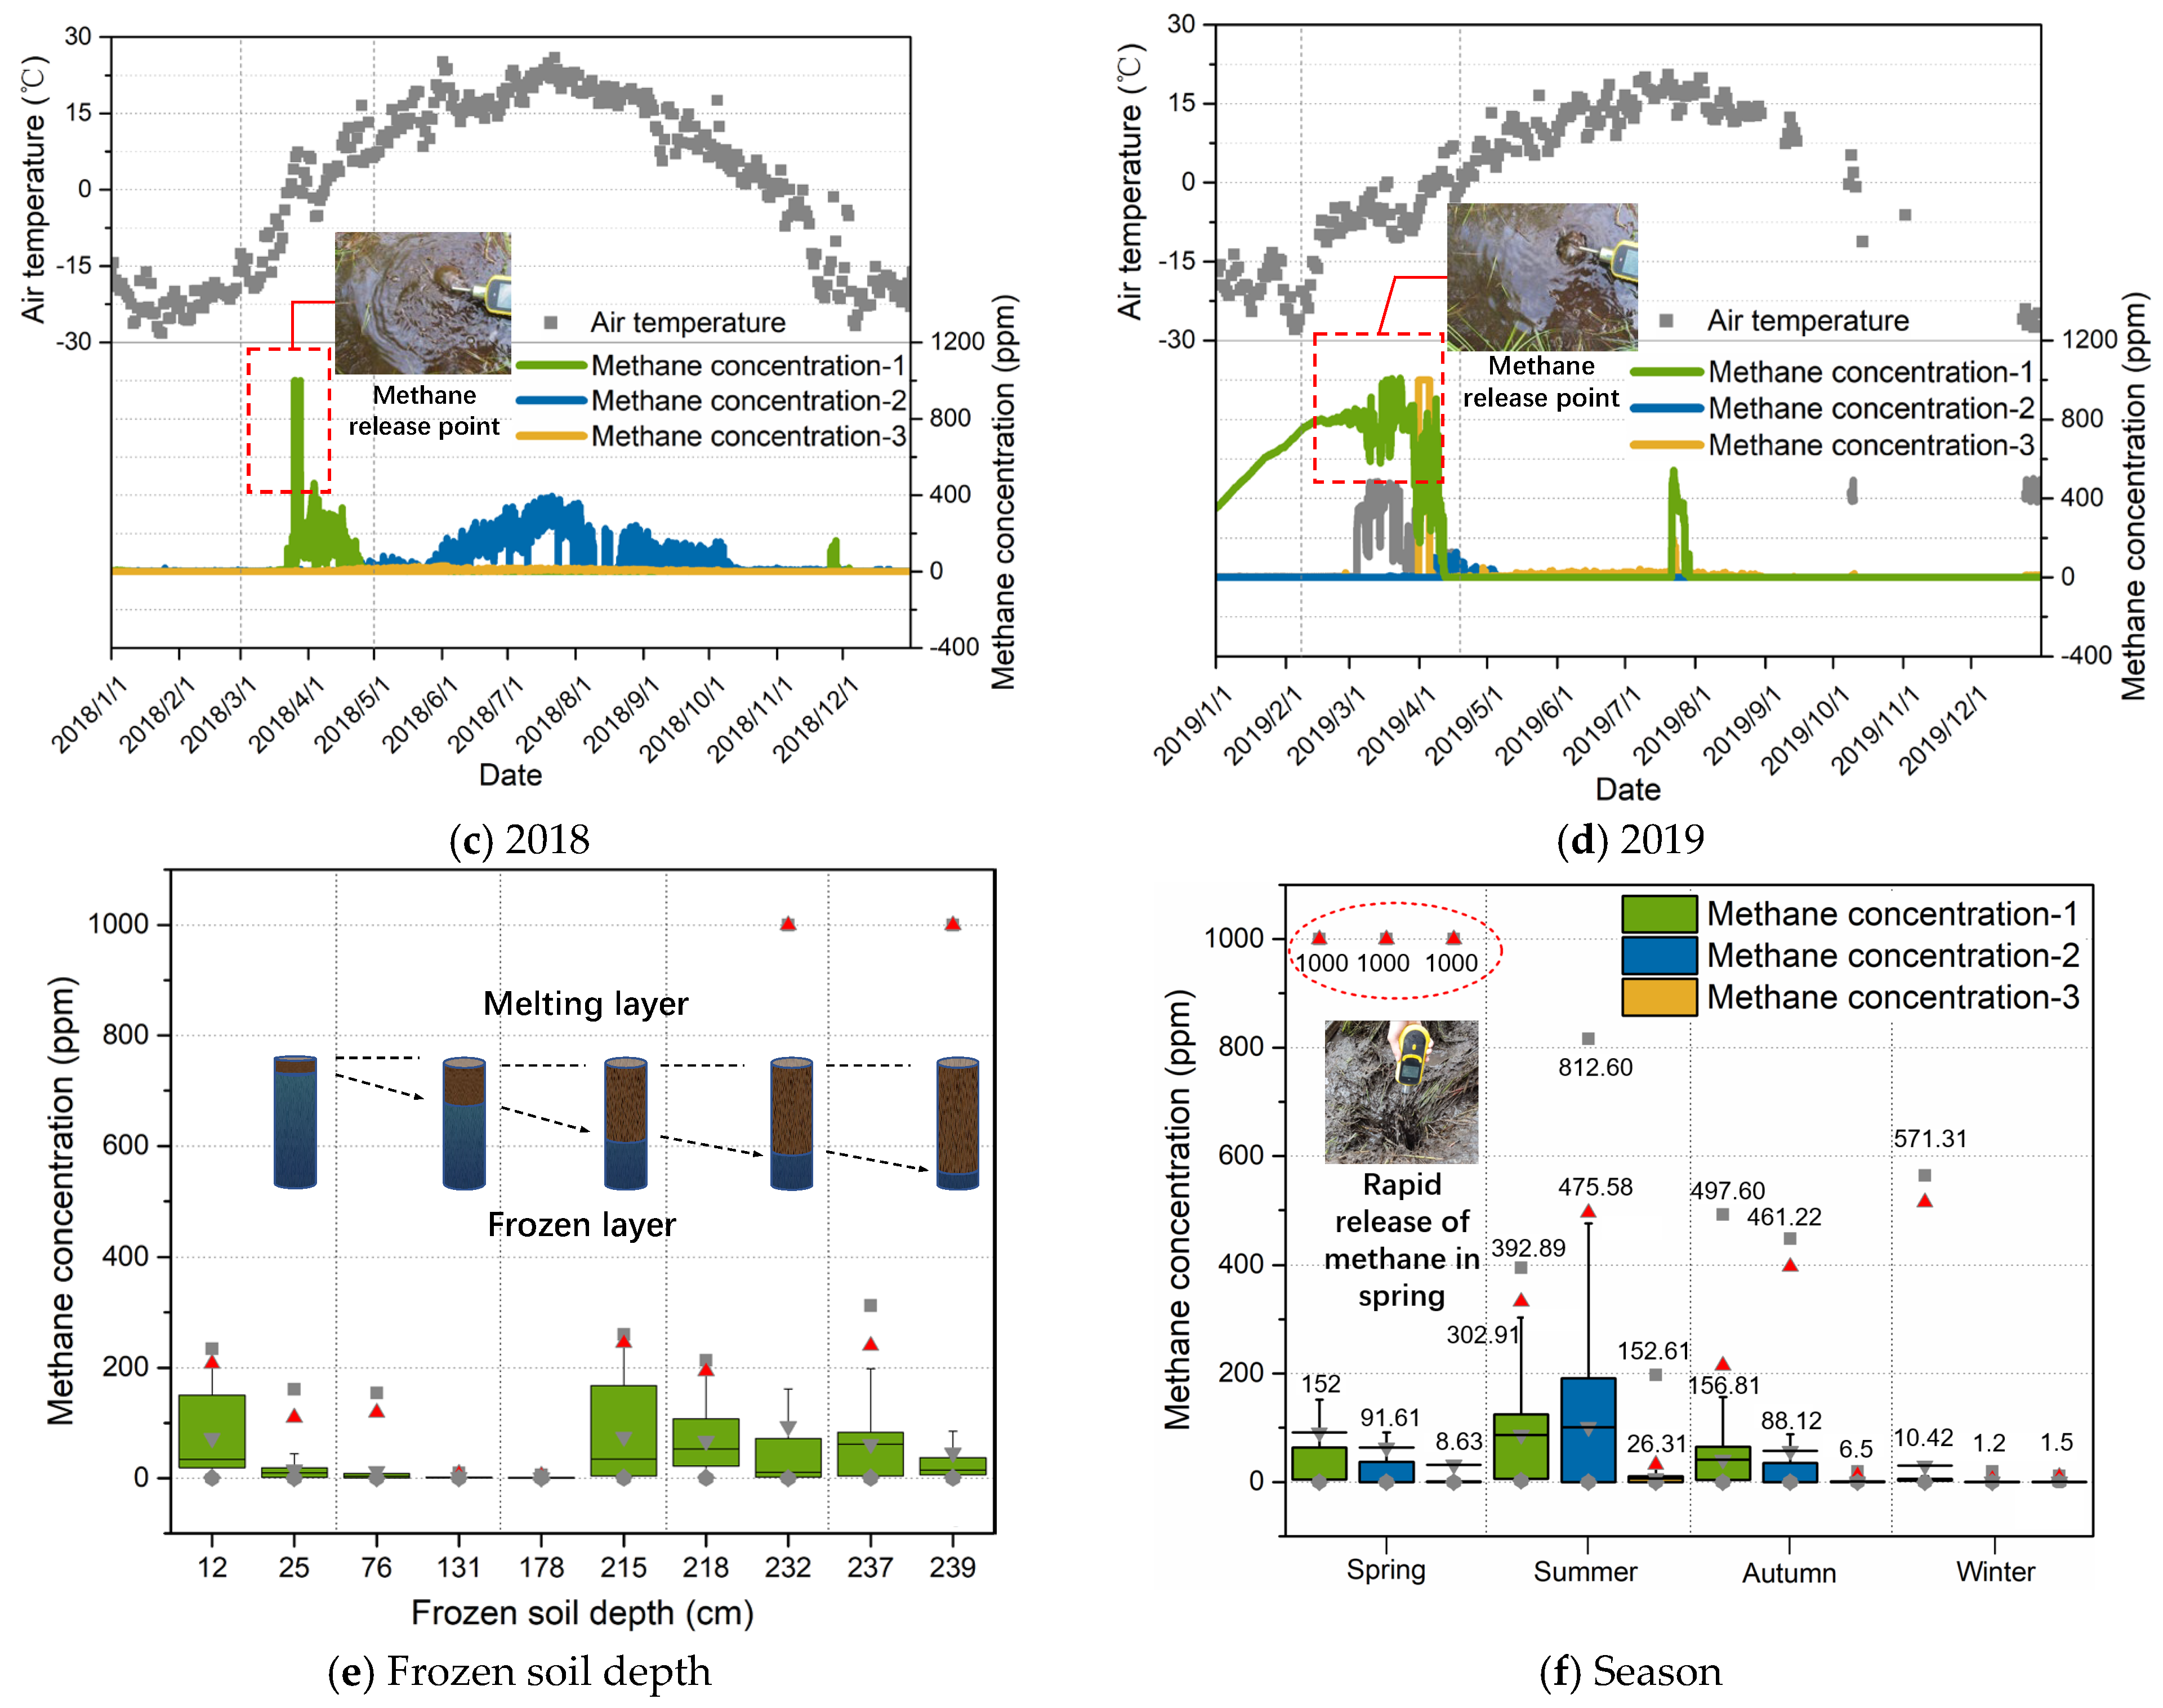
  • Based on the ground surface meteorological station data, the annual release of ground surface methane in Northeast China permafrost is mainly divided into three stages, with the maximum methane concentration occurring in the spring. The first stage of methane release is the high-concentration short-term emission stage (from March to May, frozen to melted, the release cycle is about 10 days, and the ground surface methane concentration exceeds 1000 ppm), and the peak is around March 25 each year. The second stage of methane release is the high-concentration, long-term, stable emission stage. The third stage of methane release is the higher-concentration short-term emission stage.
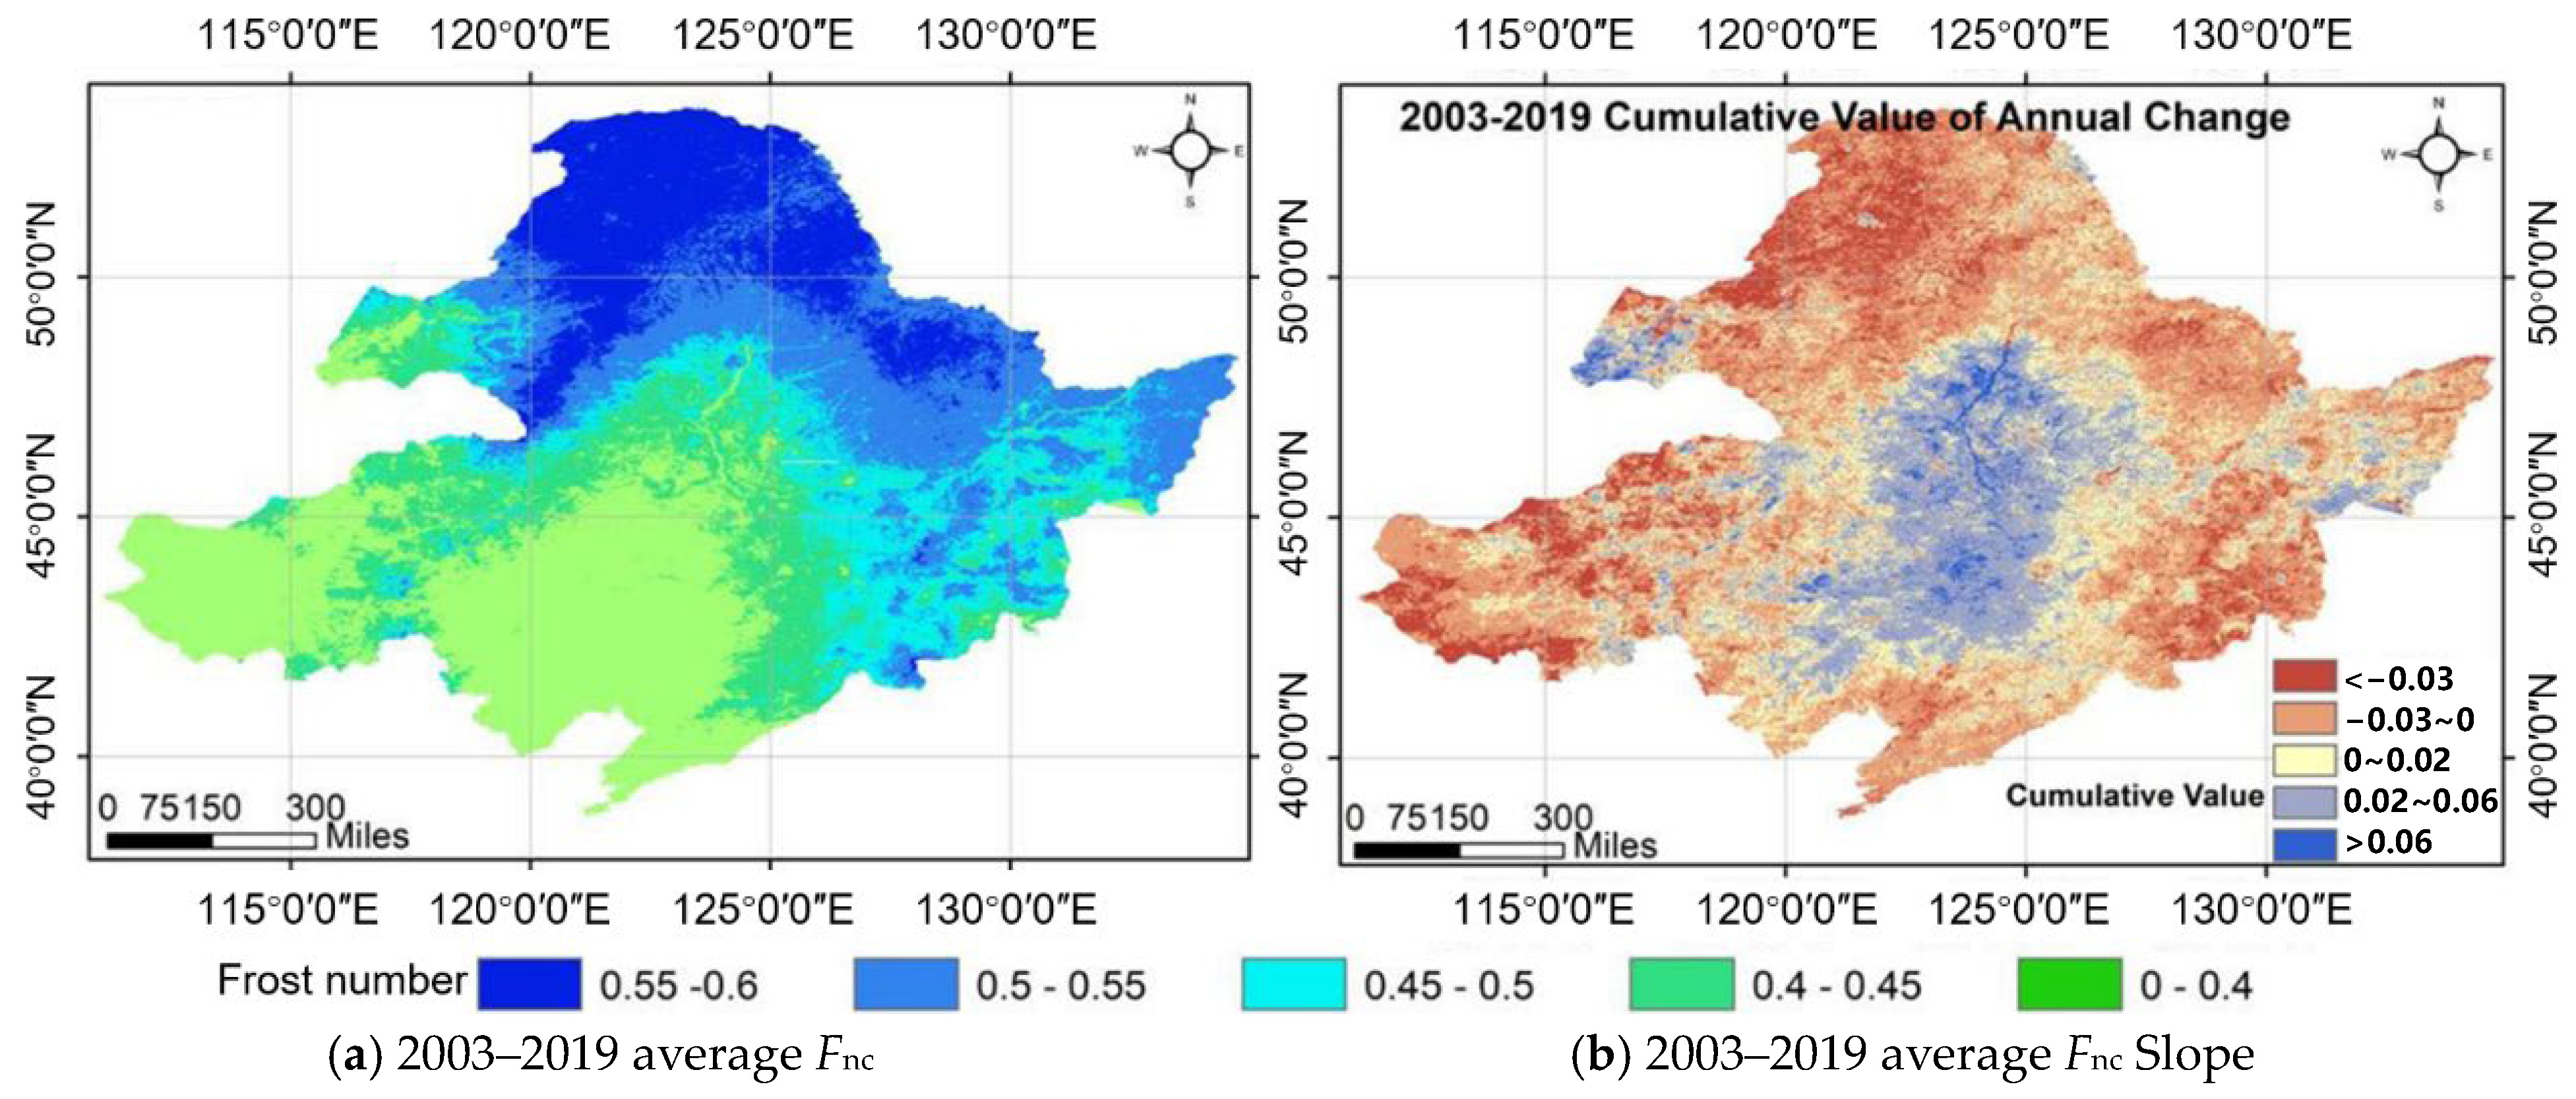
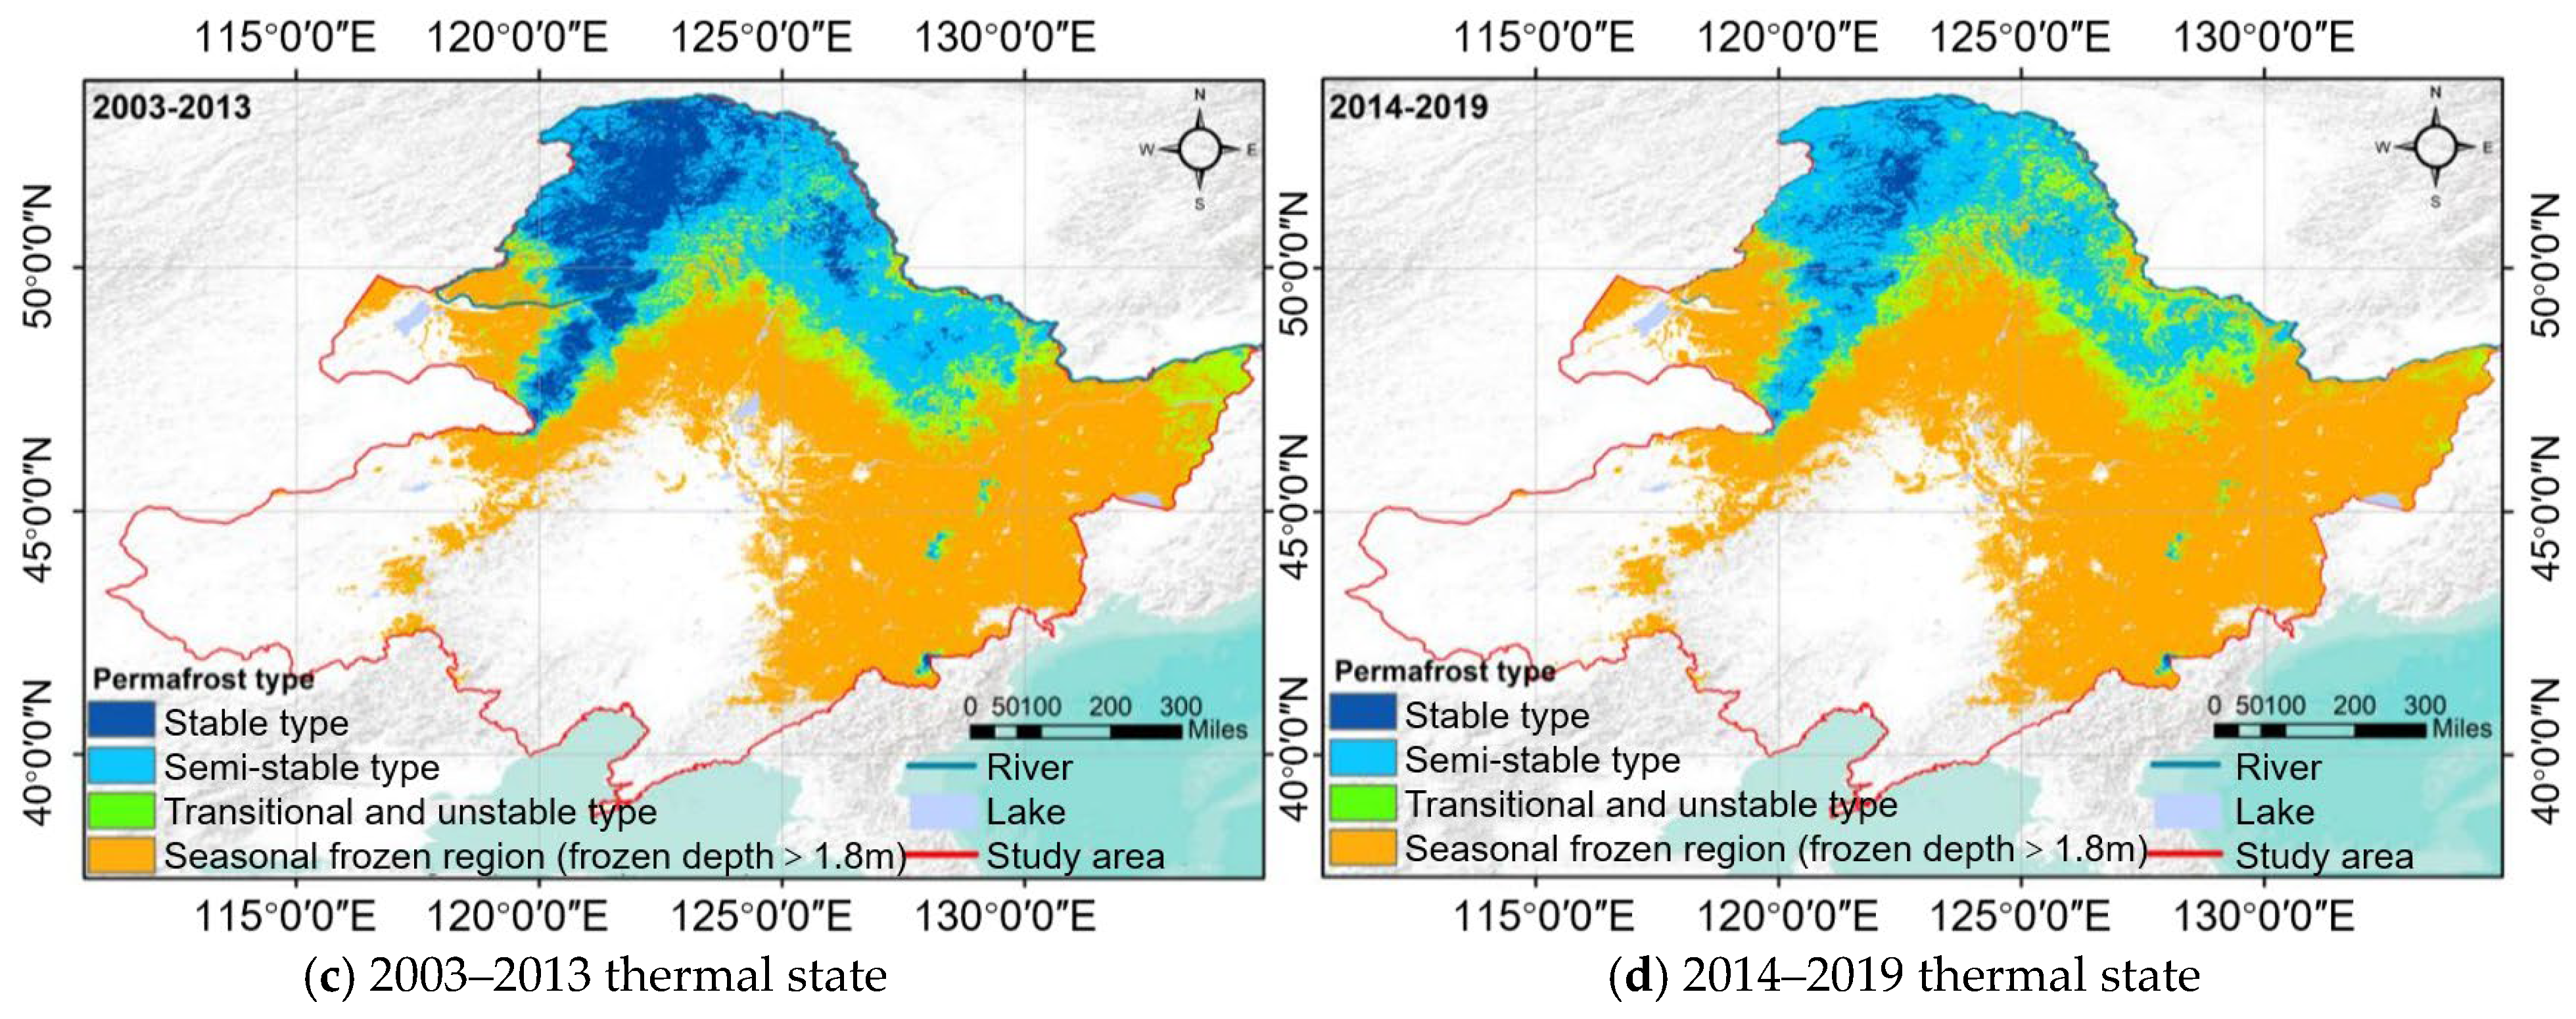
  • Discontinuous permafrost regions and sporadic permafrost regions (transitional and unstable permafrost regions) and the isolated patches (seasonal permafrost regions) in the southernmost region actually had a higher growth rate of methane concentration, up to 9.151 ppbv/a and 8.158 ppbv/a. However, the growth rate of methane concentration in the near-surface troposphere of Northeast China in the continuous permafrost region (stable and sub-stable permafrost regions) in the north of the Da and Xiao Xing’an Mountains is relatively low, up to 4.638 ppbv/a. The growth rate of methane concentration in the southern permafrost degradation zone is higher than that in the northern permafrost stable zone.
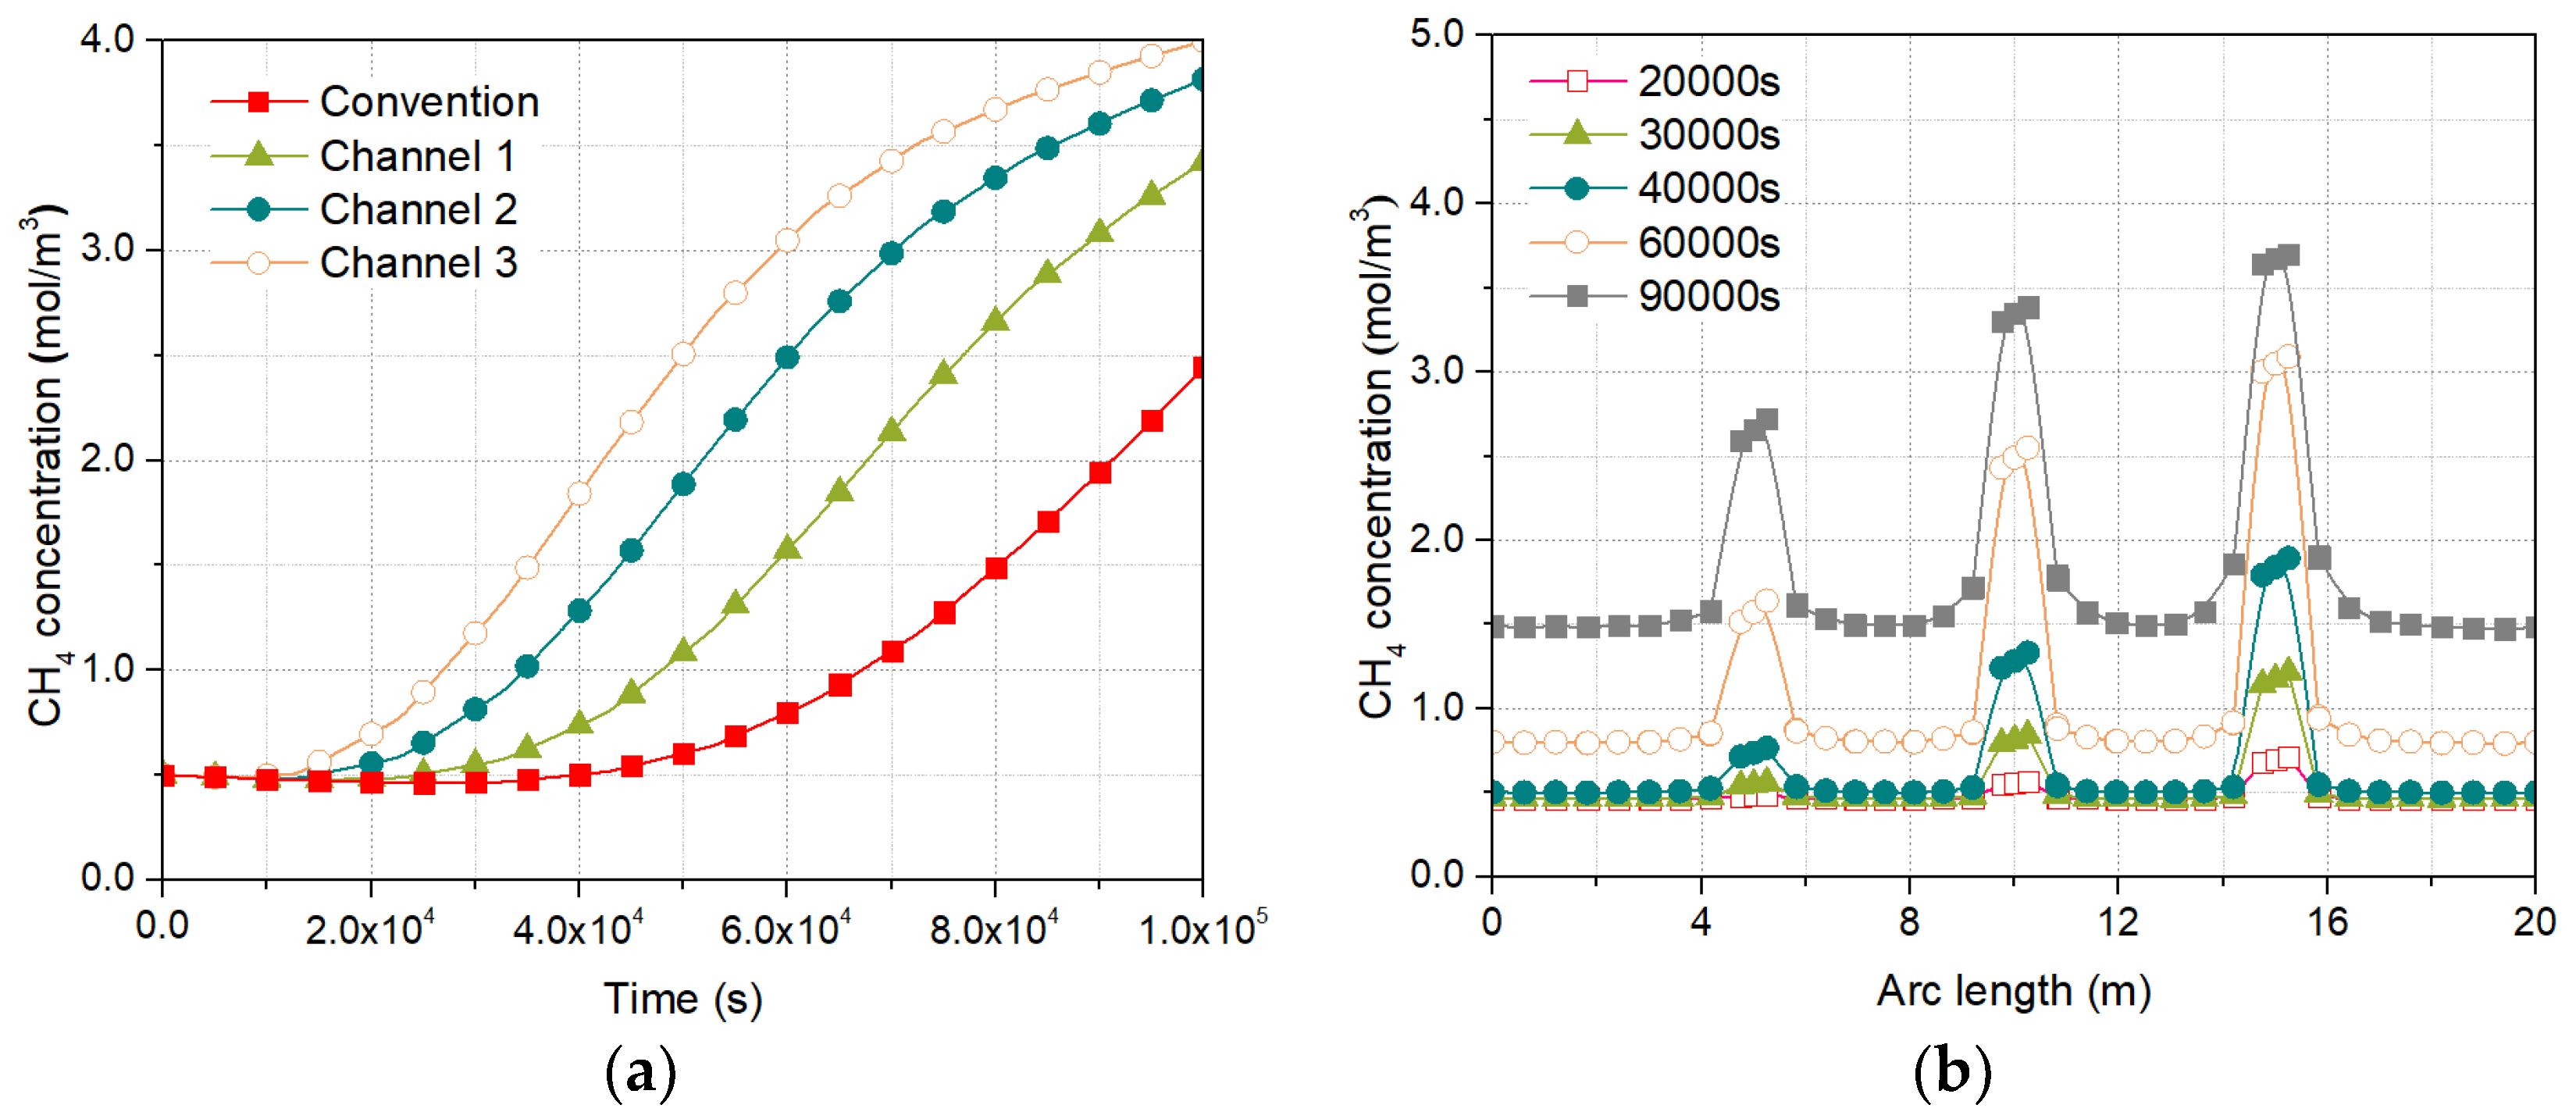
  • With the degradation of permafrost, the geological methane in deep underground (methane hydrate, coal seam, etc., manly derived from the accumulation of ancient microbial origin) stored in the frozen layer will become an important source of near surface troposphere methane in the permafrost degradation area. In addition, the phase changes after the degradation of permafrost will exacerbate the nonuniformity of the overlying layer, and combined with the rapid migration of gas, high-permeability migration channels will be formed. The permeability of this migration channel is much larger than that of ordinary permeability areas, which will further accelerate the migration of methane gas into the atmosphere, and its growth rate of near surface troposphere methane concentration can be increased by more than twice.

Supplementary Materials

The following supporting information can be downloaded at: https://www.mdpi.com/article/10.3390/atmos14081298/s1, Figure S1: Mean value of 400 hPa troposphere methane concentration in China and Northeast China from 2003 to 2022; Figure S2: Mean value of 600 hPa troposphere methane concentration in China and Northeast China from 2003 to 2022; Figure S3: Air methane concentration value of Waliguan from 1992 to 2019. (a) annual variation, (b) monthly variation, each part of the Box-plot represents maximum, minimum, median, quartile and outlier; Figure S4: Hexahedron unit; Figure S5: Simplified physical model; Table S1: Model parameters.

Author Contributions

Data curation, W.S. and Y.W.; formal analysis, Z.X. and Y.C.; funding acquisition, Z.X.; investigation, W.S., Z.X. and X.D.; methodology, Z.X.; project administration, W.S.; data acquisition, Z.X. and Y.M.; supervision, W.S.; validation, C.D.; visualization, Z.X. and M.M.; writing—original draft, Z.X. and J.J.; writing—review and editing, all authors. All authors have read and agreed to the published version of the manuscript.

Funding

This research was funded by the National Natural Science Foundation of China (4164104), Heilongjiang Provincial Transportation Investment Group Technology Foundation (JT-10000-ZC-FW-2021-0182), Hunan Provincial Natural Science Foundation (2022J50270) (2023J50339).

Institutional Review Board Statement

Not applicable.

Informed Consent Statement

Not applicable.

Data Availability Statement

The data applied in this study are available on request from the first and the corresponding author.

Acknowledgments

We would like to thank Field Scientific Observation and Research Station of the Ministry of Education-Geological Environment System of Permafrost Area in Northeast China (FSSE-PFNEC) in field sampling.

Conflicts of Interest

The authors declare no conflict of interest.

References

  1. IPCC. Summary for Policymakers. In Climate Change 2021: The Physical Science Basis; Contribution of Working Group I to the Sixth Assessment Report of the Intergovernmental Panel on Climate Change; Cambridge University Press: Cambridge, UK, 2021. [Google Scholar]
  2. Wei, Z.; Jin, H.J.; Zhang, J.M.; Yu, S.P.; Han, X.J.; Ji, Y.j.; He, R.X.; Chang, X.L. Prediction of permafrost change in northeast China under climate change. Sci. China Earth Sci. 2011, 41, 74–84. [Google Scholar] [CrossRef]
  3. Wang, L.X.; Dong, H.K.; Long, P.; Wang, C.P.; Wu, X.D. Cycling of carbon, nitrogen and pollutants under permafrost degradation: A review. J. Glaciol. Geocryol. 2021, 43, 1365–1382. (In Chinese) [Google Scholar] [CrossRef]
  4. Xu, Z.C.; Shan, W.; Guo, Y.; Zhang, C.C.; Qiu, L.S. Swamp wetlands in degraded permafrost areas release large amounts of methane and may promote wildfires through friction electrification. Sustainability 2022, 14, 9193. [Google Scholar] [CrossRef]
  5. Li, Y.Y.; Liu, H.Y. Responses of Vegetation Growth to Climate Change in Permafrost Distribution Region in Northeast China. Acta Sci. Nat. Univ. Pekin. 2021, 57, 783–789. (In Chinese) [Google Scholar] [CrossRef]
  6. Wang, H.W.; Jin, H.J.; Li, X.Y.; Zhou, L.; Qi, Y.; Huang, C.L.; He, R.X.; Zhang, J.D.; Yang, R.; Luo, D.; et al. Changes in carbon stock in the Xing’an permafrost regions in Northeast China from the late 1980s to 2020. Gisci. Remote Sens. 2023, 60, 2217578. [Google Scholar] [CrossRef]
  7. Guo, Y.; Shan, W.; Zhang, C.C.; Hu, Z.G.; Wang, S.L.; Gao, J.Y. Monitoring of permafrost degradation along the Bei’an-Heihe expressway in China. Bull. Eng. Geol. Environ. 2020, 16, 1–10. [Google Scholar] [CrossRef]
  8. Shan, W.; Xu, Z.C.; Guo, Y.; Zhang, C.C.; Hu, Z.G.; Wang, Y.Z. Geological methane emissions and wildfire risk in the degraded permafrost area of the Xiao Xing’an Mountains, China. Sci. Rep. 2020, 10, 21297. [Google Scholar] [CrossRef]
  9. Sun, X.X.; Wang, H.J.; Song, C.C.; Jin, X.; Richardson, C.J.; Cai, T.J. Response of Methane and Nitrous Oxide Emissions from Peatlands to Permafrost Thawing in Xiaoxing’an Mountains, Northeast China. Atmosphere 2021, 12, 222. [Google Scholar] [CrossRef]
  10. Li, G.Y.; Ma, W.; Wang, F.; Jin, H.J.; Alexander, F.; Chen, D.; Gao, Y.; Zhou, Y.; Mao, Y.; Zhang, J.; et al. A newly integrated ground temperature dataset of permafrost along theChina-Russia crude oil pipeline route in Northeast China. Earth Syst. Sci. Data 2022, 14, 5093–5110. [Google Scholar] [CrossRef]
  11. Zhang, Z.Q.; Li, M.; Wang, J.; Yin, Z.Q.; Yan, Y.Z.; Xun, X.Y.; Wu, Q.B. A calculation model for the spatial distribution and reserves of ground ice—A case study of the Northeast China permafrost area. Eng. Geol. 2023, 315, 107022. [Google Scholar] [CrossRef]
  12. Zhao, X.; Sun, Y.; Deng, J.; Rao, Z.; Lü, C.; Song, J.; Li, L. Microbial gas in the Mohe permafrost, northeast China and its significance to gas hydrate accumulation in permafrost across China. Acta Geol. Sin. Engl. Ed. 2018, 92, 2251–2266. [Google Scholar] [CrossRef]
  13. Wang, X.; Pan, L.; Lau, H.C.; Zhang, M.; Li, L.; Zhou, Q. Reservoir volume of gas hydrate stability zones in permafrost regions of China. Appl. Energy 2018, 225, 486–500. [Google Scholar] [CrossRef]
  14. Archer, D.; Buffett, B.; Brovkin, V. Ocean methane hydrates as a slow tipping point in the global carbon cycle. Proc. Natl. Acad. Sci. USA 2009, 106, 20596–20601. [Google Scholar] [CrossRef] [PubMed]
  15. Kivimäki, E.; Lindqvist, H.; Hakkarainen, J.; Laine, M.; Sussmann, R.; Tsuruta, A.; Detmers, R.; Deutscher, N.M.; Dlugokencky, E.J.; Hase, F.; et al. Evaluation and Analysis of the Seasonal Cycle and Variability of the Trend from GOSAT Methane Retrievals. Remote Sens. 2019, 11, 882. [Google Scholar] [CrossRef]
  16. Zhang, S.H.; Xie, B.; Zhang, H.; Zhou, X.X.; Wang, Q.Y.; Yang, D.D. The spatial-temporal distribution of CH4 over globe and East Asia. China Environ. Sci. 2018, 38, 4401–4408. (In chinese) [Google Scholar] [CrossRef]
  17. Zhang, X.M.; Zhang, X.Y.; Zhang, L.J.; Li, X.H. Accuracy comparison of monthly AIRS, GOSAT and SCIAMACHY data in monitoring atmospheric CH4 concentration. In Proceedings of the International Conference on Geoinformatics, Kaifeng, China, 20–22 June 2013; pp. 1–4. [Google Scholar]
  18. Xiong, X.Z.; Barnet, C.; Maddy, E.; Sweeney, C.; Liu, X.P.; Zhou, L.H.; Goldberg, M. Characterization and validation of methane products from the Atmospheric Infrared Sounder (AIRS). J. Geophys. Res. 2008, 113, 1–15. [Google Scholar] [CrossRef]
  19. Xiong, X.; Barnet, C.; Wei, J.; Maddy, E. Information-based mid-upper tropospheric methane derived from Atmospheric Infrared Sounder (AIRS) and its validation. Atmos. Chem. Phys. 2009, 9, 16331–16360. [Google Scholar] [CrossRef]
  20. Yang, D.Y.; Zhang, D.Q.; Li, M.; Zang, S.Y. Factors Influencing the Spatiotemporal Changes of Permafrost in Northeast China from 1982 to 2020. Land 2023, 12, 350. [Google Scholar] [CrossRef]
  21. Xiong, X.; Barnet, C.; Maddy, E.; Wei, J.; Liu, X.P.; Pagano, T.S. Seven years observation of mid-upper Tropospheric methane from atmospheric infrared sounder. Remote Sens. 2010, 2, 2509–2530. [Google Scholar] [CrossRef]
  22. Xiong, X.; Hou, W.; Wei, J.; Maddy, E.; Sun, F.; Barnet, C. Methane plume over south Asia during the monsoon season: Satellite observation and model simulation. Atmos. Chem. Phys. 2009, 9, 783–794. [Google Scholar] [CrossRef]
  23. Aumann, H.H.; Chahine, M.T.; Gautier, C.; Goldberg, M.D.; Kalnay, E.; Mcmillin, L.M.; Revercomb, H.; Rosenkranz, P.W.; Smith, W.L.; Staelin, D.H.; et al. AIRS/AMSU/HSB on the Aqua mission: Design, science objectives, data products, and processing systems. IEEE Trans. Geosci. Remote Sens. 2003, 41, 253–264. [Google Scholar] [CrossRef]
  24. Marian, A.O.; Leonard, K.A.; Craig, R.F.; Sylvester, K.D. Inter-Comparison of AIRS Temperature and Relative Humidity Profiles with AMMA and DACCIWA Radiosonde Observations over West Africa. Remote Sens. 2020, 12, 2631–2646. [Google Scholar] [CrossRef]
  25. Obu, J.; Westermann, S.; Bartsch, A.; Berdnikov, N.; Christiansen, H.H.; Dashtseren, A.; Delaloye, R.; Elberling, B.; Etzelmüller, B.; Kholodov, A.; et al. Northern Hemisphere permafrost map based on TTOP modelling for 2000–2016 at 1 km2 scale. Earth-Sci. Rev. 2019, 193, 299–316. [Google Scholar] [CrossRef]
  26. Benesty, J.; Chen, J.; Huang, Y. Pearson Correlation Coefficient. Noise Reduct. Speech Process. 2009, 2, 1–2. [Google Scholar] [CrossRef]
  27. Setyanto, P.; Rosenani, A.B.; Makarim, A.K.; Fauziah, I.C.; Bidin, A.; Suharsin, S. Soil controlling factors of methane gas production from flooded rice fields in Pati District, Central Java. Indones. J. Agric. Sci. 2016, 3, 1–11. [Google Scholar] [CrossRef]
  28. Klusman, R.W.; Leopold, M.E.; Michael, P. Seasonal variation in methane fluxes from sedimentary basins to the atmosphere: Results from chamber measurements and modeling of transport from deep sources. J. Geophys. Res. 2000, 105, 661–670. [Google Scholar] [CrossRef]
  29. Song, C.C.; Xu, X.F.; Sun, X.X.; Tian, H.Q.; Sun, L.; Miao, Y.Q.; Wang, X.W. Large methane emission upon spring thaw from natural wetlands in the northern permafrost region. Environ. Res. Lett. 2012, 7, 034009. [Google Scholar] [CrossRef]
  30. Zhang, F.G.; Sun, Z.J.; Yang, Z.B. Geochemical Investigation of Gas Hydrate in the Permafrost Area. China. Bull. Mineral. Petrol. Geochem. 2019, 38, 1–11. [Google Scholar] [CrossRef]
  31. Kim, H.C.; Bishnol, P.R.; Heidemann, R.A.; Rizvi, S.S.H. Kinetic of methane hydrate decomposition. Chem. Eng. Sci. 1987, 42, 1645–1653. [Google Scholar] [CrossRef]
  32. Shan, W.; Qiu, L.S.; Guo, Y.; Zhang, C.C.; Xu, Z.C.; Liu, S. Spatiotemporal distribution characteristics of fire scars further prove the correlation between permafrost swamp wildfires and methane geological emissions. Sustainability 2022, 14, 14947. [Google Scholar] [CrossRef]
  33. Xu, X.K.; Yuan, B.; Wei, J. Vertical distribution and interaction of ethylene and methane in temperate volcanic forest soils. Geoderma 2008, 145, 231–237. [Google Scholar] [CrossRef]
  34. Tokida, T.; Mizoguchi, M.; Miyazaki, T.; Kagemoto, A.; Nagata, O.; Hatano, R. Episodic release of methane bubbles from peatland during spring thaw. Chemosphere 2007, 70, 165–171. [Google Scholar] [CrossRef] [PubMed]
  35. Wang, D.Y.; Deng, M.Z.; Ye, B. Studies on environmental issues caused by hydrocarbon leak in XC gas field. Nat. Gas Ind. 2006, 26, 133–135. (In Chinese) [Google Scholar]
  36. Zhao, X.M.; Deng, J.; Rao, Z.; Wen, Z.G.; Bi, C.Q.; Yi, L.; Lu, C.; Liu, C. Shallow gas characteristics in Mohe Basin, Northeast China and its significance to gas hydrate formation. Acta Pet. Sin. 2018, 39, 266–277. [Google Scholar] [CrossRef]
  37. Chong, Z.R.; Yang, S.H.B.; Babu, P. Review of natural gas hydrates as an energy resource: Prospects and challenges. Appl. Energy 2016, 162, 1633–1652. [Google Scholar] [CrossRef]
  38. Keith, A.K. Methane hydrate—A major reservoir of carbon in the shallow geosphere? Chem. Geol. 1988, 3, 41–51. [Google Scholar] [CrossRef]
  39. Warren, F.; Agena, T.S.; Collett, M.W.L. Permafrost-associated natural gas hydrate occurrences on the Alaska North Slope. Mar. Pet. Geol. 2011, 28, 279–294. [Google Scholar] [CrossRef]
  40. Zhao, X.M.; Deng, J.; Li, J.P.; Lu, C.; Song, J. Gas hydrate formation and its accumulation potential in Mohe permafrost, China. Mar. Pet. Geol. 2012, 35, 166–175. [Google Scholar] [CrossRef]
  41. Zhao, X.M.; Deng, J.; Rao, Z.; Yi, L.; Lu, C.; Li, S. Abnormalities of stable carbon and hydrogen isotopes of methane in the Mohe Basin, Northeast China and mechanisms of isotopic change. Earth Sci. Front. 2019, 26, 231–237. (In Chinese) [Google Scholar] [CrossRef]
  42. Zhao, X.M.; Hu, D.G.; Wen, D.G.; Tang, Z.G.; Deng, X.; Wang, J.; Li, R.Y. Geological structures associated with potential gas-hydrate accumulation in the Mohe permafrost, North East China. J. Pet. Sci. Eng. 2021, 197, 108110. [Google Scholar] [CrossRef]
  43. Zhang, F.G.; Tang, R.L.; Yang, Z.B.; Zhu, J.H.; Zhou, Y.L.; Sun, Z.J. Geochemical investigation and prospective evaluation of natural gas hydrates in the permafrost of Mohe basin. Geoscience 2018, 32, 1003–1011. [Google Scholar] [CrossRef]
  44. Hautala, S.L.; Solomon, E.A.; Johnson, H.P.; Harris, H.P.; Miller, U.K. Dissociation of Cascadia margin gas hydrates in response to contemporary ocean warming. Geophys. Res. Lett. 2014, 41, 8486–8494. [Google Scholar] [CrossRef]
  45. Valentina, M.; Elena, G. Model study of the Effects of climate change on the methane emissions on the arctic shelves. Atmospheric 2022, 13, 274. [Google Scholar] [CrossRef]
Figure 1. Distribution of permafrost in Northeast China and location of on-site monitoring points, red circle mean the scope of the study area, data sourced from Obu, J. et al. (2019) [25].
Atmosphere 14 01298 g001
Figure 2. Meteorological stations in the study area S-1. Meteorological station is mainly composed of data acquisition host, data analysis system, data transmission system, IoT sensors, ground penetrating radar wireless transmission system, solar power supply system, etc.
Atmosphere 14 01298 g002
Figure 3. AIRS and atmospheric background monitoring station methane concentration variation curves. AIRS data includes 200 hPa, 300 hPa, 400 hPa, 600 hPa, and 700 hPa, WLG and UUM represent the ground methane concentration of atmospheric background monitoring stations.
Atmosphere 14 01298 g003
Figure 4. Mean value of 850 hPa troposphere methane concentration in China and Northeast China from 2003 to 2022.
Atmosphere 14 01298 g004aAtmosphere 14 01298 g004b
Figure 5. Spatial distribution and changes in Fnc and the thermal state of permafrost in Northeast China.
Atmosphere 14 01298 g005aAtmosphere 14 01298 g005b
Figure 6. Methane concentration changes in the different altitudes of the near-surface troposphere of Northeast China from 2003 to 2022.
Atmosphere 14 01298 g006
Figure 7. Seasonal variation in methane concentration in near-surface troposphere of Northeast China from 2003 to 2022.
Atmosphere 14 01298 g007aAtmosphere 14 01298 g007b
Figure 8. Changes in ground-surface methane concentration with different monitoring factors in study area S-1.
Atmosphere 14 01298 g008aAtmosphere 14 01298 g008b
Figure 9. Air temperature changes, ground surface freezing (melting) index, and frost number changes in the study area S-1 from 1960 to 2022. The data are sourced from on-site monitoring and National Meteorological Station (http://data.cma.cn, accessed on 1 January 2023).
Atmosphere 14 01298 g009
Figure 10. Degradation of permafrost, soil layer structure, and geological methane obtained through drilling in study area S-1.
Atmosphere 14 01298 g010
Figure 11. Geological distribution of methane, carbon, and hydrogen isotopes in the permafrost layer of the Northeast China permafrost region. The drill hole (MK-2-MK-5, etc.) data are from laboratory testing and China Geological Survey (https://en.cgs.gov.cn/, accessed on 1 January 2023).
Atmosphere 14 01298 g011aAtmosphere 14 01298 g011b
Figure 12. Distribution of oil and gas basins and geological methane release in degraded permafrost areas in Northeast China.
Atmosphere 14 01298 g012
Figure 13. Methane gas concentration variation curves for different high-permeability channels and conventional permeability regions. (a) Curve of methane concentration with time at a distance of 10 m from the upper surface of the model; (b) methane gas concentration variation curve along the horizontal axis of the model when 1.0 × 10⁴ s.
Atmosphere 14 01298 g013
Table 1. Correlation coefficient of methane concentration between AIRS and atmospheric background monitoring stations.
PositionMethane Concentration (Monthly) Average
200 hPa300 hPa400 hPa600 hPa700 hPa
WLG0.710.720.750.730.77
UUM0.490.500.540.510.53
PositionMethane Concentration (Annual) Average
200 hPa300 hPa400 hPa600 hPa700 hPa
WLG0.970.960.960.960.96
UUM0.960.950.950.970.95
Significance testAll passed α = 0.01 significance test, significantly correlated at the 0.01 level (bidirectional)
Table 2. Gas composition of drilling cores in the Mohe basin.
ComponentsMethaneEthanePropaneIsobutaneButaneIsopentaneN-Pentane
Concentration/(μL·L−1)274,747.8611,844.484296.00634.32722.61208.2774.49
Content/%93.924.051.470.220.250.070.03
Table 3. Organic matter abundance of source rock in Sunwu-Jiayin basin.
Geological Layer StructureTotal Organic Carbon (%)Chloroform Bitumen (%)Hydrocarbon Generation Potential (mg/g)Total Hydrocarbon (mg/g)
Taiping Forest Farm Group0.51~1.13
0.89 (7)
0.0071~0.019
0.0128 (5)
0.31~0.94
0.55 (7)
Yong’an Village Group0.16~4.51
1.33 (23)
0.0045~0.0348
0.0139 (12)
0.06~22.48
2.63 (21)
54.41~76.86
61.89 (3)
Taoqihe Group0.21~4.98
1.89 (171)
0.0039~0.1169
0.0261 (49)
0.045~20.468
2.94 (171)
46.3~80.39
61.66 (13)
Ningyuan Village Group0.10~5.93
1.72 (23)
0.0047~0.0451
0.0249 (2)
0.024~14.01
2.31 (5)
Disclaimer/Publisher’s Note: The statements, opinions and data contained in all publications are solely those of the individual author(s) and contributor(s) and not of MDPI and/or the editor(s). MDPI and/or the editor(s) disclaim responsibility for any injury to people or property resulting from any ideas, methods, instructions or products referred to in the content.

