
Variability of River Runoff in Poland and Its Connection to Solar Variability
by
 , , ,
, , ,
Dariusz Wrzesiński
1,
Leszek Sobkowiak
1,*,
Ileana Mares
2,
Venera Dobrica
2 and
Constantin Mares
2 1
Department of Hydrology and Water Resources Management, Faculty of Geographical and Geological Sciences, Adam Mickiewicz University, Bogumiła Krygowskiego Str. 10, 61-680 Poznań, Poland
2
Institute of Geodynamics, Romanian Academy, 19-23 J.L. Calderon St., 020032 Bucharest, Romania
*
Author to whom correspondence should be addressed.
Atmosphere 2023, 14(7), 1184; https://doi.org/10.3390/atmos14071184
Submission received: 19 June 2023
/
Revised: 17 July 2023
/
Accepted: 19 July 2023
/
Published: 22 July 2023
(This article belongs to the Section Climatology)
Abstract
:The aim of this research was to determine relationships between solar activity and variability of discharges of three Central European rivers: the Vistula, Odra and Warta in Poland in the multi-annual period of 1901–2020. Changes in precipitation and air temperature at Poznań meteorological station in the same period were also analyzed. The long-term variations in river runoff were investigated both from the point of view of temporal variability in relation to climate variations in the study area, and from the point of view of linear/non-linear links to solar activity, as described by the Wolf sunspot number. The wavelet transform analysis was used to highlight the frequency-time distribution of the coherences between solar and discharge variability. It was found that most of the links between solar activity and discharges were non-linear.
1. Introduction
Runoff is a component of the hydrological cycle, important and necessary for human and natural development [1]. Multi-annual variations in runoff may result from environmental changes on a local scale (e.g., caused by human activity) or on regional and global scales (caused by climate changes). Long-term fluctuations of hydrological and meteorological quantities have been the object of attention of hydrologists and climatologists since the beginning of the 20th century [2], with a growing number of researchers seeking for periodicity in the occurrence of high and low river runoff. For example, Pekarova et al. [3] tested the annual discharge time series of selected large rivers in the world for wet and dry periods and identified the 28–29 year and 20–22 year cycles of extremes occurrence, and determined that the temporal shift in the discharge extremes occurrence (both, maxima and minima) depended on the longitude and latitude. Pekarova et al. [4] performed a trend and runoff fluctuation analysis of discharge series of selected main European rivers in the multi-annual period of 1850–1997. The analysis did not confirm any long-term increase or decrease in the occurrence of dry and wet periods during the last 150 years, however, dry cycles of about 13.5 years and 28–29 years were detected. In addition, a shift of several years in the occurrence of the wet and dry cycles was determined in East Europe compared to North and West/Central Europe.
The inter-annual fluctuation of water resources attracts considerable interest of researchers in Poland. This is mostly due to their limited variability in that country, as the average water resources in the multi-annual period of 1901–2000 are lower than 61.5 km3, which is less than 1600 m3 per capita per year. In this regard, Poland occupies one of the lowest positions in Europe, ahead only of the Czech Republic (1600 m3 per capita per year), and Cyprus and Malta, which have much less fresh water, respectively, 400 and 100 m3 per capita per year [5].
The components of Poland’s water balance and the proportions between them are shaped by climate and the related hydrological processes. Long-term changes in the runoff of rivers in Poland are conditioned by both natural factors related to atmospheric circulation, and human activity [6,7]. A feature of the regime of Polish rivers is the tendency to form a series of wet and dry years, caused by the dominance of various types of atmospheric circulation [5]. Poland, located in Central Europe, is an area where the contrast oceanic and continental air masses clash. As a result, specific climatic conditions are observed, which is reflected in their spatial and seasonal variability. The formation of water resources in the Poland is associated primarily with the influx of humid air masses from the west and with the occurrence of cyclonic circulation. Increased zonal circulation (i.e., oceanic influences) resulting in higher precipitation in winter, while in summer precipitation is relatively lower. Droughts and long periods with no precipitation are associated with anti-cyclonic circulation from the eastern directions—although there are exceptions in spring and autumn, when a strong cyclonic circulation develops [8,9]. As a result, precipitation in Poland is much lower than in the western part of the continent, and their distribution is characterized by high seasonal variability. Limited precipitation with similar levels of evaporation losses are the main factors that make the runoff in the Polish Lowlands noticeably lower than in neighboring areas, and locally in the Kuyavia region (<60 mm) it belongs to one of the lowest in Europe; such a low runoff is recorded only in the Caspian Lowland, around the Black Sea and in the Hungarian Plain. Hence, Poland’s water resources are limited compared to neighboring countries, and the structure of the water balance is extremely unfavorable. This is evidenced by the low runoff coefficient of Polish rivers α = 0.278, which means that only 28% of water from precipitation is turned into runoff [10,11]. These resources mainly consist of the runoff by the two largest Polish rivers, the Vistula (32.5 km3) and the Odra (16.1 km3).
Although the long-term variability of the runoff of the largest rivers in Poland do not show a statistically significant trend, a clear quasi-cyclical nature can be determined in the multi-annual period of 1901–2010. The deficits and surpluses of the water resources of the Vistula and Odra rivers showed different rhythmic changes in the last century. Water resources of the Odra River change in 3–6 year cycles, while in the case of the Vistula River, a shorter 2–4 year cycle dominates, and longer fluctuations (from 3 to 7 years) are weaker. Deficit cycles from August to September are clearly visible, while the high level of water resources is marked in late autumn, winter and in the snowmelt and precipitation period [12].
A review of studies on the transformation of hydro-climatic elements in Poland in the last century [13] indicated that the longest, though not fully documented, period was the age cycle, probably conditioned by circulation and solar factors. Cycles with a periodicity of 3–4 years and unknown origin had a significant share in the temporal variability of hydro-climatic elements. Stachý [14,15], based on the analysis of the relationship between runoff and atmospheric circulation in connection with solar activity and the solar age cycle lasting about 80–90 years, predicted a gradual increase in runoff in the years 1970–1985. Jokiel and Kożuchowski [13] and Gutry-Korycka and Boryczka [16] studied the annual runoff of the largest Polish rivers and concluded that the occurrence of its long-term, multi-decadal variability, reflected in the 30 to 40 year periodicity, was characterized by the runoff alternately higher and lower than the average multi-annual value. In this way, the occurrence of alternately positive and negative sub-trends in the runoff time series was explained. Runoff and the hydrological regime of Polish rivers and lakes are also affected by changes in the intensity of the North Atlantic Oscillation, as determined by [17,18,19,20,21,22,23,24]. Marsz et al. [25] showed that the most important reason for this variability were changes in the intensity of the North Atlantic Thermohaline Circulation (NA THC). The average annual runoff of the largest Polish rivers (Vistula, Bug, Odra and Warta) shows a relationship with the variability of the indicator characterizing the NA THC intensity [25,26], and decreases in the positive phase of THC (predominance of positive values, indicating an increase in THC intensity above the average), and increases in the negative phase, along with the weakening of THC intensity (below the average).
The above review shows that while studies on the variability of river runoff in Poland and their causes are diversified, there is still a lack of research on the possible extra-terrestrial factors, including the solar activity, which may have an impact on that variability. For example, Rodriguez-Iturbe and Yevjevich [27] investigated the relationship of hydrologic series of monthly precipitation, annual precipitation and annual runoff to sunspot numbers by cross-correlation analysis for various time lags (zero lag included) and by cross-spectral analysis. While no significant correlation was found between these hydrologic series and sunspot numbers, sampling fluctuations of cross-correlation coefficients between hydrologic series and sunspot numbers increased when both series were smoothed by moving average schemes. Dyer [28] analyzed the time series of seven river flows, and inflow into three dams possess peaks near the solar cycle in their spectra. The results suggested that further work was justified since a hypothesis of no relationship between river flow and the solar cycle could not be accepted.
Zanchettin et al. [29] using spectral and statistical analyses of discharges and basin average precipitation rates acquired over the Po River since the early 1800s, investigated the impact of variations in solar activity on hydrological decadal patterns over northern Italy. The study confirmed that wet and dry periods alternated in accordance with polarized sunspot cycles. Additionally, the North Atlantic Oscillation (NAO) was determined as a potential link between the Sun and the Po River discharges, since it was significantly correlated with both solar activity and the decadal variability in the north Italian climate. Cionco and Abuin [30] explored a possible underlying physical mechanism between planetary torque signals and sub-decadal frequencies in the discharges of large rivers: the Po River in Europe and the Paraná River in South America. They found the same periodicity in discharge peaks of these two rivers, i.e., 6.3, 7.7, 8.6 and 9.9 years, and concluded that the physical origin of this connection might be related to a working solar spin-orbit interaction.
Hajian and Movahed [31] used the Detrended Cross-Correlation Analysis (DCCA) to investigate the influence of solar activity represented by sunspot numbers on river flow fluctuation for Daugava, Holston, Nolichucky and French Broad rivers. Their results showed that there existed a long-range cross-correlation between the sunspot numbers and the underlying streamflow records. Briciu and Mihăilă [32] verified the influence of some climatic oscillations and sunspot number on river flows in Romania, Ukraine using standard wavelet analyses, and found that the rivers generally had periods with a frequency of 2.9–3.5, 8.3, 11.7, and 27.8–33.1 years, generally corresponding to those of the atmospheric precipitation, climatic oscillations, and sunspot number. On that basis, they determined that the sunspot number and the climatic oscillations partly acted on river flows through rainfalls.
Antico and Torres [33] studied discharges of the Amazon River in the multi-annual period of 1903–2013 and identified a decadal flow cycle that was anti-correlated with the solar activity measured by the decadal sunspot cycle. They concluded that this relationship persisted through time and appeared to result from a solar influence on the tropical Atlantic Ocean. The amplitude of the decadal solar signal in flow was apparently modulated by the inter-decadal North Atlantic variability. These findings were confirmed by [34], who extended the analysis back in time, using a new hydrological proxy record of tree ring oxygen isotopes (δ18OTR); consistent with the findings of [33], a positive correlation between sunspots and the decadal δ18OTR cycle from 1903 to 2012 was determined. However, the relationship did not persist into the preceding century and even became weakly negative for the period of 1799–1902.
Su et al. [35] used the wavelet transform analysis to detect the variability of natural, observed, and reconstructed streamflow in the Yellow River at 500, 100 and 50 year timescales. They found that sunspots impacted streamflow variability by influencing atmospheric circulation, resulting in abundant precipitation. Dobrica et al. [36] discussed the precipitation and the Danube discharge data from the Upper-Middle and Lower Danube Basins from the viewpoint of multi-decadal variability associated both with the Atlantic variability and solar variability, concluding that climate variations, are a result of direct action of large-scale circulation patterns, modulated by solar activity. Dai et al. [1] proved that the solar and lunar periodic motions (SLPMs) had substantial impacts on the runoff of the world’s large rivers. Yang and Xing [37] searched for possible linkages of hydrological variables to ocean–atmosphere signals and sunspot Activity in the upstream Yangtze River basin and found that both the Pacific Decadal Oscillation and the sunspot had significantly stronger effects on streamflow variability than precipitation, which might be associated with the high spatiotemporal variability of precipitation. Mares et al. [38] investigated the possible influence of solar/geomagnetic forcing on climate variables, such as the drought index, discharge and large-scale atmospheric indices in the Danube River basin, and detected significant solar/geomagnetic forcing appears in the terrestrial variables with a delay of 2–3 years, and the results of testing the response of large scale climate variability indices at solar/geomagnetic forcing can be found in [39]. Liu et al. [40] taking the upper reaches of the Weihe River as an example in Western China, determined that in the peak year of sunspots, the probability of heavy drought/extreme floods was large, and the 102 year sunspot cycle had a more significant effect on drought and flood disasters.
In order to bridge this research gap, present study aims at determining possible effect the cyclicality of solar activity has on the long-term variability of river runoff in Poland.
2. Materials and Methods
2.1. Study Area
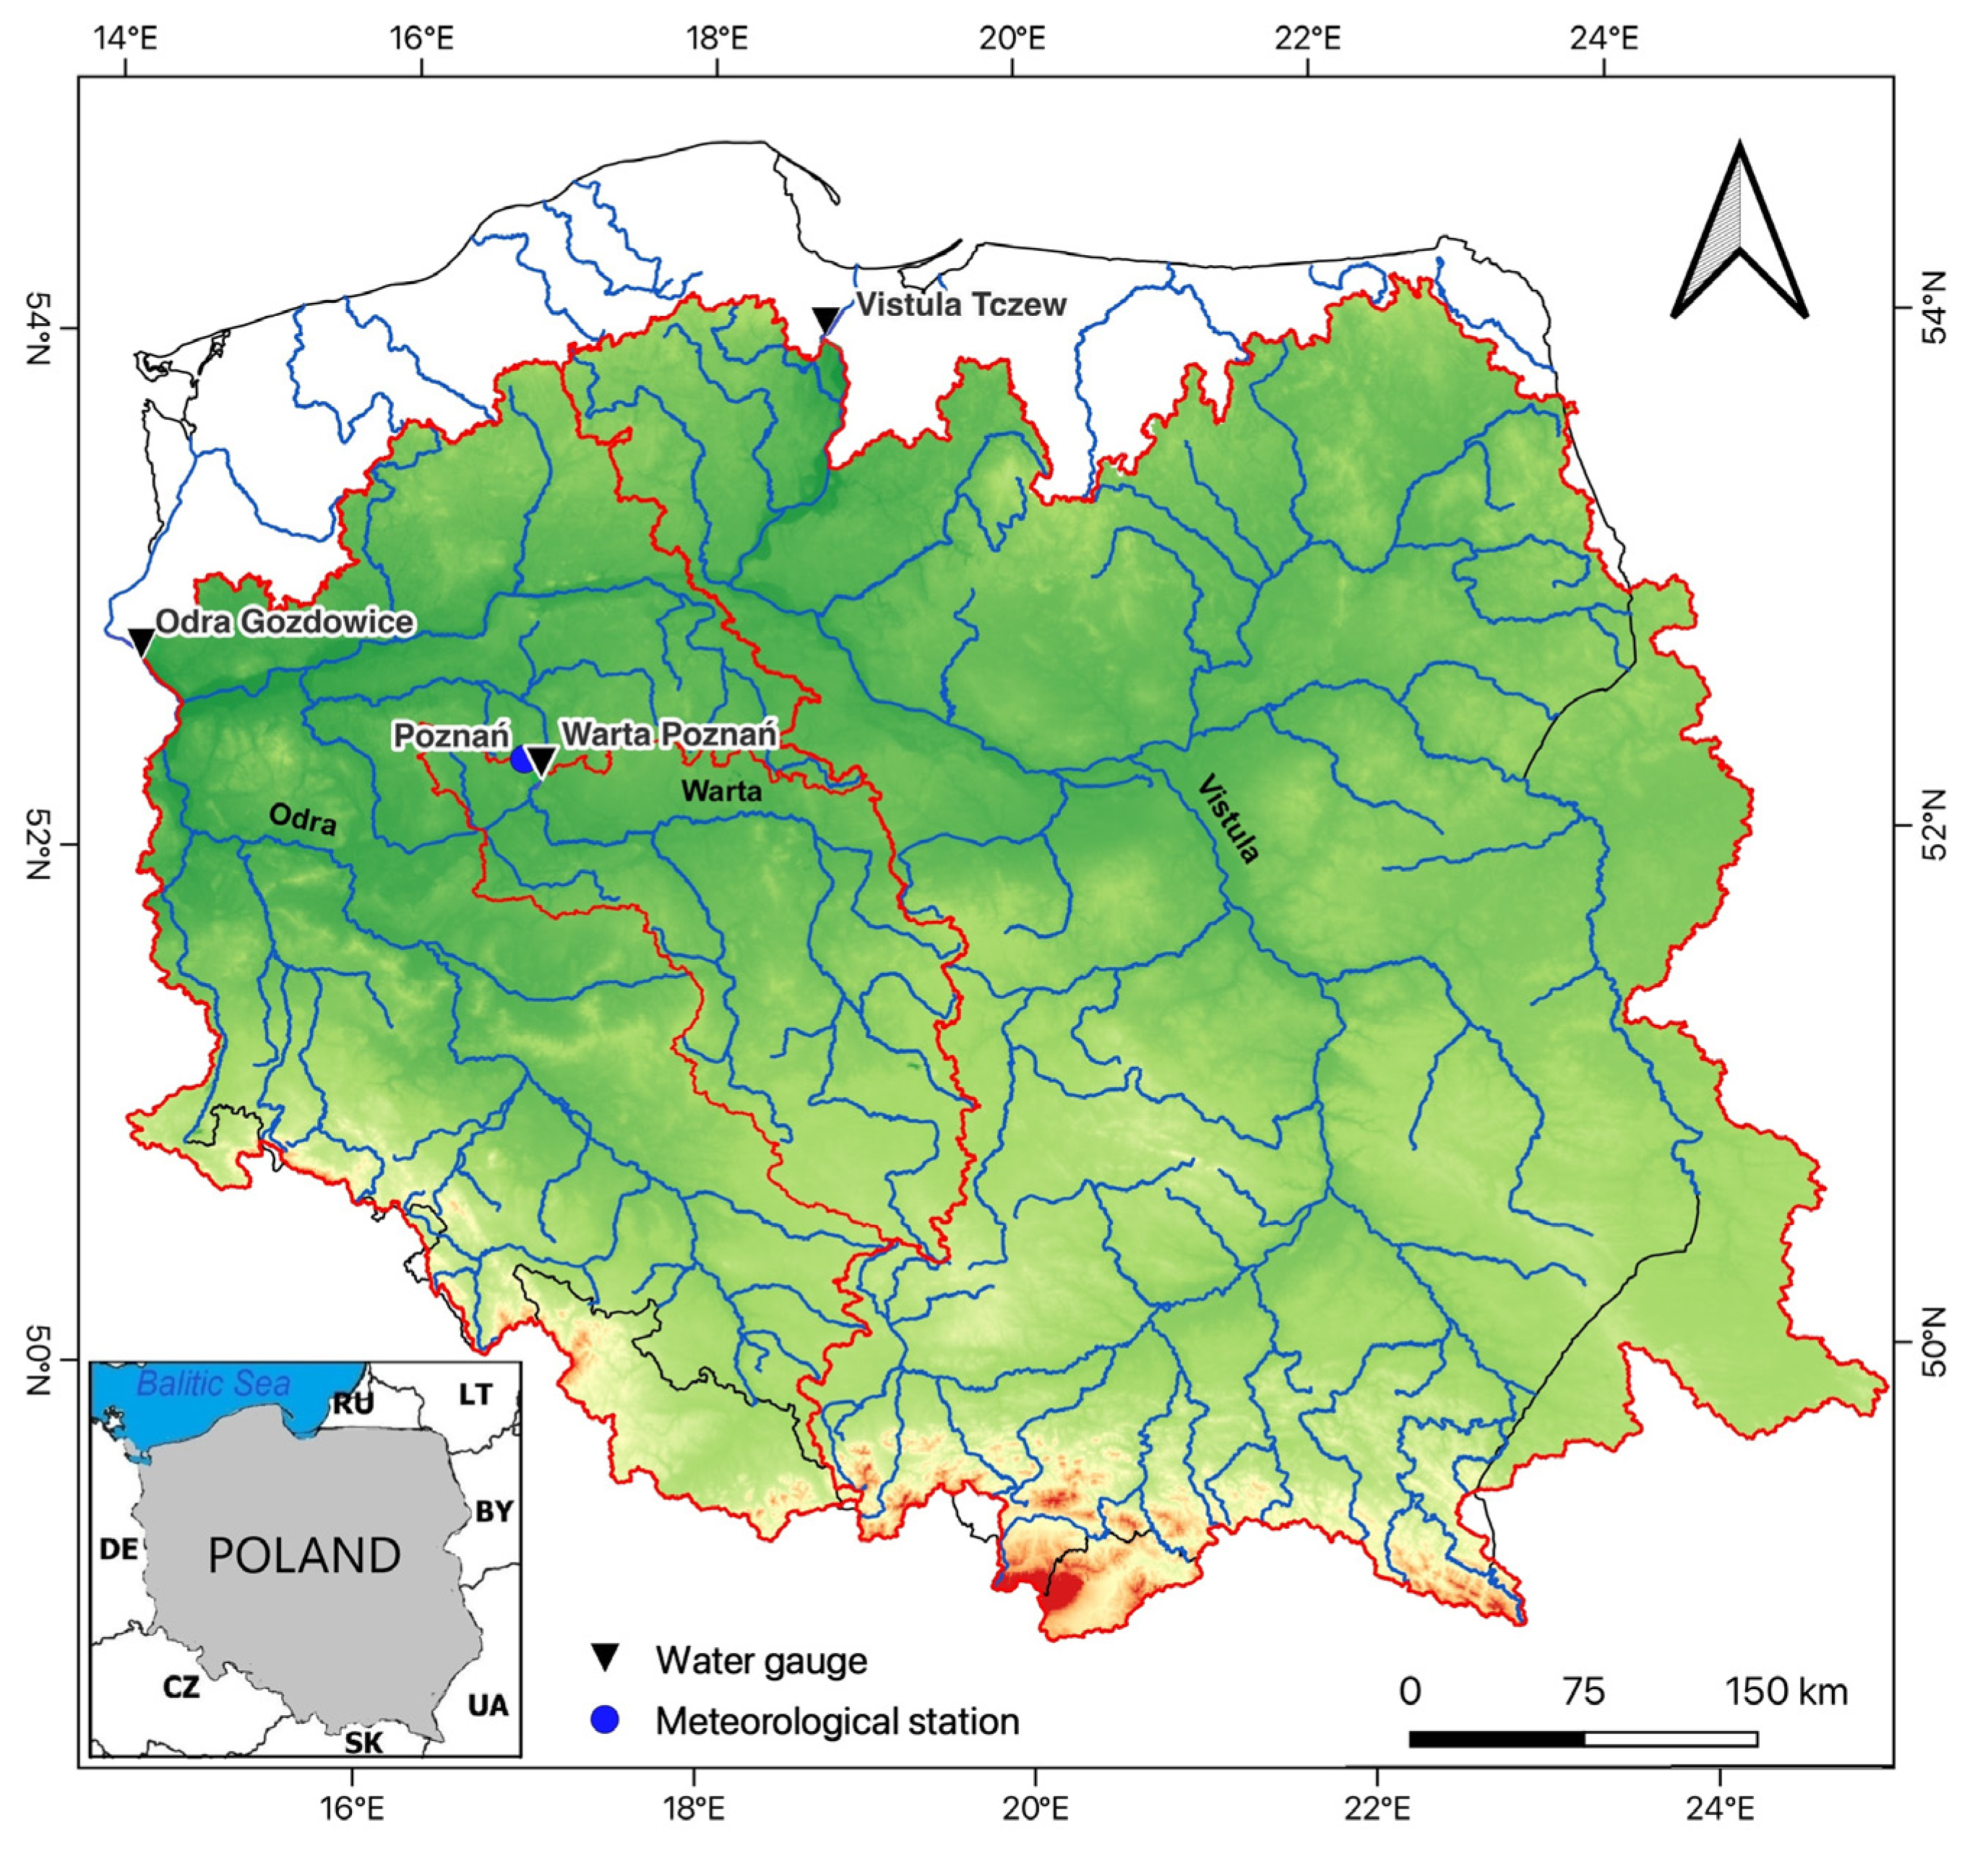
The two largest river basins in Poland, i.e., the Vistula River basin and the Odra River basin, occupying nearly 88% of the country area (Figure 1) are taken as the research area.
The Vistula (Wisła) River is the longest (1047 km) river in Poland. It is also the largest Polish river in terms of basin area (194,376 km2, of which 168,800 km2 within the borders of Poland). Being one of the largest rivers in Europe, it ranks 12th in terms of length, 9th in terms of river basin area and 10th in terms of discharge among the European watercourses. The Vistula has its source on the Barania Góra Mountain (1107 m a.s.l.) in southern Poland. It runs north and flows into the Baltic Sea. The largest tributaries of the Vistula River are: the left-bank San (16,877 km2) and Narew (74,527 km2), and the right-bank Pilica (9258 km2) and Bzura (7764 km2) [41,42] (Figure 1).
The Odra (Oder) River is the second longest river in Poland (854 km, 742 km within the country’s borders), and its basin occupies 118,861 km2 (106,056 km2 in Poland). It originates in the Sudety Mountains (634 m a.s.l) in the eastern Czech Republic. The Odra River flows north and discharges into the Baltic Sea. Odra is the transboundary river shared between Poland, the Czech Republic and Germany. The largest tributary on the Odra River is the Warta River.
The Warta River is the largest tributary of the Odra River, and is the third longest river in Poland: its total length is 808 km, and most of its catchment area (54,519 km2) lies below 200 m a.s.l. [43]. However, it has relatively diversified terrain and extends from highlands in the south through lowlands of Central Poland to the lake-district area in the north (Figure 1). The Warta River catchment has one of the lowest precipitation totals in Poland, varying from 520 mm in the north-eastern part of the catchment (the Kuyavia region) to 675 mm in the southern uplands [44].
The total outflow of the analyzed rivers varies from 170 mm in the Vistula basin in gauge Tczew to 151 mm in the Odra basin in gauge Gozdowice and 127 mm in the Warta catchment in gauge Gorzów [19]. The river regime of the three rivers is nival moderately developed [45]. In the seasonal structure of flow, the low-water period in summer and autumn, and the high-water period in spring are clearly marked [19].
According to the Köppen–Geiger classification of climates [46], the study area lies in the transition zone between a humid continental (Cfb) and oceanic climate (Dfb) with relatively cold winters and warm summers.
2.2. Data
Data used in this study were obtained from the datasets of the Institute of Meteorology and Water Management—National Research Institute in Warsaw, Poland, and included daily precipitation collected at Poznań meteorological station, and daily discharges from hydrological stations: Tczew in the Vistula River basin, Gozdowice in the Odra River basin and Poznań in the Warta River catchment in the multi-annual period of 1901–2020 (Figure 1). Hydrological stations Tczew and Gozdowice were selected for the analyses, because they are representative, closing almost the entire basins of the Vistula and the Odra rivers, respectively. In the case of the Warta River catchment, measurements from the meteorological and hydrological stations in Poznań were used for the study due to their longest and continuous in this catchment hydro-meteorological data series, dating back to the beginning of the 20th century.
For the first attempt to establish a linear/non-linear connection between solar variability and river discharges in Poland we used to describe solar variability only by the Wolf sunspots number (SSN) available at http://www.sidc.be/silso/datafiles (accessed on 1 December 2022).
2.3. Methods
In order to detect changes in the examined hydro-meteorological variables in the multi-annual period of 1901–2020 and their statistical significance, the following methods were applied:
- -
- the linear regression for evaluating long-term trends (Equation (1)):
y = ax + b
The t-Student formula was used to test the significance of the correlation coefficient r of the trend approximant (Equation (2)):
where: r—the linear correlation coefficient, n—number of sequence elements.
The t-statistic has the Student distribution with n − 2 degrees of freedom. The critical value t for n − 2 degrees of freedom was assumed for three significance levels: p = 0.05, p = 0.01 and p = 0.001.
- -
- the 10 year moving average,
- -
- the standardized cumulative annual deviation (SCAD). The resulting cumulative charts inform about periods with values higher and lower than the long-term average. In the case of precipitation and river discharge, it shows the sequence of wet and dry years, and in the case of air temperature the sequence of warm and cold years.
In the next stage, for 20 year sub-periods of the multi-year period of 1901–2020 with the 1 year lag (a total of 101 sub-periods), the following values were calculated:
- -
- average annual discharges of the analyzed rivers, air temperature and precipitation at Poznań station,
- -
- linear regressions of the analyzed hydro-meteorological variables,
- -
- deviations (differences) between the average river discharge in the subsequent 20 year sub-periods and the average values from 1901 to 2020. The statistical significance of these differences was checked with the t-test for paired samples. Each time, the hypothesis H0: μ = μ0 of the equality of expected values was tested against H1: μ ≠ μ0. Rejection of the hypothesis allows concluding about significant differences between the average discharges observed in 20 year periods and their average values from 1901 to 2020. In order to verify the hypothesis, a sample test based on the Student’s t-distribution was used, with n − 1 degrees of freedom (Equation (3)):
In the mathematical and statistical analysis of the source data, statistical procedures of Excel (Microsoft) and Statistica (TIBCO Software Inc.) were applied. The following programs were used to create the graphic page: QGIS, Surfer (Golden Software) and CorelDraw 12 (Corel). When constructing the figures, the isolines were plotted using the kriging procedure.
Assessing the solar influence on discharge was investigated by using both linear and non-linear techniques.
The linear links were tested using the Pearson correlation coefficient (R) and the non-linear ones using the non-linear correlation coefficient (NLR) calculated according to Equation (4):
where MI is mutual information, the measure of information shared between two time series.
The MI between two time series X and Y was estimated using Equation (5):
where: H(X) and H(Y) are the individual information entropies of the X and Y time series, respectively, and H(X,Y) is the joint entropy of the two variables.
The non-linear link given by NLR, in comparison with the linear one, has the advantage of ignoring the statistical distribution of the analyzed variables or the nature of their relationship [47,48]. More details about the non-linear and non-stationary link between two variables and the method used to establish confidence levels can be found in [49].
In the present study, the wavelet analysis was applied to highlight the repartition in the time–frequency domain of the coherence between two variables. A review of wavelet in geoscience and, in particular, the study of correlations between solar activity and hydrological variables is given in [50,51].
A very useful tool in wavelet transform theory is the wavelet coherence (WTC). Coherence is a measure of the intensity of the covariance of the two series in time–frequency space.
All parameters related to WTC between rivers discharge in Poland and solar variability were calculated using the Matlab procedure provided by [52] and the one related to Global Wavelet Coherence based on routines achieved by [53]. In accordance with [54], the global wavelet coherence between two time series measures the relationship between them as a function of frequency (or period).
A representation boxplot type for coherence was also carried out. On each box, the central mark indicated the median, and the bottom and top edges of the box indicatd the 25th and 75th percentiles, respectively. The whiskers extended to the most extreme data points not considered outliers, and the outliers were plotted individually using the ‘+’ marker symbol.
The testing was carried out for each season with lags from 0 to 5 years of discharge compared to sunspot number (SSN or Wolf number in some parts of the paper, especially for figures).
3. Results
3.1. Temporal Variability of Hydro-Meteorological Elements
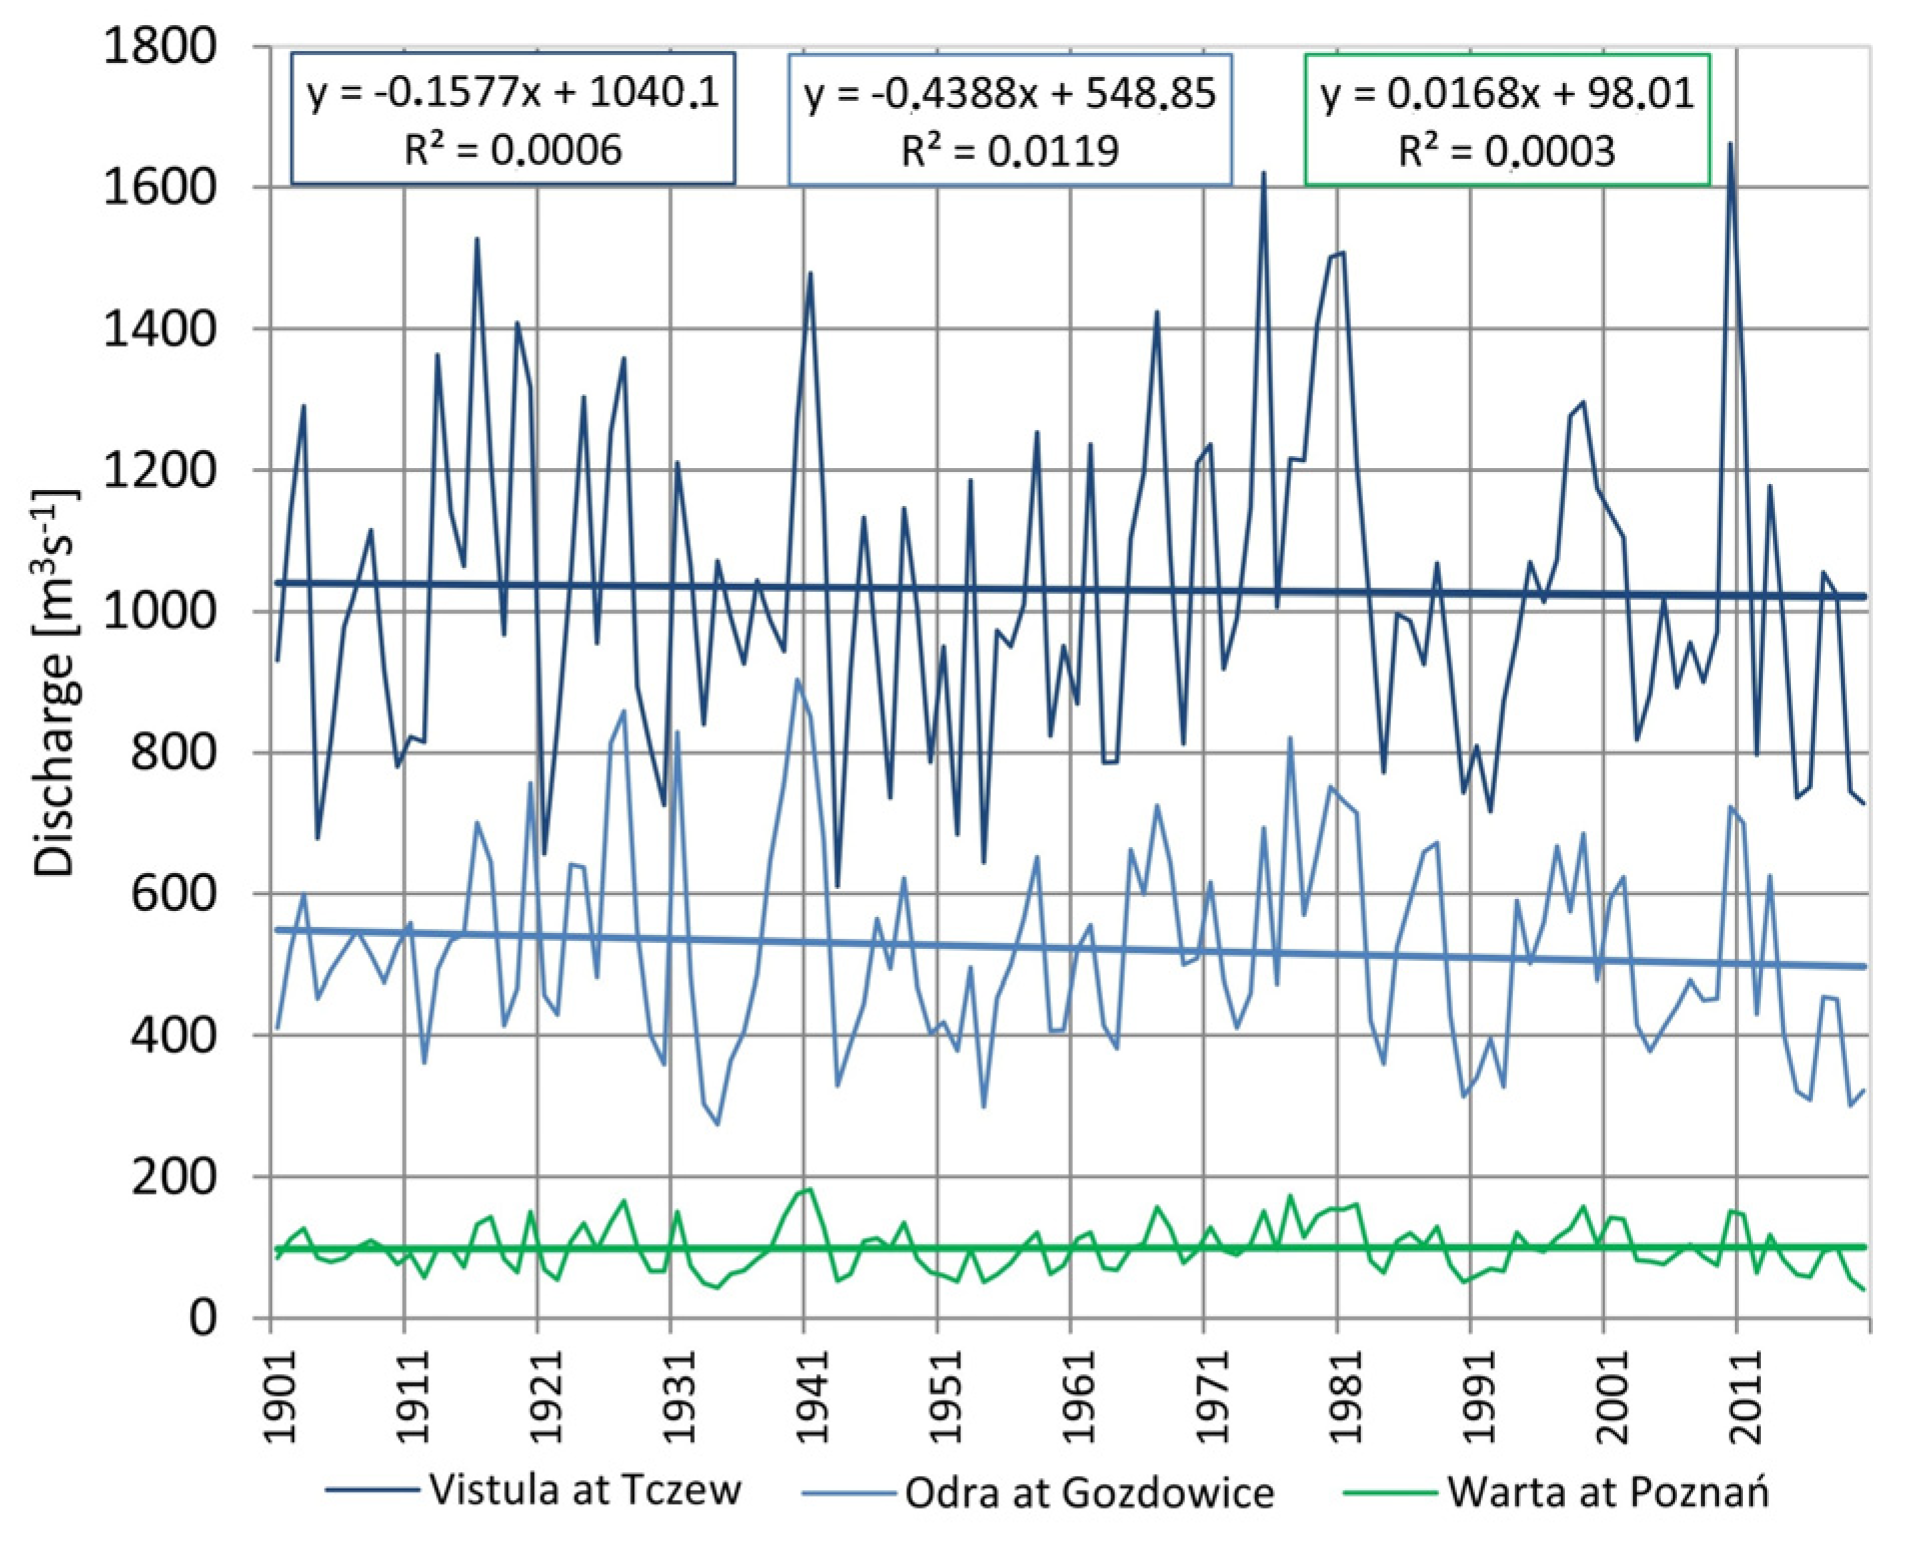
The annual runoff of the studied rivers in individual years largely corresponds to the sum and distribution of precipitation. On average, it is 124 mm for the Warta River at gauge Poznań, 150 mm for the Odra River at gauge Gozdowice and 167 mm for the Vistula River at gauge Tczew. The amount of the annual runoff is subject to strong changes, and the maxima and minima occur in different years (Figure 2).
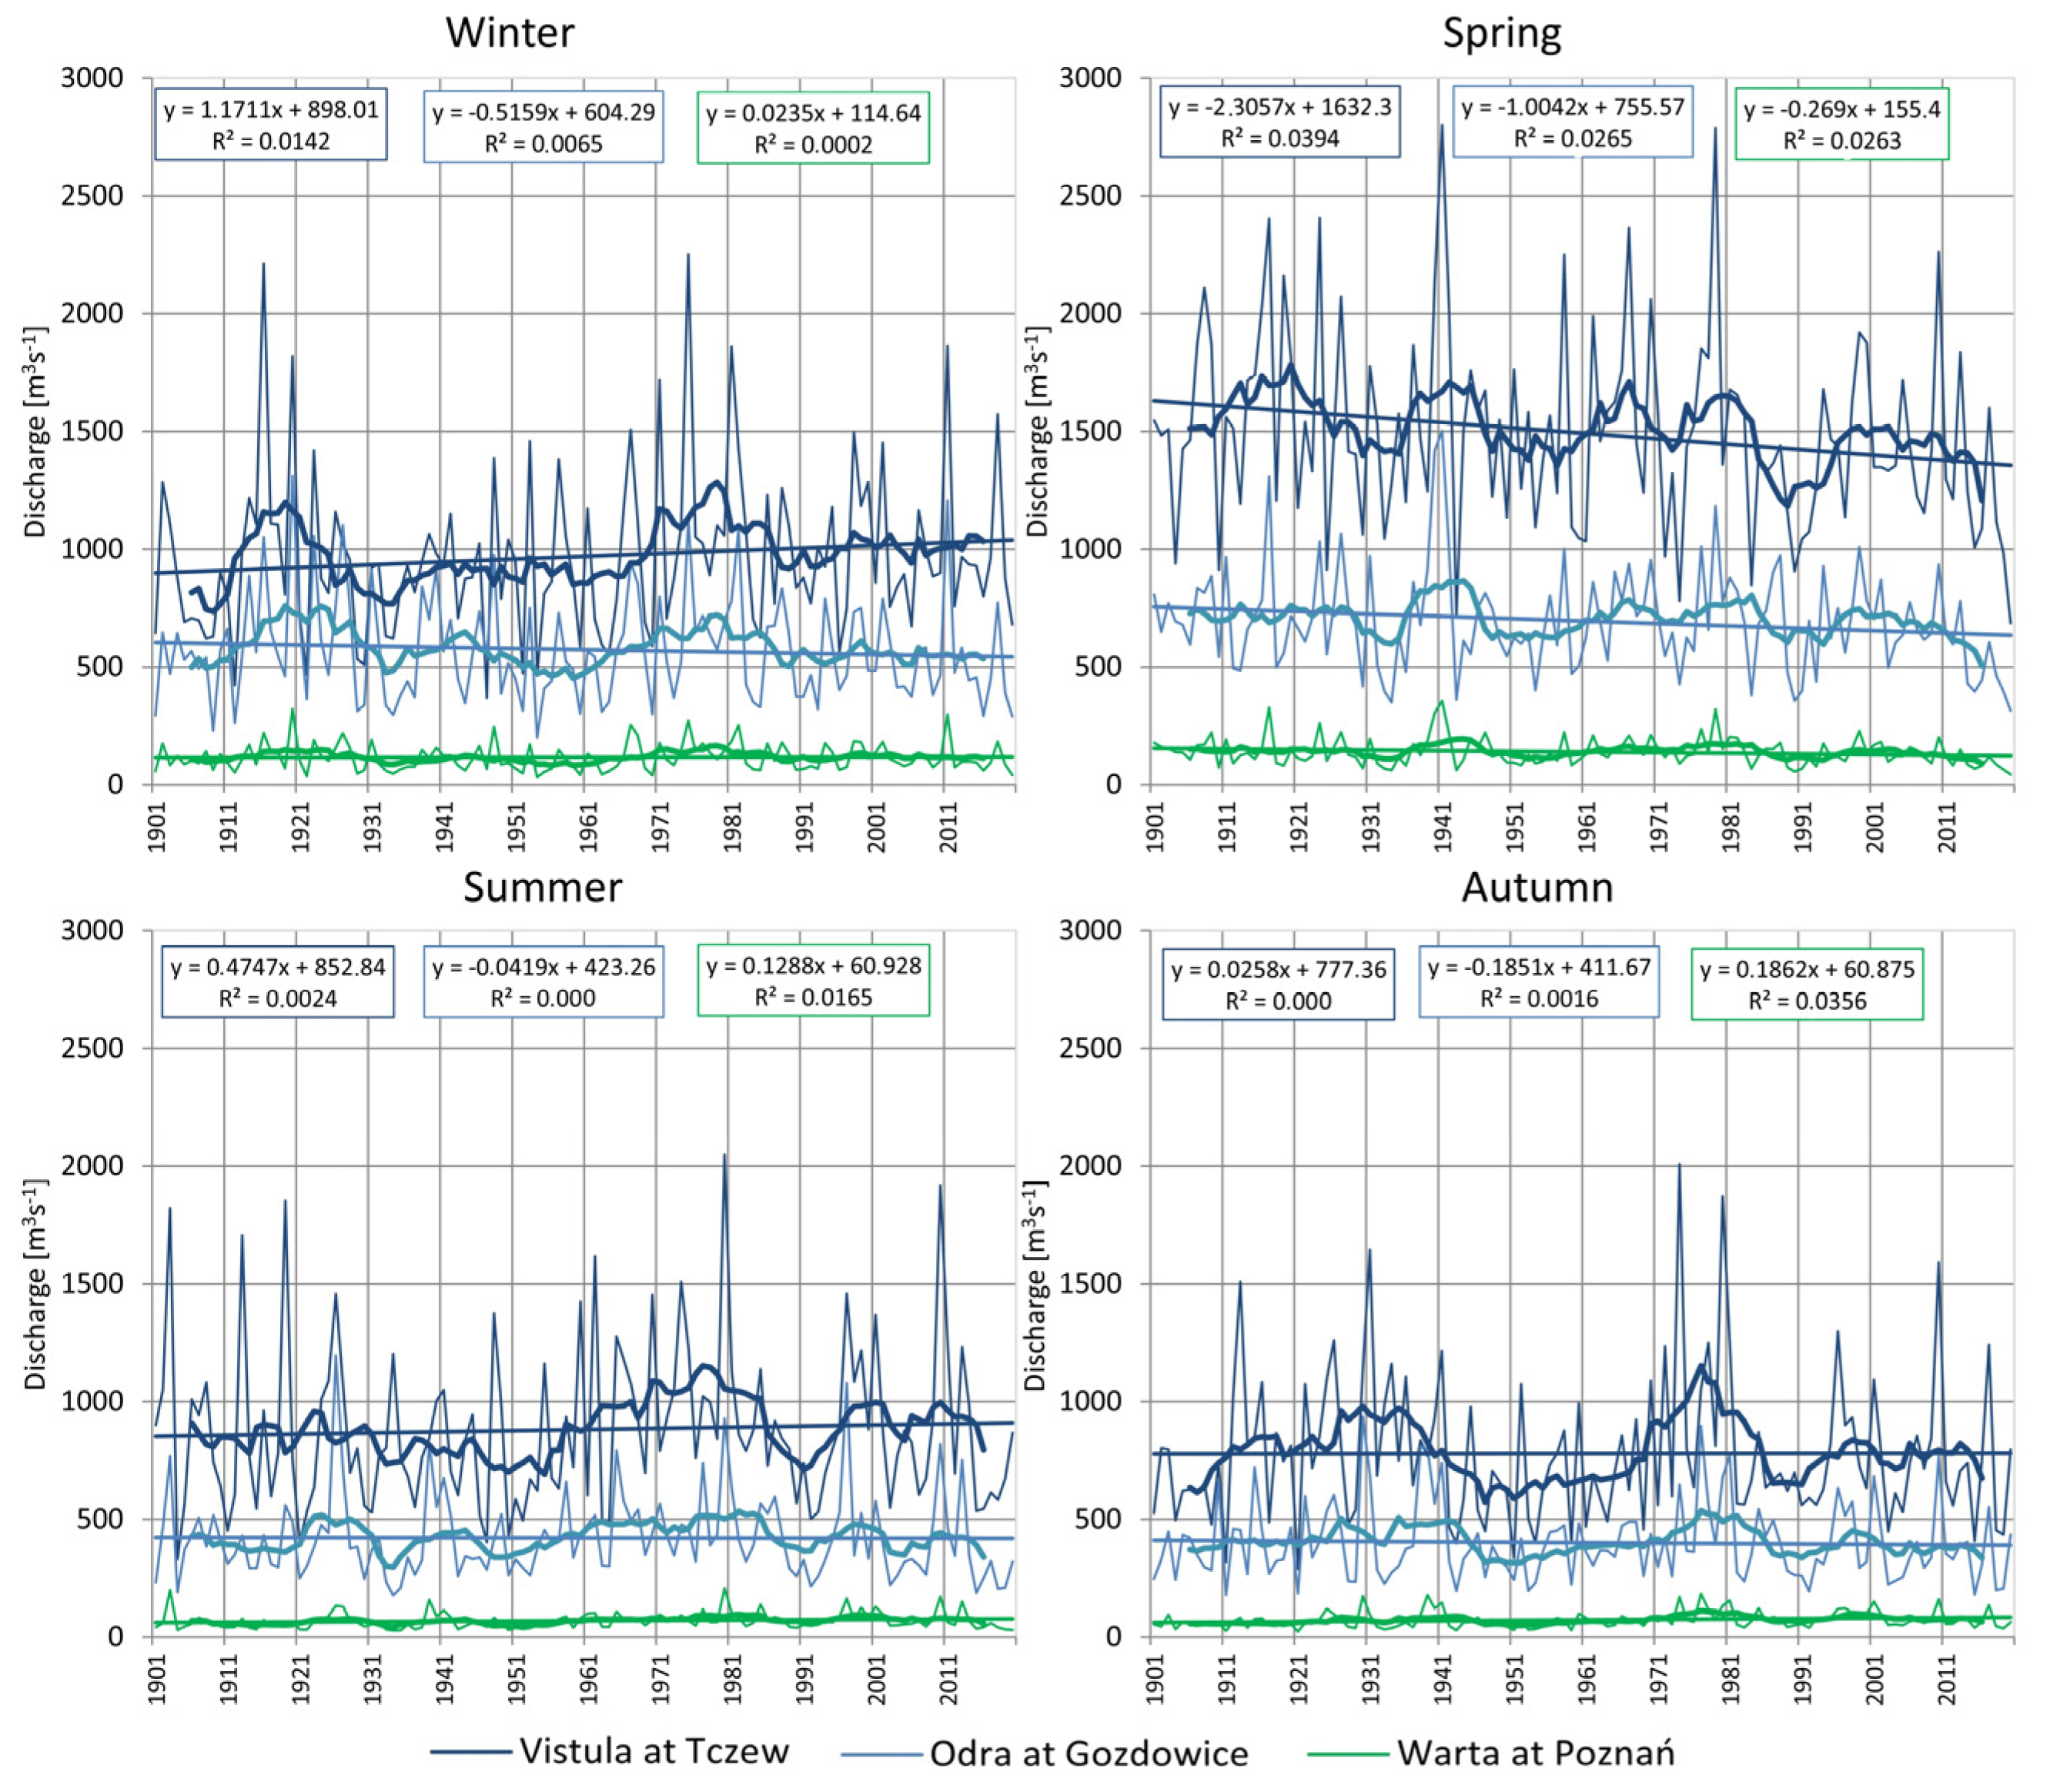
Similarly to annual discharges, seasonal discharges of the analyzed rivers in the multi-annual period of 1901–2020 usually do not show significant changes. Only the spring discharges show stronger downward trends, which are statistically significant in the case of the Vistula River (p < 0.05) (Figure 3).
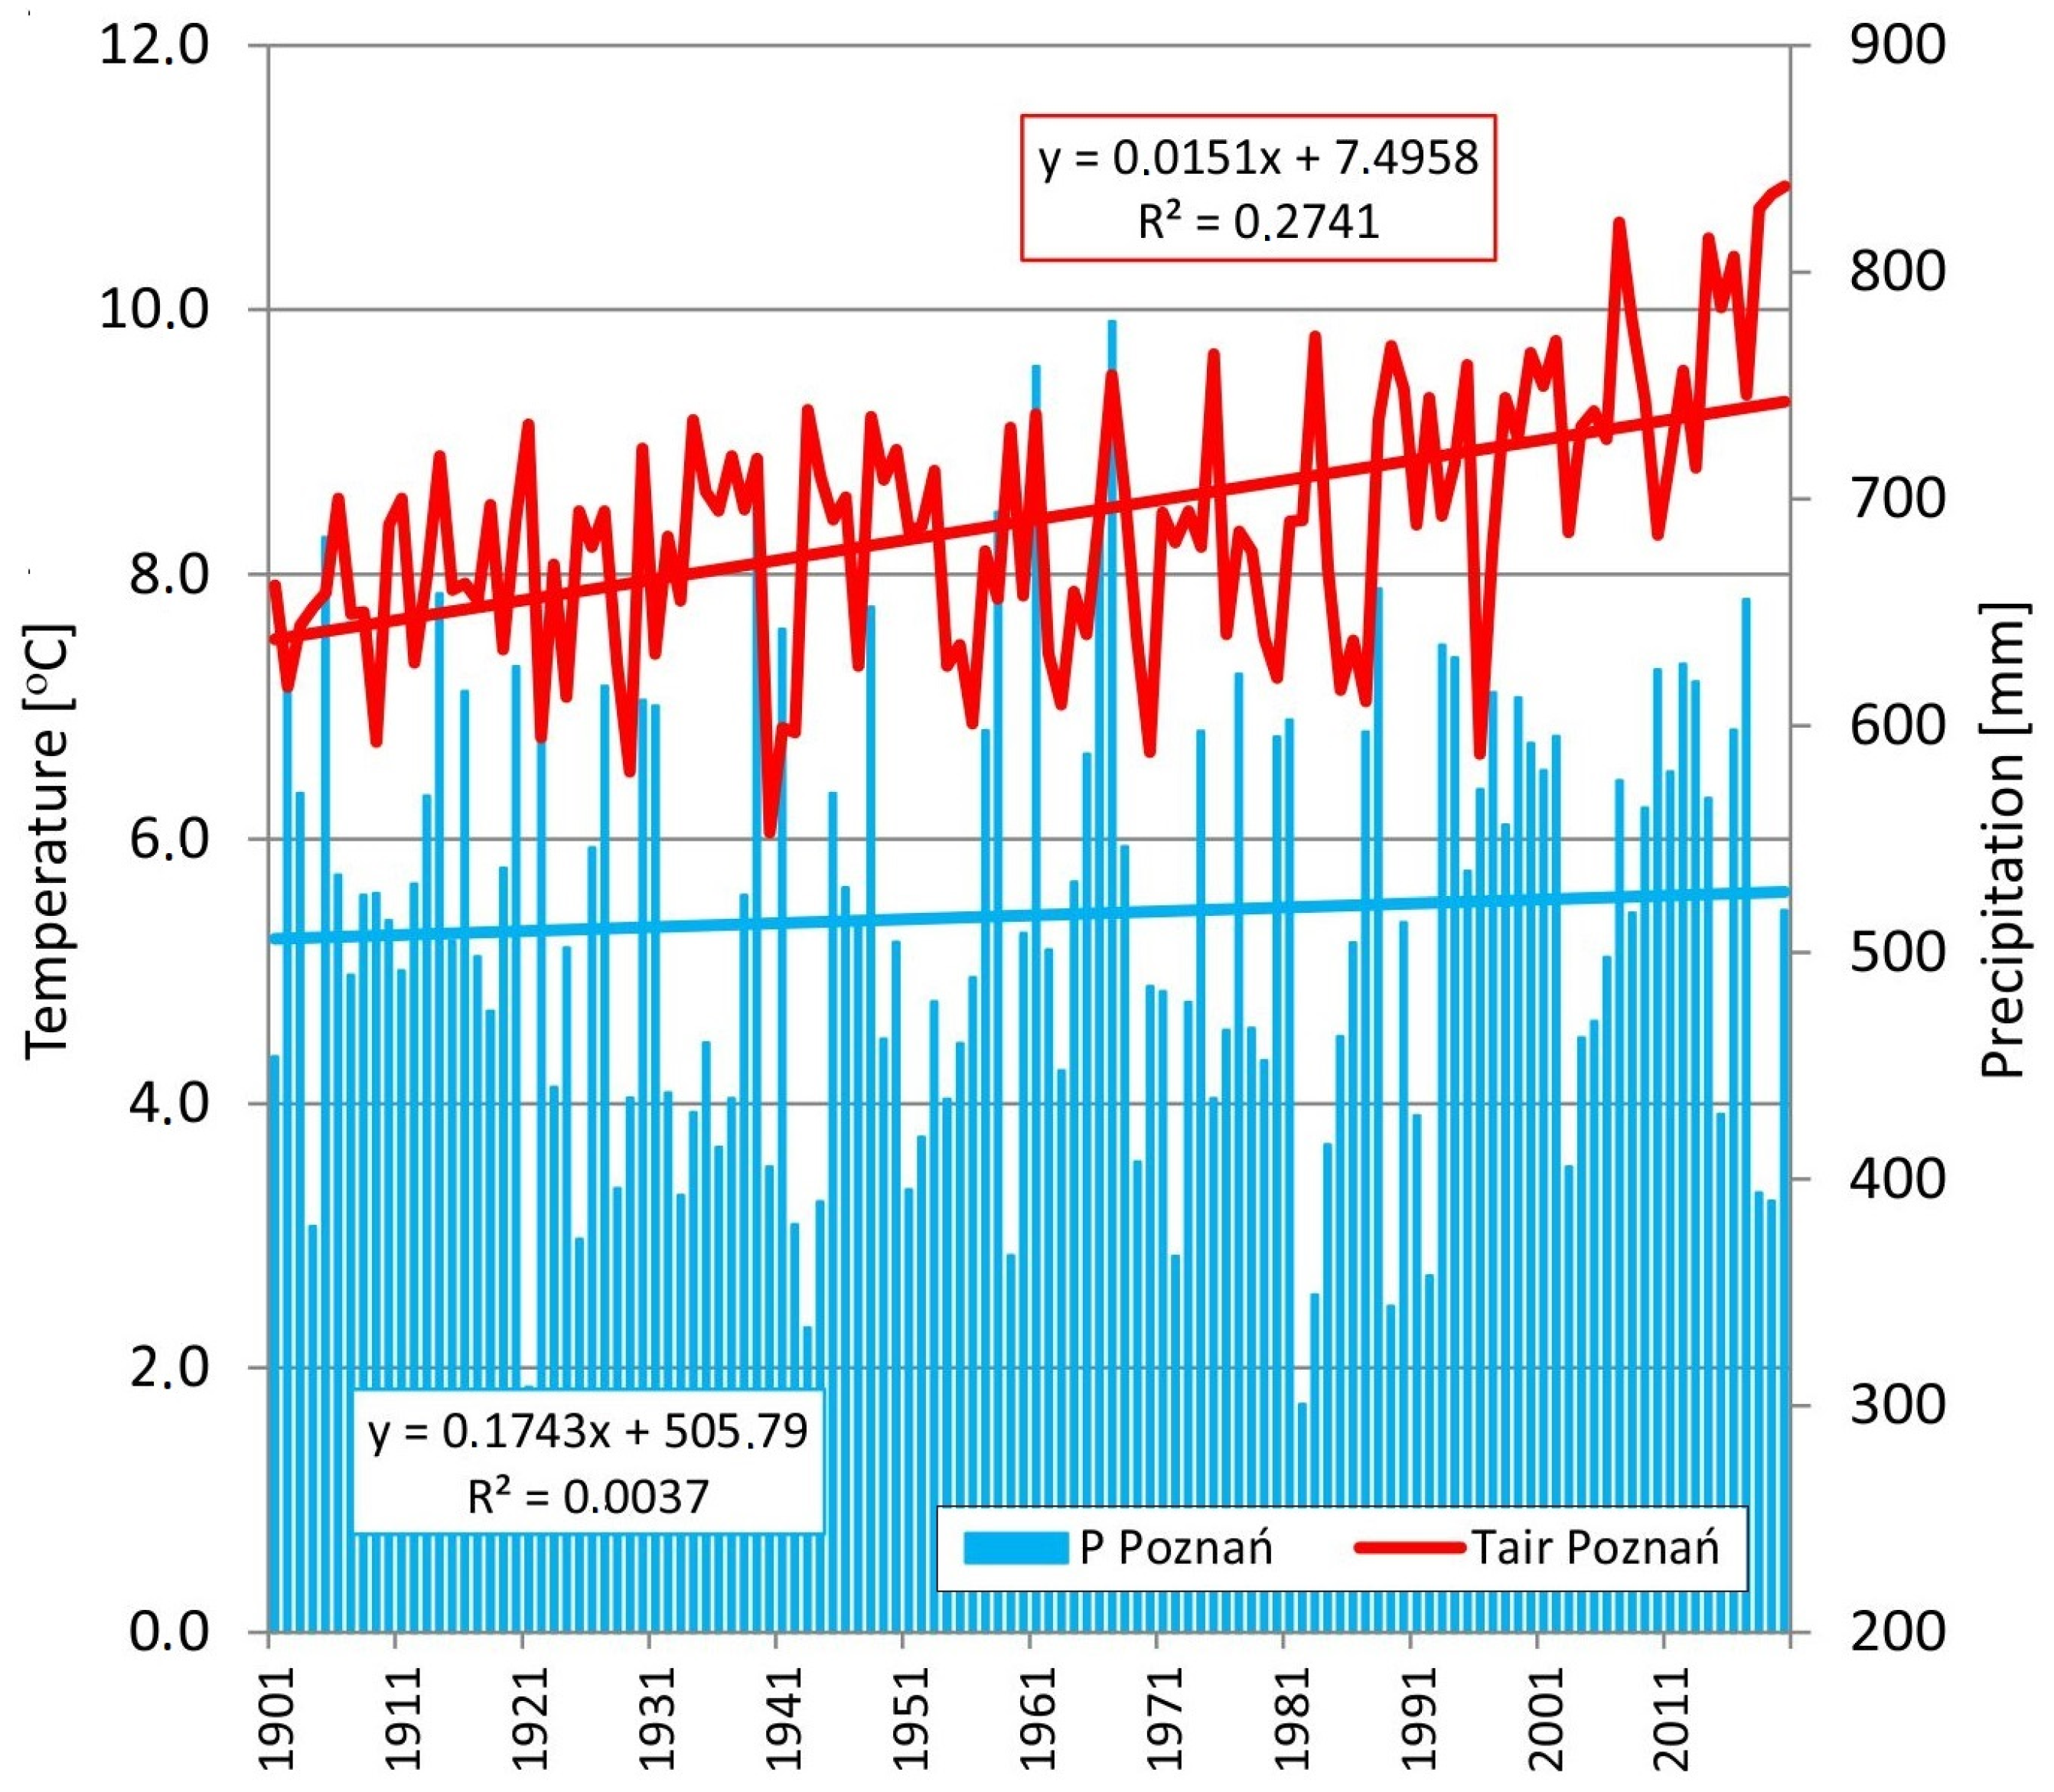
The long-term variability of both the discharges of the studied rivers and precipitation (Figure 4) do not show statistically significant changes. However, in the case of air temperature in the analyzed period, a statistically significant growing trend (R2 = 0.274; p < 0.001) is detected, with the strongest increase after 1988.
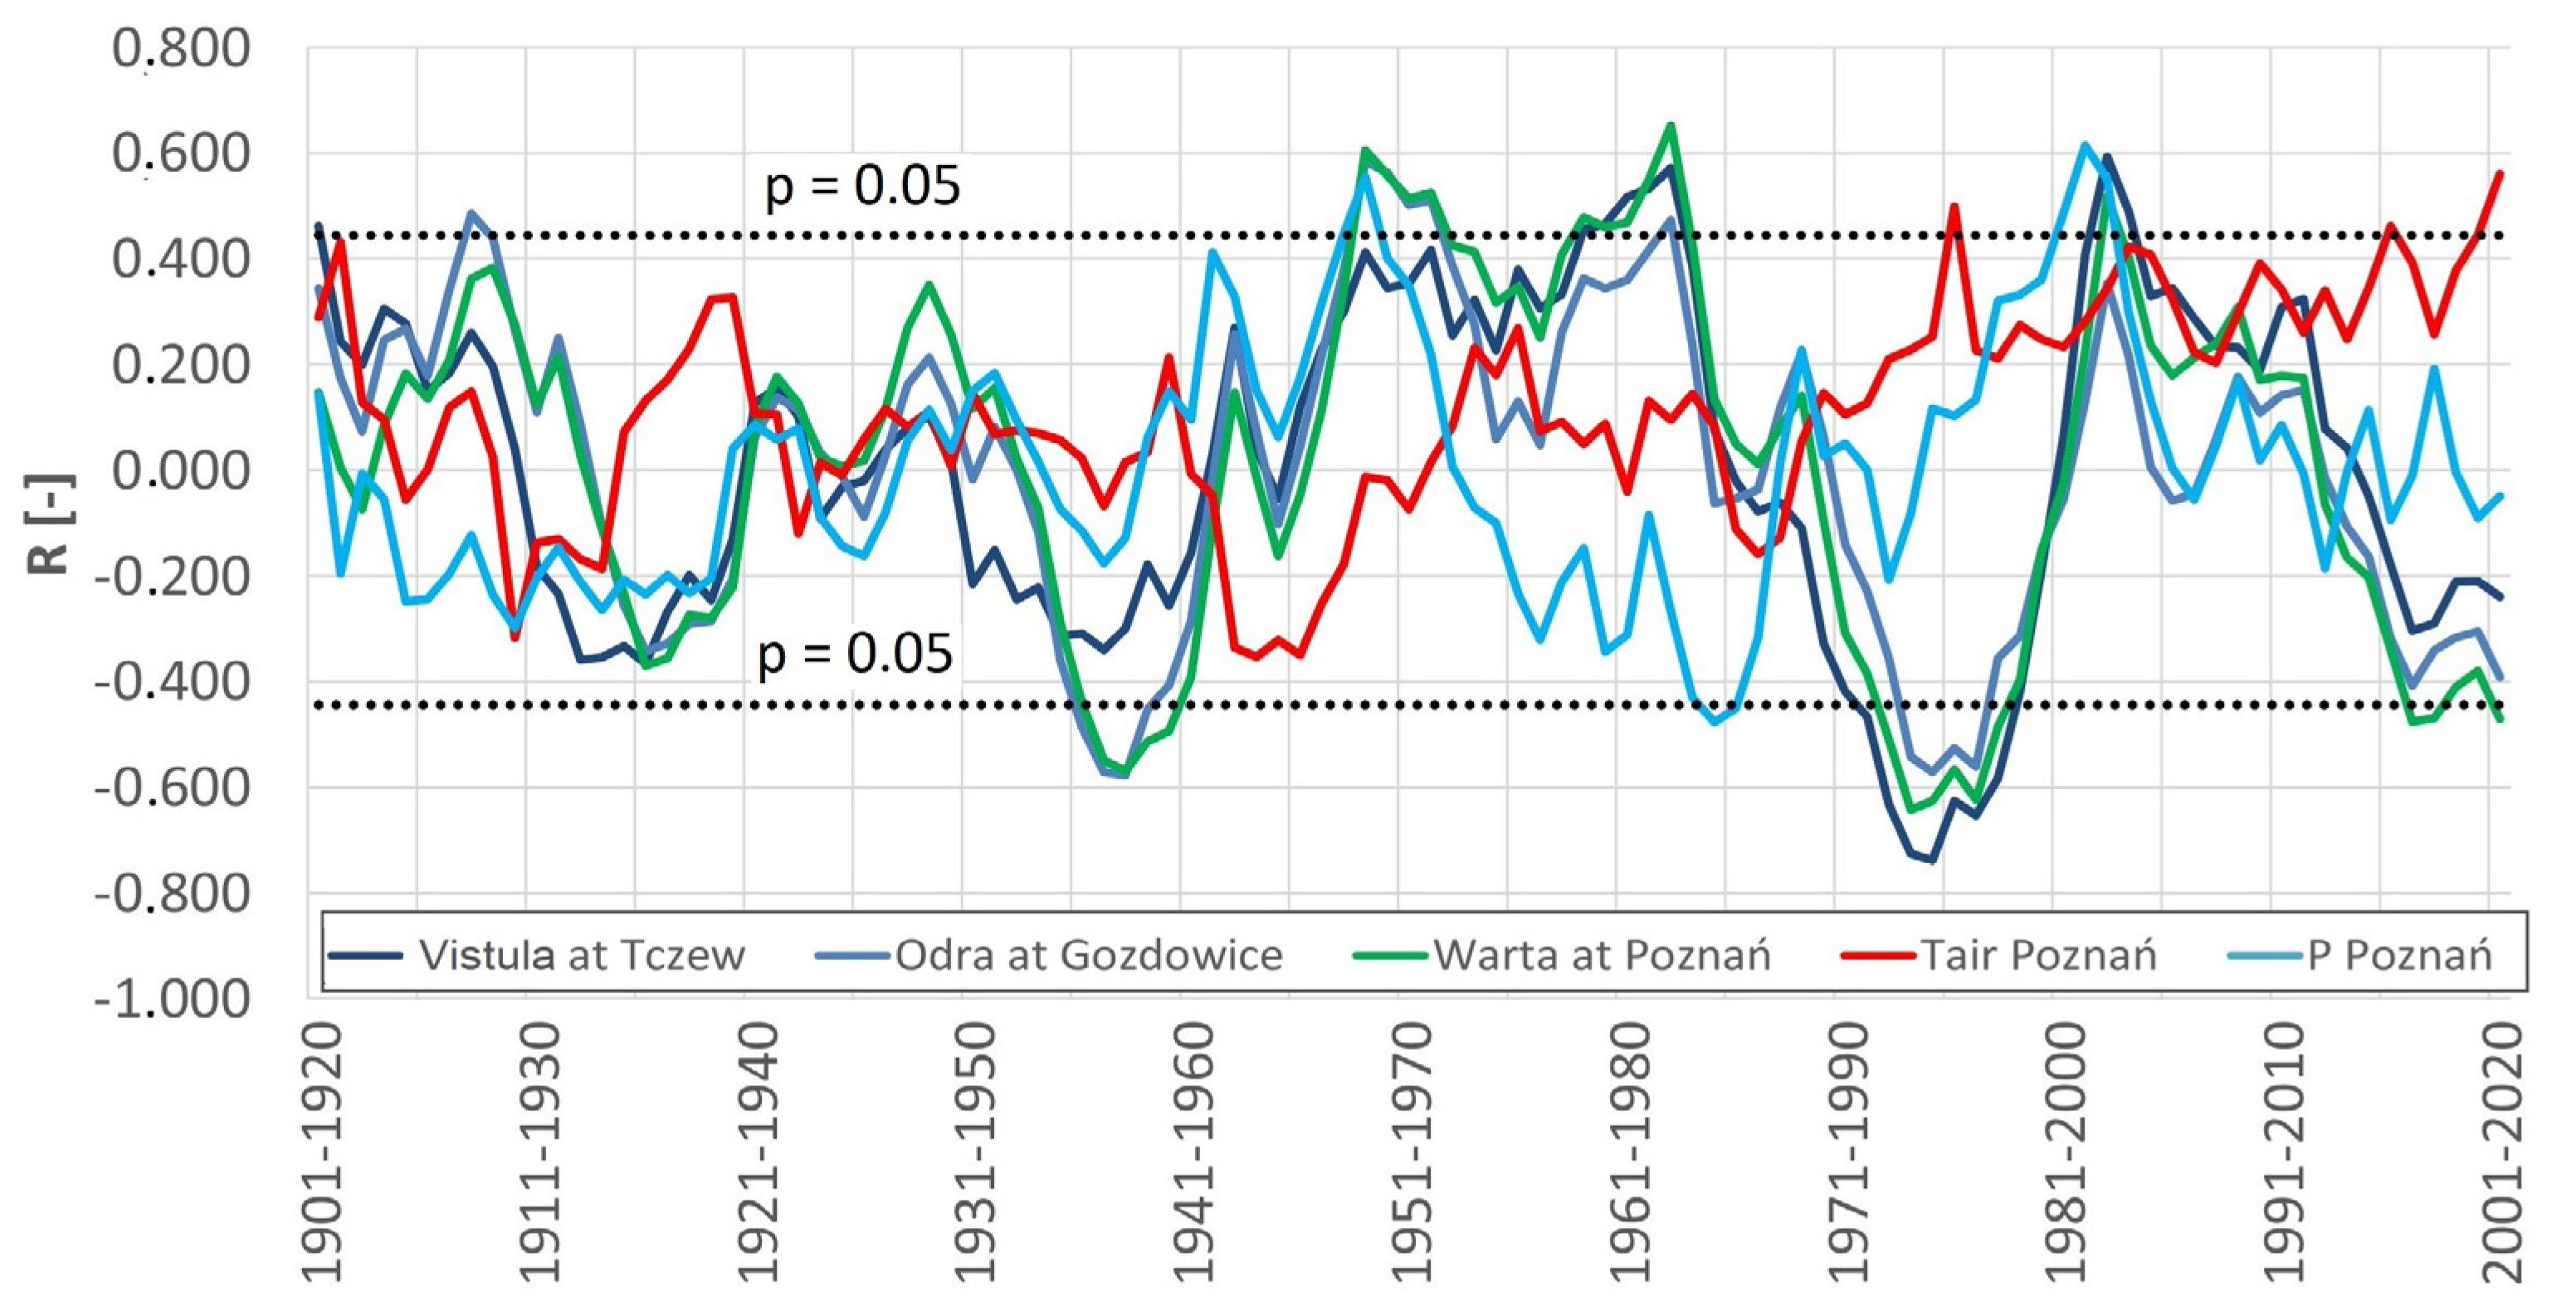
Interestingly, a more detailed analysis of the long-term variability of discharges in 20 year sub-periods indicates statistically significant trends decreasing in 1938–1957 and 1975–1994, and increasing in 1963–1982 and 1983–2002 (Figure 5).
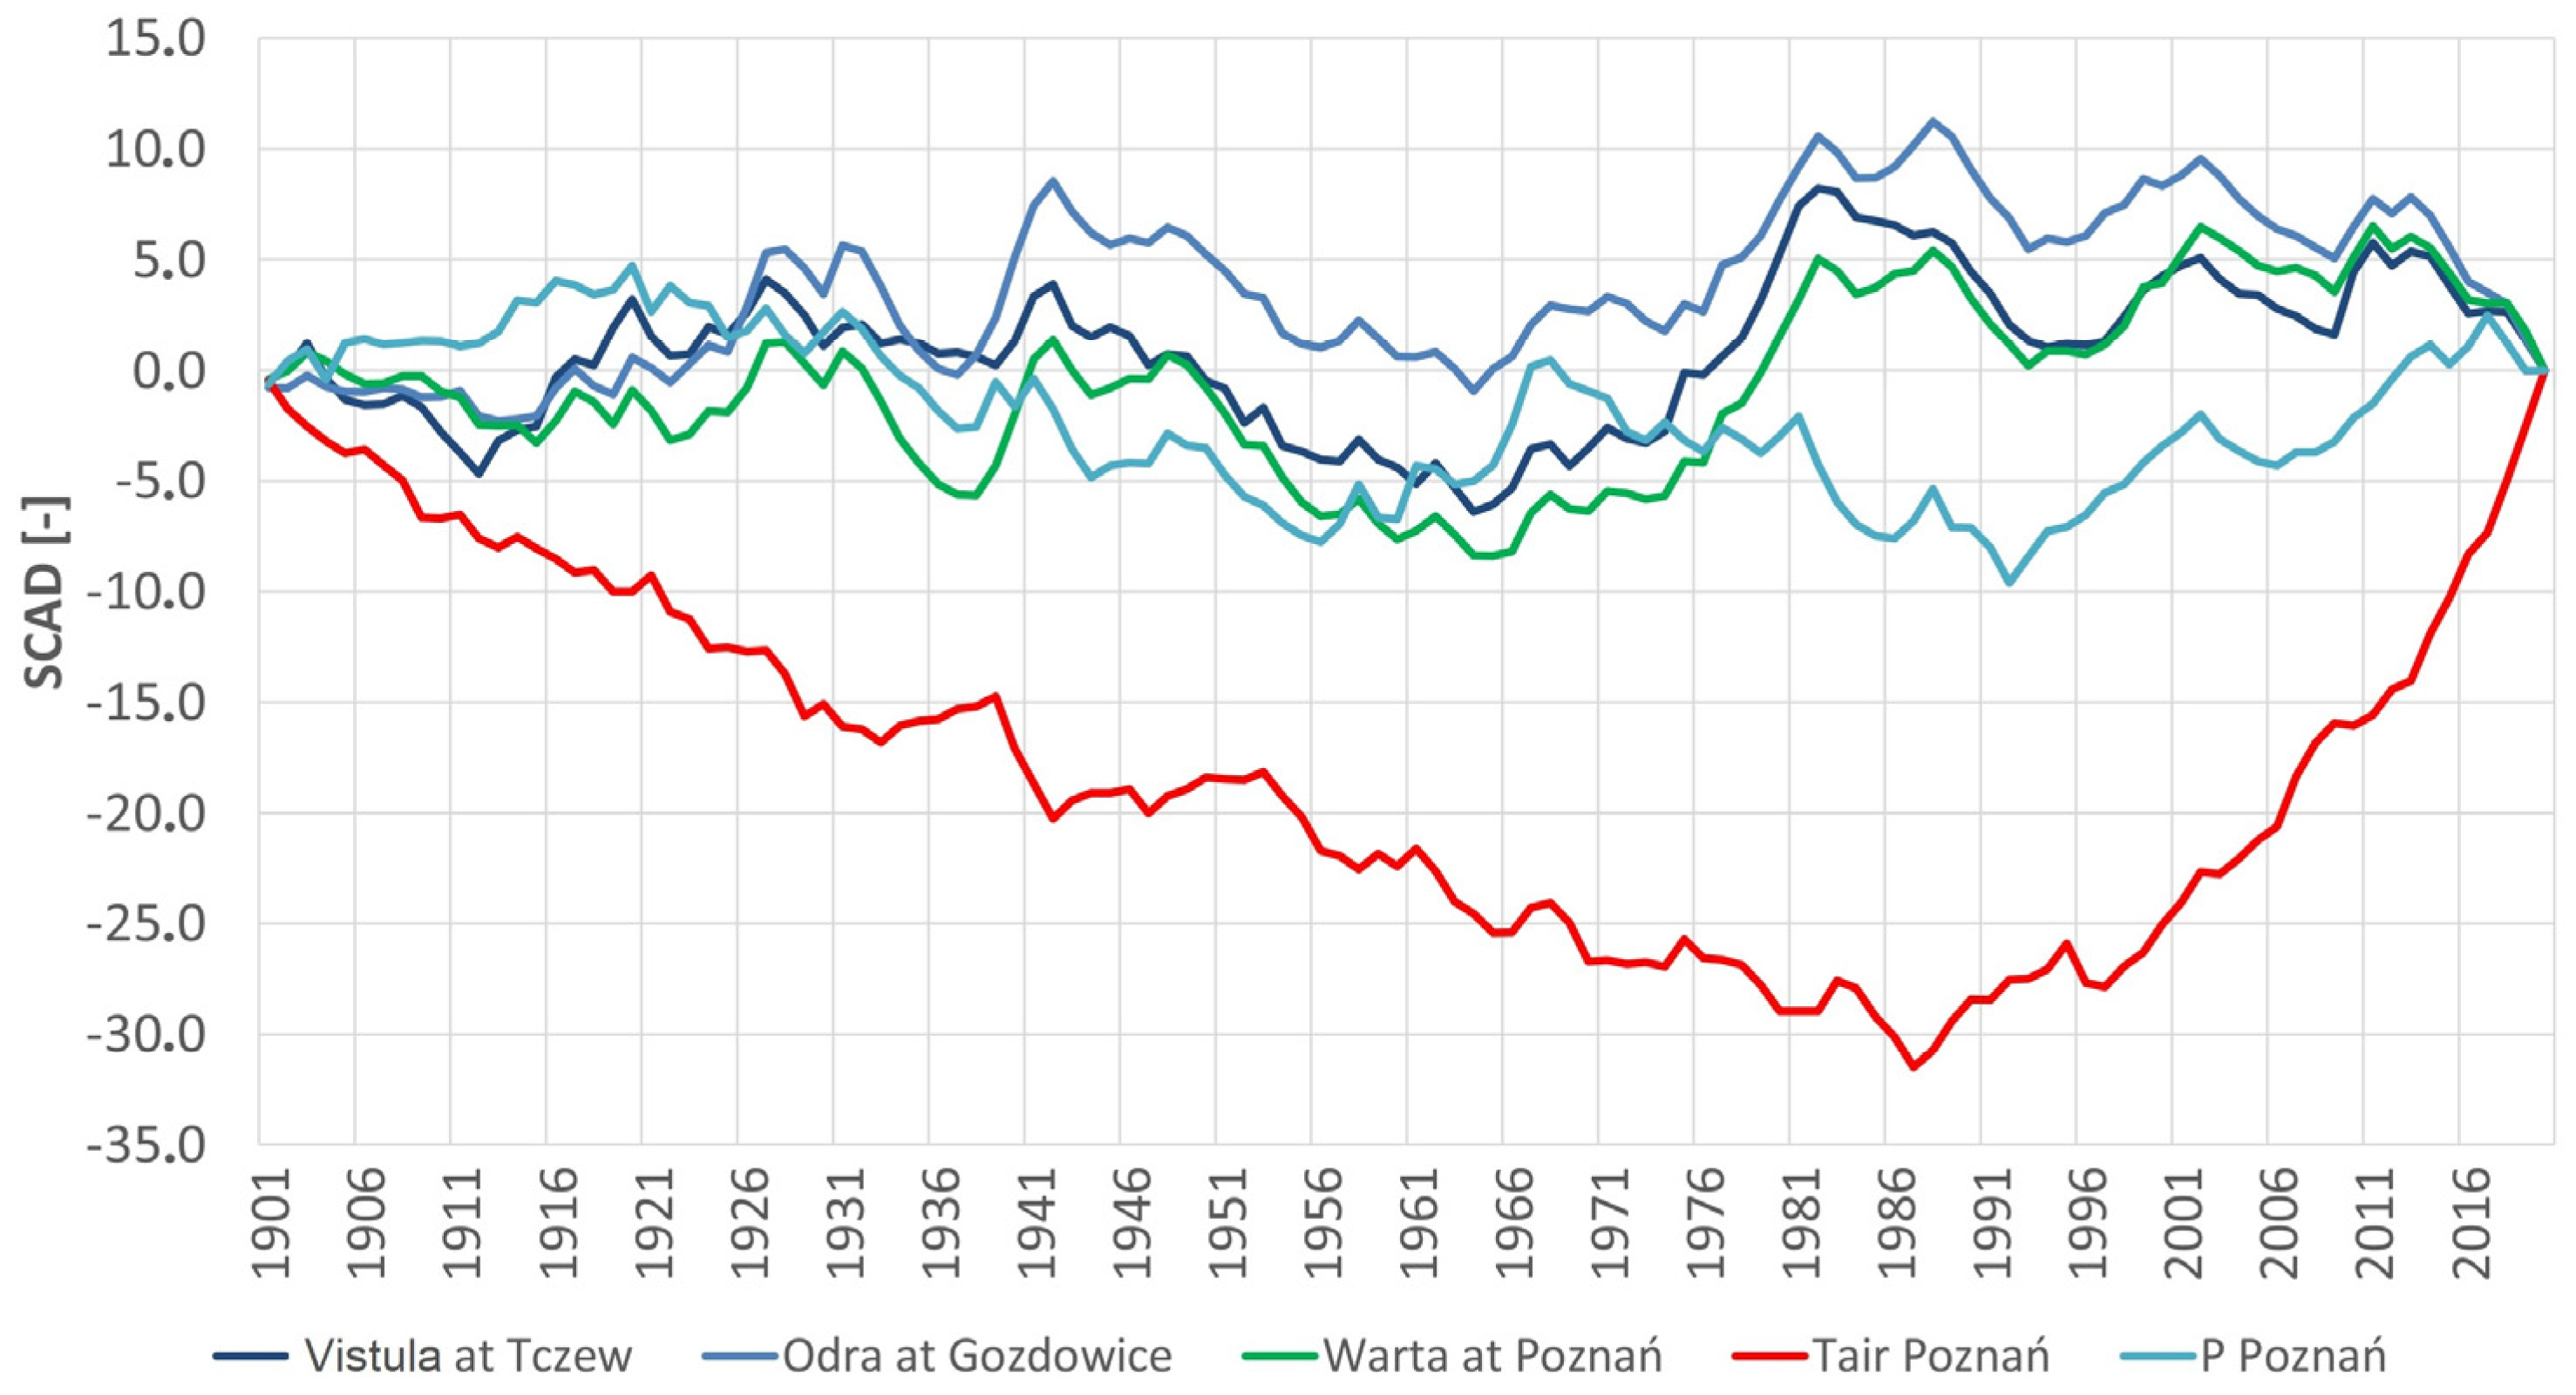
In the multi-annual period of 1901–2020, based on the calculated deviations of annual river discharges from the average value, four sub-periods with higher and lower values can be identified. The wet sub-period detected in 1901–1942 was usually accompanied by higher discharges. It was followed by an extremely dry sub-period in 1943–1964, a very wet sub-period in 1965–1982 (1988), and the last sub-period in 1983 (1989)–2020 with predominant negative deviations (Figure 6).
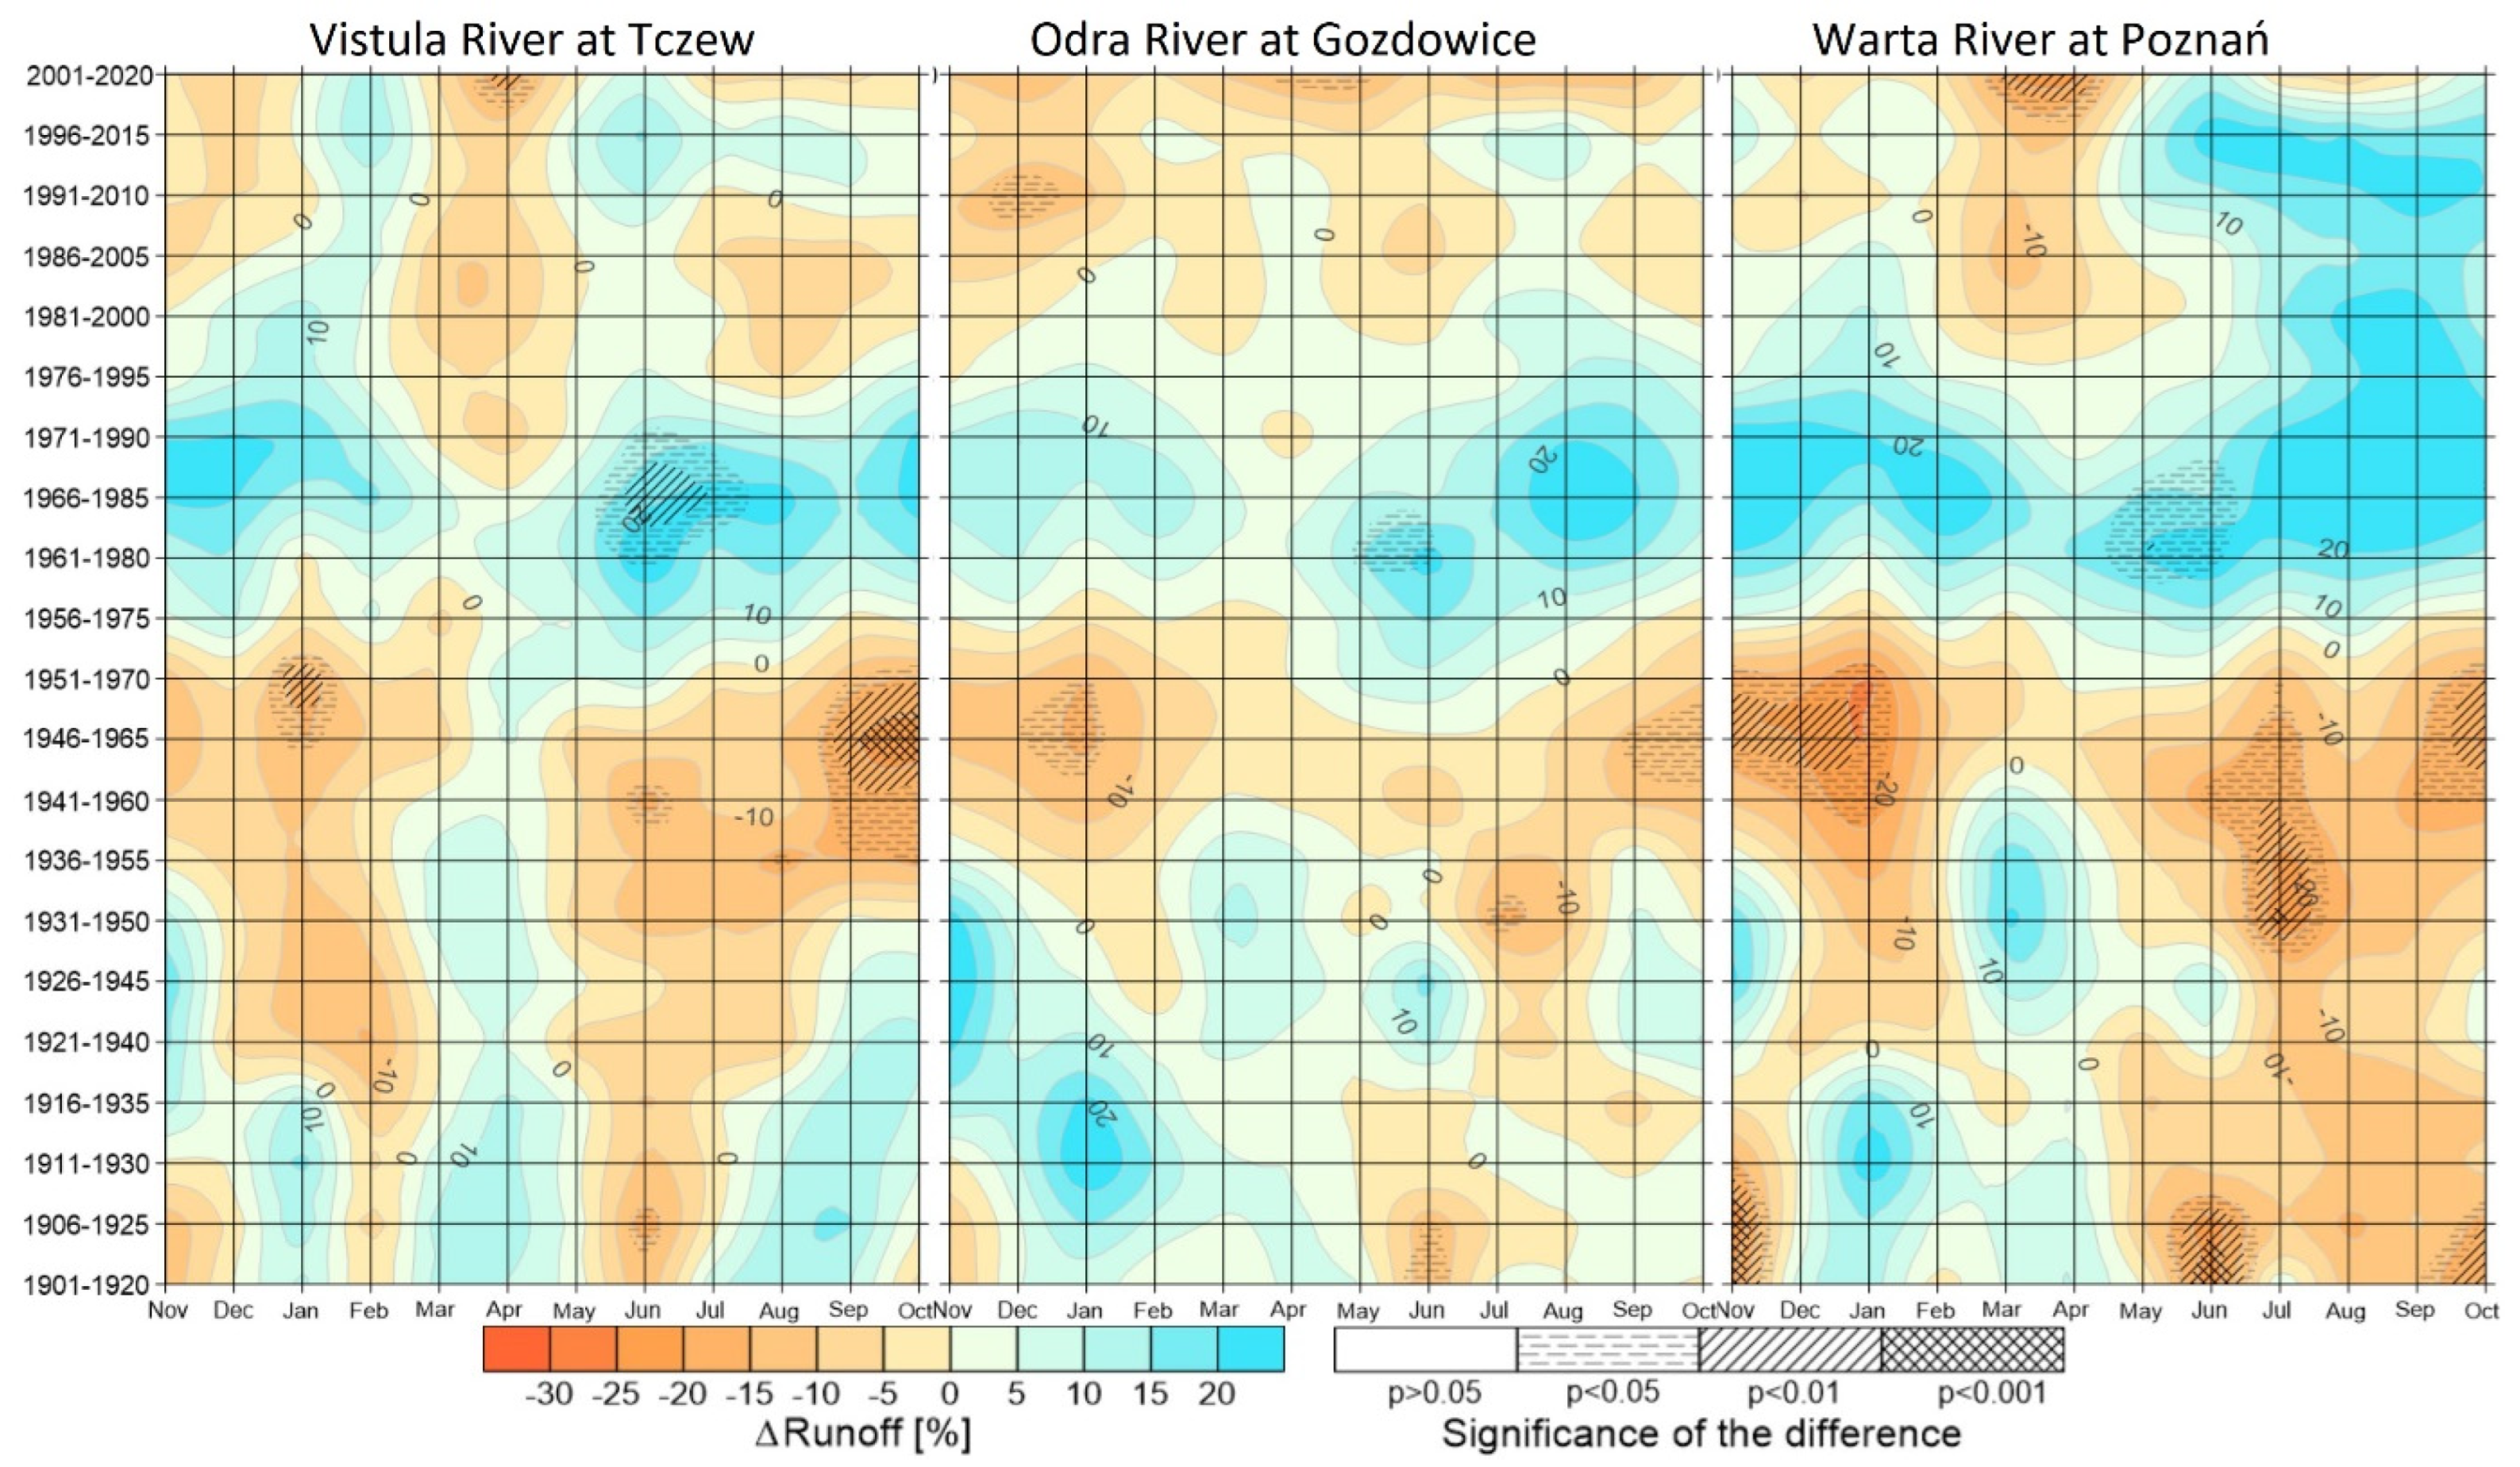
This variability is confirmed by other studies, including [10,56], and the year 1964 is indicated as the date of an abrupt change in the runoff volume from a dry to a very wet period, with an increase in precipitation caused by long-term changes in atmospheric circulation mentioned as one of the reasons of that change. In the dry period of 1943–1964, the discharges were lower, even by 20%, mainly in the winter period (November–February) and in the summer-autumn period (August–October) (Figure 7). The opposite changes were detected during the extremely wet period starting from the mid-1960s. Discharges in a number of months were over 20% higher than the average in the multi-annual period of 1901–2020, with statistically significant deviations observed in May and June.
3.2. Correlation between River Discharges and Sunspots
As we mentioned before, first we investigated the linear/non-linear relationship between the river discharges and the solar activity.
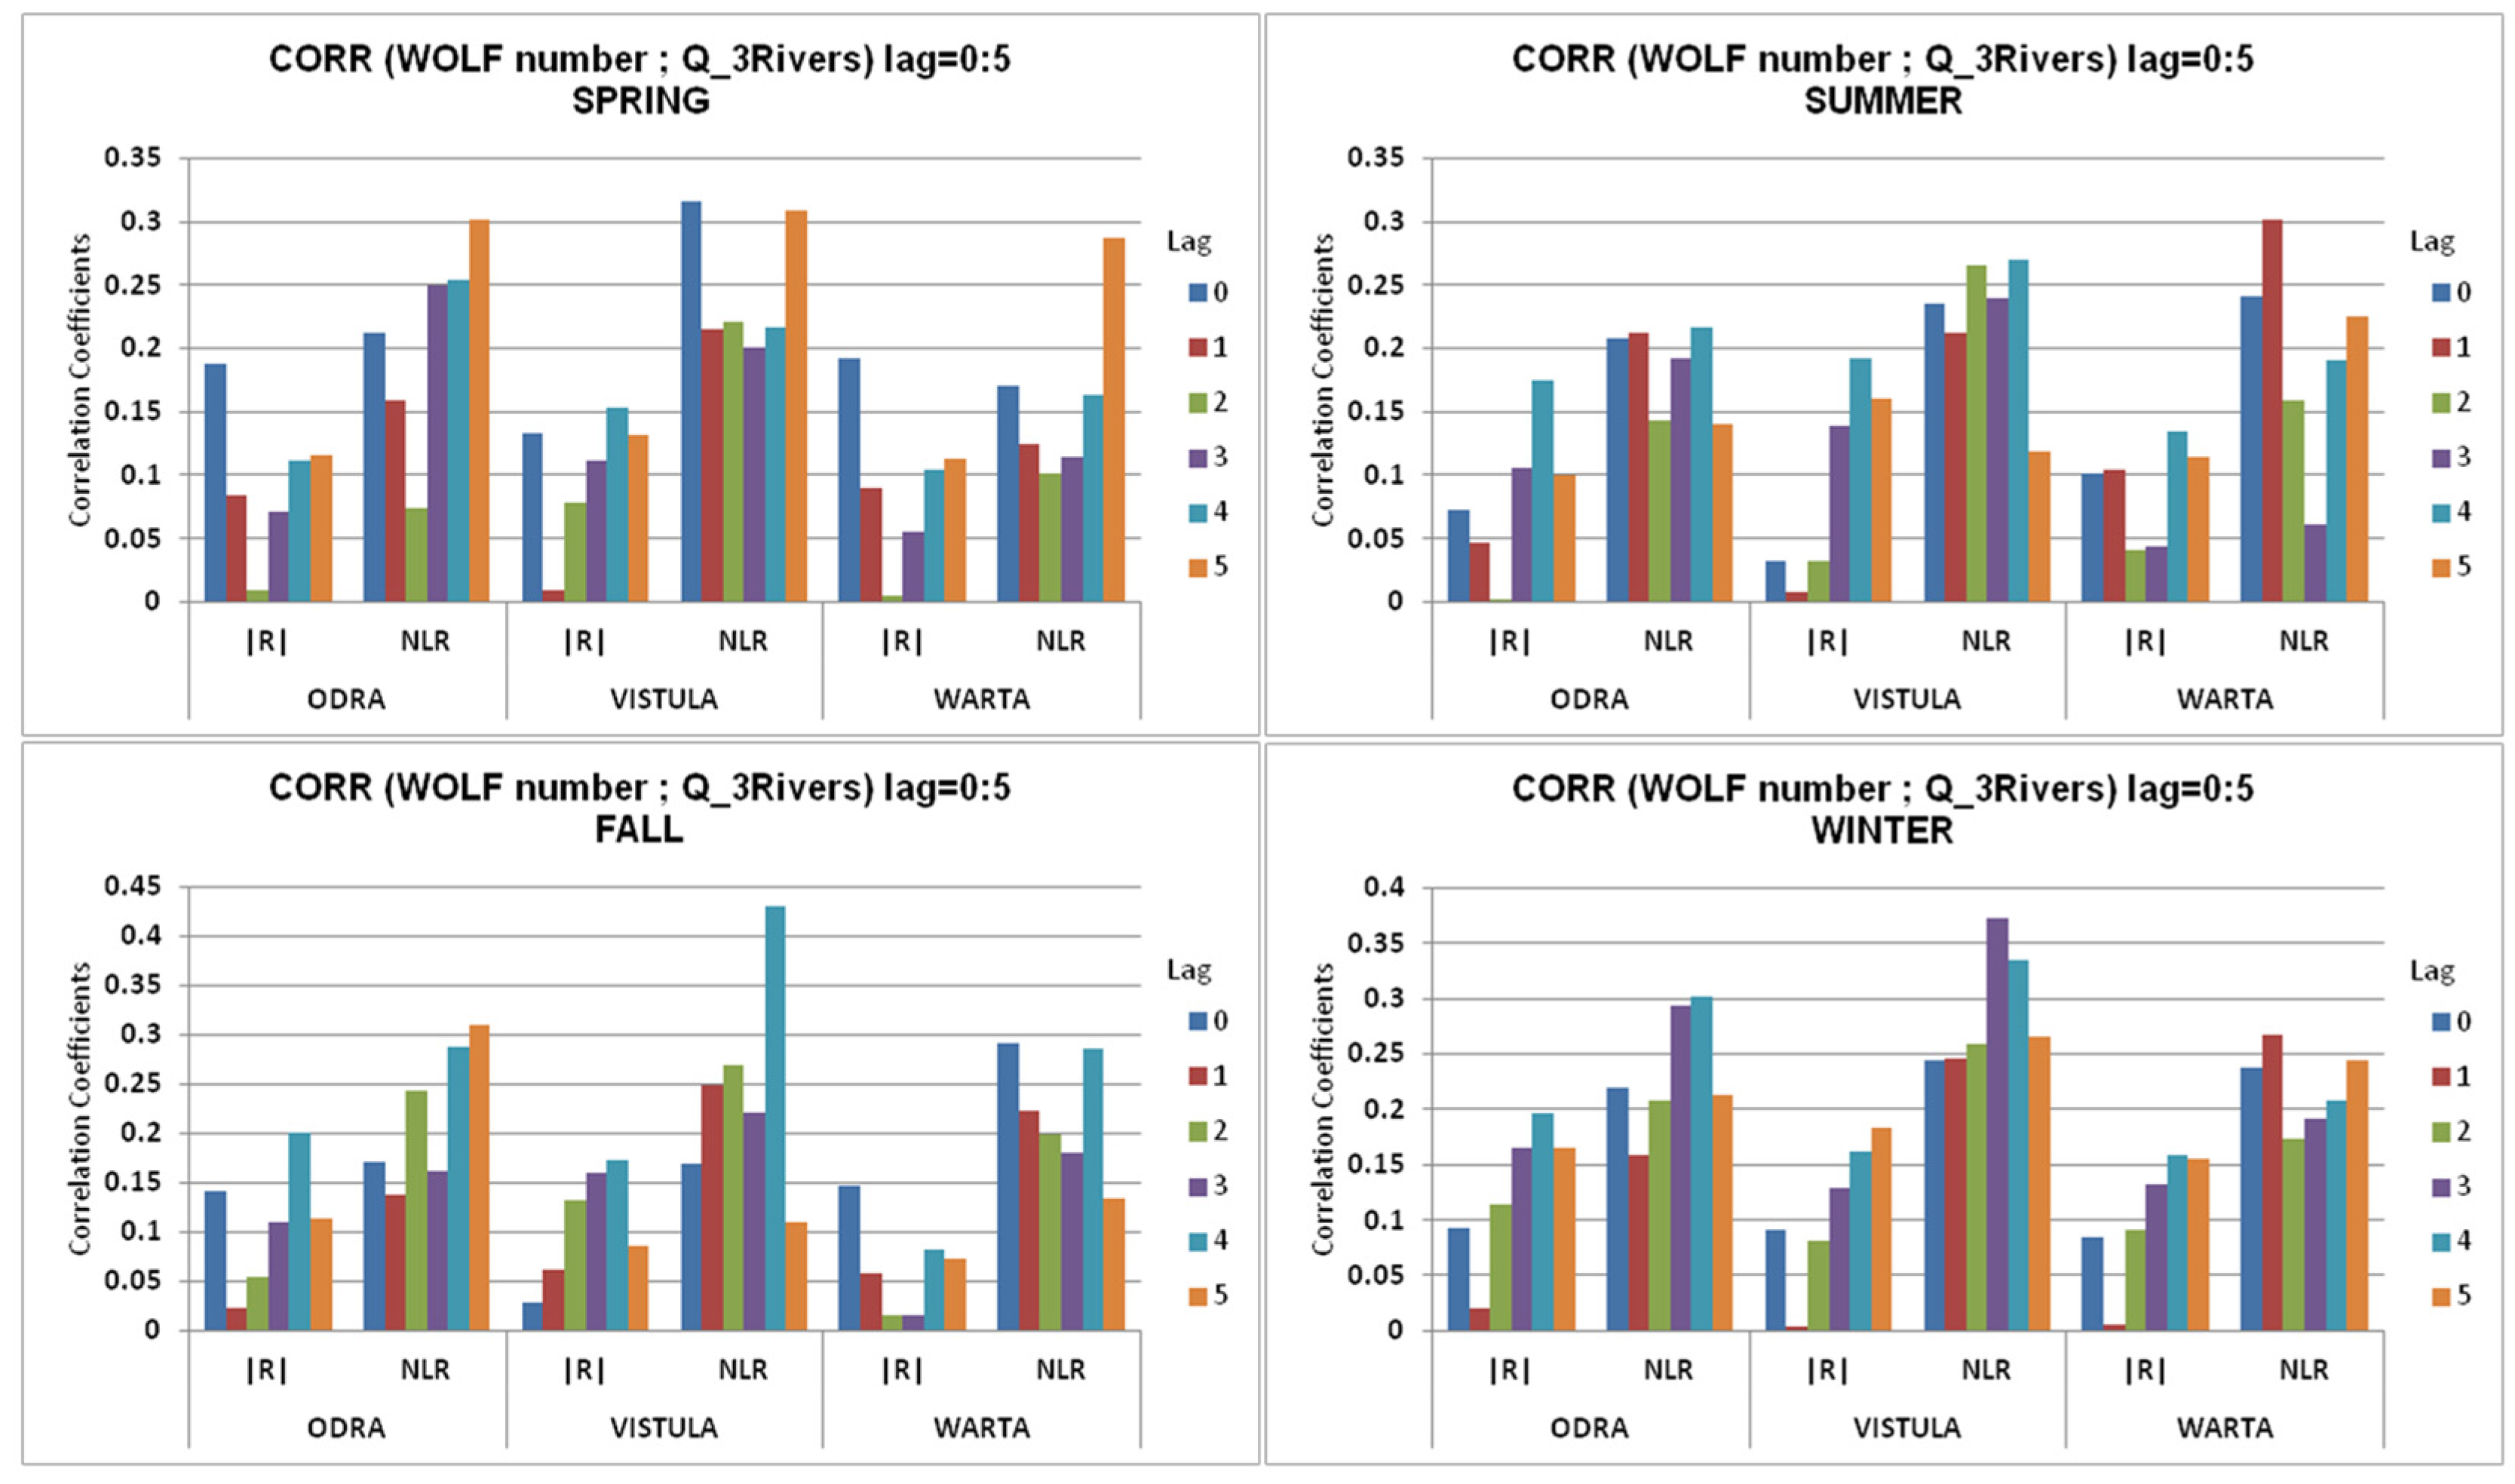
In Figure 8, for comparison the results obtained regarding the testing of linear and non-linear links between the discharge (Q) from the three rivers in Poland and the solar activity expressed by the Wolf sunspots number are presented.
Testing the confidence levels for R and NLR, we found out a 95% confidence level (CL) for |R| equal or exceeding 0.18 and for NLR of about 0.38. Linear relationships can be considered when |R |> NLR. Only cases with a CL of 95% significance will be discussed. As an overall conclusion, analyzing the results shown in Figure 8, it appears that the relationships are non-linear with small exceptions.
Three cases are emphasized for lag = 0: one with linear links (SSN-Warta during spring) and two with non-linear links (SSN-Vistula during spring and SSN-Warta in fall season). These cases were chosen as follows: in the first case, the linear correlation coefficient is higher than the non-linear one, and at the same time it also has a confidence level (CL) of 95%. In the other two cases (presented in Supplementary Material), the non-linear coefficient (NLR) is obviously higher than the linear one and has a significance which is between 90 and 95%. Also for these two cases, in order to see the evolution in the time–frequency domain, coherences obtained by wavelet transform and plots of the averages for some frequency bands, obtained after applying WTC between SSN and the discharge from the three rivers, are presented in Supplementary Material (Figures S1 and S2).
For lag ≠ 0 no cases with linear links were found.
The results in Figure 8 are obtained using mutual information between the two time series using three states of each of the series for the entire considered interval 1901–2020. The application of the wavelet transform method helps us to obtain details in the time–frequency domain of the connection between two analyzed time series.
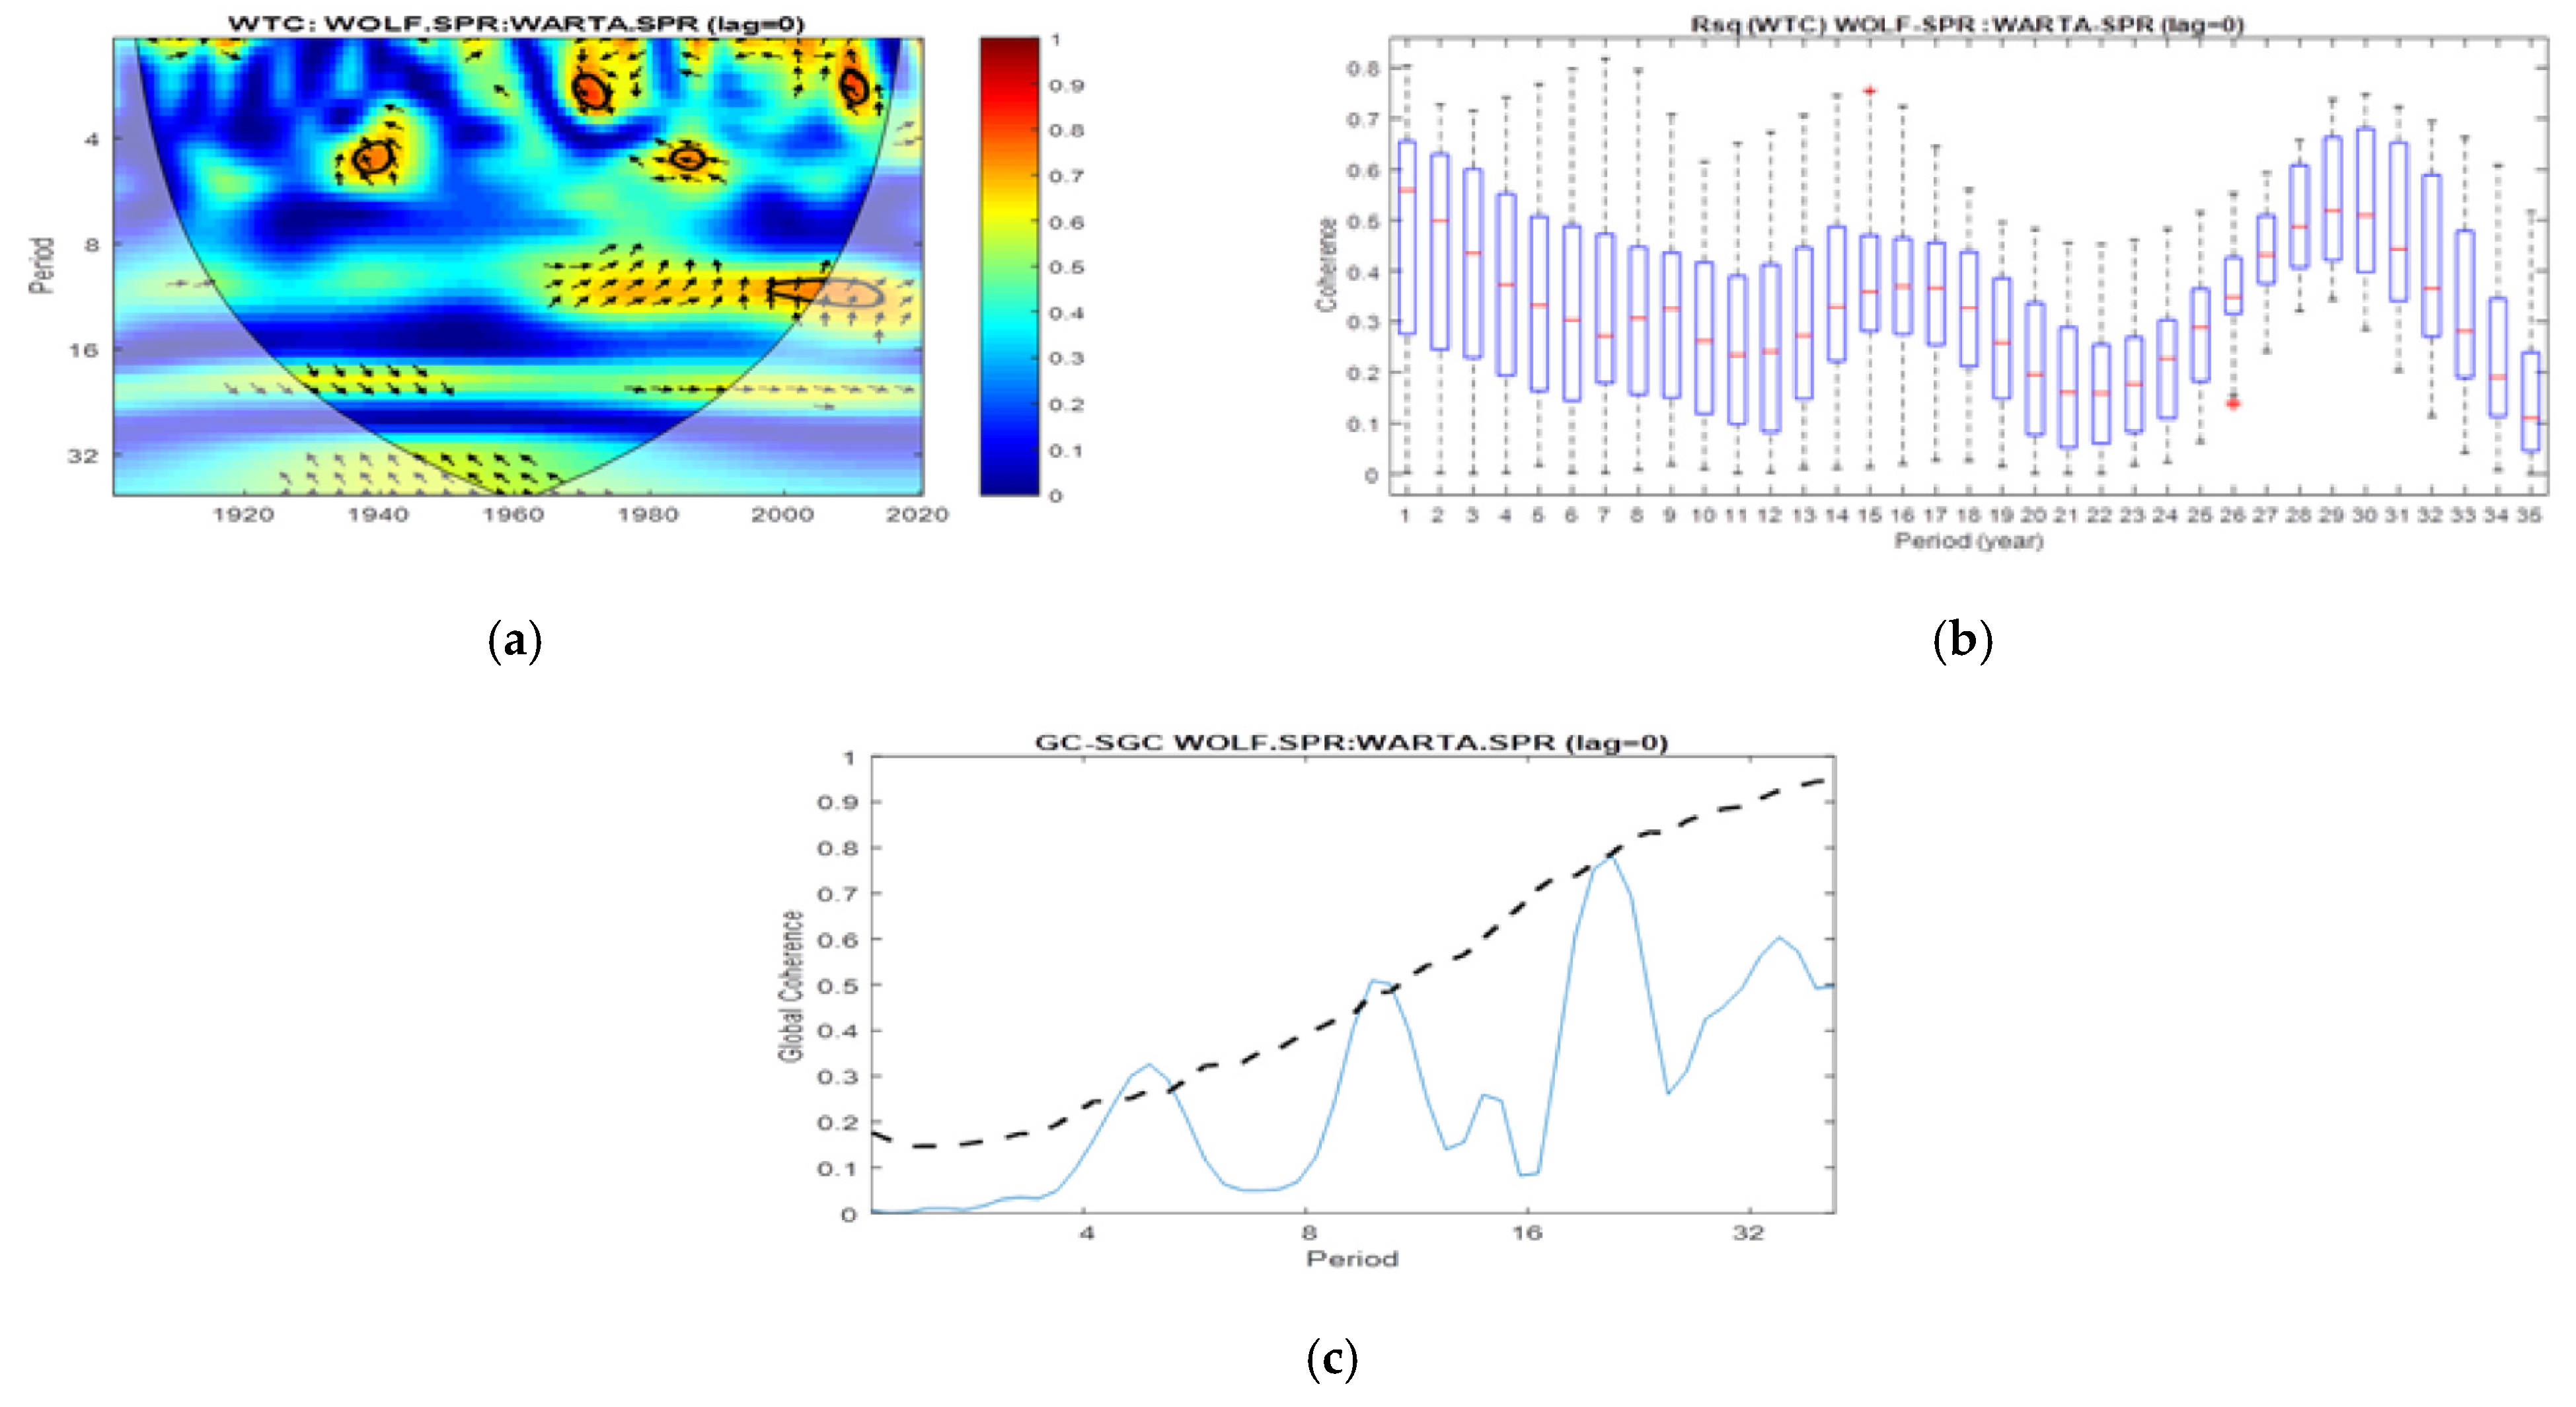
Figure 9 represents, according to Figure 8, linear links between SSN and Q-Warta during the spring, with |R| which has a CL of 95%. But, as we mentioned above, testing the links obtained in Figure 8 give us indications on the time series considered as a whole. Figure 9 shows the periods and time intervals for which the two time series have a significant statistical coherence.
Regarding the connection with the solar activity, it can be seen from Figure 9c, that for the 11 year solar cycle, the coherence is significant with a CL of 95% and for the double solar cycle, the significance of the coherence approaches 95%. Details regarding the time intervals and respective periods can be seen from Figure 9a,b.
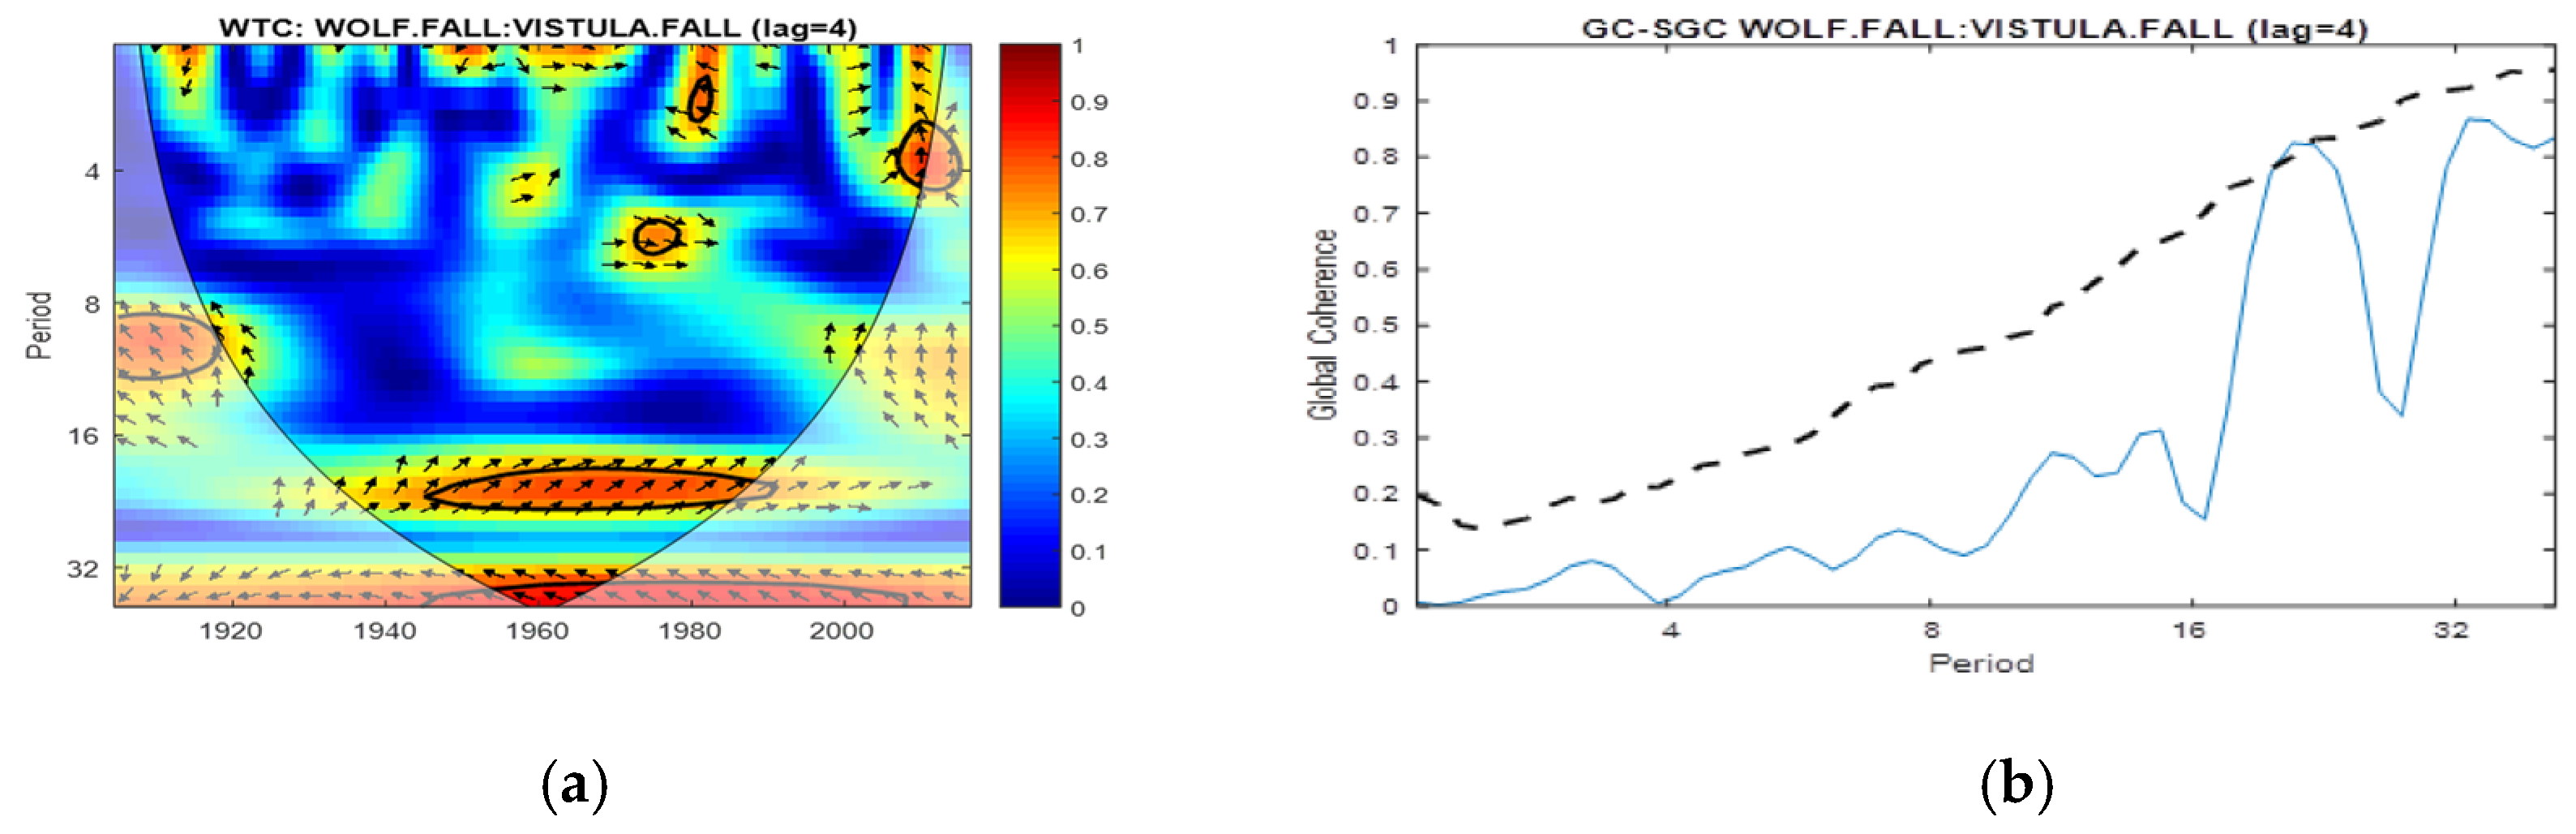
For the analysis with a lag from 1 to 5 years, the highest confidence level, corresponding to NLR (Figure 8) was found in the autumn season when NLR = 0.43, i.e., with CL close to 99%, for the correlation between SSN and Q at Vistula with a lag of four years. The results are presented in Figure 10.
Figure 10b shows a significant coherence between SSN and Q-Vistula with a lag of 4 years (with CL slightly higher than 95%), which corresponds to the Hale solar cycle (a doubling of the Schwabe cycle). This significant coherence is particularly evident between the years 1950–1990, in the cone of influence, this significance of over 95% is surrounded by a solid line (Figure 10a). Also for this time interval the two time series are nearly in phase as indicated by the arrows. From Figure 10, it is also evident that they are coherent with a CL of approximately 90% for periods of 32–33 years (the two series are in anti-phase).
Figure 9 and Figure 10 represented the cases in which R and NLR were significant, according to Figure 8, which were found in transition seasons, spring and autumn, respectively.
In the following part we will present two cases that reflect certain signals related to solar variability in case of the summer and winter seasons, respectively.
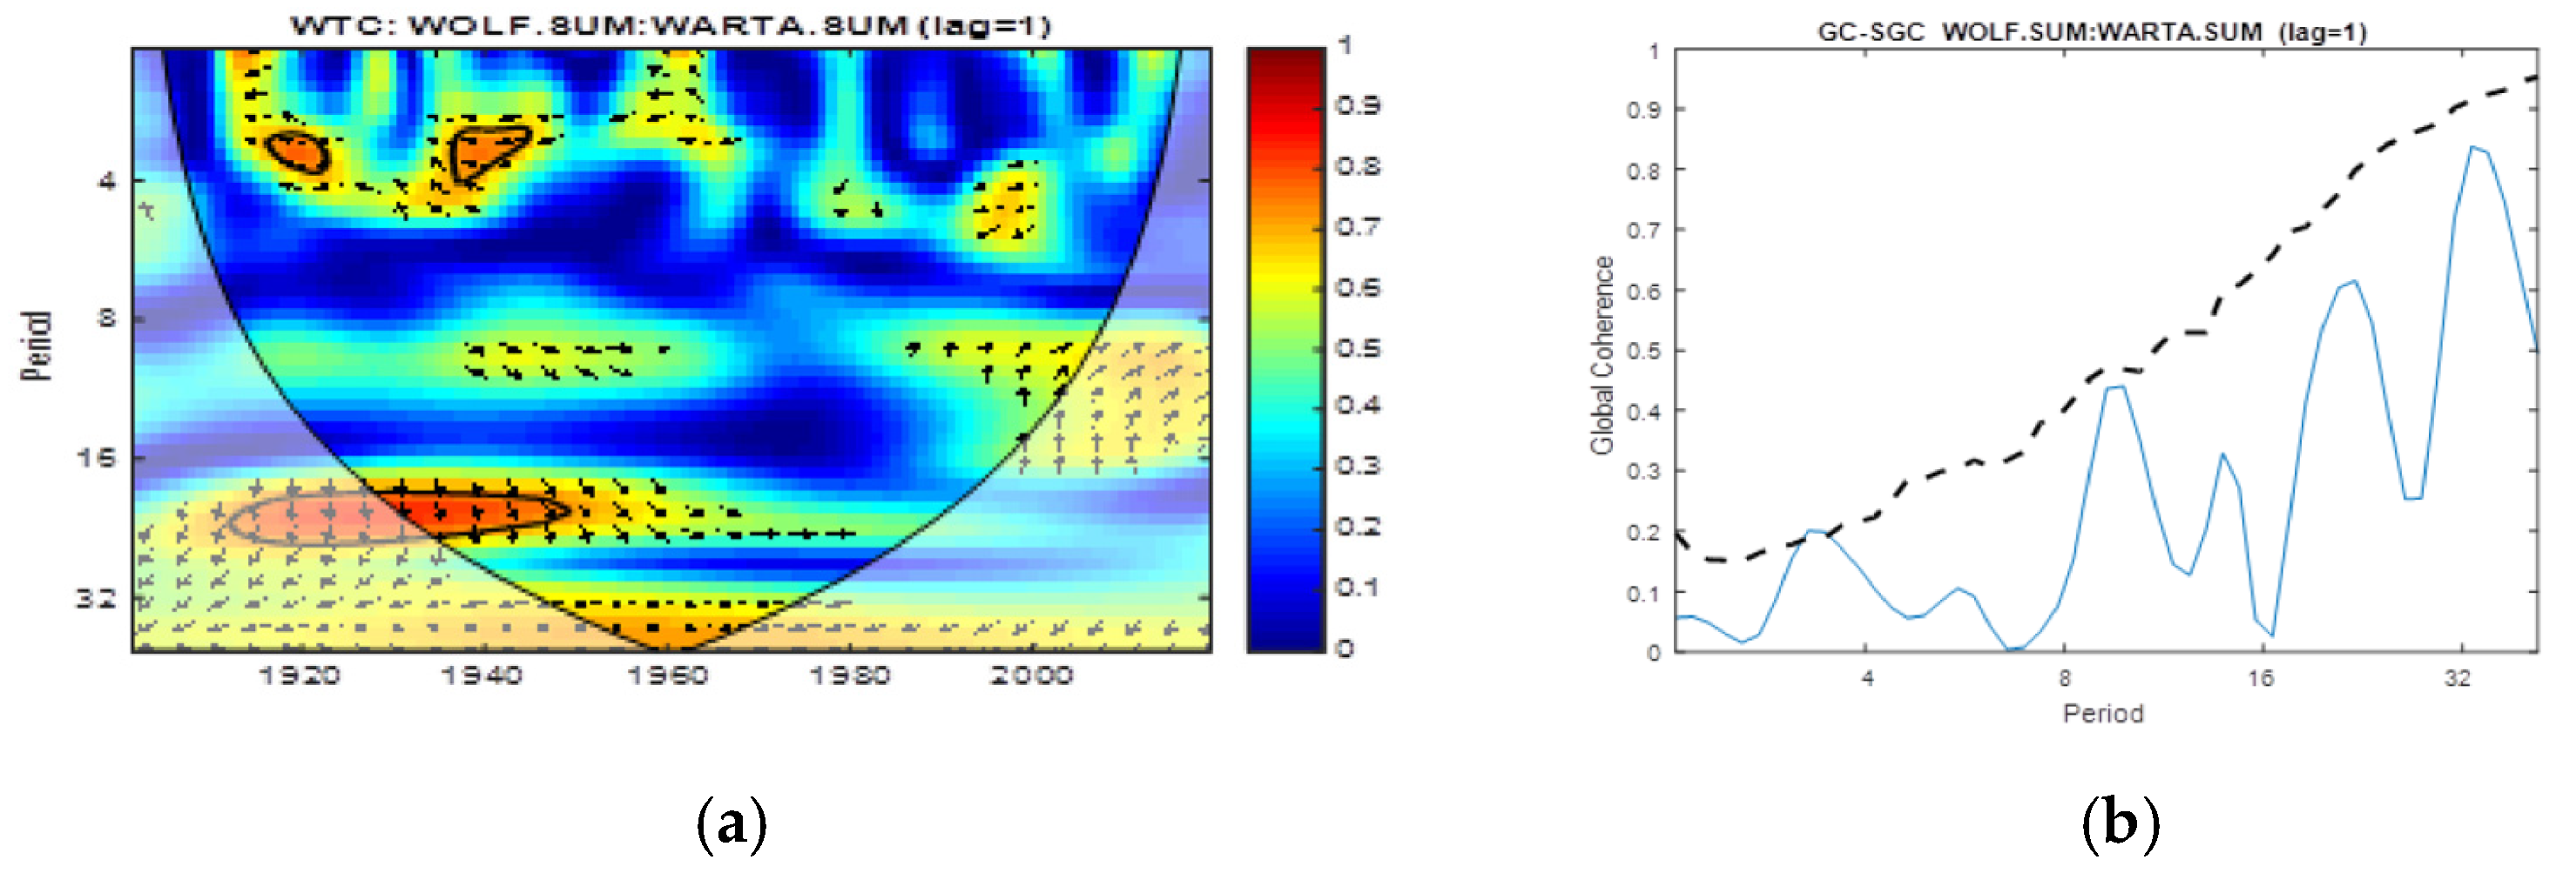
For the summer season, the connection between SSN and Q-Warta was chosen with a lag of one year, as indicated by NLR, which has a CL close to 95%. The details are shown in Figure 11.
Figure 11b indicates a single significant coherence (>95%) for frequencies corresponding to the 3 year period. For periods corresponding to the 11 year solar cycle, the coherence has a significance of approximately 90%. As can be seen from Figure 11a, this coherence is evident between the years 1940 and 1960, and after the year 2000.
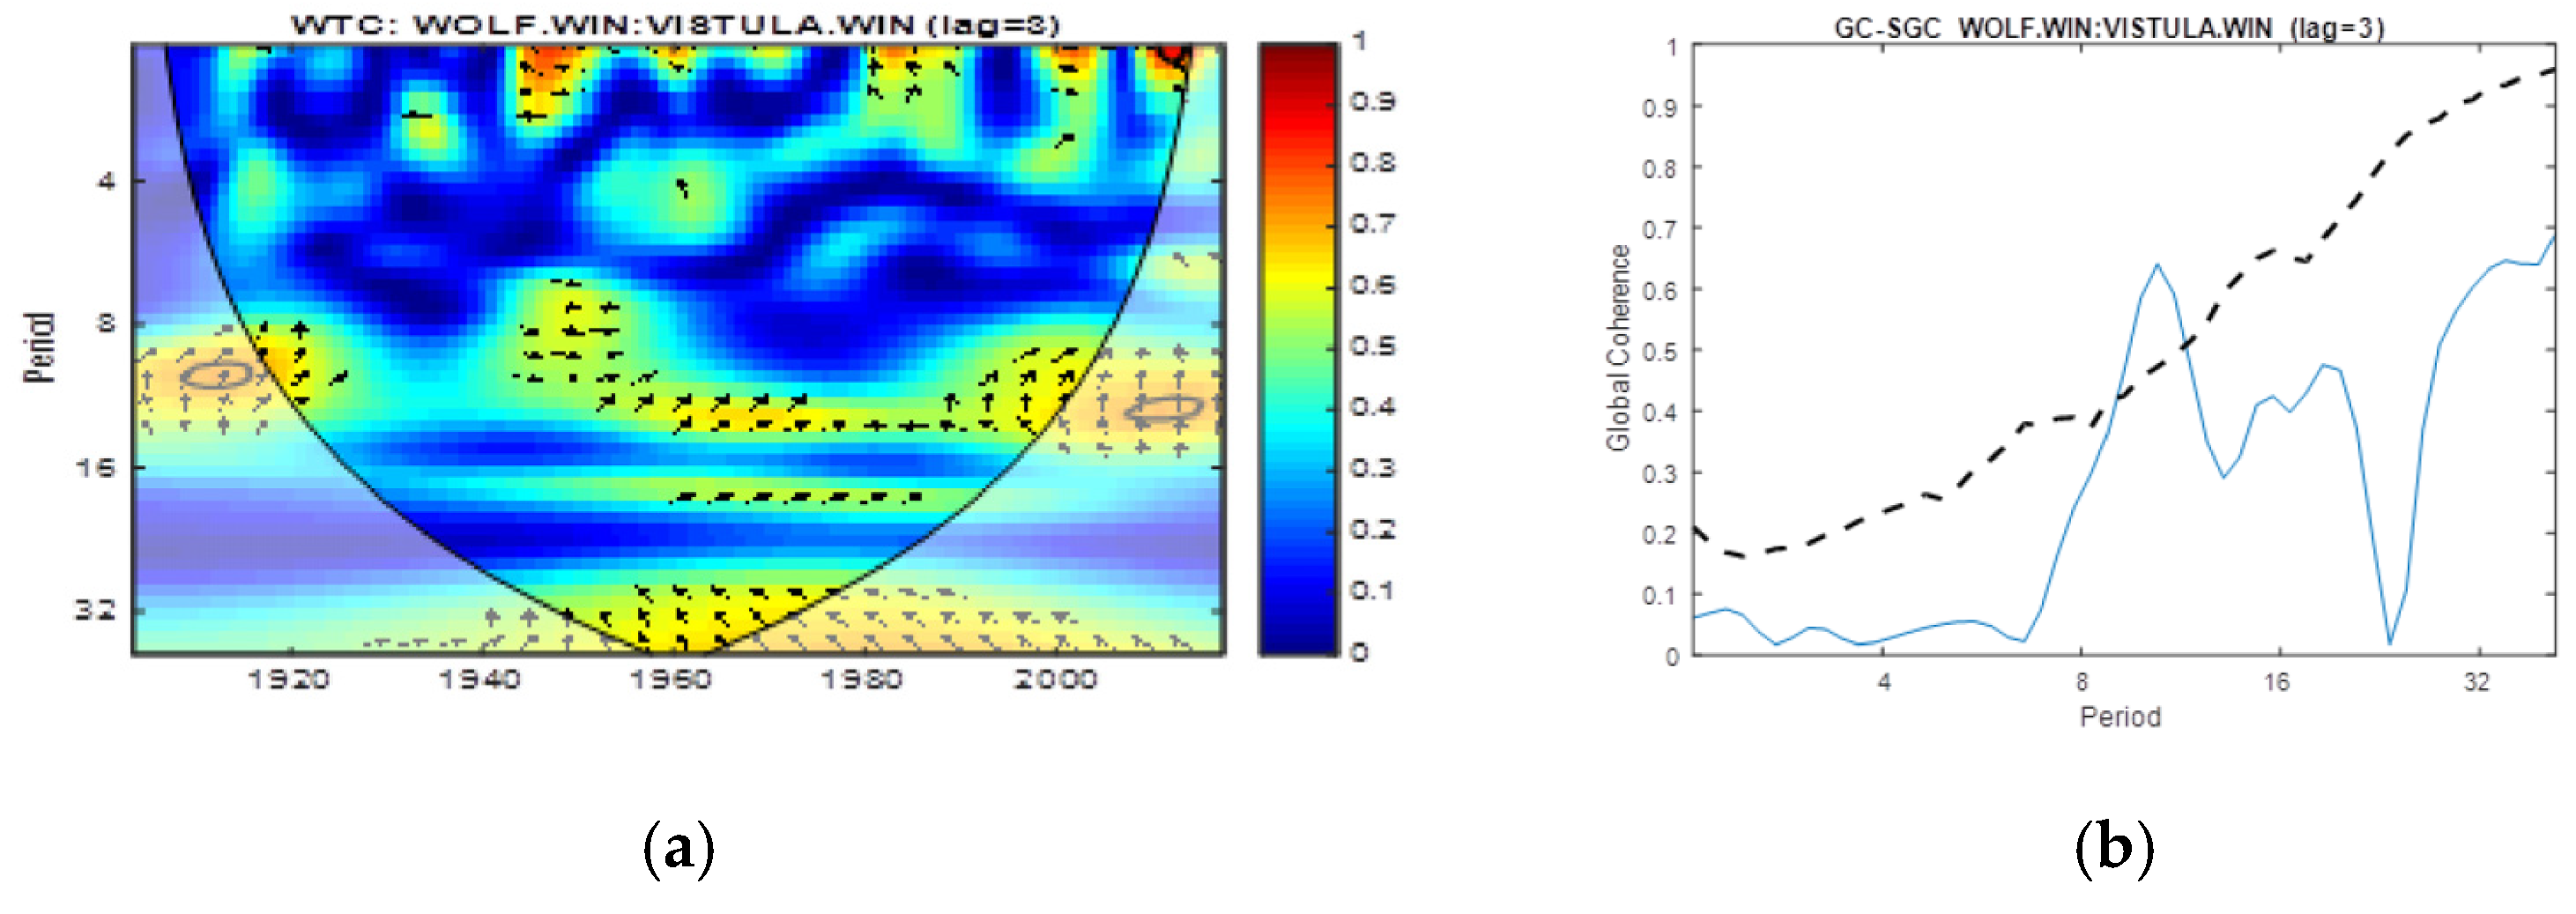
For winter the most significant case (in accordance with NLR), occurs between SSN and Q-Vistula at lag = 3.
4. Discussion and Conclusions
In this paper, long-term variability of the three rivers in Poland (Vistula, Odra and Warta) was investigated in relation to both climate variations in temperature and precipitation in the study area, and solar variability.
Changes in hydro-climatic elements show a number of regularities in the discharge of the studied rivers, precipitation and air temperature in the multi-annual period of 1901–2020. Both discharge and precipitation did not show statistically significant changes in that period, while air temperature showed a significant growing trend, especially after 1988. In shorter periods of 1901–2020, the directions and significance of trends were changed several times. Changes in both annual and seasonal discharge of the three analyzed rivers were noticeably synchronous, and that allowed for the separation of wet periods with higher discharges and dry periods with lower discharges. The 1940s, 1950s and mid-1960s were characterized by significantly lower river discharge. An increase in precipitation after 1965 caused the trend change and an increase in discharge, detected until the mid-1980s. Since then, a strong increase in air temperature and evaporation losses led to a slow decrease in river discharge, with noticeable fluctuations resulting from a periodic increase in precipitation. These findings confirm results of previous studies and indicate a great importance of macro-scale types of circulation [13,56] or thermohaline circulation [25,26].
In order to find the influence of solar activity on the discharges evolution, in the present investigation, the nature of the relationship between SSN and each of the three rivers’ discharges for each season with lags between 0 and 5 years was analyzed. Comparing the linear correlation coefficients with the non-linear ones, at a confidence level of at least 95%, it was clear that the relationship is non-linear for all of the analyzed cases, with the exception of one case. This singular case was found for the spring season, when the absolute value of the Pearson linear correlation coefficient was higher than the non-linear one, calculated on the basis of mutual information. Therefore, it turned out that in the spring season, solar activity simultaneously influences (lag = 0) the discharge at Warta River. For the non-linear link, the most significant result refers to the Vistula discharge during autumn where the NLR has a CL of approximately 99%, in which case the solar influence is significant after 4 years. To see what happens in the summer and winter seasons, we analyzed the most significant results for each of the discharges from the three rivers. Thus, for the summer, the most significant result, with a CL approaching 90%, was found at Warta, when the solar activity can influence the state of the discharge after a year. During the winter season, with a significance of almost 95%, the solar activity acts on the Vistula discharge with a delay of 3 years.
Afterwards, by means of global wavelet coherence as well as wavelet coherence in the time–frequency domain, we found out details on the influence of solar activity on the cases considered significant. The influence has been found in the streamflow data of the three studied rivers from Poland in the 2–8, 9–13, 14–23 and 24–33 year bands, and this changes both spatially and temporally. Our results showed that there are periodicities in the analyzed discharge data corresponding both to the solar activity cycles, namely 11 and 22 years, and to the hydro-climatic system, that might be taken into account through appropriate climatic indices, in the period band of 2–7 years.
From the global coherent analysis, the influence of the Schwabe cycle (11 years periodicity) is the most significant during the winter season on the Vistula discharge after a lag of 3 years (Figure 12b). At the timescale of the double solar cycle (Hale) (22 years), during the autumn season for the Vistula discharge, after a lag of 4 years, a statistically significant solar influence was revealed. In this case, the NLR has had the highest value among all of the analyzed cases (Figure 8), while the wavelet and the global wavelet coherence, from Figure 10a,b, pointed out a high significance of coherence, especially in the time interval 1940–1990, and, respectively, for the period band associated with the Hale solar cycle.
Concerning the complex relation between solar variability, described by appropriate indices, and certain geophysical phenomena, described by hydro-climatic variables, studies of [38,48] proved the importance of causal relation, in terms of linear or non-linear, on one side, and finding of a measure of this causality, on the other side. The similar outcomes were found in the research of [36,38,49,57], when the combined influence of atmospheric and extra-atmospheric factors on the Lower Danube discharge was analyzed.
To conclude, firstly, the causal link between the solar activity and the discharge at the three rivers in Poland was analyzed by using the linear and non-linear correlation coefficients, highlighting the fact that the direct link was non-linear and complex. Further, using wavelet coherence (WTC), a powerful correlation analysis method, findings in the time–frequency domain of the coherence between the solar activity and the discharge from the studied rivers were underlined. This study showed that the results differ depending on the season and indicate influences of solar activity at the solar cycle timescales of 11 and/or 22 years and in some cases even longer.
To estimate the discharge variability, the methods used can be improved by combining several predictors, both atmospheric and extra-atmospheric (solar activity indices). Thus, by combining the predictors (precipitation and temperature) presented in the first part of the study with a predictor of solar activity and applying multiple wavelet analysis methods [58], the most significant predictors for estimating discharge can be found. Also, by considering the predictors that express atmospheric circulation on a large scale and using suitable filtering methods, the results might be clearer.
Supplementary Materials
The following supporting information can be downloaded at: https://www.mdpi.com/article/10.3390/atmos14071184/s1, Figure S1. Relationship between solar activity (SSN) and the Vistula discharge for spring at lag = 0: (a) WTC (wavelet coherence), (b) Global Coherence (GC), solid line, and Significance of GC (SGC), dashed line. SGC indicates a 95% CL, (c) boxplot for the coherence obtained by WTC, (d) average of WTC for a band of 4 periods; Figure S2. Relationship between solar activity (SSN) and the Warta discharge for fall at lag = 0: (a) WTC (wavelet coherence), (b) Global Coherence (GC), solid line, and Significance of GC (SGC), dashed line. SGC indicates a 95% CL, (c) boxplot for the coherence obtained by WTC, (d) average of WTC for a band of 4 periods.
Author Contributions
Conceptualization, D.W. and I.M.; methodology, D.W., I.M. and C.M.; software, D.W., L.S., I.M. and C.M.; validation, D.W.; formal analysis, D.W.; investigation, data curation, D.W. and V.D.; writing—original draft preparation, D.W. and L.S.; writing—review and editing, L.S., I.M. and V.D.; visualization, D.W.; supervision, D.W. and L.S. All authors have read and agreed to the published version of the manuscript.
Funding
This research was partly carried out under the internal research grant (internal faculty research grant) at the Faculty of Geographical and Geological Sciences of Adam Mickiewicz University in Poznań, Poland.
Institutional Review Board Statement
Not applicable.
Informed Consent Statement
Not applicable.
Data Availability Statement
The data presented in this study are available upon request from the corresponding author.
Conflicts of Interest
The authors declare no conflict of interest.
References
- Dai, Z.J.; Du, J.Z.; Tang, Z.H.; Ou, S.Y.; Brody, S.; Mei, X.F.; Jing, J.T.; Yu, S.B. Detection of Linkage Between Solar and Lunar Cycles and Runoff of the World’s Large Rivers. Earth Space Sci. 2019, 6, 914–930. [Google Scholar] [CrossRef] [Green Version]
- Stojkovic, M.; Prohaska, S.; Plavsic, J. Stochastic structure of annual discharges of large European rivers. J. Hydrol. Hydromech. 2015, 63, 63–70. [Google Scholar] [CrossRef] [Green Version]
- Pekarova, P.; Miklanek, P.; Pekar, J. Spatial and temporal runoff oscillation analysis of the main rivers of the world during the 19th–20th centuries. J. Hydrol. 2003, 274, 62–79. [Google Scholar] [CrossRef]
- Pekarova, P.; Miklanek, P.; Pekar, J. Long-term trends and runoff fluctuations of European rivers. Climate Variability and Change—Hydrological Impacts. In Proceedings of the 5th FRIEND World Conference, Havana, Cuba, 27 November–1 December 2006; p. 708. [Google Scholar]
- Gutry-Korycka, M.; Sadurski, A.; Kundzewicz, Z.W.; Pociask-Karteczka, J.; Skrzypczyk, L. Water resources and their use. Nauka 2014, 1, 77–98. (In Polish) [Google Scholar]
- Wrzesiński, D. Use of entropy in the assessment of uncertainty of river runoff regime in Poland. Acta Geophys. 2016, 64, 1825–1839. [Google Scholar] [CrossRef] [Green Version]
- Wrzesiński, D.; Sobkowiak, L. Detection of changes in flow regime of rivers in Poland. J. Hydrol. Hydromech. 2018, 66, 55–64. [Google Scholar] [CrossRef] [Green Version]
- Wibig, J. Influence of Atmospheric Circulation on the Spatial Distribution of Temperature and Precipitation Anomalies in Europe; Wyd. Uniwersytetu Łódzkiego: Łódź, Poland, 2001; pp. 1–208. (In Polish) [Google Scholar]
- Kożuchowski, K. Circular climate factors in Poland. Czas. Geogr. 2003, 731, 93–105. (In Polish) [Google Scholar]
- Wrzesiński, D. Entropy of river runoff in Poland. Studia i Prace z Geografii i Geologii 33; Bogucki Publishing House: Poznań, Poland, 2013; pp. 1–204. (In Polish) [Google Scholar]
- Wrzesiński, D. Uncertainty of flow regime characteristics of rivers in Europe. Quaest. Geogr. 2013, 32, 49–59. [Google Scholar] [CrossRef] [Green Version]
- Michalczyk, Z.; Paszczyk, J. Changes in components to the water balance in the basins of the Vistula and Odra, 1901–2000. Czas. Geogr. 2011, 82, 49–68. (In Polish) [Google Scholar]
- Jokiel, P.; Kożuchowski, K. Changes in Selected Hydro-Climatic Characteristics of Poland in the Current Century. Dokumentacja Geograficzna; IGiPZ PAN: Warsaw, Poland, 1989; pp. 1–94. (In Polish) [Google Scholar]
- Stachý, J. Long-term runoff forecast of Polish rivers. Wiadomości Służby Hydrol.-Meteorol. 1969, 5, 5–64. (In Polish) [Google Scholar]
- Stachý, J. Long-term variability of runoff of Polish rivers. Pr. Państwowego Inst. Hydrol.-Meteorol. 1970, 97, 1–42. (In Polish) [Google Scholar]
- Gutry-Korycka, M.; Boryczka, J. Long-term changes in water balance elements in Poland and the Baltic Sea basin. Przegląd Geofiz. 1990, 35, 19–32. (In Polish) [Google Scholar]
- Wrzesiński, D. Changes of the hydrological regime of rivers of northern and central Europe in various circulation periods of the North Atlantic Oscillation. Quaest. Geogr. 2005, 24, 97–109. [Google Scholar]
- Wrzesiński, D. Regional differences in the influence of the North Atlantic Oscillation on seasonal river runoff in Poland. Quaest. Geogr. 2011, 30, 127–136. [Google Scholar] [CrossRef]
- Wrzesiński, D. Flow Regime Patterns and Their Changes. In Management of Water Resources in Poland; Zeleňáková, M., Kubiak-Wójcicka, K., Negm, A.M., Eds.; Springer Nature: Cham, Switzerland, 2021; pp. 163–180. [Google Scholar] [CrossRef]
- Wrzesiński, D.; Paluszkiewicz, R. Spatial differences in the impact of the North Atlantic Oscillation on the flow of rivers in Europe. Hydrol. Res. 2011, 42, 30–39. [Google Scholar] [CrossRef]
- Graf, R.; Wrzesiński, D. Relationship between Water Temperature of Polish Rivers and Large-Scale Atmospheric Circulation. Water 2019, 11, 1690. [Google Scholar] [CrossRef] [Green Version]
- Plewa, K.; Perz, A.; Wrzesiński, D. Links between Teleconnection Patterns and Water Level Regime of Selected Polish Lakes. Water 2019, 11, 1330. [Google Scholar] [CrossRef] [Green Version]
- Wrzesiński, D.; Ptak, M.; Plewa, K. Effect of the North Atlantic Oscillation on water level fluctuations in lakes of northern Poland. Geogr. Pol. 2018, 91, 243–259. [Google Scholar] [CrossRef]
- Wrzesiński, D.; Sobkowiak, L. Effects of Oceanic–Atmospheric Oscillations on Rivers. Water 2022, 14, 1245. [Google Scholar] [CrossRef]
- Marsz, A.A.; Styszyńska, A.; Krawczyk, E.W. The log-term fluctuations in annual flows rivers in Poland and their relationship with the North Atlantic Thermohaline Circulation. Przegląd Geogr. 2016, 88, 295–316. [Google Scholar] [CrossRef]
- Wrzesiński, D.; Marsz, A.A.; Styszyńska, A.; Sobkowiak, L. Effect of the North Atlantic Thermohaline Circulation on Changes in Climatic Conditions and River Flow in Poland. Water 2019, 11, 1622. [Google Scholar] [CrossRef] [Green Version]
- Rodriguez-Iturbe, I.; Yevjevich, V. The Investigation of Relationship between Hydrologic Time Series and Sunspot Numbers; Colorado State University: Fort Collins, CO, USA, 1968. [Google Scholar]
- Dyer, T.G.J. On the 11-year Solar Cycle and River Flow. Water SA 1978, 4, 157–162. [Google Scholar]
- Zanchettin, D.; Rubino, A.; Traverso, P.; Tomasino, M. Impact of variations in solar activity on hydrological decadal patterns in northern Italy. J. Geophys. Res. 2008, 113, D12102. [Google Scholar] [CrossRef] [Green Version]
- Cionco, R.G.; Abuin, P. On planetary torque signals and sub-decadal frequencies in the discharges of large rivers. Adv. Space Res. 2016, 57, 1411–1425. [Google Scholar] [CrossRef]
- Hajian, S.; Movahed, M.S. Multifractal Detrended Cross-Correlation Analysis of Sunspot Numbers and River Flow Fluctuations. Phys. A Stat. Mech. Its Appl. 2010, 389, 4942. [Google Scholar] [CrossRef] [Green Version]
- Briciu, A.-E.; Dumitru, M. Wavelet analysis of some rivers in SE Europe and selected climate indices. Environ. Monit. Assess. 2014, 186, 6263–6286. [Google Scholar] [CrossRef]
- Antico, A.; Torres, M.E. Evidence of a decadal solar signal in the Amazon River: 1903 to 2013. Geophys. Res. Lett. 2015, 42, 782–787. [Google Scholar] [CrossRef] [Green Version]
- Baker, J.C.A.; Gloor, M.; Boom, A.; Neill, D.A.; Cintra, B.B.L.; Clerici, S.J.; Brienen, R.J.W. Questioning theinfluence of sunspots on Amazon hydrology: Even a broken clock tells the right time twice a day. Geophys. Res. Lett. 2018, 45, 1419–1422. [Google Scholar] [CrossRef] [Green Version]
- Su, L.; Miao, C.Y.; Borthwick, A.G.L.; Duan, Q.Y. Wavelet-based variability of Yellow River discharge at 500-, 100-, and 50-year timescales. Gondwana Res. 2017, 49, 94–105. [Google Scholar] [CrossRef] [Green Version]
- Dobrica, V.; Demetrescu, C.; Mares, I.; Mares, C. Long-term evolution of the Lower Danube discharge and corresponding climate variations: Solar signature imprint. Theor. Appl. Climatol. 2018, 133, 985–996. [Google Scholar] [CrossRef]
- Yang, R.T.; Xing, B. Possible Linkages of Hydrological Variables to Ocean–Atmosphere Signals and Sunspot Activity in the Upstream Yangtze River Basin. Atmosphere 2021, 12, 1361. [Google Scholar] [CrossRef]
- Mares, I.; Dobrica, V.; Mares, C.; Demetrescu, C. Assessing the solar variability signature in climate variables by information theory and wavelet coherence. Sci. Rep. 2021, 11, 11337. [Google Scholar] [CrossRef]
- Mares, C.; Dobrica, V.; Mares, I.; Demetrescu, C. Solar Signature in Climate Indices. Atmosphere 2022, 13, 1898. [Google Scholar] [CrossRef]
- Liu, Y.; Wen, Y.; Zhao, Y.; Hu, H. Analysis of Drought and Flood Variations on a 200-Year Scale Based on Historical Environmental Information in Western China. Int. J. Environ. Res. Public Health 2022, 19, 2771. [Google Scholar] [CrossRef]
- Pociask-Karteczka, J. Geographical location of Poland against the background of Europe. In Hydrology of Poland; Jokiel, P., Marszalewski, W., Pociask-Karteczka, J., Eds.; Wydawnictwo Naukowe PWN: Warsaw, Poland, 2017. (In Polish) [Google Scholar]
- Wrzesiński, D.; Sobkowiak, L. Transformation of the Flow Regime of a Large Allochthonous River in Central Europe—An Example of the Vistula River in Poland. Water 2020, 12, 507. [Google Scholar] [CrossRef] [Green Version]
- Ilnicki, P.; Farat, R.; Górecki, K.; Lewandowski, P. Impact of climatic change on river discharge in the driest region of Poland. Hydrol. Sci. J. 2014, 59, 1117–1134. [Google Scholar] [CrossRef] [Green Version]
- Woś, A. Climate of Poland in the Second Half of the 20th Century; Wydawnictwo Naukowe UAM: Poznań, Poland, 2010. (In Polish) [Google Scholar]
- Wrzesiński, D.; Perz, A. Detection of Changes in the Flow Regime of Rivers in Poland. Physiogr. Res. West. Pol. Ser. A–Phys. Geogr. 2016, 67, 289–304. (In Polish) [Google Scholar] [CrossRef] [Green Version]
- Peel, M.C.; Finlayson, B.L.; McMahon, T.A. Updated world map of the Köppen-Geiger climate classification. Hydrol. Earth Syst. Sci. 2007, 11, 1633–1644. [Google Scholar] [CrossRef] [Green Version]
- Khan, S.; Ganguly, A.R.; Bandyopadhyay, S.; Saigal, S.; Erickson III, D.J.; Protopopescu, V.; Ostrouchov, G. Nonlinear statistics reveals stronger ties between ENSO and the tropical hydrological cycle. Geophys. Res. Lett. 2006, 33, L24402. [Google Scholar] [CrossRef] [Green Version]
- Vu, T.M.; Mishra, A.K.; Konapala, G. Information entropy suggests stronger nonlinear associations between hydro-meteorological variables and ENSO. Entropy 2018, 20, 38. [Google Scholar] [CrossRef] [Green Version]
- Mares, I.; Mares, C.; Dobrica, V.; Demetrescu, C. Comparative study of statistical methods to identify a predictor for discharge at Orsova in the Lower Danube Basin. Hydrol. Sci. J. 2020, 65, 371–386. [Google Scholar] [CrossRef]
- Labat, D. Recent advances in wavelet analyses: Part 1. A review of concepts. J. Hydrol. 2005, 314, 275–288. [Google Scholar] [CrossRef]
- Fu, C.; James, A.L.; Wachowiak, M.P. Analyzing the combined influence of solar activity and El Niño on streamflow across southern Canada. Water Resour. Res. 2012, 48, W05507. [Google Scholar] [CrossRef]
- Grinsted, A.; Moore, J.C.; Jevrejeva, S. Application of the cross wavelet transform and wavelet coherence to geophysical time series. Nonlinear Process. Geophys. 2004, 11, 561–566. [Google Scholar] [CrossRef]
- Schulte, J. Global Wavelet Coherence, MATLAB Central File Exchange. Available online: https://www.mathworks.com/matlabcentral/fileexchange/54682-global-wavelet-coherence (accessed on 14 May 2023).
- Schulte, J.; Najjar, R.G.; Li, M. The influence of climate modes on streamflow in the Mid-Atlantic region of the United States. J. Hydrol. Reg. Stud. 2016, 5, 80–99. [Google Scholar] [CrossRef] [Green Version]
- Maraun, D.; Kurths, J.; Holschneider, M. Nonstationary Gaussian processes in wavelet domain: Synthesis, estimation, and significance testing. Phys. Rev. E 2007, 75, 016707. [Google Scholar] [CrossRef] [Green Version]
- Fal, B.; Bogdanowicz, E. Surface water resources of Poland. Wiadomości IMGW 2002, 26, 3–38. (In Polish) [Google Scholar]
- Mares, I.; Dobrica, V.; Demetrescu, C.; Mares, C. Hydrological response in the Danube lower basin to some internal and external climate forcing factors. Hydrol. Earth. Syst. Sci. Discuss. 2016; preprint. [Google Scholar] [CrossRef] [Green Version]
- Hu, W.; Si, B.C. Technical Note: Improved partial wavelet coherency for understanding scale-specific and localized bivariate relationships in geosciences. Hydrol. Earth Syst. Sci. 2021, 25, 321–331. [Google Scholar] [CrossRef]
Figure 1.
Location of the study area.

Figure 2.
Trends of changes in the discharges of the studied rivers in the multi-annual period of 1901–2020 with the 10 year moving average.
Figure 2.
Trends of changes in the discharges of the studied rivers in the multi-annual period of 1901–2020 with the 10 year moving average.

Figure 3.
Trends of changes in the seasonal discharges of the studied rivers in the multi-annual period of 1901–2020 with the 10 year moving average.
Figure 3.
Trends of changes in the seasonal discharges of the studied rivers in the multi-annual period of 1901–2020 with the 10 year moving average.

Figure 4.
Trends of changes in precipitation and air temperature in Poznań in the multi-annual period of 1901–2020. The blue bars represent precipitation in Poznań (P Poznań), and the red curve represents air temperature in Poznań (Tair Poznań).
Figure 4.
Trends of changes in precipitation and air temperature in Poznań in the multi-annual period of 1901–2020. The blue bars represent precipitation in Poznań (P Poznań), and the red curve represents air temperature in Poznań (Tair Poznań).

Figure 5.
Trends of changes in the discharges of the studied rivers, air temperature and precipitation in Poznań in the 20 year sub-periods of the multi-year period of 1901–2020; p—statistical significance, R—coefficient of correlation.
Figure 5.
Trends of changes in the discharges of the studied rivers, air temperature and precipitation in Poznań in the 20 year sub-periods of the multi-year period of 1901–2020; p—statistical significance, R—coefficient of correlation.

Figure 6.
Standardized cumulative annual deviations (SCAD) from the average of annual river discharges, precipitation (P) and air temperature (Tair).
Figure 6.
Standardized cumulative annual deviations (SCAD) from the average of annual river discharges, precipitation (P) and air temperature (Tair).

Figure 7.
Deviations of monthly discharges in the 20 year sub-periods from the average values from 1901 to 2020 and their statistical significance.
Figure 7.
Deviations of monthly discharges in the 20 year sub-periods from the average values from 1901 to 2020 and their statistical significance.

Figure 8.
The linear |R| and nonlinear correlation coefficient (NLR), between the discharges (Qs) from three rivers in Poland and Wolf number with lags 0:5.
Figure 8.
The linear |R| and nonlinear correlation coefficient (NLR), between the discharges (Qs) from three rivers in Poland and Wolf number with lags 0:5.

Figure 9.
Relationship between solar activity (SSN) and the Warta discharge for spring at lag = 0: (a) WTC (wavelet coherence), (b) boxplot for the coherence obtained by WTC, (c) Global Coherence (GC), solid line, and Significance of GC (SGC), dashed line. SGC indicates a 95% CL.
Figure 9.
Relationship between solar activity (SSN) and the Warta discharge for spring at lag = 0: (a) WTC (wavelet coherence), (b) boxplot for the coherence obtained by WTC, (c) Global Coherence (GC), solid line, and Significance of GC (SGC), dashed line. SGC indicates a 95% CL.

Figure 10.
Relationship between solar activity (SSN) and the Vistula discharge for fall at lag = 4: (a) WTC (wavelet coherence), (b) Global Coherence (GC), solid line, and Significance of GC (SGC), dashed line. SGC indicates a 95% CL. In (a) the arrows with an orientation from west to east indicate that the two time series are in phase, i.e. they are positively correlated, and the arrows with an orientation from east to west indicate that the series are in anti-phase, i.e. there is a negative correlation between them.

Figure 11.
Relationship between solar activity (SSN) and the Warta discharge for summer at lag = 1: (a) WTC (wavelet coherence), (b) Global Coherence (GC), solid line, and Significance of GC (SGC), dashed line. SGC indicates a 95% CL.
Figure 11.
Relationship between solar activity (SSN) and the Warta discharge for summer at lag = 1: (a) WTC (wavelet coherence), (b) Global Coherence (GC), solid line, and Significance of GC (SGC), dashed line. SGC indicates a 95% CL.

Figure 12.
Relationship between solar activity (SSN) and the Vistula discharge for winter at lag = 3: (a) WTC (wavelet coherence), (b) Global Coherence (GC), solid line, and Significance of GC (SGC), dashed line. SGC indicates a 95% CL.
Figure 12.
Relationship between solar activity (SSN) and the Vistula discharge for winter at lag = 3: (a) WTC (wavelet coherence), (b) Global Coherence (GC), solid line, and Significance of GC (SGC), dashed line. SGC indicates a 95% CL.

Disclaimer/Publisher’s Note: The statements, opinions and data contained in all publications are solely those of the individual author(s) and contributor(s) and not of MDPI and/or the editor(s). MDPI and/or the editor(s) disclaim responsibility for any injury to people or property resulting from any ideas, methods, instructions or products referred to in the content. |
© 2023 by the authors. Licensee MDPI, Basel, Switzerland. This article is an open access article distributed under the terms and conditions of the Creative Commons Attribution (CC BY) license (https://creativecommons.org/licenses/by/4.0/).
Share and Cite
MDPI and ACS Style
Wrzesiński, D.; Sobkowiak, L.; Mares, I.; Dobrica, V.; Mares, C. Variability of River Runoff in Poland and Its Connection to Solar Variability. Atmosphere 2023, 14, 1184. https://doi.org/10.3390/atmos14071184
AMA Style
Wrzesiński D, Sobkowiak L, Mares I, Dobrica V, Mares C. Variability of River Runoff in Poland and Its Connection to Solar Variability. Atmosphere. 2023; 14(7):1184. https://doi.org/10.3390/atmos14071184
Chicago/Turabian StyleWrzesiński, Dariusz, Leszek Sobkowiak, Ileana Mares, Venera Dobrica, and Constantin Mares. 2023. "Variability of River Runoff in Poland and Its Connection to Solar Variability" Atmosphere 14, no. 7: 1184. https://doi.org/10.3390/atmos14071184
Note that from the first issue of 2016, this journal uses article numbers instead of page numbers. See further details here.