
Influence of Load Condition, Tire Type, and Ambient Temperature on the Emission of Tire–Road Particulate Matter


Institute of Vehicle System Technology, Karlsruhe Institute of Technology, 76131 Karlsruhe, Germany
*
Author to whom correspondence should be addressed.
Atmosphere 2023, 14(7), 1095; https://doi.org/10.3390/atmos14071095
Submission received: 30 May 2023
/
Revised: 20 June 2023
/
Accepted: 28 June 2023
/
Published: 30 June 2023
(This article belongs to the Special Issue Vehicle Exhaust and Non-exhaust Emissions)
Abstract
:This study focuses on particulate matter emissions from tire–road contact and their investigation using an internal drum test bench. The test bench is equipped with real-road surfaces and has been upgraded to enable real-time measurements of particulate matter. It was found that the road surface changes during the tests due to constant rolling over, influencing the level of emissions significantly. To account for this effect, the micro roughness was characterized before, during, and after the tests. Specific emission values consisting of particle mass and number were determined with summer, all-season, and winter tires for different road conditions, as well as specific longitudinal and lateral forces. It turned out that emissions increase disproportionately with load for both force directions. The winter tire led to the highest emissions across all loads, and the summer tire led to the lowest ones. While lateral forces caused emissions many times higher than longitudinal forces for the summer tire, forces in both directions led to comparable emissions for the all-season and winter tires. Regarding the ambient temperature, a lower one seems to be favorable for summer tires and a higher one seems to be favorable for winter tires. Lastly, particle size distributions during different load conditions show a dependence on load, such that larger particles are emitted with increasing load.
1. Introduction
According to a recent report by the World Health Organization (WHO), particulate matter (PM) is the air pollutant that affects most people worldwide and negatively impacts their lives. A fact that exacerbates this problem is that no limit has yet been found below which no damage can occur to the human body [1]. This means that although PM immissions have been continuously decreasing in recent years [2], also thanks to increasingly stringent exhaust gas limits, the remaining pollution still poses a health risk. According to a study by the Organisation for Economic Co-operation and Development (OECD), the elimination of combustion immissions through the switch to battery–electric vehicles (BEVs) will not change this situation. It will mainly shift the size distribution of the emitted PM, but the total emissions of the vehicles will remain more or less constant [3] because of their higher masses in conjunction with the higher torques. This is due to PM from abrasion processes, in the case of BEVs, primarily from the contact patch between tires and the road surface. In terms of introducing legal limits, there is a lack of reliable emission factors, on the one hand, and standardized measurement methods that can be applied across the board, on the other. Studies have been conducted using various approaches to measure or determine tire–road PM emissions, of which the most widespread are ambient measurements, driving tests on open roads, and road simulator measurements.
In ambient measurements [4,5,6,7,8,9,10,11,12], airborne particles are collected over an extended period of time, usually using one or several cascade impactors. Chemical and optical analyses, as well as the use of positive matrix factorization (PMF), allow conclusions to be drawn about the sources of PM collected during the measurement period [5,6,13]. In addition, average emission factors for individual vehicle classes can be determined with this approach [4,6,10,11,12]. However, since the collection of particles takes place over a long period of time, it is not possible to make any statement about the emission of specific vehicles, tire types, load conditions, or short-term environmental influences.
In driving tests on open roads [14,15,16,17,18,19], vehicles equipped with measurement systems are driven under various load conditions while the particle concentration is typically measured in the wheel arch behind the tire. By additionally measuring the particle concentration in front of the vehicle, the influence of the background concentration can be minimized but is still not completely eliminated. Local variations in particle concentration, as well as changing wind directions, are limiting factors. Furthermore, no reliable statements can be made about the effect of individual driving conditions on the total emissions from tire–road contact. For this, it would be necessary to analyze or at least collect the entire air flow from the tire–road contact patch. Due to the limited installation space in conjunction with the wheel’s dynamics, this task is particularly difficult and has therefore not been implemented by now. Usually, only a small partial flow is sampled at a specific position in the wheel arch and statements about the emissions are derived from this. Another problem is that while driving, the vehicle passes many different surfaces, and thus, the particle concentrations measured cannot be clearly linked to one road surface due to dynamically changing concentrations.
In road simulators or, in other words, in-door tire test benches, one [19,20,21,22,23] or several [6,24,25,26,27,28] tires are rolled on a known surface under defined boundary conditions. The huge advantage of these is the ability to influence the ambient conditions and, thus, better reproducibility. Depending on the test bench, the range of load conditions can vary greatly. Some test benches only allow a limited selection of load conditions, for example, speed, while others do not offer the possibility of driving on real road surfaces. Both requirements, realistic road surfaces such as asphalt or concrete, as well as adjustability of all chassis parameters, which are necessary to entirely simulate a realistic drive, can be fulfilled using an internal drum test bench. Foitzik et al. [23] and Schläfle et al. [29] have already used an internal drum test bench to measure PM emissions in the nano and micro ranges, respectively.
However, since only one tire type was investigated in both studies, no statement can be made about the emission potential of different tire types. Such comparisons, especially concerning the use of studded tires, can be found in Hussein et al. (summer, winter, and all-season) [15], Gustafsson et al. (winter and studded, and summer, winter, and studded) [26,27], Sjödin et al. (summer, winter, and studded) [6], and Kupiainen et al. (winter and studded) [17]. Nevertheless, none of the mentioned studies investigated the influence of the surface texture, in particular the one of micro roughness, on the emission of particulate matter.
Therefore, this study focuses on the emission behavior of summer, winter, and all-season tires on realistic asphalt surfaces with varying micro roughness. The tests are conducted for different load conditions and at different ambient temperatures.
2. Materials and Methods
2.1. Internal Drum Test Bench
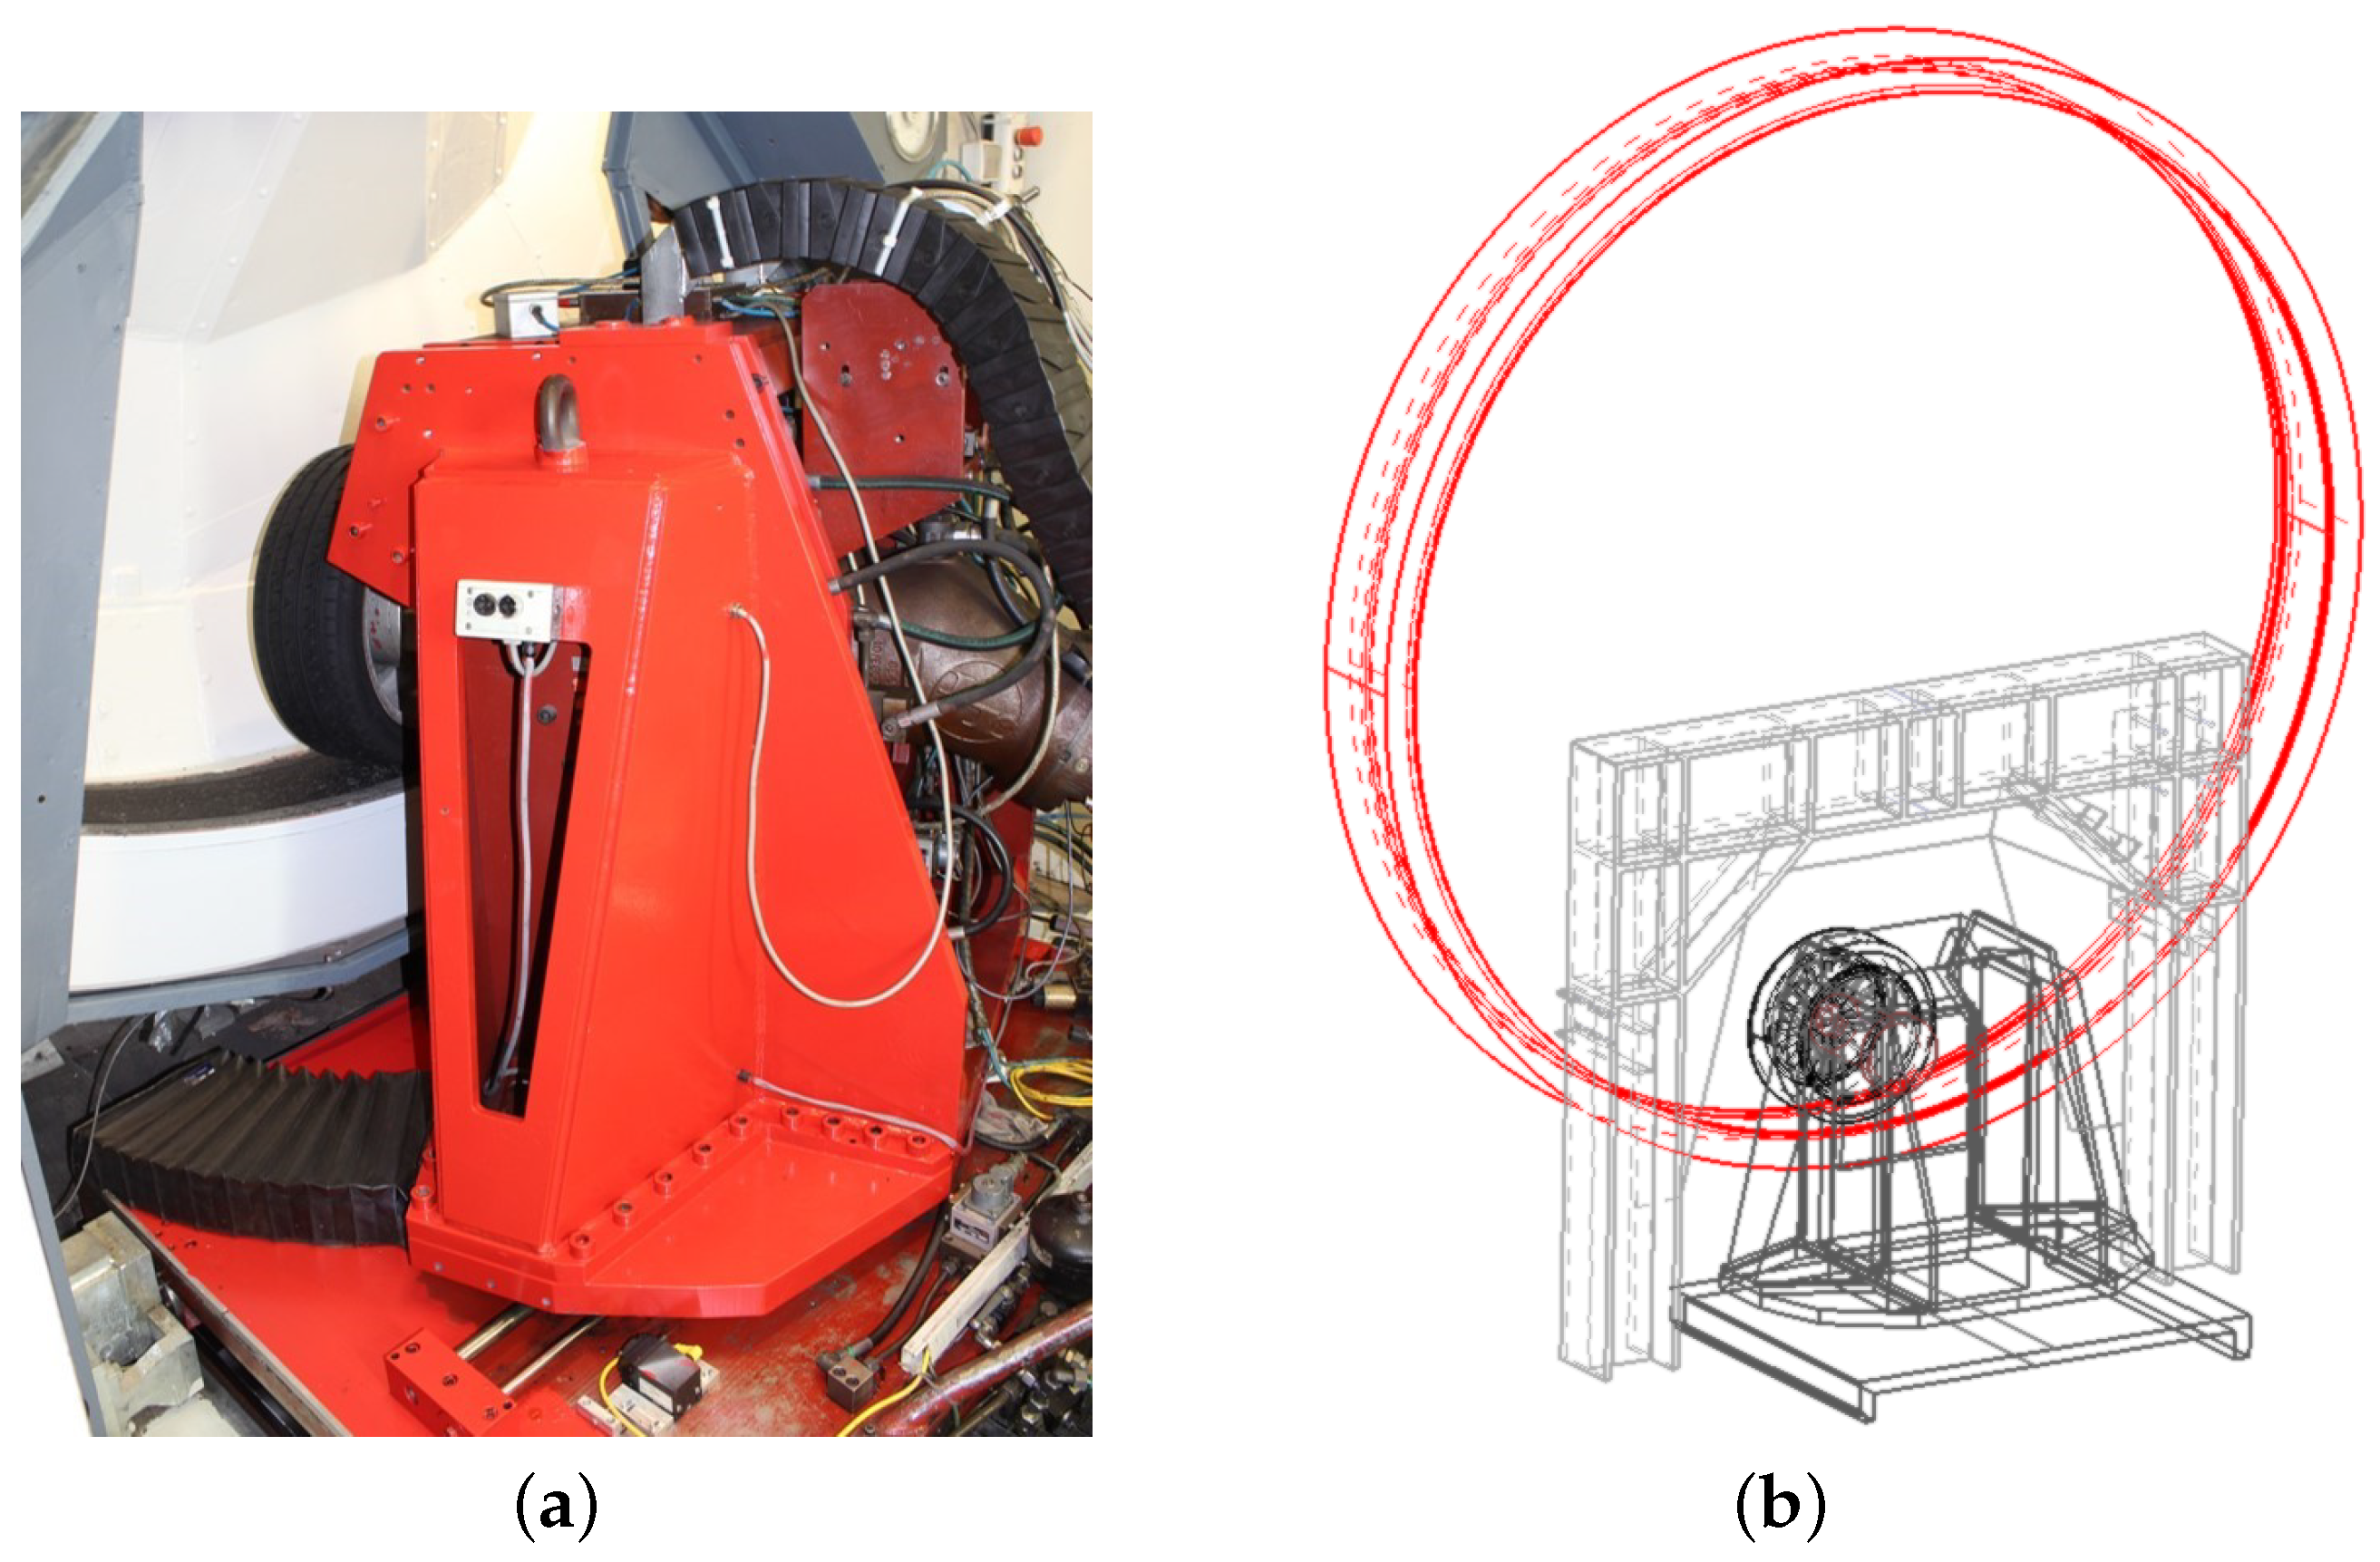
The internal drum test bench (see Figure 1) of the Institute of Vehicle System Technology (FAST) at the Karlsruhe Institute of Technology (KIT) was used to perform all test runs. In this test bench, the tire runs at the lowest point of a vertically arranged drum with an inner diameter of m. The surrounding chamber is enclosed, which allows the exclusion of fluctuations of background concentration. The drum is driven electrically while all movements, as well as the propulsion of the wheel, work hydraulically. The drum and wheel are driven separately using a 310-kW-engine each, allowing the investigation of realistic and stationary operation modes. As long as no forces but the vertical load are applied, the tire and drum roll at the same speed. Due to their separate propulsion, slip conditions in the longitudinal direction—drive and brake slip—and thus longitudinal forces can be set reproducibly. The rotation of the sled around the vertical axis of the wheel enables slip angles, i.e., lateral slip, and thus the simulation of cornering under the influence of lateral forces. The test bench can be equipped with different tires and realistic pavements, allowing for an accurate replication of the tire–road contact on open roads. During the tests for this study, a widespread asphalt mixture (AC 11 D S) has been used. Furthermore, different environmental conditions can be set: the effect of precipitation can be investigated by implementing certain water film heights, as well as snow and ice. The temperature is adjustable in a wide range below and above freezing level.
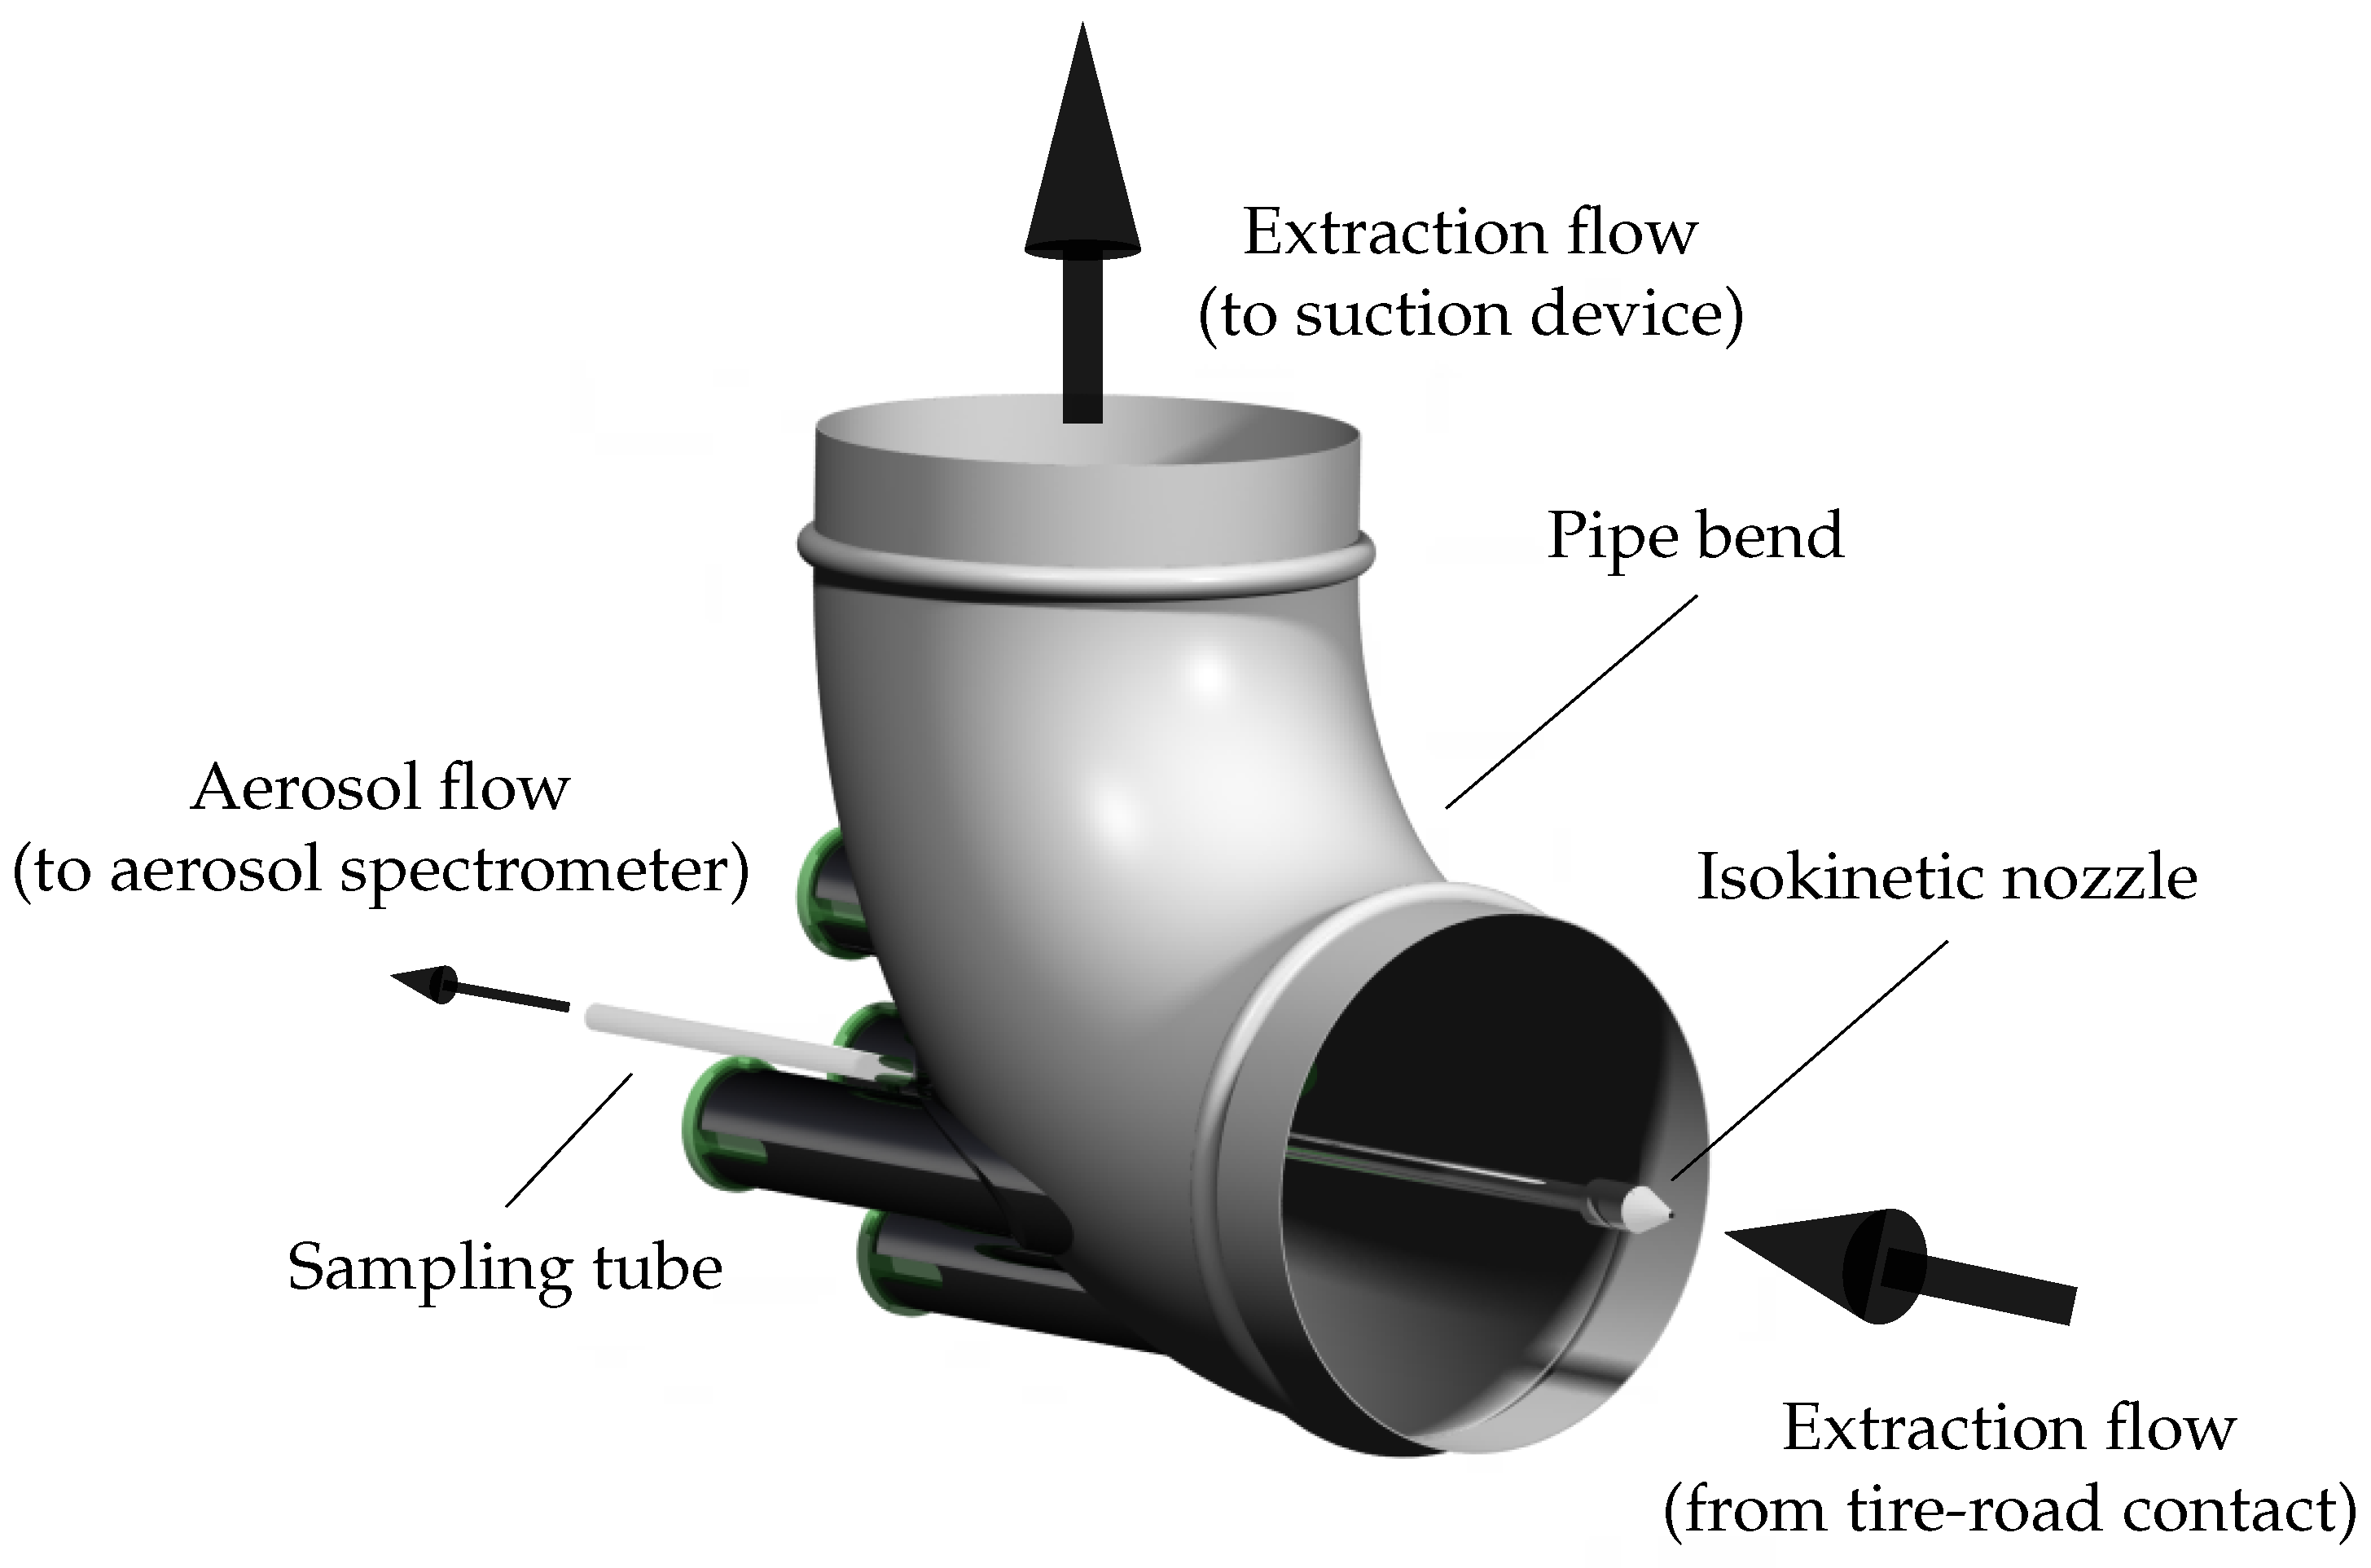
To enable the investigation of PM emissions of both the tire and road, the test bench is equipped with a suction funnel, which is mounted directly behind the tire and follows the movements of the wheel. The funnel can be adapted to different tire diameters and widths and surrounds the rear part of the tire on an angle of approximately 70° leaving only a thin slit of about 10 mm. The funnel leads to a spiral hose (Ø160 mm) in which flexibility is needed to enable the examination of slip angles. The other end of the hose is fixed to a spiral duct (Ø160 mm), which leads to the suction device. In order to avoid losses due to electrostatic charge, metal tubes are used and the spiral hose is made of permanently anti-static polyurethane. Additionally both ends of the spiral hose’s wire are grounded.
The suction device vacuums the particles emitted in the tire–road contact patch with a suction flow of 1600 m3/h. The flow rate has been designed to achieve a flow velocity of 120 km/h in the slit between tire and suction funnel. As long as the driving speed and thus the flow velocity inside the drum is below this value, it can be assumed that emitted particles become reliably extracted. Moreover, using the suction flow and the drum volume, an average residence time of 13 s can be calculated, during which the entire air inside the drum is once completely exchanged. Following the suction flow on its route from the funnel to the suction device, it passes the sampling spot (see Figure 2), which is integrated into a bend of the suction duct, which allows for sampling without further bending. After, the aerosol arrives at the suction device, where it is filtered by a fine-dust filter (HEPA-14). In addition to the inflow from the drum, the suction device has a second inflow from the environment. Hence, the volume flow from the suction device into the drum is larger than the one from the drum back to the suction device, leading to a slight overpressure in the test bench. Contamination of the measurement results by particles from ambient air can thus be precluded.
For more information about the internal drum test bench at KIT, especially the equipment and extensions to enable PM emission measurements, see [29].
2.2. Measurement System
Particle mass concentration (PMC), particle number concentration (PNC), as well as particle size distribution of PM emitted by tire–road contact were continuously monitored using a light-scattering aerosol spectrometer system (PALAS Promo 2000 & welas 2500, Karlsruhe, Germany). The system is able to measure particles in four measuring ranges between 0.2 μm and 100 μm with a measuring rate of 1 Hz and has to be calibrated for each range using a special calibration dust (PALAS MonoDust 1500, Karlsruhe, Germany) [30]. For all tests in this study, the measuring range between 0.3 μm and 17 μm was used, whereby only particles with a diameter () smaller than 10 μm were considered for the evaluation. The fast response of the system allows for the correlation between individual driving conditions and the associated emission characteristics in real time. It works with an aerosol flow rate of 5 L/min and is able to detect particle number concentrations up to 4 × 10 #/cm3 without the appearance of any coincidences [31,32]. The system registers a scattered light pulse for each particle crossing the measurement volume. From the magnitude of the scattered light pulse, the particle size and mass can finally be derived. In this study, the conversion from light pulse to mass was performed by assuming a refractive index of the particles of 1.59, the occurrence of spherical particles with an aspect ratio of 1, and a standard density of 1 g/cm3. The sampling of the aerosol flow from the extraction flow is performed with an isokinetic sampling probe that was integrated into the build-up via a self-designed apparatus (see Figure 2), which ensures that the sampling probe is accurately aligned in parallel to the air flow. Furthermore, the apparatus’ design allows for the simultaneous measurement of PM emissions and the monitoring of flow speed using a dynamic pressure anemometer. Due to the continuous monitoring, isokinetic sampling can be ensured at any time.
In the design and construction of the sampling site, special attention was paid to minimizing particle losses. Therefore, the sampling probe consists of a straight stainless steel pipe, which is inserted in a pipe bend. Furthermore, the sampling location is based on ISO 9096:2017, according to which there should be no diversion of the volume flow for a length of five hydraulic diameters upstream from the sampling plane and for a length of two hydraulic diameters downstream from the sampling plane. A calculation for the entire particle size range from 0.3 m to 10 m showed no significant transport losses from the funnel to the aerosol spectrometer. This estimation was confirmed when, even after several weeks of testing, no deposits could be detected in the suction tube or the sampling probe.
2.3. Varied Parameters
Summer, winter, and all-season tires were investigated concerning their PM emission behavior under different driving conditions and ambient temperatures. All three tires were selected from the same premium manufacturer. All of them had the same dimensions, 255/40 R20, and the same load index of 101, making them suitable for passenger cars classified as F-segment or belonging to the luxury class. Choosing tires of the same dimension ensured that tire size did not have any influence on the results, and thus, the tire types with their respective profiles and materials could be evaluated exclusively.
Prior to any investigation, each tire was subjected to a run-in process to ensure the initial layer on the tires’ surface was removed and thus excluded from the emission measurements.
Furthermore, when comparing summer and winter tires, it had to be taken into account that these tires have different areas and periods of application. Considering that, the test runs were performed for two ambient temperatures. For summer tires, an ambient temperature of 25 is common while winter tires are recommended when the ambient temperature drops below 7 . Since ambient temperatures can vary quickly and many drivers do not consequently follow the legal recommendations for tire equipment, the test runs were also performed with the respective non-suitable ambient temperatures for both tire types, performing the entire test series at 25 , as well as at 5 . As all-season tires are appropriate for usage in both temperatures and for the purpose of complete comparability, their runs were also performed for both temperatures.
In order to investigate the different PM emission behaviors between tire types, two parameters were chosen: longitudinal and lateral force. Preliminary studies, as well as a literature review, had shown that these two have the most remarkable influence on emissions. To investigate the influence of these parameters, one medium and one severe load condition for both parameters were chosen. The remaining parameters were kept constant and will be investigated in future studies. For details about the varied and constant parameters, see Table 1.
2.4. Experimental Setup and Procedure
Two test series were conducted within this study. Both were carried out with the summer, winter, and all-season tires but at two ambient temperatures: 5 and 25 . In preparation for the tests, the air condition had been turned on several hours prior to the proper test runs, ensuring that all instrumentation and surroundings had the required temperature. In order to also represent a realistic case regarding tire inflation pressure, it was adjusted after the target ambient temperature had been reached.
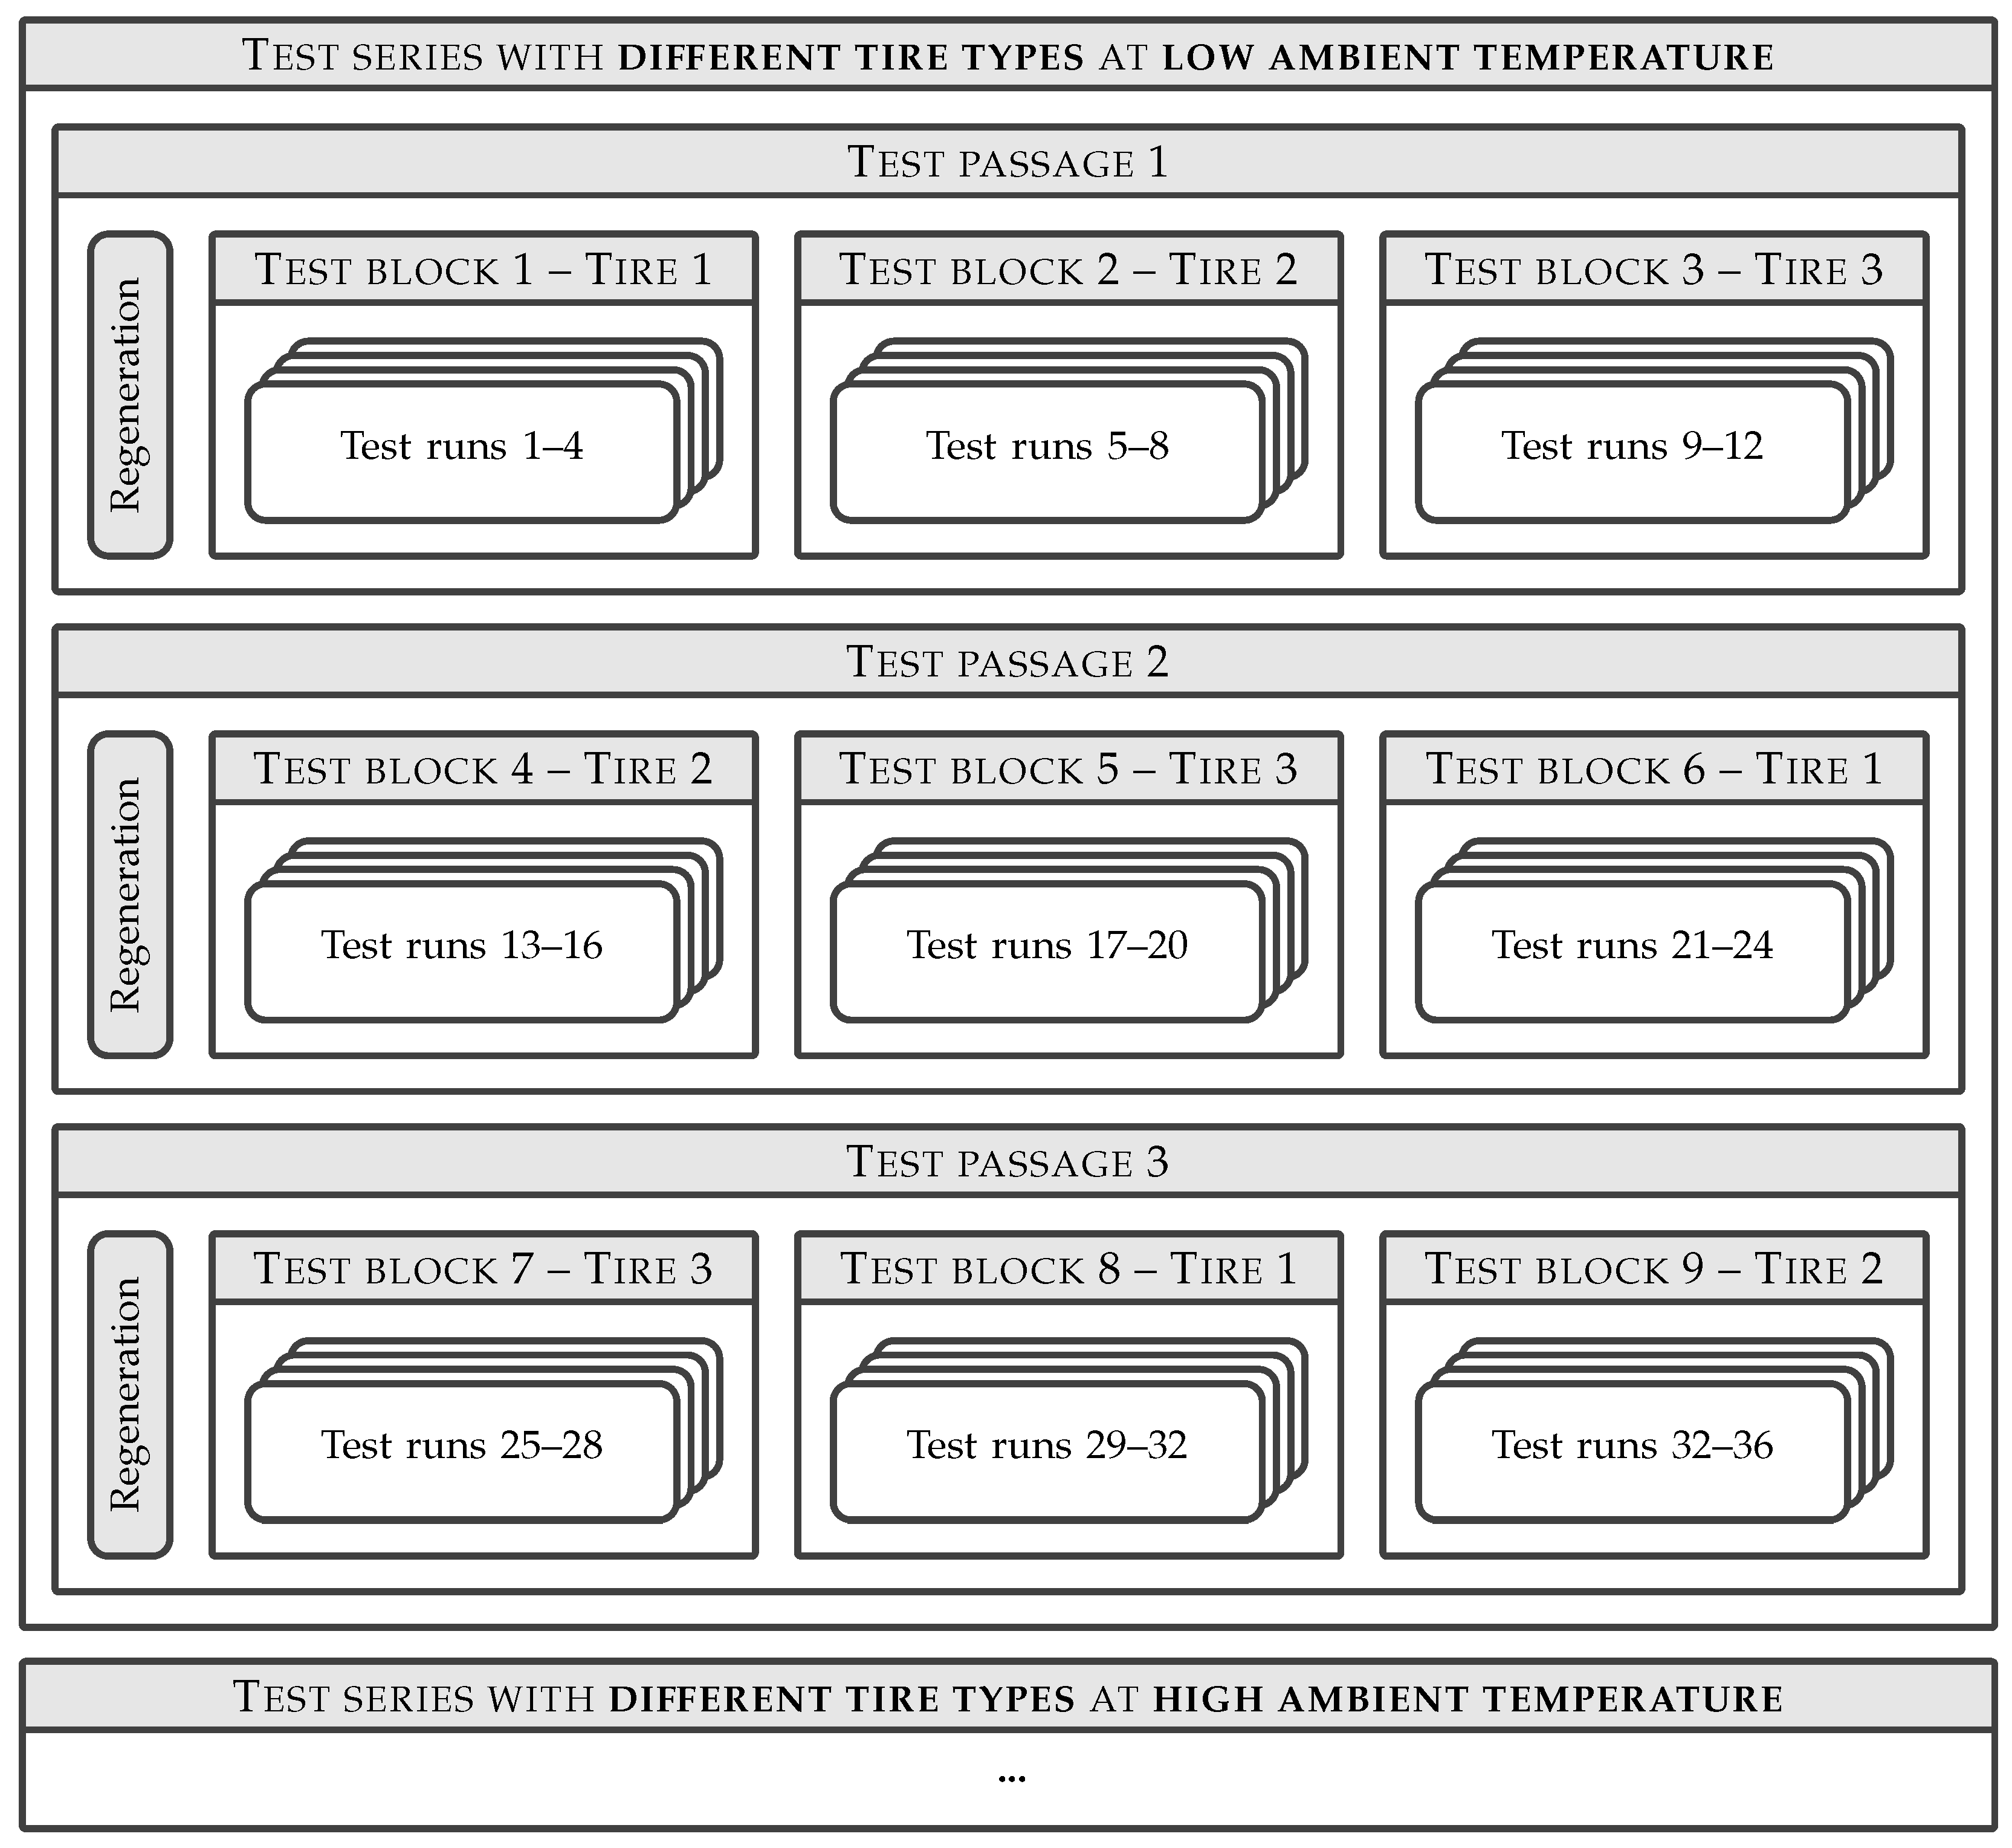
Moreover, aiming to generate meaningful results, each load condition was approached several times. This was because as preceding investigations had shown, the condition of the road surface changes during even single test runs, thus influencing the PM emissions. Caused by the constant rolling-over of the tire, the roughness, more specifically the skid resistance and thus the abrasiveness of the road surface, decreases continuously. This process also takes place on open roads, but on the test bench, it happens faster due to the tire passing the same surface section over and over again. As this adverse influence of the road surface could not be avoided, it had to be further investigated in order to be able to take it into account when processing and analyzing the data. To do so, three test passages consisting of three test blocks (one per tire) were performed in each test series. Further, each test block consisted of four individual test runs. The road surface was regenerated at the beginning of each passage by driving with a studded tire with a slip angle. The order of the tires was varied within the test passages to make sure that each tire was tested on each road surface condition. The skid resistance of the road surface was measured before, in between, as well as after the test blocks, using a skid resistance tester (SRT, Munro-Stanley London, England) according to EN 13036-4:2011 [33]. For a better understanding of the test series conducted, see Figure 3.
The subsequent test runs were subject to a defined procedure. First, the tire was driven until it reached a minimum tread temperature of 28 . After, 10 g of a sand mixture comprising quartz, corundum, and calcium carbonate was introduced as third-body material in order to keep the tire from becoming sticky. Previous tests had shown that the complete absence of soiling on the road surface would change the tire surface and thus completely inhibit the emission of fine tire and road wear particles (TRWPs). As the tire surface becomes sticky, the majority of the abraded wear particles are not emitted but stay stuck to the tread. The few particles leaving the tread are much bigger in comparison with the particles emitted on open roads. Periodically adding the sand mixture can prevent the occurrence of this effect without contaminating the subsequent measurements of the aerosol spectrometer. The decisive factor in avoiding contamination of the measurements is that the lower threshold of the sand mixture’s size distribution is higher than the biggest particles to be measured. In order to also avoid strong turbulence of the sand due to the air flow inside the drum, the speed was reduced to 50 km/h and the suction device was turned off before adding the sand. This ensured that a large portion of the added sand reached the road surface and could act in the tire–road contact patch. After 5 min, the suction device was turned on again in order to extract the sand added before. When both PMC as well as PNC had roughly dropped to the level that had existed before adding the sand (maximum PNC to start a test run: 10 #/cm3), the actual test run began.
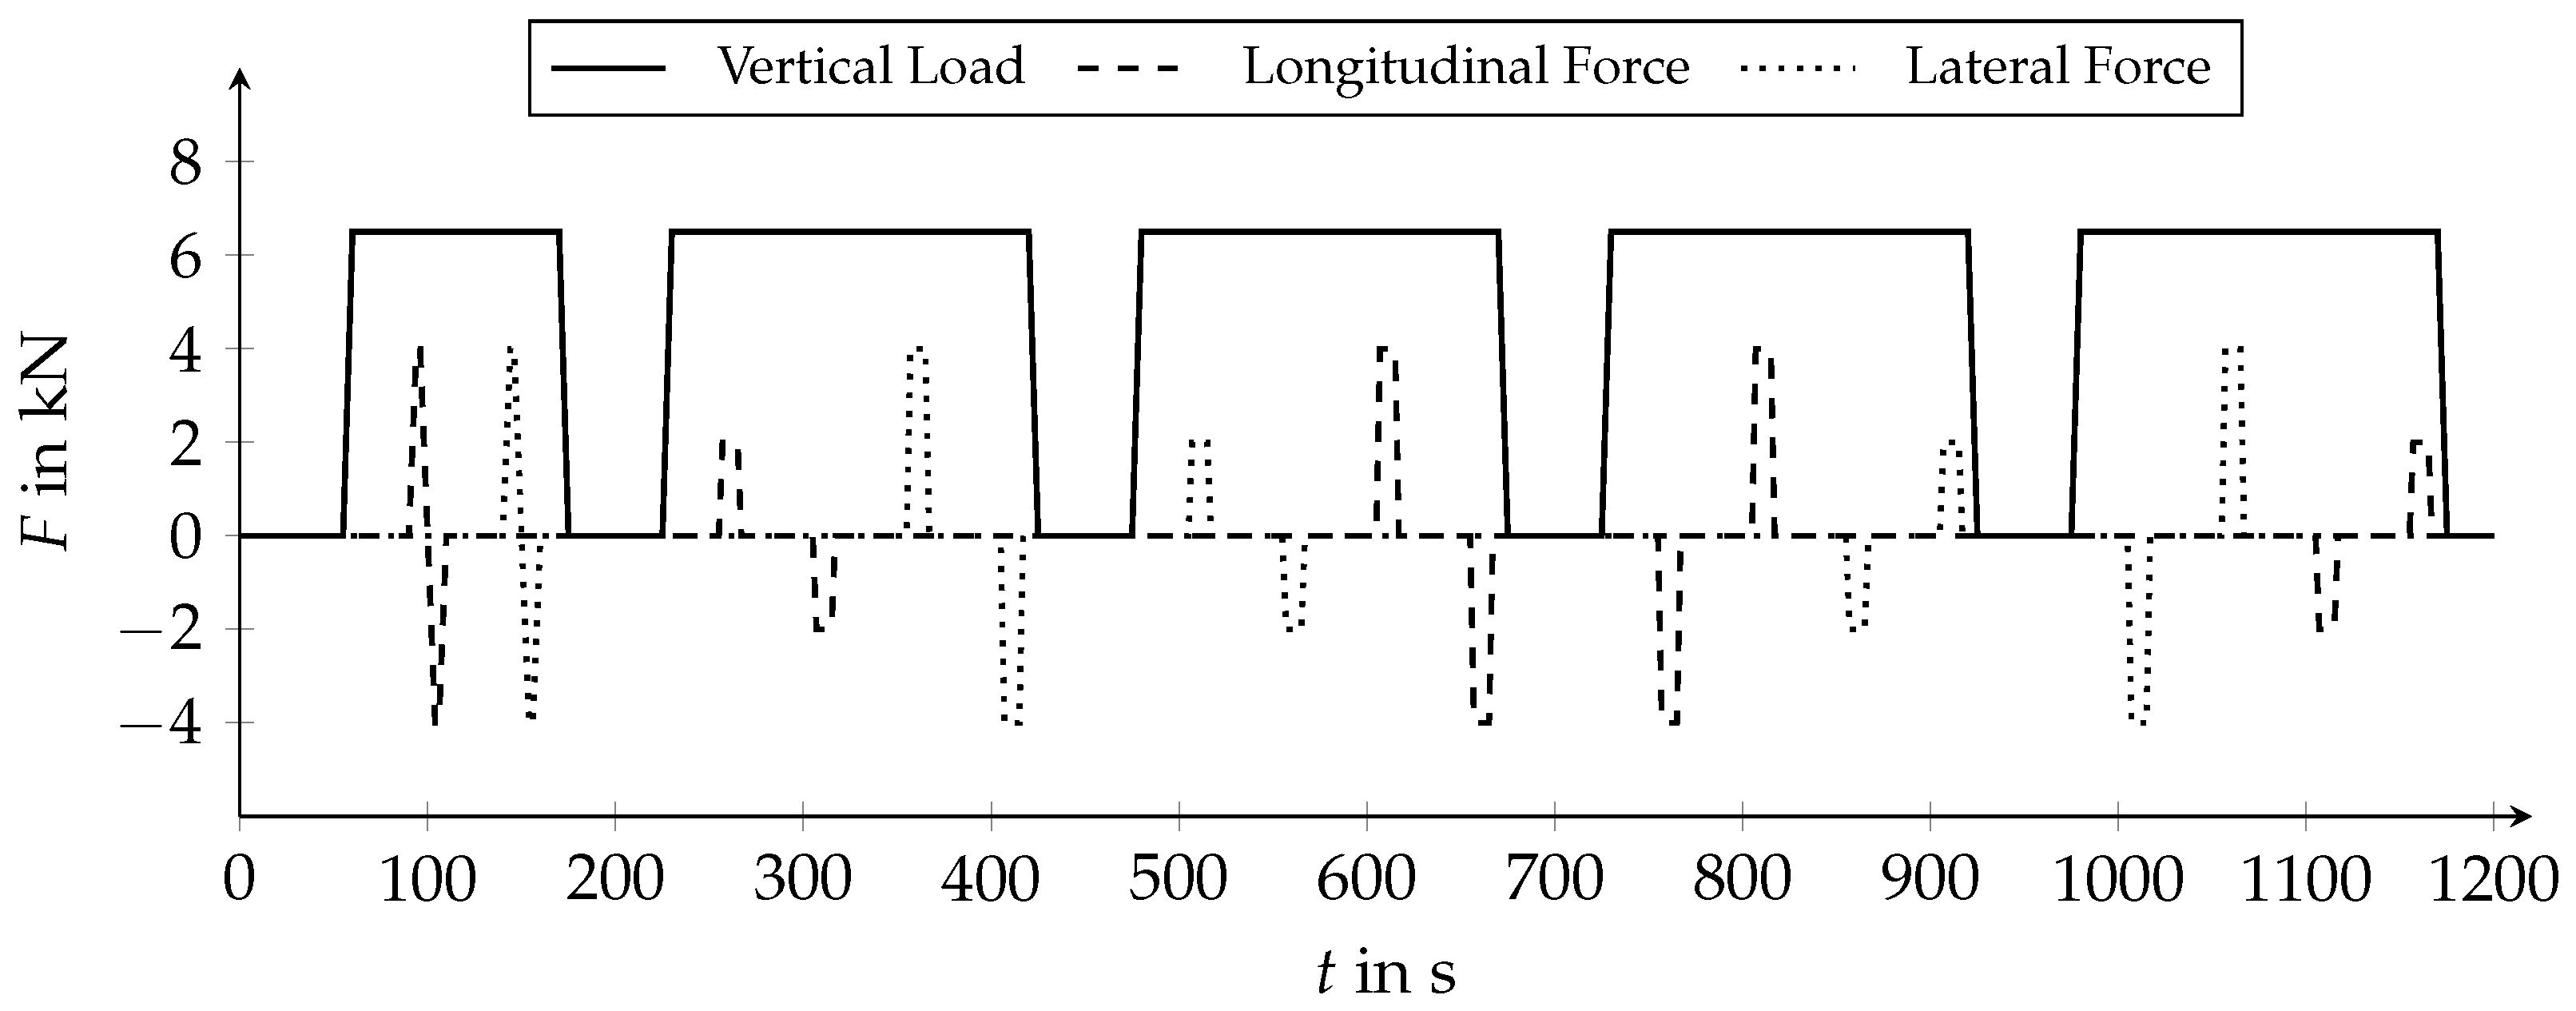
A test block of one tire consisted of four single runs of 20 individual load conditions, 10 for longitudinal and 10 for lateral forces. Between the individual load conditions, there was always an unloaded or freely rolling phase, during which the tire could cool down and the particle concentrations could drop. At the beginning of each test run, the drum was accelerated to the driving speed of 80 km/h. After, the largest longitudinal and lateral forces contained in the test block were applied, aiming to stir up and vacuum sand remaining on the road surface. These four initial load conditions were not considered for the later analysis. Subsequently, each load condition was approached twice, varying the order among the test runs. Since preceding tests had also shown that the tire tread profile adapts to its load, resulting in fewer emissions, care was taken that the load conditions were always alternated. A load condition with a negative longitudinal force was therefore always followed by one with a positive longitudinal force and vice versa. The same was true for lateral forces. An exemplary test run is shown in Figure 4.
In total, 72 of those test runs were performed, 6 test passages with 12 test runs, respectively. The application of all forces was controlled, while the other variables were kept constant. PMC and PNC were recorded throughout the test runs.
3. Results
3.1. Analysis of Data
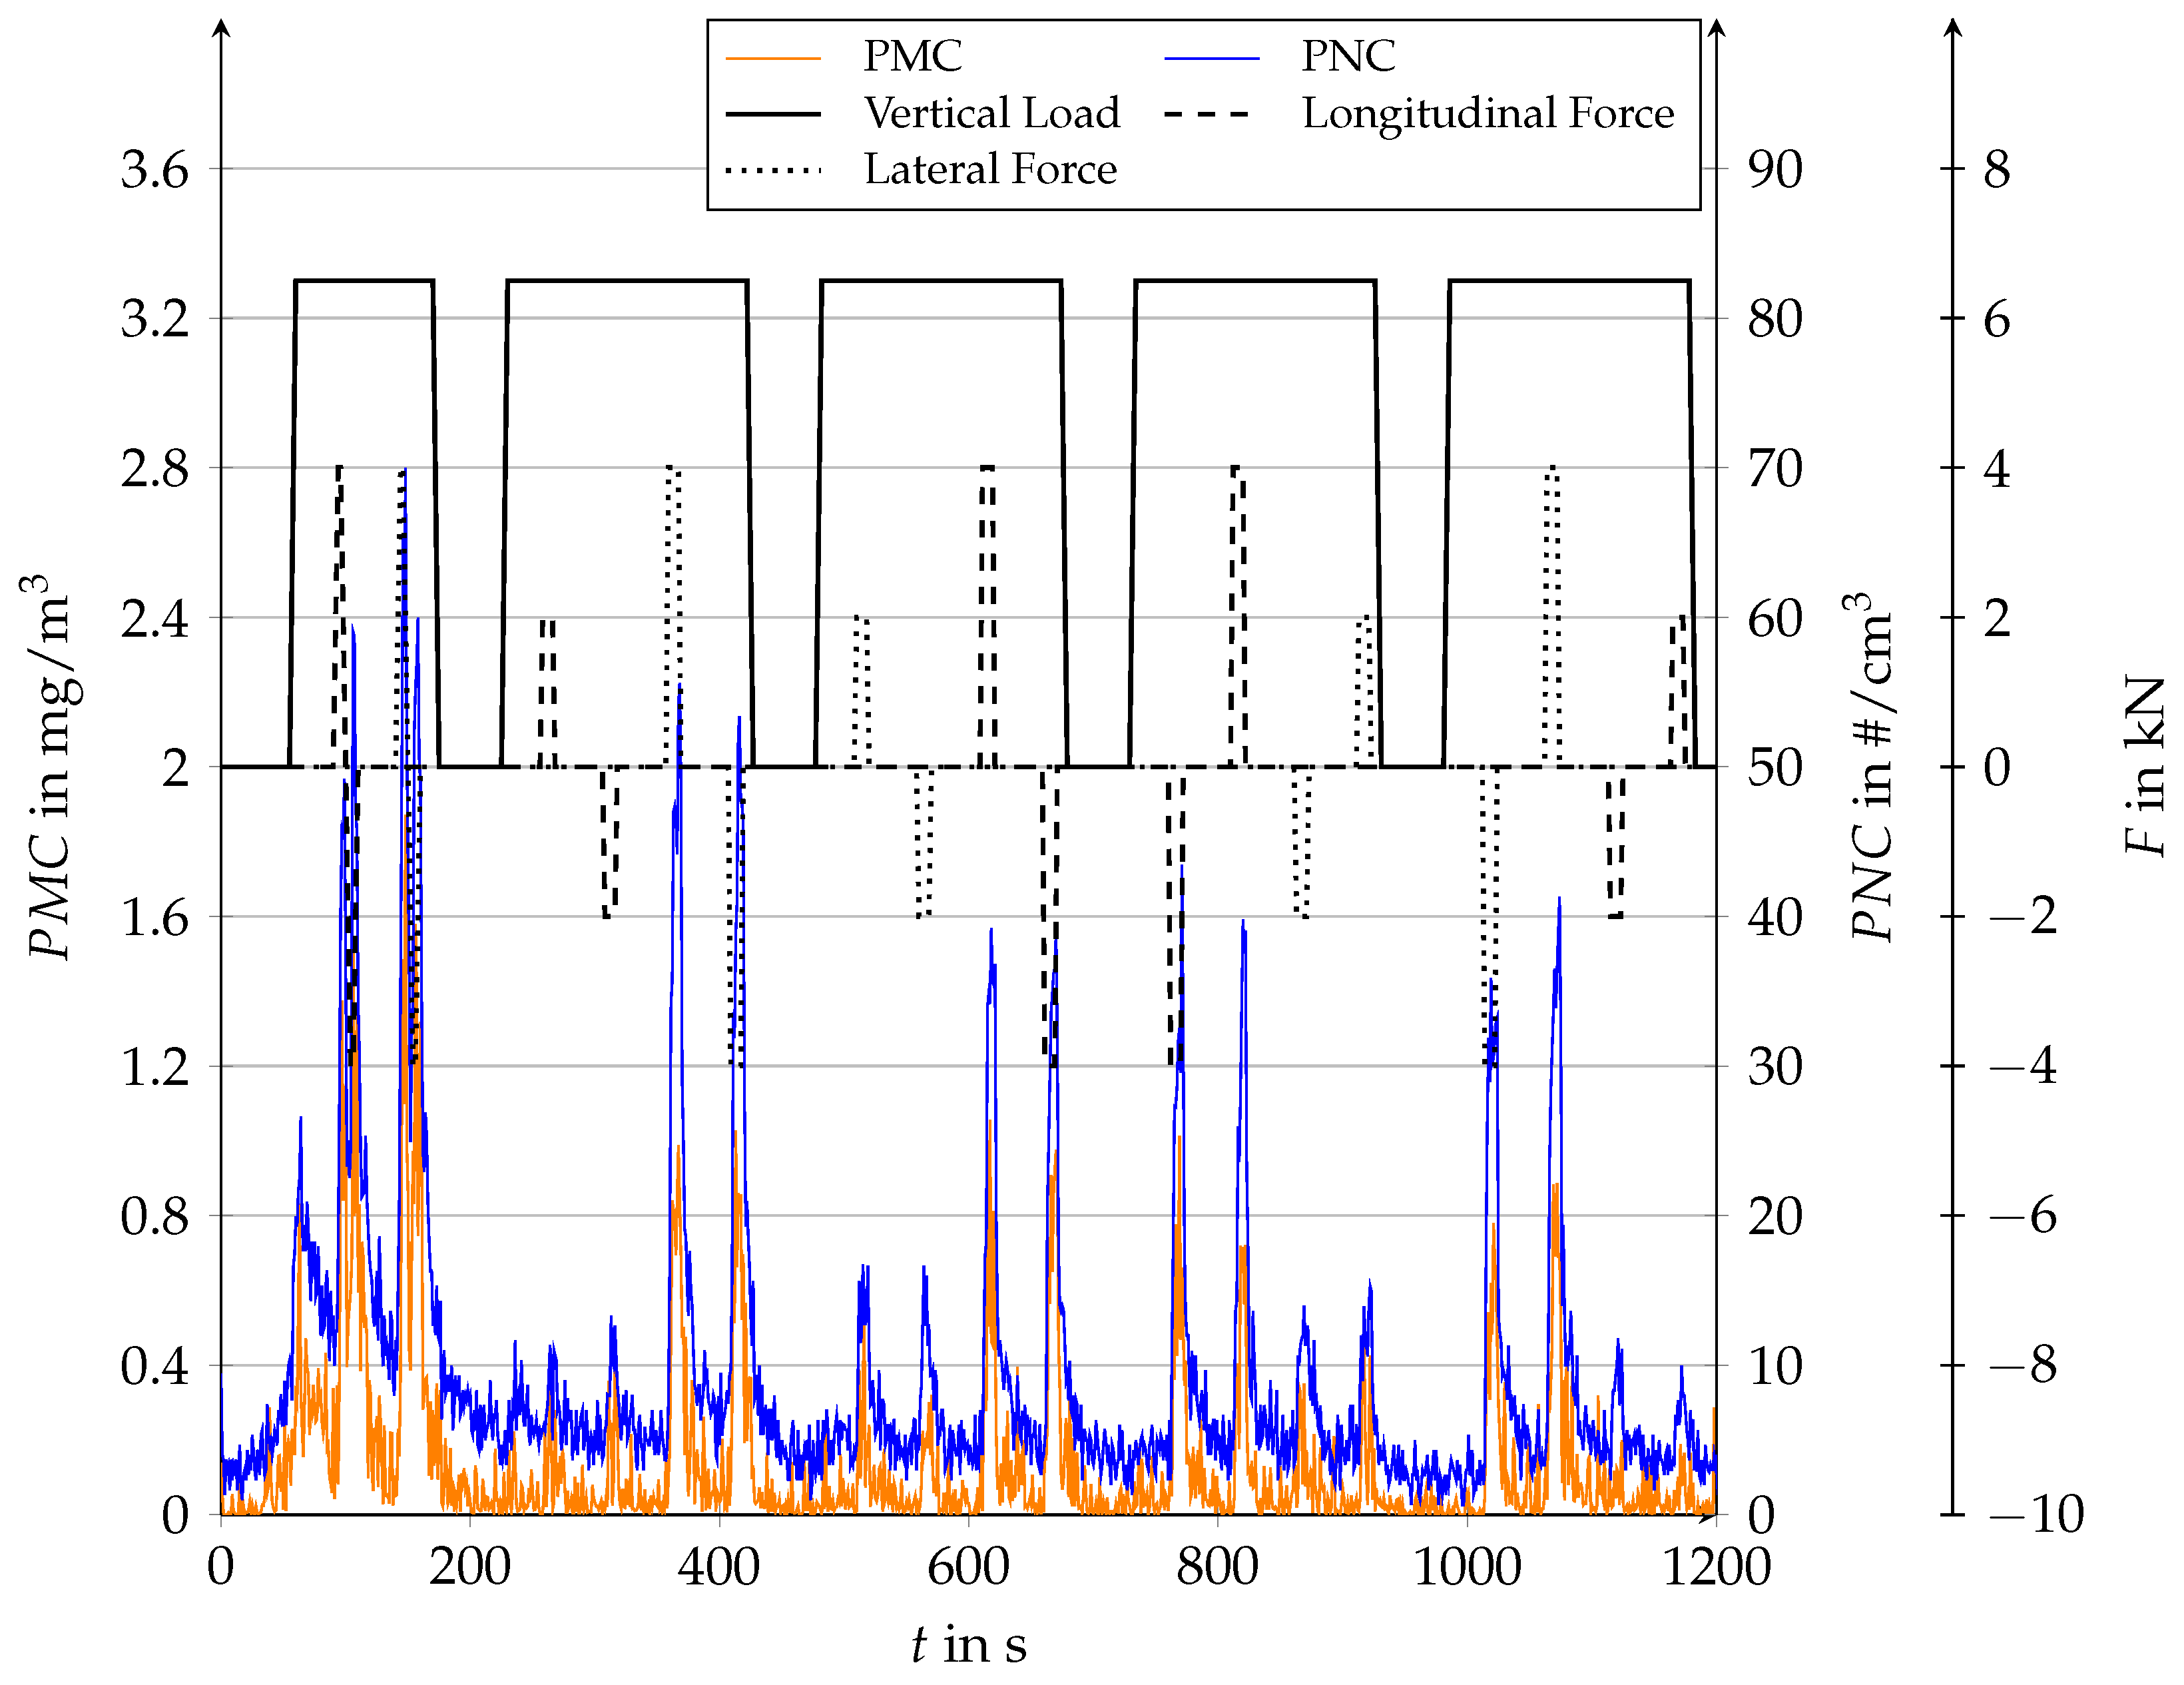
The graphs for PMC and PNC are shown in Figure 5 for an exemplary test run using the program shown in Figure 4. It can be clearly seen that at the beginning of the test run, both PMC and PNC were at low levels, rising weakly at first and then abruptly. The slight increase was caused by continuous acceleration to the measuring speed of 80 km/h (tire still lifted), which led to the resuspension of sand fragments still in the drum by the stronger air flow or greater turbulence. The abrupt increase at 55 s occurred due to the settling of the tire and the associated stronger resuspension of particles still sticking to the roadway. The two subsequent double peaks (between 90 s and 160s) were generated by starting and briefly holding the maximum longitudinal and lateral forces (respectively, positive and negative) in order to remove the last residues of sand.
After this initial run-in procedure, the load conditions were applied, in which associated emissions were taken into account in the subsequent evaluation. Each peak in emission can be clearly assigned to one load condition. Low ones led to low emissions, while for high loads, the emission increased significantly. This statement applies to both PMC and PNC.
In addition to the peaks caused by the intended loads, noise can also be detected in both curves over the entire measurement period, which is due to the combination of the high measurement frequency and the small aerosol flow. However, due to the fact that the peaks clearly stand out from the noise in their magnitude, this interference signal is of secondary importance.
To compare the different tire types and temperature levels with respect to the load conditions, emission values were assigned to the individual load conditions, which were calculated on the basis of the recorded concentrations. The comparison of representative emission values for each load condition is preferable to the direct comparison of the concentration graphs, since the emission behavior occurred individually for each load. For example, in the case of heavy loads, the emission of particles still took place some seconds after the actual load phase. Therefore, in order to include any emission caused by the load condition, a longer period of time was considered for the emission calculation for all load conditions. This period ended as soon as the concentrations had fallen back to the level prior to the load.
Furthermore, it had to be taken into account that not the entire PM emission detected during the load originated from the current load. Even before, low but nevertheless non-negligible concentrations were present. These consisted of the so-called background concentration. In order to calculate the actual emission for the respective load condition, this proportion that would also exist without any tire–road contact had to be subtracted. The background concentration was not measured prior to each load condition, since in order to do so, the wheel would have had to be lifted for a longer period of time, which would have multiplied the time required for a whole test series. The background concentrations of particle mass and number present at the respective point of time during a measurement block were therefore calculated considering the starting values each time the wheel was set down (225 s, 475 s, 725 s, and 975 s) and using regression curves describing the standard drop for both PMC and PNC inside the test bench. The mathematical basis of this standard drop had been previously determined empirically by evaluating the concentrations after numerous different load conditions. The background concentration values calculated in this manner were finally subtracted from the values used to calculate the total emission, resulting in the net emission for each individual load condition.
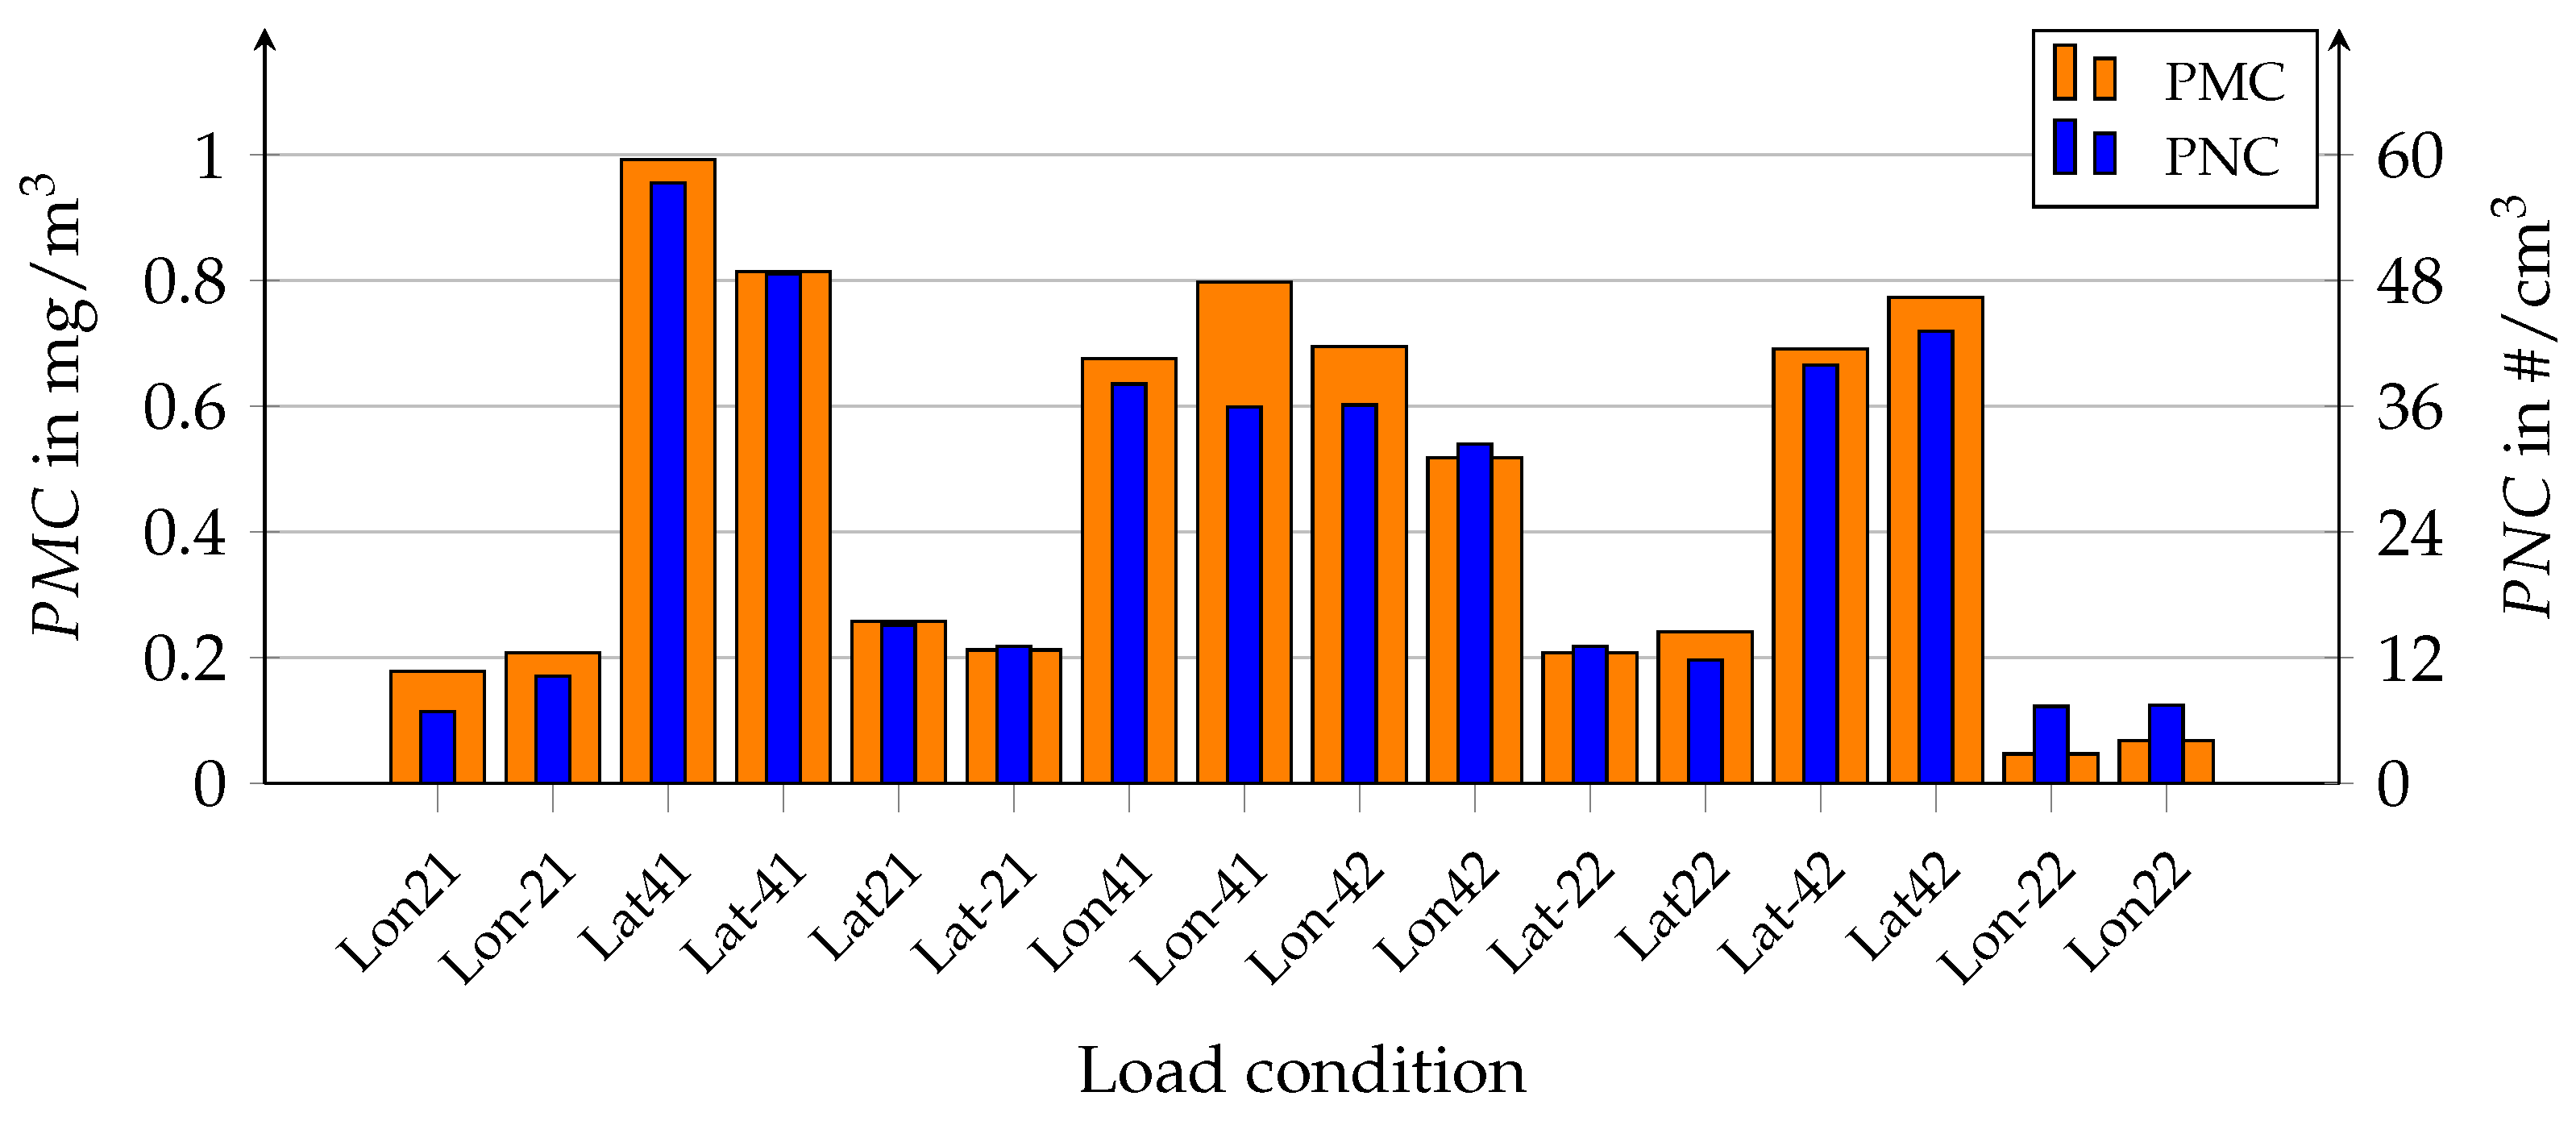
The result of the calculation is illustrated in Figure 6. The initial procedure for removing the last sand fragments is no longer included, nor are periods with the wheel lifted off or rolling freely. The diagram only shows the phases that are necessary to calculate the emissions of the individual load conditions. Loads abbreviated with “Lon” stand for longitudinal forces and loads abbreviated with “Lat” stand for lateral forces, each supplemented with the force applied in and another digit to indicate the repetition. The height of the peaks contained in Figure 5 is reflected here. It is again clear that higher loads lead to higher emissions for both PMC and PNC. However, a close comparison of the peak heights shows that the ratio between the individual peaks has changed, which is caused by the different emission behavior explained earlier. That no longer plays a role in this representation, which only represents the net emission caused by the respective load condition.
As described in Section 2.4, the condition of the pavement was measured before, during, and after each test passage (four measurements in total) using an SRT pendulum in order to be able to quantify the influence of the skid resistance on the emission. The results of these measurements have shown a high reproducibility, so that very similar trends were observed when comparing the SRT value trends for the single passages. In order to be able to calculate the skid resistance between the individual SRT measurements, i.e., during the test runs, the measured values were used to compute power functions as regression curves. The SRT curves of all runs were combined by averaging to form a curve on which all calculations were based. This standard curve for one test passage is shown in Figure 7. The highest SRT value occurs immediately after roughening/regenerating. The subsequent driving-over causes the skid resistance to drop sharply at first and to become weaker with ongoing tests.
Using the standard SRT curve, the currently present SRT value could be calculated for each point of time during the test runs and was assigned to the respective load condition. For each passage, the curve was therefore divided into 192 intervals, each of which could be assigned to one individual load condition. It was taken into account that the load conditions had different severities, and accordingly, the condition of the pavement did not change uniformly but according to the severity of the respective load. For this purpose, it was assumed that longitudinal and lateral forces abrade the road surface to the same extent and that there is a linear relationship between the force applied and the intensity of the road wear. Since, apart from longitudinal and lateral forces, all other parameters such as wheel load, speed, and camber angle were kept constant, this assumption is plausible. The incremental progression of SRT values, on which the subsequent correlation with the emission values is based, is also shown in Figure 7. The first 16 intervals correspond to a decrease in the SRT value as would occur for one test run, as shown in Figure 4. To illustrate the incremental decrease, a section of the curve is shown magnified.
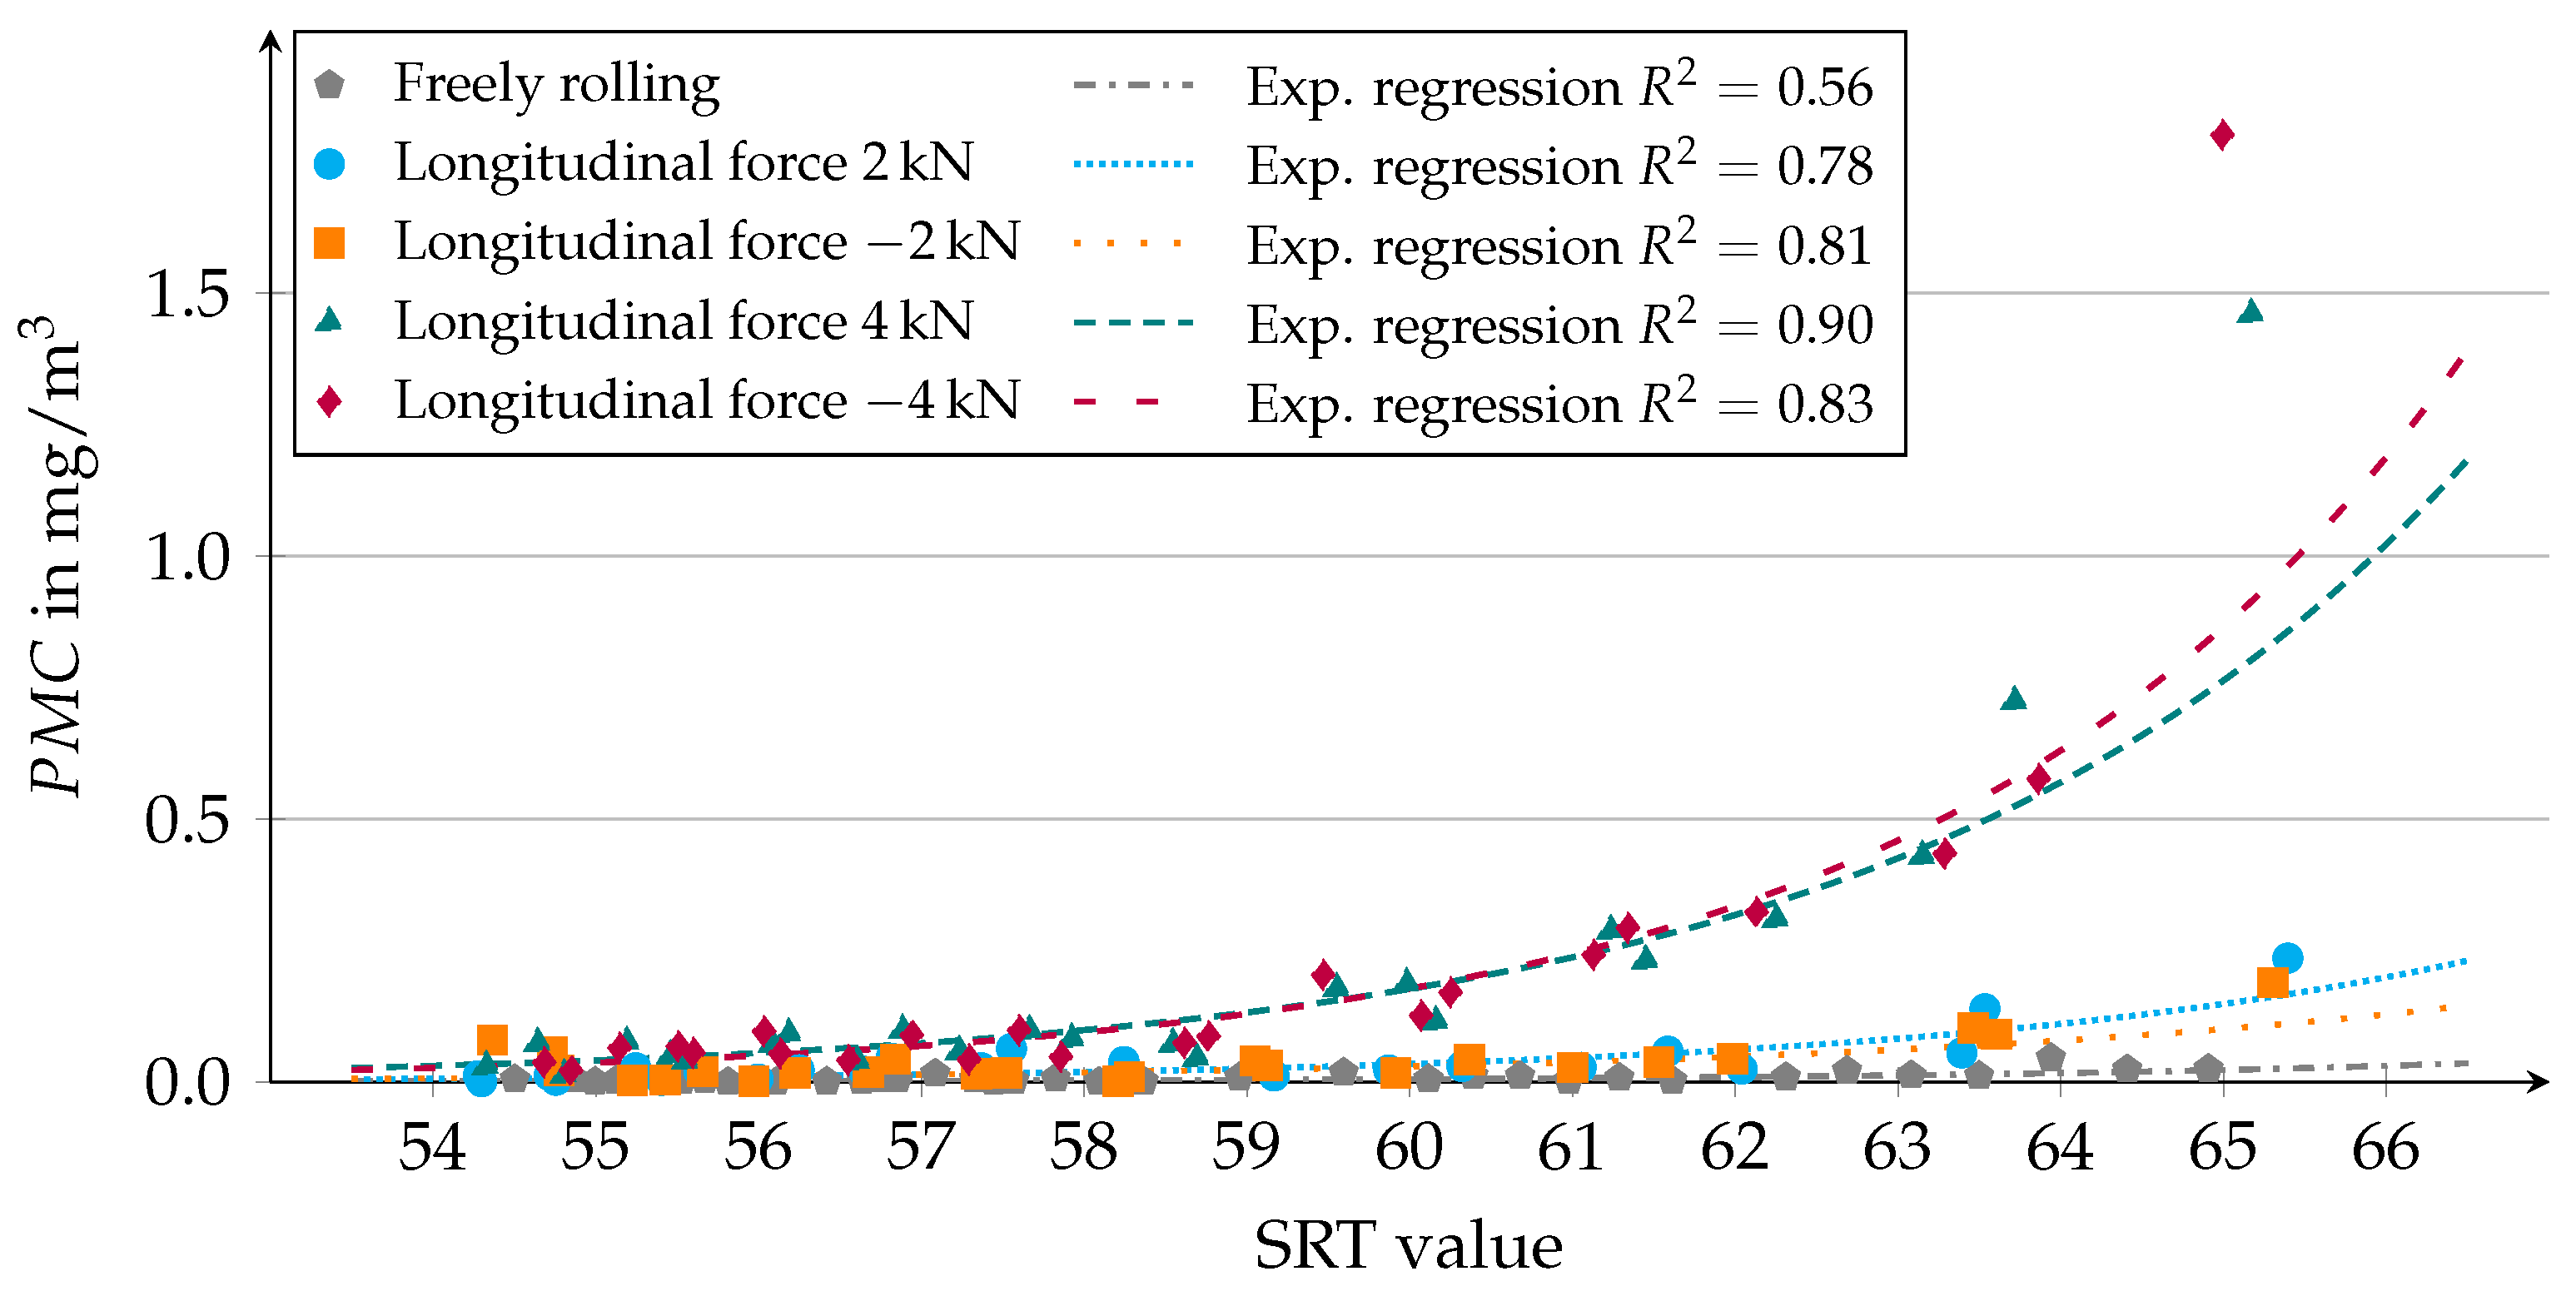
The pairs of values, each comprising one SRT and one emission value, were finally linked for each tire for PMC, as well as for PNC. Identical loads at different points of time during the test series, i.e., at different SRT values, were combined to form one curve. Such exemplary curves, which show the influence of skid resistance on PMC when driving with a summer tire, are shown in Figure 8 for different longitudinal forces.
By varying the order of the individual load conditions between and within the test passages, as described in Section 2.4, pairs of values for the entire SRT range were obtained for all load conditions and tires. However, it can be seen that the horizontal distance between the individual points is large for high SRT values and decreases with declining SRT value. This is caused by the fact that the drop in skid resistance directly after the regeneration of the surface was fast at first and continuously slowed down, so that less load conditions were performed at high SRT values than at low ones.
Also shown are the coefficients of determination , which were calculated to be between 0.78 and 0.9 for conditions with longitudinal forces, indicating a good correlation between SRT values and the measured particle mass concentrations. Only for the freely rolling condition is the coefficient of determination significantly worse, which is probably due to the larger percentage of the background concentration.
The continuous decrease in emission together with the SRT value described above is also pronounced here, so that a longitudinal force of 4 kN at an SRT value of 66 causes a particle mass concentration, which is approximately five times higher than at an SRT value of 60. It is also particularly noticeable that the first value of each curve lies far above all others and thus above the regression curve. The initially extremely high value and the subsequent strong decrease are presumably caused by the effects of the surface resharpening, whereby tiny peaks are generated in the asphalt structure, which are directly removed during subsequent load conditions and are emitted as fine dust. Once these tiny peaks have been abraded, the decrease in the skid resistance slows down and the emission drops.
Finally, statements regarding the influence of the longitudinal force on PMC can be made on the basis of Figure 8. On the one hand, it can be seen that there is a significantly smaller gap between the emission for the freely rolling tire and loads with kN than between the latter and loads with kN. This indicates a disproportionate or progressive increase in PMC over the longitudinal force. On the other hand, it can be seen that the curves for positive and negative loads of the same value have similar slopes, which means that this tire has a similar emission behavior with regard to PMC for driving and braking forces.
Based on several data sets, as shown in Figure 8, the final results of the study were derived. For this purpose, the emission values for equal load types (longitudinal and lateral force) were plotted over the load magnitude. By using regression models, this resulted in emission functions depending on the respective parameter. The results for PMC and PNC when applying different types of load are presented in the following section. This is followed by two sections dealing specifically with the influence of tire type and ambient temperature.
3.2. Influence of Load Condition on PM Emission
Figure 9 shows the influence of longitudinal forces on PMC and PNC for the summer tire at its typical ambient temperature of 25 . The emission values obtained from the previous diagrams are plotted as points approximated by regression curves. These were created separately for positive and negative forces but calculated so that there was no slope at the zero passage. The SRT value of 60 chosen for the plot corresponds to the acceptance value for new road surfaces [34] recommended by the German Road and Transportation Research Association (Forschungsgesellschaft für Straßen- und Verkehrswesen, FGSV).
It can be seen that both particle concentrations increase significantly when longitudinal forces are applied. This is true for braking and driving forces. With the applied vertical load, the forces of 2 kN and 4 kN correspond to adhesion utilizations of 0.31 and 0.62, respectively. Transferred to an entire vehicle in which all four wheels are equally loaded, this would result in accelerations of 3 m/s2 ( g) or 6 m/s2 ( g) in the longitudinal or lateral direction. The high forces are already outside a normal driving mode and lead to correspondingly high emissions. Furthermore, the tire seems to emit similar amounts for both force directions. Despite separate approximation, almost axisymmetric curves are obtained. These regression curves correspond to quadratic functions and are supposed to show the disproportionate increase over the forces. For both concentrations, the curves overestimate the emissions for loads of kN, which means that a function of higher order could be better suited to approximate the real course of the particle concentrations.
Furthermore, it generally looks like the two concentrations increased in the same manner. However, a more precise evaluation of the values reveals that PMC increases stronger than PNC. While PMC shows increases to about 35-fold for forces of kN compared with the freely rolling condition, increases to only 15-fold are seen in PNC, indicating changes in the particle size distribution depending on the driving condition. A more precise evaluation of the particle size distribution is given in Section 3.5.
Similar graphs are shown in Figure 10 for lateral forces. The displayed positive half of the plot contains the mean values of concentrations recorded for positive and negative lateral forces. It was found that the emissions for positive and negative lateral forces were different. Since the emission for all tires was higher for positive than for negative lateral forces, this phenomenon is more likely to be due to a flow influence in the test bench rather than a direction-dependent emission from the tires.
Again, the approximated courses of concentrations are represented by quadratic regression curves. For both concentrations, the quadratic functions seem to represent the progression well. When comparing with the curves for the longitudinal force, it can be seen that lateral forces lead to concentrations more than two times higher than longitudinal forces. The evaluation of the relative increases in both concentrations also shows differences for lateral forces. While PMC increases by a factor of about 100 at a lateral force of 4 kN compared with the freely rolling condition, PNC only increases by a factor of 40, so that changes in the particle size distribution must also take place here.
3.3. Influence of Tire Type on PM Emission
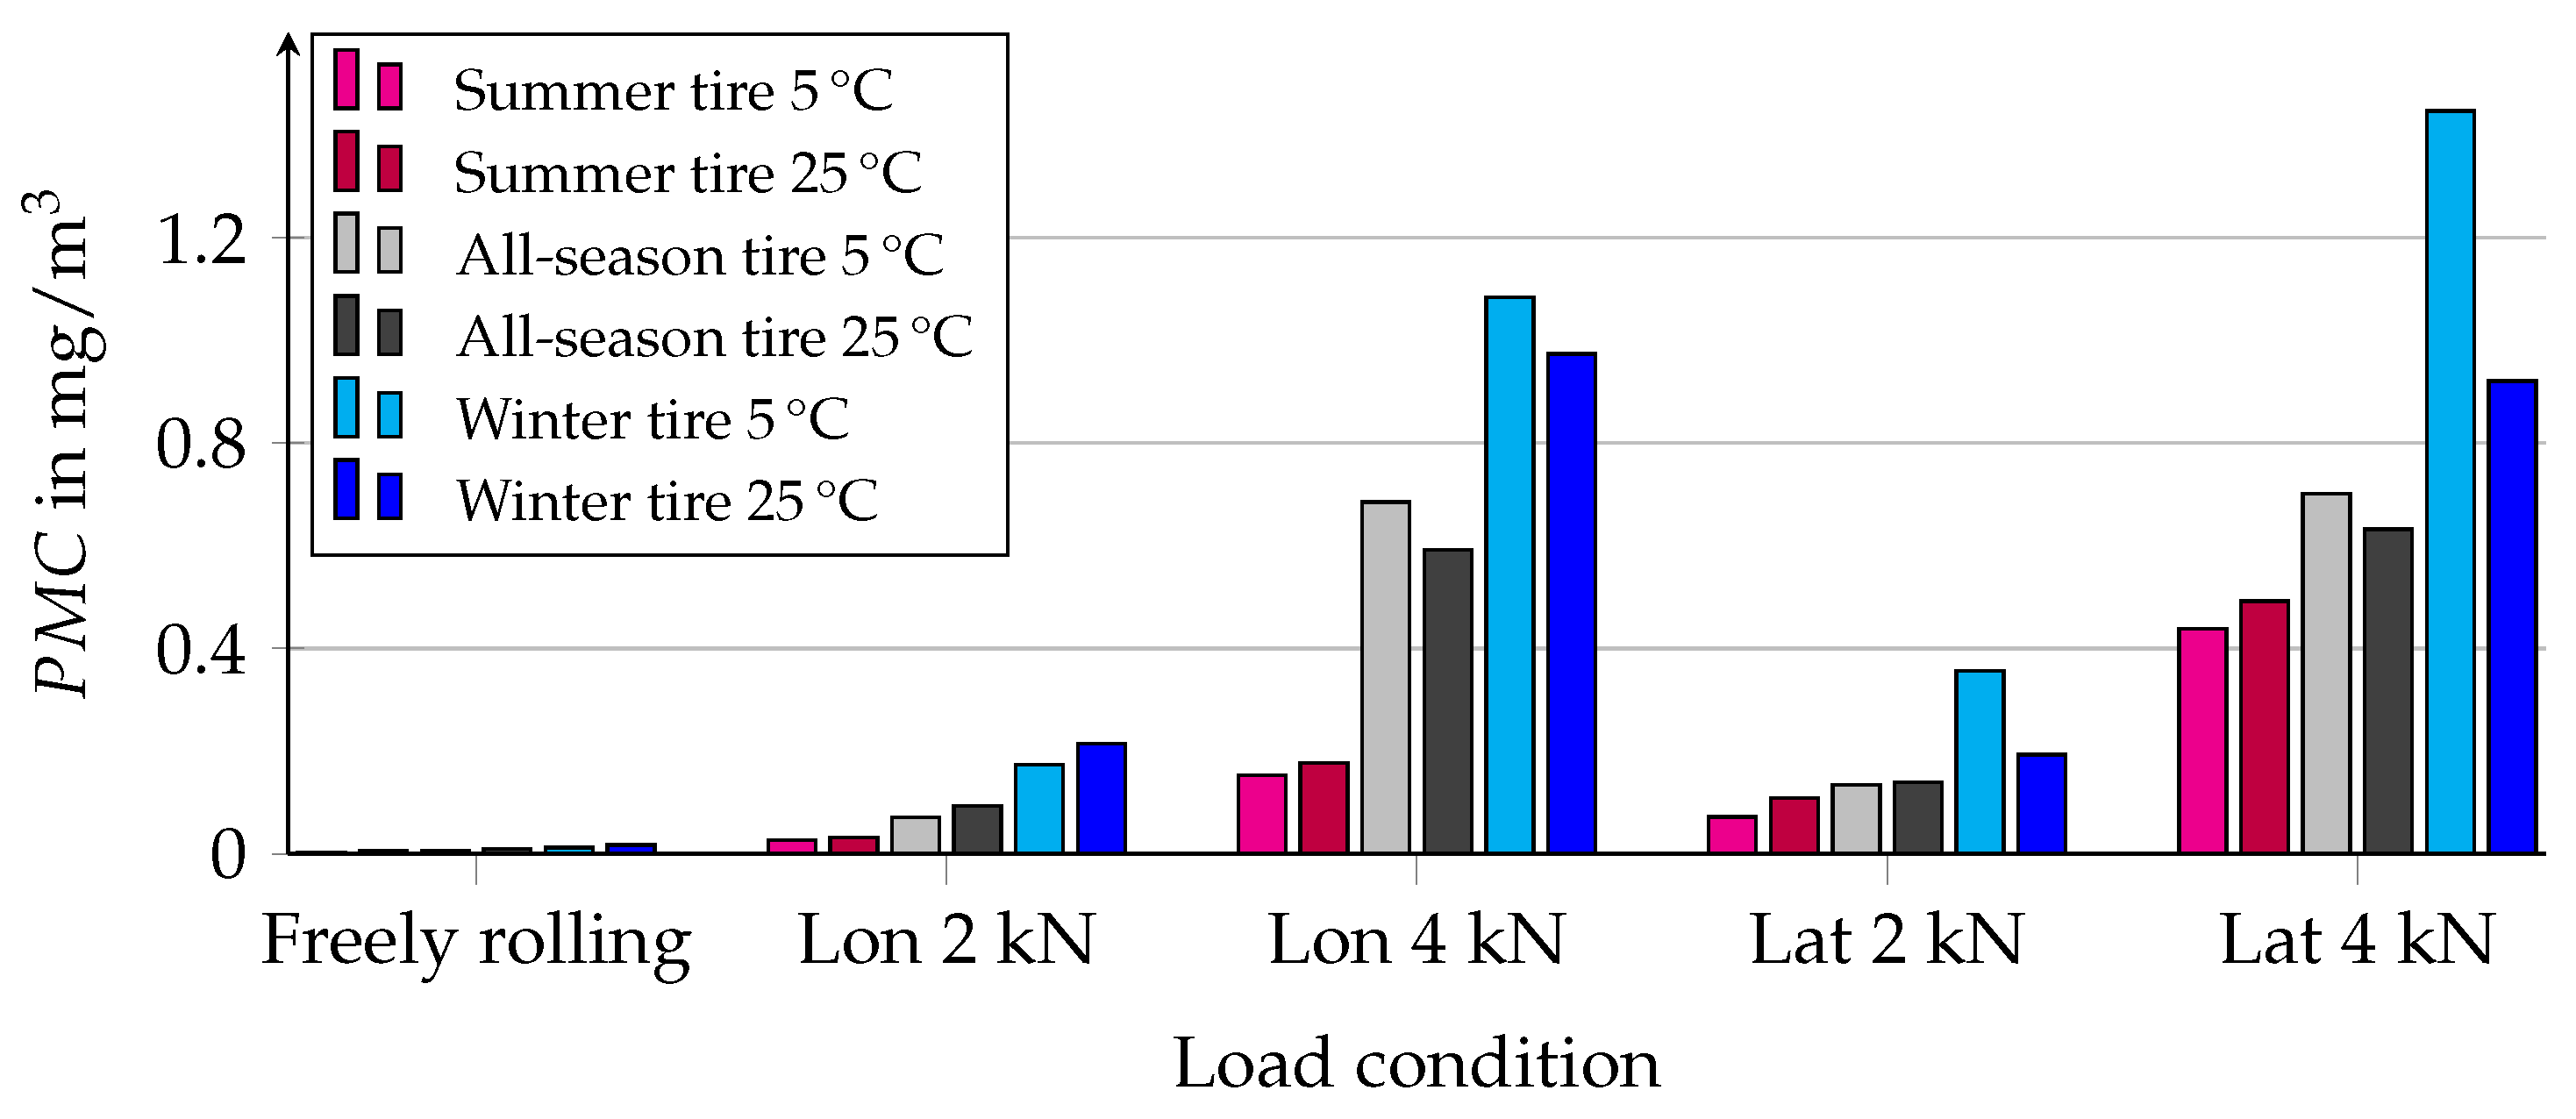
To investigate the influence of the tire type, the particle concentrations for different load conditions and tire types are shown in Figure 11. The values for summer and winter tires are taken from the test series of the ambient temperature typical for the respective tire: 25 for the summer tire and 5 for the winter tire. For the all-season tire, the mean values of both test series are shown. All values represent the mean values of positive and negative longitudinal and lateral forces, respectively.
It can be seen that the winter tire leads to, by far, the highest concentrations across all loads. As expected, the emissions of the all-season tire are between the summer and winter tire for all load conditions. With regard to PMC, the loads with longitudinal forces for the winter tire lead to six times the emission compared with the summer tire and to about twice the emission compared with the all-season tire. For lateral forces, these factors are around 3 and 2.5. Only in the case of freely rolling driving, when no other forces but the vertical load were applied are the emissions significantly closer together.
PNC (see Figure 12) shows similar proportions. The summer and all-season tires are on a par for the freely rolling condition, while the winter tire produces about twice the amount of emissions. For longitudinal forces, the winter tire produces 3 to 5 times the emissions of the summer tire, and 1.5 times the emissions of the all-season tire. For lateral forces, these increases are a factor of 2.5 compared with the summer tire and about 2 for the all-season tire.
The factors which exist between PMC and PNC at the same load conditions are in a very similar range in each case, indicating that all tire types result in similar size distributions for particle fractions smaller than 10 m.
Another interesting aspect is the trend of emissions of the different tire types when loaded with forces in different directions. For the summer tire, a load of 4 kN in the longitudinal direction leads to an emission that is 35 times the particle mass of the freely rolling condition. The same force in the lateral direction leads to a factor of 98. For the all-season and winter tires, these increases are closer to each other, with 80 and 83 for the all-season tire and 90 and 123 for the winter tire, respectively. The increases in particle number are lower in absolute terms but comparable in terms of percentage. From that, it is clear that the tire types react differently to forces of different directions regarding emissions.
One possible explanation is the difference in tread design between the tire types. While the tread of the summer tire has no lateral grooves and hardly any lateral sipes but mainly longitudinal grooves, the treads of the all-season and winter tire consist mostly of individual blocks which are separated from each other by sipes and grooves in both the lateral and longitudinal directions. Additionally, the individual blocks are siped themselves. This means that the tread of the summer tire has almost continuous ribs and the tread edges extend only in the longitudinal direction of the tire. In contrast, the all-season and the winter tire have tread edges in the longitudinal and lateral directions. In the case of the summer tire, the absence of lateral grooves and sipes could lead to less deformation of the tire material and less edge wear if the tire is loaded in the longitudinal direction. In the case of the all-season and the winter tire, on the other hand, the individual tread blocks can deform or tilt independently of one another, so that edge wear can occur for both longitudinal and lateral forces.
3.4. Influence of Ambient Temperature on PM Emission
Figure 13 shows the influence of the ambient temperature on PMC for the three tire types and at different load conditions. For the summer tire, a higher temperature results in slightly higher emissions. For the all-season tire, the higher ambient temperature leads to higher concentrations for moderate loads and to lower concentrations for high loads. For the winter tire, high ambient temperatures lead to lower emissions in most cases. The maximum percentage between PMC under load at high versus low temperature are therefore 51% for the summer tire, between −14 and 31% for the all-season tire, and between −46 and 24% for the winter tire.
For PNC, the differences in emissions for the same tire types in different ambient temperatures are mostly smaller than those for PMC, resulting in maximum differences of 45% for the summer tire, between −7% and 23% for the all-season tire, and between −36% and 62% for the winter tire. Since PNC shows the same trends as PMC, it is not presented separately.
However, different types of tires show different influences of the ambient temperature on both PMC and PNC. For the summer tire, a higher ambient temperature always leads to higher emissions. This tendency is also evident for the all-season tire at low loads. For higher loads and the winter tire, however, there is a trend reversal, so that higher ambient temperature leads to lower emissions. These different emission trends for summer and winter tires as a function of temperature are also described by Sjödin et al. (2010) [6] for their test bench experiments. One possible explanation could be the different rubber compounds of the tire types. The harder compound of the summer tire changes only slightly as a function of the ambient temperature, since the low temperature is only marginally outside its typical application temperature. The winter tire, on the other hand, has a much softer compound, and its application temperature is far exceeded at 25 . The resulting even softer tire compound of the winter tire could tend to emit larger particles that are outside the size range covered by the aerosol spectrometer. This would mean that the total tire wear could still increase with increasing temperature for the winter tire, while the PM emission decreases. The all-season tire shows ambivalent behavior between low and high loads. This could also indicate that the particle size distribution changes with increasing temperature, in this case caused by high forces. Thus, due to the different tire compounds, the trend reversal initially seems plausible, but whether it applies to all tires across the board or only to these three tire models must be verified in further tests.
3.5. Influence of Load Condition on Particle Size Distribution
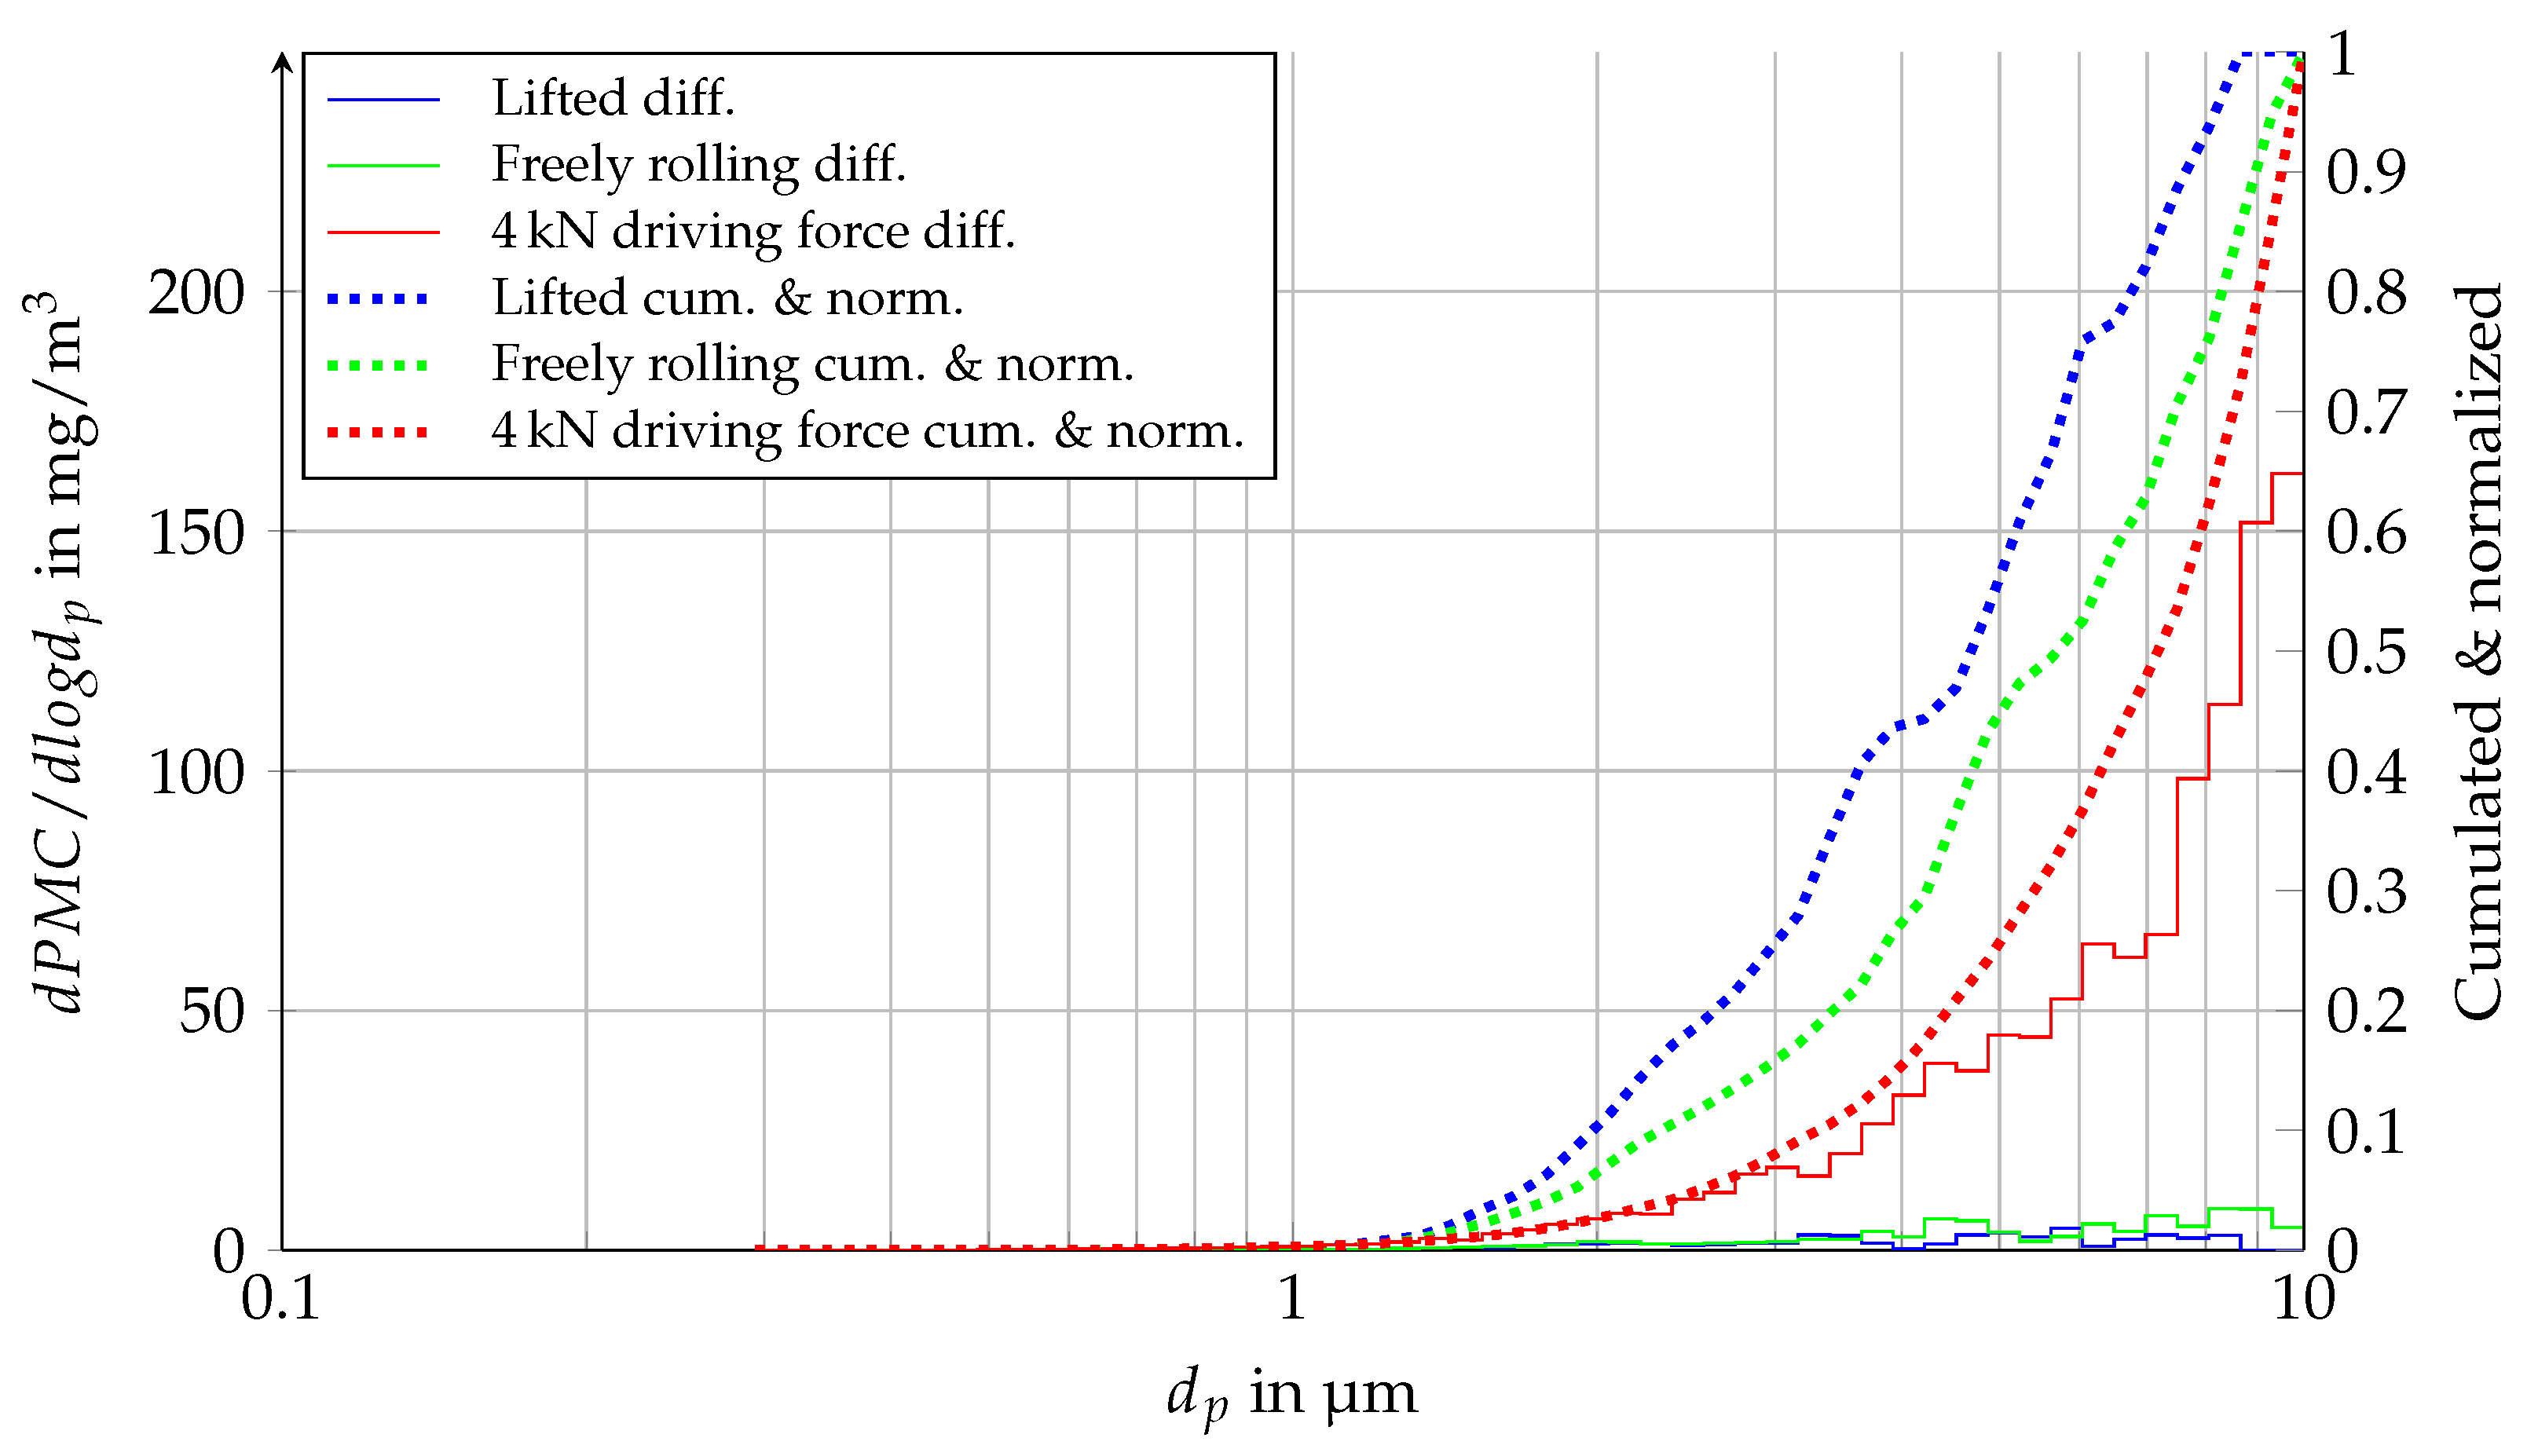
In addition to PMC and PNC, the aerosol spectrometer also records the particle size distribution present during each second, which allows the assumption of a shifted particle size distribution expressed in Section 3.2 to be verified. In Figure 14, the particle size distributions for three different operating phases are shown. Each curve describes the mean particle size distribution during a complete phase, so that the curves consist of 30 individual distributions (of one second each) for the lifted phase, 20 for the freely rolling phase, and 10 for the phase in which the tire was loaded with a driving force of 4 kN.
Using the representation in differential form, the absolute emissions are shown for each individual size channel. It can be seen that in the complete size range below 10 m, the measured PMC with the freely rolling wheel differs insignificantly from that with the lifted wheel. Only in the size range of larger particles (larger than 3 m) is more mass emitted. Whereas in the condition loaded with a driving force of 4 kN, there is a clear increase over the entire size range. These additional particles, or rather the masses associated with them, mainly consist of large particles, which is evident from the rising edge on the right-hand side. This circumstance becomes even clearer when looking at the cumulative and normalized representation. While the cumulative curve for the lifted wheel reaches its maximum already at m, this happens for the cases of the freely rolling wheel and for the driven wheel just at 10 m. The fact that larger particles are generated with increasing load can also be seen from the shape of the cumulative curves, which shift steadily to the right from the lifted state to the state loaded with a longitudinal force.
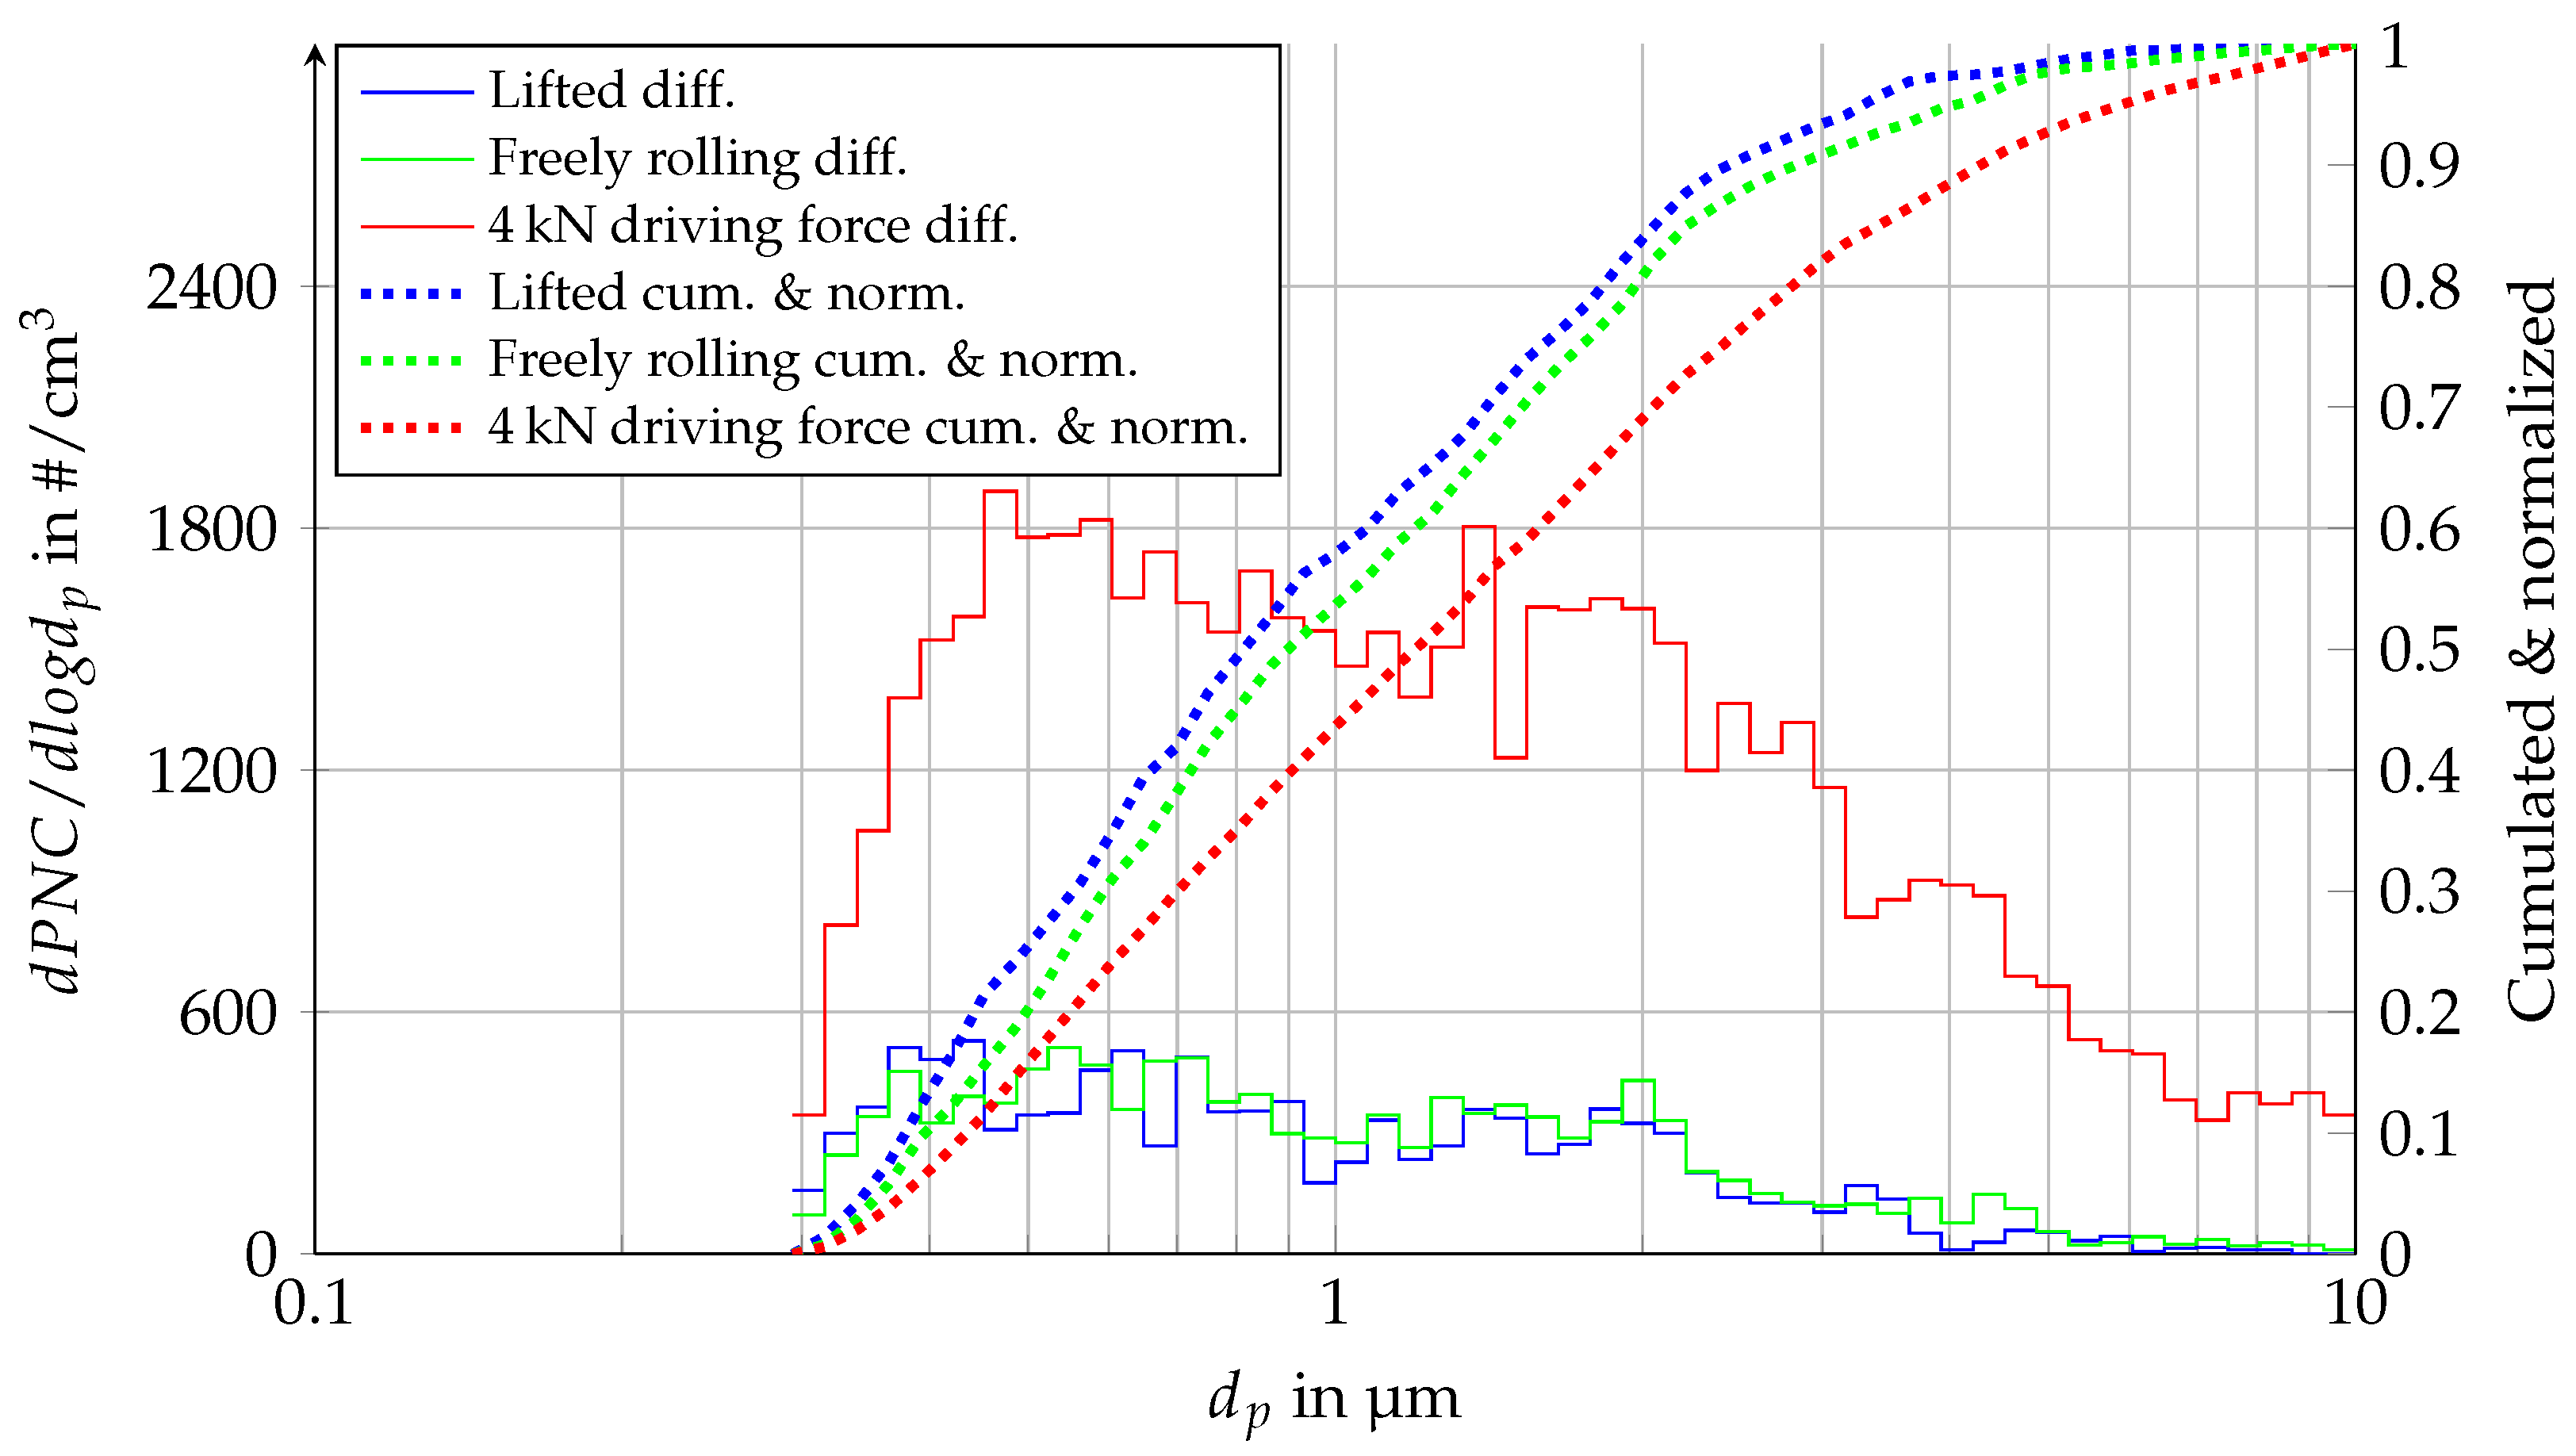
Due to the disproportionate influence of large particles on PMC and the associated small resolution of this representation, however, it is not clear whether the size distribution changes in the range of small particles. For the consideration of this size range, the particle number distribution is better suited than the particle mass distribution, since here, the mass of the particles is not considered and each particle receives the same weighting. In Figure 15, this particle number distribution is shown for the same three phases.
In this representation, it is also visible that the particle size distribution between the lifted and freely rolling conditions hardly differs for small particles. The influence of larger particles is less visible, but nevertheless present, as can be seen from the cumulative curve which is slightly shifted to the right. However, it is particularly apparent that the number of particles increases in the entire size range when the wheel is driven. In addition to large particles, this also applies to small particles. In percentage terms, however, the increase in particle number is highest for large particles, as can be seen from the cumulative curve. Both plots for PMC, as well as for PNC, show that larger forces lead to larger emitted particles as well. This can probably be attributed to the higher shear forces in the tire–road contact patch, which lead to the mechanical release of larger particles.
4. Discussion
For the evaluation of the test series, assumptions and simplifications were made which only partially correspond to reality but were necessary for the sake of higher representativeness and reproducibility. For better transparency of the procedure, these assumptions and simplifications are explicitly explained and critically scrutinized in the following. In some cases, the number of tests performed was not sufficient to draw definite conclusions about quantitative relationships. In these cases, follow-up studies are necessary to provide more detailed insights.
4.1. Representativeness of the Stated Particle Concentrations
Due to the working principle, the particle mass cannot be measured in aerosol spectrometers but needs to be calculated via the scattered light pulse assigned to the respective particle and the equivalent diameter derived from it. For this purpose, a refractive index of 1.59 was used, which was set as the standard for this aerosol spectrometer. This refractive index probably does not accurately correspond to TRWPs; however, an exact value is neither known nor easy to determine, since it can vary depending on the composition and size of the respective particle.
The aspect ratio of the particles was assumed to be 1, which would correspond to spherical particles. TRWPs are usually described in the literature as elongated or even “cigar-shaped”, which would result in higher aspect ratios. Kovochich et al. (2021) [35] and Rausch et al. (2022) [36] gave average aspect ratios of 1.53 to 1.69 for tire wear particles (TWPs) collected in their studies. However, it is not clear whether these properties also apply to airborne fractions smaller than 10 , so the standard value was also used here.
Further, a standard density of 1 g/cm3 was used to calculate PMC. Therefore, the values given do not correspond to the actual PMC but must be multiplied by the density of tire–road PM. The literature provides different information on this, which is always specific to the location and the respective measurement conditions. According to Baensch-Baltruschat et al. (2020) [37] and Kovochich et al. (2021) [35], the density of TRWPs is in the range between 1.5 g/cm3 and 2.2 g/cm3. Since an analysis of the particle density will only be carried out in a subsequent study and no precise data on the particle density was available in the context of this study, only relative statements on the influence of different emission levels can be made so far. Only when the planned particle density studies have been carried out can absolute values be calculated.
In addition, it should be noted that the values of the particle concentrations shown were determined under specific test bench conditions. In order to establish comparability with other test benches or a drive on open roads, emission factors for one tire or a complete vehicle must be calculated from the measured concentrations. These emission factors apply to specific driving conditions and can be combined by means of clustering to form a representative driving cycle. That can finally represent an emission value for realistic driving.
4.2. Procedure for Determination and Influence of the Currently Present SRT Value
The regression curves derived from the measured SRT values showed high reproducibility; however, individual SRT values deviated. Nonetheless, there were no indications that the actual SRT value was significantly different from the ordinary trend, since the emission values registered shortly before and after the SRT measurement have shown no abnormality. Therefore, it was assumed that extreme values in SRT measurements were outliers and occurred due to the measurement method itself.
With the sliding body attached to the SRT pendulum, only a very small section of the road surface was measured, so the exact position of the pendulum had an enormous influence on the result. Although care has been taken to ensure that the measurements were always taken at the same four spots, just a few tenths of a millimeter have determined whether a stone peak was inside or outside the measurement section. Such inconsistencies led to occasionally fluctuating SRT values. The processes between tire and road surfaces which cause the particle emission, however, take place on a much larger surface, so that constant emission is a clear indicator of constant skid resistance. To take this into account, a unified SRT curve was derived from all SRT values measured during the test series, which was subsequently used as a basis to calculate all emission data.
To link PMC and PNC to SRT values, the SRT curve was divided into 192 stages so that an average SRT value could be assigned to each load condition. This step-like decrease in skid resistance only approximately describes reality, but it is the only useful way to link representative emission values to the respective SRT values. An alternative would be to assign an individual SRT value to each emission value recorded by the aerosol spectrometer. However, due to the higher noise in emission values caused by the shorter measurement time, this would only allow for a much worse correlation with the respective SRT values.
Finally, in the Results section, only emissions at an SRT value of 60 were considered. However, since the SRT value on open roads is subject to both local and temporal fluctuations, the emissions associated with this can also differ greatly from those calculated above. In order to give an impression of how high these fluctuations can be, Table 2 shows an overview of the emissions at different load conditions and SRT values. The additional SRT values of 55 and 65 correspond to the target value and warning value for roads in Germany [34]. This clearly shows that the entire SRT and thus emission range in between can occur on real roads. The differences in emission emphasize once again that the SRT value is a significant influencing factor and should therefore always be specified when quantifying PM from tire–road contact.
4.3. Quantitative Dependence of the Emission on the Forces
To better show the influence of longitudinal and lateral forces on the emission and to compare the emission behavior of different tire types and at different ambient temperatures, quadratic regression curves were used for calculating the underlying particle concentrations. However, for both the longitudinal force in Figure 9 and less distinct for the lateral force in Figure 10, it can be seen that the quadratic model overestimates the emissions at moderate forces. In order to make a more precise statement about the quantitative relationship between longitudinal, as well as lateral forces and the emission, more extensive tests have to be performed, which can provide further support points. With their help, it can be checked whether the quadratic relationship is correct or another regression model could provide more accurate results for the different tire types.
4.4. Use of Regression Curves for Correlation between PMC/PNC and the SRT Value
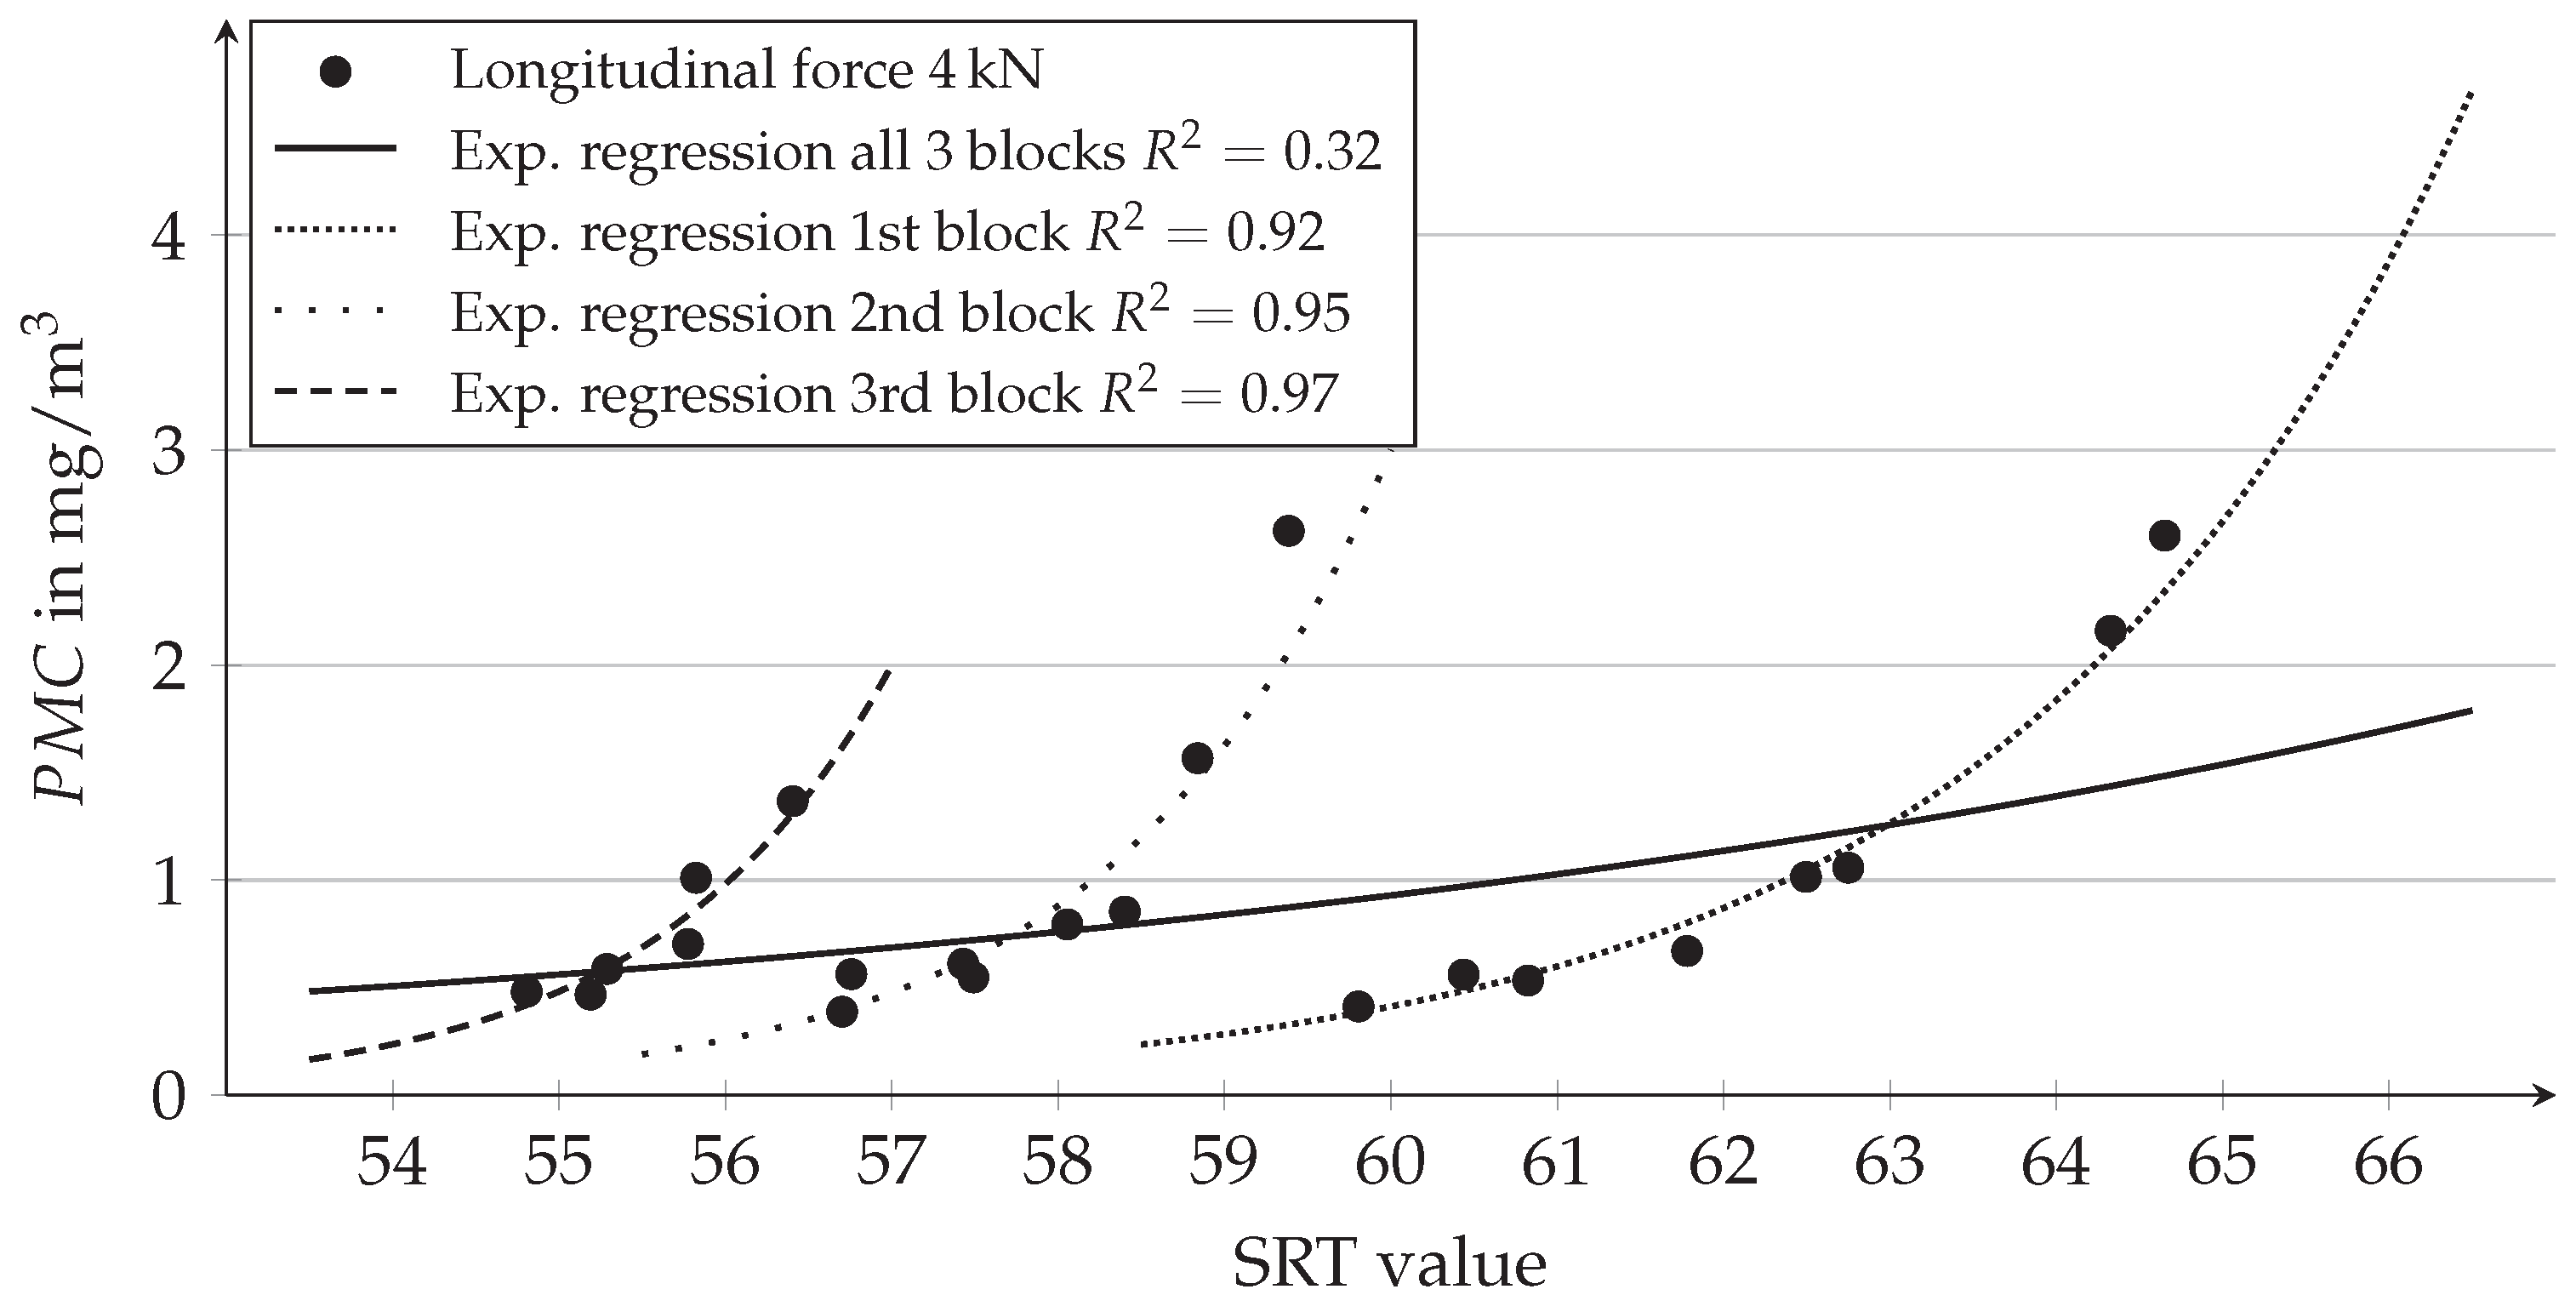
In determining the correlation between the emissions at constant load and the SRT value present (see Figure 8), it was assumed that the SRT value is the decisive influencing variable on the level of emissions. For summer and all-season tires, this assumption seems to be true, resulting in coefficients of determination between 0.7 and 0.9. For the winter tire, however, these values are in some cases lower, indicating a smaller influence of the SRT value and the existence of another main influencing parameter. In Figure 16, the recorded PMC for the three test blocks of the winter tire at low ambient temperature are shown.
It can be seen that while the emission tends to decrease as the SRT value decreases, there appears to be a second parameter that affects the emission even more. The three groups of dots represent the three test blocks at different times during the respective passage. At the beginning of each group of dots, the emission is higher than at the end of the previous group. In conjunction with the data shown in Section 3.4, this could indicate that there is a stronger dependence on ambient or tire surface temperature for the winter tire than for the other tire types, so that the emission from the winter tire is particularly high at the beginning of each measurement block (when the minimum temperature is present) and gradually decreases as the temperature increases (due to repeated load conditions). Since this trend occurs even at high loads on the all-season tire, a plausible explanation is the softer rubber compound compared with the summer tire. While the material is stiffer at low temperatures, smaller particles could preferably come loose, while high temperatures lead to a more deformable rubber compound and thus to larger material breakouts. This could increase overall tire wear but reduce PM emissions in the considered size range smaller than 10 m.
However, it is also clear that the regression model for all three measurement blocks which is used for the comparisons in Section 3.3 and Section 3.4 tends to underestimate the actual values, which means that the amount of real emissions would be even more. The influence of the ambient temperature and thus the surface temperature of the tire or any other decisive factors on the emission should therefore be investigated in more detail for the benefit of a more accurate prediction of the PM emission of winter tires.
5. Conclusions
The aim of this research work was to investigate the effects of longitudinal and lateral forces on tire–road particulate matter emissions for different types of tires and at different ambient temperatures. For this purpose, a tire internal drum test bench was upgraded to be able to perform real-time measurements for particulate matter. It turned out that the changing skid resistance of the road surface, representing the micro roughness, exerts a significant influence on the level of emissions. Therefore, the skid resistance of the road surface (SRT value) was determined for all tests, and the measured emissions were considered as a function of the SRT value. The results of the extensive test series show that both longitudinal and lateral forces have a significant influence on the emission of tire–road PM. It seems that the courses of PMC and PNC over the loads can be approximated using quadratic regression curves. However, whether these are indeed the best fit will be investigated in future experiments providing more support points. Furthermore, the results show clear differences between the emissions of summer, winter, and all-season tires. Across all conditions, the all-season tire emits on average twice as much particle mass as the summer tire, while the winter tire’s emission is four times that of the summer tire. For the particle number, these values are around 1.8 and 3. With regard to the influence of the ambient temperature, different trends emerge for different tire types. While for the summer tire an ambient temperature of 25 always leads to higher emissions than the one of 5 , the lower emissions for winter tires are mostly present at higher ambient temperatures. The emission behavior of the all-season tire is even more diversified, so that at low loads, low ambient temperature causes less emissions, and at high loads, higher temperatures cause less emissions. The different temperature effects are probably caused by the different tread compounds, which are usually much softer for winter tires than for summer tires. Finally, the evaluation of the particle size distributions during different driving conditions shows that the level of loading by longitudinal and lateral forces has an influence on the size of the emitted particles within the PM range. As soon as the wheel is set down on the road, the size distribution slightly shifts towards larger particles, even if the wheel is only rolling freely. If longitudinal or lateral forces are transmitted, emissions increase across all sizes, but particularly strongly for large particles ().
The results show great potential for reducing PM emissions from tire–road contact. On the one hand, high longitudinal and lateral forces should be avoided as much as possible. Rapid acceleration, heavy braking, and fast cornering cause disproportionate emission levels. On the other hand, all-season or, even better, summer tires should be used whenever ambient conditions permit. This is true although the emissions from the winter tire decrease with increasing temperature, as the emission is still far above the one of the summer tire. In addition, these values only represent particles with a diameter smaller than 10 m, but the total mass loss of the tire, which includes much larger TRWPs, can show different trends.
Author Contributions
Conceptualization, S.S. and H.-J.U.; methodology, S.S.; software, S.S.; validation, S.S. and H.-J.U.; formal analysis, S.S.; investigation, S.S; resources, F.G.; data curation, S.S.; writing—original draft preparation, S.S.; writing—review and editing, H.-J.U.; visualization, S.S.; supervision, S.S.; project administration, S.S.; funding acquisition, F.G. All authors have read and agreed to the published version of the manuscript.
Funding
We acknowledge support by the KIT-Publication Fund of the Karlsruhe Institute of Technology.
Institutional Review Board Statement
Not applicable.
Informed Consent Statement
Not applicable.
Data Availability Statement
Restrictions apply to the availability of these data. Due to a non-disclosure agreement, the data are only available from the corresponding author with the permission of the Mercedes-Benz Group AG.
Acknowledgments
We thank the Mercedes-Benz Group AG, which made it possible to carry out this study by funding the framework project “Influence of the vehicle driving conditions on the tire-road particulate matter emissions”.
Conflicts of Interest
The authors declare that they have no known competing financial interests or personal relationships that could have appeared to influence the work reported in this paper.
Abbreviations
The following abbreviations are used in this manuscript:
| BEV | Battery–Electric Vehicle |
| Lat | Lateral Force |
| Lon | Longitudinal Force |
| OECD | Organisation for Economic Co-operation and Development |
| PM | Particulate Matter |
| PMC | Particle Mass Concentration |
| PMF | Positive Matrix Factorization |
| PNC | Particle Number Concentration |
| SRT | Skid Resistance Tester |
| TRWP | Tire and Road Wear Particles |
| TWP | Tire Wear Particles |
| WHO | World Health Organization |
References
- World Health Organization. Ambient (Outdoor) Air Pollution. Available online: https://www.who.int/news-room/fact-sheets/detail/ambient-(outdoor)-air-quality-and-health (accessed on 13 June 2023).
- German Environment Agency. Feinstaub-Jährliche Auswertungen. Available online: https://www.umweltbundesamt.de/themen/luft/luftschadstoffe-im-ueberblick/feinstaub#feinstaub-jahresmittelwerte (accessed on 13 June 2023).
- OECD. Non-Exhaust Particulate Emissions from Road Transport: An Ignored Environmental Policy Challenge; OECD Publishing: Paris, France, 2020. [Google Scholar] [CrossRef]
- Luhana, L.; Sokhi, R.; Warner, L.; Mao, H.; Boulter, P.; McCrae, I.; Wright, J.; Osborn, D. Measurement of Non-Exhaust Particulate Matter: Characterisation of Exhaust Particulate Emissions from Road Vehicles; European Commission: Brussels, Belgium, 2004. [Google Scholar]
- Bukowiecki, N.; Lienemann, P.; Hill, M.; Furger, M.; Richard, A.; Amato, F.; Prévôt, A.; Baltensperger, U.; Buchmann, B.; Gehrig, R. PM10 emission factors for non-exhaust particles generated by road traffic in an urban street canyon and along a freeway in Switzerland. Atmos. Environ. 2010, 44, 2330–2340. [Google Scholar] [CrossRef]
- Sjödin, Å.; Ferm, M.; Björk, A.; Rahmberg, M.; Gudmundsson, A.; Swietlicki, E.; Johansson, C.; Gustafsson, M.; Blomqvist, G. Wear Particles from Road Traffic: A Field, Laboratory and Modelling Study: Final Report; IVL Swedish Environmental Research Institute Ltd.: Göteborg, Sweden, 2010. [Google Scholar]
- Amato, F.; Schaap, M.; van der Denier Gon, H.A.; Pandolfi, M.; Alastuey, A.; Keuken, M.; Querol, X. Effect of rain events on the mobility of road dust load in two Dutch and Spanish roads. Atmos. Environ. 2012, 62, 352–358. [Google Scholar] [CrossRef]
- Harrison, R.M.; Jones, A.M.; Gietl, J.; Yin, J.; Green, D.C. Estimation of the contributions of brake dust, tire wear, and resuspension to nonexhaust traffic particles derived from atmospheric measurements. Environ. Sci. Technol. 2012, 46, 6523–6529. [Google Scholar] [CrossRef]
- Kam, W.; Liacos, J.W.; Schauer, J.J.; Delfino, R.J.; Sioutas, C. Size-segregated composition of particulate matter (PM) in major roadways and surface streets. Atmos. Environ. 2012, 55, 90–97. [Google Scholar] [CrossRef]
- Amato, F.; Pandolfi, M.; Alastuey, A.; Lozano, A.; Contreras González, J.; Querol, X. Impact of traffic intensity and pavement aggregate size on road dust particles loading. Atmos. Environ. 2013, 77, 711–717. [Google Scholar] [CrossRef]
- Panko, J.M.; Chu, J.; Kreider, M.L.; Unice, K.M. Measurement of airborne concentrations of tire and road wear particles in urban and rural areas of France, Japan, and the United States. Atmos. Environ. 2013, 72, 192–199. [Google Scholar] [CrossRef]
- Lawrence, S.; Sokhi, R.; Ravindra, K. Quantification of vehicle fleet PM10 particulate matter emission factors from exhaust and non-exhaust sources using tunnel measurement techniques. Environ. Pollut. 2016, 210, 419–428. [Google Scholar] [CrossRef]
- Amato, F.; Favez, O.; Pandolfi, M.; Alastuey, A.; Querol, X.; Moukhtar, S.; Bruge, B.; Verlhac, S.; Orza, J.; Bonnaire, N.; et al. Traffic induced particle resuspension in Paris: Emission factors and source contributions. Atmos. Environ. 2016, 129, 114–124. [Google Scholar] [CrossRef]
- Etyemezian, V.; Kuhns, H.; Gillies, J.; Chow, J.; Hendrickson, K.; McGown, M.; Pitchford, M. Vehicle-based road dust emission measurement (III): Effect of speed, traffic volume, location, and season on PM10 road dust emissions in the Treasure Valley, ID. Atmos. Environ. 2003, 37, 4583–4593. [Google Scholar] [CrossRef]
- Hussein, T.; Johansson, C.; Karlsson, H.; Hansson, H.C. Factors affecting non-tailpipe aerosol particle emissions from paved roads: On-road measurements in Stockholm, Sweden. Atmos. Environ. 2008, 42, 688–702. [Google Scholar] [CrossRef]
- Mathissen, M.; Scheer, V.; Vogt, R.; Benter, T. Investigation on the potential generation of ultrafine particles from the tire–road interface. Atmos. Environ. 2011, 45, 6172–6179. [Google Scholar] [CrossRef]
- Kupiainen, K.J.; Pirjola, L. Vehicle non-exhaust emissions from the tyre–road interface–effect of stud properties, traction sanding and resuspension. Atmos. Environ. 2011, 45, 4141–4146. [Google Scholar] [CrossRef]
- Mathissen, M.; Scheer, V.; Kirchner, U.; Vogt, R.; Benter, T. Non-exhaust PM emission measurements of a light duty vehicle with a mobile trailer. Atmos. Environ. 2012, 59, 232–242. [Google Scholar] [CrossRef]
- Kwak, J.; Lee, S.; Lee, S. On-road and laboratory investigations on non-exhaust ultrafine particles from the interaction between the tire and road pavement under braking conditions. Atmos. Environ. 2014, 97, 195–205. [Google Scholar] [CrossRef]
- Aatmeeyata; Kaul, D.S.; Sharma, M. Traffic generated non-exhaust particulate emissions from concrete pavement: A mass and particle size study for two-wheelers and small cars. Atmos. Environ. 2009, 43, 5691–5697. [Google Scholar] [CrossRef]
- Kim, G.; Lee, S. Characteristics of Tire Wear Particles Generated by a Tire Simulator under Various Driving Conditions. Environ. Sci. Technol. 2018, 52, 12153–12161. [Google Scholar] [CrossRef]
- Park, I.; Kim, H.; Lee, S. Characteristics of tire wear particles generated in a laboratory simulation of tire/road contact conditions. J. Aerosol Sci. 2018, 124, 30–40. [Google Scholar] [CrossRef]
- Foitzik, M.J.; Unrau, H.J.; Gauterin, F.; Dornhöfer, J.; Koch, T. Investigation of Ultra Fine Particulate Matter Emission of Rubber Tires. Wear 2018, 394–395, 87–95. [Google Scholar] [CrossRef]
- Kupiainen, K.J.; Tervahattu, H.; Räisänen, M.; Mäkelä, T.; Aurela, M.; Hillamo, R. Size and composition of airborne particles from pavement wear, tires, and traction sanding. Environ. Sci. Technol. 2005, 39, 699–706. [Google Scholar] [CrossRef]
- Dahl, A.; Gharibi, A.; Swietlicki, E.; Gudmundsson, A.; Bohgard, M.; Ljungman, A.; Blomqvist, G.; Gustafsson, M. Traffic-generated emissions of ultrafine particles from pavement–tire interface. Atmos. Environ. 2006, 40, 1314–1323. [Google Scholar] [CrossRef]
- Gustafsson, M.; Blomqvist, G.; Gudmundsson, A.; Dahl, A.; Swietlicki, E.; Bohgard, M.; Lindbom, J.; Ljungman, A. Properties and toxicological effects of particles from the interaction between tyres, road pavement and winter traction material. Sci. Total Environ. 2008, 393, 226–240. [Google Scholar] [CrossRef] [PubMed] [Green Version]
- Gustafsson, M.; Blomqvist, G.; Gudmundsson, A.; Dahl, A.; Jonsson, P.; Swietlicki, E. Factors influencing PM10 emissions from road pavement wear. Atmos. Environ. 2009, 43, 4699–4702. [Google Scholar] [CrossRef]
- Panko, J.; McAtee, B.L.; Kreider, M.; Gustafsson, M.; Blomqvist, G.; Gudmundsson, A.; Sweet, L.; Finley, B. Physio-Chemical Analysis of Airborne Tire Wear Particles. Available online: http://docs.wbcsd.org/2010/02/physioChemAnalysisAirborne.pdf (accessed on 13 June 2023).
- Schläfle, S.; Gauterin, F.; Lallement, R. Aufbau eines Prüfstands zur Messung von Reifen-Fahrbahn-Feinstaubemissionen auf realen Fahrbahnoberflächen. In Reifen–Fahrwerk–Fahrbahn; VDI Wissensforum GmbH, Ed.; VDI Verlag: Düsseldorf, Germany, 2022; VDI-Berichte 2398; pp. 15–33. [Google Scholar] [CrossRef]
- PALAS. Datasheet MonoDust 1500. Available online: https://www.palas.de/en/product/download/monodust1500/datasheet/pdf (accessed on 13 June 2023).
- PALAS GmbH. Datasheet Promo 2000. Available online: https://www.palas.de/en/product/download/promo2000/datasheet/pdf (accessed on 13 June 2023).
- PALAS GmbH. Datasheet Aerosol Sensor Welas 2500. Available online: https://www.palas.de/en/product/download/aerosolsensorwelas2500/datasheet/pdf (accessed on 13 June 2023).
- EN 13036; Road and Airfield Surface Characteristics—Test Methods–Part 4: Method for Measurement of Slip/Skid Resistance of a Surface—The Pendulum Test. European Committee for Standardization: Berlin, Germany, 2011.
- Forschungsgesellschaft für Straßen- und Verkehrswesen. Zusätzliche Technische Vertragsbedingungen und Richtlinien für den Bau von Verkehrsflächenbefestigungen aus Asphalt: ZTV Asphalt-StB 07/13; FGSV: Cologne, Germany, 2013. [Google Scholar]
- Kovochich, M.; Liong, M.; Parker, J.A.; Oh, S.C.; Lee, J.P.; Xi, L.; Kreider, M.L.; Unice, K.M. Chemical mapping of tire and road wear particles for single particle analysis. Sci. Total Environ. 2021, 757, 144085. [Google Scholar] [CrossRef] [PubMed]
- Rausch, J.; Jaramillo-Vogel, D.; Perseguers, S.; Schnidrig, N.; Grobéty, B.; Yajan, P. Automated identification and quantification of tire wear particles (TWP) in airborne dust: SEM/EDX single particle analysis coupled to a machine learning classifier. Sci. Total Environ. 2022, 803, 149832. [Google Scholar] [CrossRef]
- Baensch-Baltruschat, B.; Kocher, B.; Stock, F.; Reifferscheid, G. Tyre and road wear particles (TRWP)—A review of generation, properties, emissions, human health risk, ecotoxicity, and fate in the environment. Sci. Total Environ. 2020, 733, 137823. [Google Scholar] [CrossRef]
Figure 1.
Internal drum test bench at FAST/KIT [29]. (a) Sled with mounted wheel in the foreground and internal drum in the background. (b) Schematic sketch of the test bench comprising the main components drum, portal, sled, and wheel.
Figure 1.
Internal drum test bench at FAST/KIT [29]. (a) Sled with mounted wheel in the foreground and internal drum in the background. (b) Schematic sketch of the test bench comprising the main components drum, portal, sled, and wheel.

Figure 2.
Sampling apparatus which enables measurement of particulate matter emission and monitoring of flow speed simultaneously and at different positions of the flow’s cross section.
Figure 2.
Sampling apparatus which enables measurement of particulate matter emission and monitoring of flow speed simultaneously and at different positions of the flow’s cross section.

Figure 3.
Overview of the test series performed.

Figure 4.
Typical tire test run comprising four initial load conditions to stir up remaining sand and 16 single measuring points, 8 for longitudinal and lateral force, respectively.
Figure 4.
Typical tire test run comprising four initial load conditions to stir up remaining sand and 16 single measuring points, 8 for longitudinal and lateral force, respectively.

Figure 5.
Courses of PMC and PNC () during one exemplary test run with corresponding load conditions.
Figure 5.
Courses of PMC and PNC () during one exemplary test run with corresponding load conditions.

Figure 6.
Calculated PMC and PNC () for load conditions during one exemplary test run.

Figure 7.
Measured SRT values and approximated course during one test passage.

Figure 8.
Dependency of PMC () of the skid resistance for a freely rolling tire, as well as with positive and negative longitudinal-force-loaded summer tire.
Figure 8.
Dependency of PMC () of the skid resistance for a freely rolling tire, as well as with positive and negative longitudinal-force-loaded summer tire.

Figure 9.
Calculated courses of particle concentrations versus longitudinal force for the summer tire at an ambient temperature of 25 and at an SRT value of 60.
Figure 9.
Calculated courses of particle concentrations versus longitudinal force for the summer tire at an ambient temperature of 25 and at an SRT value of 60.

Figure 10.
Calculated courses of particle concentrations versus lateral force for the summer tire at an ambient temperature of 25 and at an SRT value of 60.
Figure 10.
Calculated courses of particle concentrations versus lateral force for the summer tire at an ambient temperature of 25 and at an SRT value of 60.

Figure 11.
Influence of tire type on PMC for different load conditions.

Figure 12.
Influence of tire type on PNC for different load conditions.

Figure 13.
Influence of ambient temperature on PMC for different load conditions and different tire types.
Figure 13.
Influence of ambient temperature on PMC for different load conditions and different tire types.

Figure 14.
Typical particle mass distributions for different load conditions of a summer tire.

Figure 15.
Typical particle number distributions for different load conditions of a summer tire.

Figure 16.
Dependency of PMC of the skid resistance for a longitudinal force of 4 kN at a winter tire.
Figure 16.
Dependency of PMC of the skid resistance for a longitudinal force of 4 kN at a winter tire.


Table 1.
Varied and constant parameters with associated values.
| Parameter | Parameter Variation | |
|---|---|---|
| Varied | Tire type | Summer; Winter; All-season |
| Ambient temperature | 5 ; 25 | |
| Longitudinal force | 0 kN; kN; kN | |
| Lateral force | 0 kN; kN; kN | |
| Constant | Camber angle | 0° |
| Vertical load | kN | |
| Speed | 80 km/h | |
| Tire inflation pressure | bar |
Table 2.
Influence of the SRT value on the emission (PMC and PNC) for individual load conditions for a summer tire at an ambient temperature of 25 .
Table 2.
Influence of the SRT value on the emission (PMC and PNC) for individual load conditions for a summer tire at an ambient temperature of 25 .
| Load Condition | SRT Value 55 | SRT Value 60 | SRT Value 65 | |
|---|---|---|---|---|
| PMC | Freely rolling | mg/m3 | mg/m3 | mg/m3 |
| Lon 2 kN | mg/m3 | mg/m3 | mg/m3 | |
| Lon 4 kN | mg/m3 | mg/m3 | mg/m3 | |
| Lat 2 kN | mg/m3 | mg/m3 | mg/m3 | |
| Lat 4 kN | mg/m3 | mg/m3 | mg/m3 | |
| PNC | Freely rolling | #/cm3 | #/cm3 | #/cm3 |
| Lon 2 kN | #/cm3 | #/cm3 | #/cm3 | |
| Lon 4 kN | #/cm3 | #/cm3 | #/cm3 | |
| Lat 2 kN | #/cm3 | #/cm3 | #/cm3 | |
| Lat 4 kN | #/cm3 | #/cm3 | #/cm3 |
Disclaimer/Publisher’s Note: The statements, opinions and data contained in all publications are solely those of the individual author(s) and contributor(s) and not of MDPI and/or the editor(s). MDPI and/or the editor(s) disclaim responsibility for any injury to people or property resulting from any ideas, methods, instructions or products referred to in the content. |
© 2023 by the authors. Licensee MDPI, Basel, Switzerland. This article is an open access article distributed under the terms and conditions of the Creative Commons Attribution (CC BY) license (https://creativecommons.org/licenses/by/4.0/).
Share and Cite
MDPI and ACS Style
Schläfle, S.; Unrau, H.-J.; Gauterin, F. Influence of Load Condition, Tire Type, and Ambient Temperature on the Emission of Tire–Road Particulate Matter. Atmosphere 2023, 14, 1095. https://doi.org/10.3390/atmos14071095
AMA Style
Schläfle S, Unrau H-J, Gauterin F. Influence of Load Condition, Tire Type, and Ambient Temperature on the Emission of Tire–Road Particulate Matter. Atmosphere. 2023; 14(7):1095. https://doi.org/10.3390/atmos14071095
Chicago/Turabian StyleSchläfle, Stefan, Hans-Joachim Unrau, and Frank Gauterin. 2023. "Influence of Load Condition, Tire Type, and Ambient Temperature on the Emission of Tire–Road Particulate Matter" Atmosphere 14, no. 7: 1095. https://doi.org/10.3390/atmos14071095
Note that from the first issue of 2016, this journal uses article numbers instead of page numbers. See further details here.