
Chemical Characteristics and Source Apportionment of PM2.5 in Western Industrial Region of Jinan
1
Jinan Environmental Research Academy, Jinan 250014, China
2
State Key Laboratory of Environmental Criteria and Risk Assessment, Chinese Research Academy of Environmental Sciences, Beijing 100012, China
*
Author to whom correspondence should be addressed.
Atmosphere 2023, 14(5), 864; https://doi.org/10.3390/atmos14050864
Submission received: 24 February 2023
/
Revised: 5 May 2023
/
Accepted: 11 May 2023
/
Published: 12 May 2023
(This article belongs to the Special Issue Two-Dimensional Nanomaterials for Gas Detection and Energy Storage)
Abstract
:In order to obtain the chemical composition characteristics and source apportionment of PM2.5 in a western industrial region of Jinan, manual sampling and analysis of PM2.5 in Pingyin County was conducted during 2019. The results showed that the total concentration of 29 species of PM2.5 was 53.8 μg·m−3. The NO3− concentration (14.6 ± 14.2 μg·m−3) was the highest, followed by OC (9.3 ± 5.5 μg·m−3), SO42− (9.1 ± 6.4 μg·m−3) and NH4+ (8.1 ± 6.8 μg·m−3). Concentrations of OC, NO3− and SO42− were highest in winter and lowest in summer. The concentration of NH4+ was highest in winter and lowest in spring. The annual SOR and NOR were 0.30 ± 0.14 and 0.21 ± 0.12, respectively. SO2 emission and conversion ratio was highest in winter, leading to the highest SO42− concentration. SO2 emission in summer was low, but the conversion ratio was high. NOR in winter and autumn were close and higher than spring and summer. The high NOR in autumn caused a higher NO3− concentration compared with that in spring and summer. The average concentration of SOC during 2019 was 2.8 ± 1.9 μg·m−3, accounting for 30% of OC. The PMF results showed that coal emission accounted for 36.5% of PM2.5 concentration, followed by mobile sources (32.6%), industry emission (17.4%), dust emission (7.1%) and other emissions (6.4%).
1. Introduction
Jinan is located in the middle and west of Shandong Province, at the junction of the low hills and the alluvial plain. It is surrounded by mountains in the east, north and south. The terrain in the south is higher than that in the north, and the diffusion conditions for ambient air are relatively weak. Unfavorable geographical conditions combined with heavy energy structure led to heavy air pollution levels in Jinan. PM2.5 is one of the main pollutants affecting local air quality. In 2019, the annual average PM2.5 concentration was 53.8 μg·m−3, 1.5 times the national second-level standard limit. Especially in autumn and winter, heavy pollution episodes occur frequently, seriously impacting social and economic development and especially people’s health [1].
PM2.5 plays important roles in acid deposition, atmospheric visibility reduction and climate change. PM2.5 also has significant adverse health effects [2,3]. Exposure to high concentrations of PM2.5 could result in increased hospitalizations and higher mortality rates. PM2.5 is a complex mixture of organic carbon (OC), elemental carbon (EC), nitrate (NO3−), sulfate (SO42−), ammonium (NH4+), mineral dust, sea salt and heavy metals [4]. OC and EC affect the extinction coefficient for light scattering and absorption, which can contribute up to 30% of the total extinction. The strong absorption capacity of EC has a significant impact on aerosol radiative forcing, which can lead to global warming [5,6,7]. Water-soluble ions such as SO42−, NO3− and NH4+ are hydrophilic and can promote the formation of cloud condensation nuclei, which significantly influence visibility and climate.
Wei Xiaofeng et al. [8] studied the changes of PM2.5 water-soluble ions in Jinan during the heating season of 2016 and 2017 and found that NO3−, SO42− and NH4+ (SNA) accounted for the highest proportion in water-soluble ions. In 2017, the concentration of SNA decreased by 12.3–31.7%, while the proportion of NO3− increased unexpectedly. Xia Zhiyong et al. [9] studied the characteristics of PM2.5 components in urban areas and one clean background site in Jinan during heavy pollution in autumn and winter of 2016 and found that the PM2.5 concentration in urban areas was three times that in the rural background site, and the concentration of secondary organic carbon in urban areas and the rural background site were estimated to be 8.3 μg·m−3 and 1.8 μg·m−3, respectively, indicating that the secondary reaction of aerosols in urban areas was higher. Liu Yingying et al. [10] found that the heavy pollution process was caused by meteorological conditions with stable air and high humidity, large accumulation of precursors and a liquid-phase heterogeneous chemical process.
The North China Plain (NCP) is one of the most heavily atmospherically polluted areas in China. Widespread regional air pollution episodes occurred frequently in Beijing–Tianjin–Hebei region [11]. Jinan is located in Western Shandong province, bordering the Beijing–Tianjin–Hebei region. Therefore, the study of pollution characteristics in this region has a certain promoting effect on the analysis and control of air pollution in the entire North China Plain. This study is focused on Pingyin County, where industrial enterprises are concentrated in the western part of Jinan. Benefitting from convenient transportation conditions, several important industrial parks are located in Pingyin County, involving many types, such as machinery manufacturing, pharmaceuticals and food production, building materials and the energy industry. The logistics level in the region is also highly developed. In order to obtain a comprehensive understanding of the specific contributions from various sources, it is necessary to analyze the sources and evolution processes of fine particle pollution in Pingyin, which could provide scientific support for the improvement of air quality in industrial areas of Jinan.
2. Materials and Methods
2.1. Sampling
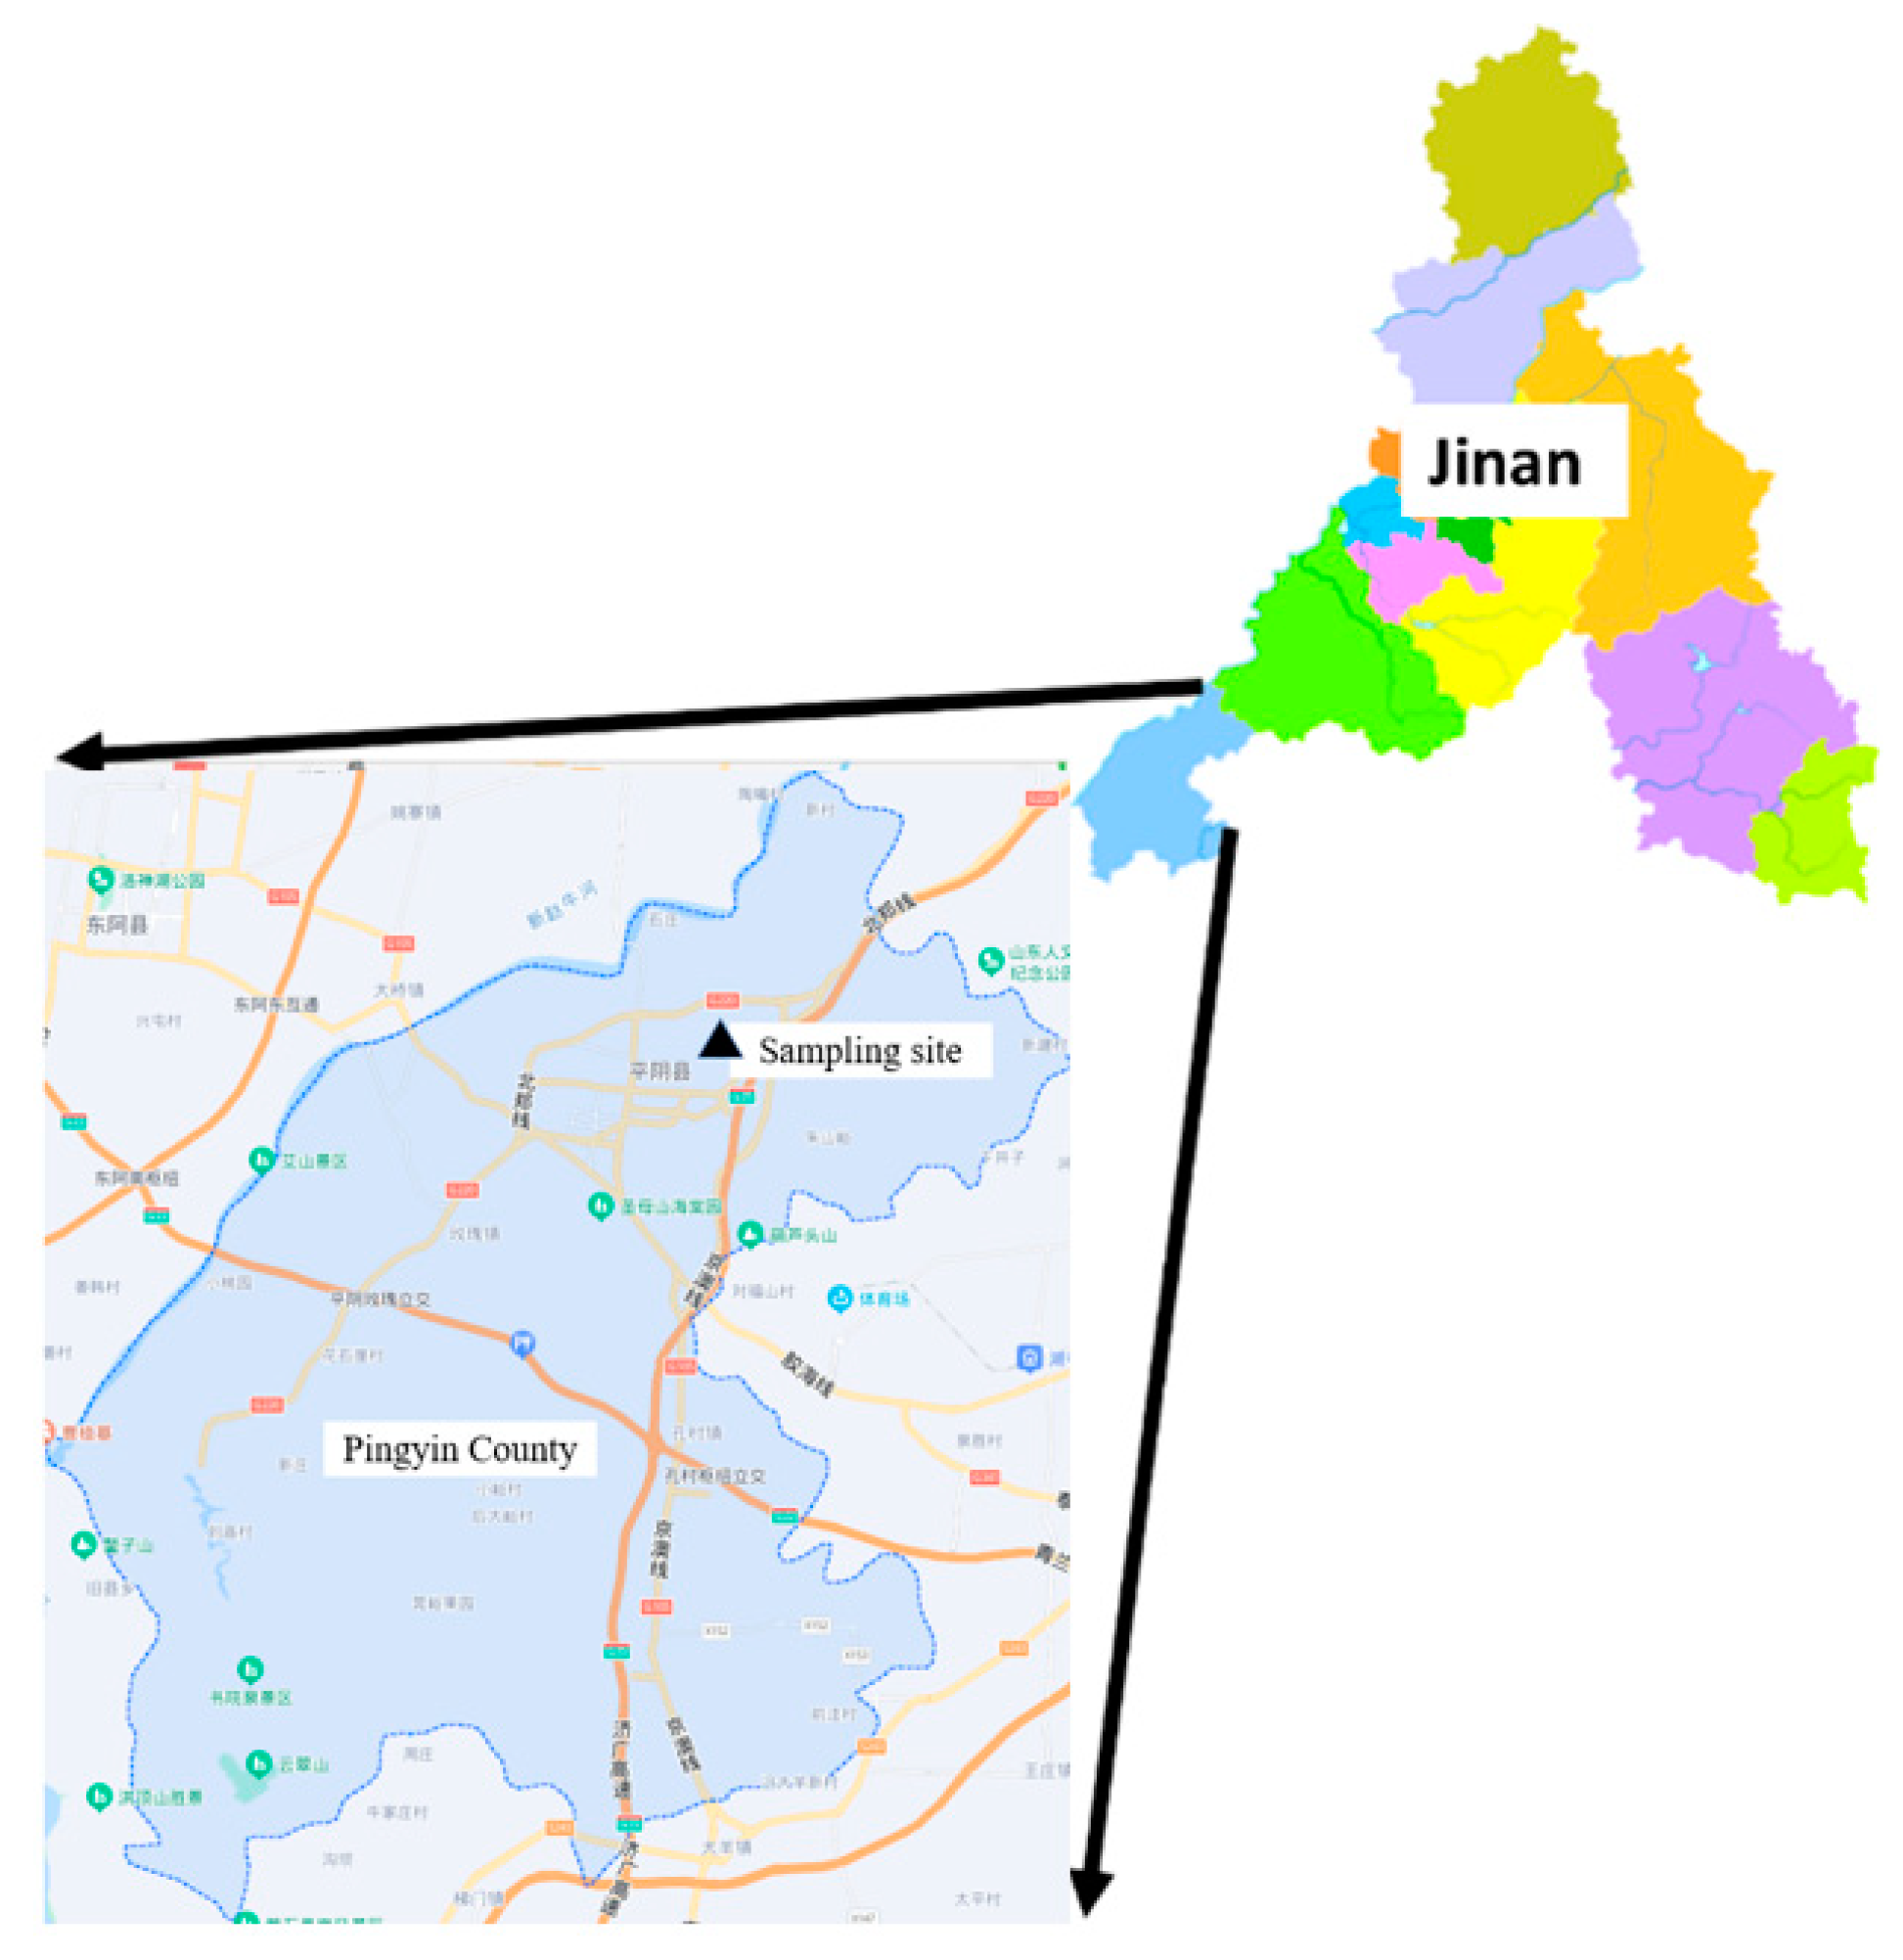
To collect the particulate matter samples, filter sampling was conducted at Pingyin county sites of Jinan (36.28° N 116.46° E). Based on the seasonal characteristics of the particle matter emission sources, this campaign was implemented in spring (May 20–June 21), summer (July 17–August 12), autumn (October 30–November 24) and winter (December 1–December 31). Daily PM2.5 samples were collected on quartz and Teflon filters, by two BTPM-HS air samplers (Dandong Baite Ltd., Dandong, China) from 9:00 a.m. to 8:00 a.m. (23 h) at a flow rate of 16.67 L/min. All quartz filters were prebaked at 450 °C for 4 h. Before and after sampling, the filters were conditioned at 23 °C and relative humidity of 50% for 48 h and then weighted and stored at −18 °C until pretreatment. In total, 9 water-soluble ions, 18 elements and OC/EC were analyzed for each filter membrane. The sampling sites are shown in Figure 1.
2.2. Chemical Analysis
Nine water-soluble ions, including F−, Cl−, NO3−, SO42−, Na+, K+, Mg2+, Ca2+ and NH4+ were analyzed in this study. The chemical analysis processes were described in the previous research [12]. The pretreatment by ultrasonic extraction was performed to make sure the water-soluble inorganic ions (WSIIs) on filter could dissolve into the deionized water, and then the liquid was extracted through a 0.22 μm membrane pore to remove the impurity, followed by analysis using an ion chromatograph system Dionex ICS-1100 and ICS-2100 (Thermo Fisher Scientific, Waltham, MA, USA).
A quarter of Teflon filter was cut for the digestion with an acid mixture (6 mL HNO3 + 2 mL H2O2 + 0.6 mL HF) using a microwave digestion system, and 20 mL saturated boric acid solution was added to neutralize the excess fluoride ions. A total of 18 elements, including Na, Mg and Al, were measured by ICP-OES Intrepid-XDL (Thermo Fisher Scientific, Waltham, MA, USA).
The detection of organic carbon (OC) and elemental carbon (EC) was performed using a thermal/optical carbon aerosol analyzer RT-4 (Sunset Lab, Tigard, OR, USA). The filter samplers were removed from the cryogenic refrigerator and then measured by the carbon analyzer. In addition, the concentration of NOx and SO2 were monitored synchronously using the SO2 analyzer and NOx analyzer 100E and 200E (API, Rockwell, MD, USA).
2.3. Positive Matrix Factorization
The receptor model PMF was used for source apportionment in this study. The principles of PMF were described elsewhere in detail [13,14]. The error in the chemical composition of the acceptor was determined according to the weight, and then the main pollution source and contribution ratio were determined by the least square method. The matrix X of a speciated sample data is decomposed into two matrix factors: factor contribution (G) and factor spectrum (F). This method does not require source spectrum input and ensures that the factor contribution (G) and factor spectrum (F) of the decomposition are non-negative values. The matrix form can be expressed as follows:
xij is the concentration of species j in the i sample; p is the number of factors; gik is the contribution value of the k factor in the sample i; fkj is the concentration of species j to factor k; eij is the error of species j in the sample i.
3. Results and Discussion
3.1. Chemical Components of PM2.5
The concentration of each component of PM2.5 during the sampling period is shown in Figure 2. The total concentration of 29 components is 53.8 μg·m−3, among which NO3− has the highest concentration, with an average of 14.6 ± 14.2 μg·m−3, followed by OC, SO42− and NH4+. The average concentrations were 9.3 ± 5.5 μg·m−3, 9.1 ± 6.4 μg·m−3 and 8.1 ± 6.8 μg·m−3, respectively. These four components were the main components in PM2.5, and their concentrations accounted for 76.4% of the total concentration in 29 components. Among the other components, the concentrations of EC, Cl−, K+ and other water-soluble ions were in the range of 0.2 ± 0.1 μg·m−3 to 2.2 ± 1.5 μg·m−3. Mg2+ had the lowest and EC the highest concentration of all species. The concentrations of 18 elements, such as Na, Mg and Al, were between 0.018 ± 0.008 μg·m−3 and 0.888 ± 0.415 μg·m−3, with the lowest concentration of Co and the highest concentration of K.
Table 1 shows the comparison of the concentrations of the four main components of PM2.5 in Jinan and different studies. Compared with the monitoring results in 2015, the concentrations of each component showed an obvious decreasing trend, especially for SO42−, which showed a larger decreasing range. However, compared with the monitoring results in the background area and urban area of Jinan in 2016 and 2017, the concentration of PM2.5 components in Pingyin County did not decrease significantly, and the concentration of NO3− even reached the highest level. The main reason is that the number of industrial enterprises in Pingyin County is larger, and the overall PM2.5 concentration level is higher than that in the urban area and background area of Jinan. Compared with the observation in different countries in the world, the concentrations of SNA in Pingyin were similar to those in Delhi, which was also the district with severe air pollution in India, and generally higher than those in other areas such as Dammam and Seoul.
Overall comparison showed that the degree of NO3− pollution in Pingyin County was relatively serious.
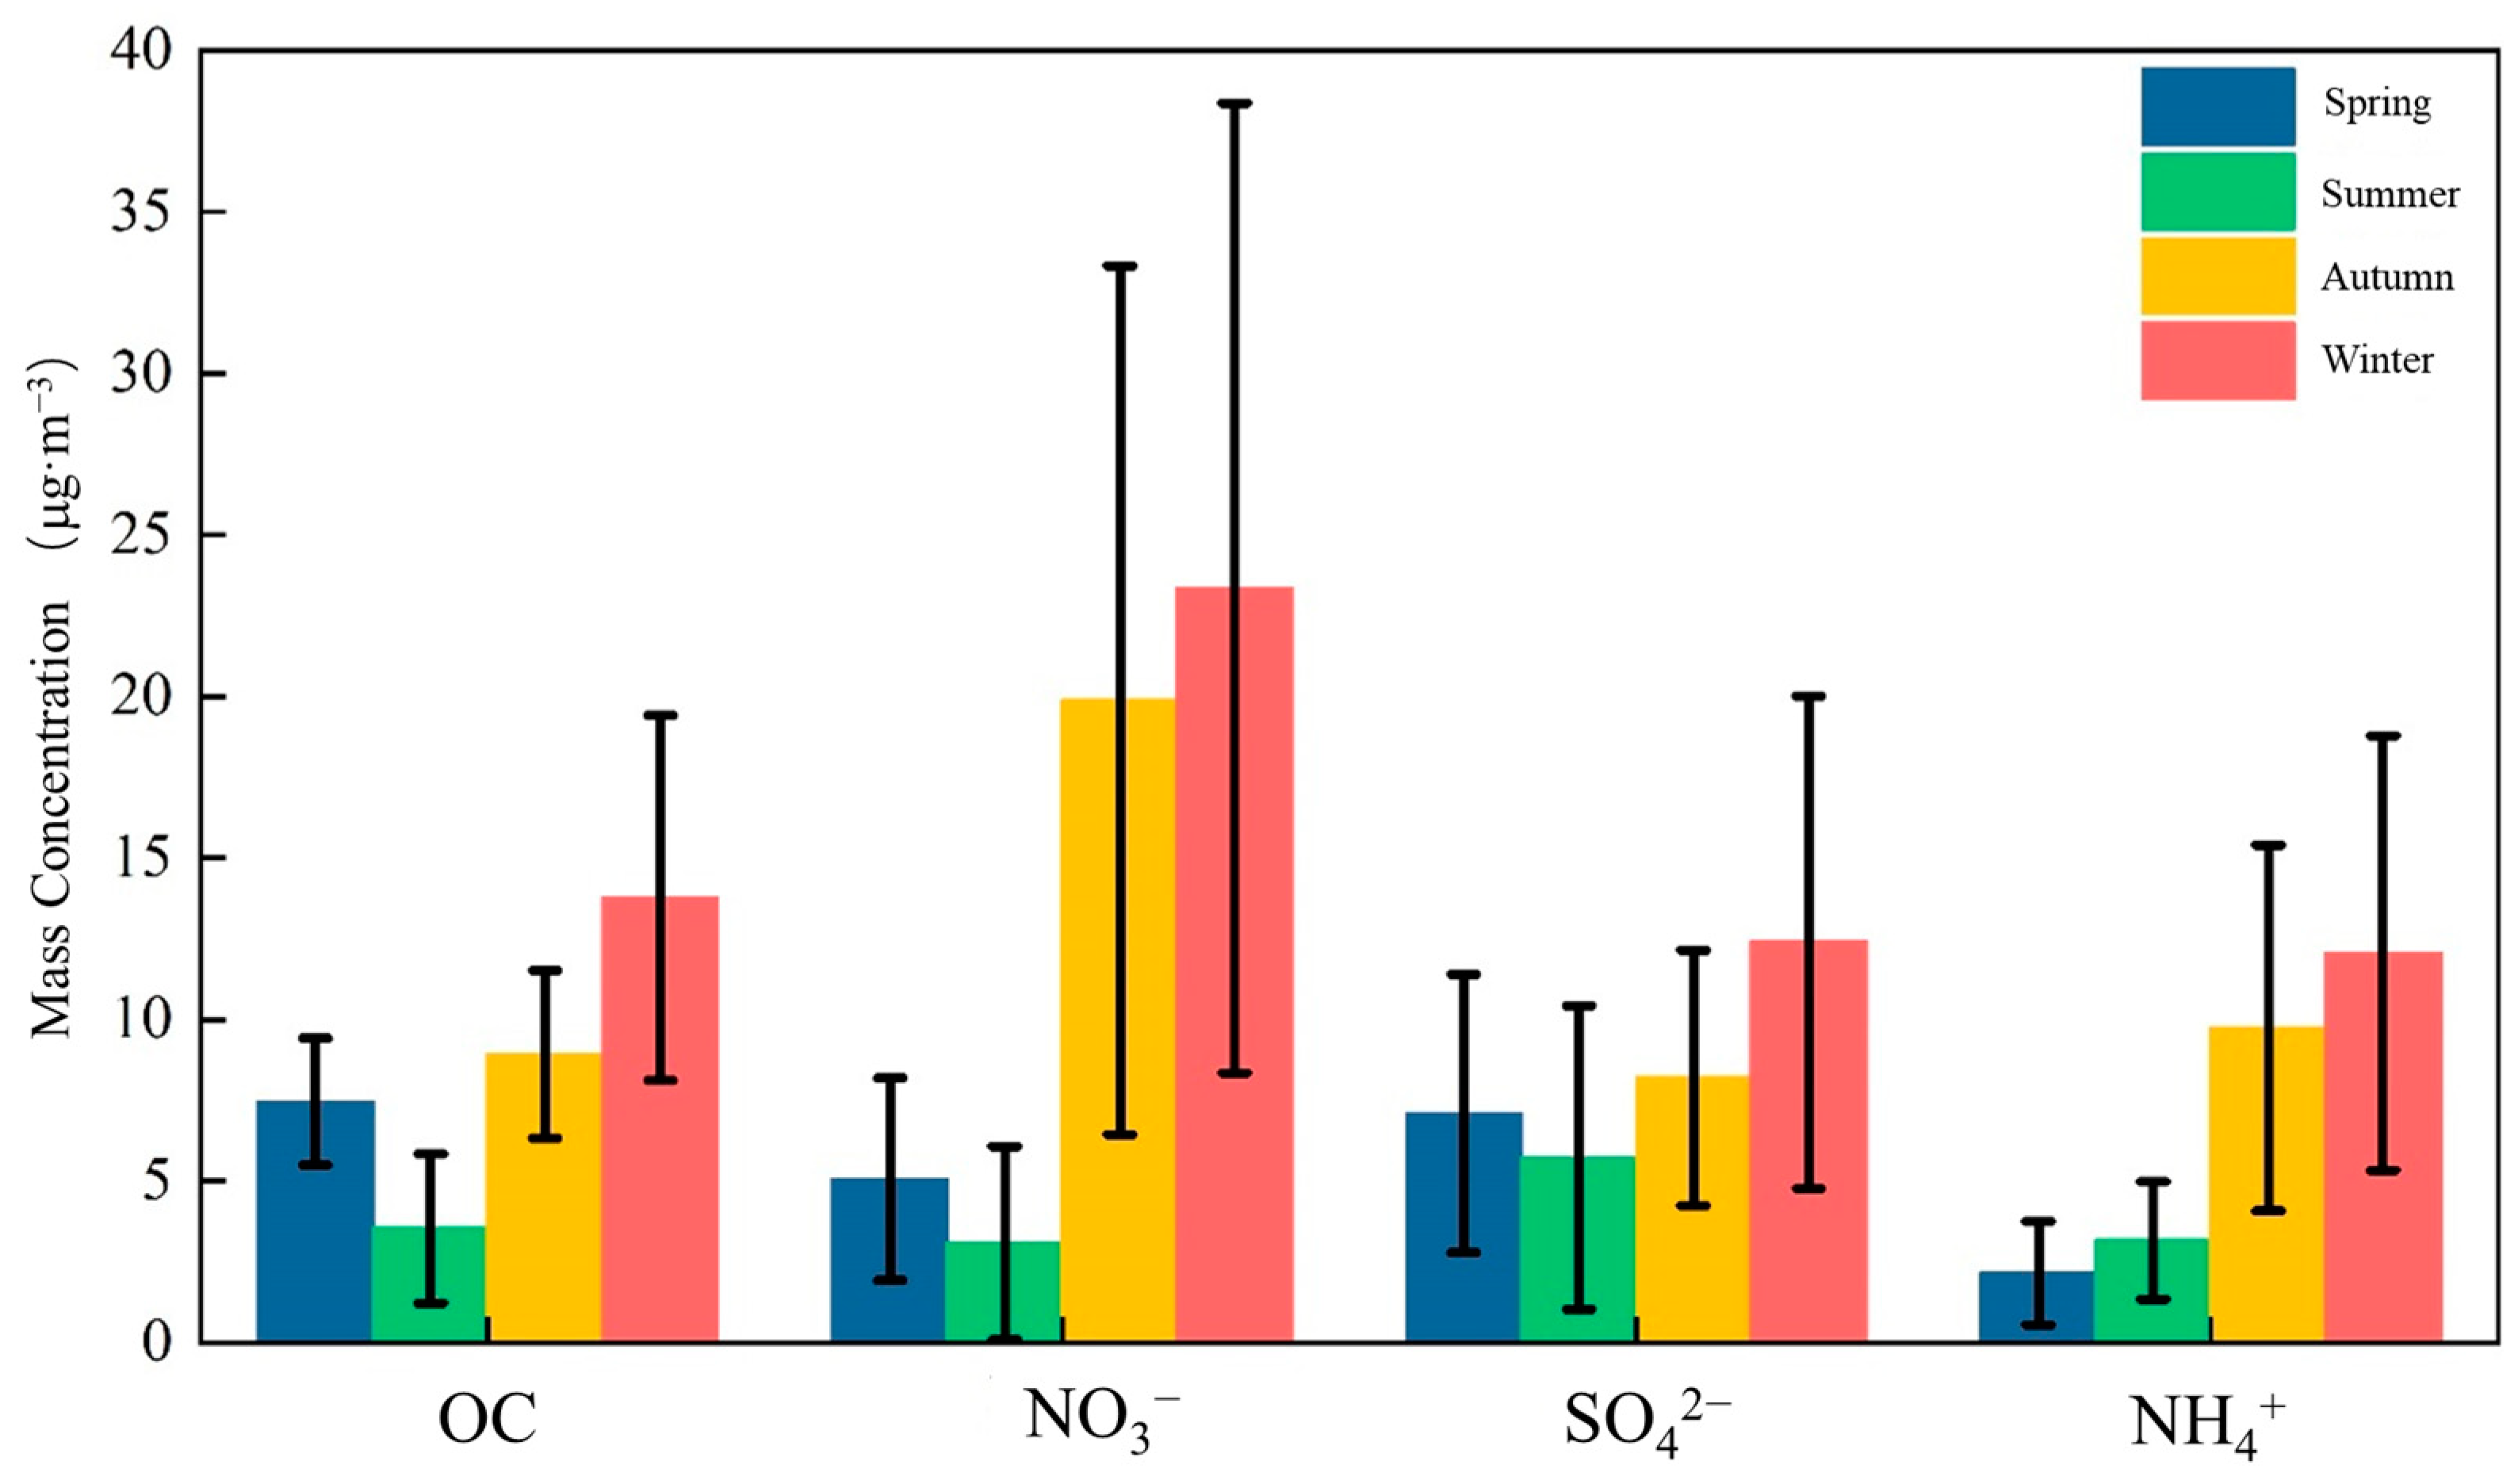
3.2. Seasonal Variation of Chemical Components
Figure 3 shows the concentration levels of the four main components of PM2.5 in Pingyin county in different seasons. For OC, NO3− and SO42−, the concentrations were the highest in winter and the lowest in summer. The average concentration of OC in four seasons was 13.8 ± 5.7 μg·m−3 in winter, 8.9 ± 2.6 μg·m−3 in autumn, 7.5 ± 2.0 μg·m−3 in spring and 3.5 ± 2.3 μg·m−3 in summer. OC was mainly derived from the combustion of fossil fuels, with the highest concentration in winter due to emissions from coal burning for heating. The higher OC concentration in autumn and spring has a certain relationship with biomass combustion [23]. The average NO3− concentration in the four seasons was 23.4 ± 15.0 μg·m−3 in winter, 19.9 ± 13.5 μg·m−3 in autumn, 5.1 ± 3.1 μg·m−3 in spring and 3.1 ± 3.0 μg·m−3 in summer. NO3− mainly comes from vehicle exhaust emissions and industrial production emissions. The concentration of NO3− in autumn and winter in Pingyin county was significantly higher than that in spring and summer, indicating that the emissions from industrial enterprises have a greater impact on NO3−. The average concentration of SO42− in four seasons was 12.4 ± 7.6 μg·m−3 in winter, 8.2 ± 4.0 μg·m−3 in autumn, 7.1 ± 4.3 μg·m−3 in spring and 5.7 ± 4.7 μg·m−3 in summer. SO42− mainly comes from the transformation of SO42− emissions from coal burning. Compared with OC and NO3−, the concentration of SO42− in summer was closer to that in spring and autumn, mainly because although the emission of SO2 is lower in summer, higher temperature and humidity are conducive to the generation of SO42− [24]. NH4+ showed different seasonal patterns. The concentration of NH4+ in summer was higher than that in spring, and the average concentration of NH4+ in winter was 12.1 ± 6.7 μg·m−3, 9.8 ± 5.7 μg·m−3 in autumn, 3.2 ± 1.8 μg·m−3 in summer and 2.2 ± 1.6 μg·m−3 in spring. NH4+ mainly comes from coal burning, agricultural production and the decay of organic matter.
3.3. Sulfur Oxidation Rate and Nitrogen Oxidation Rate
Sulfur oxidation rate (SOR) and nitrogen oxidation rate (NOR) are used to indicate the degree of atmospheric SO2 and NO2 transformation, respectively (defined as SOR = nSO42−/(nSO42− + nSO2) and NOR = nNO3−/(nNO3− + nNO2)). The higher SOR and NOR, the higher degree of oxidation of gaseous pollutants and the more sulfate and nitrate are generated [25,26]. Figure 4 shows SOR and NOR values in different seasons in Pingyin County. For the whole year, SOR and NOR were 0.30 ± 0.14 and 0.21 ± 0.12, respectively, with higher sulfur oxidation rate. The values of SOR were higher than NOR in spring, summer and winter, except for autumn. The mass concentration of NO3− was higher than SO42−, but nitrogen oxidation rate was lower than sulfur oxidation rate in Pingyin County. In terms of seasons, SOR and NOR showed different seasonal patterns. The SOR of the four seasons were 0.35 ± 0.14 in winter, 0.31 ± 0.18 in summer, 0.27 ± 0.11 in spring and 0.25 ± 0.09 in autumn. The SO2 emission and conversion rates were the highest in winter, resulting in the highest concentration of SO42−. In summer, although the emission of SO2 was low, the conversion rate was particularly high. NOR of the four seasons was 0.27 ± 0.11 in winter, 0.27 ± 0.12 in autumn, 0.15 ± 0.06 in spring and 0.11 ± 0.09 in summer. The nitrogen oxidation rates in winter and autumn were similar and significantly higher than those in spring and summer. The higher NOR in autumn is also one of the reasons for the significantly higher NO3− concentration level in autumn than in spring and summer.
The [NO3−]/[SO42−] ratio was applied to characterize the relative contributions of mobile sources and stationary sources. The average [NO3−]/[SO42−] ratios of Pingyin in spring, summer, autumn and winter were 0.7, 0.5, 2.4 and 1.9, respectively. The [NO3−]/[SO42−] ratios were lower in spring and summer and higher in autumn and winter. High temperatures, high humidity and strong solar radiation in summer favor the formation of SO42−. The distribution of NO3− across the gas phase, particle phase and different sizes of particulate matter is related to temperature, humidity, SO42− concentration and the concentration of crustal elements in the particulate matter. The combination of these potential factors causes seasonal variations in the [NO3−]/[SO42−] ratio.
3.4. The Estimation of Secondary Organic Carbon
The ratio of OC/EC is often used to identify the emission and transformation characteristics of carbon aerosol and to evaluate and identify secondary sources of particulate matter. EC mainly comes from incomplete combustion of carbon-containing raw materials. It has good stability and does not undergo obvious chemical reactions in the atmosphere, so it is used as a tracer of anthropogenic primary source emissions. OC can derive from both primary organic carbon (POC) directly emitted by pollution sources and secondary organic carbon (SOC) generated by photochemical reactions [27]. Chow et al. [28] assumed that OC/EC > 2 indicates SOC generation in the atmosphere, while Castro et al. [29] supposed that OC/EC > 1.1 indicates the existence of SOC. In addition to photochemical reactions, biomass combustion releases a large amount of OC and has relatively little effect on EC, resulting in a high OC/EC ratio. Zhang et al. [30] found that the average OC/EC reached 7.7 when studying the combustion of cereal straw in China.
OC includes primary organic carbon (POC) and secondary organic carbon (SOC). At present, there is a lack of comprehensive understanding of the complex atmospheric formation process and condensation/distribution mechanism of SOC, and there is no unified analysis method for direct measurement of SOC. In addition to directly simulating SOC generation under specific conditions using a smoke box, SOC concentration in atmospheric environment is generally estimated by indirect methods, such as the OC and EC concentration ratio method, organic molecule tracing method and numerical model prediction method [31]. Among them, the OC and EC concentration ratio method is the most simple and direct way and is widely used in identifying and assessing SOC pollution.
According to the OC/EC ratio method, the ratio of OC to EC concentration in particulate matters emitted by pollution sources is a relatively stable eigenvalue, which is related to the type of emission source. When the ratio of OC/EC in atmospheric particulate matter exceeds this value, it indicates the formation of SOC. According to this theory, Turpin and Huntzicker [32] proposed the calculation method of SOC:
TOC represents total organic carbon, and (OC/EC)pri represents the average OC/EC ratio of pollution sources. However, it is difficult and uncertain to determine the ratio, and investigation of the emission characteristics of various pollution sources in the region is required, considering the diurnal and seasonal fluctuations of emissions and meteorological conditions. Therefore, Castro et al. [29] proposed to estimate SOC according to the lowest OC/EC value.
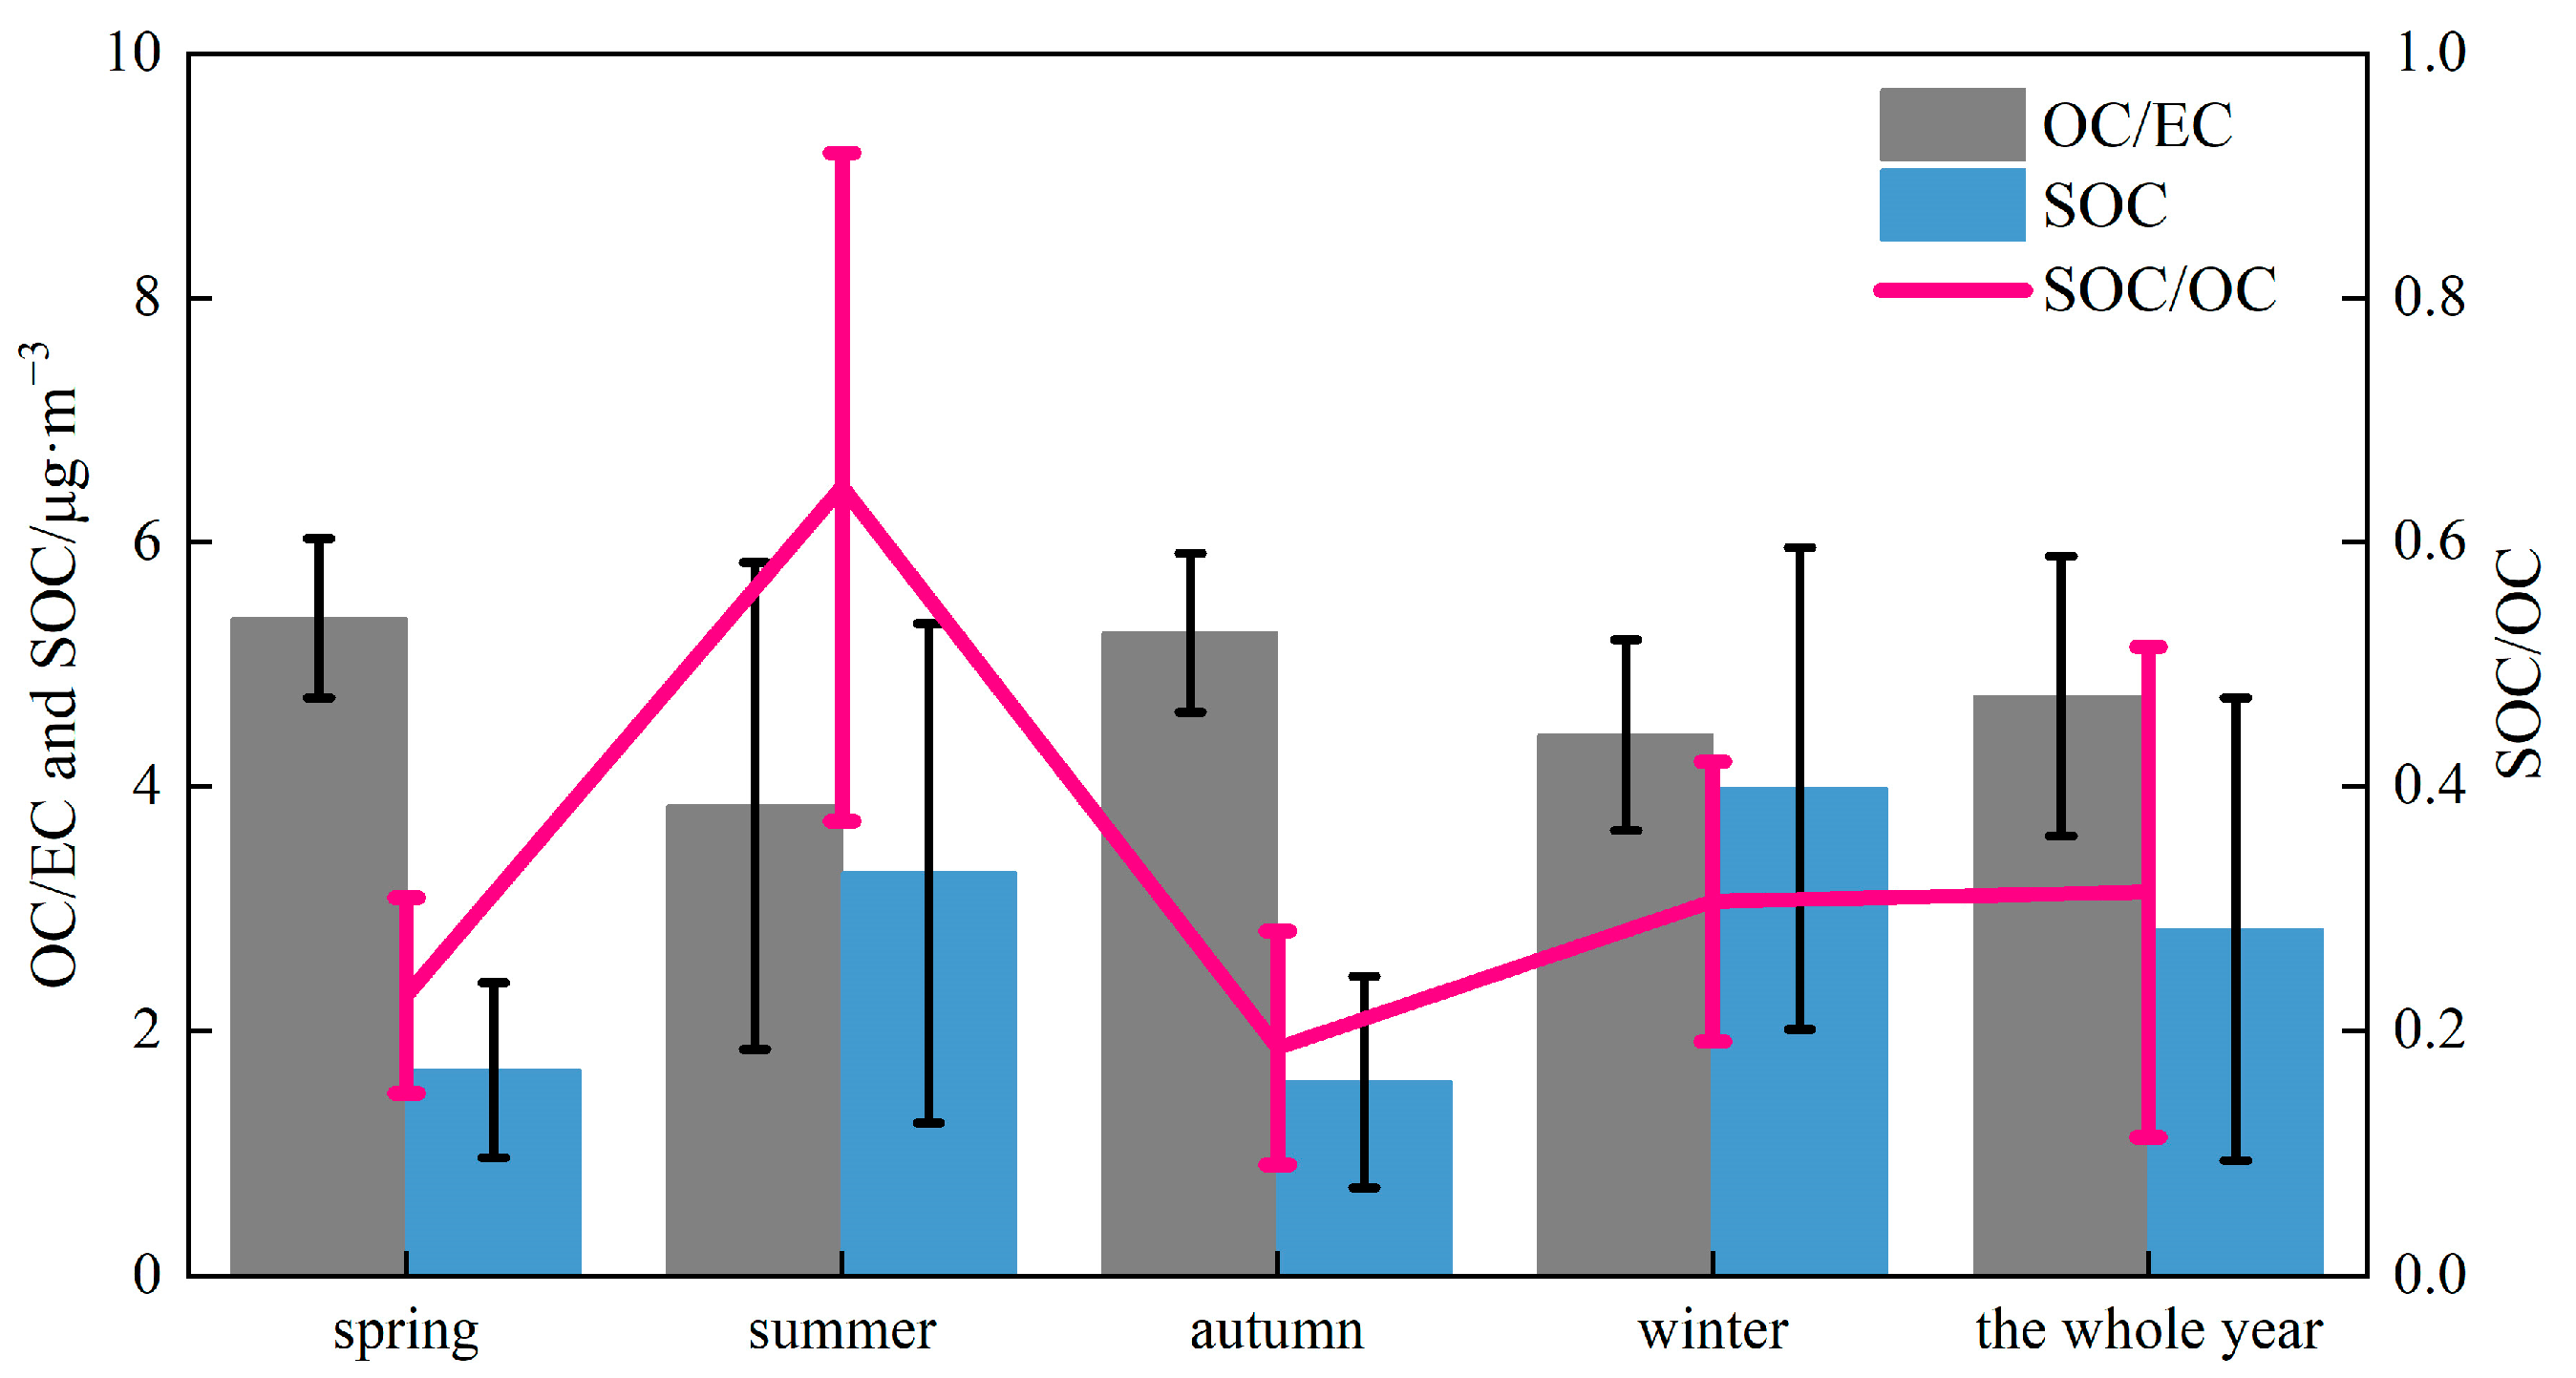
Figure 5 shows the OC/EC ratio, SOC concentration estimated based on this method and the SOC/OC ratio in Pingyin County in different seasons. The average OC/EC of the whole year was 4.7 ± 1.1, indicating the existence of secondary organic carbon formation. OC/EC in the four seasons were 5.4 ± 0.7 in spring, 5.3 ± 0.6 in autumn, 4.4 ± 0.8 in winter and 3.8 ± 2.0 in summer. The higher OC/EC in spring and autumn may be affected by biomass burning. The average SOC concentration in Pingyin County was 2.8 ± 1.9 μg·m−3, and the SOC concentration in four seasons was 4.0 ± 2.0 in winter, 3.3 ± 2.0 in summer, 1.7 ± 0.7 in spring and 1.6 ± 0.9 in autumn. Although the concentration of OC was lower in summer, the SOC concentration was relatively high. The annual average SOC/OC was 0.3 ± 0.2. About 30% of the OC in Pingyin County was SOC generated by secondary chemical reactions, and the primary organic carbon concentration accounted for about 70%. The SOC/OC of four seasons was 0.6 ± 0.3 in summer, 0.3 ± 0.1 in winter, 0.2 ± 0.1 in spring, and 0.2 ± 0.1 in autumn. The proportion of secondary generation was the highest in summer and the lowest in spring and autumn.
3.5. Source Apportionment of PM2.5
Referring to the analysis results of PM2.5 sources released by Jinan City, the emission sources are classified into five main categories: coal burning, mobile sources, dust, industry and others. Figure 6 shows the profile of each factor of the optimal solution of the PMF model. In factor 1, secondary components such as SO42−, NO3− and NH4+ had high contributions; they were considered as secondary sources [29]. In factor 2, the contribution of Na, S, P and other elements was high, which was the characteristic component of chemical enterprise emission, so it was regarded as the industrial source [29]. In factor 3, the contribution of Zn element was the highest, which was the characteristic component of vehicle emission. OC, EC and NO3− also had a certain contribution, which was higher than other components. Their mass concentration in factor 3 was 2.0, 0.5 and 3.0 μg·m−3, respectively. The mass of other elements in factor 3 was lower than 0.1 μg·m−3. Therefore, factor 3 can be identified as mobile source in view of the high contribution of NO3−, Zn, OC and EC [29]. In factor 4, the contribution of crustal elements such as Al, Si, Ca and Fe is high, usually deriving from the dust source. In factor 5, Cl− content was the highest and was the characteristic component of coal burning emissions, and the OC concentration was also dominant, so this factor was regarded as the source of coal burning. Figure S1 shows the time series of each source, and Table S1 summarizes the average concentrations and standard deviation of five sources in each season. The specific sources displayed seasonal patterns. The mean concentrations of coal combustion in autumn and winter were higher than those in spring and summer. The mean value of mobile source in different seasons was relatively approximated and ranged from 12.7 to 16.5 μg·m−3. The mean value of the dust source was the highest in spring. In addition, we analyzed the NO3−/SO42− ratios in different sources through the output of the PMF model. The characteristic values in each source were 2.29, 0.04, 8.12, 2.61 and 0.02 for the secondary source, industrial source, mobile source, dust and coal combustion, respectively. The NO3−/SO42− ratios in mobile source were the highest, and this was related to more NO3− precursors emitted by mobile source. The ratios in the industrial source and coal combustion were relatively low; these two sources mainly emitted the SO42− precursors. It was noticed that the ratio in the dust source was 2.61, and this may involve fugitive dust from vehicles.
Figure 7a shows the contribution of each source in Pingyin County based on PMF results. The secondary source accounted for the largest proportion, contributing 42%. The second was coal combustion, contributing 28%. The third contributor was mobile sources, accounting for 18%. The dust source and industrial source contributed 7% and 5%, respectively. The pollutant of the secondary source is mainly converted from the gaseous precursor SO2 and NO2 emitted by coal combustion, industry sources and motor vehicle exhaust. Therefore, we calculated the proportion of gaseous pollutants in each source and redistributed the secondary source with the proportion, with the help of the emission inventory of air pollution sources in Pingyin County. The final results are shown in Figure 7b. Coal combustion contributed the most to PM2.5 in Pingyin County, accounting for 36.5%. The contribution of the mobile source was close to that of coal source, at 32.6%. The third contributor was industrial sources, accounting for 17.4%. The contribution of dust and other emission sources to PM2.5 was 7.1% and 6.4%, respectively. The other source was from the secondary source allocation process, due to the emission of gas precursors from other sources, such as biomass burning. It can be seen that emissions from coal burning and mobile sources contribute the most to PM2.5 in Pingyin County, which needs to be focused on strengthening control.
In order to explore the spatial distribution of regional transport, the air mass backward trajectories were calculated at the sampling site by using the HYSPLIT-4 model. Combined with PSCF analysis, the potential pollution origins of PM2.5 in Pingyin are shown in Figure 8. The spatial distribution of pollution showed that the areas with high PSCF values (PSCF > 0.7) were mainly located in the northwest and northeast of the receptor sites, such as the central area of Shandong Province and the southern part of Hebei Province. In addition, there were some areas with high PSCF values in Central Henan Province and Southern Shandong Province; this indicated these areas also had effects on the receptor site. Therefore, it is critical to strengthen the overall regional joint prevention and treatment.
4. Conclusions
In 2019, the sum of 29 components of the PM2.5 concentration in Pingyin County of Jinan City was 53.8 μg·m−3, and the concentration of NO3− was the highest, which was 14.6 μg·m−3, followed by OC, SO42− and NH4+. Compared with the monitoring results in the background area and urban area of Jinan in 2016 and 2017, the concentration of PM2.5 components in Pingyin County did not decrease significantly. The SOR and NOR of Pingyin County were 0.30 and 0.21, respectively. The nitrogen oxidation rate was lower than that of sulfur oxidation rate in spring summer and winter, but the concentration of NO3− was higher than that of SO42− in these three seasons. The highest emission and conversion rates of SO2 were found in winter, resulting in the highest concentration of SO42−. In summer, although the emission of SO2 was relatively low, the conversion rate was noteworthy. The levels of nitrogen oxidation in winter and autumn were similar and significantly higher than those in spring and summer, and the higher NOR in autumn was also one of the reasons for the significantly higher NO3− concentration in autumn than in spring and summer. The mass concentration of OC was lower in summer, and the SOC concentration was higher. In the whole year, about 30% of the OC concentration in Pingyin County was SOC, generated by secondary chemical reactions, and the primary organic carbon concentration accounts for about 70%.
The results of PMF source analysis showed that coal burning contributed the most to PM2.5 in Pingyin County, accounting for 36.5%. The contribution of the mobile source was close to that of the coal source, at 32.6%. The third contributor was industrial sources, accounting for 17.4%. The contribution of dust and other emission sources to PM2.5 was 7.1% and 6.4%, respectively. Emissions from coal combustion and mobile sources contributed the most to PM2.5 in Pingyin County. It is suggested to focus on strengthening control, such as increasing the proportion of clean energy use, phasing out inefficient coal-fired boilers, promoting new energy vehicles and improving vehicle emission standards in order to reduce the concentration of PM2.5 in Pingyin County.
Supplementary Materials
The following supporting information can be downloaded at: https://www.mdpi.com/article/10.3390/atmos14050864/s1, Figure S1: Time series of different sources during sampling period; Table S1: The mean concentration of each source in different seasons (μg/m3).
Author Contributions
Conceptualization, Z.W. and J.G.; methodology, Z.W. and H.W.; data curation, S.L.; writing—original draft preparation, J.G.; writing—review and editing, Z.W.; project administration, Z.W.; funding acquisition, Z.W. All authors have read and agreed to the published version of the manuscript.
Funding
This research was funded by the National Key R&D Program of China, grant number 2022YFE0209500.
Institutional Review Board Statement
This study did not require ethical approval.
Informed Consent Statement
Not applicable.
Data Availability Statement
Data will be made available on request.
Conflicts of Interest
The authors declare no conflict of interest.
References
- Guo, J.; Li, L.; Wu, X.C.; Zhuang, T.; Liu, S.J.; Huang, X.J. Simulation study on the effect of key industrial sources on air quality in winter heavy pollution process in Jinan. Acta Sci. Circumstantiae 2019, 39, 134–142. [Google Scholar]
- An, Z.; Huang, R.-J.; Zhang, R.; Tie, X.; Li, G.; Cao, J.; Zhou, W.; Shi, Z.; Han, Y.; Gu, Z.; et al. Severe haze in northern China: A synergy of anthropogenic emissions and atmospheric processes. Proc. Natl. Acad. Sci. USA 2019, 116, 8657–8666. [Google Scholar] [CrossRef] [PubMed]
- Zheng, H.; Kong, S.; Yan, Q.; Wu, F.; Cheng, Y.; Zheng, S.; Wu, J.; Yang, G.; Zheng, M.; Tang, L.; et al. The impacts of pollution control measures on PM2.5 reduction: Insights of chemical composition, source variation and health risk. Atmos. Environ. 2019, 197, 103–117. [Google Scholar] [CrossRef]
- Yan, G.; Zhang, P.; Yang, J.; Zhang, J.; Zhu, G.; Cao, Z.; Fan, J.; Liu, Z.; Wang, Y. Chemical characteristics and source apportionment of PM2.5 in a petrochemical city: Implications for primary and secondary carbonaceous component. J. Environ. Sci. 2021, 103, 322–335. [Google Scholar] [CrossRef]
- Huang, R.-J.; Wang, Y.; Cao, J.; Lin, C.; Duan, J.; Chen, Q.; Li, Y.; Gu, Y.; Yan, J.; Xu, W.; et al. Primary emissions versus secondary formation of fine particulate matter in the most polluted city (Shijiazhuang) in North China. Atmos. Chem. Phys. 2019, 19, 2283–2298. [Google Scholar] [CrossRef]
- Huang, X.; Liu, Z.; Liu, J.; Hu, B.; Wen, T.; Tang, G.; Zhang, J.; Wu, F.; Ji, D.; Wang, L.; et al. Chemical characterization and source identification of PM2.5 at multiple sites in the Beijing-Tianjin-Hebei region, China. Atmos. Chem. Phys. 2017, 17, 12941–12962. [Google Scholar] [CrossRef]
- Zhang, Q.; He, K.; Huo, H. Cleaning China’s air. Nature 2012, 484, 161–162. [Google Scholar] [CrossRef]
- Wei, X.F.; Tan, L.Y.; Sun, Y.M.; Zhu, L.; Zhang, G.Q. Impact on water soluble ions in PM2.5 during heating period in Jinan city by a policy of clean energy. Ecol. Environ. Sci. 2019, 28, 1416–1422. [Google Scholar]
- Xia, Z.Y.; Fu, H.X.; Lv, C.; Zhang, W.J.; Li, M.; Sun, F.J. Pollution characteristics of PM2.5 and components during heavy air pollution period in Jinan urban area and clean air site. Ecol. Environ. Sci. 2019, 28, 958–963. [Google Scholar]
- Liu, Y.Y.; Yin, B.H.; Wang, J.; Wang, X.H.; Hou, L.J.; Ma, Y.H.; Wang, J.; Zhao, X.M.; Jiang, Y. Characteristics of airborne particles compositions during winter heavy pollution days in Ji’nan. Environ. Chem. 2018, 37, 2749–2757. [Google Scholar]
- Li, M.; Wang, L.; Liu, J.; Gao, W.; Song, T.; Sun, Y.; Li, L.; Li, X.; Wang, Y.; Liu, L.; et al. Exploring the regional pollution characteristics and meteorological formation mechanism of PM2.5 in North China during 2013–2017. Environ. Int. 2020, 134, 105283. [Google Scholar] [CrossRef] [PubMed]
- Kong, S.F.; Li, L.; Li, X.X.; Yin, Y.; Chen, K.; Liu, D.T.; Yuan, L.; Zhang, Y.J.; Shan, Y.P.; Ji, Y.Q. The impacts of firework burning at the Chinese Spring Festival on air quality: Insights of tracers, source evolution and aging processes. Atmos. Chem. Phys. 2015, 15, 2167–2184. [Google Scholar] [CrossRef]
- Paatero, P.; Tapper, U. Positive Matrix Factorization—A Nonnegative Factor Model with Optimal Utilization of Error-Estimates Of Data Values. Environmetrics 1994, 5, 111–126. [Google Scholar] [CrossRef]
- Mazzei, F.; D’Alessandro, A.; Lucarelli, F.; Nava, S.; Prati, P.; Valli, G.; Vecchi, R. Characterization of particulate matter sources in an urban environment. Sci. Total Environ. 2008, 401, 81–89. [Google Scholar] [CrossRef] [PubMed]
- Zhang, W.J.; Li, M.; Fu, H.X.; Ge, X.; Lv, B.; Wang, Z.F.; Li, H.B. Pollution characteristics and chemical composition and of PM2.5 in Jinan. Environ. Pollut. Control 2019, 41, 1490–1494. [Google Scholar]
- Bie, S.J.; Yang, L.X.; Gao, Y.; Jiang, P.; Li, Y.Y.; Yang, Y.M.; Zhao, T.; Wang, W.X. Characteristics of Atmospheric PM2.5 Pollution and Its Influence on Visibility inBackground Areas of Ji’nan. Environ. Sci. 2019, 40, 3868–3874. [Google Scholar]
- Liu, X.D.; Meng, J.J.; Hou, Z.F.; Li, J.; Xing, J.Z.; Wei, B.J.; Zhang, E.X.; Liu, J.Z.; Dong, J. Analysis of Seasonal Variations in Chemical Characteristics and Sources of PM2.5 During Summer and Winter in Ji’nan City. Environ. Sci. 2018, 39, 4014–4025. [Google Scholar]
- Sharma, S.K.; Mandal, T.K.; Jain, S.; Saraswati; Sharma, A.; Saxena, M. Source Apportionment of PM2.5 in Delhi, India Using PMF Model. Bull. Environ. Contam. Toxicol. 2016, 97, 286–293. [Google Scholar] [CrossRef]
- Alwadei, M.; Srivastava, D.; Alam, M.S.; Shi, Z.; Bloss, W.J. Chemical characteristics and source apportionment of particulate matter (PM2.5) in Dammam, Saudi Arabia: Impact of dust storms. Atmos. Environ. X 2022, 14, 100164. [Google Scholar] [CrossRef]
- Park, J.; Kim, H.; Kim, Y.; Heo, J.; Kim, S.-W.; Jeon, K.; Yi, S.-M.; Hopke, P.K. Source apportionment of PM2.5 in Seoul, South Korea and Beijing, China using dispersion normalized PMF. Sci. Total Environ. 2022, 833, 155056. [Google Scholar] [CrossRef]
- Xie, Y.; Liu, Z.; Wen, T.; Huang, X.; Liu, J.; Tang, G.; Yang, Y.; Li, X.; Shen, R.; Hu, B.; et al. Characteristics of chemical composition and seasonal variations of PM2.5 in Shijiazhuang, China: Impact of primary emissions and secondary formation. Sci. Total Environ. 2019, 677, 215–229. [Google Scholar] [CrossRef]
- Wang, J.; Li, X.; Zhang, W.; Jiang, N.; Zhang, R.; Tang, X. Secondary PM2.5 in Zhengzhou, China: Chemical Species Based on Three Years of Observations. Aerosol Air Qual. Res. 2016, 16, 91–104. [Google Scholar] [CrossRef]
- Luo, G.; Wang, T.J.; Zhao, M.; Wang, D.Y.; Cao, Y.Q.; Chen, C. Chemical composition and source apportionment of fine particulate matter in Xianlin area of Nanjing basing on-line measurement. China Environ. Sci. 2020, 40, 1857–1868. [Google Scholar]
- Zhang, S.; Xing, J.; Sarwar, G.; Ge, Y.; He, H.; Duan, F.; Zhao, Y.; He, K.; Zhu, L.; Chu, B. Parameterization of heterogeneous reaction of SO2 to sulfate on dust with coexistence of NH3 and NO2 under different humidity conditions. Atmos. Environ. 2019, 208, 133–140. [Google Scholar] [CrossRef] [PubMed]
- Pandolfi, M.; Amato, F.; Reche, C.; Alastuey, A.; Otjes, R.P.; Blom, M.J.; Querol, X. Summer ammonia measurements in a densely populated Mediterranean city. Atmos. Chem. Phys. 2012, 12, 7557–7575. [Google Scholar] [CrossRef]
- Ding, A.; Huang, X.; Nie, W.; Chi, X.; Xu, Z.; Zheng, L.; Xu, Z.; Xie, Y.; Qi, X.; Shen, Y.; et al. Significant reduction of PM2.5 in eastern China due to regional-scale emission control: Evidence from SORPES in 2011–2018. Atmos. Chem. Phys. 2019, 19, 11791–11801. [Google Scholar] [CrossRef]
- Wang, Z.; Zhang, D.; Liu, B.; Li, Y.; Chen, T.; Sun, F.; Yang, D.; Liang, Y.; Chang, M.; Yang, L.; et al. Analysis of chemical characteristics of PM2.5 in Beijing over a 1-year period. J. Atmos. Chem. 2016, 73, 407–425. [Google Scholar] [CrossRef]
- Chow, J.C.; Watson, J.G.; Lu, Z.Q.; Lowenthal, D.H.; Frazier, C.A.; Solomon, P.A.; Thuillier, R.H.; Magliano, K. Descriptive analysis of PM2.5 and PM10 at regionally representative locations during SJVAQS/AUSPEX. Atmos. Environ. 1996, 30, 2079–2112. [Google Scholar] [CrossRef]
- Castro, L.M.; Pio, C.A.; Harrison, R.M.; Smith, D.J.T. Carbonaceous aerosol in urban and rural European atmospheres: Estimation of secondary organic carbon concentrations. Atmos. Environ. 1999, 33, 2771–2781. [Google Scholar] [CrossRef]
- Zhang, Y.-X.; Shao, M.; Zhang, Y.-H.; Zeng, L.-M.; He, L.-Y.; Zhu, B.; Wei, Y.-J.; Zhu, X.-L. Source profiles of particulate organic matters emitted from cereal straw burnings. J. Environ. Sci. 2007, 19, 167–175. [Google Scholar] [CrossRef]
- Zheng, M.; Yan, C.Q.; Li, X.Y.; Wang, X.S.; Zhang, Y.H. A review of methods for quantifying secondary organic aerosol. China Environ. Sci. 2014, 34, 555–564. [Google Scholar]
- Turpin, B.J.; Huntzicker, J.J. Identification of Secondary Organic Aerosol Episodes and Quantitation of Primary and Secondary Organic Aerosol Concentrations during Scaqs. Atmos. Environ. 1995, 29, 3527–3544. [Google Scholar] [CrossRef]
Figure 1.
Location of the monitoring site.

Figure 2.
Average concentrations and standard deviations of chemical compositions of PM2.5 during sampling period (the error bar shows the standard deviation).
Figure 2.
Average concentrations and standard deviations of chemical compositions of PM2.5 during sampling period (the error bar shows the standard deviation).

Figure 3.
Concentrations of chemical compositions of PM2.5 in different seasons (the error bar shows the standard deviation).
Figure 3.
Concentrations of chemical compositions of PM2.5 in different seasons (the error bar shows the standard deviation).

Figure 4.
SOR and NOR in different seasons (the error bar shows the standard deviation).

Figure 5.
OC/EC, SOC and SOC/OC in different seasons (the error bar shows the standard deviation).

Figure 6.
Profiles of five sources modeled by PMF in Pingyin (black dot: source profile, green column: mass concentration).
Figure 6.
Profiles of five sources modeled by PMF in Pingyin (black dot: source profile, green column: mass concentration).

Figure 7.
Source contribution of PM2.5 (a), the final results of PM2.5 source apportionment after secondary source reallocation (b).
Figure 7.
Source contribution of PM2.5 (a), the final results of PM2.5 source apportionment after secondary source reallocation (b).

Figure 8.
PSCF distribution of PM2.5 in Pingyin.


Table 1.
Concentrations of chemical compositions of PM2.5 in different studies.
| Sampling Time | Site | Concentration (μg·m−3) | |||||
|---|---|---|---|---|---|---|---|
| OC | EC | NO3− | SO42− | NH4+ | |||
| 2019 | Industrial district | 9.3 | 2.2 | 14.6 | 9.1 | 8.1 | This study |
| 2017 | Jinan urban site | 9.10 | 2.68 | 13.55 | 12.85 | 7.89 | Zhang et al. [15] |
| 2016 | Jinan background site | 10.0 | 1.0 | 14.3 | 10.9 | 9.5 | Bie et al. [16] |
| 2015 | Jinan urban site | 13.5 | 5.1 | 15.4 | 22.9 | 13.1 | Liu et al. [17] |
| 2016 | Delhi urban area | 17.9 | 10.4 | 10.0 | 12.9 | 9.4 | Sharma et al. [18] |
| 2018 | Dammam city left | 6.3 | 1.8 | 3.4 | 7.0 | 3.9 | Alwadei et al. [19] |
| 2015 | Seoul urban site | 6.3 | 0.97 | 6.8 | 6.6 | 4.4 | Park et al. [20] |
| 2015 | Shijiazhuang | 22.3 | 8.6 | 20.2 | 22.6 | 13.8 | Xie et al. [21] |
| 2013 | Zhengzhou | 33.0 | 6.0 | 27.0 | 44.0 | 19.0 | Zhang et al. [22] |
Disclaimer/Publisher’s Note: The statements, opinions and data contained in all publications are solely those of the individual author(s) and contributor(s) and not of MDPI and/or the editor(s). MDPI and/or the editor(s) disclaim responsibility for any injury to people or property resulting from any ideas, methods, instructions or products referred to in the content. |
© 2023 by the authors. Licensee MDPI, Basel, Switzerland. This article is an open access article distributed under the terms and conditions of the Creative Commons Attribution (CC BY) license (https://creativecommons.org/licenses/by/4.0/).
Share and Cite
MDPI and ACS Style
Guo, J.; Wang, H.; Liu, S.; Wang, Z. Chemical Characteristics and Source Apportionment of PM2.5 in Western Industrial Region of Jinan. Atmosphere 2023, 14, 864. https://doi.org/10.3390/atmos14050864
AMA Style
Guo J, Wang H, Liu S, Wang Z. Chemical Characteristics and Source Apportionment of PM2.5 in Western Industrial Region of Jinan. Atmosphere. 2023; 14(5):864. https://doi.org/10.3390/atmos14050864
Chicago/Turabian StyleGuo, Jian, Haiyong Wang, Shanjun Liu, and Zhanshan Wang. 2023. "Chemical Characteristics and Source Apportionment of PM2.5 in Western Industrial Region of Jinan" Atmosphere 14, no. 5: 864. https://doi.org/10.3390/atmos14050864
Note that from the first issue of 2016, this journal uses article numbers instead of page numbers. See further details here.