
Traits of Adaptive Outdoor Thermal Comfort in a Tropical Urban Microclimate
by
 , , , ,
Chng Saun Fong
1,2,*,
Suneja Manavvi
3,
Radhakrishnan Shanthi Priya
4,*,
Logaraj Ramakreshnan
1,
Nik Meriam Sulaiman
2 and
Nasrin Aghamohammadi
5,6 1
Institute for Advanced Studies, Universiti Malaya, Kuala Lumpur 50603, Malaysia
2
University Malaya Sustainability and Development Centre (UMSDC), Universiti Malaya, Kuala Lumpur 50603, Malaysia
3
Department of Architecture and Planning, Indian Institute of Technology, Roorkee 247667, India
4
School of Architecture and Interior Design, SRM Institute of Science and Technology, Kattankulathur 603203, India
5
Department of Social and Preventative Medicine, Faculty of Medicine, University of Malaya, Kuala Lumpur 50603, Malaysia
6
Harry Butler Institute, College of Environment and Life Sciences, Murdoch University, Murdoch, WA 6150, Australia
*
Authors to whom correspondence should be addressed.
Atmosphere 2023, 14(5), 852; https://doi.org/10.3390/atmos14050852
Submission received: 7 March 2023
/
Revised: 27 April 2023
/
Accepted: 2 May 2023
/
Published: 10 May 2023
(This article belongs to the Special Issue Urban Microclimate: Thermal Comfort, Air Quality and Green Building as Drivers of Healthy Urban Design)
Abstract
:Urban heat islands (UHIs) are negatively impacting the quality of the urban environment and outdoor thermal comfort (OTC) levels, which have raised concerns regarding their impact on urban health and well-being. Understanding of OTC level is crucial, particularly in tropical cities with year-round high temperatures and humidity. A study was conducted in Kuala Lumpur (KL), Malaysia, to determine the OTC level in a selected urban area through microclimate measurements and questionnaire surveys with 1157 respondents. Over half of the urban dwellers reported thermal discomfort, with a high perceived OTC level, indicating strong thermal adaptive behaviours among the urban dwellers despite the physiological stress. Confounding factors such as urban morphology, land cover and human activity patterns also influence the OTC level in the tropical city. The findings emphasize the need for interventions to improve the urban environment and promote better outdoor thermal comfort for city dwellers through measures such as green infrastructure, UHI mitigation and increasing public awareness.
1. Introduction
The Intergovernmental Panel on Climate Change (IPCC) warns that anthropogenic activities have increased global temperatures by about 1 °C and has forecasted a further increase by 1.5 °C between 2030 and 2052 if the current situation persists unmanaged [1]. The 2019 Global Risk Report highlighted that the extreme weather events and failure of climate-change mitigation and adaptation measures will be catastrophic, with a high likelihood of occurrence in the near future [2]. In addition to global climate change, the heating phenomenon is intensified in urban areas due to the formation of urban heat islands (UHIs) [3,4,5]. The UHI effect is a type of urban thermal pollution that happens due to higher ambient air temperatures in densely-built environments compared to their rural peripheries [6,7,8,9,10,11,12,13,14]. Consequently, urban dwellers are prone to higher and longer levels of heat exposure, which cause the deterioration of outdoor thermal comfort (OTC) levels [15,16,17,18,19] and impact their well-being [20]. A constant rise in temperature will also lead to the aggravation of heat-related illnesses and mortalities [21,22,23,24].
Currently, more than 50% of the world’s population is living in urban areas [25] and half of the world’s population is concentrated in the tropics [23,26]. Therefore, studies are focusing on identifying new strategies to enhance the liveability in tropical cities [27,28]. Considering the large population within tropical regions where it is constantly hot and humid throughout the year, knowledge of OTC has become imperative to intervene in the expected rise of heat stress in the future. Limited studies on human OTC in the tropics [29,30,31,32,33,34,35] emphasize an urgent need for more scholarly studies identifying the severity of the issue and the need for intervention. Furthermore, a thorough understanding of the UHI impacts on society, economy and environment is important, especially among stakeholders, to plan and carry out effective UHI mitigation measures [28,36,37].
In line with this, the present study describes the findings from field measurements and a questionnaire survey to examine the OTC levels of urban dwellers in Kuala Lumpur (KL), Malaysia, one of the fastest-growing metropolitan cities in the tropics. The influence of the urban microclimate on the OTC level is expressed as physiological heat stress and perceived OTC. Of note, the urban area in this study was carefully chosen to represent heterogeneous urban morphology based on its built types and land cover types as suggested in the local climate zone scheme [38]. The OTC assessment approach of Fong et al. [21], which accounts for thermal adaptive behaviour in the tropical region of Southeast Asia, was used in this study.
2. Materials and Methods
2.1. Description of Study Area
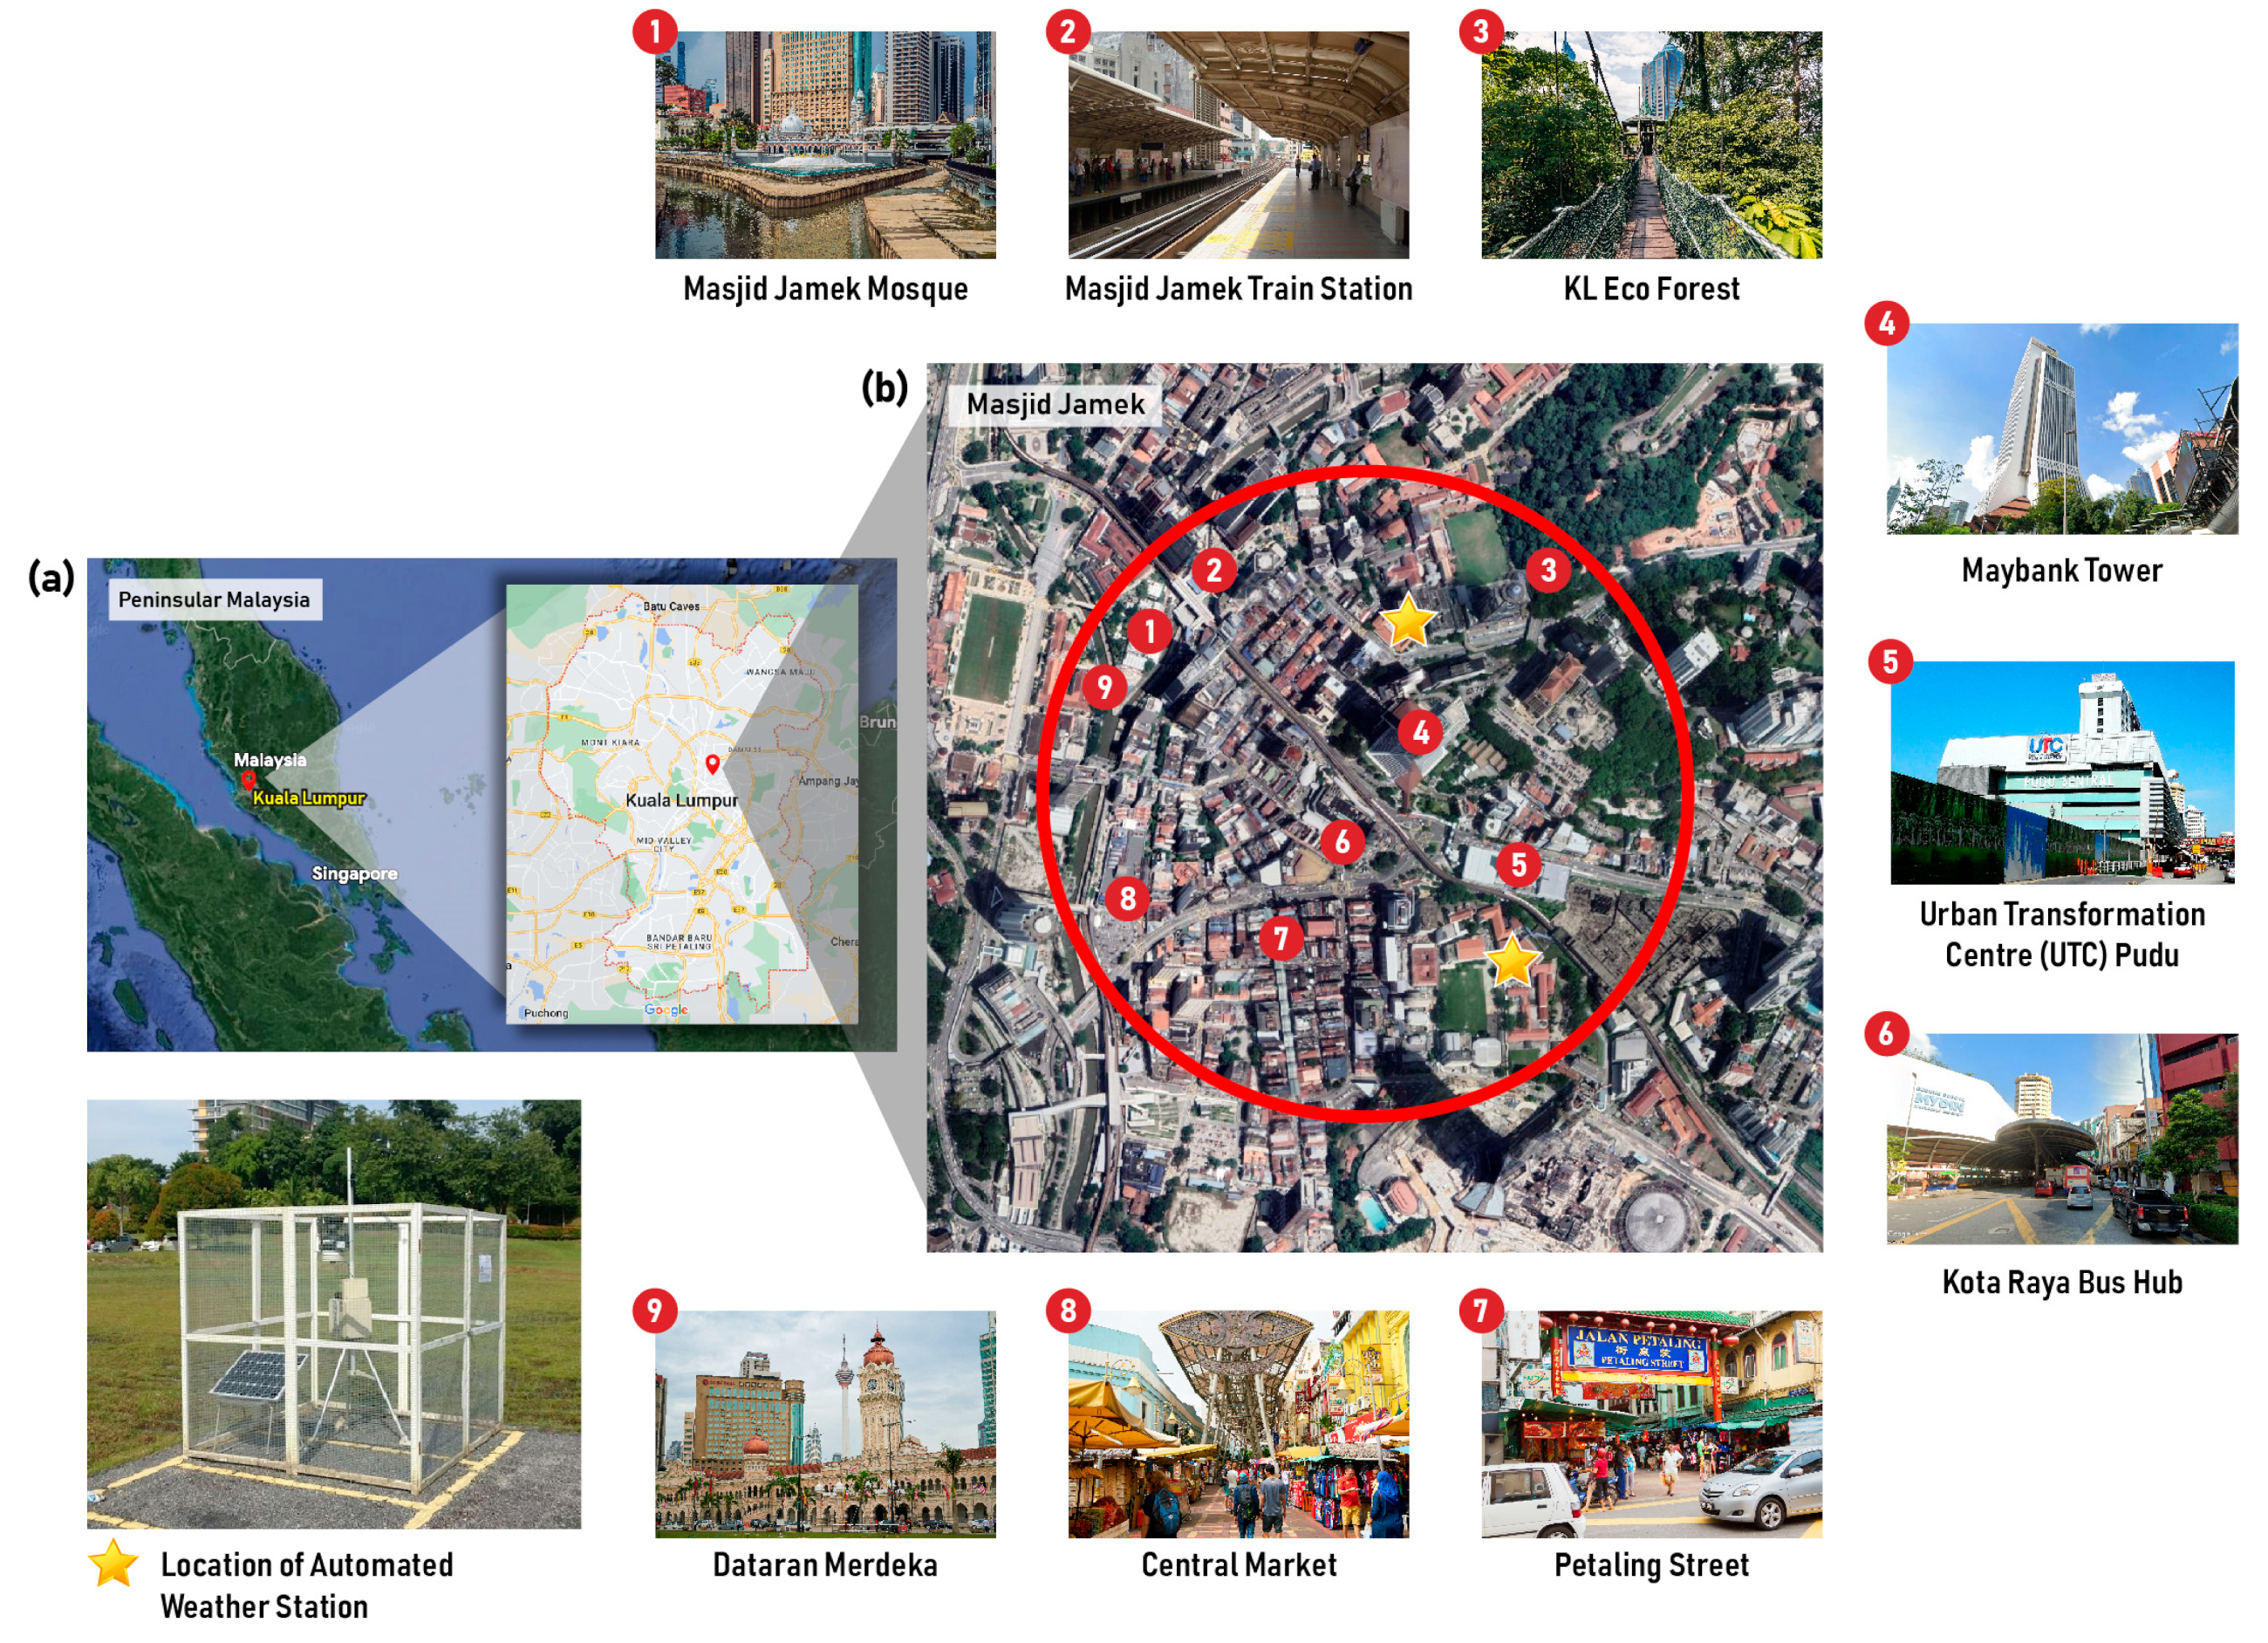
Kuala Lumpur (KL) is one of the fastest-growing cities in tropical Southeast Asia. KL experiences a tropical rainforest climate (Af) characterized by near-uniform monthly mean temperature (26.8–27.0 °C) and high mean relative humidity (63–68%) [35,39]. For microclimate studies, a radius of 200 to 500 m is recommended for the air temperature to form a stable internal boundary layer that does not overlap with adjacent thermal climate zones [38]. Following this recommendation, Masjid Jamek (MJ), located at the city centre of KL, was chosen for microclimatic measurements within a 500 m radius in this study. MJ was chosen due to its role as the centre of an economic hub which also has a multifunctional role in commercial, transportation and educational aspects. Moreover, MJ is adjacent to Dataran Merdeka, which was found to be the hottest (highest ambient temperature of 37 °C) among the 75 locations measured in the KL city centre [40].
In terms of built types, the study area represents a heterogeneous built type that is characterized by high-rise and mid-rise buildings. High-rise buildings in this study area consist of condominiums, residential suites, business suites and office towers, whereas mid-rise buildings consist of schools, temples, churches, hospitals and commercial lots. There are 40 buildings in the study area. The highest building in the study area is 60 m tall, while the lowest building is 3 m tall. The mean building height in the study area is 17 m, or about 6 floors (1 floor is approximately 3 m in height). The land cover type consists of a mixture of dense trees near the Kuala Lumpur Eco Forest reserve and scattered trees of bushes and shrubs along the roadsides. In addition, there is heavy human and traffic activity in this study area, especially during the peak hours due to the central bus station at Kota Raya and the Mass Rapid Transport stations of Pudu Raya and Masjid Jamek interchange stations. Other local hotspots in Masjid Jamek are shown in Figure 1b. There are also several prominent roads passing through this area, such as Jalan Tun Perak, Jalan Raja Chulan, Jalan Pudu, Jalan Tun Tan Cheng Lok and Jalan Petaling. In short, MJ was chosen due to its urban morphology representing heterogeneous built-type and land cover properties which are commonly found in KL and other tropical cities. A map of the study area is shown in Figure 1.
2.2. Urban Microclimate Measurements
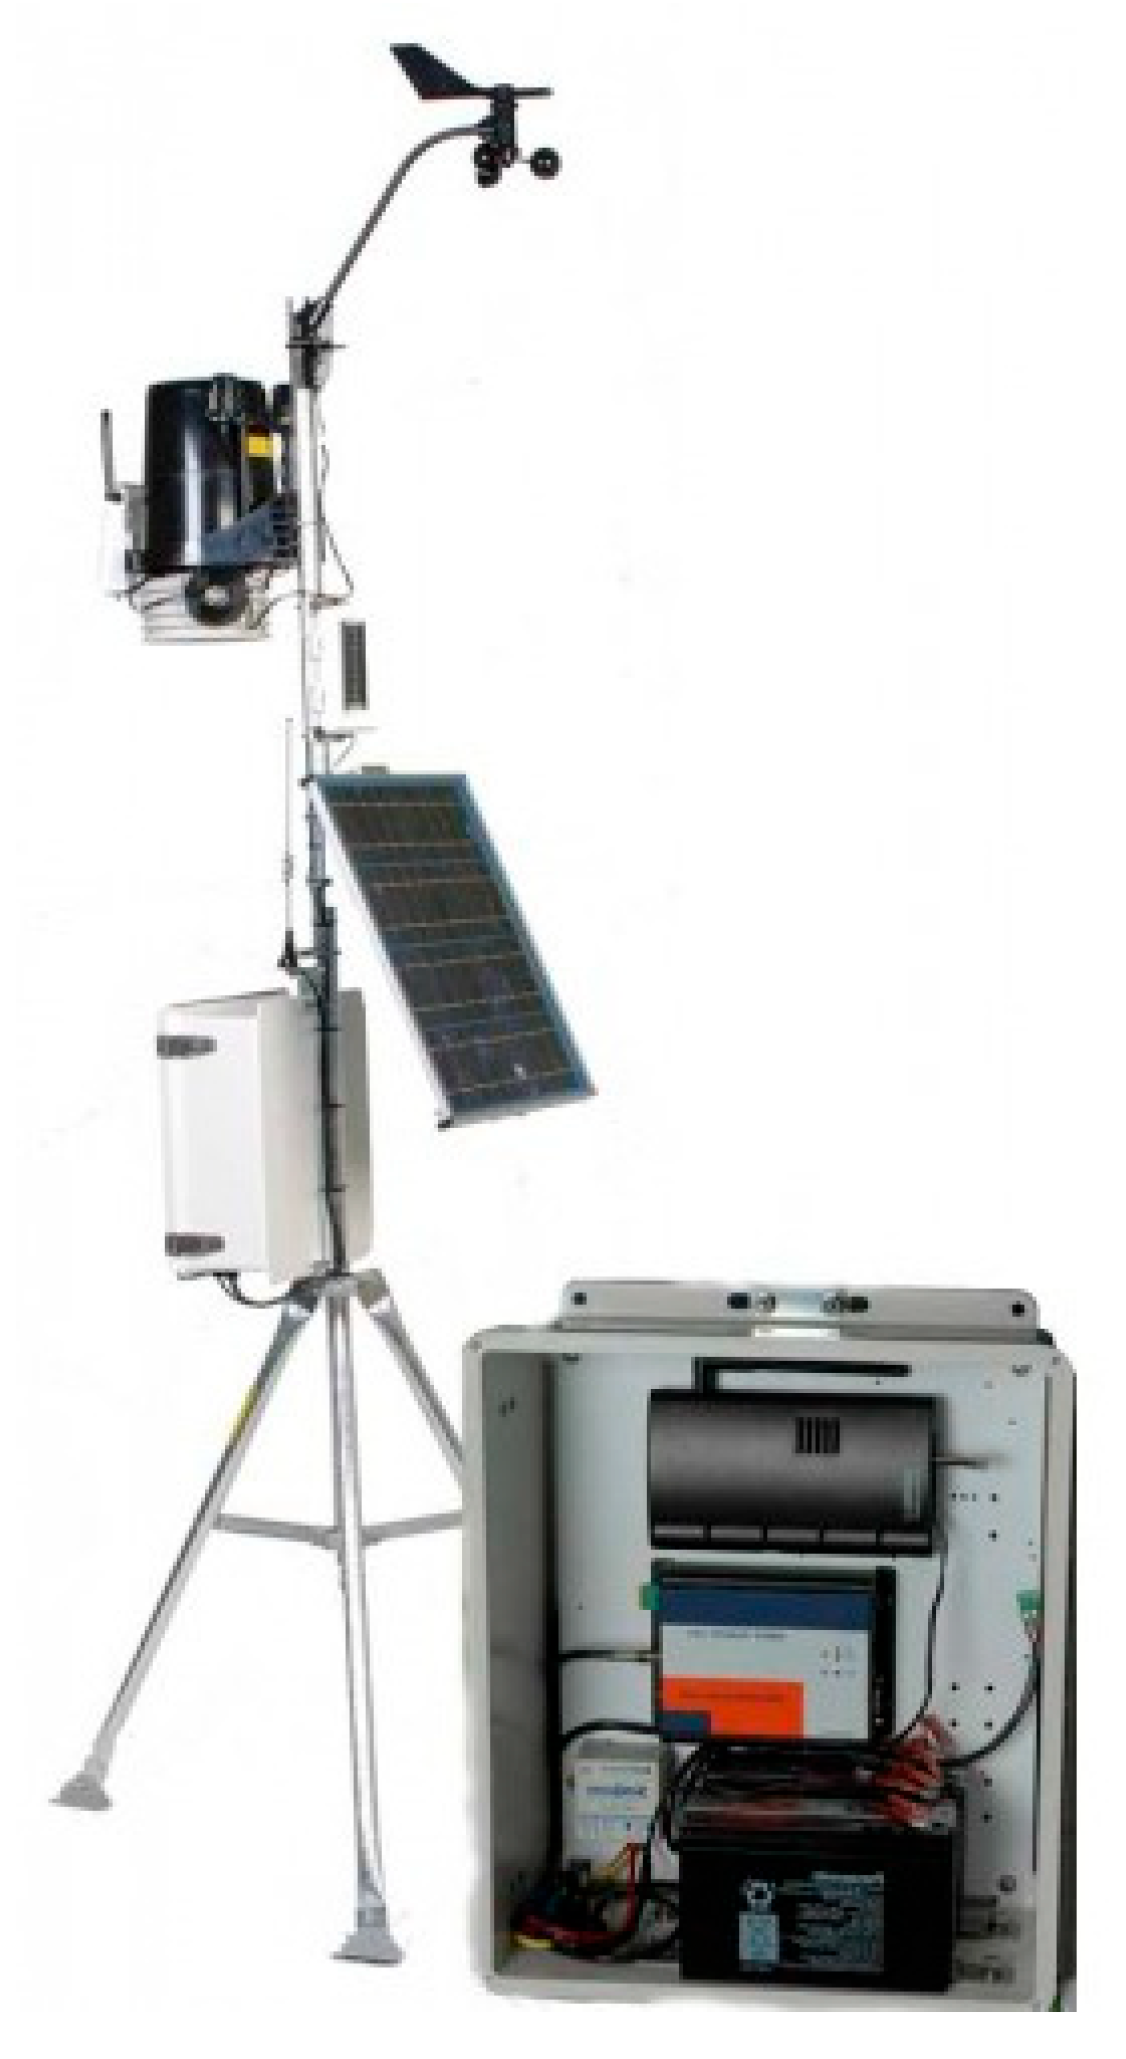
Two automated weather stations (AWSs) were deployed to collect key meteorological data such as air temperature (Ta), relative humidity (RH), wind speed (WS), wind direction (WD) and solar radiation (SR) in the selected study area (Figure 1b) from January to December 2018. The height of the instrument was set to 1.5 m above the ground surface to record urban heat exposure at a human-height level [21]. The list of parameters collected by the AWS along with their specifications is presented in Table 1. The meteorological data were collected at 5 min intervals and stored in the data logger before being transmitted and kept in the cloud storage. To ensure the accuracy and reliability of data collected by the AWS, the calibration of sensors was conducted twice a year. The AWS model, Vantage Pro2™ (6152, 6153) (Davis Instruments Corporation, Hayward, CA, USA). along with its integrated sensors are made in the United States of America by Davis Instrument. The setup of AWS is shown in Figure 2.
2.3. The Assessment of Outdoor Thermal Comfort
An adaptive steady-state approach is adopted in this study to provide a thorough understanding of the OTC level in the study area [41,42,43,44,45,46]. The adaptive approach in OTC assessment evaluates physiological heat stress and perceived OTC.
2.3.1. Evaluating Physiological Heat Stress via Physiological Equivalent Temperature Index
The Physiological Equivalent Temperature (PET) index is selected to express physiological heat stress. PET is the air temperature where the heat balance of the human body is equalized between two human body nodes (core and skin) under typical indoor settings equal to the complex outdoor conditions being assessed [47,48,49]. Meteorological data which are collected and collated from the AWS were used for the estimation of PET via the RayMan model (Version 1.1). The average clothing value is assumed to be 0.30 clo (1 clo = 0.155 °C m2/W), while the metabolic rate was assumed to be 1.4 met for standing (1 met = 58.15 W/m2) [50].
2.3.2. Evaluating Perceived Outdoor Thermal Comfort via Questionnaire Survey
The questionnaire survey on perceived OTC was conducted involving urban dwellers within the study area (Figure 1b: Site 4 and 6). The bilingual questionnaire consisted of three sections including socio-demographic information, OTC assessment and human health implications due to urban heat exposure. The findings of human health implications due to severe urban heat exposure are published separately elsewhere [22]. In the sociodemographic section, in addition to obtaining basic information, respondents were also asked about the average duration spent outdoors and the main outdoor activities that they usually do in a day. In the OTC assessment section, respondents were required to express their thermal sensation, preference, acceptability and comfort levels using established Likert scales in accordance with ISO 10551: “Ergonomics of The Thermal Environment-Assessment of The Influence of the Thermal Environment Using Subjective Judgement Scales” [51]. The Modified ASHRAE scale of “+2” and “+3” representing “hot” and “very hot” was found to better define the hot conditions in a tropical climate as compared to “+2” and “+3” representing “warm” and “hot”, respectively [52]. Therefore, this modified ASHRAE scale is referred to in this study.
2.3.3. Sampling Method
A clustered random sampling was used for the preliminary screening of respondents to be included in the study. Respondents who fulfilled two inclusion criteria were invited to answer the questionnaire. Firstly, respondents had to be urban dwellers found within the selected study area. Secondly, the respondents had to be exposed to the outdoor environment for at least 10 to 15 min prior to answering the questionnaire. To minimize the influence of thermal adaptation, the methodology of Kurazumi et al. [53] was adopted in this study. Respondents that did not fulfil the two criteria were eventually excluded from the study. The variations in UHI intensity in KL were found to vary between 08:00 and 20:00 h [7]. To address the variations in microclimatic conditions within a day, the period for data collection was set for 12 hours from 08:00 to 20:00 h following the UHI intensity variations in KL. Heat fluxes are also found to be significantly influenced by precipitation [54]. Hence, the time frame of data collection was carefully chosen to avoid rainy days, as they will influence the surrounding thermal environment and subsequently the OTC level. Weather forecasts from the Department of Meteorology, Malaysia (MetMalaysia), were referred to in advance so that the data collection could be conducted on clear and non-rainy days.
2.3.4. Ethical Consideration
This study was approved by the University of Malaya Research Ethics Committee (UM.TNC2/UMREC-691). Informed consent was obtained verbally. Respondents were informed that their participation is voluntary, and any information obtained from the survey is kept confidential and will only be used for this study.
2.4. Data Analyses
All statistical evaluation was conducted using SPSS software (version 25). SPSS is a Windows-based program that can be used to perform data entry and analysis. It is capable of handling large amounts of data and can perform a wide range of quantitative and qualitative analyses. To control the influence of wet days on heat flux, the data from the AWS were extracted and pre-processed to only include meteorological parameters from non-rainy days. Descriptive statistics were conducted to identify the temporal variations in urban microclimate and sociodemographic profiles. In addition, the prevalence of physiological heat stress and perceived OTC among urban dwellers were determined as well. Univariate binary logistic regression was conducted to identify the association between physiological heat stress and selected sociodemographic variables.
3. Results
3.1. Variations in Urban Microclimate at Masjid Jamek
Continuous monitoring of the urban microclimate was carried out from January to December 2018. The mean and standard deviation of the urban microclimate are presented in Table 2.
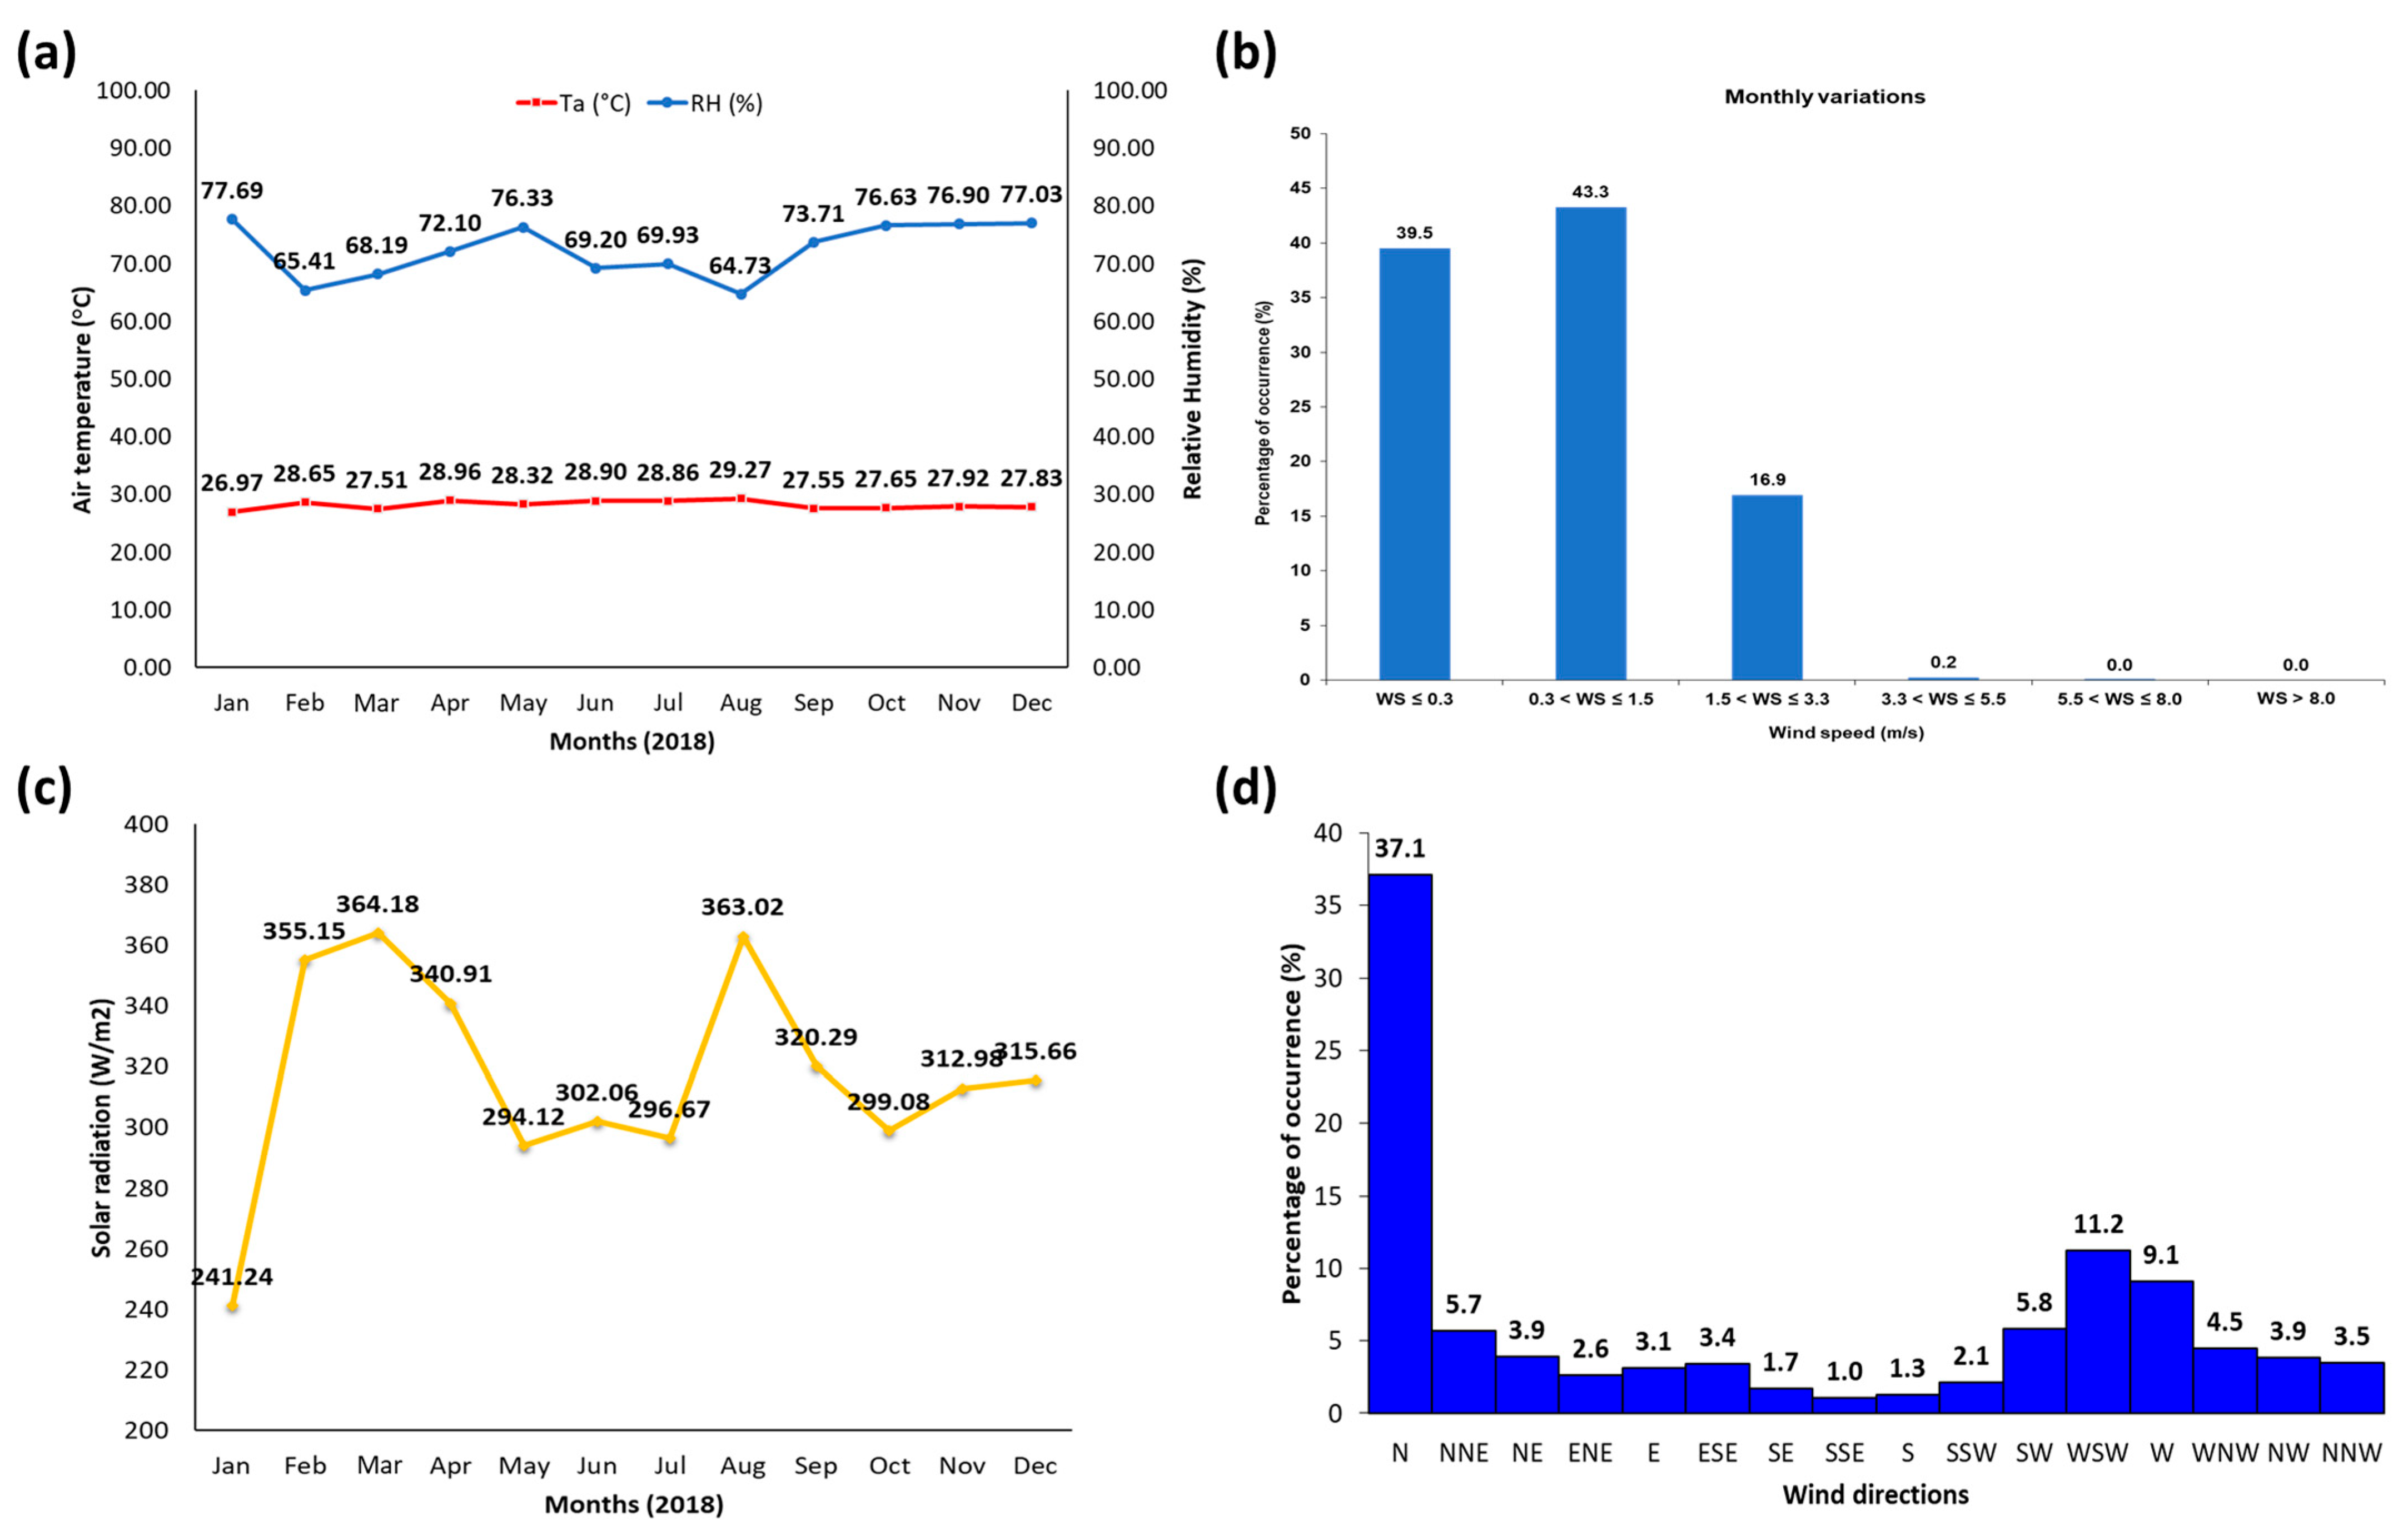
The monthly average of Ta ranged from 26.97 to 29.27 °C, whereas the monthly average of RH ranged from 64.73 to 77.69%. It was observed that the coolest month was January 2018 while the hottest month was August 2018. In terms of humidity, August 2018 was found to be the driest, and January 2018 was the wettest month. In terms of SR, the monthly average ranged from 241.24 to 364.18 W/m2 while the daily average of SR was 98.21 W/m2 (SD = 119.74 W/m2).
The WS in the selected study area was found to fluctuate from 0.00 to 3.01 m/s while the average WS was 0.63 m/s (SD = 0.57 m/s). In general, the selected study area experiences light air flow movement throughout the year according to the Beaufort wind force scale [55]. Light air activity representing WS of 0.5 to 1.5 m/s is predominant (43.3%) in the study area, followed by calm air (39.5%) and light breeze (16.9%). The urban microclimate variation is summarized in Figure 3.
3.2. Sociodemographic Attributes of the Respondents at Masjid Jamek
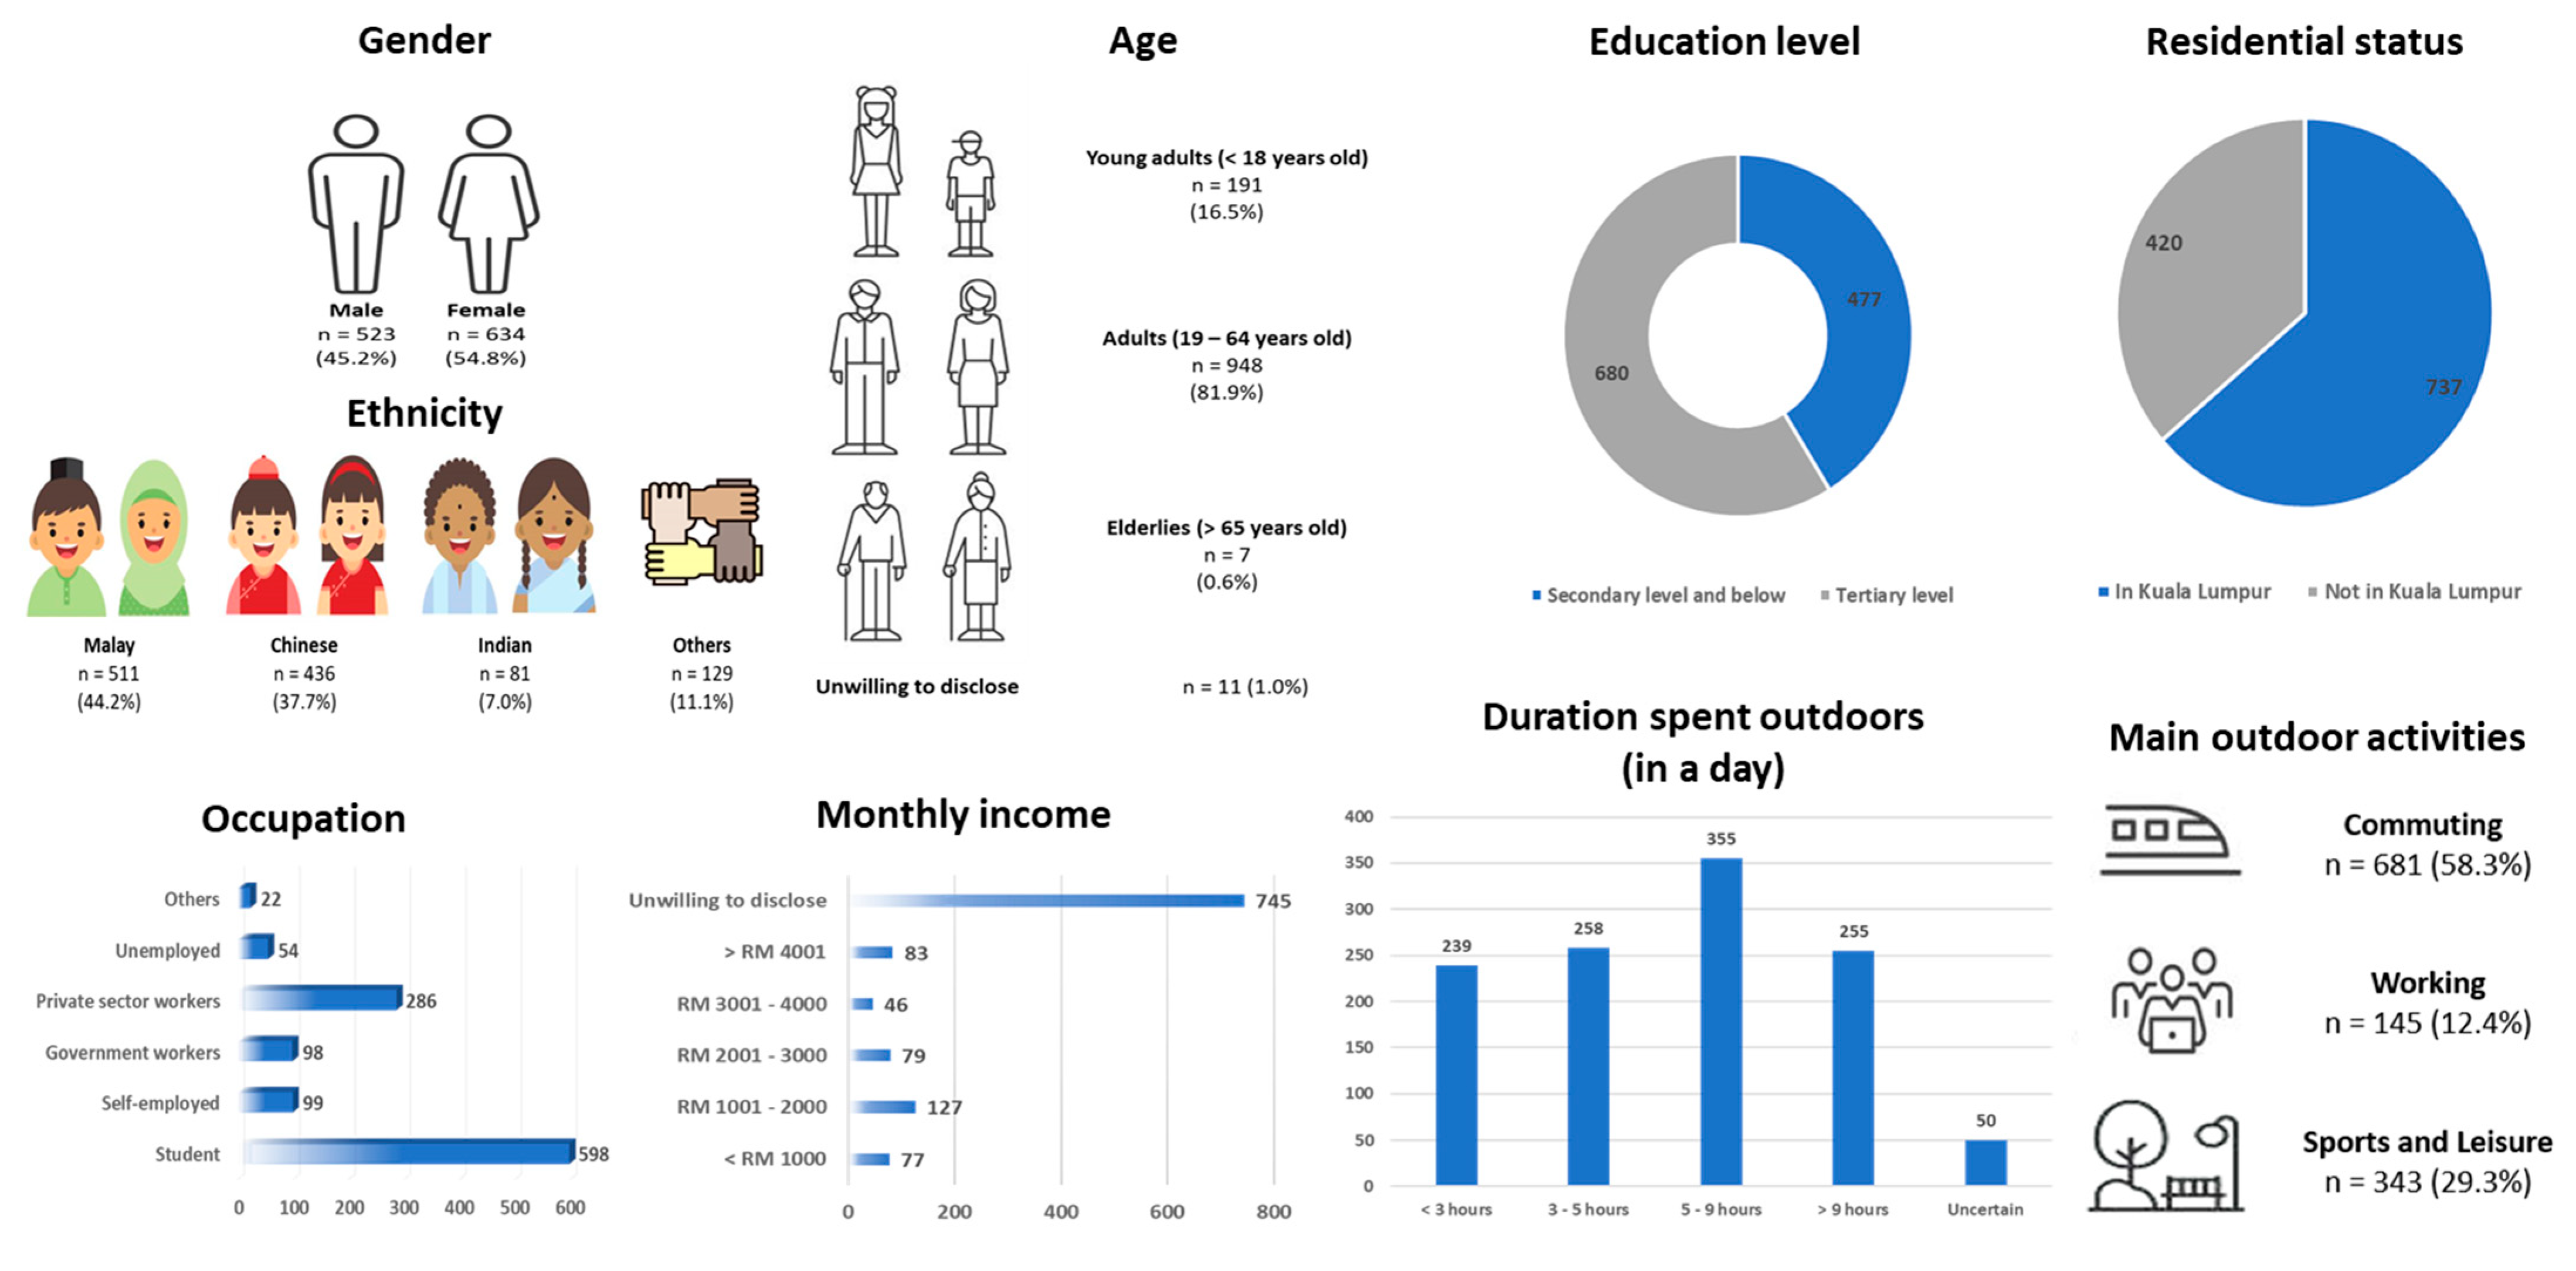
In total, 1,157 eligible responses were collected and included for data analysis. More than half of the participants were females (n = 634, 54.8%), while males constituted the other 45.2% (n = 523) of the total respondents in this study. In terms of age distribution, the majority of the respondents were adults (n = 948, 81.9%) between the ages of 19 and 64 years old. The mean age was 27 years (SD = 10.6 years). In terms of ethnicity, the majority were Malays (n = 511, 44.2%), followed by Chinese (n = 436, 37.7%), Indians (n = 81, 7%) and other ethnicities (n = 129, 11.1%).
The respondents in the study area consisted mainly of the daytime population. Hence, it is difficult to clarify the length of residence in the city. Alternatively, a question was asked about the duration of hours spent outdoors and the purpose of being outdoors. On average, the respondents spent nearly 6 h (SD = 4.0 h) outdoors in a day for activities such as commuting (n = 681, 58.3%), working (n = 145, 12.4%) and doing sports and leisure (n = 343, 29.3%). The sociodemographic characteristics of the respondents are presented in Figure 4.
3.3. The Outdoor Thermal Comfort Level of Urban Dwellers in Masjid Jamek
3.3.1. The Prevalence of Physiological Heat Stress in Masjid Jamek
The mean PET was found to be 29.45 °C (SD = 2.11 °C) which corresponds to “slight heat stress” according to the PET heat stress classification [44]. The prevalence of physiological heat stress was also identified through the clustering of the 7-point thermal sensation scale into two groups representing positive thermal sensation (slightly warm to very hot) as well as neutral and negative thermal sensation (neutral to very cold). Although there are 1157 eligible respondents, only 864 sets of microclimate data were included for the assessment of physiological heat stress. This is because there are situations where more than one respondent answers the questionnaire within the same 5-minute timeframe. Hence, the duplication of microclimate data was excluded in subsequent data analysis. It was found that the majority (n = 543, 62.8%) of the respondents reported neutral and negative thermal sensations, while only 37.2% (n = 321) reported positive thermal sensations. In further analysis, the association of physiological heat stress with selected sociodemographic variables is summarized in Table 3.
In terms of association, only ethnicity (p = 0.002) was found to be significantly associated with expressing physiological heat stress, while gender (p = 0.670), age group (p = 0.113) and duration spent outdoors in a day (p = 0.814) were not significantly associated. Malays were 1.9 times (OR = 1.89, 95% CI: 1.00, 3.55) more likely to report positive thermal sensation as compared to other ethnicities. In comparison, Chinese were found to be 1.1 times (OR = 1.07, 95% CI: 0.56, 2.05) more likely while Indians were found to be 1.5 times (OR = 1.54, 95% CI: 0.71, 3.37) more likely to report positive thermal sensation as compared to other ethnicities.
3.3.2. The Perceived Outdoor Thermal Comfort Level in Masjid Jamek
The findings of perceived OTC from the questionnaire survey are summarized in Table 4.
It was found that 74.0% (n = 856) of the respondents reported positive thermal sensations while 24.9% (n = 288) reported neutral and negative thermal sensations. In terms of thermal acceptance, a majority (n = 828, 71.6%) of the respondents found the thermal environment to be acceptable, while only 27.9% (n = 323) found the thermal environment to be unacceptable. In terms of thermal preference, a majority (n = 806, 69.7%) wanted a cooler environment, as opposed to only 9.9% (n = 114) who wanted a warmer environment. Meanwhile, 20.1% (n = 232) of the respondents preferred the thermal environment how it is. Lastly, it was found that more than half of the respondents (n = 633, 54.7%) expressed thermal discomfort in MJ.
4. Discussion
4.1. Urban Microclimate Variations in Masjid Jamek
Despite the microclimate variations in MJ from January to December 2018, the selected study area experienced a distinctive hot and humid tropical climate with high Ta ( = 30.23 °C, SD = 3.90 °C) and RH (x = 69.09%, SD = 13.75%). MJ also receives ample SR with a daily average of 98.21 W/m2 (SD = 119.74 W/m2). In addition to the hot and humid thermal environment, light air activity representing WS of 0.5 to 1.5 m/s is predominant (43.3%) in the study area, with the average WS recorded at 0.63 m/s (SD = 0.57 m/s).
The existence of high-rise buildings, rough pavement surfaces and other obstructing objects are influencing factors which determine the thermal environment [56] in MJ. The introduction of these elements alters the aspect ratio and surface roughness of the urban morphology, which contributes to the deterioration of the urban environment [36]. The low WS in the study area is evidence for such man-made alterations. Higher WS is associated with higher effectiveness to remove urban heat and simultaneously contribute to better OTC levels [15]. Unfortunately, there is only a 0.2% occurrence of gentle breeze representing WS of 3.4 to 5.5 m/s that can dissipate heat from urban areas. As a result, this leads to the deterioration of OTC levels among urban dwellers in MJ.
4.2. Outdoor Thermal Comfort Level of Urban Dwellers in Masjid Jamek
The findings from physiological heat stress suggest that the majority (n = 543, 62.8%) of the urban dwellers physiologically experience neutral and negative thermal sensations while only 37.2% (n = 321) experience positive thermal sensations. However, the urban dweller in MJ is expected to feel ‘slight heat stress’ with a mean PET of 29.45 °C (SD = 2.11 °C). In this study, a heat stress index such as the Universal Thermal Climate Index (UTCI) was not used because there are moments with no wind speed in the study area (i.e., 0 m/s). As a result, the UTCI value could not be quantified and is therefore not used to express the physiological heat stress of participants in this study. It is important to note that the physiological heat stress is an indication of what the human body feels as opposed to the perceived OTC, which is an indication of what the mind thinks about the thermal environment. How a person perceives the urban environment may not be coherent with the thermal stress experienced [57].
In terms of perceived OTC, findings revealed more positive thermal sensation responses from the questionnaire survey. Interestingly, a majority (n = 856, 74.0%) who reported a positive thermal sensation contradicted the findings of physiological heat stress where only 37.2% (n = 321) reported experiencing a positive thermal sensation. From this study, it was found that there is a tendency for the physiological OTC assessment approach to under-report the actual OTC level in any given thermal environment. The finding from this study is in line with the findings of several other studies [58,59,60,61]. In addition, this comparison also indicates that only accounting for physiological OTC is insufficient to investigate the OTC levels of urban dwellers [21].
In terms of thermal acceptance, a majority (n = 828, 71.6%) of the respondents had accepted the thermal environment despite having about 74% (n = 856) who reported positive thermal sensation. Based on the field observations and survey findings, the respondents are expected to report a higher unacceptance rate as they claimed the environment to be warm and hot. The mean PET identified from this study (i.e., 29.45 °C (SD = 2.11 °C)) is within the acceptable range of ambient temperatures from a similar study in the same region (i.e., 25.9 °C and 32.3 °C PET) [62]. This finding is also similar to the findings of Chow et al. [30] and Nasir et al. [63], who conducted OTC assessments in other tropical cities in similar climate settings. One possible explanation could be the very limited amount of control that one possesses over the dynamic outdoor environment. Realizing this, respondents would choose to accept that there is nothing that could be done on an individual level. Consequently, the urban community would lower their expectation level and conclusively accept the thermal environment.
The findings also revealed that the majority (n = 806, 69.7%) wanted a cooler environment. The higher preference towards a cooler environment contradicts the high thermal acceptance votes. This finding supports the earlier finding that an individual will choose to accept the hotter environment because of the very limited amount of control they possess over the urban environment. However, if they were given a choice, they would prefer a cooler environment. This recalls the importance of psychological or perceived OTC assessment when assessing the physiological heat stress, as these key determining facts would be missed by only assessing the physiological OTC level. Lastly, it was found that only 45.0% (n = 520) of the respondents expressed that they are at thermal comfort levels while the others expressed thermal discomfort.
In summary, it can be concluded that the thermal environment of MJ has led to the deterioration of OTC levels among urban dwellers. Although there are contradictions to the findings between the physiological heat stress and perceived OTC, it can be agreed that urban dwellers are experiencing thermal discomfort with slight physiological heat stress.
4.3. The Prevalence of Outdoor Thermal Comfort with Selected Sociodemographic Variables
Through univariate binary logistic regression analysis, ethnicity (p = 0.002) was found to be significantly associated with physiological heat stress. One of the possible explanations for this result is clothing behaviour. It was observed that the clothing behaviour of the urban dwellers is influenced by ethnicity and religion. For example, Malay females are commonly found to be wearing a head scarf covering their hair because of their religious beliefs and needs. In addition, their clothing choices are also to ensure modesty, which includes the covering of the arms and legs. This may not necessarily be followed by others with different ethnic and religious backgrounds. The amount of clothing on a person has a direct influence on the thermoregulation system, which subsequently affects the reported OTC. However, these deductions are merely observations, as the clo value was not collected in this study. This is one of the limitations of this study. More in-depth study is needed to understand the influence of ethnicity towards OTC levels in a tropical city. Similarly, a more in-depth study can also be dedicated to unravelling the reasons explaining the insignificance of gender (p = 0.670), age group (p = 0.113) and duration spent outdoors in a day (p = 0.814) in expressing physiological heat stress.
Interestingly, the duration of outdoor exposure, which is predicted to have a linear relationship with OTC, was not found to be significantly associated with expressing physiological heat stress. This is because individuals are relatively perceptive to environments depending on the level of their awareness and exposure [64]. The fact that there are no significant associations hints at two possibilities. First, the temporal changes in the urban microclimate were deemed to have negligible influence on the urban dwellers despite the long hours of exposure. Secondly, urban dwellers may have developed a mentality to falsely accept the environment by adjusting their perception towards the thermal environment which is a type of adaptive behaviour. Further in-depth OTC studies can be dedicated to exploring the knowledge gap pertaining to this matter.
4.4. The Influence of Thermal Adaptive Behaviour in Distorting the True Outdoor Thermal Comfort Level
The OTC findings from this study emphasized that any OTC research should not be conducted by simply depending on either a physiological or psychological approach alone due to the complexity of what the mind perceives as opposed to how the body feels. Although control measures were taken to reduce the influence of thermal adaptation in this study, the contradicting findings of physiological heat stress with the findings of perceived OTC show that there are strong thermal adaptive behaviours among urban dwellers in MJ.
Adaptation is practised consciously or subconsciously at an individual level to cope with hot and humid urban environments. The adaptation to thermal comfort can either be a physical and/or a physiological process [65,66] distinguished according to three categories: behavioural, physiological and psychological [67,68]. Other influencing factors such as cultural background, experience, expectation of the thermal environment, active body heat control and exposure time can also directly influence the adaptation of a person to the thermal environment [53]. However, due to the nature of the current study, the thermal adaptation features could not be further explored. Future research is highly suggested to bridge the knowledge gap on the topic of thermal adaptive behaviour in a tropical climate.
5. Conclusions
The present study was conducted to identify the OTC status of the urban dwellers in MJ, a selected urban area of KL. According to the urban microclimate observation in MJ, it experienced a distinctive hot and humid tropical climate with high Ta ( = 30.23 °C, SD = 3.90 °C), RH ( = 69.09%, SD = 13.75%) and daily SR ( = 98.21W/m2, SD = 119.74 W/m2). The urban morphology in MJ is characterized by high-rise buildings, rough pavement surfaces and other obstructing objects contributing to the drastic reduction in air activity, which facilitates urban heat mitigation. As a result, the deterioration of OTC levels among urban dwellers in MJ was prevalent in the form of physiological heat stress and as expressed as perceived OTC. Although there are contradictions to the findings between physiological heat stress and perceived OTC, it can be agreed that more than half of the urban dwellers (n = 633, 54.7%) experienced thermal discomfort characterized by slight physiological heat stress ( = 29.45 °C PET, SD = 2.11 °C PET).
The respondents in this study were found to exhibit traits of adaptive thermal comfort when they perceived the environment to be better as compared to measured microclimate conditions. In further analysis, it was found that ethnicity (p = 0.002) was significantly associated with expressing physiological heat stress, while gender (p = 0.670), age group (p = 0.113) and duration spent outdoors in a day (p = 0.814) were not. A possible explanation supporting this finding may be the clothing behaviour of urban dwellers in MJ, which is influenced by ethnicity and religion. More studies are needed to bridge the knowledge gap on adaptive thermal comfort identified through this study.
There are several limitations to this study. The main limitation of this study lies within the subjective assessment of OTC. As the interaction between the environment, built environment and human biometeorology is deemed complex, the findings from the OTC assessment may be subjected to bias and inconsistency because of thermal adaptation. Nevertheless, protocols to minimize the influence of such adaptive behaviours were implemented in this study to improve the reliability of the findings. The second limitation of this study is that all information obtained from the survey was self-reported, and reporting bias due to socially desirable attitudes and behaviours might exist. Despite these limitations, the findings from the current study have shed light on the OTC status in MJ, one of the hotspots of KL. The outcome of this study would be beneficial to various stakeholders and urban policy makers to plan effective intervention measures to ensure good liveability standards in a tropical city. The collective output is expected to benefit the public in the long run, in tandem with the vision of transforming KL to be among the top 20 most liveable cities in the world and to achieve the 11th goal of the United Nations’ Sustainable Development Goals, which is to make cities inclusive, safe, resilient and sustainable by 2030.
Author Contributions
Conceptualization, C.S.F., N.A. and N.M.S.; methodology, C.S.F., S.M.; formal analysis, C.S.F., S.M. and R.S.P.; investigation, C.S.F. and L.R.; resources, N.A.; writing—original draft preparation, C.S.F.; writing—review and editing, L.R. and R.S.P.; funding acquisition, C.S.F. All authors have read and agreed to the published version of the manuscript.
Funding
This research was funded by Universiti Malaya under the Universiti Malaya International Collaboration Grant (SATU Joint Research Scheme Program), grant number ST092-2022.
Institutional Review Board Statement
The study was conducted in accordance with the Declaration of Helsinki, and approved by the University of Malaya Research Ethics Committee (protocol code UM.TNC2/UMREC-691 approved on date 26 November 2019).
Informed Consent Statement
Informed consent was obtained verbally from all subjects involved in the study. Respondents were informed that the participation is voluntary, and any information obtained from the survey is kept confidential and will only be used for this study.
Data Availability Statement
The questionnaire data presented in this study are available on request from the corresponding author. The data are not publicly available due to protocol adherence set by the research ethics committee. The meteorological data were obtained from the Malaysian Meteorological Department (MetMalaysia) and the Department of Environment (DOE) Malaysia. Access to the data will require written permission directly to MetMalaysia and DOE.
Acknowledgments
The authors would like to express gratitude to the Malaysian Meteorological Department (MetMalaysia) and Department of Environment (DOE) Malaysia for providing the meteorological data for this research. The authors would also like to thank Law Julkee for her contribution in the production of graphics for the manuscript.
Conflicts of Interest
The authors declare no conflict of interest. The funders had no role in the design of the study; in the collection, analyses, or interpretation of data; in the writing of the manuscript; or in the decision to publish the results.
References
- Masson-Delmotte, V.; Zhai, P.; Pörtner, H.-O.; Roberts, D.; Skea, J.; Shukla, P.R.; Pirani, A.; Moufouma-Okia, W.; Péan, C.; Pidcock, R.; et al. Global Warming of 1.5 °C; IPCC: Geneva, Switzerland, 2019; ISBN 9789291691531. [Google Scholar]
- WEF; Collins, A. The Global Risks Report 2019 14th Edition Insight Report; WEF: Geneva, Switzerland, 2019; ISBN 9781944835156. [Google Scholar]
- Rajagopal, P.; Priya, R.S.; Senthil, R. A Review of Recent Developments in the Impact of Environmental Measures on Urban Heat Island. Sustain. Cities Soc. 2023, 88, 104279. [Google Scholar] [CrossRef]
- Pragati, S.; Priya, R.S.; Pradeepa, C.; Senthil, R. Simulation of the Energy Performance of a Building with Green Roofs and Green Walls in a Tropical Climate. Sustainability 2023, 15, 2006. [Google Scholar] [CrossRef]
- Aghamohammadi, N.; Ramakreshnan, L.; Fong, C.S.; Sulaiman, N.M. Climate-Related Disasters and Health Impact in Malaysia. In Extreme Weather Events and Human Health; Springer International Publishing: Cham, Switzerland, 2020; pp. 247–263. [Google Scholar]
- Rajagopalan, P.; Lim, K.C.; Jamei, E. Urban Heat Island and Wind Flow Characteristics of a Tropical City. Sol. Energy 2014, 107, 159–170. [Google Scholar] [CrossRef]
- Ramakreshnan, L.; Aghamohammadi, N.; Fong, C.S.; Ghaffarianhoseini, A.; Wong, L.P.; Sulaiman, N.M. Empirical Study on Temporal Variations of Canopy-Level Urban Heat Island Effect in the Tropical City of Greater Kuala Lumpur. Sustain. Cities Soc. 2019, 44, 748–762. [Google Scholar] [CrossRef]
- Roth, M. Urban Heat Islands. In Handbook of Environmental Fluid Dynamics; Fernando, H.J.S., Ed.; Taylor & Francis Group: Abingdon, UK, 2013; Volume 2, pp. 143–159. Available online: http://profile.nus.edu.sg/fass/geomr/rothuhihefd13.pdf (accessed on 11 March 2020).
- Rovers, T.J.H. The Impacts of Urban Heat Islands on Northwestern European Cities Characterising the Heat Island Intensity Based on Land Use Data. 2016. Available online: http://www.diva-portal.org/smash/get/diva2:1020112/FULLTEXT02.pdf (accessed on 9 July 2019).
- Sani, S. Urban Climatology in Malaysia: An Overview. Energy Build 1990, 15, 105–117. [Google Scholar] [CrossRef]
- Santamouris, M. Analyzing the Heat Island Magnitude and Characteristics in One Hundred Asian and Australian Cities and Regions. Sci. Total Environ. 2015, 512–513, 582–598. [Google Scholar] [CrossRef]
- Shahmohamadi, P.; Che-Ani, A.I.; Tawil, N.M.; Tahir, M.M. The Conceptual Framework to Achieve Energy Consumption Balance in Kuala Lumpur Shophouses for Mitigating Urban Heat Island Effects with Focusing On Anthropogenic Heat Factor. J. Surv. Constr. Prop. 2011, 2, 1–22. [Google Scholar] [CrossRef]
- Toy, S.; Yilmaz, S. Evaluation of Urban-Rural Bioclimatic Comfort Differences over a Ten-Year Period in the Sample of Erzincan City Reconstructed after a Heavy Earthquake. Atmosfera 2010, 23, 387–402. [Google Scholar]
- Tso, C.P. A Survey of Urban Heat Island Studies in Two Tropical Cities. In Proceedings of the Atmospheric Environment; Pergamon Press Inc.: Oxford, UK, 1996; Volume 30, pp. 507–519. [Google Scholar]
- Hanipah, M.H.; Abdullah, A.H.; Che Sidik, N.A.; Yunus, R.; Azam Yasin, M.N.; Muhammad Yazid, M.N.A.W. Assessment of Outdoor Thermal Comfort and Wind Characteristics at Three Different Locations in Peninsular Malaysia. MATEC Web Conf. 2016, 47, 04005. [Google Scholar] [CrossRef]
- Morris, K.I. Computational Study of Klang Valley’s Urban Climatology, and Urbanisation of Putrajaya City, Malaysia. Ph.D. Thesis, University of Nottingham, Notthingham, UK, 2016. [Google Scholar]
- Qaid, A.; bin Lamit, H.; Ossen, D.R.; Raja Shahminan, R.N.; Lamit, H.; Ossen, D.R.; Raja Shahminan, R.N. Urban Heat Island and Thermal Comfort Conditions at Micro-Climate Scale in a Tropical Planned City. Energy Build 2016, 133, 577–595. [Google Scholar] [CrossRef]
- Thorsson, S.; Lindberg, F.; Eliasson, I.; Holmer, B. Different Methods for Estimating the Mean Radiant Temperature in an Outdoor Urban Setting. Int. J. Climatol. 2007, 27, 1983–1993. [Google Scholar] [CrossRef]
- Toy, S.; Yilmaz, S. Thermal Sensation of People Performing Recreational Activities in Shadowy Environment: A Case Study from Turkey. Theor. Appl. Climatol. 2010, 101, 329–343. [Google Scholar] [CrossRef]
- Bernardi, N.; Kowaltowski, D.C.C.K. Environmental Comfort in School Buildings: A Case Study of Awareness and Participation of Users. Environ. Behav. 2006, 38, 155–172. [Google Scholar] [CrossRef]
- Fong, C.S.; Aghamohammadi, N.; Ramakreshnan, L.; Sulaiman, N.M.; Mohammadi, P. Holistic Recommendations for Future Outdoor Thermal Comfort Assessment in Tropical Southeast Asia: A Critical Appraisal. Sustain. Cities Soc. 2019, 46, 101428. [Google Scholar] [CrossRef]
- Aghamohammadi, N.; Fong, C.S.; Idrus, M.H.M.; Ramakreshnan, L.; Sulaiman, N.M. Environmental Heat-Related Health Symptoms among Community in a Tropical City. Sci. Total Environ. 2021, 782, 146611. [Google Scholar] [CrossRef]
- Aghamohammadi, N.; Fong, C.S.; Farid, N.D.N.; Ramakreshnan, L.; Mohammadi, P.A. Heat and Mental Health in Cities. In Urban Overheating: Heat Mitigation and the Impact on Health; Aghamohammadi, N., Santamouris, M., Eds.; Springer: Berlin/Heidelberg, Germany, 2022; pp. 81–107. [Google Scholar] [CrossRef]
- Aghamohammadi, N.; Ramakreshnan, L.; Fong, C.S.; Kumar, P. Aghamohammadi, N.; Ramakreshnan, L.; Fong, C.S.; Kumar, P. A Global Synthesis of Heat-Related Mortality in Overheated Cities. In Urban Overheating: Heat Mitigation and the Impact on Health; Aghamohammadi, N., Santamouris, M., Eds.; Springer: Berlin/Heidelberg, Germany, 2022; pp. 21–38. [Google Scholar] [CrossRef]
- Bocquier, P. World Urbanization Prospects. Demogr. Res 2014, 12, 32. [Google Scholar] [CrossRef]
- Siemens, A.G. Asian Green City Index Assessing the Environmental Performance of Asia’s Major Cities; Siemens AG: Munich, Germany, 2011; pp. 1–123. [Google Scholar] [CrossRef]
- Ignatius, M.; Wong, N.H.; Jusuf, S.K. Urban Microclimate Analysis with Consideration of Local Ambient Temperature, External Heat Gain, Urban Ventilation, and Outdoor Thermal Comfort in the Tropics. Sustain. Cities Soc. 2015, 19, 121–135. [Google Scholar] [CrossRef]
- Jänicke, B.; Milošević, D.; Manavvi, S. Review of User-Friendly Models to Improve the Urban Micro-Climate. Atmosphere 2021, 12, 1291. [Google Scholar] [CrossRef]
- Ahmed, K.S. Comfort in Urban Spaces: Defining the Boundaries of Outdoor Thermal Comfort for the Tropical Urban Environments. Energy Build. 2003, 35, 103–110. [Google Scholar] [CrossRef]
- Chow, W.T.L.; Akbar, S.N.A.B.A.; Heng, S.L.; Roth, M. Assessment of Measured and Perceived Microclimates within a Tropical Urban Forest. Urban For. Urban Green 2016, 16, 62–75. [Google Scholar] [CrossRef]
- Johansson, E.; Emmanuel, R. The Influence of Urban Design on Outdoor Thermal Comfort in the Hot, Humid City of Colombo, Sri Lanka. Int. J. Biometeorol. 2006, 51, 119–133. [Google Scholar] [CrossRef] [PubMed]
- Lin, T.P. Thermal Perception, Adaptation and Attendance in a Public Square in Hot and Humid Regions. Build. Environ. 2009, 44, 2017–2026. [Google Scholar] [CrossRef]
- Lin, T.P.; Matzarakis, A.; Hwang, R.-L.L. Shading Effect on Long-Term Outdoor Thermal Comfort. Build. Environ. 2010, 45, 213–221. [Google Scholar] [CrossRef]
- Makaremi, N.; Salleh, E.; Jaafar, M.Z.; GhaffarianHoseini, A.H. Thermal Comfort Conditions of Shaded Outdoor Spaces in Hot and Humid Climate of Malaysia. Build. Environ. 2012, 48, 7–14. [Google Scholar] [CrossRef]
- Morris, K.I.; Chan, A.; Morris, K.J.K.; Ooi, M.C.; Oozeer, M.Y.; Abakr, Y.A.; Nadzir, M.S.M.; Mohammed, I.Y.; Al-Qrimli, H.F. Impact of Urbanization Level on the Interactions of Urban Area, the Urban Climate, and Human Thermal Comfort. Appl. Geogr. 2017, 79, 50–72. [Google Scholar] [CrossRef]
- Aghamohammadi, N.; Ramakreshnan, L.; Fong, C.S.; Noor, R.M.; Hanif, N.R.; Sulaiman, N.M. Perceived Impacts of Urban Heat Island Phenomenon in a Tropical Metropolitan City: Perspectives from Stakeholder Dialogue Sessions. Sci. Total Environ. 2022, 806, 150331. [Google Scholar] [CrossRef]
- Aghamohammadi, N.; Ramakreshnan, L.; Fong, C.S.; Sulaiman, N.M. Urban Heat Island, Contributing Factors, Public Responses and Mitigation Approaches in the Tropical Context of Malaysia. In Advances in 21st Century Human Settlements; Springer: Berlin/Heidelberg, Germany, 2021; pp. 107–121. [Google Scholar]
- Oke, T.R.; Stewart, I.D. Local climate zone for urban temperature studies. Bull. Am. Meteorol. Soc. 2012, 93, 1879–1900, ISBN 5148712082. [Google Scholar]
- Aflaki, A.; Mirnezhad, M.; Ghaffarianhoseini, A.A.; Ghaffarianhoseini, A.A.; Omrany, H.; Wang, Z.H.; Akbari, H. Urban Heat Island Mitigation Strategies: A State-of-the-Art Review on Kuala Lumpur, Singapore and Hong Kong. Cities 2017, 62, 131–145. [Google Scholar] [CrossRef]
- Ibrahim, I.; Samah, A.A. Preliminary Study of Urban Heat Island: Measurement of Ambient Temperature and Relative Humidity in Relation to Landcover in Kuala Lumpur. In Proceedings of the 2011 19th International Conference on Geoinformatics, Shanghai, China, 24–26 June 2011. [Google Scholar]
- Manavvi, S.; Rajasekar, E. Evaluating Outdoor Thermal Comfort in Urban Open Spaces in a Humid Subtropical Climate: Chandigarh, India. Build Environ. 2022, 209, 108659. [Google Scholar] [CrossRef]
- Cohen, P.; Potchter, O.; Matzarakis, A. Human Thermal Perception of Coastal Mediterranean Outdoor Urban Environments. Appl. Geogr. 2013, 37, 1–10. [Google Scholar] [CrossRef]
- Kántor, N.; Unger, J.; Gulyás, Á.; Kantor, N.; Unger, J.; Gulyas, A. Subjective Estimations of Thermal Environment in Recreational Urban Spaces-Part 2: International Comparison. Int. J. Biometeorol. 2012, 56, 1089–1101. [Google Scholar] [CrossRef] [PubMed]
- Lin, T.P.; Matzarakis, A. Tourism Climate and Thermal Comfort in Sun Moon Lake, Taiwan. Int. J. Biometeorol. 2008, 52, 281–290. [Google Scholar] [CrossRef] [PubMed]
- Nikolopoulou, M.; Lykoudis, S. Thermal Comfort in Outdoor Urban Spaces: Analysis across Different European Countries. Build. Environ. 2006, 41, 1455–1470. [Google Scholar] [CrossRef]
- Toy, S.; Kantor, N. Evaluation of Human Thermal Comfort Ranges in Urban Climate of Winter Cities on the Example of Erzurum City. Environ. Sci. Pollut. Res. 2017, 24, 1811–1820. [Google Scholar] [CrossRef] [PubMed]
- Koerniawan, M.D.; Gao, W. Addressing Climate to Make Better Places, Thermal Comfort in Outdoor Open Space in Mega Kuningan Superblock, Jakarta. In Proceedings of the International Conference on Image Analysis and Processing, Yogjakarta, Indonesia, 21–22 August 2014. [Google Scholar] [CrossRef]
- Koerniawan, M.D.; Gao, W. Thermal Comfort and Walkability in Open Spaces of Mega Kuningan Superblock in Jakarta. In Proceedings of the IC2UHI—Third International Conference on Countermeasures to Urban Heat, Venice, Italy, 13–15 October 2014. [Google Scholar] [CrossRef]
- Koerniawan, M.D.; Gao, W. Thermal Comfort Investigation in Three Hot-Humid Climate Theme Parks in Jakarta. Am. J. Environ. Sci. 2015, 11, 133–144. [Google Scholar] [CrossRef]
- Yang, W.; Wong, N.H.; Jusuf, S.K. Thermal Comfort in Outdoor Urban Spaces in Singapore. Build. Environ. 2013, 59, 426–435. [Google Scholar] [CrossRef]
- ISO 10551:2019; Ergonomics of the Physical Environment—Subjective Judgement Scales for Assessing Physical Environments. ISO: Geneva, Switzerland, 2019. Available online: https://www.iso.org/standard/67186.html (accessed on 22 February 2023).
- Din, M.F.M.; Lee, Y.Y.; Ponraj, M.; Ossen, D.R.; Iwao, K.; Chelliapan, S.; Md Din, M.F.; Lee, Y.Y.; Ponraj, M.; Ossen, D.R.; et al. Thermal Comfort of Various Building Layouts with a Proposed Discomfort Index Range for Tropical Climate. J. Therm. Biol. 2014, 41, 6–15. [Google Scholar] [CrossRef]
- Kurazumi, Y.; Ishii, J.; Fukagawa, K.; Kondo, E.; Aruninta, A. Ethnic Differences in Thermal Responses between Thai and Japanese Females in Tropical Urban Climate. Am. J. Clim. Chang. 2016, 5, 52–68. [Google Scholar] [CrossRef]
- Niu, S.W.; Hu, L.L.; Qian, Y.J.; He, B.L. Effective Pathway to Improve Indoor Thermal Comfort in Rural Houses: Analysis of Heat Efficiency of Elevated Kangs. J. Energy Eng. 2016, 142, 11. [Google Scholar] [CrossRef]
- Mather, J.R. Beaufort Wind Scale. In Encyclopedia of Earth Sciences Series; Springer: Berlin/Heidelberg, Germany, 2005; pp. 156–157. [Google Scholar]
- Zacharias, J.; Stathopoulos, T.; Wu, H. Microclimate and Downtown Open Space Activity. Environ. Behav. 2001, 33, 296–315. [Google Scholar] [CrossRef]
- Zacharias, J.; Stathopoulos, T.; Wu, H. Spatial Behavior in San Francisco’s Plazas: The Effects of Microclimate, Other People, and Environmental Design. Environ. Behav. 2004, 36, 638–658. [Google Scholar] [CrossRef]
- Middel, A.; Selover, N.; Hagen, B.; Chhetri, N. Impact of Shade on Outdoor Thermal Comfort—A Seasonal Field Study in Tempe, Arizona. Int. J. Biometeorol. 2016, 60, 1849–1861. [Google Scholar] [CrossRef] [PubMed]
- Seltenrich, N. From Ambient to Personal Temperature: Capturing the Experience of Heat Exposure. Environ. Health Perspect. 2017, 125, 094002. [Google Scholar] [CrossRef] [PubMed]
- Bernhard, M.C.; Kent, S.T.; Sloan, M.E.; Evans, M.B.; McClure, L.A.; Gohlke, J.M. Measuring Personal Heat Exposure in an Urban and Rural Environment. Environ. Res. 2015, 137, 410–418. [Google Scholar] [CrossRef]
- Kuras, E.R.; Richardson, M.B.; Calkins, M.M.; Ebi, K.L.; Hess, J.J.; Kintziger, K.W.; Jagger, M.A.; Middel, A.; Scott, A.A.; Spector, J.T.; et al. Opportunities and Challenges for Personal Heat Exposure Research. Environ. Health Perspect. 2017, 125, 085001. [Google Scholar] [CrossRef]
- Aghamohammadi, N.; Fong, C.S.; Mohd Idrus, M.H.; Ramakreshnan, L.; Haque, U. Outdoor Thermal Comfort and Somatic Symptoms among Students in a Tropical City. Sustain. Cities Soc. 2021, 72, 103015. [Google Scholar] [CrossRef]
- Nasir, R.A.; Ahmad, S.S.; Ahmed, A.Z. Perceived and Measured Adaptive Thermal Comfort at an Outdoor Shaded Recreational Area in Malaysia. Adv. Mat. Res. 2013, 610–613, 1083–1086. [Google Scholar] [CrossRef]
- Sonnenfeld, J. Equivalence and Distortion of the Perceptual Environment. Environ. Behav. 1969, 1, 83–99. [Google Scholar] [CrossRef]
- Huizenga, C.; Hui, Z.; Arens, E. A Model of Human Physiology and Comfort for Assessing Complex Thermal Environments. Build. Environ. 2001, 36, 691–699. [Google Scholar] [CrossRef]
- Sanesi, G.; Lafortezza, R.; Bonnes, M.; Carrus, G. Comparison of Two Different Approaches for Assessing the Psychological and Social Dimensions of Green Spaces. Urban Urban Green 2006, 5, 121–129. [Google Scholar] [CrossRef]
- Brager, G.S.; de Dear, R.J. Thermal Adaptation in the Built Environment: A Literature Review. Energy Build. 1998, 27, 83–96. [Google Scholar] [CrossRef]
- Yang, W.; Wong, N.H.; Zhang, G. A Comparative Analysis of Human Thermal Conditions in Outdoor Urban Spaces in the Summer Season in Singapore and Changsha, China. Int. J. Biometeorol. 2013, 57, 895–907. [Google Scholar] [CrossRef] [PubMed]
Figure 1.
(a) The location of Kuala Lumpur, Malaysia (3°09′ N; 101°44′ E). (b) The selected study area, Masjid Jamek (3°8′43.57″ N, 101°41′56.59″ E). Source: Google Earth (2023).
Figure 1.
(a) The location of Kuala Lumpur, Malaysia (3°09′ N; 101°44′ E). (b) The selected study area, Masjid Jamek (3°8′43.57″ N, 101°41′56.59″ E). Source: Google Earth (2023).

Figure 2.
Automated weather station (AWS) for urban microclimate measurements.

Figure 3.
The microclimate variations in Masjid Jamek from January to December 2018. (a) Air temperature (°C) and relative humidity (%); (b) wind speed variation (m/s); (c) solar radiation (W/m2); and (d) wind direction (°).
Figure 3.
The microclimate variations in Masjid Jamek from January to December 2018. (a) Air temperature (°C) and relative humidity (%); (b) wind speed variation (m/s); (c) solar radiation (W/m2); and (d) wind direction (°).

Figure 4.
The sociodemographic characteristics of the respondents in the study area.


Table 1.
Specifications of sensors in AWS.
| Parameters | Sensor Type | Resolution and Units | Range | Accuracy |
|---|---|---|---|---|
| Air temperature (Ta) | PN Junction Silicon Diode | 1.00 °C | −40 °C to +65 °C | ±0.50 °C above −7 °C |
| Relative humidity (RH) | Film capacitor element | 1.00% | 1 to 100% | ±3% (0 to 90% RH); ±4% (90 to 100% RH) |
| Wind speed (WS) | Wind cups with magnetic switch | 0.10 m/s | 1 to 80 m/s | ±1 m/s |
| Wind direction (WD) | Wind vane with potentiometer | 1° | 0 to 360° | ±3° |
| Solar radiation (SR) | Silicon photo diode | 1.00 W/m2 | 0 to 1800 W/m2 | ±5% |
Table 2.
The microclimate variations in Masjid Jamek from January to December 2018.
| Month | Ta (°C) | RH (%) | WS (m/s) | SR (W/m2) |
|---|---|---|---|---|
| Jan. | 26.97 | 77.69 | 0.86 | 0.87 |
| Feb. | 28.65 | 65.41 | 1.12 | 1.28 |
| Mac. | 27.51 | 68.19 | 0.88 | 1.31 |
| Apr. | 28.96 | 72.10 | 1.01 | 1.23 |
| May | 28.32 | 76.33 | 1.01 | 1.06 |
| Jun. | 28.90 | 69.20 | 1.20 | 1.09 |
| Jul. | 28.86 | 69.93 | 1.19 | 1.07 |
| Aug. | 29.27 | 64.73 | 1.31 | 1.31 |
| Sep. | 27.55 | 73.71 | 1.09 | 1.15 |
| Oct. | 27.65 | 76.63 | 1.05 | 1.08 |
| Nov. | 27.92 | 76.90 | 1.02 | 1.13 |
| Dec. | 27.83 | 77.03 | 0.99 | 1.14 |
Table 3.
Prevalence of physiological heat stress with selected sociodemographic variables.
| Variable | Participants | Physiological Equivalent Temperature | OR (95% CI) | p-Value | |
|---|---|---|---|---|---|
| Positive Thermal Response | Neutral and Negative Thermal Response | ||||
| n (%) | n (%) | n (%) | |||
| Gender (n = 864) | 0.670 | ||||
| Male | 401 (46.4) | 152 (17.6) | 249 (28.8) | 1.06 (0.81, 1.40) | |
| Female | 463 (53.6) | 169 (19.6) | 294 (34.0) | Reference | |
| Age group (n = 858) | 0.113 | ||||
| <20 years | 311 (36.2) | 120 (14.0) | 191 (22.3) | 1.45 (1.01, 2.09) | |
| 20–23 years | 138 (16.1) | 53 (6.2) | 85 (9.9) | 1.44 (0.92, 2.25) | |
| 24–31 years | 184 (21.4) | 75 (8.7) | 109 (12.7) | 1.59 (1.06, 2.39) | |
| >31 years | 225 (26.2) | 68 (7.9) | 157 (18.3) | Reference | |
| Ethnicity (n = 846) | 0.002 * | ||||
| Malay | 406 (48.0) | 176 (20.8) | 230 (27.2) | 1.89 (1.00, 3.55) | |
| Chinese | 323 (38.2) | 98 (11.6) | 225 (26.6) | 1.07 (0.56, 2.05) | |
| Indian | 65 (7.7) | 25 (3.0) | 40 (4.7) | 1.54 (0.71, 3.37) | |
| Others | 52 (6.1) | 15 (1.8) | 37 (4.4) | Reference | |
| Duration spent outdoors in a day (n = 840) | 0.814 | ||||
| <3 h | 197 (23.5) | 75 (8.9) | 122 (14.5) | 0.92 (0.61, 1.39) | |
| 3–5 h | 275 (32.7) | 98 (11.7) | 177 (21.1) | 0.83 (0.56, 1.22) | |
| 5–9 h | 191 (22.7) | 72 (8.6) | 119 (14.2) | 0.90 (0.59, 1.37) | |
| >9 h | 177 (21.1) | 71 (8.5) | 106 (12.6) | Reference | |
* Correlation is significant at the 0.01 level (2-tailed).
Table 4.
Summary of the findings of perceived outdoor thermal comfort levels.
| Perceived OTC | Value | n (%) |
|---|---|---|
| Thermal sensation | Positive thermal sensation | 856 (74.0) |
| Neutral and negative thermal sensation | 288 (24.9) | |
| Thermal acceptance | Acceptable | 828 (71.6) |
| Unacceptable | 232 (27.9) | |
| Thermal preference | Warmer | 114 (9.9) |
| No change | 232 (20.1) | |
| Cooler | 806 (69.7) | |
| Thermal comfort | High discomfort | 75 (6.5) |
| Little discomfort | 558 (48.2) | |
| No effect | 229 (19.8) | |
| Little comfort | 236 (20.4) | |
| High comfort | 55 (4.8) |
Disclaimer/Publisher’s Note: The statements, opinions and data contained in all publications are solely those of the individual author(s) and contributor(s) and not of MDPI and/or the editor(s). MDPI and/or the editor(s) disclaim responsibility for any injury to people or property resulting from any ideas, methods, instructions or products referred to in the content. |
© 2023 by the authors. Licensee MDPI, Basel, Switzerland. This article is an open access article distributed under the terms and conditions of the Creative Commons Attribution (CC BY) license (https://creativecommons.org/licenses/by/4.0/).
Share and Cite
MDPI and ACS Style
Fong, C.S.; Manavvi, S.; Priya, R.S.; Ramakreshnan, L.; Sulaiman, N.M.; Aghamohammadi, N. Traits of Adaptive Outdoor Thermal Comfort in a Tropical Urban Microclimate. Atmosphere 2023, 14, 852. https://doi.org/10.3390/atmos14050852
AMA Style
Fong CS, Manavvi S, Priya RS, Ramakreshnan L, Sulaiman NM, Aghamohammadi N. Traits of Adaptive Outdoor Thermal Comfort in a Tropical Urban Microclimate. Atmosphere. 2023; 14(5):852. https://doi.org/10.3390/atmos14050852
Chicago/Turabian StyleFong, Chng Saun, Suneja Manavvi, Radhakrishnan Shanthi Priya, Logaraj Ramakreshnan, Nik Meriam Sulaiman, and Nasrin Aghamohammadi. 2023. "Traits of Adaptive Outdoor Thermal Comfort in a Tropical Urban Microclimate" Atmosphere 14, no. 5: 852. https://doi.org/10.3390/atmos14050852
Note that from the first issue of 2016, this journal uses article numbers instead of page numbers. See further details here.