

Atmospheric Observation of Fluorinated Greenhouse Gases around Four Chemical Plants in China
by
 , ,
, ,
Tengfei Ma
1,
Jing Wu
2,3,*,
Dongmei Hu
1,
Tong Ye
4,
Mingzhu Li
4,
Tong Wang
2,3,
Yueling Zhang
1 and
Mao Yuan
4,* 1
The MOE Key Laboratory of Resource and Environmental System Optimization, College of Environmental Science and Engineering, North China Electric Power University, Beijing 102206, China
2
Engineering Research Center of Clean and Low-Carbon Technology for Intelligent Transportation, Ministry of Education, School of Environment, Beijing Jiaotong University, Beijing 100044, China
3
Institute of Transport Energy and Environment, Beijing Jiaotong University, Beijing 100044, China
4
China National Environmental Monitoring Center, Beijing 100012, China
*
Authors to whom correspondence should be addressed.
Atmosphere 2023, 14(5), 817; https://doi.org/10.3390/atmos14050817
Submission received: 12 February 2023
/
Revised: 25 April 2023
/
Accepted: 26 April 2023
/
Published: 30 April 2023
(This article belongs to the Section Air Quality)
Abstract
:Due to the high global warming potential and rapidly increasing atmospheric concentrations of fluorinated greenhouse gases (hereinafter referred to as F-gases), the emission estimation has been widely studied. Additionally, the atmospheric observation supports the emission estimation. However, there are few F-gas studies with respect to chemical plants. In this study, we firstly carried out atmospheric observation studies of F-gases around chemical plants in China. Four typical chemical plants were selected, and the concentration levels, their concentration differences (hereinafter referred to as the up–down difference) and enhanced ratios (hereinafter referred to as the up–down enhanced ratio) of the F-gases at upwind and downwind sites in the four plants were observed. Both the upwind and downwind observation results of each plant showed that the average concentrations of HFCs were the highest (57%–85%), followed by PFCs, while the total average concentrations of SF6 and NF3 only accounted for less than 5%. The F-gases, with both the larger up–down enhanced ratios and the larger up–down differences in each plant, may suggest larger emission strengths during fluorinated production, by-products and usage processes. Additionally, the numbers of F-gas species emitted from Plants A, B and C were all significantly higher than those from Plant D. This may be because the F-gases in Plants A, B and C were emitted not only during fluorinated production and by-product processes, but also during usage processes, with respect to refrigeration and air-conditioning or foam insulation materials. The F-gases emitted by each plant did not cause toxicity to humans at sensitive sites; however, they can cause nonnegligible climate impacts. In the future, it is necessary to select more typical chemical plants to carry out the atmospheric observation of F-gases, with a higher observation frequency and larger sample size, to further estimate F-gas emissions from chemical plants in China.
1. Introduction
Greenhouse gases (GHGs) are gases in the atmosphere that can absorb solar radiation reflected from the ground, and emit the radiation again [1]. The seven GHGs controlled under the Kyoto Protocol of the United Nations Framework Convention on Climate Change include carbon dioxide (CO2), methane (CH4), nitrous oxide (N2O), hydrofluorocarbons (HFCs), perfluorocarbons (PFCs), sulfur hexafluoride (SF6) and nitrogen trifluoride (NF3) [2]. The latter four GHGs contain fluorine atoms, and are thus called fluorinated greenhouse gases (hereinafter referred to as F-gases) in this paper. The sources of F-gases are almost all anthropogenic sources that are emitted during the production and usage processes of the substitutes for ozone-depleting substances (ODSs), fluorochemical industry, electronic industry, electric power industry, metal smelting and so on [3,4]. The global background concentrations of F-gases are extremely low, at only several ppt to hundreds of ppt (https://gml.noaa.gov/dv/iadv/index.php (accessed on 10 February 2023)). Additionally, the global annual global warming potential (GWP)-weighted emissions of F-gases amounted to billions of tons per year [5], which was an order of magnitude lower than ten billion tons of CO2 emissions per year [5,6,7]. Moreover, the GWPs of F-gases are high, at 124–22,800 [8], and the global background concentrations are increasing rapidly at an annual growth rate far greater than that of CO2, CH4 and other GHGs (https://ghgdata.epa.gov/ghgp/main.do# (accessed on 10 February 2023)) [9]. From 2009 to 2018, the average annual growth of global GWP-weighted emissions of F-gases was 4.4% [5]. Additionally, the global GWP-weighted emissions of HFCs increased by 18% in 2016–2020 [10]. Therefore, the atmospheric observations of F-gases were widely carried out.
Many studies have been carried out on F-gases, including the physicochemical analysis of F-gases, replacement evaluation, environmental impact, and emission estimation [11]. Research conducted on physicochemical analyses mainly focused on determining the GWP, which was estimated by using the reaction rate and other parameters of F-gases [12,13,14,15]. In addition, the technologies of emission reduction and recovery of F-gases were studied by using physical and chemical experiments, such as catalysis, adsorption and separation [16,17,18,19,20,21,22]. The feasibility of the substance as a replacement for F-gases was evaluated by using performance tests, and the replacement of the refrigerants has been widely studied [23,24,25]. The impact of climate change and biological toxicity was studied to evaluate the environmental impacts of F-gases [26,27,28,29,30,31]. The emissions of F-gases have been calculated based on bottom–up and top–down methods [24,32,33], and atmospheric observation was the important support for emission estimation. The atmospheric observations of F-gases have been mostly carried out at background and urban sites. Background sites are locations for observing the composition of the clean and remote atmosphere, and for detecting the long-term changes and trends of F-gases [34]. Based on the observed background concentrations, the global emissions of NF3 and SF6 can be estimated by using two-box models from the 1970s [35,36]. Additionally, by using the 12-box model, the global emissions of HFCs, PFCs and SF6 were also estimated from the 2000s to the 2010s [37,38,39,40]. At the same time, the atmospheric concentrations at the background sites were also affected by local or regional emissions [34]. By using the FLEXPART, FLEXINVERT+ or InTEM model, the regional emissions of F-gases can be reversed based on the observation data containing pollution information [41,42,43]. In China, only the emissions of HFCs were reversed by using FLEXPART [44,45]. In addition, the combination of FLEXPART-COSMO, and the tracer ratio method was also used to reverse the emissions of F-gases in Swiss [46,47]. Urban sites are locations for studying the concentration level and composition of F-gases in the urban atmosphere, which can be used to analyze pollution characteristics by being compared to background concentrations. By using the interspecies correlation method, the emissions of cities, regions or nations can be reversed based on urban observation data [48,49,50,51]. Chemical plants are one of the main emission sources of F-gases, but so far, few atmospheric observation studies have been conducted on F-gases around chemical plants.
China has ranked first in the world in terms of annual GHG emissions since 2014, and it is the largest producer, consumer and emitter of HFCs worldwide [52,53]. Therefore, it is necessary to carry out F-gas atmospheric observations around chemical plants in China. In this study, we firstly carried out atmospheric observation studies on F-gases around chemical plants in China. Four typical chemical plants were selected, and the concentration levels and their concentration differences of F-gases at upwind and downwind sites in the four plants were observed.
2. Materials and Methods
2.1. Sampling Sites
We selected one chemical plant with fluorochemical companies in the Shandong, Jiangsu and Zhejiang Provinces (Plants A, B and C, respectively), and a chemical plant in the Guangdong Province that only used F-gases without fluorochemical company (Plant D). Atmospheric observations were carried out around the four chemical plants. In the four plants, the emissions of the F-gases were mainly unorganized during production and by-product processes, so the plants can be regarded as area sources. The distance between each sampling site and the area source center was 1–3 km.
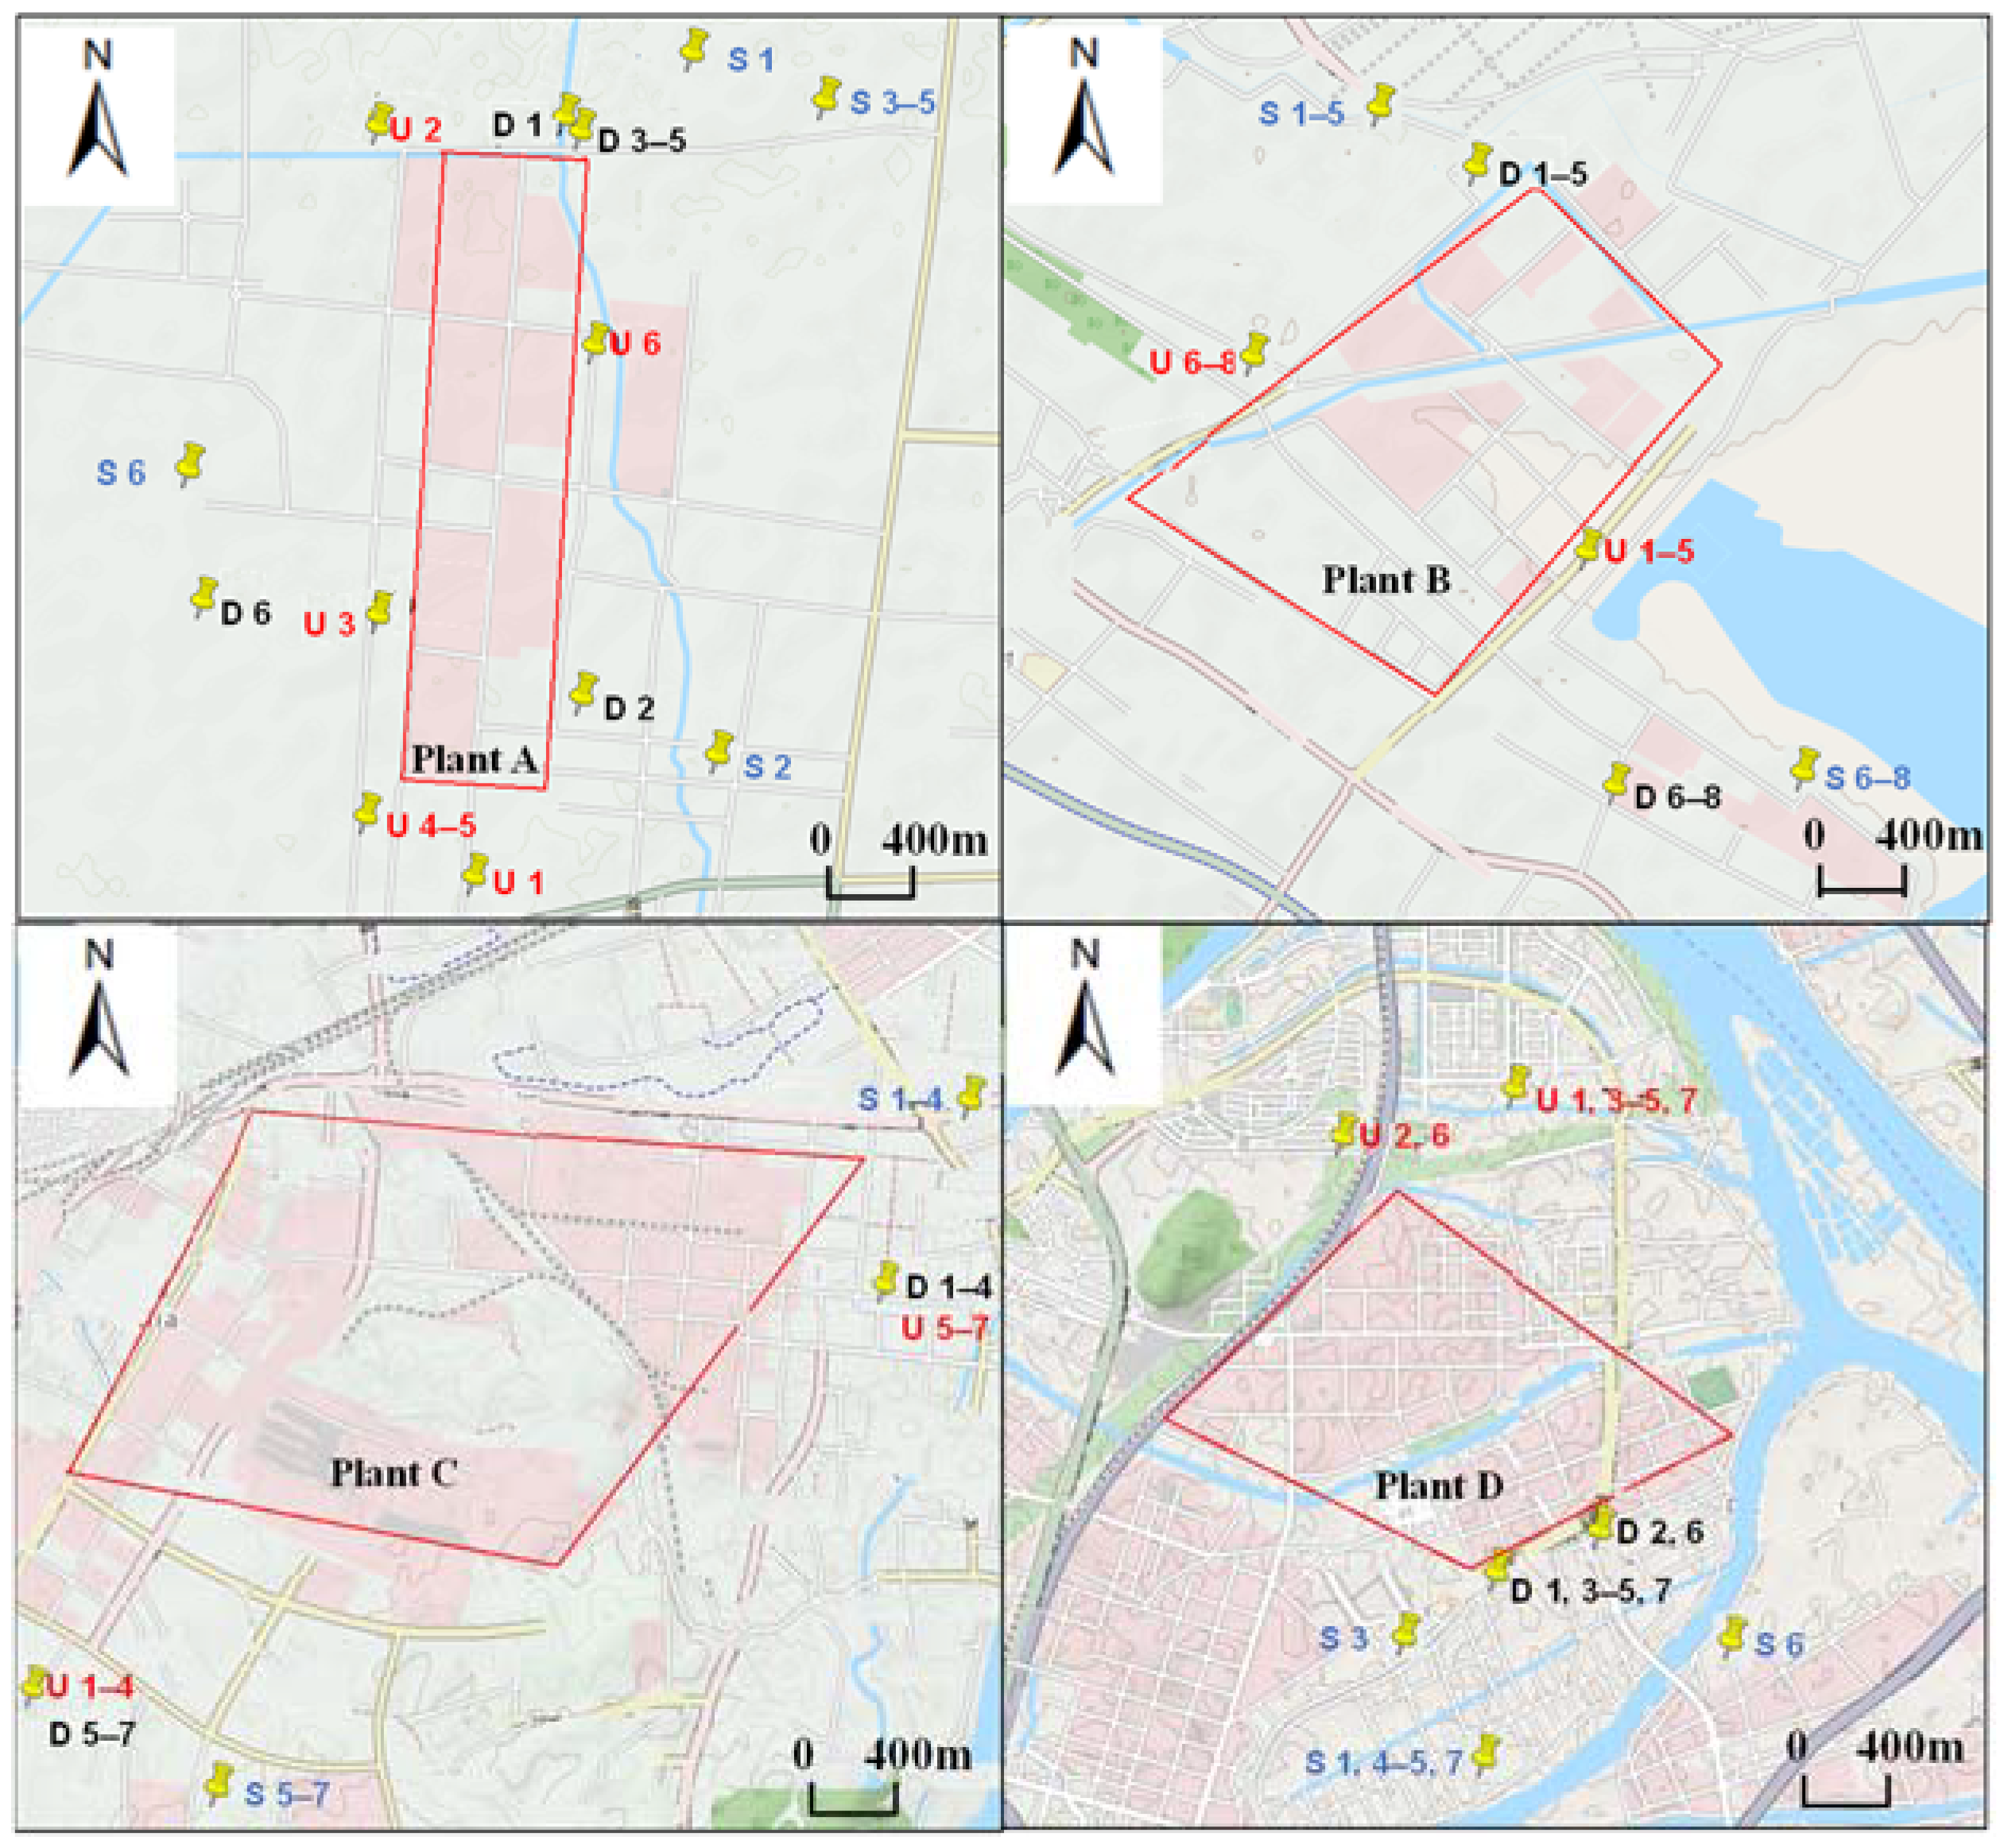
In November 2021, we carried out a total of 28 effective observations at 4 plants, including 6 effective observations in Plant A and Plant C, and 7 effective observations in Plant B and Plant D. For each observation, F-gas samples were collected at 1–2 upwind sites, 1–2 downwind sites and 1–2 sensitive sites at the same time. According to the meteorological data from a period of 7 days before sampling, the dominant wind direction in the production period of the plant was analyzed, and the AERMOD model was used to simulate the concentration distributions of F-gases around the plants. Then, the 1–2 upwind sites,1–2 downwind sites and 1–2 sensitive sites were arranged around the plants. A schematic diagram of the location of sampling sites for each observation is given in Figure 1. The samples and meteorological data during sampling in each plant are given in Table S1. Among the 4 plants, the wind directions of both Plant A and Plant B were mostly southwest, and the wind speed was within 6 m/s. The wind directions of Plant C and Plant D were southeast and north, respectively, and the wind speeds were within 3 m/s. It should be noted that the terrain around the four plants located in the suburbs is open and flat, with few farmlands and no other industrial, residential and transportation sources within a radius of 3 km.
2.2. Sampling and Chemical Analysis
Before sampling, we used a canister cleaner with high-purity nitrogen (ENTECH3100D, ENTECH) to clean the SUMMA canister (3 L, LAB COMMERCE). During the sampling process, we used the positive pressure sampler of the SUMMA canister (RGSZ-1, Qingdao Rongguang Electronic Technology Co., Ltd., Qingdao, China) for sampling, and replaced one filter head for every four samples collected, to prevent cross contamination.
The SUMMA canisters were transported to the laboratory, and a system for the high-precision measurement of halogenated gases (ODS5-pro) was used to capture and analyze the target substances (http://tianjiods.cn/ods5pro.html#_jcp=2 (accessed on 10 February 2023)). The specific steps were to remove most N2, O2, Ar, Xe, CH4 and CO2 using trap 1, and to re-concentrate and remove impurities using trap 2. A total of 18 species of F-gases, including 10 HFCs, 6 PFCs, SF6 and NF3, were qualitatively and quantitatively analyzed by GC-MS (A91P, Panna Instruments Co., Ltd., Changzhou, China; 7700 B, Suzhou Anyeep Instrument Co., Ltd., Suzhou, China). The name and molecular formula of each F-gas are shown in Table 1. To ensure the accuracy and reliability of the experiment, the overall conditions of the equipment were checked by using an instrument blank and standard gas before formal sampling. In the process of sample determination, three samples were randomly selected from the collected atmospheric samples as parallel samples, which were determined twice. In addition, one instrument blank was added after every three measured samples, so as to avoid the residual caused by excessive sample composition, which could affect accuracy. The detection limit of the GC-MS analysis method was 0.09–2.72 pptv, and measurement precision and accuracy were 0.80%–13.22% and 0.05%–34.29%, respectively. The details are presented in Table 1.
3. Results and Discussion
3.1. Concentrations of F-Gases at the Upwind Sites
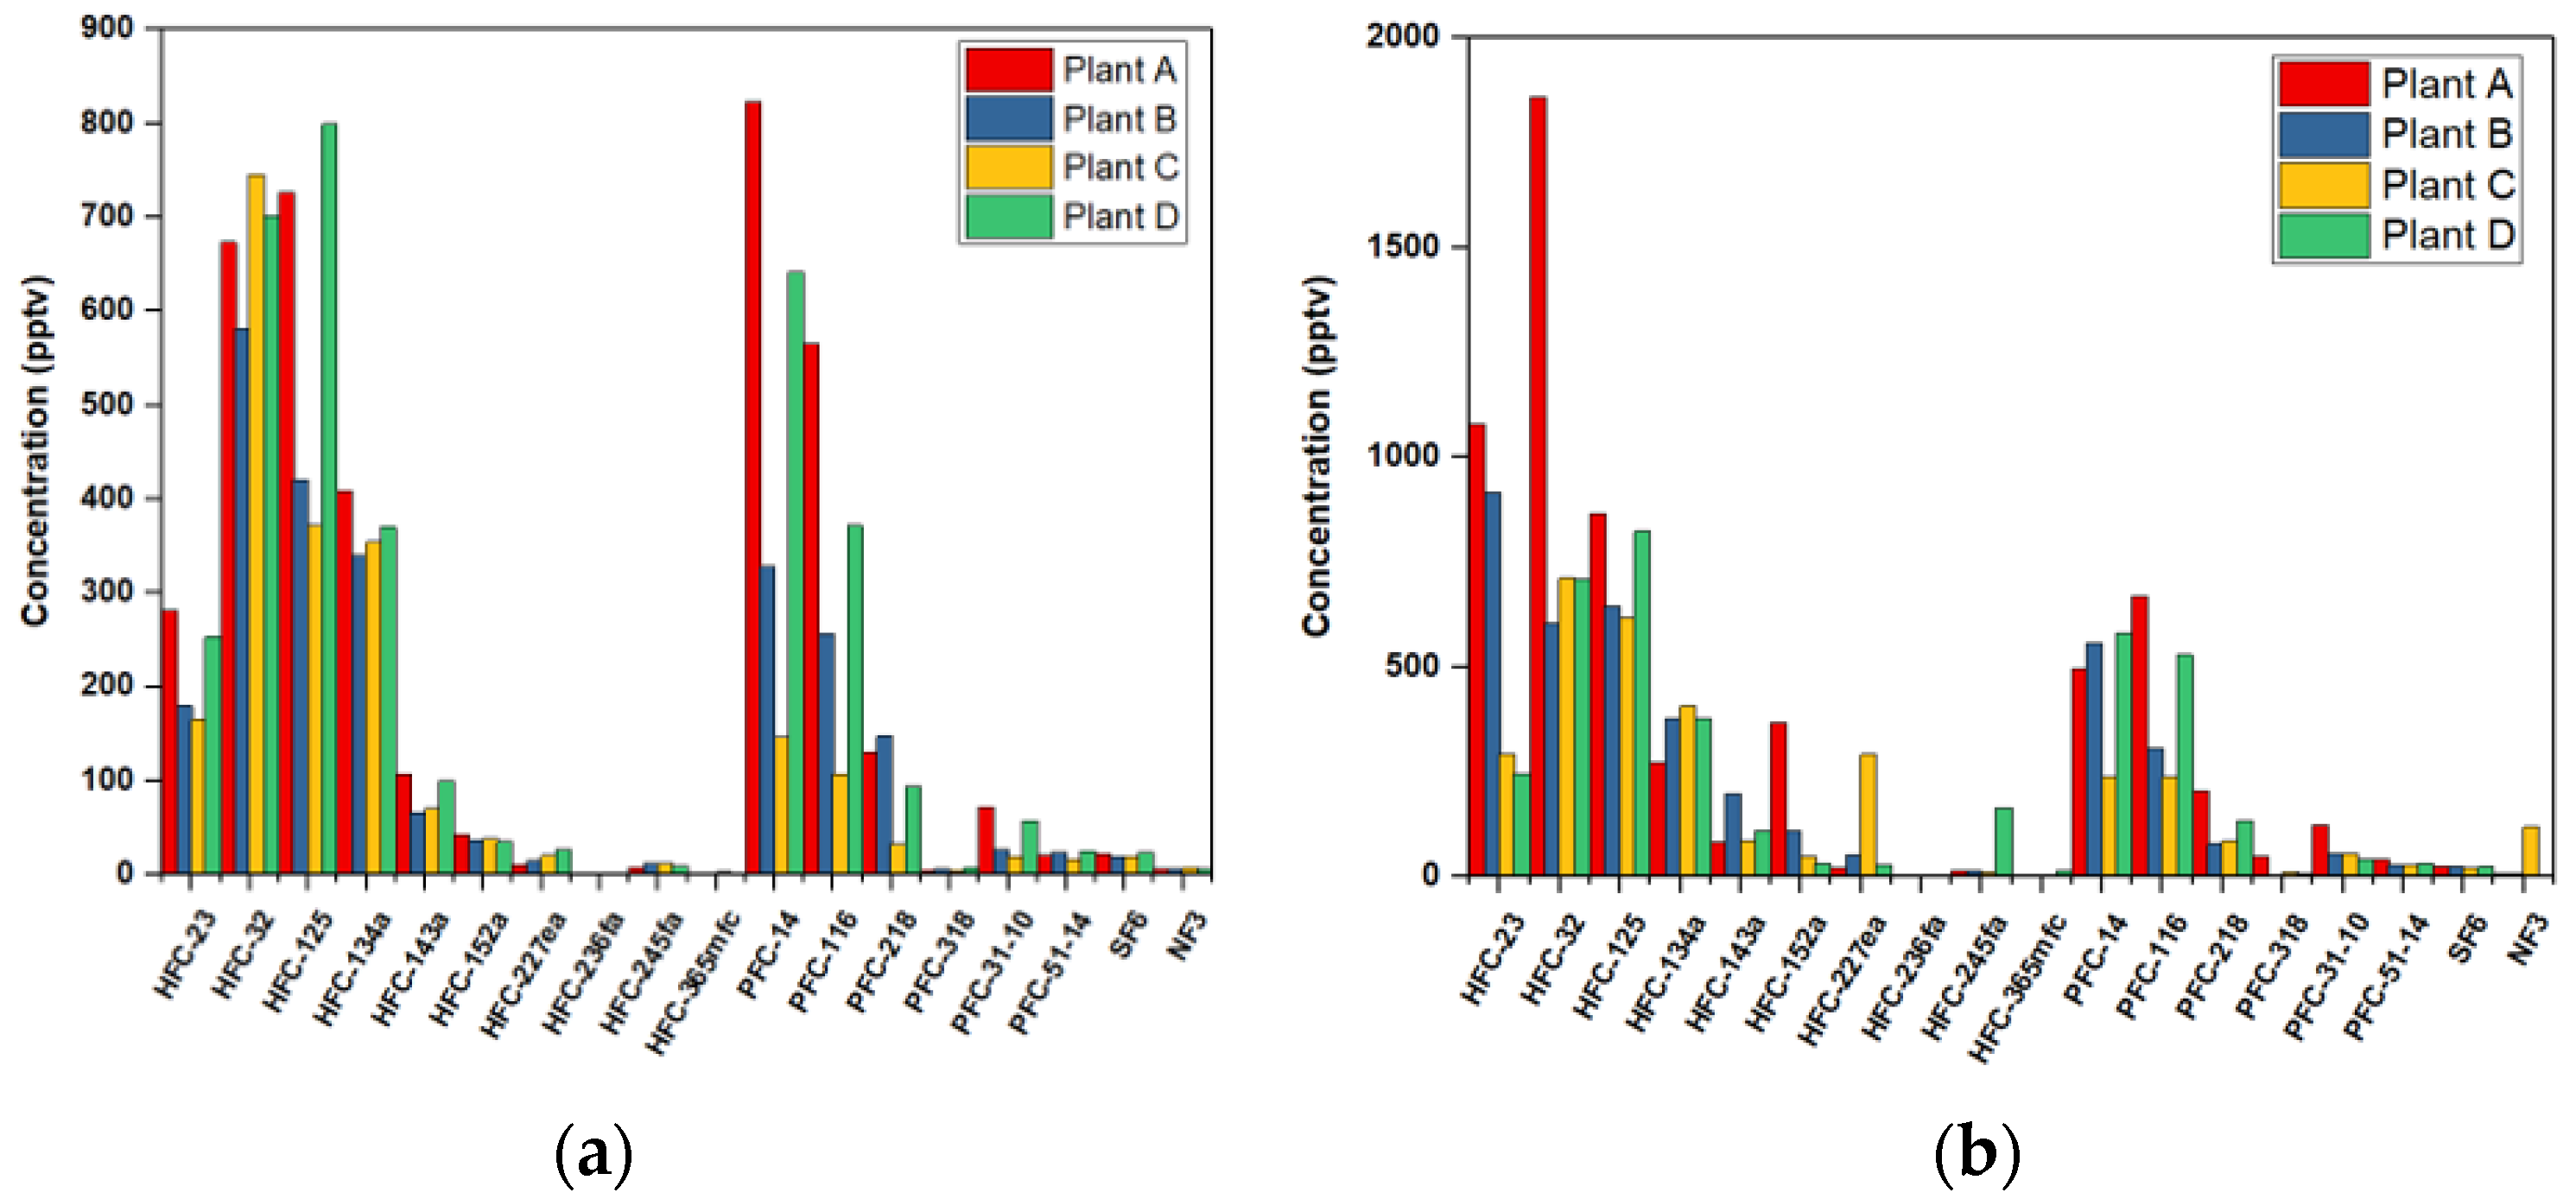
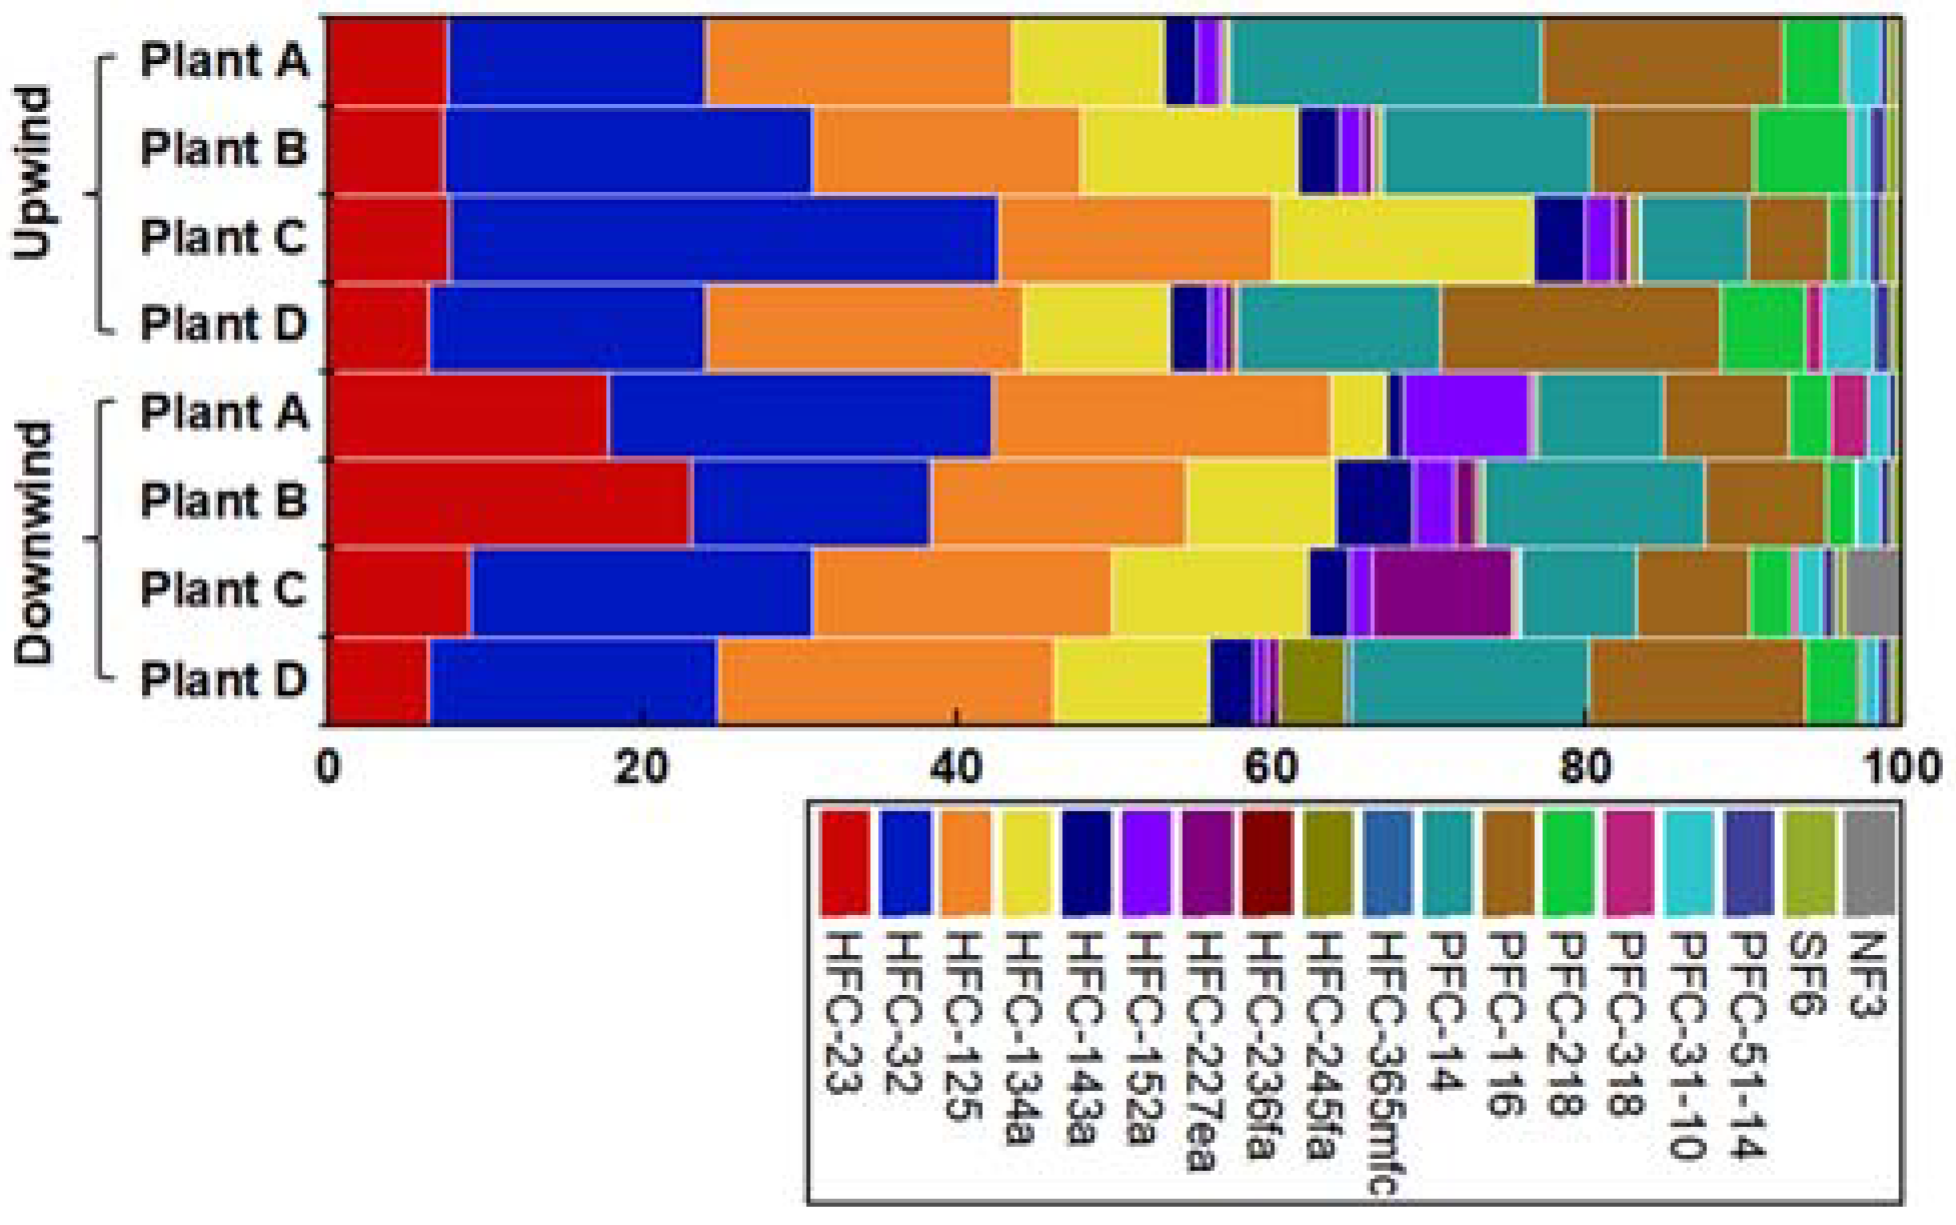
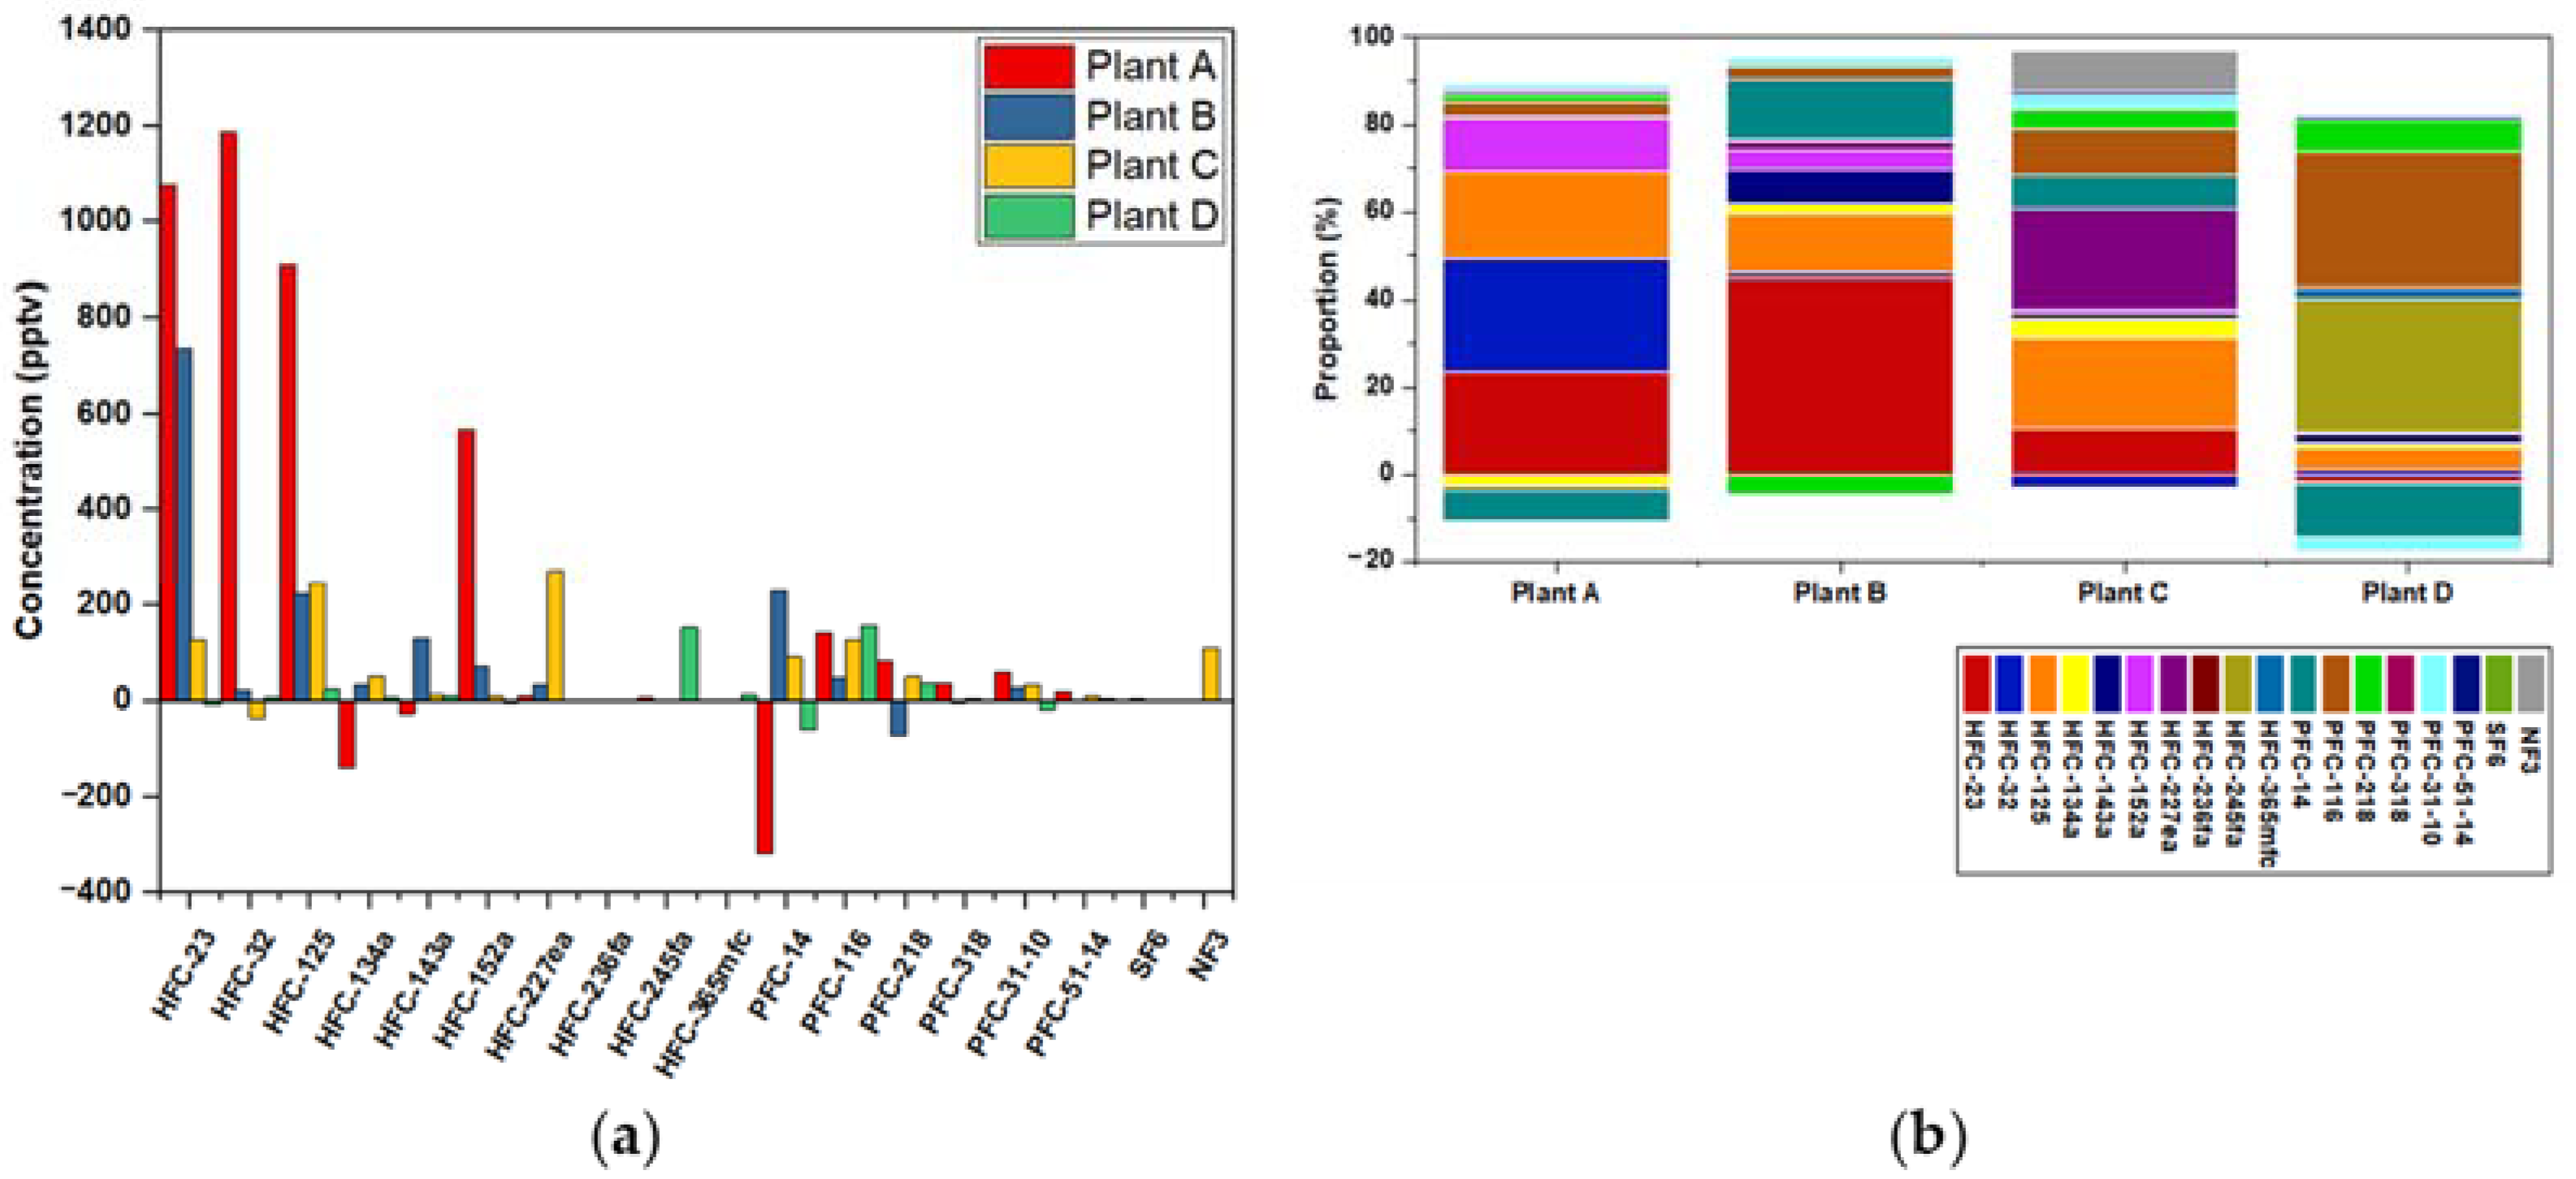
According to the upwind concentration data of each plant (Figure 2), the total average concentrations of F-gases in each plant ranged from 2137 to 3938 pptv. As shown in Figure 3, among F-gases, the F-gases with the highest average concentrations in each plant were HFCs, ranging from 57% to 83%, followed by PFCs (15%–42%), while the total average concentrations of SF6 and NF3 accounted for only about 1%. The F-gas with the lowest average concentrations in each plant was HFC-236fa (0.8–1.1 pptv), which was 238%–407% higher than the background concentrations observed at the Macehead (MHD) station (https://gml.noaa.gov/dv/data.html (accessed on 10 February 2023)). The background concentrations of each F-gas are given in Table S2. The F-gases with the highest average concentrations in each plant were different. Among the four plants, PFC-14, HFC-125 and HFC-32 were the highest in Plant A (646–782 pptv), and they were 790%–2126% higher than the background concentrations of each F-gas. Additionally, the total concentrations of the above three F-gases accounted for 56%. The average concentrations of HFC-32, HFC-125 and HFC-134a were the highest in Plant B and Plant C. Additionally, the total average concentrations of the three F-gases accounted for 54% and 69% of the total concentrations of F-gases, respectively. However, the average concentrations and the enhanced ratios from the background concentrations of the three F-gases in Plant B and Plant C were different. The average concentrations of HFC-32, HFC-125 and HFC-134a in Plant B were 340–581 pptv, with enhanced ratios of 169%–1905%, while the average concentrations and enhanced ratios of the three F-gases in Plant C were 354–746 pptv (180%–2471%). The average concentrations of HFC-125, HFC-32 and PFC-14 were the highest in Plant D (642–799 pptv), being 630%–2381% higher than their respective background concentrations (29–88 pptv). The total average concentrations of the three F-gases accounted for 61%.
3.2. Concentrations of F-Gases at the Downwind Sites
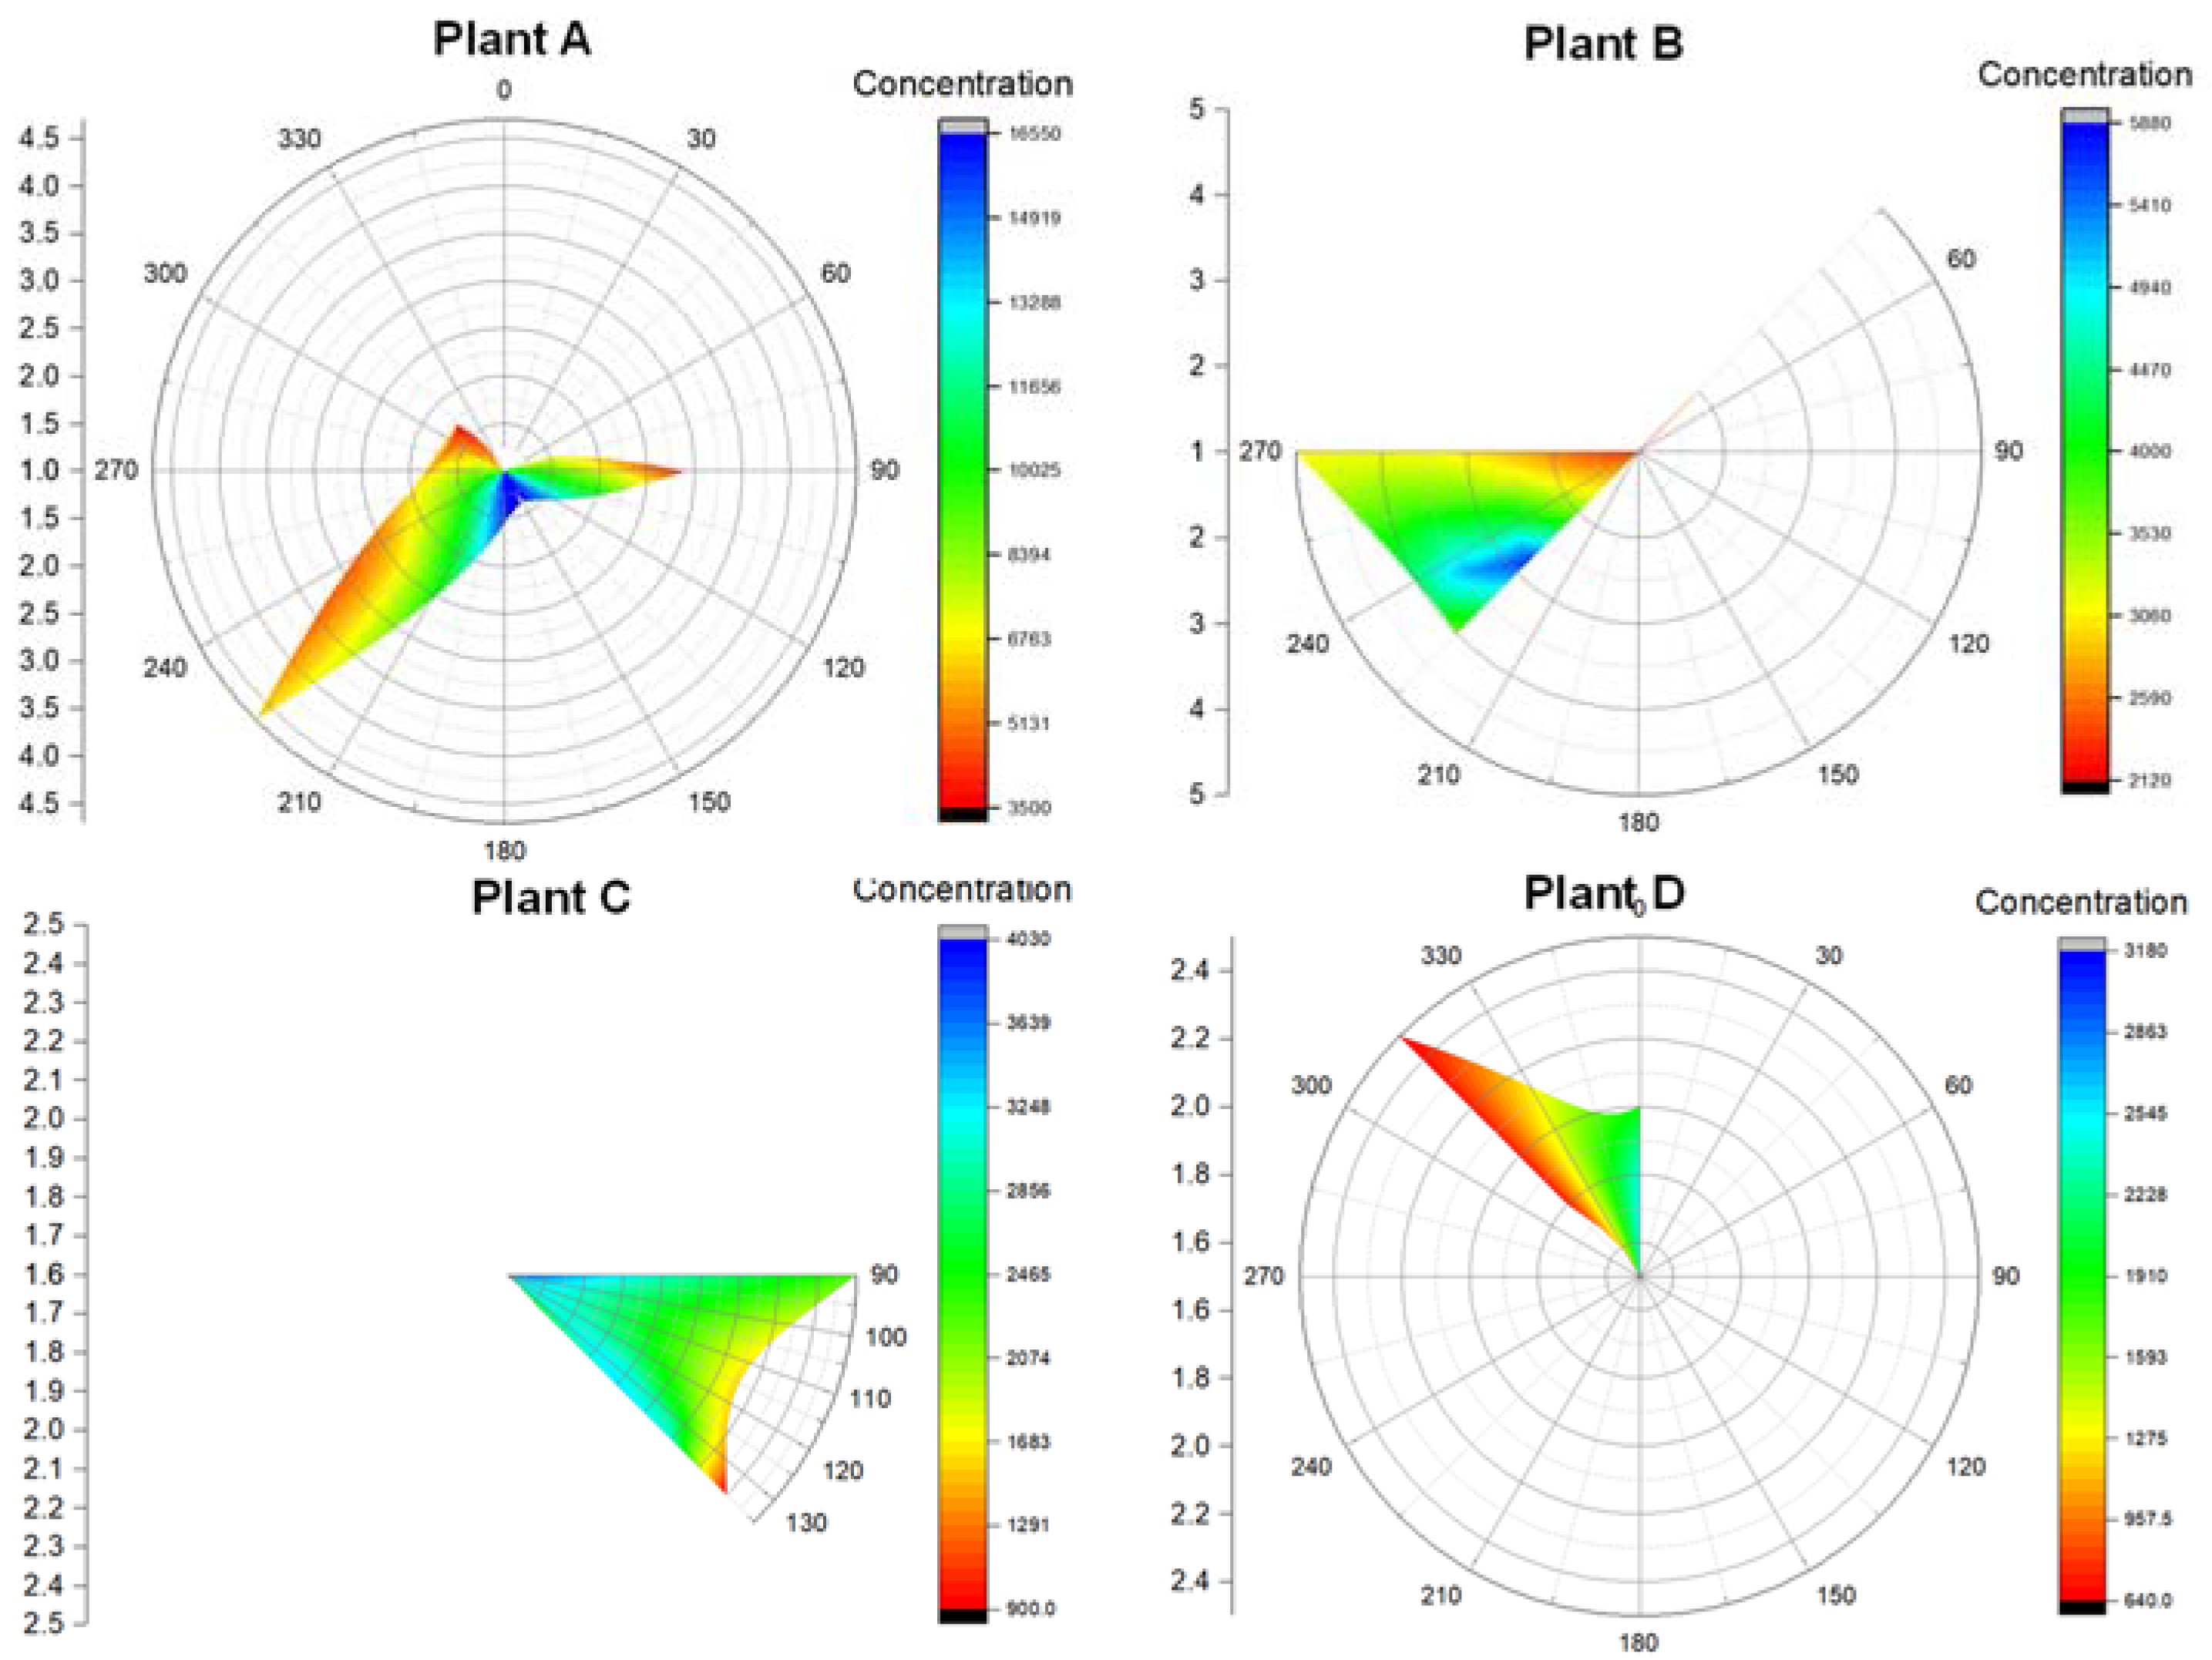
By comparing the relationship between downwind concentrations and wind speed and wind direction (Figure 4), it was found that the downwind concentrations in Plants A, B (wind speed above 2.5 m/s), C and D decreased with the increase in wind speed. A possible reason could be that when wind speeds are higher, the diffusion conditions are better, and the downwind concentration is lower [54,55]. In contrast to this, when the wind speed was lower than 2.5 m/s in Plant B, the wind speed was higher, and the downwind concentrations were higher. When the wind speed was lower than 2.5 m/s, the atmospheric stability was relatively high (D or E) during the sampling period. Because the diffusion degree of the F-gases was relatively low, and the F-gases had difficulty being diffused toward downwind sites, the downwind concentrations increased with the increase in wind speed. In addition, under similar atmospheric conditions, for the F-gas with a high molar mass, only higher emission strengths can lead to considerable concentration differences between the upwind and downwind sites. Therefore, the emission strength of F-gases may be higher relative to a higher molar mass. We consider the first atmospheric observation in Plant A as an example. Under the same meteorological conditions, the concentration differences between the upwind and downwind sites of HFC-23 (70.01 g mol −1) and HFC-125 (102.03 g mol −1) were 17 and 18 pptv, and the emission strength of HFC-125 may be higher due to the higher molar mass of HFC-125.
According to the downwind concentration data of each plant (Figure 2), the total average concentrations of F-gases in each plant ranged from 3255 to 7533 pptv. Similarly to the composition characteristics of the upwind observation data, the F-gases with the highest average concentrations in each plant were HFCs ranging from 65% to 78%, followed by PFCs, accounting for less than 35%, while the total average concentrations of SF6 and NF3 were only within a range of 0.3%–4%. The F-gas with the lowest average concentrations in each plant was HFC-236fa (1.0–1.6 pptv), and it was 339%–613% higher than the background concentrations. The F-gases with the highest average concentrations in each plant were different. Among F-gases, the average concentrations of HFC-23, HFC-32 and HFC-125 were the highest in Plant A and Plant B, and their total average concentrations accounted for 64% and 54%, respectively. However, the downwind average concentrations and enhanced ratios from the background concentrations of the three F-gases in the two plants were different. In Plant A, the average concentrations of HFC-32, HFC-23 and HFC-125 (1358–1859 pptv) were 3673%–6311% higher than their respective background concentrations. In Plant B, the average concentrations (enhanced ratios) of HFC-23, HFC-125 and HFC-32 were 645–916 pptv (1613%–2446%). The average concentrations of HFC-32, HFC-125 and HFC-134a were the highest in Plant C (406–711 pptv), and they were 220%–2351% higher than the background concentrations, and their total average concentrations accounted for 53%. The average concentrations of HFC-125 (823 pptv), HFC-32 (708 pptv) and PFC-14 (581 pptv) were the highest in Plant D, which were 561%–2341% higher than their respective background concentrations (29–88 pptv), with their total average concentrations accounting for 55%.
For HFC-134a and HFC-152a, the average concentrations at the downwind sites in each plant (284–406 pptv and 32–714 pptv) were significantly higher than those previously studied [48,49,51,56], such as the average concentrations of HFC-134a (30–144 pptv) and HFC-152a (10–24 pptv) in 46 Chinese cities in 2010 [56] and the concentrations of HFC-134a in four cities in China from 2009 to 2011 (61–110 pptv) [49], in five cities in China from 2009 to 2019 (61–207 pptv) [51] and in the Pearl River Delta region in 2010 (90 pptv) [48]. It may, to some extent, indicate that the chemical plants were important sources of F-gas emissions in cities.
3.3. Concentration Difference and the Enhanced Ratio of F-Gases between Upwind and Downwind Sites
As shown in Figure 5 and Table 2, the average concentration differences of F-gases between the upwind and downwind sites (hereinafter referred to as up–down differences) in each plant showed that the total up–down differences of F-gases in Plants A, B and C ranged from 960 to 3623 pptv, and the average concentration enhanced the downwind to upwind ratios (hereinafter referred to as up–down enhanced ratios), which ranged from 52% to 93%. However, the total up–down differences of F-gases in Plant D were only 415 pptv, and the up–down enhanced ratio was 9%. This may be because there are fluorochemical companies in Plants A, B and C. F-gases were emitted through fugitive emissions during their production process [3,4,10,57,58]. For example, the emission factors of the production process recommended by IPCC 2006 and IPCC 2019 were 0.5% (0–1%) and 4% (1%–20%). At the same time, a large number of F-gases can be produced as by-products and emitted into the atmosphere, such as HFC-23, SF6, PFC-14, PFC-116, PFC-318, PFC-31-10, and PFC-51-14 [3,4,59]. The emissions of these by-product F-gases may exceed the emissions of F-gases that are intentionally produced [4]. Additionally, the by-product emission factors of these F-gases ranged from 3% to 18% [4]. These F-gases were emitted into the atmosphere via process vents, equipment leakage and container ventilation [4]. F-gases may also be emitted during the usage processes, with respect to refrigeration and air-conditioning or foam insulation materials [3,4,41,60,61]. However, there is no fluorochemical company in Plant D, with F-gases emitting only during usage processes. Therefore, it can be inferred that the emission sources of F-gases in each plant were different, resulting in different emission strengths and up–down differences in each plant.
For the component of up–down differences in each plant, the up–down differences of HFCs were the highest, which accounted for a range of 61%–99% of the total up–down differences of F-gases, followed by PFCs ranging from 1% to 37%. In contrast, the total up–down differences of SF6 and NF3 only accounted for a range of 0%–10% of the total up–down differences of F-gases. The comparison between F-gas concentrations at the upwind sites and those at the downwind sites shows that the average concentrations of most F-gases at the downwind sites of each plant were significantly higher than those at the upwind sites. For example, the up–down differences of HFC-125 in each plant were 24–910 pptv. However, there were also a few F-gases that have lower average concentrations at the downwind sites than upwind sites of each plant, such as HFC-134a, HFC-143a, HFC-365mfc and PFC-14 in Plant A. It was indicated that these F-gases may not be the main F-gases emitted from this plant [62]. In general, the number of F-gas species emitted in Plant C was the highest, with a total of 16 F-gas species, followed by Plant B and Plant A, and the number of F-gas species emitted in Plant D was the lowest (12 F-gas species). A possible reason for this observation may be that there were fluorochemical companies in Plants A, B and C, in which multiple F-gases may be emitted during fluorinated production and by-product processes at the same time [3,4,10,57,58,59]. Additionally, F-gases may also be emitted during usage processes [3,4,41,60,61]. The F-gases in Plant D may mainly be emitted during the usage processes [3,4,41,60,61]. Perhaps the emission sources of F-gases were different, so the species of F-gases emitted were also different.
As shown in Table 2, the F-gases with the highest up–down enhanced ratios in each plant were different. In Plant A, the up–down enhanced ratio of HFC-152a was the highest (1322%), followed by PFC-318 and HFC-23. Among the three F-gases, the up–down differences of HFC-152a and HFC-23 were also high, which accounted for 16% and 30% of the total up–down differences of F-gases, respectively. However, the up–down difference of PFC-318 was low (84 pptv). In Plant B, the up–down enhanced ratios of HFC-23, HFC-227ea and HFC-143a were the highest (200%–409%). Among the three F-gases, the up–down difference of HFC-23 was also high, which accounted for 49% of the total up–down differences of F-gases. However, HFC-227ea and HFC-143a were the opposite. In Plant C, the up–down enhanced ratios of NF3, HFC-227ea and PFC-218 were the highest (157%–1576%), except for PFC-218, and the up–down differences of NF3 (111 pptv) and HFC-227(245 pptv) were also high. In Plant D, the up–down enhanced ratios of HFC-245fa, HFC-365mfc and PFC-116 were the highest (42%–1592%). Additionally, the up–down differences between HFC-245fa and PFC-116 were also high, and the proportions were 47% and 48%. As mentioned by Lv et al. (2015), Wei et al. (2016) and Wei et al. (2018), the higher the up–down differences or up–down enhanced ratios of volatile organic compounds in plants, the higher the emission strength [63,64,65]. Our results also showed the similar features.
3.4. Toxicity and Environmental Impact of the F-Gases
F-gases have high volatility and low or no solubility in water [26,28,66,67,68,69]. After being released into the environment, F-gases almost reside in the atmosphere. Only high F-gas concentrations caused by high emissions over short periods can cause exposure risks, such as cardiotoxicity, pneumonia or pulmonary edema and other diseases [27,28,29,30,31,69]. Based on the exposure limits and the LC50 of F-gases, the health impacts of F-gases at sensitive sites were analyzed (Table 3). Except for HFC-245fa (300 ppm), the exposure limits of other F-gases were 1000 ppm, and except for PFC-218, PFC-31-10, PFC-51-14 and NF3, the LC50 of other F-gases at higher than 81ppm/4H can cause acute toxicity, and both were far higher than the total concentrations of F-gases at sensitive sites (1441–2565 pptv). Therefore, the F-gases emitted by each plant did not cause toxicity relative to humans at sensitive sites.
As shown in Table 3, F-gases have a high GWP (124–22,800) and radiative efficiencies (almost five orders of the magnitude of CO2 (1.33 × 10⁻⁵ W)) [8]. Although the concentrations of F-gases emitted by each plant were not high (419–3623 pptv), they can also cause non-negligible climate impacts. Therefore, it is necessary to continually monitor the concentrations of F-gases in the workplaces and try to adopt the best available abatement technology for reducing the climate and health impacts of F-gases. Currently, some control measures have been taken in China (https://www.mee.gov.cn/ (accessed on 11 Marth 2023)). For example, new construction and expansion of HFC production facilities are not allowed, and the production capacity and material types of the original production facilities cannot increase.
4. Conclusions
Based on the atmospheric observation data around Plants A, B, C and D in the Shandong, Zhejiang, Jiangsu and Guangdong Province, in this study, we observed and analyzed the atmospheric concentration level and concentration difference at the upwind and downwind sites of F-gases at four plants.
The observation results at both the upwind and downwind sites of each plant showed that HFCs had the highest average concentrations in each plant, which ranged from 57% to 83%, followed by PFCs (15%–42%), while the total average concentrations of SF6 and NF3 accounted for less than 5%. The average concentration of HFC-236fa was the lowest in each plant, which was only within a range of 0.8–1.6 pptv, while F-gases with the highest concentrations were different. For example, according to the upwind concentration data of F-gases, the average concentrations of PFC-14, HFC-125 and HFC-32 were the highest in Plant A (673–824 pptv), while the average concentrations of HFC-125, HFC-32 and PFC-14 were the highest (642–799 pptv) in Plant D.
From the up–down differences and up–down enhanced ratios of F-gases in each plant, the total up–down differences in each plant ranged from 415 to 3623 pptv, and from 9% to 93%. Moreover, 13–16 F-gas species were emitted from Plants A, B and C, and they were also significantly higher than those emitted from Plant D (only 12 F-gas species). This may be because F-gases were emitted during the fluorinated production and the by-product processes of fluorochemical companies in Plants A, B and C, as well as the usage processes of refrigeration and air-conditioning equipment or foam insulation materials. However, there is no fluorochemical company in Plant D, and only the emission of F-gases during the usage processes was observed. It can be inferred that the emission sources of F-gases in each plant were different, resulting in different emission strengths and up–down differences in each plant. Therefore, paying attention to the emission of F-gases is necessary during fluorinated production and the by-product processes of fluorochemical companies.
Only high F-gas concentrations caused by high emissions over short periods can cause exposure risk. The F-gases emitted by each plant did not cause toxicity relative to humans. However, because F-gases have a high GWP (124–25,200) and radiative efficiencies (almost five orders of magnitude of CO2 (1.33 × 10⁻⁵ W)), they can cause nonnegligible climate impacts. Therefore, available concentration observation, abatement and control measures should be conducted to reduce the climate and health impacts of F-gases.
Although this study only carried out preliminary atmospheric observations around four chemical plants in China, the methods and principles of selecting sampling sites and the discussion about the effects of wind speed and direction on downwind concentrations in each plant during the sampling period may provide a reference for carrying out the atmospheric observation of other GHGs and atmospheric pollutants around chemical plants. In addition, both up–down enhanced ratios and up–down differences can better identify the F-gases exhibiting high emissions during the fluorinated production and by-product processes, and this method can be used to identify emissions of the main air pollutants from other chemical plants. Because F-gases were emitted during fluorinated production, by-product and usage processes in different chemical plants are different, and the production equipment, process flow and control measures in different chemical plants also differ in the production process. If one wants to further estimate the F-gas emissions of fluorochemical companies in China in the future, selecting more typical chemical plants to carry out the atmospheric observation of F-gases at a higher observation frequency and larger sample size is necessary.
Supplementary Materials
The following supporting information can be downloaded at: https://www.mdpi.com/article/10.3390/atmos14050817/s1, Table S1: Sample information and meteorological conditions during sampling at each plant; Table S2: The background concentrations of each F-gas.
Author Contributions
Conceptualization, T.M., J.W., D.H. and Y.Z.; methodology, T.M., J.W. and D.H.; validation, T.M. and J.W.; investigation, T.M., T.Y. and M.L.; data curation, T.M.; writing—original draft preparation, T.M. and M.Y.; writing—review and editing, J.W., D.H., T.W. and M.Y.; validation, T.M. and J.W.; supervision, J.W., T.Y., M.L. and Y.Z.; project administration, J.W. and M.Y. All authors have read and agreed to the published version of the manuscript.
Funding
This research was funded by the Beijing Municipal Natural Science Foundation, 8232042, the National Key R&D Program of China, 2019YFC0214500, the Talent Fund of Beijing Jiaotong University, 2023JBRC001 and the Demonstration Study on Cooperative Control of Fine Particles and Ozone, DQGG202109.
Institutional Review Board Statement
Not applicable.
Informed Consent Statement
Informed consent was obtained from all subjects involved in the study.
Data Availability Statement
Data will be made available on request.
Conflicts of Interest
The authors declare no conflict of interest.
References
- Zhang, J.; Kuang, S.; Hu, S. Environmental Science; Chemical Industry Press: Beijing, China, 2016; p. 111. [Google Scholar]
- United Nations Framework Convention on Climate Change (UNFCCC). 2012. Available online: https://enb.iisd.org/negotiations/un-framework-convention-climate-change-unfccc (accessed on 10 February 2023).
- Intergovernmental Panel on Climate Change (IPCC). Guidelines for National Greenhouse Gas Inventories Volume 3 Industrial Processes and Product Use—Chapter 3; IGES: Kanagawa, Japan, 2006. [Google Scholar]
- Intergovernmental Panel on Climate Change (IPCC). 2019 Refinement to the 2006 IPCC Guidelines for National Green-house Gas Inventories Volume 3 Industrial Processes and Product Use—Chapter 3; IPCC: Interlaken, Switzerland, 2019. [Google Scholar]
- Forster, P.M.; Storelvmo, T.; Armour, K. Chapter 7: The Earth’s Energy Budget, Climate Feedbacks, and Climate Sensitivity, in Climate Change 2021: The Physical Science Basis. Contribution of Working Group I to the Sixth Assessment Report of the Intergovernmental Panel on Climate Change, Oxford, UK, in Press. 2021. Available online: https://openaccess.wgtn.ac.nz/articles/chapter/Chapter_7_The_Earth_s_energy_budget_climate_feedbacks_and_climate_sensitivity/16869671 (accessed on 10 February 2023).
- Friedlingstein, P.; Matthew, W.J.; Michael, O.S.; Robbie, M.A.; Bakker, D.C.E.; Judith, H.; Corinne, L.Q.; Glen, P.P.; Wouter, P.; Julia Pongratz, S.S.J.G.; et al. Global Carbon Budget 2021. Earth Syst. Sci. Data 2021, 14, 1917–2005. [Google Scholar]
- Friedlingstein, P. Global carbon budgets: Determining limits on fossil fuel emissions. Weather 2020, 75, 210–211. [Google Scholar] [CrossRef]
- Intergovernmental Panel on Climate Change. Synthesis Report. Contribution of Working Groups I, II and III to the Fourth Assessment Report of the Intergovernmental Panel on Climate Change. In Core Writing Team; Pachauri, R.K., Reisinger, A., Eds.; IPCC: Geneva, Switzerland, 2007; p. 104. [Google Scholar]
- Minx, J.C.; William, F.L.; Robbie, M.A.; Josep, G.C.; Monica, C.; Döbbeling, N.; Piers, M.F.; Diego, G.; Jos, O.; Glen, P.P.; et al. Andrew A comprehensive and synthetic dataset for global, regional, and national greenhouse gas emissions by sector 1970–2018 with an extension to 2019. Earth Syst. Sci. Data 2021, 13, 5213–5252. [Google Scholar] [CrossRef]
- United Nations Environment Programme (UNEP). Scientific Assessment of Ozone Depletion; United Nations Environment Programme: Nairobi, Kenya, 2022. [Google Scholar]
- Wang, J.; Fu, H.-Z.; Xu, J.; Wu, D.; Yang, Y.; Zhu, X.; Wu, J. Trends of Studies on Controlled Halogenated Gases under International Conventions during 1999–2018 Using Bibliometric Analysis: A Global Perspective. Sustainability 2022, 14, 806. [Google Scholar] [CrossRef]
- Andersen, M.P.S.; Nielsen, O.J. Atmospheric chemistry of a cyclic hydrofluorocarbon: Kinetics and mechanisms of gas-phase reactions of 1-trifluoromethy l-1,2,2-trifluorocyclobutane with Cl atoms, OH radicals, and O3. Phys. Chem. Chem. Phys. 2019, 21, 1497–1505. [Google Scholar] [CrossRef] [PubMed]
- Sterstrm, F.F.; Andersen, S.T.; Slling, T.I.; Nielsen, O.J.; Andersen, M.P.S. Atmospheric chemistry of Z- and E-CF3CH=CHCF3. Phys. Chem. Chem. Phys. 2017, 19, 735–750. [Google Scholar] [CrossRef]
- Gour, N.K.; Paul, S.; Deka, R.C. Atmospheric Impact of Z-and E-Isomers of CF3CHCHC2F5 Molecule Initiated by OH Radi-cals: Reaction Mechanism, Kinetics and Global Warming Potential. Int. J. Refrig. 2019, 101, 167–177. [Google Scholar] [CrossRef]
- Zhang, N.; Chen, L.; Mizukado, J.; Quan, H.; Suda, H. Rate constants for the gas-phase reactions of (Z)-CF3CHCHF and (E)-CF3CHCHF with OH radicals at 253–328 K. Chem. Phys. Lett. 2015, 621, 78–84. [Google Scholar] [CrossRef]
- Castro, P.J.; Redondo, A.E.; Sosa, J.E.; Zakrzewska, M.E.; Nunes, A.V.M.; Araújo, J.M.M.; Pereiro, A.B. Absorption of Fluorinated Greenhouse Gases in Deep Eutectic Solvents. Ind. Eng. Chem. Res. 2020, 59, 13246–13259. [Google Scholar] [CrossRef]
- Sosa, J.E.; Ribeiro, R.P.P.L.; Castro, P.J.; Mota, J.P.B.; Araújo, J.M.M.; Pereiro, A.B. Absorption of Fluorinated Greenhouse Gases Using Fluorinated Ionic Liquids. Ind. Eng. Chem. Res. 2019, 58, 20769–20778. [Google Scholar] [CrossRef]
- Yang, H.; Wu, S.; Chen, Z.; Li, L.; Wang, H.; Liu, B.; Tang, H.; Li, Y.; Chen, A.; Han, W. Catalytic Performance for the Con-version of Potent Fluorinated Greenhouse Gases by Aluminium Fluorides with Different Morphology. Catal. Lett. 2020, 151, 2065–2074. [Google Scholar] [CrossRef]
- Kopylov, S.N.; Kopylov, P.S.; Eltyshev, I.P.; Kopylov, N.P.; Begishev, I.R. Highly Effective Fire Extinguishing Mixtures of Iodinated and Fluorinated Hydrocarbons as a Way to Reduce Greenhouse Gas Emissions into the Atmosphere. IOP Conf. Series Earth Environ. Sci. 2021, 666, 022011. [Google Scholar] [CrossRef]
- Sosa, J.E.; Ribeiro, R.P.; Castro, P.J.; Mota, J.P.; Pereiro, A.B.; Araújo, J.M. Sorption of fluorinated greenhouse gases in silica-supported fluorinated ionic liquids. J. Environ. Chem. Eng. 2022, 10, 108580. [Google Scholar] [CrossRef]
- Wei, X.; Yang, H.; Liu, B.; Yu, H.; Wang, C.; Wu, S.; Jia, Z.; Han, W. Synthesis of titanium oxyfluoride with oxygen vacancy as novel catalysts for pyrolysis of fluorinated greenhouse gasses to hydrofluoroolefins. J. Taiwan Inst. Chem. Eng. 2021, 129, 189–196. [Google Scholar] [CrossRef]
- Stankuniene, G.; Streimikiene, D.; Kyriakopoulos, G.L. Systematic Literature Review on Behavioral Barriers of Climate Change Mitigation in Households. Sustainability 2020, 12, 7369. [Google Scholar] [CrossRef]
- Daviran, S.; Kasaeian, A.; Golzari, S.; Mahian, O.; Nasirivatan, S.; Wongwises, S. A comparative study on the performance of HFO-1234yf and HFC-134a as an alternative in automotive air conditioning systems. Appl. Therm. Eng. 2017, 110, 1091–1100. [Google Scholar] [CrossRef]
- Prabakaran, R.; Sidney, S.; Iyyappan, R.; Lal, D.M. Experimental studies on the performance of mobile air conditioning system using environmental friendly HFO-123yf as a refrigerant. Proc. Inst. Mech. Eng. Part E J. Process Mech. Eng. 2021, 235, 731–742. [Google Scholar]
- Ha, A.; Bf, A.; Mb, B.; Sa, C.; Gp, D. Overview of low GWP mixtures for the replacement of HFC refrigerants: R134a, R404A and R410A—ScienceDirect. Int. J. Refrig. 2020, 111, 113–123. [Google Scholar]
- Tsai, W.-T. An overview of environmental hazards and exposure risk of hydrofluorocarbons (HFCs). Chemosphere 2005, 61, 1539–1547. [Google Scholar] [CrossRef]
- Sabik, L.; Abbas, R.A.; Ismail, M.M.; El-Refaei, S. Cardiotoxicity of Freon among refrigeration services workers: Compara-tive cross-sectional study. Environ. Health A Glob. Access Sci. Source 2009, 8, 31. [Google Scholar] [CrossRef]
- Alonso, M.L.; Alonso, R.M.; Lombraña, J.I.; Izcara, J.; Izagirre, J. Exploring the Decomposition Products of 1,3,3,3-Tetrafluoropropene and Perfluoro-(3-methylbutan-2-one) Gas Mixtures in Medium-Voltage Electrical Switchgear as Alternatives to SF6. ACS Omega 2021, 6, 21534–21542. [Google Scholar] [CrossRef] [PubMed]
- Ema, M.; Naya, M.; Yoshida, K.; Nagaosa, R. Reproductive and developmental toxicity of hydrofluorocarbons used as re-frigerants. Reprod Toxicol. 2010, 29, 125–131. [Google Scholar] [CrossRef] [PubMed]
- Gaku, I.; Yu, X.; Junzoh, K.; Nobuyuki, A.; Toshihiko, K.; Hisakazu, I.; Eiji, S.; Tetsuya, Y.; Wang, H.; Xie, Z. Reproductive toxicity of 1-bromopropane, a newly introduced alternative to ozone layer depleting solvents, in male rats. Toxicol. Sci. 2000, 54, 416–423. [Google Scholar]
- Rusch, G.M.; Tveit, A.; Muijser, H.; Tegelenbosch-Schouten, M.M.; Hoffman, G.M. The acute, genetic, developmental and inhalation toxicology of trans-1,3,3,3-tetrafluoropropene (HFO-1234ze). Drug Chem. Toxicol. 2012, 36, 170–180. [Google Scholar] [CrossRef] [PubMed]
- Kim, J.; Li, S.; Muhle, J.; Fang, X.; Manning, A.J.; Arnold, T.; Park, S.; Park, M.; Saito, T.; Yokouchi, Y. in Emissions of Tetra-fluoromethane (CF4) and Hexafluoroethane (C2F6) from East Asian Aluminum and Semiconductor Industries. Agu. Fall Meet. 2013, 126, e2021JD034888. [Google Scholar]
- Li-Ying, Y.; Zhang, Z.-Y.; An, M.-D.; Gao, D.; Yi, L.-Y.; Hu, J.-X. The estimated schedule and mitigation potential for hydrofluorocarbons phase-down in China. Adv. Clim. Chang. Res. 2019, 10, 174–180. [Google Scholar] [CrossRef]
- Ruckstuhl, A.F.; Henne, S.; Reimann, S.; Steinbacher, M.; Vollmer, M.K.; O’Doherty, S.; Buchmann, B.; Hueglin, C. Robust extraction of baseline signal of atmospheric trace species using local regression. Atmos. Meas. Tech. 2012, 5, 2613–2624. [Google Scholar] [CrossRef]
- Weiss, R.F.; Mühle, J.; Salameh, P.K.; Harth, C.M. Nitrogen trifluoride in the global atmosphere. Geophys. Res. Lett. 2008, 35, 57. [Google Scholar] [CrossRef]
- Levin, I.; Naegler, T.; Heinz, R.; Osusko, D.; Cuevas, E.; Engel, A.; Ilmberger, J.; Langenfelds, R.L.; Neininger, B.; Rohden, C.V.; et al. The global SF6 source inferred from long-term high precision atmospheric measurements and its comparison with emission inventories. Atmos. Chem. Phys. 2010, 10, 2655–2662. [Google Scholar] [CrossRef]
- Vollmer, M.K.; Miller, B.R.; Rigby, M.; Reimann, S.; Mühle, J.; Krummel, P.B.; O’Doherty, S.; Kim, J.; Rhee, T.S.; Weiss, R.F.; et al. Atmospheric histories and global emissions of the anthropogenic hydrofluorocarbons HFC-365mfc, HFC-245fa, HFC-227ea, and HFC-236fa. J. Geophys. Res. Atmos. 2011, 116, 701. [Google Scholar] [CrossRef]
- Simmonds, P.G.; Rigby, M.; Manning, A.J.; Lunt, M.F.; O’Doherty, S.; McCulloch, A.; Fraser, P.J.; Henne, S.; Vollmer, M.K.; Mühle, J.; et al. Global and regional emissions estimates of 1,1-difluoroethane (HFC-152a, CH3CHF2) from in situ and air archive observations. Atmos. Chem. Phys. 2016, 16, 365–382. [Google Scholar] [CrossRef]
- O’Doherty, S.; Rigby, M.; Mühle, J.; Ivy, D.J.; Miller, B.R.; Young, D.; Simmonds, P.G.; Reimann, S.; Vollmer, M.K.; Krummel, P.B.; et al. Global emissions of HFC-143a (CH3CF3) and HFC-32 (CH2F2) from in situ and air archive atmospheric observations. Atmos. Chem. Phys. 2014, 14, 9249–9258. [Google Scholar]
- Simmonds, P.G.; Matthew, R.; Alistair, J.M.; Sunyoung, P.; Kieran, M.S.; McCulloch, A.; Stephan, H.; Francesco, G.M.M.J.; Vollmer, M.K.; Jens, M.; et al. The increasing atmospheric burden of the greenhouse gas sulfur hexafluoride (SF6). Atmos. Chem. Phys. 2020, 20, 7271–7290. [Google Scholar] [CrossRef]
- Flerlage, H.; Velders, G.J.; de Boer, J. A review of bottom-up and top-down emission estimates of hydrofluorocarbons (HFCs) in different parts of the world. Chemosphere 2021, 283, 131208. [Google Scholar] [CrossRef] [PubMed]
- Graziosi, F.; Arduini, J.; Furlani, F.; Giostra, U.; Cristofanelli, P.; Fang, X.; Hermanssen, O.; Lunder, C.; Maenhout, G.; O’Doherty, S.; et al. European emissions of the powerful greenhouse gases hydrofluorocarbons inferred from atmospheric measurements and their comparison with annual national reports to UNFCCC. Atmos. Environ. 2017, 158, 85–97. [Google Scholar] [CrossRef]
- Manning, A.J.; Alison, L.R.; Daniel, S.; Simon, O.D.; Dickon, Y.; Simmonds, P.G.; Martin, K.V.; Jens, M.; Jgor, A.; Gerard, S.; et al. Evidence of a recent decline in UK emissions of hydrofluorocarbons determined by the InTEM inverse model and at-mospheric measurements. Atmos. Chem. Phys. 2021, 21, 12739–12755. [Google Scholar] [CrossRef]
- Jooil Kim, R.T.; Hyeri, P.; Stephanie, B.; Jens, M.; Park, M.; Yeaseul, K.; Christina, M.H.; Peter, K.S.; Schmidt, R.; Deborah, O.; et al. Emissions of Tetrafluoromethane (CF4) and Hexafluoroethane (C2F6) From East Asia: 2008 to 2019. J. Geophys. Res.-Atmos. 2021, 126, e2021JD034888. [Google Scholar]
- Zhang, B.; Zhang, Y.; Xueli, Z.; Meng, J. Non-CO2 Greenhouse Gas Emissions in China 2012: Inventory and Supply Chain Analy-sis. Earth’s Future 2018, 6, 103–116. [Google Scholar]
- Rust, D. Assessing National Halocarbon Emissions Using Regional Atmospheric Measurements. Chimia 2022, 76, 331. [Google Scholar] [CrossRef]
- Rust, D.; Katharopoulos, I.; Vollmer, M.K.; Henne, S.; O’Doherty, S.; Say, D.; Emmenegger, L.; Zenobi, R.; Reimann, S. Swiss halocarbon emissions for 2019 to 2020 assessed from regional atmospheric observations. Atmos. Chem. Phys. 2022, 22, 2447–2466. [Google Scholar] [CrossRef]
- Wu, J.; Fang, X.; Jonathan, W.M.; Zihan, Z.; Shenshen, S.; Xia, H.; Jiarui, H.; Sihua, L.; Wang, C.; Jianbo, Z.; et al. Estimated emissions of chlorofluorocarbons, hydrochlorofluorocarbons, and hydrofluorocarbons based on an interspecies correlation method in the Pearl River Delta region, China. Sci. Total Environ. 2014, 470, 829–834. [Google Scholar] [CrossRef] [PubMed]
- Wu, J.; Fang, X.; Xu, W.; Wan, D.; Shi, Y.; Su, S.; Hu, J.; Zhang, J. Chlorofluorocarbons, hydrochlorofluorocarbons, and hy-drofluorocarbons in the atmosphere of four Chinese cities. Atmos. Environ. 2013, 75, 83–91. [Google Scholar] [CrossRef]
- Fang, X.; Wu, J.; Su, S.; Zhang, J.; Hu, J. Estimates of major anthropogenic halocarbon emissions from China based on inter-species correlations. Atmos. Environ. 2012, 62, 26–33. [Google Scholar] [CrossRef]
- Yi, L.; Wu, J.; An, M.; Weiguang, X.; Xuekun, F.; Bo, Y.; Yixi, L.; Gao, D.; Xingchen, Z.; Jianxin, H. The atmospheric concentra-tions and emissions of major halocarbons in China during 2009–2019. Environ. Pollut. 2021, 284, 117–190. [Google Scholar] [CrossRef]
- Bie, P.; Fang, X.; Li, Z.; Wang, Z.; Hu, J. Emissions estimates of carbon tetrachloride for 1992–2014 in China. Environ. Pollut. 2017, 224, 670–678. [Google Scholar] [CrossRef]
- World Bank Database: Indicators, Climate Change. 2017. Available online: https://data.worldbank.org.cn/ (accessed on 10 February 2023).
- Lingbo, L.; Long, L.; Mengting, C.; Xiangchen, F.; Alistair, J. Manning. Current status and future developments in monitor-ing of fugitive VOC emissions from petroleum refining and petrochemical industry. Chem. Ind. Eng. Prog. 2020, 39, 1196–1208. [Google Scholar] [CrossRef]
- Liping, C.; Jingtao, C.; Juncheng, J.; Guangfa, D. Effect of turbulence induced by wind velocity on volatile pollutants mass transfer. J. Hohai Univ. (Nat. Sci.) 2012, 40, 610–614. [Google Scholar] [CrossRef]
- Fang, X.; Wu, J.; Xu, J.; Huang, D.; Shi, Y.; Wan, D.; Wu, H.; Shao, M.; Hu, J. Ambient mixing ratios of chlorofluorocarbons, hydrochlorofluorocarbons and hydrofluorocarbons in 46 Chinese cities. Atmos. Environ. 2012, 54, 387–392. [Google Scholar] [CrossRef]
- Mühle, J.; Trudinger, C.M.; Rigby, M.; Western, L.M.; Weiss, R.F. Perfluorocyclobutane (PFC-318, c-C4F8) in the global at-mosphere. Atmos. Chem. Phys. 2019, 19, 10335–10359. [Google Scholar] [CrossRef]
- The People’s Republic of China Second Biennial Update Report on Climate Change. 2018. Available online: https://unfccc.int/sites/default/files/resource/China%202BUR_English.pdf (accessed on 24 April 2023).
- United Nations Framework Convention on Climate Change (UNFCCC). 2005. Available online: https://unfccc.int/resource/docs/convkp/conveng.pdf (accessed on 24 April 2023).
- Yao, B.; Fang, X.; Vollmer, M.K.; Reimann, S.; Chen, L.; Fang, S.; Prinn, R.G. China’s Hydrofluorocarbon Emissions for 2011–2017 Inferred from Atmospheric Measurements. Environ. Sci. Technol. Lett. 2019, 6, 479–486. [Google Scholar] [CrossRef]
- Ashford, P.; Clodic, D.; McCulloch, A.; Kuijpers, L. Emission profiles from the foam and refrigeration sectors comparison with atmospheric concen-trations. Part 2: Results and discussion. Int. J. Refrig. 2004, 27, 701–716. [Google Scholar] [CrossRef]
- Bai, H.-X.; Wei, W.; Wang, Y.-T.; Ren, Y.-T.; Zang, J.-X.; Cheng, S.-Y. Characteristics of VOCs Emitted from the Rubber Tire Manufacturing Industry Based on the Inverse-Dispersion Calculation Method. Huan Jing ke Xue= Huanjing Kexue 2019, 40, 2994–3000. [Google Scholar] [PubMed]
- Lv, Z.; Wei, W.; Yang, G.; Cheng, S. Inversion research in VOCs source emission of a petroleum refinery. China Env.-Tal Sci. 2015, 35, 2958–2963. [Google Scholar]
- Wei, W.; Wang, Y.; Yang, G.; Yue, L.; Cheng, S. Speciated VOCs emission estimate for a typical petrochemical manufacturing plant in China using inverse-dispersion calculation method. Environ. Monit. Assess. 2018, 190, 451. [Google Scholar] [CrossRef]
- Wei, W.; Lv, Z.; Yang, G.; Cheng, S.; Li, Y.; Wang, L. VOCs emission rate estimate for complicated industrial area source using an inverse-dispersion calculation method: A case study on a petroleum refinery in Northern China. Environ. Pollut. 2016, 218, 681–688. [Google Scholar] [CrossRef]
- Zhang, X.; Li, Y.; Xiao, S.; Tang, J.; Tian, S.; Deng, Z. Decomposition Mechanism of C5F10O: An Environmentally Friendly Insulation Medium. Environ. Sci. Technol. 2017, 51, 10127–10136. [Google Scholar] [CrossRef]
- Tsai, W.-T. Environmental and health risk analysis of nitrogen trifluoride (NF3), a toxic and potent greenhouse gas. J. Hazard. Mater. 2008, 159, 257–263. [Google Scholar] [CrossRef]
- Sekiya, A.; Misaki, S. The potential of hydrofuoroethers to replace CFCs, HCFCs and PFCs. J. Fluorine Chem. 2000, 101, 215–221. [Google Scholar] [CrossRef]
- Wang, Y.-F.; Shih, M.; Tsai, C.-H.; Tsai, P.-J. Total toxicity equivalents emissions of SF6, CHF3, and CCl2F2 decomposed in a RF plasma environment. Chemosphere 2006, 62, 1681–1688. [Google Scholar] [CrossRef]
Figure 1.
Schematic diagram of the locations of sampling sites around four plants in China. U, D and S denoted upwind, downwind and sensitive sampling sites in each plant, respectively.
Figure 1.
Schematic diagram of the locations of sampling sites around four plants in China. U, D and S denoted upwind, downwind and sensitive sampling sites in each plant, respectively.

Figure 2.
The average concentrations of F-gases at the upwind and downwind sites in each plant (pptv). (a) Upwind; (b) downwind.
Figure 2.
The average concentrations of F-gases at the upwind and downwind sites in each plant (pptv). (a) Upwind; (b) downwind.

Figure 3.
The proportion of average concentrations at the upwind and downwind sites in each plant (%).
Figure 3.
The proportion of average concentrations at the upwind and downwind sites in each plant (%).

Figure 4.
The relationship between the downwind concentrations, and wind speed and wind direction.

Figure 5.
The concentration differences of F-gases at the upwind and downwind directions, and their proportions relative to each plant. (a) Concentration difference; (b) proportion.
Figure 5.
The concentration differences of F-gases at the upwind and downwind directions, and their proportions relative to each plant. (a) Concentration difference; (b) proportion.


Table 1.
Limits of detection (LOD), precision (%) and accuracy (%) of each F-gas.
| Substance | Molecular Formula | LOD (pptv) | Precision (%) | Accuracy (%) |
|---|---|---|---|---|
| PFC-14 | CF4 | 1.79 | 0.80 | / |
| PFC-116 | C2F6 | 0.17 | 1.20 | 0.67 |
| PFC-218 | C3F8 | 0.09 | 4.61 | 3.02 |
| PFC-318 | C4F8 | 0.10 | 4.61 | 3.02 |
| PFC-31-10 | C4F10 | 0.08 | 13.22 | 34.29 |
| PFC-51-14 | C6F14 | 0.06 | 7.58 | 2.92 |
| SF6 | SF6 | 0.42 | 1.48 | 0.59 |
| NF3 | NF3 | 0.18 | 2.00 | / |
| HFC-23 | CHF3 | 1.16 | 0.46 | 0.05 |
| HFC-32 | CH2F2 | 1.39 | 1.39 | 2.64 |
| HFC-125 | CHF2CF3 | 0.96 | 0.90 | 0.98 |
| HFC-134a | CH2FCH3 | 2.72 | 0.80 | 0.08 |
| HFC-143a | CH3CF3 | 0.67 | 0.91 | 0.74 |
| HFC-152a | C2H4F2 | 0.32 | 1.20 | 0.80 |
| HFC-227ea | CF3CHFCF3 | 0.15 | 2.56 | 0.05 |
| HFC-236fa | CF3CH2CF3 | 0.06 | 7.46 | 6.63 |
| HFC-245fa | CF3CH2CHF2 | 0.30 | 3.03 | 1.35 |
| HFC-365mfc | CF3CH2CH3CF2 | 0.14 | 4.08 | 0.30 |
Table 2.
The up–down enhanced ratio of each F-gas.
| Substance | Plant A | Plant B | Plant C | Plant D |
|---|---|---|---|---|
| PFC-14 | −38% | 70% | 62% | −9% |
| PFC-116 | 25% | 19% | 119% | 42% |
| PFC-218 | 64% | −48% | 157% | 41% |
| PFC-318 | 871% | −41% | 117% | 4% |
| PFC-31-10 | 84% | 108% | 172% | −31% |
| PFC-51-14 | 96% | 10% | 56% | 16% |
| SF6 | −2% | 24% | 3% | −8% |
| NF3 | 0% | −1% | 1576% | −6% |
| HFC-23 | 382% | 409% | 77% | −3% |
| HFC-32 | 176% | 4% | −5% | 1% |
| HFC-125 | 125% | 53% | 66% | 3% |
| HFC-134a | −34% | 10% | 15% | 2% |
| HFC-143a | −25% | 200% | 21% | 10% |
| HFC-152a | 1322% | 195% | 24% | −8% |
| HFC-227ea | 104% | 229% | 1306% | 5% |
| HFC-236fa | 98% | 7% | 10% | 31% |
| HFC-245fa | 81% | 3% | −4% | 1592% |
| HFC-365mfc | −17% | 144% | 43% | 470% |
Table 3.
Exposure limits, LC50 and GWP of each F-gas.
| Substance | CAS | Exposure Limits (ppm) a | LC50 (ppm/4H) b | Gwp 100-Year | References |
|---|---|---|---|---|---|
| PFC-14 | 75−73−0 | / c | 895,000 d | 6630 | [28,66] |
| PFC-116 | 76−16−4 | / c | 40,000 | 6630 | [28,66] |
| PFC-218 | 116−15−4 | / c | / | 8900 | [28,66] |
| PFC-318 | 76−19−7 | / c | 81 | 9540 | [66] |
| PFC-31-10 | 354−92−7 | / c | / | 9200 | [66] |
| PFC-51-14 | 354−96−1 | / c | / | 7910 | [66] |
| SF6 | 2551−62−4 | 1000 | >500,000 | 22,800 | [66,69] |
| NF3 | 7783–54–2 | 1000 | / c | 17,400 | [67] |
| HFC-23 | 75–46–7 | 1000 | 663,000 | 14,600 | [26] |
| HFC-32 | 75–10–5 | 1000 | 520,000 | 771 | [29] |
| HFC-125 | 354–33–6 | 1000 | 800,000 | 3740 | [29] |
| HFC-134a | 811–97–2 | 1000 | 500,000 | 1530 | [29] |
| HFC-143a | 420–46–2 | 1000 | 540,000 | 5810 | [29] |
| HFC-152a | 75–37–6 | 1000 | 383,000 | 124 | [29] |
| HFC-227ea | 431–89–0 | 1000 | 789,000 | 3600 | [26] |
| HFC-236fa | 690–39–1 | 1000 | 457,000 | 8690 | [26] |
| HFC-245fa | 460–73–1 | 300 | 200,000 | 962 | [29] |
| HFC-365mfc | 406–58–6 | 1000 | 100,000 | 914 | [26] |
a American Industrial Hygiene Association (AIHA) Workplace Environmental Exposure Limits (WEEL) based on an 8 h time-weighted average. b Lethal concentration at 50% mortality, rat. c No available data. d Value referred to 15 months.
Disclaimer/Publisher’s Note: The statements, opinions and data contained in all publications are solely those of the individual author(s) and contributor(s) and not of MDPI and/or the editor(s). MDPI and/or the editor(s) disclaim responsibility for any injury to people or property resulting from any ideas, methods, instructions or products referred to in the content. |
© 2023 by the authors. Licensee MDPI, Basel, Switzerland. This article is an open access article distributed under the terms and conditions of the Creative Commons Attribution (CC BY) license (https://creativecommons.org/licenses/by/4.0/).
Share and Cite
MDPI and ACS Style
Ma, T.; Wu, J.; Hu, D.; Ye, T.; Li, M.; Wang, T.; Zhang, Y.; Yuan, M. Atmospheric Observation of Fluorinated Greenhouse Gases around Four Chemical Plants in China. Atmosphere 2023, 14, 817. https://doi.org/10.3390/atmos14050817
AMA Style
Ma T, Wu J, Hu D, Ye T, Li M, Wang T, Zhang Y, Yuan M. Atmospheric Observation of Fluorinated Greenhouse Gases around Four Chemical Plants in China. Atmosphere. 2023; 14(5):817. https://doi.org/10.3390/atmos14050817
Chicago/Turabian StyleMa, Tengfei, Jing Wu, Dongmei Hu, Tong Ye, Mingzhu Li, Tong Wang, Yueling Zhang, and Mao Yuan. 2023. "Atmospheric Observation of Fluorinated Greenhouse Gases around Four Chemical Plants in China" Atmosphere 14, no. 5: 817. https://doi.org/10.3390/atmos14050817
Note that from the first issue of 2016, this journal uses article numbers instead of page numbers. See further details here.