Article

Analysis of the Applicability of Multisource Meteorological Precipitation Data in the Yunnan-Kweichow-Plateau Region at Multiple Scales

1
Faculty of Electric Power Engineering, Kunming University of Science and Technology, Kunming 650500, China
2
Key Laboratory of Water Ecology and Flow Structure Engineering, University of Yunnan, Kunming 650500, China
3
Department of Energy and Power Engineering, Kunming University of Science and Technology, Kunming 650093, China
*
Author to whom correspondence should be addressed.
Atmosphere 2023, 14(4), 701; https://doi.org/10.3390/atmos14040701
Submission received: 17 February 2023 / Revised: 2 April 2023 / Accepted: 3 April 2023 / Published: 10 April 2023
(This article belongs to the Section Meteorology)

Abstract

:
Multisource meteorological precipitation products are an important way to make up for a lack of observation sites or a lack of precipitation data in areas with a complex topography. They have important value for local industrial, agricultural, and ecological water use calculations, as well as for water resource evaluation and management. The Yunnan-Kweichow Plateau is located in southwest China and has a relatively backward economy and few meteorological stations. At the same time, the terrain is dominated by mountain valleys, precipitation is greatly affected by the terrain, and meteorological data are lacking, making the calculation of local water resources difficult. In this study, the applicability of the 3-hourly merged high-quality/IR estimates (3B42) of the Tropical Rainfall Measuring Mission (TRMM), China Meteorological Forcing Dataset (CMFD), and China Meteorological Assimilation Driving Datasets (CMADS) in the Yunnan-Kweichow Plateau was analyzed using multiple evaluation indicators of different temporal scales and precipitation intensity levels as well as the spatial distribution of the indicators based on measured daily precipitation data from 59 national meteorological basic stations in the study area in 2008–2018. The results showed that (1) the three products had performed well and could be applied to the calculation of local water resources with CMFD performing the best; (2) the performance of precipitation products was slightly worse on the daily scale, and the overall performance of the yearly, quarterly, and monthly scales was better; (3) good results were achieved in most regions, but there were also some regions with prominent overestimation and underestimation; (4) the three precipitation products had the highest probabilities of detection and the lowest false alarm rates for no rain and light rain, and the probability of detection gradually decreased with an increase in the precipitation intensity; and (5) the mean absolute error of precipitation products in rainy months is large, so the accuracy of products in the calculation of heavy rain and flood will be limited.

1. Introduction

Precipitation is a key driver of the hydrological cycle in the basin and an important source of river runoff [1]. Precipitation data are an important basis for the evaluation and management of water resources in river basins, and they have great value for the calculation of local ecological, industrial, agricultural, and domestic water use [2]. At present, station observations are the main source of precipitation data, but due to the temporal and spatial heterogeneity of precipitation, it is greatly affected by other meteorological elements and the underlying surface topography, which makes it difficult for the station data to fully reflect the spatial distribution of precipitation, especially in areas with complex terrain [3]. Satellite precipitation products and reanalysis data are important supplements to ground observation data, as they have the characteristics of a high spatiotemporal resolution, strong timeliness, and large coverage and are not limited by topography and geomorphology, which is of great value for the evaluation of local water resources, especially in areas lacking data. However, different precipitation products use different data sources and data fusion techniques, and their applicability to different regions is also different [4]. Therefore, the selection of suitable precipitation products for different study areas could effectively improve the accuracy of water resource assessment.
Satellite precipitation information collection is realized by remote sensing microwave or infrared sensors mounted on satellites, which can provide continuous precipitation information and has been widely used in hydrometeorology and other research fields [5]. Since the first meteorological satellite was launched in the United States in 1960, more than 30 satellite products have been applied worldwide for precipitation inversion and evaluation [6]. Among them, the more famous precipitation products are the satellite precipitation product GPCP [7], which was jointly released by GPCC, TRMM [8], and GPM [9] and jointly developed by NASA and JAXA. In addition, GSMAP [10] was jointly released by Japan and JAXA and CMORPH [11], CMAP [12] and PERSIANN-CDR [13] were jointly released by NOAA and USA, and MSWEP was published by NASA and the USA [14]. The reanalysis data are based on climate models and satellite remote sensing data sources [15]. At present, the most commonly used reanalysis data worldwide include ECMWF’s ERA-interim [16], NCEP’s CFSR [17], NASA’s MERRA [18], as well as JRA-25 [19] and JRA-55 [4] of JMA. In China, the National Meteorological Information Center developed CLDAS [20] to cover the Asian region, Tsinghua University also developed the Chinese regional high-resolution meteorological dataset CMFD [21], and Meng Xiangyong’s team created the Chinese atmospheric assimilation dataset CMADS [22].
Developed jointly by NASA and JAXA, TRMM is the first meteorological satellite to measure precipitation using multifrequency microwaves, visible far-infrared, and space rainfall radar, mainly to measure tropical and subtropical rainfall [23]. TRMM 3B42 is a precipitation product that is inverted by the TRMM satellite in conjunction with other satellites. TRMM precipitation datasets are widely used worldwide. Many regions in China and abroad have examined and analyzed the TRMM precipitation dataset. For example, Fwyera et al. [24] found that TRMM 3B42 and CMORPH detect precipitation better than PERSIANN in complex terrain. Veronique Michot et al. [25] evaluated the accuracy of TRMM 3B42 data on daily precipitation in the Amazon basin and concluded that the data estimated by TRMM 3B42 for daily precipitation are in good agreement with the rain gauge. Sambou et al. [26] verified the TRMM 3B42 data by using statistical indicators in the Kayanga/Geba River Basin of Africa and obtained results showing CC = 0.92–0.96 and an NSE of close to 1. Yang et al. [27] evaluated the performance of daily precipitation data produced by CMORPH and TRMM in Thailand and concluded that TRMM-3B42 V7 is superior to CMORPH. Zhaoli Wang et al. [28] found that TRMM 3B42 products can act as precipitation sources in areas lacking data in the Pearl River Basin. Linfei Yu et al. [29] found that TRMM 3B42 data were closer to the actual precipitation value than CMORPH and GPM IMERG data on different time scales in the Taihang Mountains. Junzhi Liu et al. [30] used station data and two versions of TRMM 3B42 precipitation products (V6/V7) in the sub-basin of the Meichuan River to carry out an accuracy evaluation at multiple spatiotemporal scales and concluded that precipitation was slightly overestimated by the two versions of precipitation products, and the accuracy of TRMM 3B42 precipitation products was high on both monthly and annual scales. Leilei Zhang et al. [31] found that the accuracy of TRMM 3B42 in the source area of the yellow river was higher than that of CMORPH and PERSIANN. In the Yunnan-Kweichow Plateau, TRMM 3B42 data have also been used in research. Yifan Hu et al. [32] compared the precipitation detection capabilities of CMORPH-BLD, PERSIANN-CDR, and TRMM-3B42 data in southwest China, and found that, except for in Chongqing, the precipitation estimation ability of the three precipitation products in southwest China was high. In summary, TRMM 3B42 has been tested and applied in many regions in China and abroad, and the data applicability effect is good.
CMFD is a set of near-ground meteorological and environmental element reanalysis datasets that were researched and developed by the Institute of Tibetan Plateau of the Chinese Academy of Sciences. The dataset was formed by using the existing Princeton reanalysis data, GLDAS data, GEWEX-SRB radiation data, and TRMM precipitation data as the background fields, and integrating conventional meteorological observation data of the China Meteorological Administration [33]. CMFD was tested in the Yalong River Basin [34], Shule River [35], Xinjiang [36], Yangtze River Basin [37], and other regions of China, and its precipitation accuracy is high. Yu Li et al. [38] and Ren [39] used CMFD reanalysis data and other satellite precipitation data to evaluate the extreme precipitation capturing ability and precipitation performance in Beijing and concluded that CMFD performed better when the daily precipitation was >50 mm. On a daily/yearly scale, CMFD outperforms other data, having a high correlation coefficient and a lower RMSE. The researchers found that CMFD has a strong ability to capture extreme precipitation on the Tibetan Plateau [40] and has a higher precipitation accuracy than CHIRPS, ERA5 Land, and PERSIANN-CCS-CDR [41,42]. In summary, CMFD has good applicability in many regions in China, and this topic will be considered to further study the applicability of CMFD data in the Yunnan-Kweichow Plateau.
CMADS is a meteorological precipitation product that was jointly developed by the China Institute of Water Resources and Hydropower Research, the China Meteorological Administration, and the Institute of Cold Region Environment and Engineering of the Chinese Academy of Sciences, which is composed of the fusion of multiple satellites and ground-measured precipitation data and has been widely studied and applied in recent years. Thom Thi Vu et al. [43] evaluated the accuracy of precipitation products, such as TRMM 3B42, PERSIANN, PERSIANN-CDR, and CMADS, in the Han River Basin of South Korea and found that TRMM 3B42 and CMADS contained more accurate rainfall data. Duy Minh Dao et al. [44] compared CMADS and CFSR with ground weather data from the Cau River Basin in northern Vietnam and found that CMADS products performed better. Yongyu Song et al. [45] used TRMM, CMADS, and IMERG data for hydrological modeling and predictive analysis in the Qujiang River Basin, and the results showed that CMADS had a stronger ability to detect precipitation events. Qiang Wang et al. [46] used measured data to evaluate ability of CAMDS, TRMM 3B42, and 3B42RT to measure precipitation data in the Ganjiang River Basin based on different time scales, and the results showed that CMADS had the best precipitation estimation ability on daily and monthly scales, while TRMM 3B42 performed better on the annual scale. Limin et al. [47] compared the observation data with CMADS and CFSR precipitation products in Northeast China and concluded that the precipitation data produced by CMADS were in good agreement with the meteorological observation data. In summary, CMADS has been studied and applied in many regions of China and abroad, and its application effect is good, According to the literature research, CMFD, TRMM 3B42, and CMADS all perform well in the southwest regions. This paper will further study its applicability in the Yunnan-Kweichow Plateau.
It is crucial to conduct local hydrometeorological research to preserve ecological diversity and fulfill the dual carbon goal, because the Yunnan-Kweichow Plateau is the ecological core region of southwest China. It is rich in biodiversity but is also constrained by water and soil conditions, a fragile ecological environment, and a heavy reliance on water resources. The western region is developing more quickly as a result of the state’s concentration on its development and ongoing construction projects related to infrastructure and transportation. In order to reduce the conflict between the water demands of ecological systems and human development and to plan the scale of local human activities with water determination, the research results of the hydrological water resource evaluation and prediction can be used to support local development planning and design [48]. The Yunnan-Kweichow Plateau, on the other hand, is located in southwest China and has underdeveloped economic conditions and comparatively few hydrometeorological observation stations. At the same time, the terrain is complicated with high mountains, deep valleys, and a great fluctuation in the distribution of precipitation, which make hydrometeorological data more scarce and poses significant challenges to the local water resource research and evaluation [3]. Multisource meteorological precipitation data can be used to handle this problem as a complement to the observed precipitation data. There are numerous multisource meteorological precipitation packages available right now, and each one has varying regional applicability. This paper conducts research on the applicability of TRMM 3B42, CMFD, and CMADS in the Yunnan-Kweichow Plateau and compares the accuracy and applicability from temporal and spatial scales and various rainfall intensity grading angles and analyzes its applicability characteristics in the Yunnan-Kweichow Plateau as a supplement to local observation station data to support management and research.

2. Study Area and Data Sources
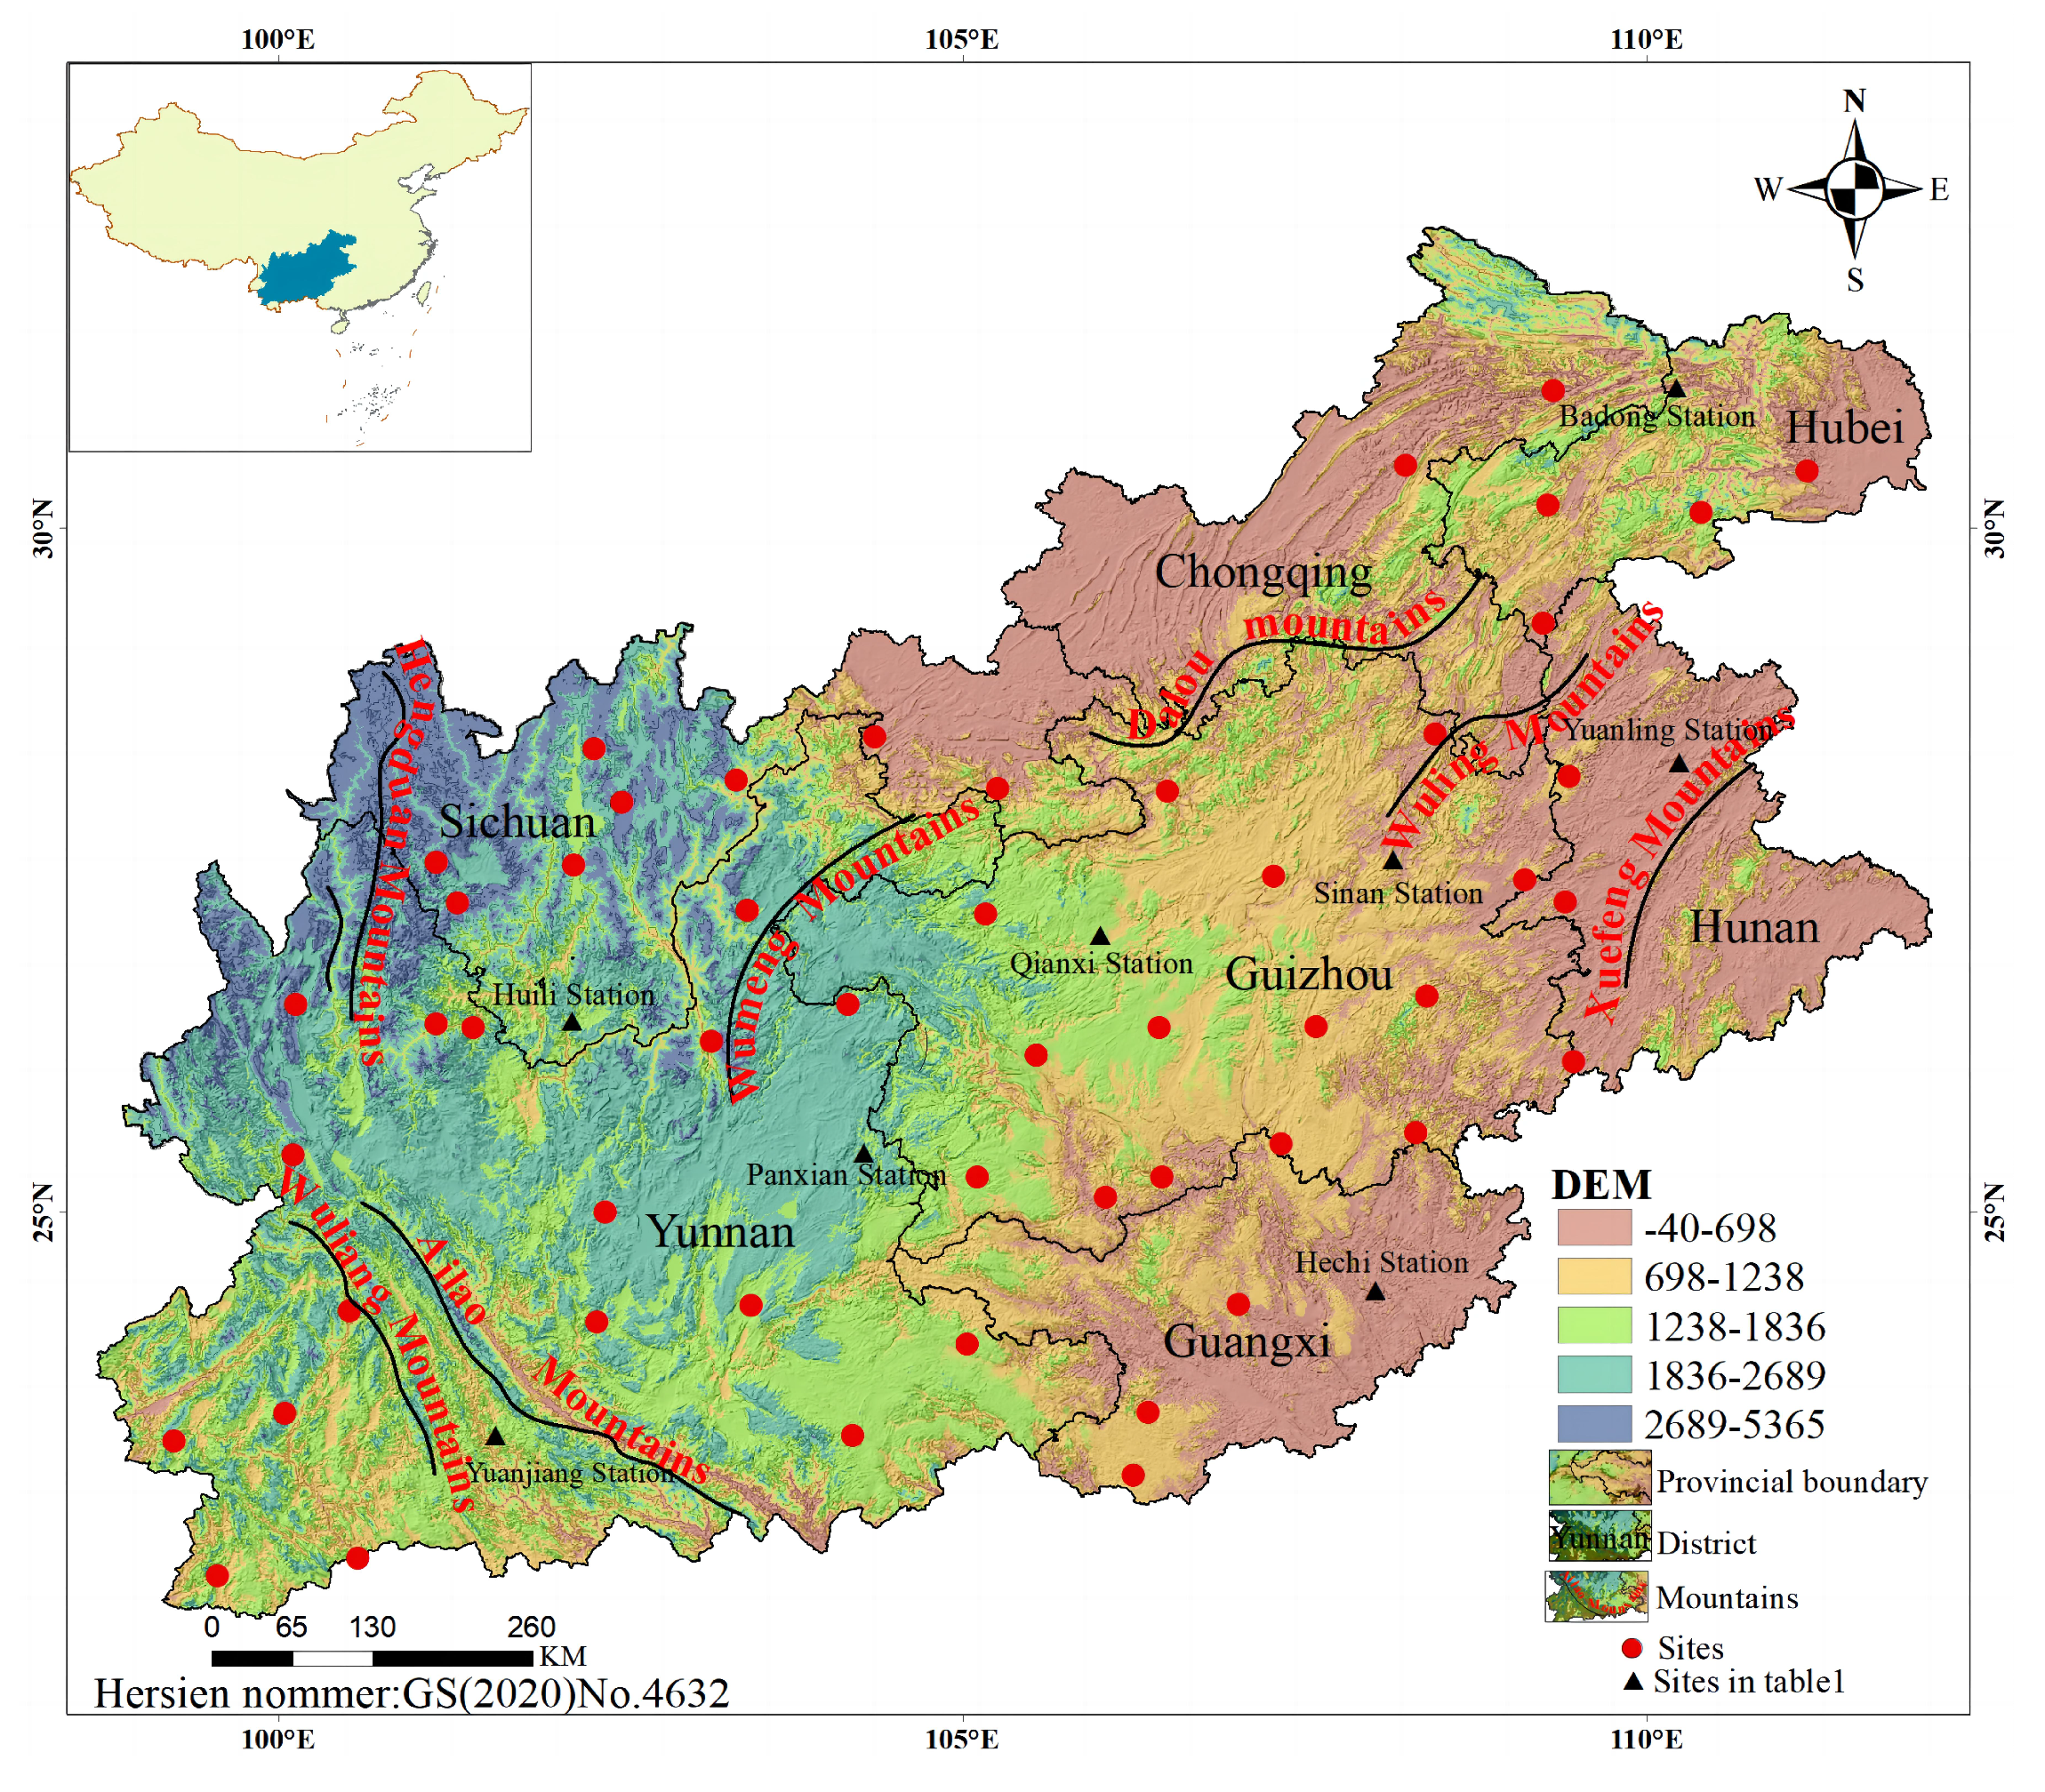
2.1. Study Area

The Yunnan-Kweichow Plateau area is located in southwest China, roughly between 100–111° E and 22–30° N. The main body includes Yunnan and Guizhou as well as parts of Sichuan, Chongqing, Guangxi, Hunan, Hubei, and other places (Figure 1). It is located at the intersection of two sets of mountain ranges in China’s north–south direction and northeast–southwest trend, and is one of the four major plateaus in China. The geographical conditions in the Yunnan-Kweichow Plateau region are intricate and complex, making it one of the most complex regions in China in terms of its topography and geomorphology. The Yunnan-Kweichow Plateau area has more mountains, the terrain is very rugged, the overall terrain is high in the northwest and low in the southeast, the altitude is −40–5365 m, and the altitude difference is relatively large [49]. The Yunnan-Kweichow Plateau has a subtropical monsoon climate, and the climate varies significantly with altitude and atmospheric circulation conditions. The annual average temperature is 5–24 °C, and the average annual precipitation is 600–2000 mm. Table 1 shows the average annual precipitation of eight weather stations in different provinces in the study area. By combining Figure 1 and Table 1, it is found that the spatial distribution of the stations in the Yunnan-Kweichow Plateau is very uneven, and the distribution of precipitation in time and space is extremely unbalanced, whereby the amount of precipitation in the eastern, western, and southern areas is large, while that in the central and northern areas is small.

2.2. Data Source and Preprocessing

2.2.1. Site Precipitation Data

The precipitation measurement data presented in this paper come from the daily data set (V3.0) of China’s surface climate data from the China Meteorological Data Network (http://data.cma.cn/ (accessed on 1 April 2022)), which includes 699 national benchmarks on the ground in China and meteorological data from 1951 to the present. It has undergone strict and effective quality control, and the data are complete and reliable.

2.2.2. Multisource Meteorological Precipitation Data

The three precipitation products used in this paper are TRMM 3B42 V7, CMFD, and CMADS V1.2. In this study, the daily scale precipitation data for three precipitation products from 2008–2018 were selected, and the spatial resolution was unified to 0.125° × 0.125° by bilinear interpolation. The data from three meteorological precipitation products were mainly derived from online resources, as shown in Table 2.

2.2.3. Data Preprocessing

The applicability analysis of three precipitation products requires data preprocessing, including the following:
(1) In order to compare the precipitation data from the three products with the site data, it is necessary to obtain the precipitation values of the three products at the site location, among which the site precipitation values of the CMFD and TRMM 3B42 meteorological products were obtained by kriging interpolation [50], and the measured site precipitation of CMADS was obtained by interpolation with the nearest neighborhood method [51].
(2) When analyzing different time scales, the precipitation data of the study area were calculated by the Spatial Arithmetic Average Method of each station.
(3) In the spatial scale analysis, the spatial distribution of the study area of the deviation value of precipitation products was obtained by the Inverse Distance Interpolation [52] of the station data.

3. Methods

In this study, the continuous statistical index and the precipitation performance detection index were used to evaluate the accuracy of precipitation and the ability to capture precipitation occurrence events, and the probability density function (PDF) was used to express the frequency of precipitation events under different precipitation intensities during the study period.
(1) Continuous statistical indicators
These include the correlation coefficient (CC), relative bias (RBIAS), mean absolute error (MAE), and Kling–Gupta efficiency (KGE) (see Table 3). Among them, CC reflects the linear correlation between the precipitation data and measured data; and RBIAS, MAE, and KGE are used to describe the relative bias, the error, and the overall goodness-of-fit between the precipitation data and measured data, respectively.
(2) Precipitation performance detection indicators
These include the probability of detection (POD), the false alarm rate (FAR), the critical success index (CSI), and the frequency bias (FBIAS) (see Table 3). POD reflects the ability of precipitation products to accurately capture measured precipitation events; FAR reflects the false alarm rate of precipitation products in predicting precipitation events; CSI comprehensively reflects the accurate capture and false alarm of precipitation data, representing the ability of precipitation data to truly detect measured precipitation events; and FBIAS answers the question of how the precipitation frequency detected by the products compares to that recorded by the station.
When calculating the precipitation performance detection indexes, according to the precipitation intensity classification standard, the precipitation intensity thresholds of light rain, moderate rain, heavy rain and storm rain were set to 0.1 mm/d, 10 mm/d, 25 mm/d, and 50 mm/d, respectively [53], and the critical threshold for the occurrence of precipitation events was set to 0.1 mm/d. For each precipitation intensity, the precipitation event detection results included four scenarios, as shown in Table 4. H represents the number of times that a precipitation product and station detect a precipitation event of a certain intensity at the same time, M indicates the number of times that a precipitation product does not detect a precipitation event but the station records it, and F indicates the number of times that a precipitation product detects a precipitation event but the station does not record it. C indicates the number of times that there is neither precipitation nor a precipitation event recorded by the station.

4. Results and Analysis

4.1. Timescale Analysis
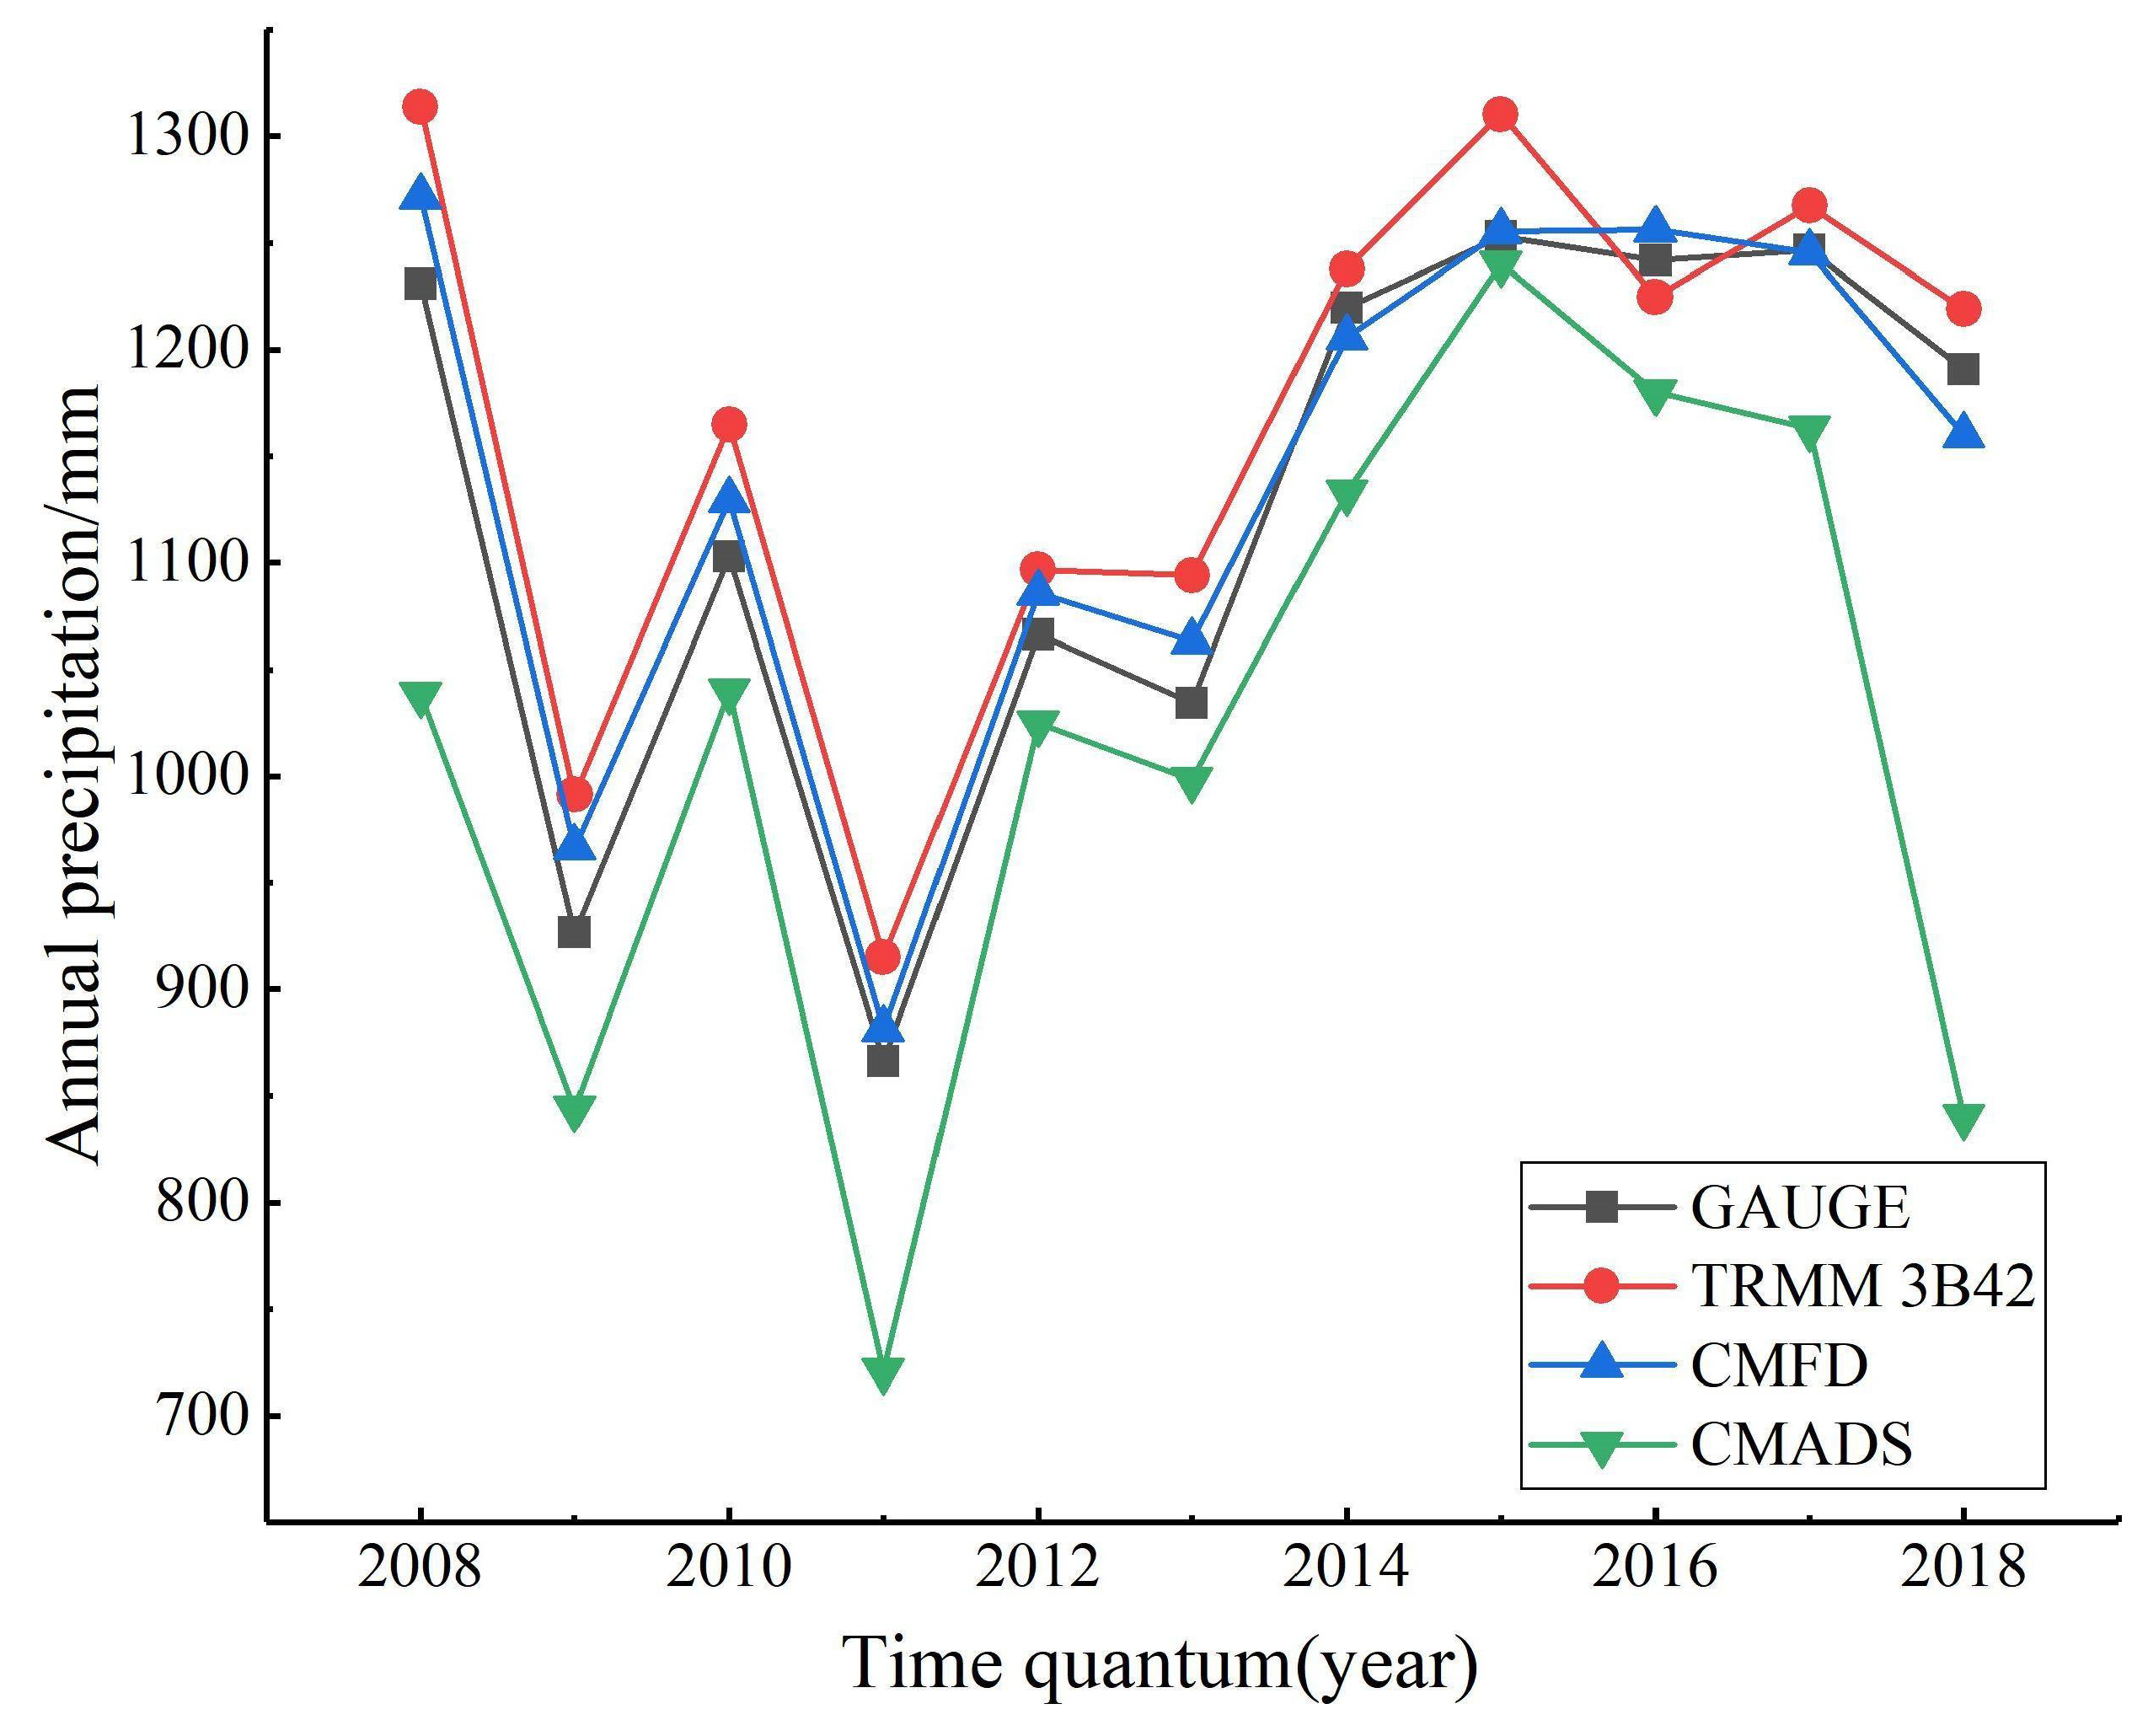
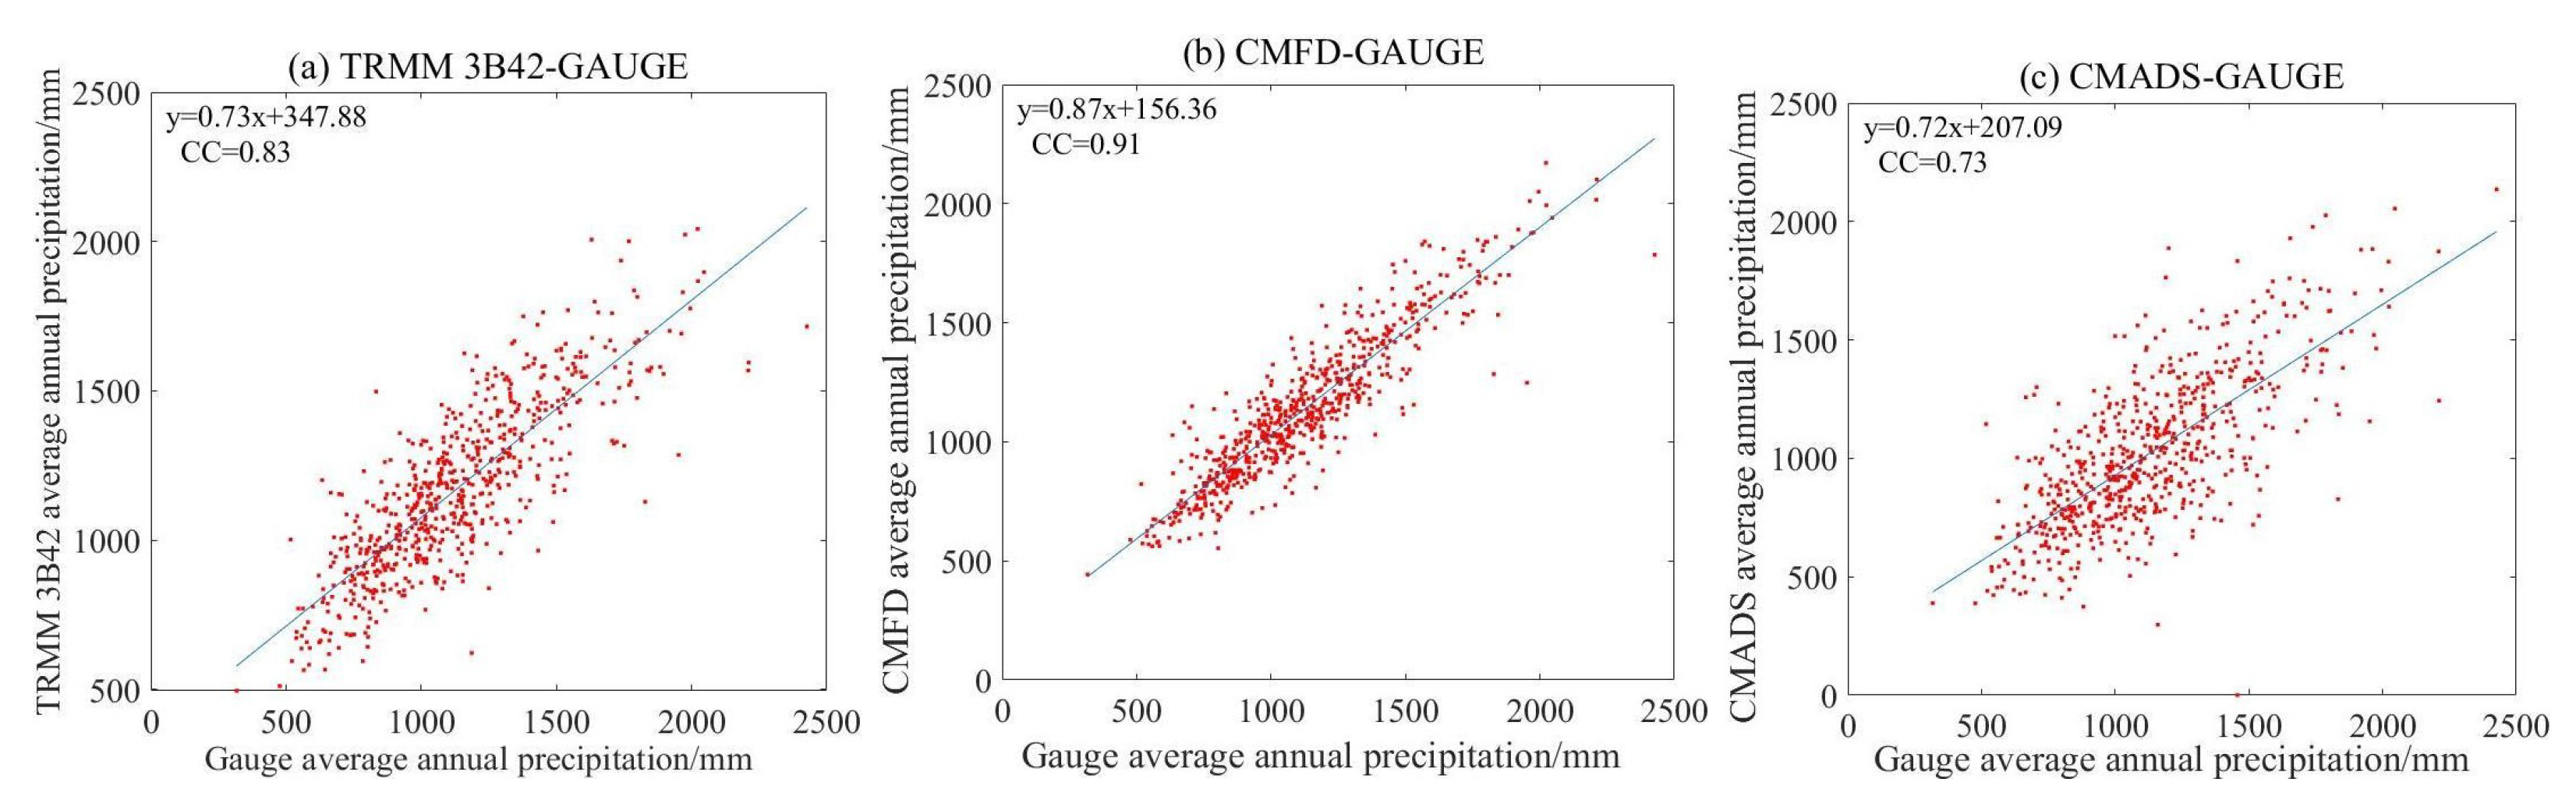
4.1.1. Annual Scale

In this paper, the annual rainfall of 59 selected stations in 2008–2018 was spatially calculated by kriging interpolation for CMFD and TRMM 3B42 and by the nearest neighborhood method for CMADS to determine the annual precipitation over the study area. In this paper, the annual rainfall at 59 selected stations in 2008–2018 is spatially calculated to determine the annual precipitation over the study area, as shown in Figure 2. It can be seen that the annual precipitation changed greatly in 2008–2014, and was relatively stable in 2015–2018. The CMFD and TRMM 3B42 products produced data that were consistent with the changing trend of the site precipitation data, the fit was good, and the annual precipitation deviation in each year was small, but the overall precipitation was overestimated. CMADS produced data that were consistent with the changing trend of site precipitation before 2017, but the degree of underestimation was large, especially in 2018 (annual precipitation of only 840.26 mm). On the whole, the data produced by CMADS were slightly worse, but the annual precipitation performance of the three products was better, among which CMFD products performed the best on the annual scale.
The annual precipitation scatter plots of 59 stations (649 values) corresponding to precipitation products (Figure 3a–c) were produced, and the CC values of the three products are 0.83, 0.91, and 0.73, respectively. The significance test met the requirement of p < 0.01. The comprehensive analysis, CMFD data, and measured data had the best correlations on the annual scale, followed by TRMM 3B42, and CMADS had the lowest correlation.
The correlation analysis can better reflect the overall consistency of precipitation products and measured precipitation, but it cannot reflect the error size [54]. For this reason, the RBIAS, MAE, and KGE evaluation indexes were introduced to analyze the precipitation error, as shown in Table 5 (the optimal values are presented in bold). From the three indicators shown in Table 5, the annual precipitation performance of the three products was found to be good, among which CMFD performed the best. CMFD, TRMM 3B42, and CMADS had RBIAS values of 1.14%, 3.90%, and –9.34%, respectively, and KGE values of 0.90, 0.77, and 0.70, respectively. The RBIAS values of the three products did not exceed 10%, and the KGE values reached more than 0.70, but the overall CMFD performde better, and several other indicators showed similar results. In addition, TRMM 3B42 and CMFD both had an RBIAS of greater than 0, while CMADS had an RBIAS of less than 0, indicating that the former two products overestimated the annual precipitation as a whole, and the latter underestimated the annual precipitation, but the CMFD produced the least overestimation.
This shows that on the annual scale, except for the slightly greater underestimation of CMADS, the annual precipitation performance of the three precipitation products at each site was good, with small deviations and good correlations from the site data. Thus, it can be used for the assessment of local annual water resources. Overall, CMFD products were found to be the most accurate for estimating annual precipitation at each site in the study area.

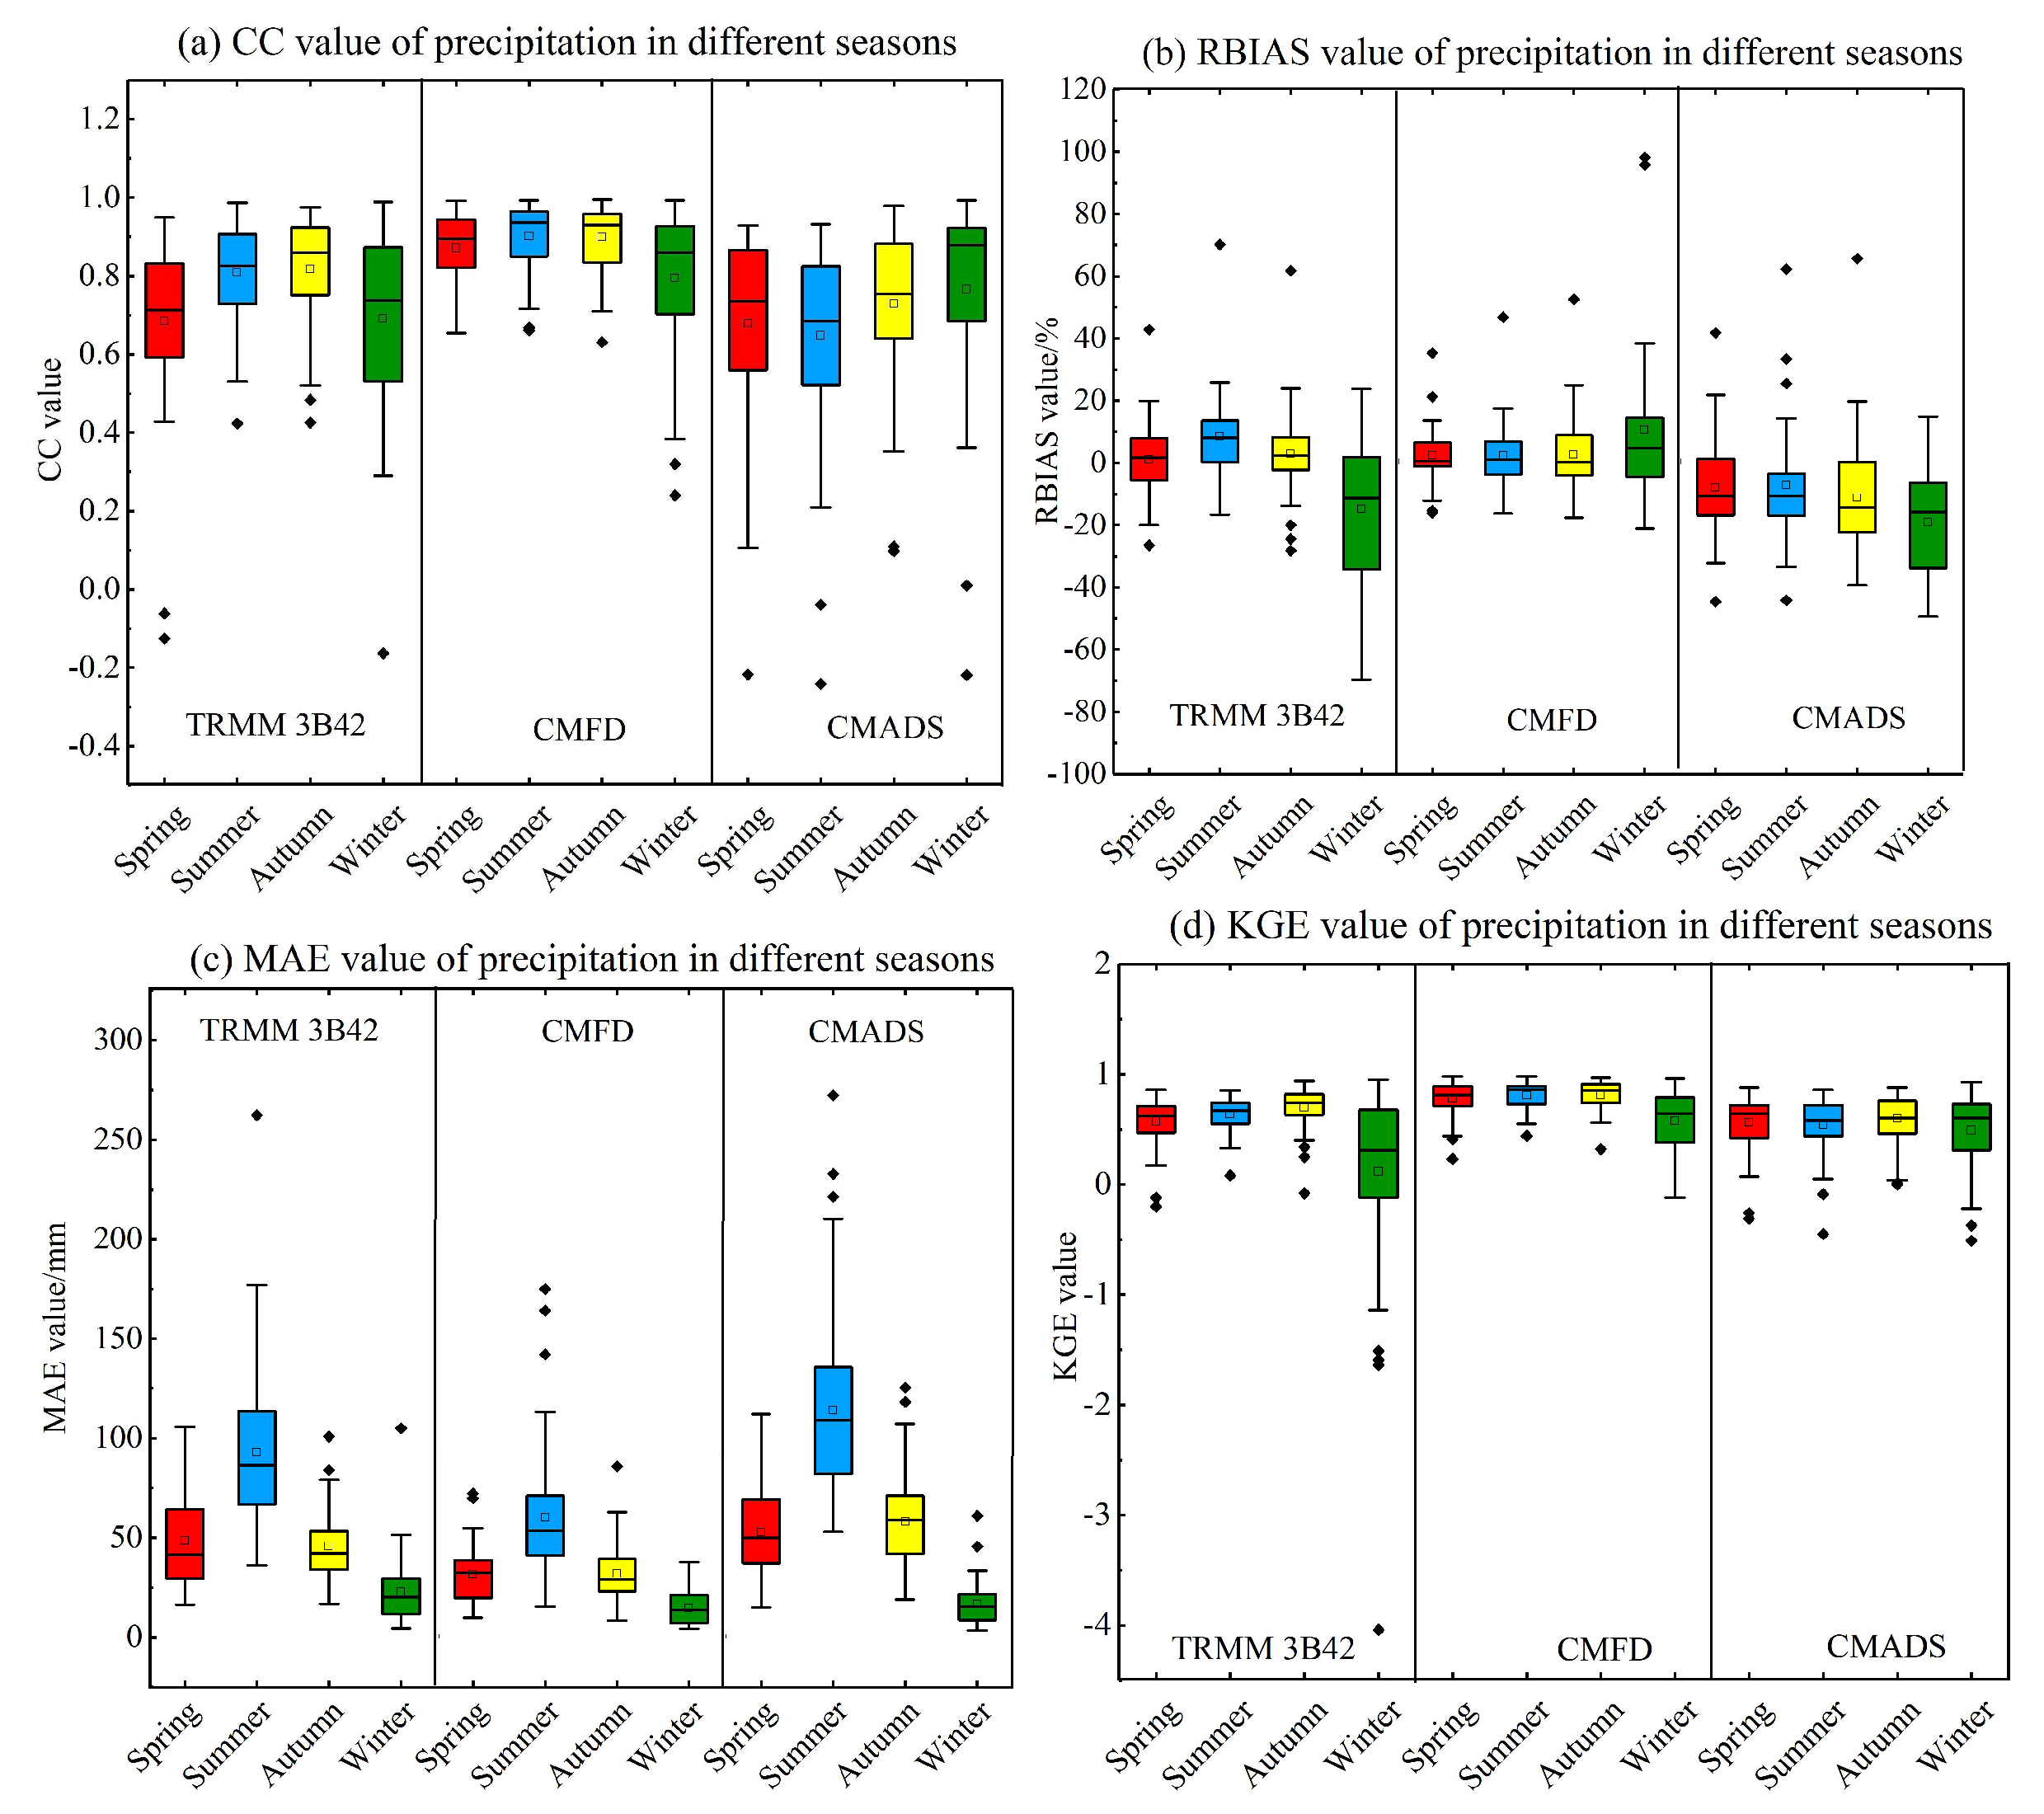
4.1.2. Seasonal Scale

The seasonal precipitation in the Yunnan-Kweichow Plateau varies greatly. According to the characteristics of the dry and wet seasons in the study area, March–May, June–August, September–November, and December–February were divided into spring, summer, autumn, and winter. In addition, the seasonal precipitation of the products from 2008 to 2018 at each site location was calculated by the spatial interpolation method introduced in Section 2.2.3 and the temporal arithmetic method. The seasonal precipitation of the measured data and the products from 2008 to 2018 at each site location were calculated, and the product seasonal evaluation indexes in each station were counted separately to make the box graphs (Figure 4). From the perspective of the CC, the overall correlation degree of the three products was good, the winter CC of TRMM 3B42 had the lowest lower quartile, which was also above 0.5, and the summer CC of CMADS had the lowest median, which was around 0.7. The CC values for the four seasons measured by CMFD were the best, with median values higher than 0.9 for the seasons except for winter, for which it was 0.85-0.9. The lower quartile values were above 0.8 for all seasons except for winter, when it was 0.7. Secondly, the median CC value of TRMM 3B42 for the four seasons were above 0.65. It was slightly lower but close to 0.7 in spring and winter, and the median box plot of CMADS was between 0.7 and 0.9, except for in summer. From the perspective of seasonal CC, TRMM 3B42 and CMFD had higher correlations in summer and autumn and slightly worse correlations in winter and spring, but the results of CMADS were the opposite and the overall correlation was better.
The RBIAS shows that the deviation of three products was small, with the median of close to 0 and a relatively convergent distribution, among which CMFD performed the best. The deviation of CMFD in each season was the smallest, but there was a slight overestimation, and the deviation and dispersion degree were slightly higher in winter. Secondly, TRMM 3B42 overestimated values in spring, summer, and autumn but underestimated values and was the most discrete in winter. CMADS produced obvious underestimations in all four seasons, but the degree of dispersion among the four seasons was uniform.
The performance of the MAE indicator was basically consistent with that of RBIAS, and CMFD showed the smallest deviations and the smallest degree of discreteness for the four seasons. Of the four seasons, the MAE in summer was the largest, which is related to the largest total precipitation occurring in summer. From the perspective of KGE, CMFD had the highest efficiency in each season and its performance was slightly worse in the winter.
Based on the above index analysis, the performance of the three products in the four seasons was good, with CMFD performing the best in all four seasons. Among the four seasons, summer and autumn had the highest CC values and the best KGE values, and winter and spring had slightly worse values due to their smaller rainfall totals. In terms of the RBIAS, the difference between seasons was not obvious, while the MAE was the largest in summer and the smallest in winter, which may be related to the greater amount of rainfall in summer. Based on these results, the three products can be used for local water resource evaluations in all four seasons.

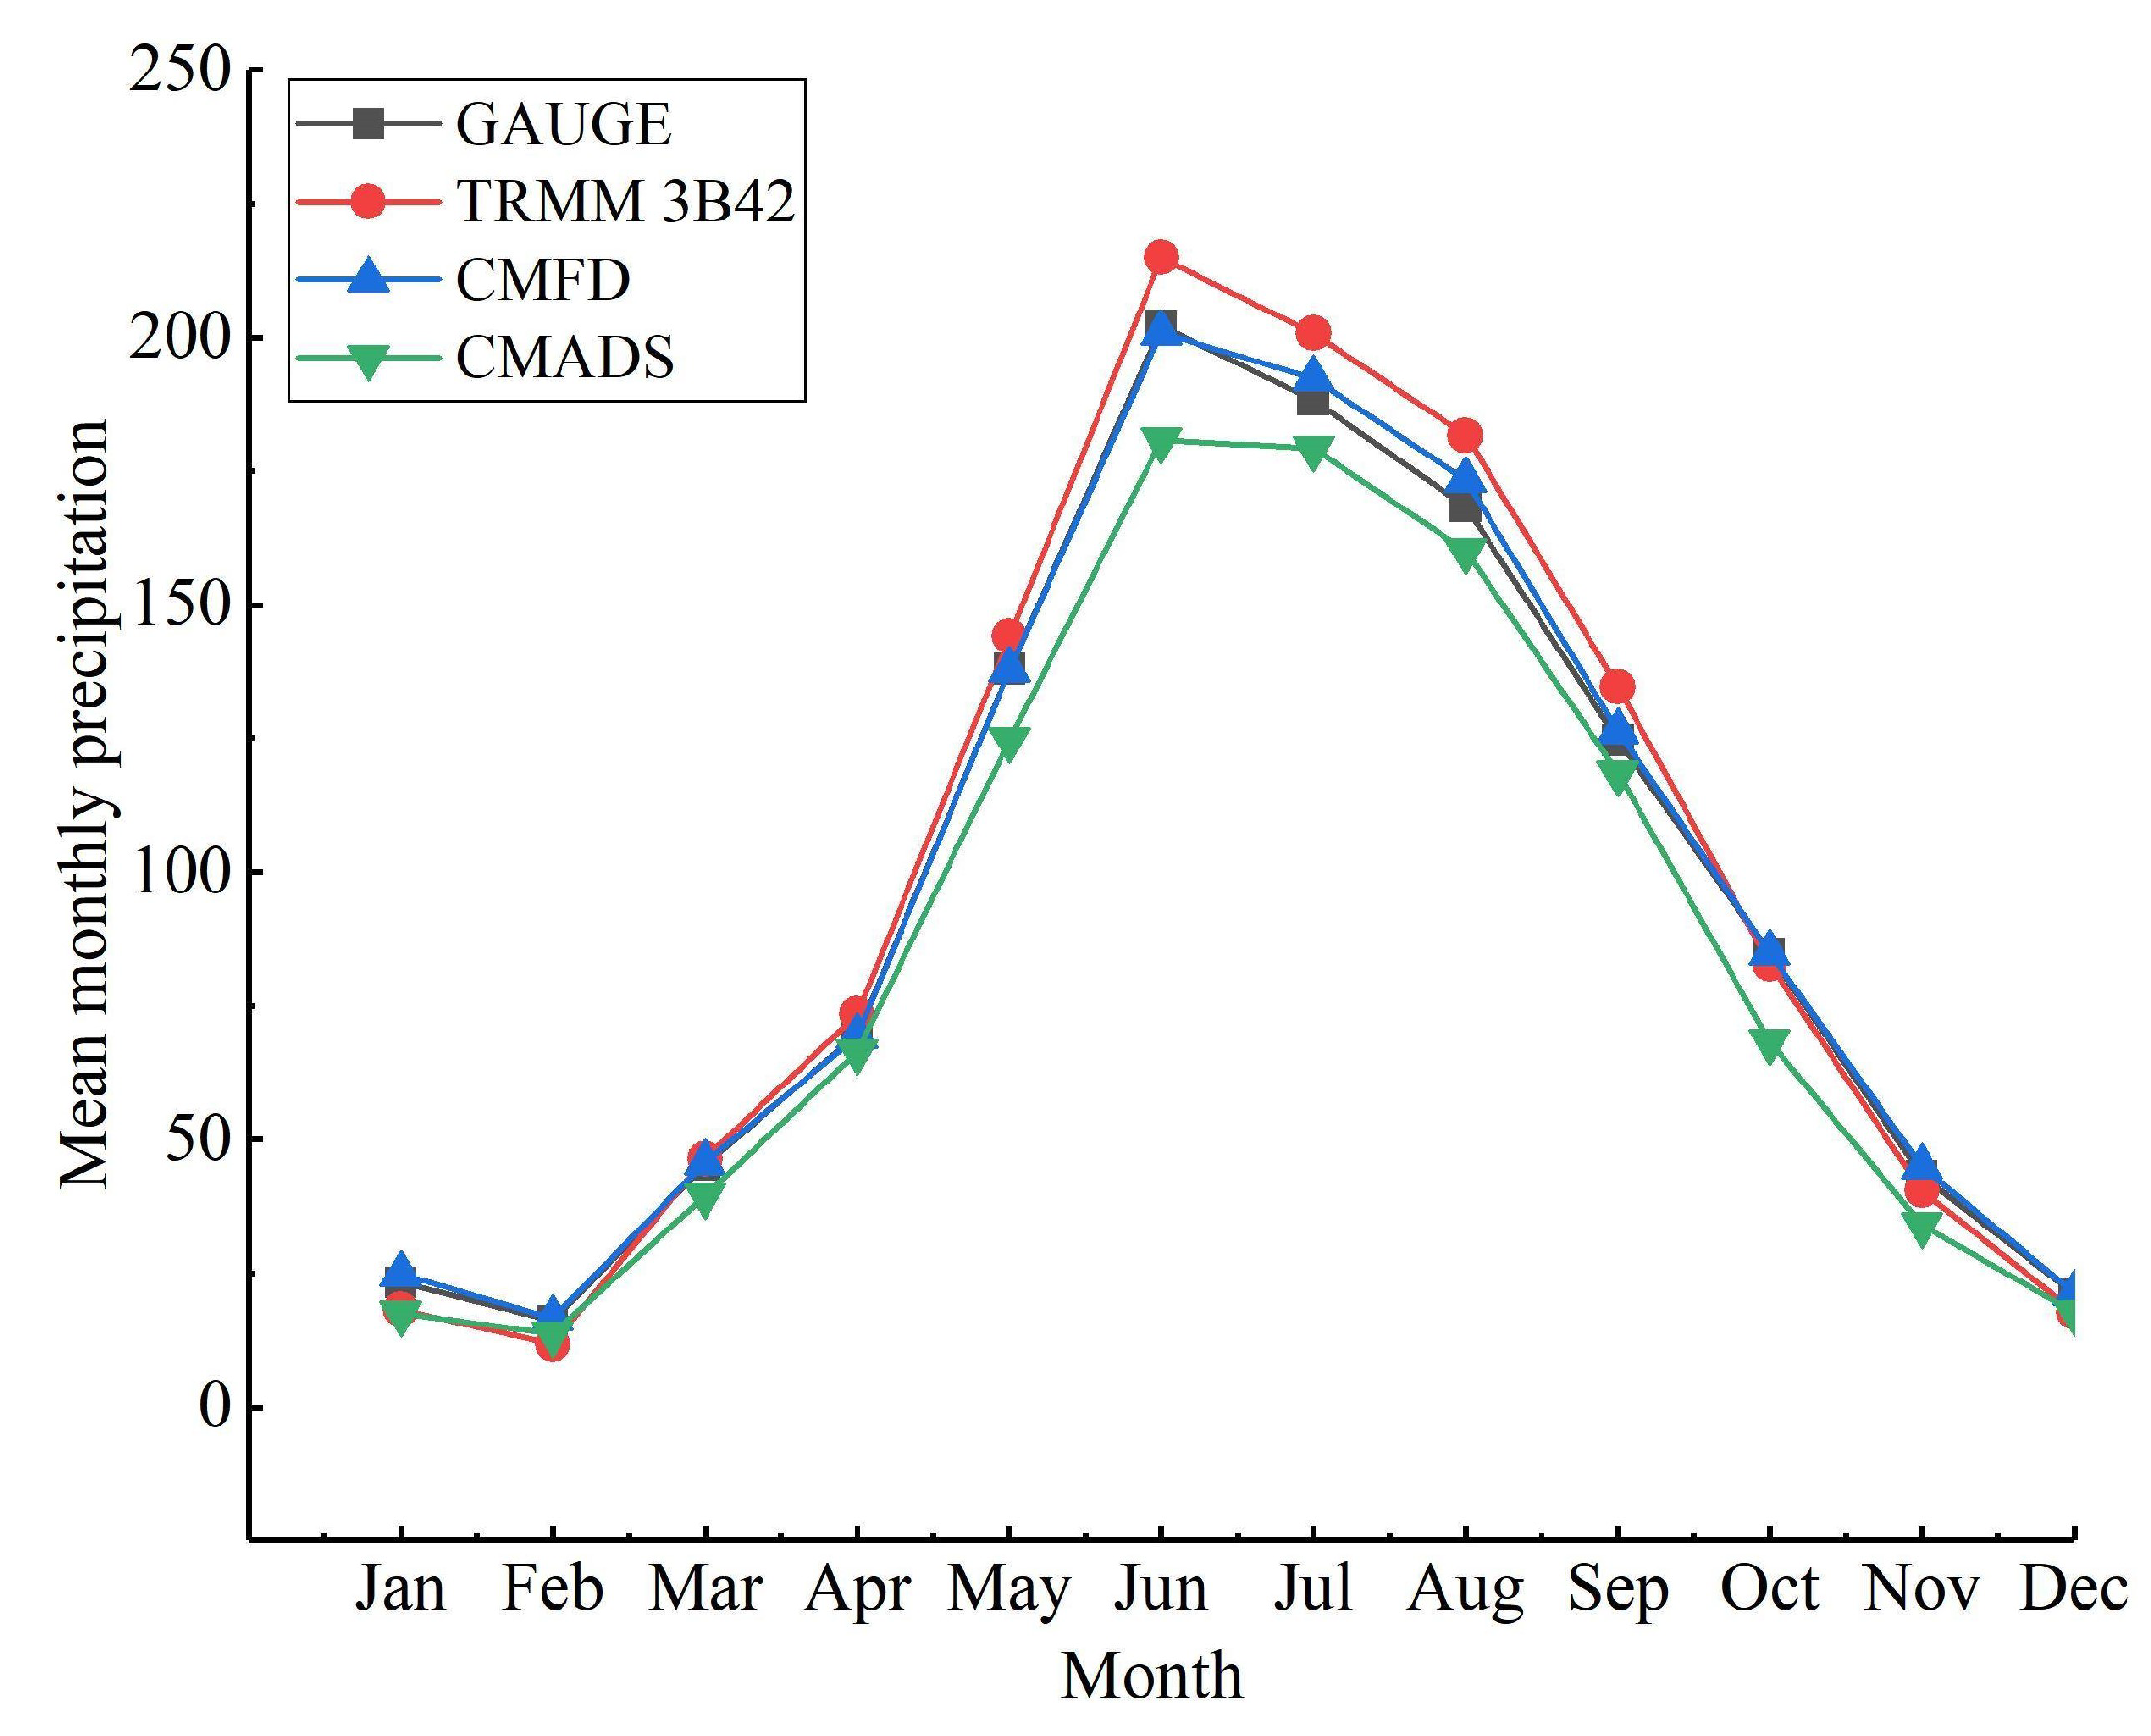
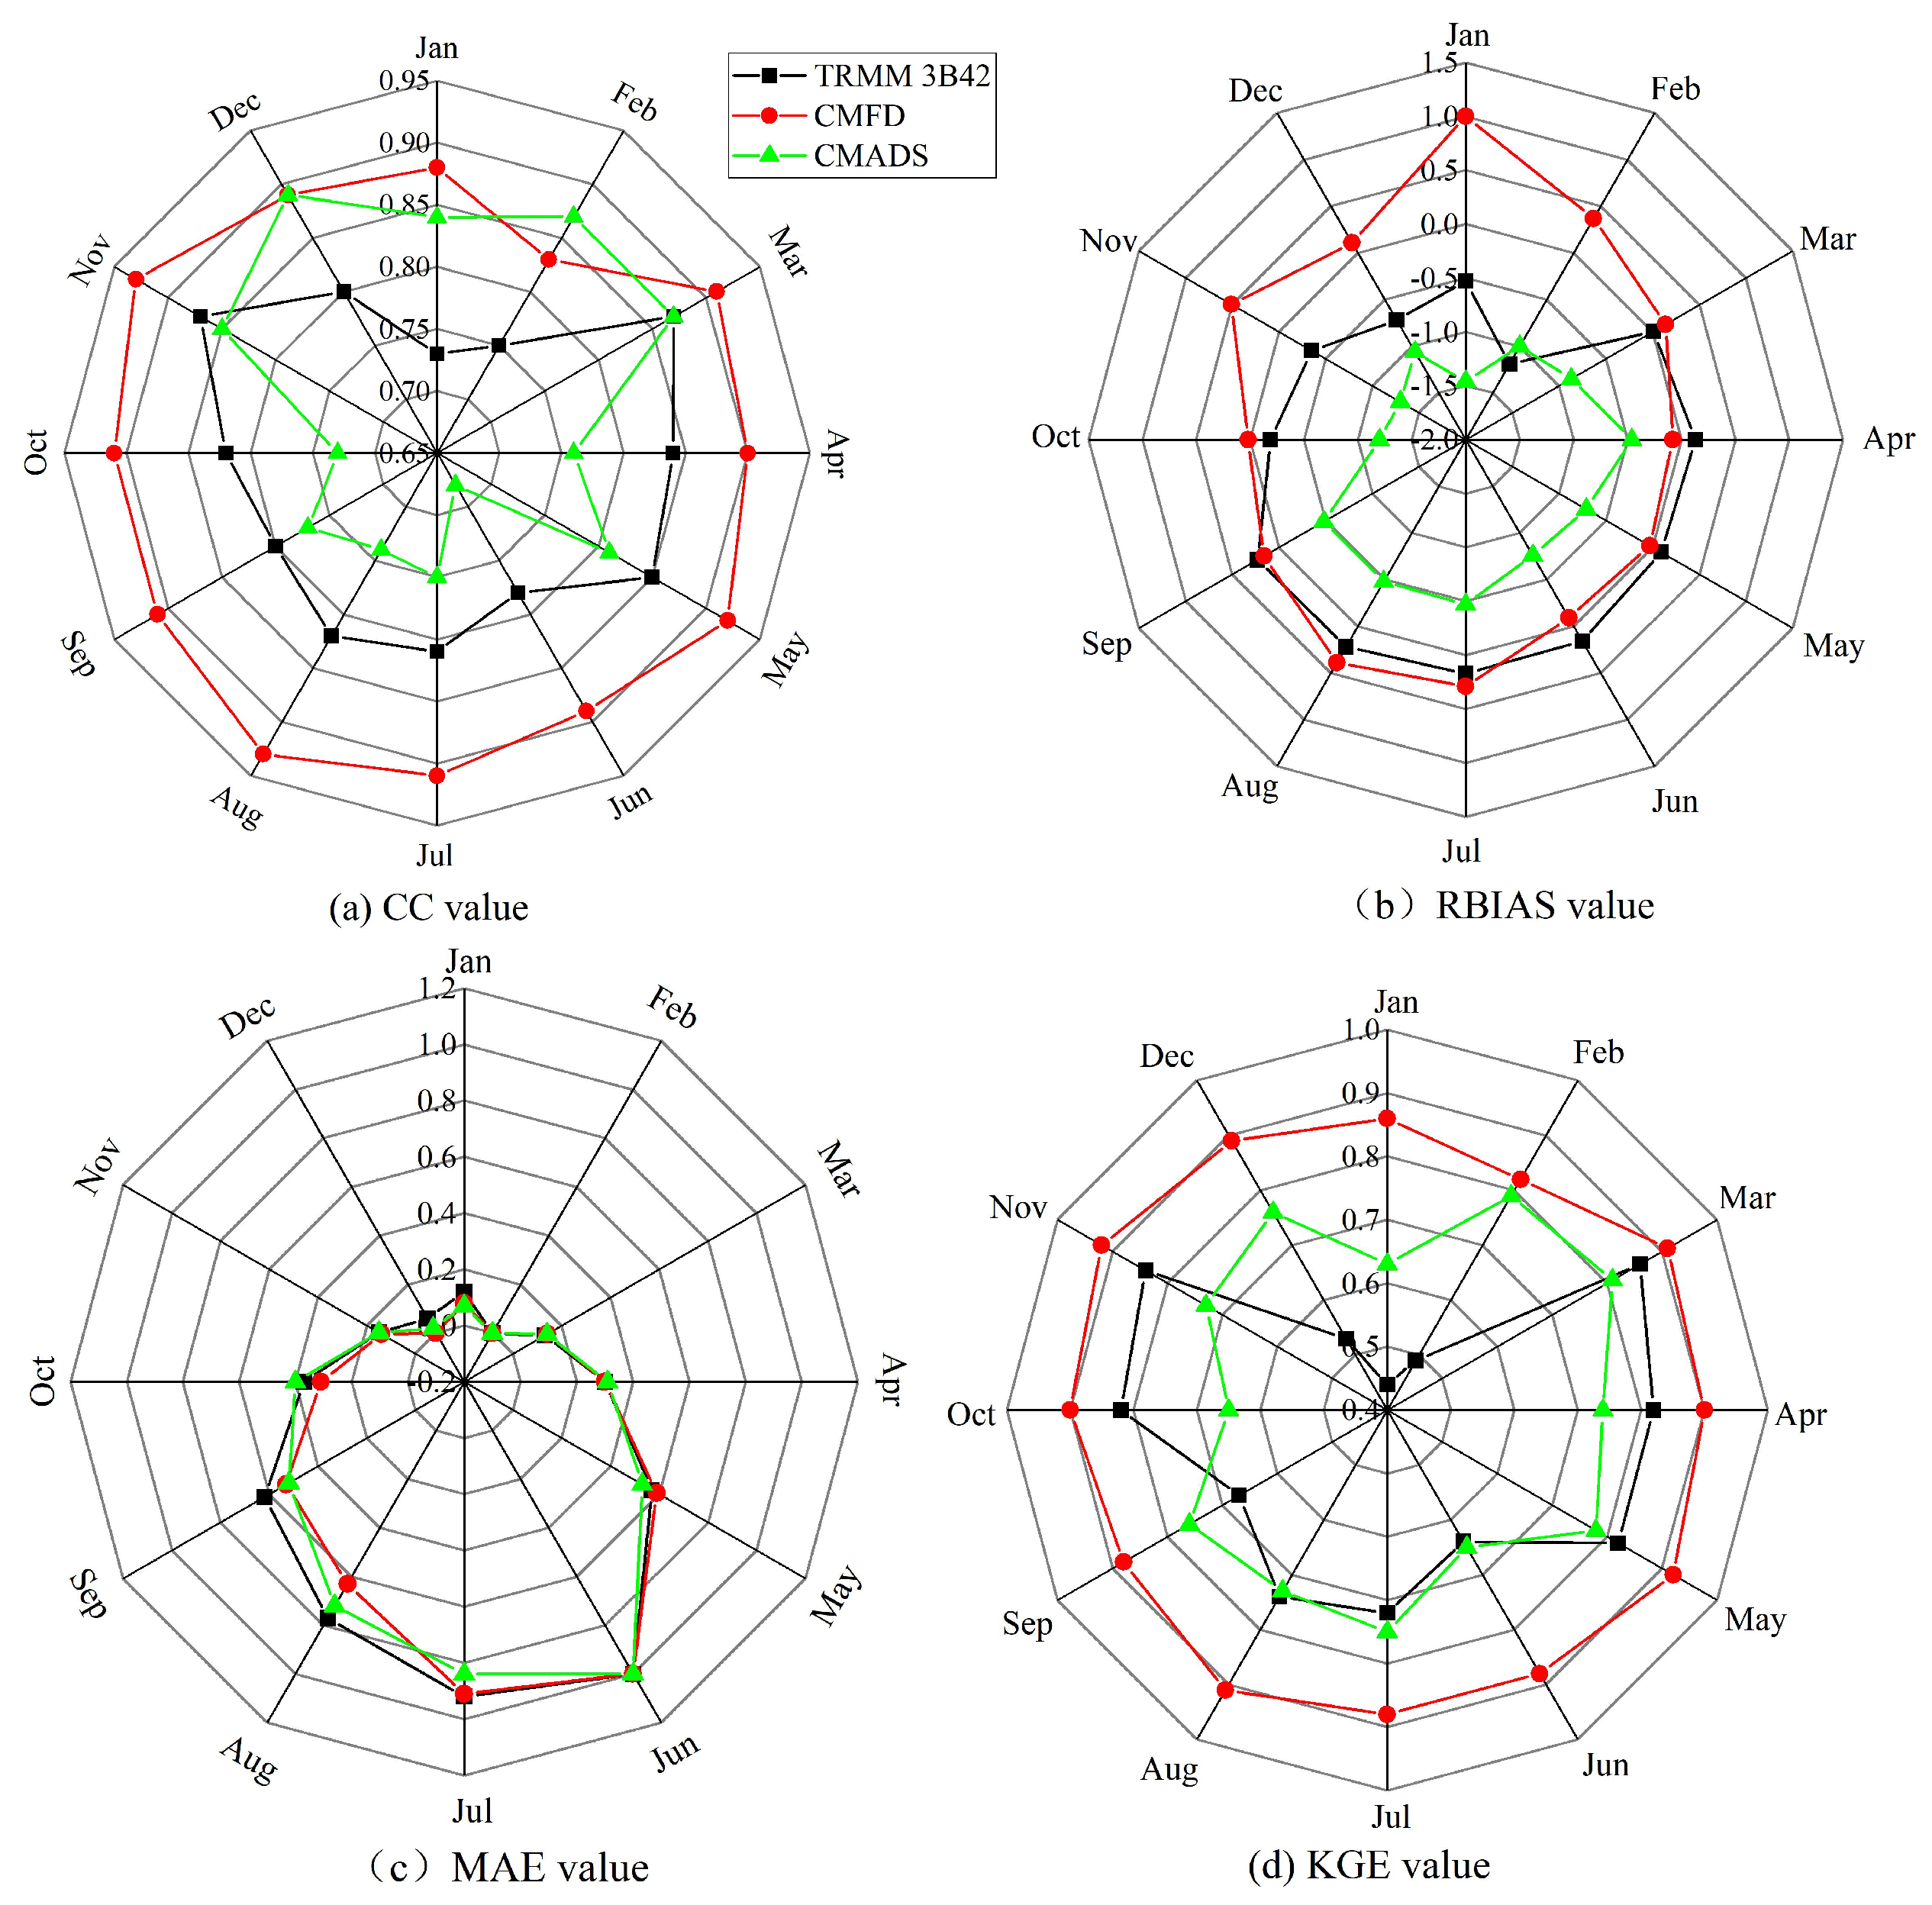
4.1.3. Monthly Scale

The average monthly precipitation in the study area during 2008–2018 was calculated by the spatial arithmetic method for the site data and products. Figure 5 shows the monthly average precipitation process in the study area for the measured data and for each product. It can be seen that the four lines are basically the same, among which CMFD is shown to have the strongest ability to estimate precipitation and fits better with the station data, and the other two products have a slight deviations from the precipitation process line of the measured data.
The monthly precipitation series of the products in the site location was obtained by the spatial interpolation method introduced in Section 2.2.3 and the temporal arithmetic method. Statistical indicators were calculated for the monthly precipitation series of the measured data and products in the site location to form the radar maps (Figure 6). The CC radar chart shown in Figure 6a shows that, except for CMADS, which produced a value of 0.68 for June, the other three products had values above 0.7 in all months, so the precipitation of the three products had a good correlation with the site, among which CMFD performed the best. Except for a value of 0.84 in February, the CC values of the CMFD were higher than those of the other two products with values higher than 0.9 in most months. TRMM 3B42 was second only to CMFD, with the lowest correlation coefficient of 0.73 in January and values above 0.75 in all other months.
From the RBIAS data presented in Figure 6b, dry months such as November and February had large values, which may be related to the occurrence of less precipitation, and the performance of the CMFD and TRMM 3B42 in the other months was better. The overall underestimation of CMADS was large, which is consistent with the results of the annual and seasonal scales. Overall, CMFD performed the best. Except for the dry months, such as January, February, and November, the RBIAS of CMFD was close to 0, but there were different degrees of overestimation. This was followed by TRMM 3B42, which produced somewhat underestimated values during the dry season and had similar results to CMFD in other months—slightly overestimated.
From the MAE results presented in Figure 6c, it can be seen that the performance of the three products did not differ significantly. The values were low in dry months, such as December–February, and gradually became larger in the flood period, reaching the maximum values in June. This may be related to the lower level of precipitation in the dry period and the higher level of precipitation in the flood period, similar to the conclusion of the seasonal scale analysis. From the KGE results shown in Figure 6d, CMFD produced the highest values among the three products, and the KGE value of each month was basically around 0.9. The performance of TRMM 3B42 was slightly worse than CMADS in the dry month, and their performance levels were basically the same in the other months.
The above analysis shows that the three products performed well on the monthly scale in most months, but there were problems such as a large RBIAS in the dry period and a large MAE in the flood period, which are normal statistical phenomena. Overall, CMFD performed well for all indicators and had the best performance among the three products, and TRMM 3B42 performed better than CMADS for most indicators. The three products can be used for local monthly water resource assessment and for driving hydrological models for hydrological prediction simulations.

4.1.4. Daily Scale

According to the spatial arithmetic average method, the spatial mean daily precipitations for the measured data and products from 2008 to 2018 over the study area were calculated, based on which the evaluation indexes were calculated, as shown in Table 6. On the daily scale, the CC values between the three products and the site were not high, with the highest value of only 0.60 being obtained for CMFD. Consistent with the other scales, TRMM 3B42 and CMFD showed some degree of overestimation, and CMADS showed underestimation. CMFD had the smallest RBIAS of 2.11%. For MAE, the performance of CMFD was the best, and CMADS performed better than TRMM 3B42. The KGE values of the three products were not high, and the highest value was only 0.55 from CMFD. The precipitation performance detection indexes for all daily precipitation data from 59 sites in 2008–2018 show that the POD of CMFD was the highest, reaching 0.91, followed by 0.75 with CMADS. The false alarm rate (FAR) of CMADS was the lowest, reaching 0.33, followed by 0.39 with CMFD, and the critical success index (CSI) of CMFD was the highest, reaching 0.57, followed by 0.55 with CMADS, but the FBIAS results showed that TRMM 3B42 was the best, and CMFD was the worst.
The above analysis shows that, compared with other time scales, the performance of the three products on the daily scale was poor, and the correlation degree and efficiency coefficient were not high. However, CMFD still performed optimally. CMFD and TRMM 3B42 were still shown to be overperforming, and CMADS was underperforming. However, in terms of the MAE, CMADS performed better than TRMM 3B42, unlike the results for the other scales. Similarly, CMADS outperformed TRMM 3B42 in terms of POD and CSI, and CMADS performed the best in terms of the FAR. This shows that the application accuracy of the three products in a daily-scale hydrological simulation is limited.

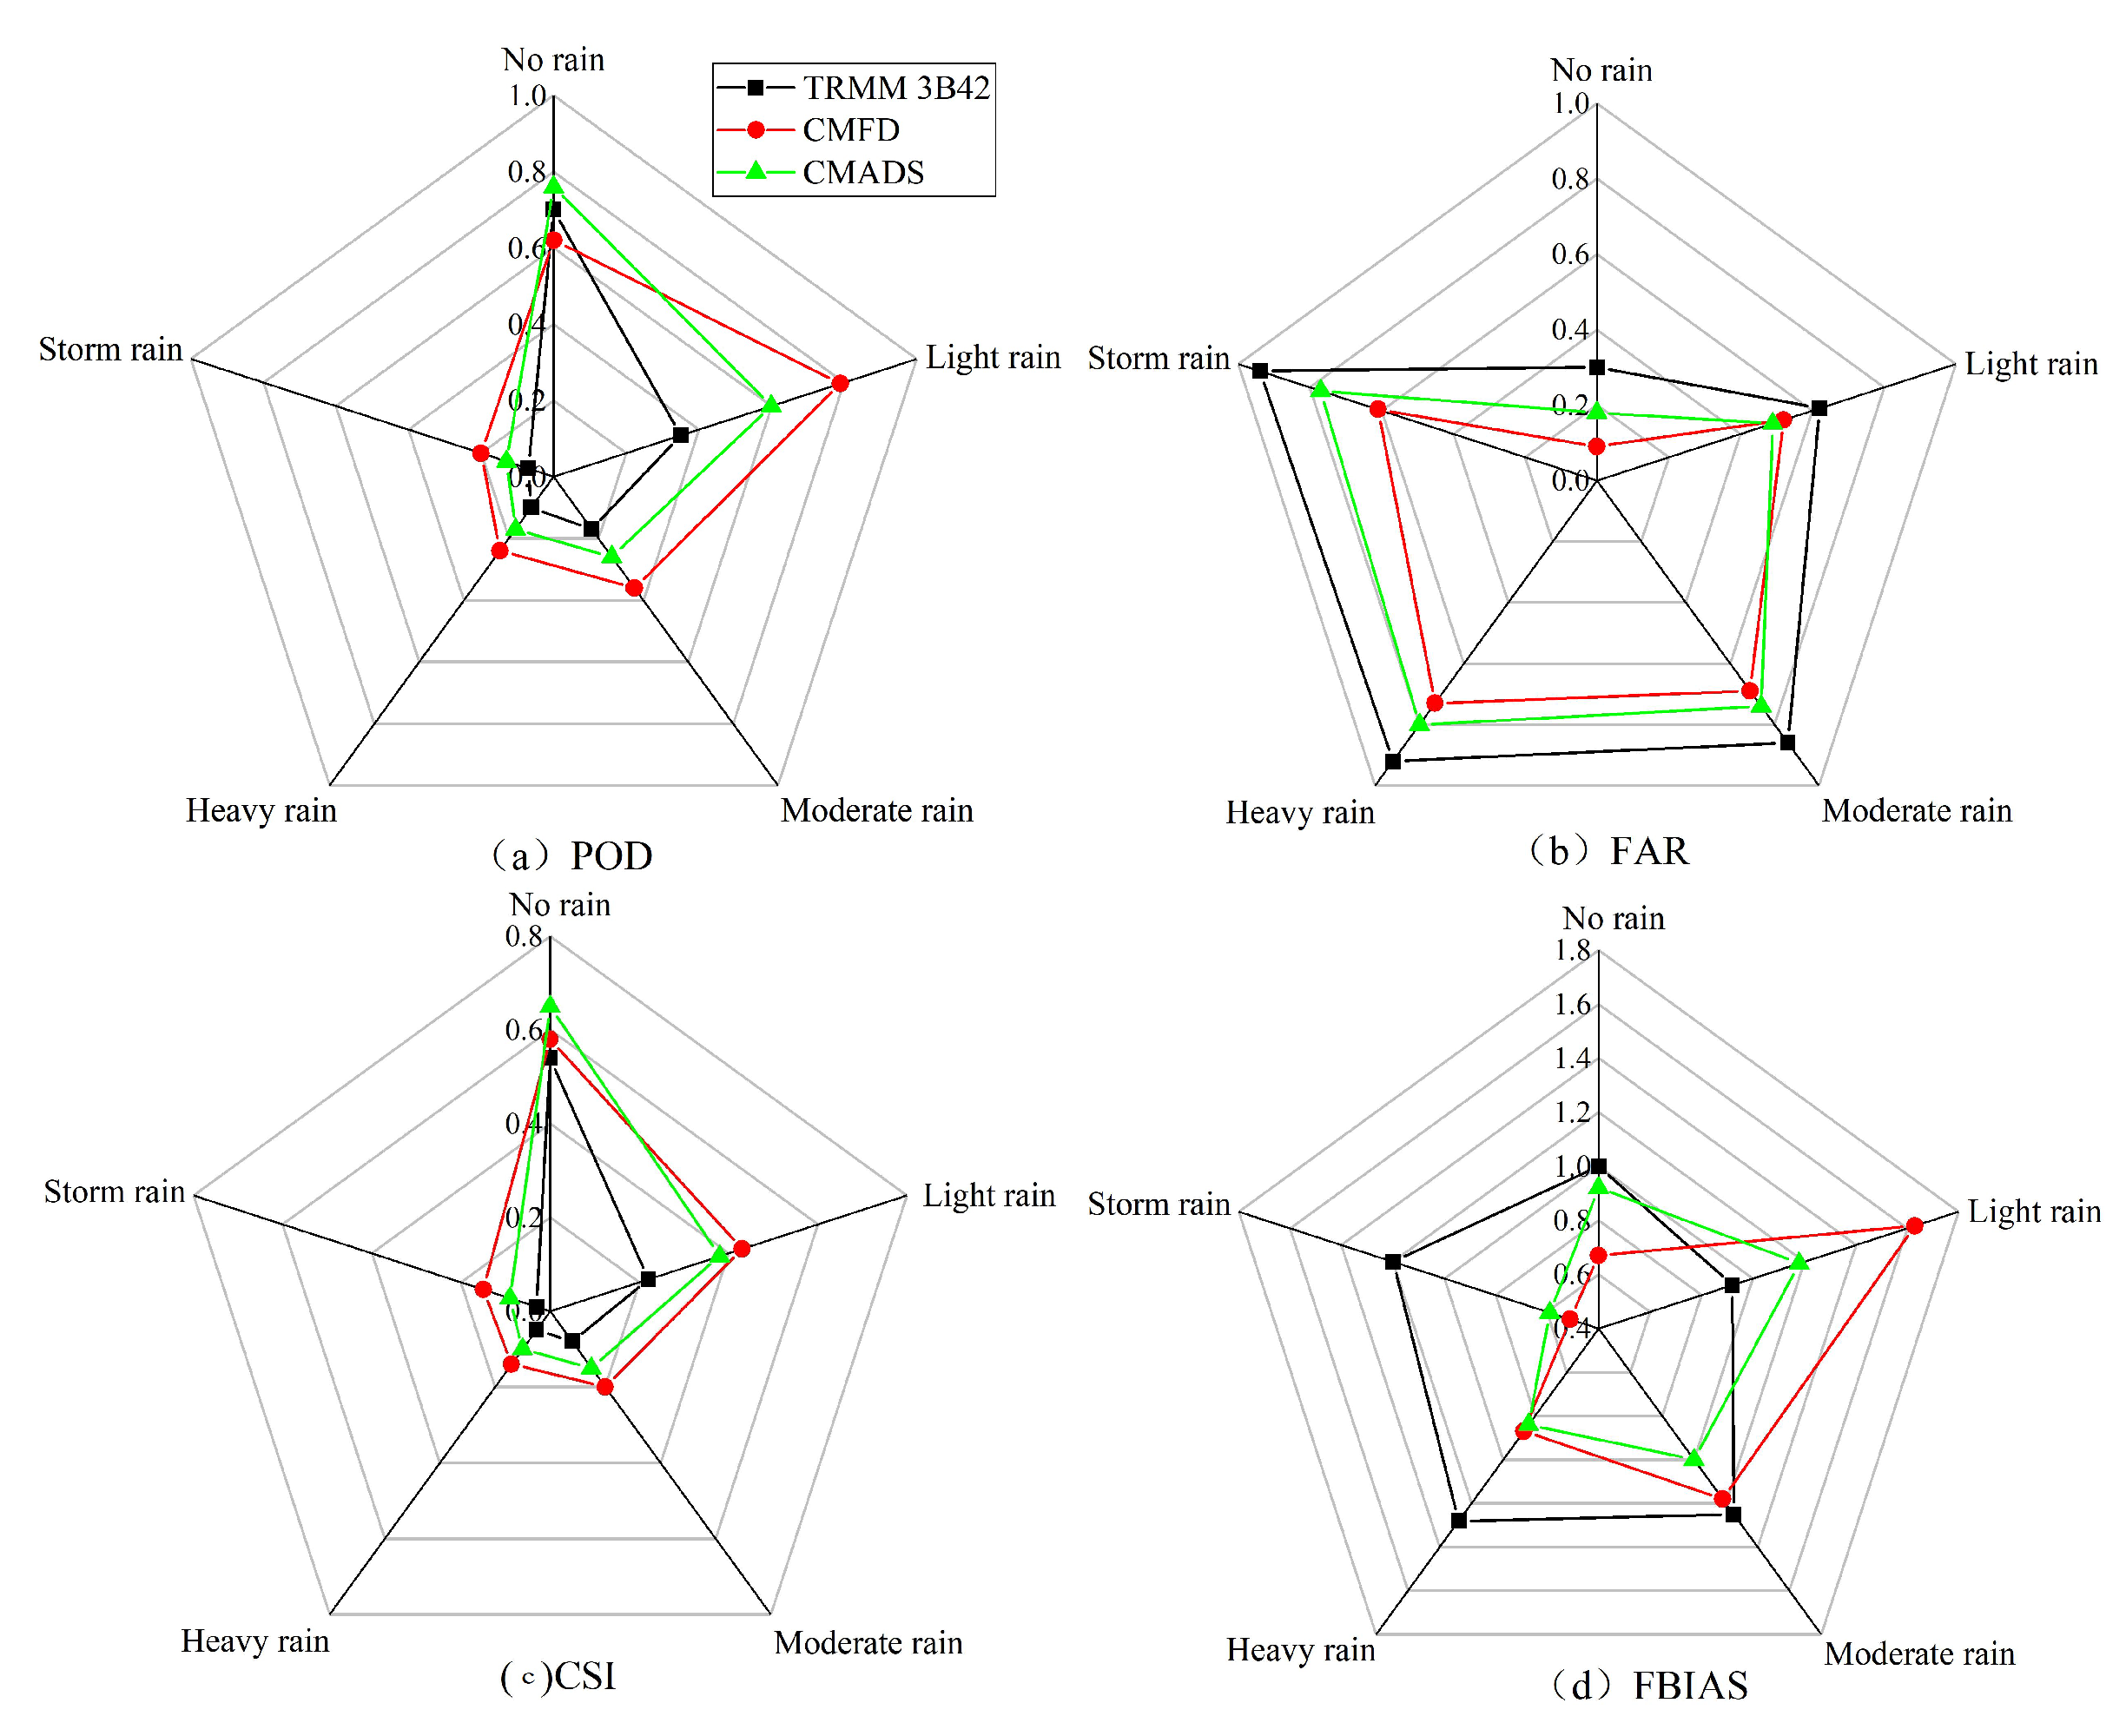
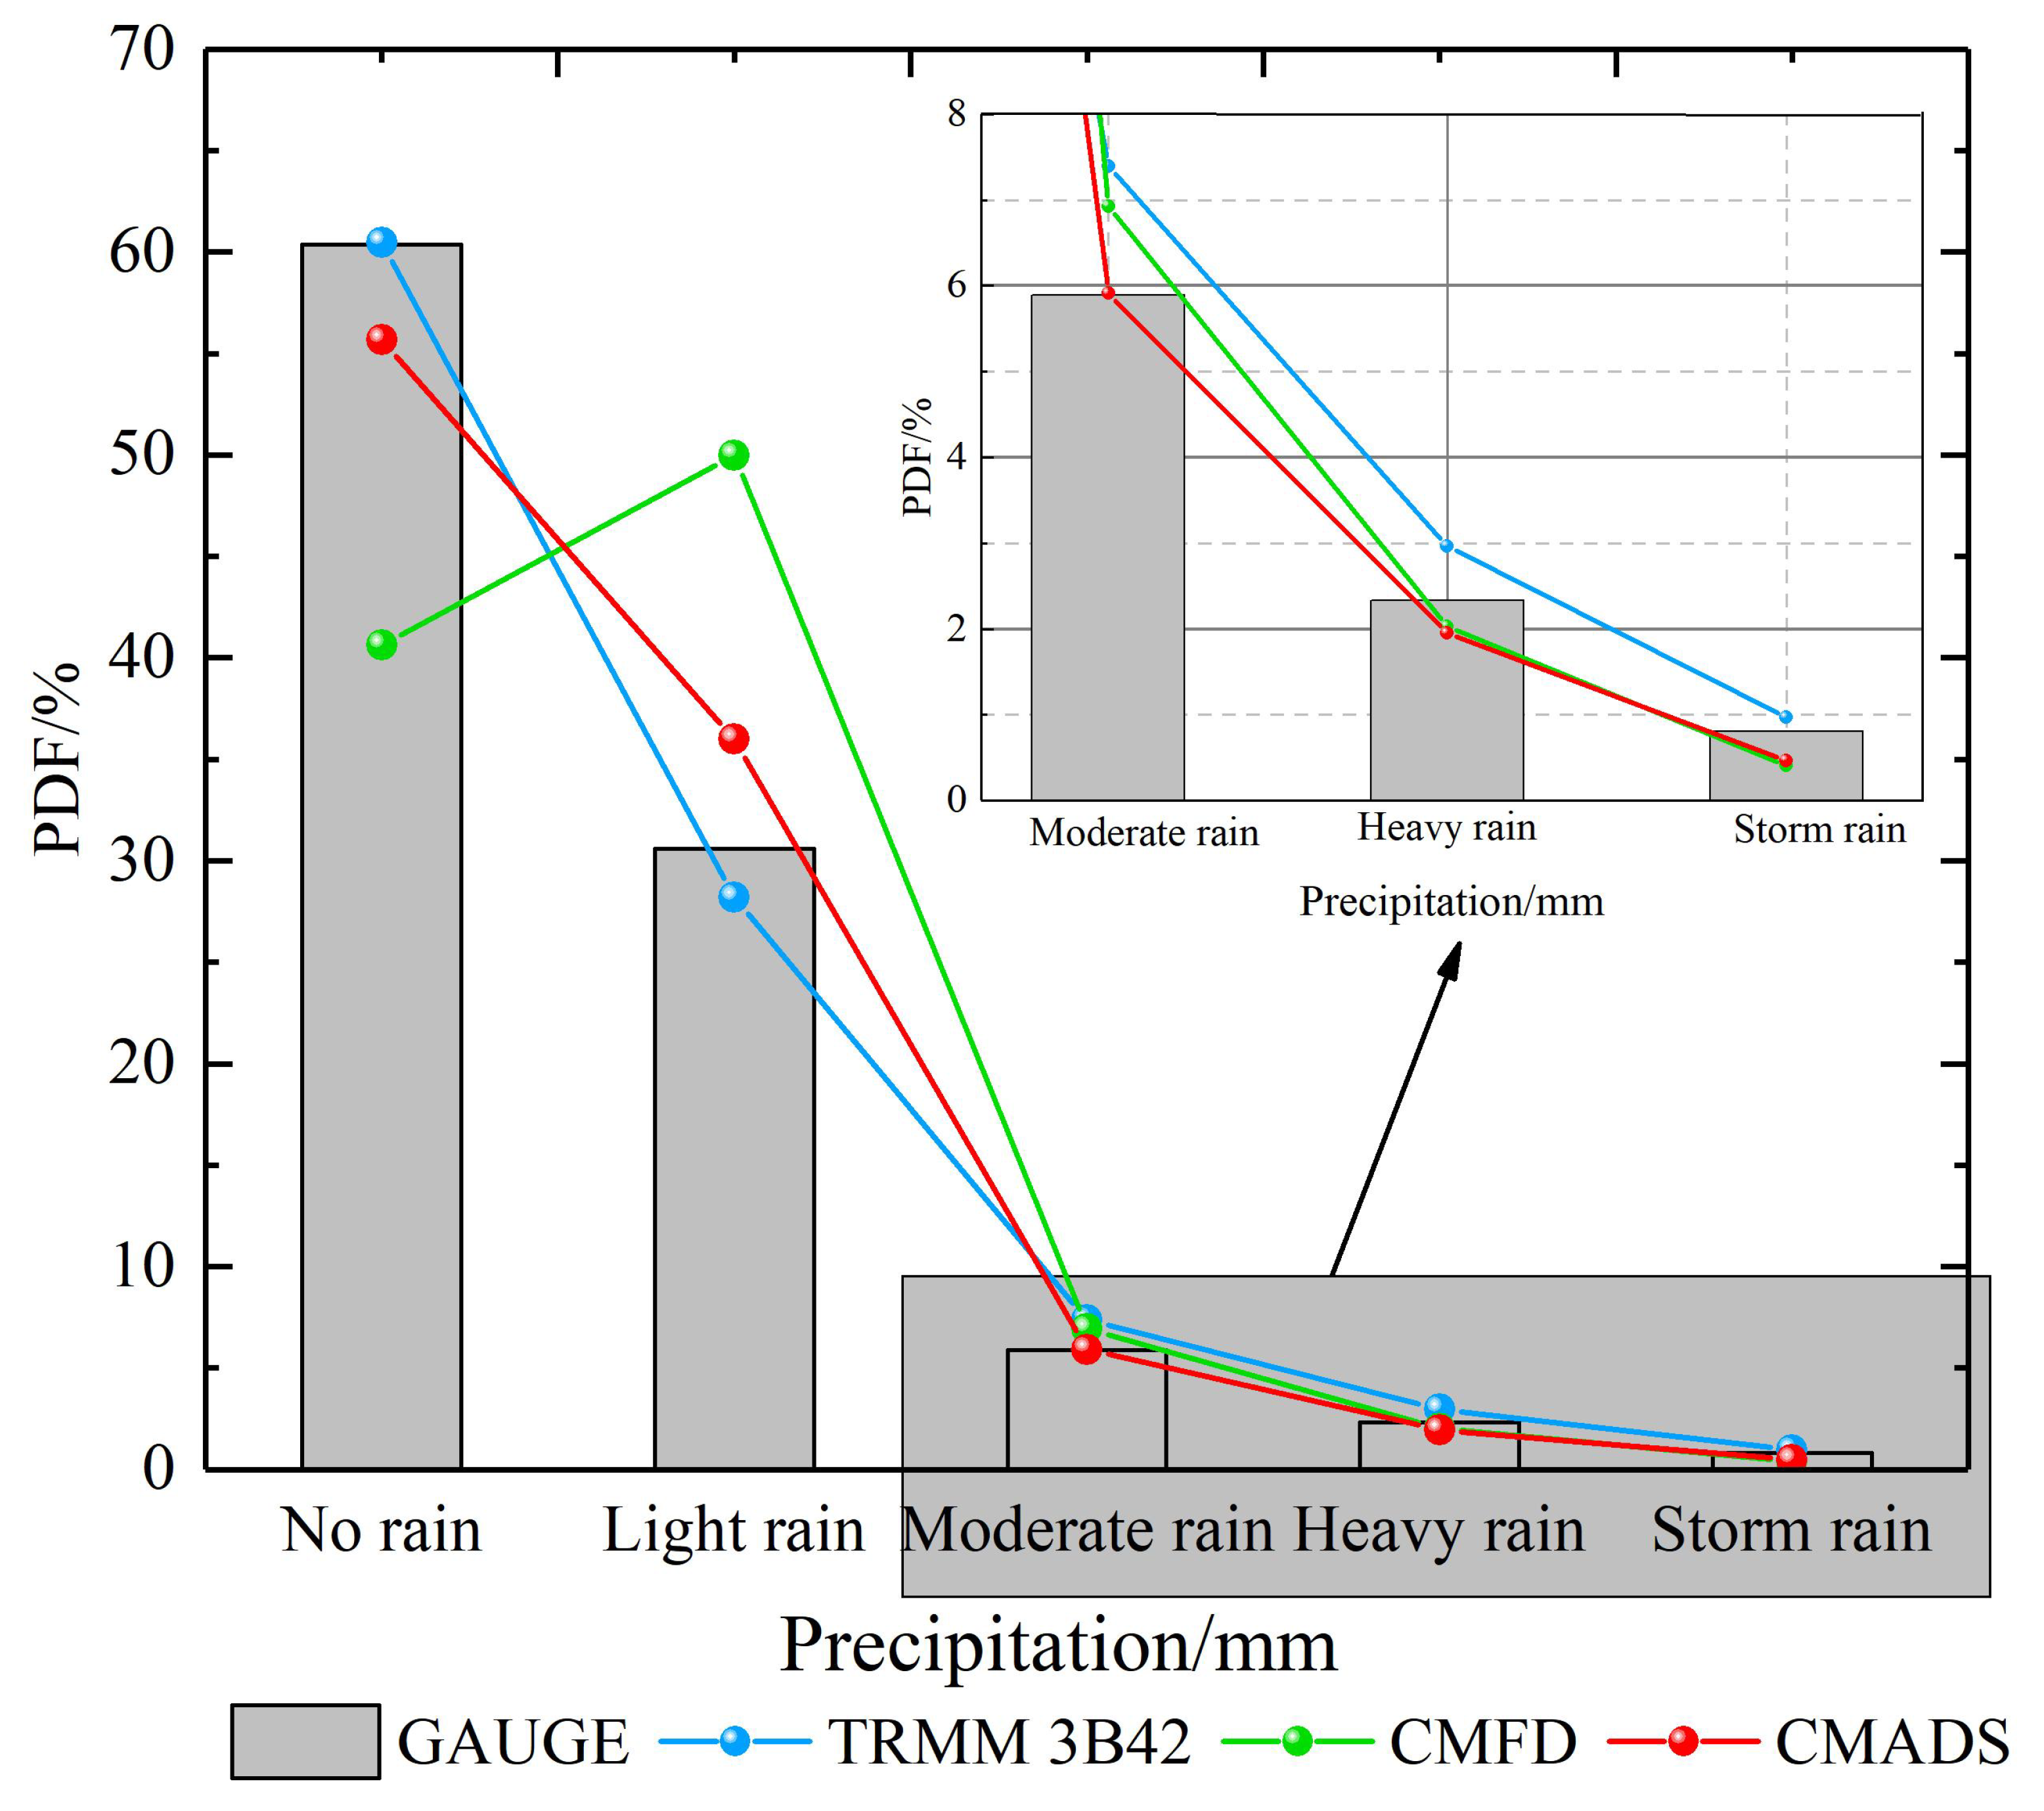
4.2. Analysis of Different Precipitation Intensities

According to the precipitation intensity grading standard, the daily precipitation in 2008–2018 was divided into five levels: no rain, light rain, moderate rain, heavy rain, and storm rain, and four performance detection indicators were used to evaluate the precipitation products. As can be seen from Figure 7a, the three products had high POD values for light rain and no rain, and as the intensity of rainfall increased, POD decreased and was the lowest for storm rain. Among the three products, the POD of CMFD was the highest, except for other products when there was no rain, and it reached 80% for light rain but only 20% for storm rain. This was followed by CMADS, which exceeded TRMM 3B42 in POD for all rainfall levels. As shown in Figure 7b,c, the FAR, CSI, and POD values of the three products were consistent: FAR increased and CSI decreased with an increase in the rainfall level, and CMFD had the best effect. In the FBIAS data shown in Figure 7d, CMADS performs the best for moderate and heavy rain, CMFD performs the best for no rain and storm rain, and TRMM 3B42 performs the best in light rain, and it is difficult to distinguish which product is the best overall.
Figure 8 shows the frequency distribution of the precipitation intensity for the three precipitation products. Under different precipitation intensities, the three precipitation products had different degrees of overestimation/underestimation of the actual precipitation. TRMM 3B42 precipitation products showed a stronger ability to estimate the classification of no rain, light rain, and storm rain, while CMFD performed the worst among the three precipitation products, and the estimated precipitation frequency was only stronger in the heavy rain phase. CMADS had the strongest precipitation estimation performance in moderate rain and storm rain.
Based on the above analysis, from the perspective of POD and FAR for different precipitation intensities, the three precipitation products had the highest POD and the lowest FAR values for no rain and light rain, and the POD decreased with an increase in the precipitation intensity. It can be considered that the three precipitation products are more accurate in judging whether there is precipitation, but under different precipitation intensity grades, the judgment accuracy will decrease with an increase in the precipitation intensity, with the POD of heavy rainfall being the lowest. In terms of other metrics, all three products have their strengths, but overall, CMFD performs the best. According to the above analysis, the simulation effect of the three precipitation products on storm rain was shown to be poor, so the three products are not suitable for rainstorm-flood calculations but are suitable for the analysis and calculation of water resources at different time scales.

4.3. Spatial Scale Analysis

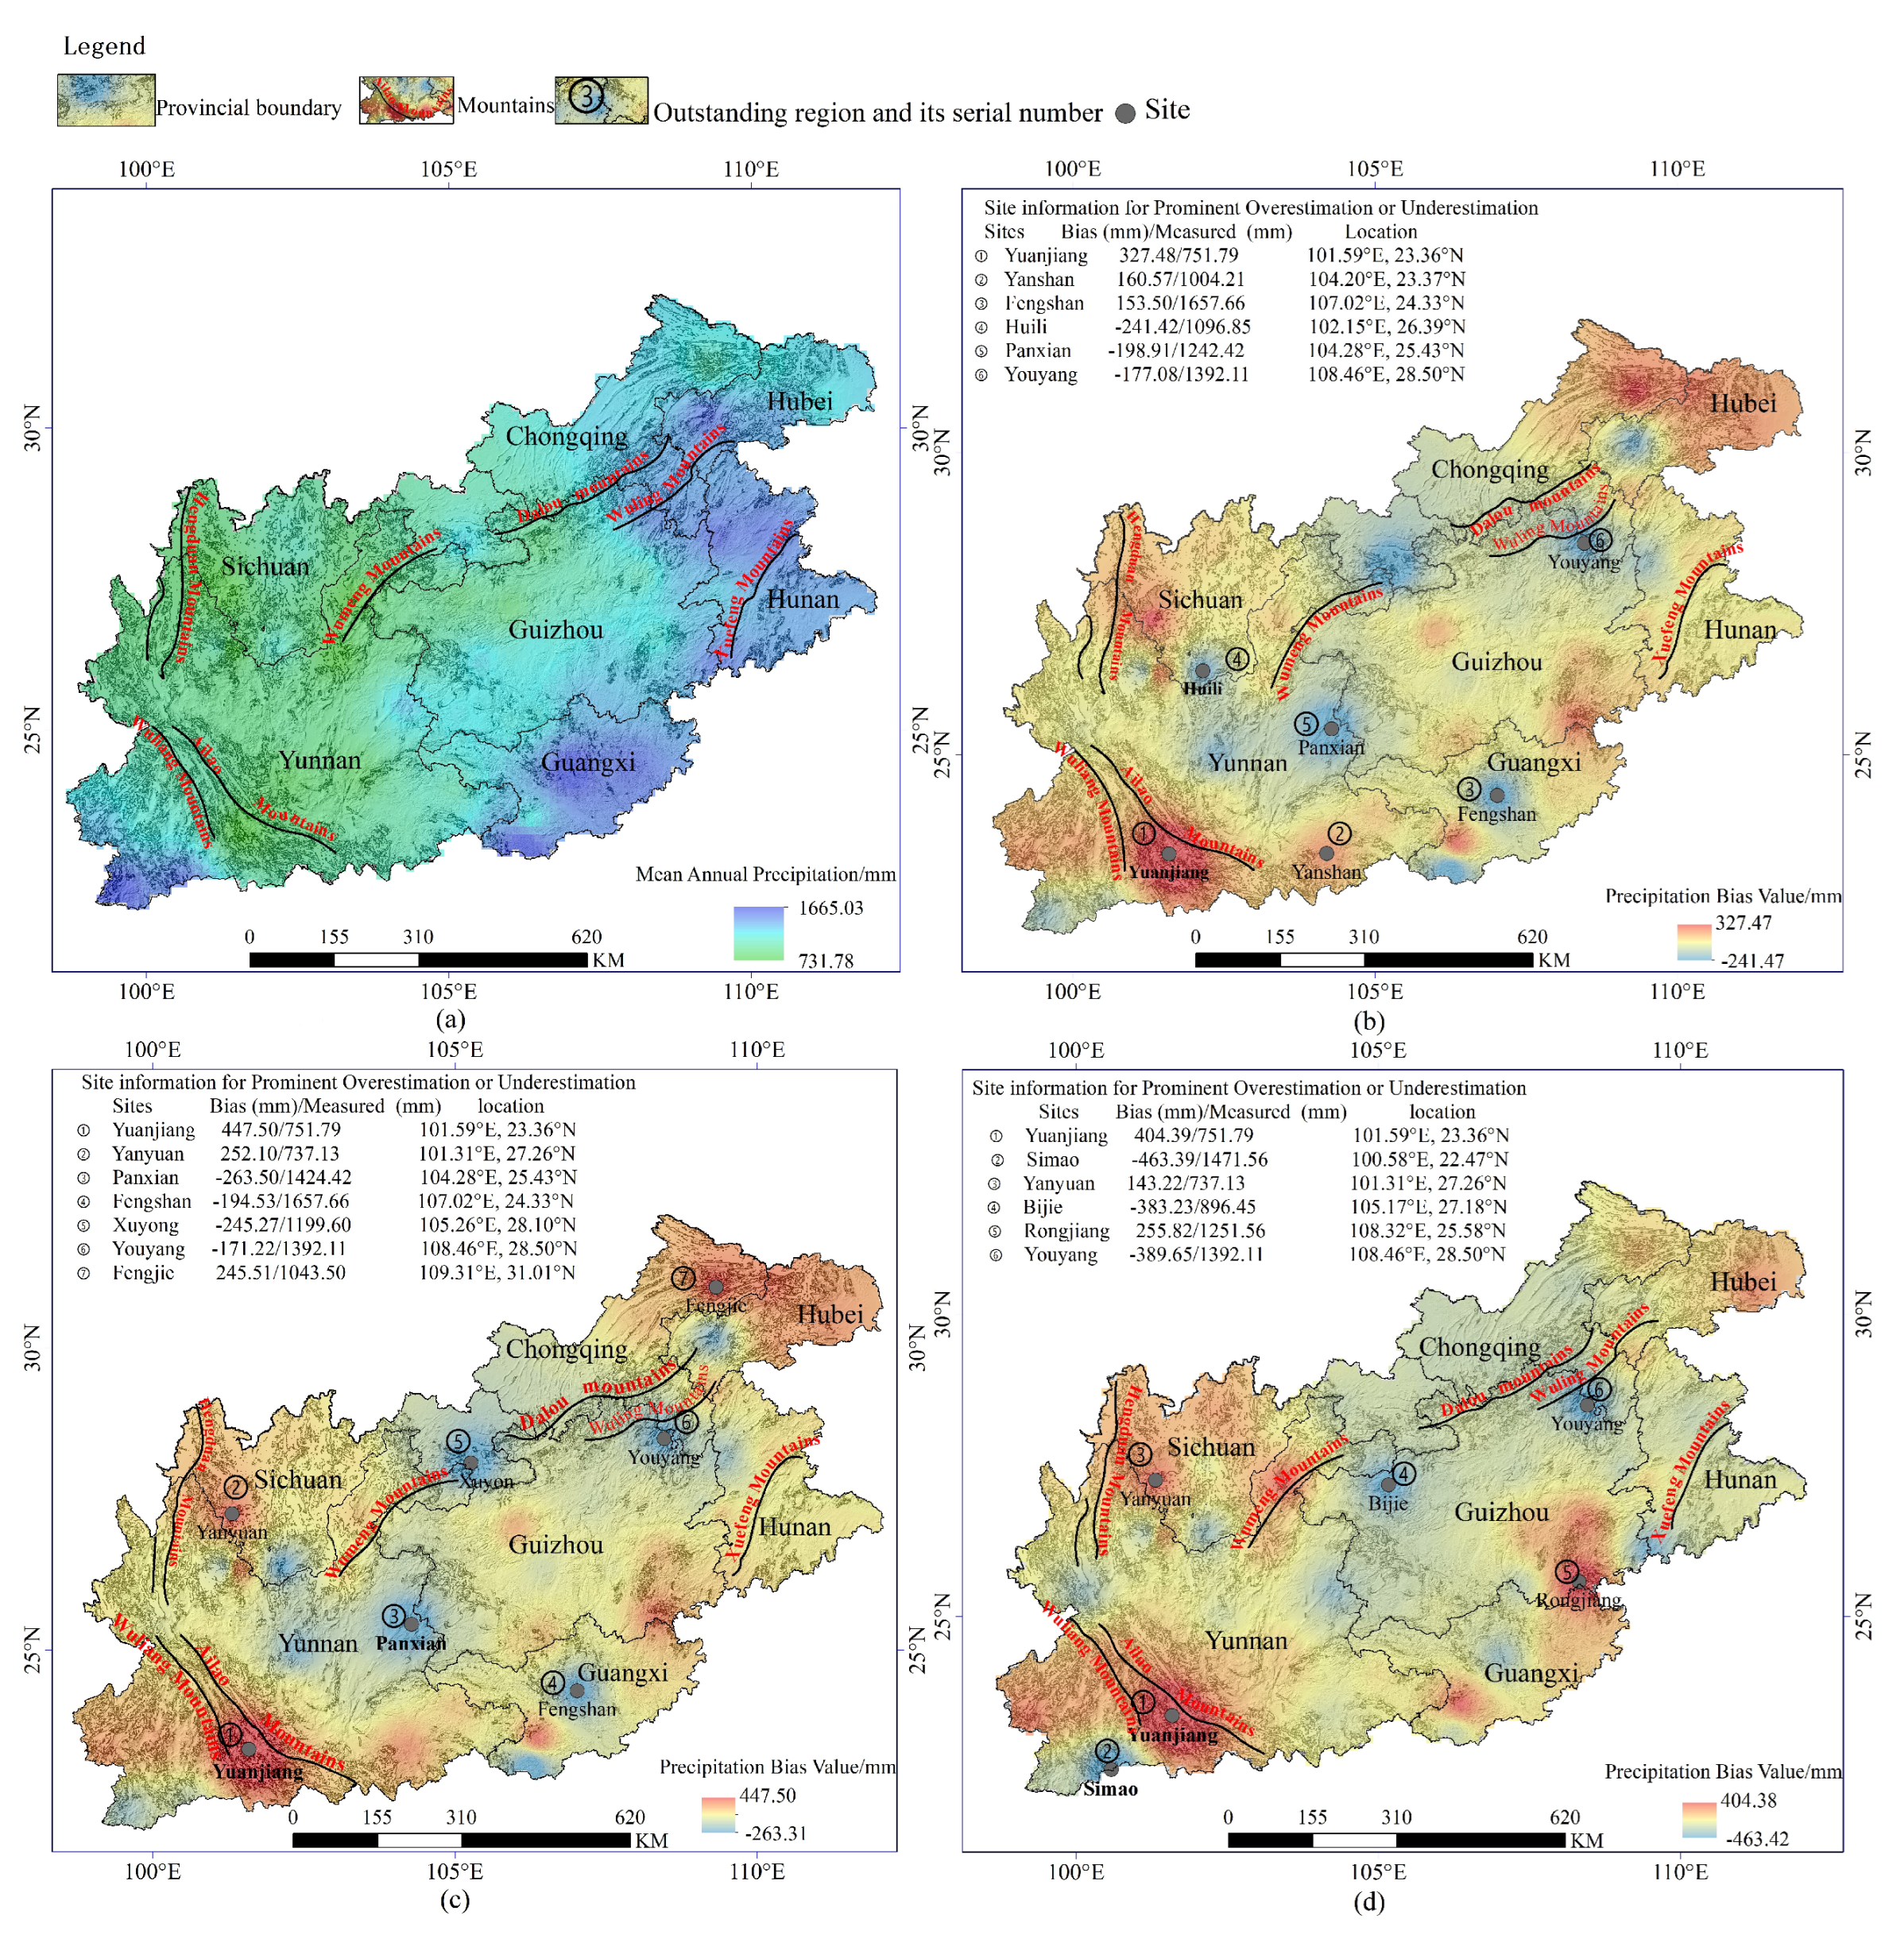
4.3.1. Spatial Distribution of Precipitation Deviation Values

In addition to the applicability evaluation of the three products at different time scales, this paper also conducted an analysis at the spatial scale. The bias value of the mean annual precipitation was calculated, and the Inverse Distance Interpolation method was used to determine the bias statistical indexes (Table 7) and the spatial distribution map of the bias value over the study area (Figure 9a–c).
As shown in Table 7, the measured mean annual precipitation of study area for 2008–2018 was 1125.4 mm, and the average precipitation bias of the three products was not large, in which CMADS produced the largest value of the three products, with a bias and RBIAS of 105.1 mm and 9.3%, and CMFD had the smallest values with a bias of only 12.8 mm. As shown in Figure 9b, from the perspective of the bias distribution, the most overestimated station of CMFD was ➀ Yuanjiang Station, located in Yuanjiang County, southwest of Yunnan Province, with maximum overestimation and RBIAS values of 327.5 mm and 43.56%, respectively. The most underestimated station was ➃ Huili Station, located in the north of Yunnan Province, with maximum underestimation and RBIAS values of 241.5 mm and −22.01%, respectively. The overvalued area of CMFD mainly covered the southern part of the Yunnan-Kweichow Plateau, including southern Yunnan, southern Guangxi, and eastern Guizhou, where there was more annual precipitation. The underestimated area of CMFD mainly covered ➂ central Guangxi, ➃ the junction of Yunnan and Sichuan, ➄ central, northern, and eastern Yunnan, and ➅ northeastern Guizhou, which were relatively rainless. It can be seen that the overestimated areas were mainly located in the rainy area, consistent with the conclusion from the previous timescale analysis that precipitation products have greater bias in the flooded period. The reason for this may be related to the source of water vapor and topography—the water vapor of the Yunnan-Kweichow Plateau mainly comes from the Bay of Bengal and the western Pacific Ocean, and the overestimation area is basically at the gateway position of the water vapor into the Yunnan-Kweichow Plateau. Yuanjiang Station is just located on the southwest side of Ailao Mountain, where the water vapor source comes from, and the water vapor is blocked by Ailao Mountain, so the amount of precipitation is large.
The maximum overestimation value of TRMM 3B42 was 447.5 mm, larger than that of CMADS, but the maximum underestimation value was −263.5 mm, much smaller than that of CMADS. The spatial distribution of the bias values of TRMM 3B42 and CMADS differed from that of CMFD, and the distribution characteristics of southern overestimation and intermediate underestimation were similar to those of CMFD.
In summary, the reuslts of the spatial distribution of mean annual precipitation bias over the study area were good for the three products in most areas, and CMFD was shown to have the best effect, but there were also some regions that were prominently overestimated and underestimated. In the perspective of water resource assessment, three products can be used for the water resource evaluation in most parts of the study area.

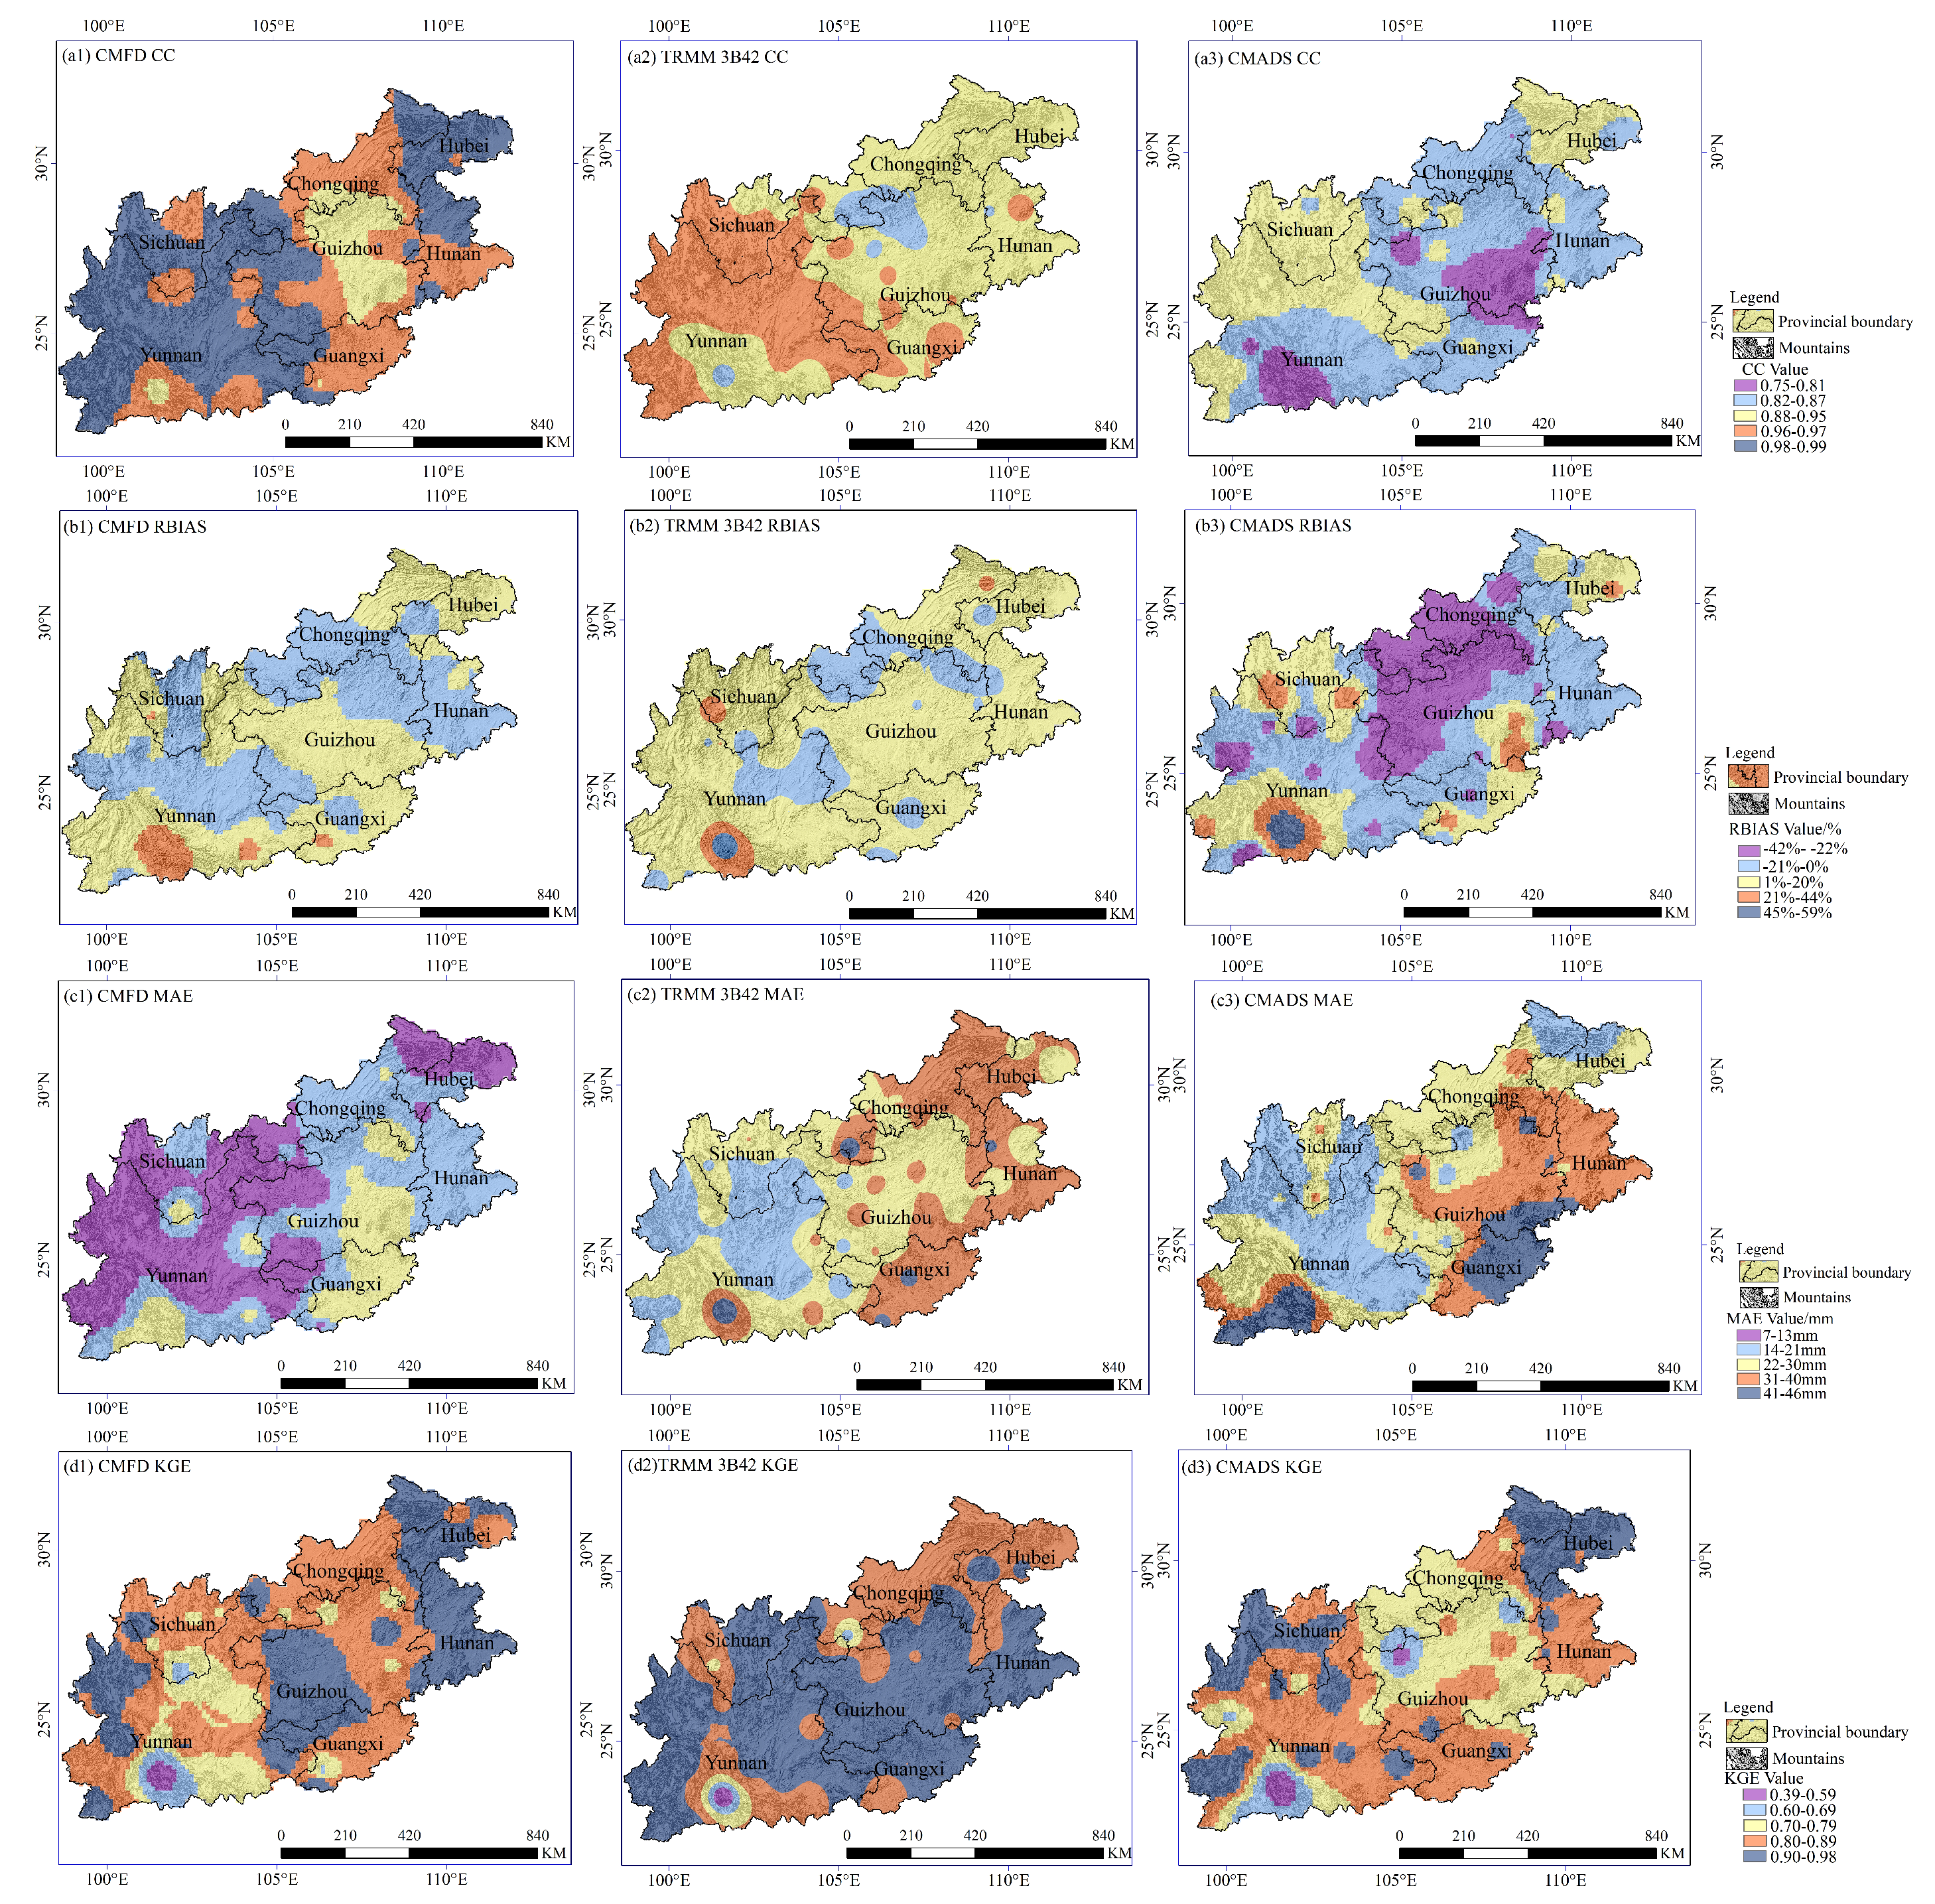
4.3.2. Evaluation of the Spatial Distribution of the Indicators

Figure 10 shows the spatial distribution of the monthly statistical indicators for th ethree products.The monthly scale statistical indexes were calculated by comparing the product and measured monthly precipitation based on the monthly precipitation in 2008–2018 for each station. The reason for the use of monthly statistical indicators is that hydrological models are often used for monthly-scale rainfall-runoff simulations in water resource analyses, so the spatial distribution of month-scale statistical indicators can be used as the basis for selecting precipitation products for water resource analyses.
The CC values between the three products and the measured precipitation were high, with values of above 0.75 (Figure 10(a1–a3)). The CC spatial distribution maps of the three products can be clearly distinguished. CMFD performed the best, followed by TRMM 3B42, and then CMADS. The CC of CMFD was more than 0.96 in most areas except for a small part of eastern Guizhou and southern Yunnan, which had CC values of 0.88–0.95 (Figure 10(a1)). The CC distribution of TRMM 3B42 was strong and consistent with that of CMFD, but the range of CC, 0.88–0.95, was significantly larger than that of CMFD. The overall CC of CMADS was 0.75–0.87.
For RBIAS (Figure 10(b1–b3)), CMFD also performed the best, having an overall RBIAS of −21%–20%, with overestimation in a small part of southern Yunnan. For TRMM 3B42, most areas had values of −21%–20%, except for several overvalued areas around the Yunnan-Kweichow Plateau. However, most areas of CMADS were underestimated, with values of −42%–0%.
The spatial distribution of the MAE is shown in Figure 10(c1–c3). The performance of the three products differed significantly. CMFD performed the best with MAE values of 7–21 mm in most areas and 22–30 mm near Yuanjiang in Yunnan and southeast of Guangxi and Guizhou. TRMM 3B42 had a MAE of 31–40 mm in most areas of eastern Yunnan and near the edge of southern Yunnan and 7–30 mm in other areas. For CMADS, the MAE was above 22 mm in most areas, and there was a large deviation between 41 and 46 mm in the eastern regions of the study area and in the southern part of Yunnan. In general, the MAE was large in the rainy areas of the east and the southwest of the Yunnan-Kweichow Plateau area (dominated by Yuanjiang Station).
For KGE (Figure 10(d1–d3)), all three products performed well, with the values of above 0.7 in most regions. CMFD and TRMM 3B42 performed the best, but the performance of TRMM 3B42 was slightly better than that of CMFD in most areas with values of above 0.8 in most areas. CMADS also performed well overall, but its performance level was slightly lower in the north of Guiyang and Chongqing.
In summary, in terms of the spatial distribution of the statistical indicators, the three products performed well in most areas, but slightly less well in rainy areas in the southwest and east of the study area. CMFD outperformed the other two products for the indicators in most areas. This means that the three products can effectively support local water analysis in most areas, but the analysis effect may be not so good fin rainy areas in the southwest and east of the study area.

5. Discussion

TRMM 3B42, CMFD, and CMADS have been widely used in many regions at home and abroad and can alleviate the difficulty associated with insufficient data at local rainfall sites and provide a data basis for local hydrometeorological research. However, the terrain of the Yunnan-Kweichow Plateau area is complex, the mountains are high and the valleys are deep, and there are few ground stations, thereby requiring precipitation products to have high terrain adaptability. In order to further study the applicability of the three precipitation products in the Yunnan-Kweichow Plateau area, this paper analyzed their simulation accuracy and detection indicators on multiple time scales and spatial scales and at different precipitation intensities. The results show that the three precipitation products performed well overall in the Yunnan-Kweichow Plateau area. CMFD performed the best, having higher correlation and accuracy values in relation to the measured precipitation and a better performance than the other precipitation products on nearly all evaluation perspectives. This is similar to the conclusions of previous studies. Qianxin Wu et al. [55] evaluated the monthly precipitation of five other precipitation products in the Shule River Basin, and found that CMFD performed the best in the evaluation of monthly-scale precipitation data. Yanhong Wu et al. [56] found that CMFD data had a higher correlation with the measured precipitation data and a smaller deviation in the Qinghai-Tibet Plateau.
It was found that TRMM 3B42 and CMFD produce overestimations compared with the measured precipitation data, while CMADS showed underestimation overall. This finding is similar to the conclusions of previous studies. Guotao Dong et al. [57] found that TRMM 3B42 overestimated the annual precipitation in the Yellow River Basin with an overestimation of 2.19%. John M.A. et al. [58] found that TRMM 3B42 consistently overestimated precipitation in all seasons in Nepal. Qiang Wang et al. [46] found that CMADS products in the Gan River Basin tended to underestimate precipitation, while TRMM 3B42 products slightly overestimated precipitation. This paper found that the correlation between precipitation products and measured precipitation was higher on annual, seasonal, and monthly scales and poor at the daily scale. This is consistent with the conclusion of Omranian and Sharif [59] in a study conducted in the Lorador River Basin that precipitation products have a better linear correlation with measured precipitation on a monthly scale compared to the diurnal scale. For the different precipitation intensities, it was found that CMFD and CMADS data had large deviations in the capture of no rain and light rain, the prediction of no rain was underestimated, and the prediction of light rain was overestimated, among which CMFD had the largest deviation. This conclusion was also obtained by Haizhe Wu [60] in the Loess Plateau where they evaluated the multitemporal and spatial scale accuracy of CMFD, MSWEP, and CMADS. Qi Huang [33] compared CMFD, GPM-IMERG, and MSWEP and the meteorological station data to evaluate the accuracy of the three products in the Yalong River Basin and concluded that with an increase in the precipitation intensity, the detection capacity of each dataset became weaker, which is basically consistent with the conclusions of this study.
There are still shortcomings in this study. When the interpolation methods were used to extract the precipitation data produced by the three products at the site location, the error and information loss may influence the evaluation effect, as the impacts of terrain, elevation, and the mountain peak barrier on the precipitation distribution were not considered. In future research, geographically weighted regression and other methods that consider the influences of topography and other factors will be used to minimize the loss of product information caused by interpolation.
The purpose of developing and researching precipitation products is to compensate for the lack and deficiency of data at surface precipitation sites. The product applicability analysis can determine whether precipitation products can replace site data in areas with insufficient stations and whether the combination of precipitation products and site data can improve the accuracy of water resource calculations. The applicability analysis of precipitation products included a simulation effect evaluation of precipitation products at the location of the observation station and over the entire river basin. The latter requires runoff data from the hydrological station for analysis. The watershed hydrological model can simulate the runoff of the watershed control section driven by the precipitation products, and then the simulated runoff can be compared with the measured runoff to verify the ability of precipitation products to cover the whole watershed precipitation. A characteristic of hydrological inspection is that the simulation effect of precipitation at a certain point in the basin cannot be tested, but the precipitation simulation effect across the entire basin can be verified. The combination of the precipitation product inspection at the meteorological stations and the hydrological simulation inspection over the entire basin can be used to verify the performance of precipitation products more accurately. Limited by the wide scope of the study area and the difficulty of collecting hydrological data, hydrological testing of precipitation products was not carried out in this paper, and further study will be done in later research.

6. Conclusions

Taking the Yunnan-Kweichow Plateau area as the research object and using precipitation data collected in 2008–2018 from 59 stations, this paper evaluated the accuracy and applicability of TRMM 3B42, CMFD, and CMADS in the Yunnan-Kweichow Plateau area through continuity indicators and precipitation detection indicators for different time scales, precipitation intensity levels, and spatial scales. The following conclusions were obtained:
(1) The three products performed well and can be applied to the calculation of local water resources. The precipitation data of CMFD were closer to the actual values than the two data sets produced by TRMM and TRMM 3B42 at nearly all time scales, precipitation intensity levels, and spatial distributions. TRMM 3B42 performed better than CMADS for most metrics, but CMADS outperformed TRMM 3B42 in terms of POD and CSI, and CMADS only had the best performance for the false positive rate. As a whole, CMFD and TRMM 3B42 overestimated the results, but CMADS underestimated them.
(2) Precipitation products perform well on the annual, quarterly, and monthly scales, but their performance was slightly worse on the daily scale. The good performance in most months makes the products capable of conducting the rainfall-runoff simulation well enough for hydrological studies and water resource evaluations to be carried out.
(3) The mean annual precipitation of the three products from 2008 to 2018 showed good effects in most areas of study area. CMFD performed the best, but there were also some stations that were prominently overestimated or underestimated. The three products can be used for water resource evaluations in most parts of the study area.
(4) Except for the daily scale, the CC values between the three products and the measured data were good, and CMFD performed the best. The RBIAS was larger in the dry months of spring and winter, smaller in the wet months of summer and autumn, larger in the less rainy areas, and smaller in the rainy areas. The MAE was the opposite to RBIAS due to the characteristics of the statistical indicators. The spatial mean KGE over the study area was not good for the daily scale, having a highest value of only 0.55, but it was better for the other temporal scales. The KGEs were high in most regions with values of above 0.7. CMADS outperformed TRMM 3B42 for the POD and CSI, and CMADS was the best for the FAR. The three precipitation products had the highest POD values and the lowest FAR values for no rain and light rain, and the POD values gradually decreased with an increase in the precipitation intensity.
(5) Due to the relatively large absolute errors in rainy months shown by the precipitation products, they will be limited in accuracy for rainstorm-flood calculations, but they can be used for local water resources analyses and evaluations in most parts of the study area. Especially at the monthly scale, they can drive the rainfall-runoff models to simulate the local monthly runoff.

Author Contributions

Conceptualization, H.Z.; methodology, H.Z. and Z.L.; software, T.Y.; validation, T.Y., Y.X. and G.C.; formal analysis, A.B. and T.Y.; investigation, T.Y. and Y.X.; resources, H.Z.; data curation, T.Y., A.B., G.C. and Y.X.; writing–original draft preparation, T.Y., H.Z. and Y.X.; writing—review and editing, H.Z.; visualization, Y.X.; supervision, H.Z.; project administration, H.Z.; funding acquisition, H.Z. All authors have read and agreed to the published version of the manuscript.

Funding

The study was funded by National Natural Science Foundation of China through Grant No. 52069010 and the Scientific Research Fund Approved by the Education Department of Yunnan Province No.202350129.

Institutional Review Board Statement

Not applicable.

Informed Consent Statement

Not applicable.

Data Availability Statement

The following supporting information can be downloaded online. TRMM 3B42 data is from https://disc.gsfc.nasa.gov (accessed on 1 April 2022), CMFD data from http://westdc.westgis.ac.cn (accessed on 1 April 2022), CMADS data from http://www.cmads.org/ (accessed on 1 April 2022), the site precipitation data of the China Meteorological Data Network from http://data.cma.cn/ (accessed on 1 April 2022) and the geographical information from http://www.resdc.cn/ (accessed on 1 April 2022).

Acknowledgments

We acknowledge the following research institutes for providing us the related data. CMADS data were developed by the China Institute of Water Resources and Hydropower Research, the China Meteorological Administration and the Institute of Cold Region Environment and Engineering of the Chinese Academy of Sciences, TRMM data by NASA and JAXA, CMFD data by the Institute of Tibetan Plateau of the Chinese Academy of Sciences, the site precipitation data by China Meteorological Data Network and the geographical data by Resource and Environmental Scientific Data Center.

Conflicts of Interest

The authors declare no conflict of interest.

References

  1. Michaelides, S.; Levizzani, V.; Anagnostou, E.; Bauer, P.; Kasparis, T.; Lane, J.E. Precipitation: Measurement, remote sensing, climatology and modeling. Atmos. Res. 2009, 94, 512–533. [Google Scholar] [CrossRef]
  2. Xie, P.; Chen, M.; Yang, S.; Yatagai, A.; Hayasaka, T.; Fukushima, Y.; Liu, C. A guage based analysis of daily precipitation over East Asia. J. Hydrometeorol. 2007, 8, 607–626. [Google Scholar] [CrossRef]
  3. Huang, X.; Wang, Z.-G.; Sang, Y.-F.; Yang, M.-Y.; Liu, X.-C.; Gong, T.-L. A comparative study on the quality of precipitation data from different sources in the Yarlung Tsangpo River basin. Adv. Geogr. Sci. 2016, 35, 339–348. [Google Scholar]
  4. Kobayashi, S.; Ota, Y.; Harada, Y.; Ebita, A.; Moriya, M.; Onoda, H.; Onogi, K.; Kamahori, H.; Kobayashi, C.; Endo, H.; et al. The JRA-55 reanalysis: General specifications and basic characteristics. J. Meteorol. Soc. Jpn. Ser. II 2015, 93, 5–48. [Google Scholar] [CrossRef] [Green Version]
  5. Huang, G.; Cao, Y. Accuracy analysis of TRMM 3B43 satellite precipitation data in the Yellow River basin. Remote Sens. Technol. Appl. 2019, 34, 1111–1120. [Google Scholar]
  6. Wang, G. Accuracy Assessment of Multiple Precipitation Products in the Qinba Mountains. Master’s Thesis, Northwestern University, Evanston, IL, USA, 2018. [Google Scholar]
  7. Huffman, G.J.; Adler, R.F.; Bolvin, D.T.; Gu, G. Improving the global precipitation record: GPCP Version 2.1. Geophys. Res. Lett. 2009, 36, 153–159. [Google Scholar] [CrossRef] [Green Version]
  8. Kummerow, C.; Barnes, W.; Kozu, T.; Shiue, J.; Simpson, J. The tropical rainfall measuring mission(TRMM) sensor package. J. Atmos. Ocean Technol. 1998, 15, 809–917. [Google Scholar] [CrossRef]
  9. Tang, G.; Wan, W.; Zeng, Z.; Guo, X.; Li, N.; Long, D.; Hong, Y. An overview of the Global Precipitation Measurement (GPM) program and its latest progress. Remote Sens. Technol. Appl. 2015, 30, 607–615. [Google Scholar]
  10. Ushio, T.; Sasashige, K.; Kubota, T.; Shige, S.; Okamoto, K.I.; Aonashi, K.; Inoue, T.; Takahashi, N.; Iguchi, T.; Kachi, M. A Kalman filter approach to the global satellite mapping of precipitation(GSMaP) from combined passive microwave and infrared radiometric data. J. Meteorol. Soc. Jpn. 2009, 87A, 137–151. [Google Scholar] [CrossRef] [Green Version]
  11. Joyce, R.J.; Janowiak, J.E.; Arkin, P.A.; Xie, P. CMORPH: A method that produces global precipitation estimates from passive microwave and infrared data at a high spatial and temporal resolution. J. Hydrometeorol. 2004, 5, 487–503. [Google Scholar] [CrossRef]
  12. Xie, P.; Arkin, P.; Janowiak, J. CMAP: The CPC merged analysis of precipitation. Meas. Precip. Space 2007, 28, 319–328. [Google Scholar]
  13. Ashouri, H.; Hsu, K.; Sorooshian, S.; Braithwaite, D.K.; Knapp, K.R.; Cecil, L.D.; Nelson, B.R.; Prat, O.P. PERSIANN-CDR: Daily Precipitation Climate Data Record from Multi-satellite Observations for Hydrological and Climate Studies. Bull. Am. Meteorol. Soc. 2015, 96, 69–83. [Google Scholar] [CrossRef] [Green Version]
  14. Beck, H.E.; Wood, E.F.; Pan, M.; Fisher, C.K.; Miralles, D.G.; van Dijk, A.I.J.M.; McVicar, T.R.; Adler, R.F. MSWEP V2 Global 3-Hourly 0.1° Precipitation: Methodology and Quantitative Assessment. Bull. Am. Meteorol. Soc. 2019, 100, 473–500. [Google Scholar] [CrossRef] [Green Version]
  15. Zhang, L.; Yang, M.; Wang, H. Application of CMADS, CFSR and Meteorological data in Hunhe River Basin. China Rural Water Hydropower 2020, 9, 132–137. [Google Scholar]
  16. Balsamo, G.; Albergel, C.; Beljaars, A.; Boussetta, S.; Brun, E.; Cloke, H.; Dee, D.; Dutra, E.; Munoz-Sabater, J.; Pappenberger, F. ERA-Interim/Land:a global land surface reanalysis data set. Hydrol. Earth Syst. Sci. 2015, 19, 389–407. [Google Scholar] [CrossRef] [Green Version]
  17. Saha, S.; Moorthi, S.; Pan, H.L.; Wu, X.; Wang, J.; Nadiga, S.; Tripp, P.; Kistler, R.; Woollen, J.; Behringer, D. The NCEP climate forecast system reanalysis. Bull. Am. Meteorol. Soc. 2010, 91, 1015–1057. [Google Scholar] [CrossRef] [Green Version]
  18. Gelaro, R.; McCarty, W.; Suarez, M.J.; Todling, R.; Molod, A.; Takacs, L.; Randles, C.A.; Darmenov, A.; Bosilovich, M.G.; Reichle, R. The modern-era retrospective analysis for research and applications, version 2(MERRA-2). J. Clim. 2017, 30, 5419–5454. [Google Scholar] [CrossRef]
  19. Onogi, K.; Tsutsui, J.; Koide, H.; Sakamoto, M.; Kobayashi, S.; Hatsushika, H.; Matsumoto, T.; Yamazaki, N.; Kamahori, H.; Takahashi, K.l. The JRA-25 Reanalysis. Meteorol. Mag. 2017, 85, 369–432. [Google Scholar] [CrossRef] [Green Version]
  20. Wu, L.F.; Qian, L.; Huang, G.M.; Liu, X.G.; Wang, Y.C.; Bai, H.; Wu, S.F. Assessment of the impact of improved CLDAS precipitation drive on regional snow simulation in China. Meteorology 2018, 44, 985–997. [Google Scholar]
  21. He, J.; Yang, K. Regional High Spatial and Temporal Resolution Ground Meteorological Elements Driven Dataset for China (1979–2019); National Qinghai-Tibet Plateau Scientific Data Center: Lanzhou, China, 2019. [Google Scholar]
  22. Meng, X. SWAT Model Chinese Atmospheric Assimilation Drive Dataset (CMADS V1.2); Cold and Arid Regions Science Data Center: Lanzhou, China, 2016. [Google Scholar]
  23. Wang, J.; Chen, H.; Xu, C.; Li, X.; Zeng, Q. Accuracy of TRMM satellite rainfall data and runoff simulation evaluation. Water Resour. Res. 2016, 5, 12. [Google Scholar]
  24. Hirpa, F.A.; Gebremichael, M.; Hopson, T. Evaluation of High-Resolution Satellite Precipitation Products over Very Complex Terrain in Ethiopia. J. Appl. Meteorol. Climatol. 2010, 49, 1044–1051. [Google Scholar] [CrossRef]
  25. Michot, V.; Vila, D.; Arvor, D.; Corpetti, T.; Ronchail, J.; Funatsu, B.M.; Dubreuil, V. Performance of TRMM TMPA 3B42 V7 in Replicating Daily Rainfall and Regional Rainfall Regimes in the Amazon Basin (1998–2013). Remote Sens. 2018, 10, 1879. [Google Scholar] [CrossRef] [Green Version]
  26. Sambou, S.; Dacosta, H.; Deme, A.; Diouf, I. Contribution of TRMM 3B42 Data to Improve Knowledge on Rainfall in the Kayanga/Geba River Basin (The republic of Guinea, Senegal and Guinea-Bissau). Eur. Sci. J. 2018, 14, 260–275. [Google Scholar] [CrossRef] [Green Version]
  27. Yang, W.; Fu, S.; Sun, J.; Zheng, F.; Wei, J.; Ma, Z. Comparative Evaluation of the Performances of TRMM-3B42 and Climate Prediction Centre Morphing Technique (CMORPH) Precipitation Estimates over Thailand. J. Meteorol. Soc. Jpn. 2021, 99, 1525–1546. [Google Scholar] [CrossRef]
  28. Wang, Z.; Zhong, R.; Lai, C.; Chen, X.; Li, J.; Huang, Z. Study on the applicability of TRMM satellite precipitation inversion data in the Pearl River basin using the Dongjiang and Beijiang rivers as examples. Adv. Water Sci. 2017, 28, 174–182. [Google Scholar]
  29. Yu, L.; Zhang, Y.; Zhang, J.; Yang, Y. Preliminary assessment of the applicability of satellite precipitation products in Taihang Mountains. Highl. Meteorol. 2020, 39, 819–829. [Google Scholar]
  30. Liu, J.; Zhu, A.; Duan, Z. Evaluation of TRMM 3B42 Precipitation Product Using Rain Gauge Data in Meichuan Watershed, Poyang Lake Basin, China. J. Resour. Ecol. 2012, 3, 359–366. [Google Scholar]
  31. Zhang, L.; Kang, Y.; Yue, Q.; Tang, J.; Xu, J.; Wang, J.; Hao, Z. Applicability analysis of four kinds of satellite precipitation data in the source region of the Yellow River. Yellow River 2021, 43, 29–33. [Google Scholar]
  32. Hu, Y.; Jia, Z. Accuracy assessment and comparative analysis of multi-source satellite precipitation products in southwest China. Water Resour. Res. 2021, 10, 516–524. [Google Scholar] [CrossRef]
  33. Huang, Q.; Wang, R.; Xiang, J.; Qin, G. Study on the temporal and spatial applicability of three precipitation products in the Yalong River Basin. Hydrology 2020, 40, 14–21. [Google Scholar]
  34. Yang, K.; He, J. China Regional Surface Meteorological Factor—Driven Dataset (1979–2018); National Data Center for Tibetan Plateau Science: Tibetan, China, 2020. [Google Scholar]
  35. Wu, Q.-X.; Ma, S.-Y.; Zhang, Z.-H.; Guo, J.-K.; Zhang, S.-Q. Comparative study on the applicability of five precipitation products to monthly precipitation in the Upper and middle and lower reaches of Shule River. J. Glaciol. Geocryol. 2019, 41, 470–482. [Google Scholar]
  36. Gao, L.; Zhang, L.; Shen, Y.; Zhang, Y.; Zhang, W. Evaluation of the applicability of ErA-Interim and CMFD Meteorological Driven Data in the Irtysh River Basin, Xinjiang. J. Glaciol. Geocryol. 2022, 44, 179–187. [Google Scholar]
  37. Wang, L.; Zhang, X.; Fang, Y.; Xia, D. Assessment of applicability of regional ground meteorological element datasets in China in the upper Yangtze River basin. Hydropower 2017, 43, 18–22. [Google Scholar]
  38. Li, Y.; Pang, B.; Ren, M.; Shi, S.; Peng, D.; Zhu, Z.; Zuo, D. Evaluation of Performance of Three Satellite-Derived Precipitation Products in Capturing Extreme Precipitation Events over Beijing, China. Remote Sens. 2022, 14, 2698. [Google Scholar] [CrossRef]
  39. Ren, M.F.; Xu, Z.X.; Pang, B.; Liu, W.F.; Liu, J.T.; Du, L.G.; Wang, R. Assessment of Satellite-Derived Precipitation Products for the Beijing Region. Remote Sens. 2018, 10, 1914. [Google Scholar] [CrossRef] [Green Version]
  40. He, Q.; Yang, J.; Chen, H.; Liu, J.; Ji, Q.; Wang, Y.; Tang, F. Evaluation of Extreme Precipitation Based on Three Long-Term Gridded Products over the Qinghai-Tibet Plateau. Remote Sens. 2021, 13, 3010. [Google Scholar] [CrossRef]
  41. Zhang, L.; Gao, L.; Chen, J.; Zhao, L.; Zhao, J.; Qiao, Y.; Shi, J. A comprehensive evaluation of mainstream gridded precipitation datasets in the cold season across the Tibetan Plateau. J. Hydrol. Reg. Stud. 2022, 43, 101186. [Google Scholar] [CrossRef]
  42. Wen, T.T.; Guo, Y.X.; Dong, S.R.; Dong, Y.Z.; Lai, X.L. Assessment of applicability of CRU, ERA5, and CMFD grid point precipitation data on the Tibetan Plateau from 1979–2017. Arid Zone Res. 2022, 39, 684–697. [Google Scholar]
  43. Vu, T.T.; Li, L.; Jun, K.S. Evaluation of multi-satellite precipitation products for streamflow simulations: A case study for the Han River Basin in the Korean Peninsula, East Asia. Water 2022, 10, 642. [Google Scholar] [CrossRef] [Green Version]
  44. Dao, D.M.; Lu, J.; Chen, X.; Kantoush, S.A.; Binh, D.V.; Phan, P.; Tung, N.X. Predicting Tropical Monsoon Hydrology Using CFSR and CMADS Data over the Cau River Basin in Vietnam. Water 2022, 13, 1314. [Google Scholar] [CrossRef]
  45. Song, Y.; Zhang, J.; Meng, X.; Zhou, Y.; Lai, Y.; Cao, Y. Comparison Study of Multiple Precipitation Forcing Data on Hydrological Modeling and Projection in the Qujiang River Basin. Water 2020, 12, 2626. [Google Scholar] [CrossRef]
  46. Wang, Q.; Xia, J.; Zhang, X.; She, D.; Liu, J.; Li, P. Multi-Scenario Integration Comparison of CMADS and TMPA Datasets for Hydro-Climatic Simulation over Ganjiang River Basin, China. Water 2020, 12, 3243. [Google Scholar] [CrossRef]
  47. Zhang, L.; Meng, X.; Wang, H.; Yang, M.; Cai, S. Investigate the Applicability of CMADS and CFSR Reanalysis in Northeast China. Water 2020, 12, 996. [Google Scholar] [CrossRef] [Green Version]
  48. Zhang, Q.; Li, Y.Q. Climate change characteristics of precipitation and rainy days in southwest China in the last 48 years. Highl. Meteorol. 2014, 2, 372–383. [Google Scholar]
  49. Zhao, J.; Chen, C. Geography of China; Higher Education Press: Beijing, China, 1999; 579p. [Google Scholar]
  50. Jie, Z. Research on Spatial Data Interpolation. Adv. Appl. Math. 2019, 8, 1859–1869. [Google Scholar]
  51. Li, H.; Chen, B.; Ding, Y.; Zhang, Z. Nearest Neighbor Data Correlation Algorithm Based on Information Entropy Weight. Syst. Eng. Electron. 2020, 42, 806–812. [Google Scholar]
  52. Yan, J.; Duan, X.; Zheng, W.; Liu, Y.; Deng, Y.; Hu, Z. An Adaptive IDW Algorithm Involving Spatial Heterogeneity. Geomat. Inf. Sci. Wuhan Univ. 2020, 45, 97–104. [Google Scholar]
  53. Guo, J.; Ding, G.; Yang, X.; Tang, Z.; Zhang, H.; Pan, R.; Dai, L. Comparison of spatial and temporal accuracy of multi-source satellite precipitation products in the Yangtze River Basin. South-Water Divers. Water Sci. Technol. (Engl. Chin.) 2022, 20, 230–242+252. [Google Scholar]
  54. Wang, Z.; Wang, Z.; Yang, Y.; Wu, Y. Comparative analysis of the applicability of remote sensing precipitation products and reanalysis precipitation products in Haihe River Basin under multiple time scales. Sci. Technol. Eng. 2021, 21, 2186–2193. [Google Scholar]
  55. Wu, Q.; Ma, S.; Zhang, Z.; Wang, G.; Zhang, S. Evaluation of nine precipitation products with ground-based measurements during 2001 to 2013 in alpine Upper Reach of Shule River Basin, northeastern edge of the Tibetan Plateau. Theor. Appl. Climatol. 2021, 144, 1101–1117. [Google Scholar] [CrossRef]
  56. Wu, Y.H.; Guo, L.N.; Zheng, H.X.; Zhang, B.; Li, M.R. Hydroclimate assessment of gridded precipitation products for the Tibetan Plateau. Sci. Total. Environ. 2019, 660, 1555–1564. [Google Scholar] [CrossRef] [PubMed]
  57. Dong, G.; Fan, D.; Yang, S.; Xue, H.; Zhou, J.; Dang, S.; Cheng, C. Applicability analysis of GPM and TRMM rainfall data in the Yellow River basin. Res. Soil Water Conserv. 2018, 25, 81–87. [Google Scholar]
  58. Duncan, J.M.; Biggs, E.M. Assessing the accuracy and applied use of satellite-derived precipitation estimates over Nepal. Appl. Geogr. 2012, 34, 626–638. [Google Scholar] [CrossRef]
  59. Omranian, E.; Sharif, H.O. Evaluation of the Global Precipitation Measurement (GPM) Satellite Rainfall Products over the Lower Colorado River Basin, Texas. J. Am. Water Resour. Assoc. (JAWRA) 2018, 54, 882–898. [Google Scholar] [CrossRef]
  60. Wu, H.; Liu, D.; Huang, Q.; Zheng, H.; Zou, H.; Ye, N.; Lin, M. Precision evaluation and alternative study of precipitation products in the Loess Plateau. J. Hydroelectr. Eng. 2021, 40, 31–40. [Google Scholar]
Figure 1. Distribution Map of the study area and ground precipitation station.
Atmosphere 14 00701 g001
Figure 2. Annual average precipitation variation from 2008–2018 for products and site data.
Atmosphere 14 00701 g002
Figure 3. Scatterplot of three precipitation products and station-measured annual precipitation.
Atmosphere 14 00701 g003
Figure 4. Box plots of statistical indicators for 3 sets of precipitation products in different seasons. The diamonds represent the minimum and maximum values and the small rectangles indicate the mean values.
Atmosphere 14 00701 g004
Figure 5. Comparison of the measured and monthly average precipitation results for each precipitation product in the study area.
Atmosphere 14 00701 g005
Figure 6. Radar chart of continuity evaluation indicators by month.
Atmosphere 14 00701 g006
Figure 7. Radar distribution of statistical indicators under different precipitation intensities.
Atmosphere 14 00701 g007
Figure 8. Frequency distribution of different precipitation intensities for different precipitation products.
Atmosphere 14 00701 g008
Figure 9. Spatial Distribution Map of (a) the Mean Annual Precipitation and Corresponding Precipitation Bias of the Three Products: (b) CMFD, (c) TRMM 3B42 and (d) CMADS.
Atmosphere 14 00701 g009
Figure 10. Distribution of the statistical indicators.
Atmosphere 14 00701 g010
Table 1. Average annual precipitation of sites for different provinces.
StationLongitude and LatitudeAverage Annual Precipitation/mm
Yuanjiang Station101.59° E, 23.36° N751.79
Panxian Station104.28° E, 25.43° N1242.79
Huili Station102.15° E, 26.39° N1096.85
Qianxi Station106.01° E, 27.02° N880.35
Hechi Station108.02° E, 24.42° N1501.97
Sinan Station108.15° E, 27.57° N1061.94
Yuanling Station110.24° E, 28.28° N1466.36
Badong Station110.22° E, 31.02° N1140.10
Table 2. Basic information table showing the meteorological precipitation data.
DatasetSpatial ResolutionTime ResolutionScopeTime RangeDownload Address
TRMM 3B420.25° × 0.25°Day60° N–60° S1998–2019https://disc.gsfc.nasa.gov (accessed on 1 April 2022)
CMFD0.1° × 0.1°DayChina1979–2018http://westdc.westgis.ac.cn (accessed on 1 April 2022)
CMADS V1.21/8° × 1/8°DayEastern Asia2008–2018http://www.cmads.org/ (accessed on 1 April 2022)
Table 3. Statistical metrics.
IndicatorsFormulasRange of ValuesOptimum Value (Units)
CCCC =  i = 1 N G i G ¯ P i P ¯ i = 1 N G i G ¯ 2 i = 1 N P i P ¯ 2 [−1, 1]1
RBIASRBIAS =  i = 1 N G i P i i = 1 N P i ( , + ) 0%
MAEMAE =  1 N i = 1 N G i P i [0, +)0 mm
KGEKGE = 1 R 1 2 + β 1 2 + γ 1 2 [0, +)1
PODPOD =  H H + M [0, 1]1
FARFAR =  F H + F [0, 1]0
CSICSI =  H H + M + F [0, 1]1
FBIASFBIAS = H + F H + M [0, 1]0
PDFPDF =  a b f x d x n a , b N [0, 1]1
G i is the precipitation product precipitation, G ¯ is the average value of the product precipitation, P i is the site precipitation, P ¯ is the average value of the site precipitation. σ G and σ P denote the standard deviations of the precipitation product and site precipitation, respectively. N is the number of samples. R is the Pearson coefficient value, β is the standard deviation of the product precipitation divided by the standard deviation of the site precipitation, γ is the average product precipitation divided by the average site precipitation. H indicates the number of precipitation events detected by the precipitation product and also recorded by the station, M indicates the number of precipitation events not detected by the precipitation product but recorded by the station, F indicates the number of precipitation events detected by the precipitation product but not recorded by the station, and n a , b indicates the number of days with precipitation between a and b.
Table 4. Precipitation occurrence event detection table.
Meteorological StationsPrecipitation Product
≥Threshold<Threshold
≥ThresholdHit (H)Miss (M)
<ThresholdFalse (F)Correct negatives (C)
Table 5. Values of statistical indicators at the yearly scale.
Precipitation ProductsCCRBIAS (%)MAE (mm)KGE
TRMM 3B420.833.90143.700.77
CMFD0.911.1496.480.90
CMADS V1.20.73−9.34197.060.70
Table 6. Evaluation indexes of the daily-scale precipitation accuracy for different precipitation products.
ProductCCRBIAS (%)MAE (mm)KGEPODFARCSIFBIAS
TRMM 3B420.1922.234.920.150.540.460.371.00
CMFD0.602.112.810.550.910.390.571.50
CMADS0.45−8.553.200.440.750.330.551.12
Table 7. Multiyear average deviation and maximum overestimation, low valuation, and corresponding sites in the study area for the three products.
ProductsAverage Bias of Products (mm)/
Measured Value (mm)
Maximum Overestimation (mm)/
Measured Value (mm)
Corresponding BiasCorresponding SiteMaximum Underestimation Value (mm)/
Measured Value (mm)
Corresponding BiasCorresponding Site
CMFD12.8/1125.4327.5/751.843.56%Yuanjiang Station−241.5/1096.922.01%Huili Station
TRMM 3B4243.9/1125.4447.5/751.859.55%Yuanjiang Station−263.5/1242.421.21%Panxian Station
CMADS105.1/1125.4404.4/751.853.79%Yuanjiang Station−463.4/1471.631.49%Simao Station
Disclaimer/Publisher’s Note: The statements, opinions and data contained in all publications are solely those of the individual author(s) and contributor(s) and not of MDPI and/or the editor(s). MDPI and/or the editor(s) disclaim responsibility for any injury to people or property resulting from any ideas, methods, instructions or products referred to in the content.

