

Trends and Features of Thunderstorms and Lightning Activity in the Upper Volga Region
by
 , , , and
Svetlana Dementyeva
1,*,
Maria Shatalina
1,2,
Alena Popykina
1,
Fedor Sarafanov
1,2,
Mikhail Kulikov
1,2 and
Evgeny Mareev
1 1
Geophysical Research Department, Institute of Applied Physics of the Russian Academy of Sciences, Nizhny Novgorod 603950, Russia
2
Laboratory of Integrated Systems for Diagnostics of the Atmosphere and Hydrosphere, Lobachevsky State University of Nizhni Novgorod, Nizhny Novgorod 603950, Russia
*
Author to whom correspondence should be addressed.
Atmosphere 2023, 14(4), 674; https://doi.org/10.3390/atmos14040674
Submission received: 28 February 2023
/
Revised: 27 March 2023
/
Accepted: 30 March 2023
/
Published: 2 April 2023
(This article belongs to the Special Issue Future Trends of Our Atmospheric Electric Environments)
Abstract
:An increase in the frequency of atmospheric hazards in a changing climate has attracted interest in the study of regional features of mesoscale convective systems and trends of lightning activity. Severe convective storms are the most destructive weather events causing substantial damage and fatalities. In this paper, we analyze general trends in the lightning activity in the Upper Volga region and identify the particular features of a severe thunderstorm on 13–14 July 2020. The analysis of the annual variability of the lightning activity in the Upper Volga region, carried out according to the World-Wide Lightning Location Network (WWLLN) data, has shown that the total number of discharges during the convective seasons of 2016–2021 increased. For the convective season of 2020, the daily number of discharges in the neighborhood of Nizhny Novgorod (the center of the region) is calculated according to the WWLLN data and the electric field mill (EFM) measurements. It is revealed that the most powerful (per convective season) thunderstorms have a number of similarities both according to observations and numerical simulation. The thunderstorm on 13–14 July was numerically simulated using the Weather Research and Forecasting (WRF) model in combination with calculations of the electric parameters (such as electric potential and intracloud electric field). The simulations were carried out using two parametrizations of microphysical processes to reveal the features associated with allowance for aerosol particles. The data from the meteorological radar and WWLLN were used to validate the radar reflectivity simulation results of the WRF model. Some features of the thunderstorm evolution characteristic for each of the microphysical parametrizations were identified. In general, the non-aerosol parametrization gives a more correct description of the development of severe thunderstorms in the Upper Volga region (with the exception of the final stage of the convective system development). For a convective event to have the required duration (more than 6 h), aerosol particles should be taken into account.
1. Introduction
Presently, much attention is paid to the study of the regional features of mesoscale convective systems and trends of lightning activity. This is due to an increase in the frequency of atmospheric hazards in a changing climate [1,2]. Severe convective storms are destructive weather events that cause substantial damage and fatalities, which are commonly observed in different parts of the world [3,4].
Thunderstorms themselves influence the climate system via the redistribution of heat, moisture, and momentum in the atmosphere [5]. The formation of thunderclouds is accompanied by electrification processes, which give rise to lightning discharges. Lightning is a major hazard to the public, nature, aviation, and power companies that causes great damage and death.
The prediction of thunderstorms and their characteristics remains one of the most difficult problems in modern weather forecasting. The need to develop short-term forecasting systems in the territory of Russia is explained by an increase in convective precipitation, which has been observed in Russian regions over the last 50 years [6]. Moreover, Chernokulsky et al. [7] predict that the risk of severe convective events will continue to rise in the 21st century.
Various instability indices are used to forecast convection-driven hazardous weather events and thunderstorm activity [8,9,10,11]. There are also methods for identifying thunderclouds using meteorological radar products, which are based on counting cells with certain parameters (primarily radar reflectivity) as indicators of thunderstorms (see, for example, [12,13,14,15,16]). Such indicators, as a rule, are quite sensitive to regional climatic and geographical features, as well as to the equipment used; therefore, their use requires adjustment for a specific region and equipment. One of the most common methods for predicting local atmospheric phenomena is numerical mesoscale modeling (see, for example, [17,18,19]). Analyzing the microphysical and electric parameters of thunderclouds obtained through numerical simulations and field observations is a key factor in improving the prediction capabilities of a system with strong convection.
The presence of aerosol particles affects the microphysical and electrical parameters of convective systems. As cloud condensation nuclei lift up to the mixed-phase region, more liquid water is formed and, hence, more ice-phase particles are produced, which impacts charge separation and lightning activity (see, for example, [17,20,21]. Based on the Weather Research and Forecasting (WRF) model simulations, Khain et al. [22] demonstrated that accumulated aerosols acting as cloud condensation nuclei lead to an increase in the number of cloud droplets and the release of latent heat. The study of aerosol effects, both in individual convective events and climate trends, has recently received increased attention (see, for example, [23,24,25,26]). An increase in the growth rate of snow and graupel and, as a result, an intensification of electric processes due to an increased aerosol load were shown in [19]. In addition, Zhao et al. [27] pointed to the correlation between the concentration of sulfates and lightning activity in the plateau and basin regions of Sichuan (China). Some observational studies demonstrated the impact of increased cloud condensation nuclei on lightning activity (see, for example, [28,29]).
Sun et al. [30] noted a need to carry out numerical experiments aimed at studying the effect of aerosols acting as ice nuclei on lightning activity. Zheng et al. [31] pointed out that the characteristics of lightning activity in severe thunderstorms are different from those in regular thunderstorms. For this reason, a detailed study of the characteristics of individual powerful thunderstorm events is of great interest.
In this paper, we analyze the number and characteristics of the thunderstorms during the convective season of 2020 in the Upper Volga region, which encompasses the majority of the Nizhny Novgorod region, using data from the World-Wide Lightning Location Network (WWLLN) and electric field mill (EFM) measurements; identify the most powerful convective event; and study its characteristics using numerical modeling, meteorological radar observations, WWLLN data, and electric field mill measurements. Thus, the purpose of this work is to find general trends in the lightning activity and particular features of thunderstorm formation in the Upper Volga region.
2. Materials and Methods
The primary focus of this work is the study of thunderstorms observed during the 2020 convective season over the Upper Volga region (with the center in Nizhny Novgorod) and the most powerful convective event of this season. The analysis of the convective season as a whole focuses on identifying the powerful thunderstorm events and determining their characteristics and general trends. The analysis of the most powerful thunderstorm is based on the use of a wide range of experimental and numerical tools to study the characteristics and features of the convective system’s development.
2.1. Weather Archive Data
The general meteorological situation in the area under consideration was analyzed by the open-access data from the <<rp5>> weather archive [32] at the meteorological station <<Nizhny Novgorod>> (56.32 N, 44.00 E) from April to September 2020. The following parameters were analyzed (all of them were measured every 3 h): air temperature and relative humidity at a height of 2 m above the ground; wind direction and speed at a height of 10–12 m, averaged over a 10-min period; current meteorological events and weather in the previous 3 h; total cloudiness; height of the cloud base; and precipitation rate. The performed analysis made it possible to identify thunderstorm events during the convective season and also to determine their approximate duration and the accompanying meteorological conditions.
2.2. Meteorological Radar
We used data from the Doppler meteorological radar <<DMRL-C>> located on the roof of the <<Oka>> hotel 56.29 N, 43.98 E (see Figure 1, right panel). The radar’s area of view is 11 km in height and 250 km in radius from the observation point. The DMRL-C scans the atmosphere with a time resolution of 10 min and provides primary measurements such as the radar reflectivity of the vertical and horizontal polarizations, the linear depolarization ratio, the radial velocity, the width of the Doppler spectrum of radial velocity, and other measurements typical of radars. At a peak radiated power of 15 kW, the maximum dynamic range of each polarization was not less than 100 dB [33].
In this study, we used only the radar reflectivity Z measured in decibels (dBZ). The radar reflectivity was determined on a 3D grid with a vertical step of 1 km and a horizontal step of 4 km, i.e., each grid cell has a size of km.
2.3. Electric Field Measurements
Multipoint long-term measurements of the atmospheric electric potential gradient have been conducted in Nizhny Novgorod since 2012. Figure 1 (right panel) shows a layout of the measurement points in Nizhny Novgorod: the electric field mill Boltek EFM-100 [34] installed on the roof of the IAP RAS 561925 N, 440121 E, and the meteorological radar installed on the roof of the <<Oka>> hotel for electromagnetic field reception and recording in the territory of Nizhny Novgorod. The Boltek EFM-100 is used for recording the electric field and has an exact reference to UTC time, which enables joint analysis with other time series, for example, themeasurements of global lightning detection networks. The rated discretization frequency of measurements and the sensitivity of the EFM amount to 20 Hz and ±80 kV/m, respectively.
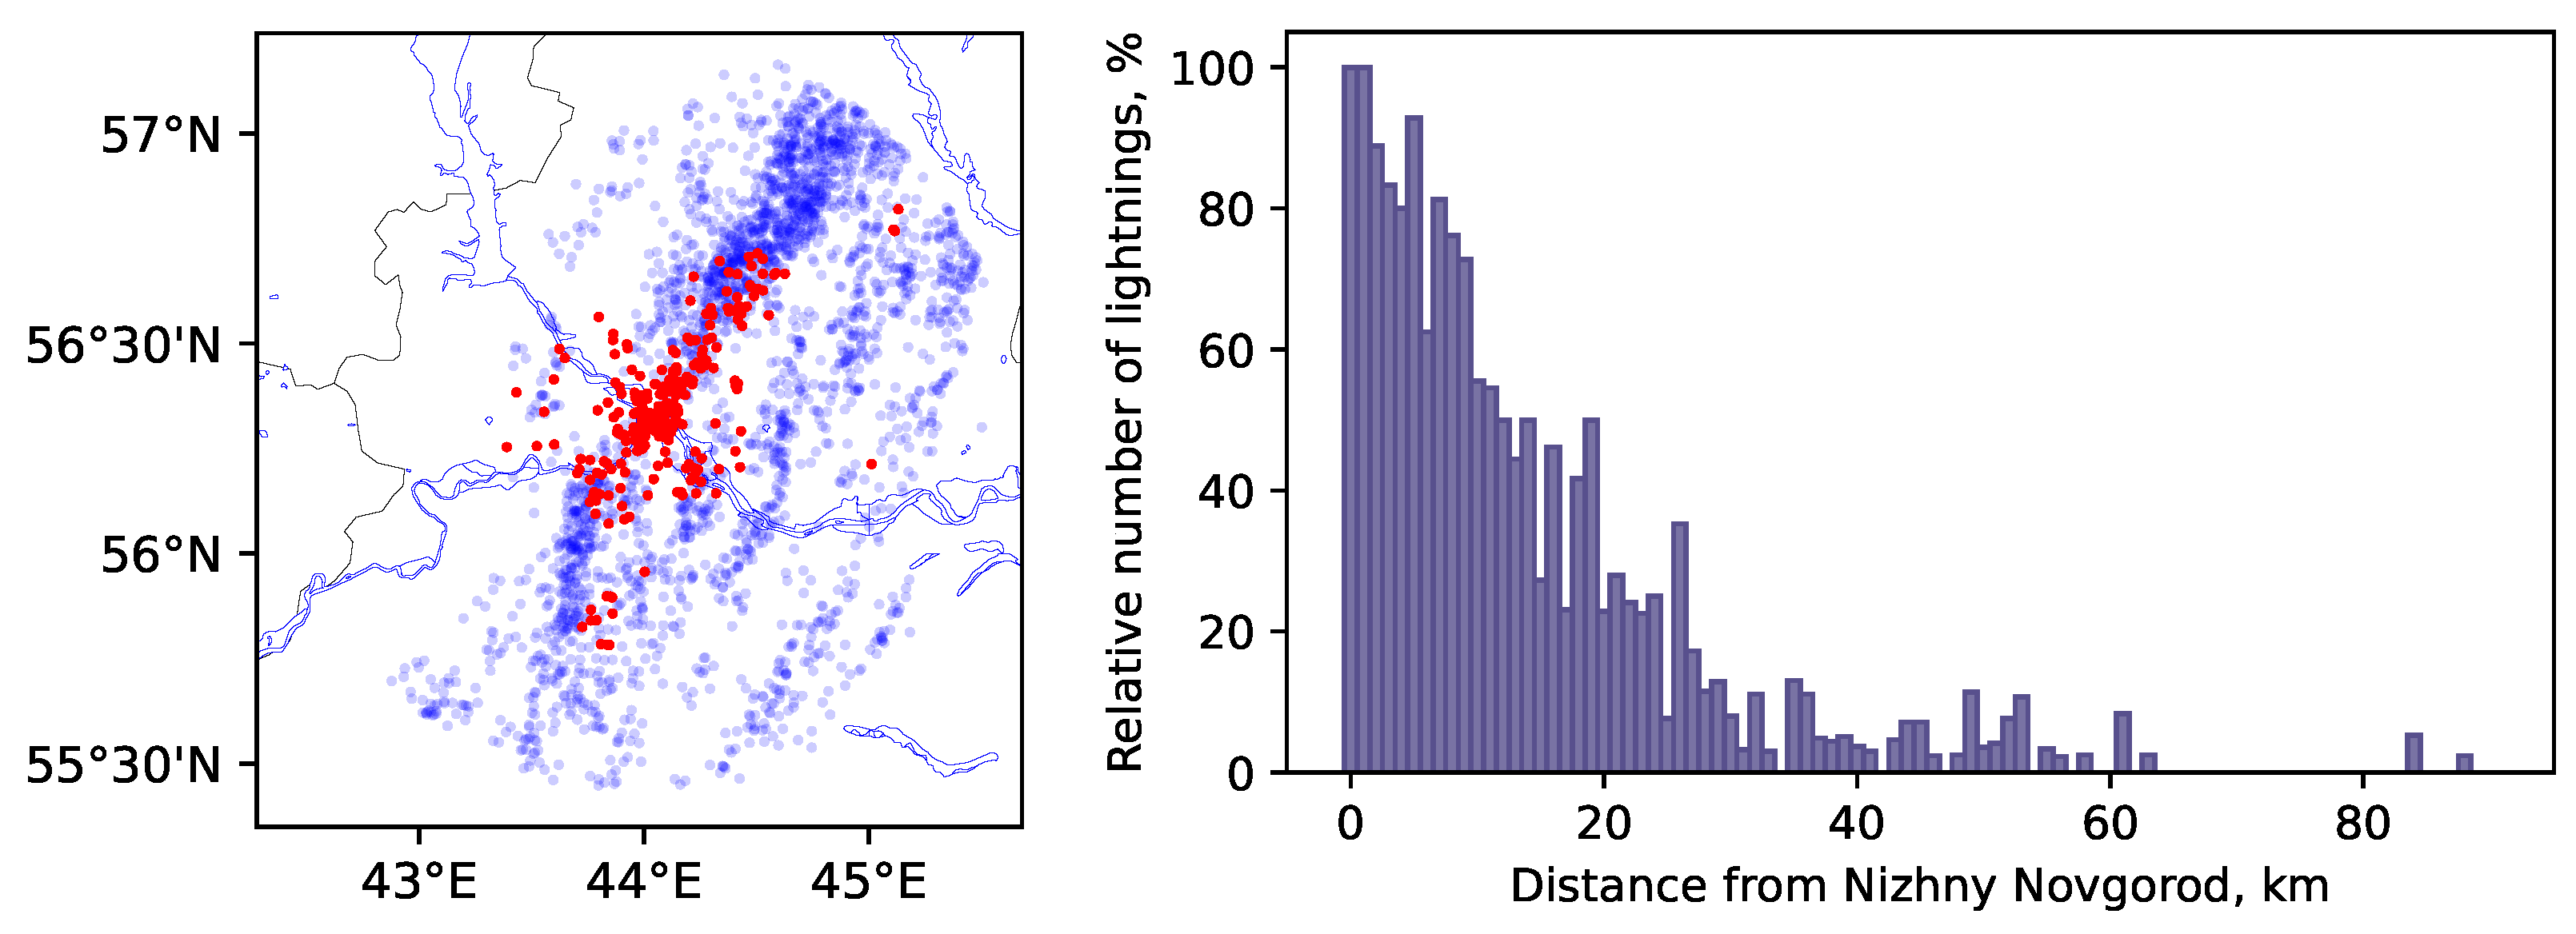
The efficiency of the tool is illustrated in Figure 2 using the lightning activity in the Nizhny Novgorod region on 13–14 July 2020 as an example. All lightning events detected by the WWLLN within a radius of 100 km from the observation point are shown in the left panel by the blue color. The discharges that coincided in time with the discharges determined according to the EFM measurements are marked by the red color. The ratio of the number of lightning events registered by both the EFM and WWLLN to the number of all lightning events detected by the WWLLN is demonstrated in the right panel. Figure 2 confirms the EFM documentation [34], which states that the maximum radius for detecting lightning is 38 km.
The continuous atmospheric electric potential gradient records are interesting from the viewpoint of thunderstorm climatology. The comparative analysis of the thunderstorm electricity observation results and the meteorological data are also of great significance. Electrostatic fluxmeter data records allowed us to evaluate the number of discharges by a fairly simple calculation method using the specified threshold of the leap of the filtered electric field strength derivative [35]. First, the signal was filtered to extract the high-frequency component, and then the discharge itself was separated. A set of the following conditions was taken as the discharge criterion: (1) more than 0.8 s elapsed from the last detected discharge, (2) the time-dependence sharpness of the field intensity did not exceed 5 kV/(m·s) for 0.1 s before the assumed discharge time, and (3) the field intensity varied by more than 1.5 kV/m for 0.25 s from the assumed discharge time. The criteria were selected taking into account local characteristics using the long-term observations potential gradient database and verified using DMRL-C records and lightning-direction-finding data.
2.4. Lightning Data
We use observational lightning data from the World-Wide Lightning Location Network [36]. This network provides information about thunderstorm activity over the entire globe by registering the electromagnetic signals from thunderstorms in the VLF range (3–30 kHz). Currently, it consists of more than 60 detectors, including those in Russia. According to various studies, the network provides an opportunity to localize lightning discharges on a global scale with a high spatial resolution and makes it possible to obtain estimates of the spatial and temporal variability of lightning activity for any region of the planet. The lightning data contain the location, time of discharge, time uncertainty, energy of the strike, energy uncertainty, and the number of stations that have recorded the discharge.
For our research, the WWLLN data for the internal domain of the simulations are analyzed. The number of lightning strikes is summed up over km squares every 3 h. To analyze lightning activity during the convective season, the distribution of the number of discharges per day in the area under consideration is plotted vs. the time. To analyze the lightning activity of an individual convective event, we consider the time dependence of the number of discharges summed over 10 min.
2.5. Numerical Simulation
The numerical modeling is based on the Weather Research and Forecasting (WRF) model [37,38]. It is a collaborative project designed for the development of a mesoscale weather forecasting model to gain better insight into mesoscale weather-related processes. The WRF model includes many parametrizations, including the parametrizations of cloud physics, radiation, microphysical processes, the planetary boundary layer, and the underlying surface. Thus, the WRF model is suitable for numerical weather prediction and atmospheric modeling in various research and practical tasks from small-scale to global modeling.
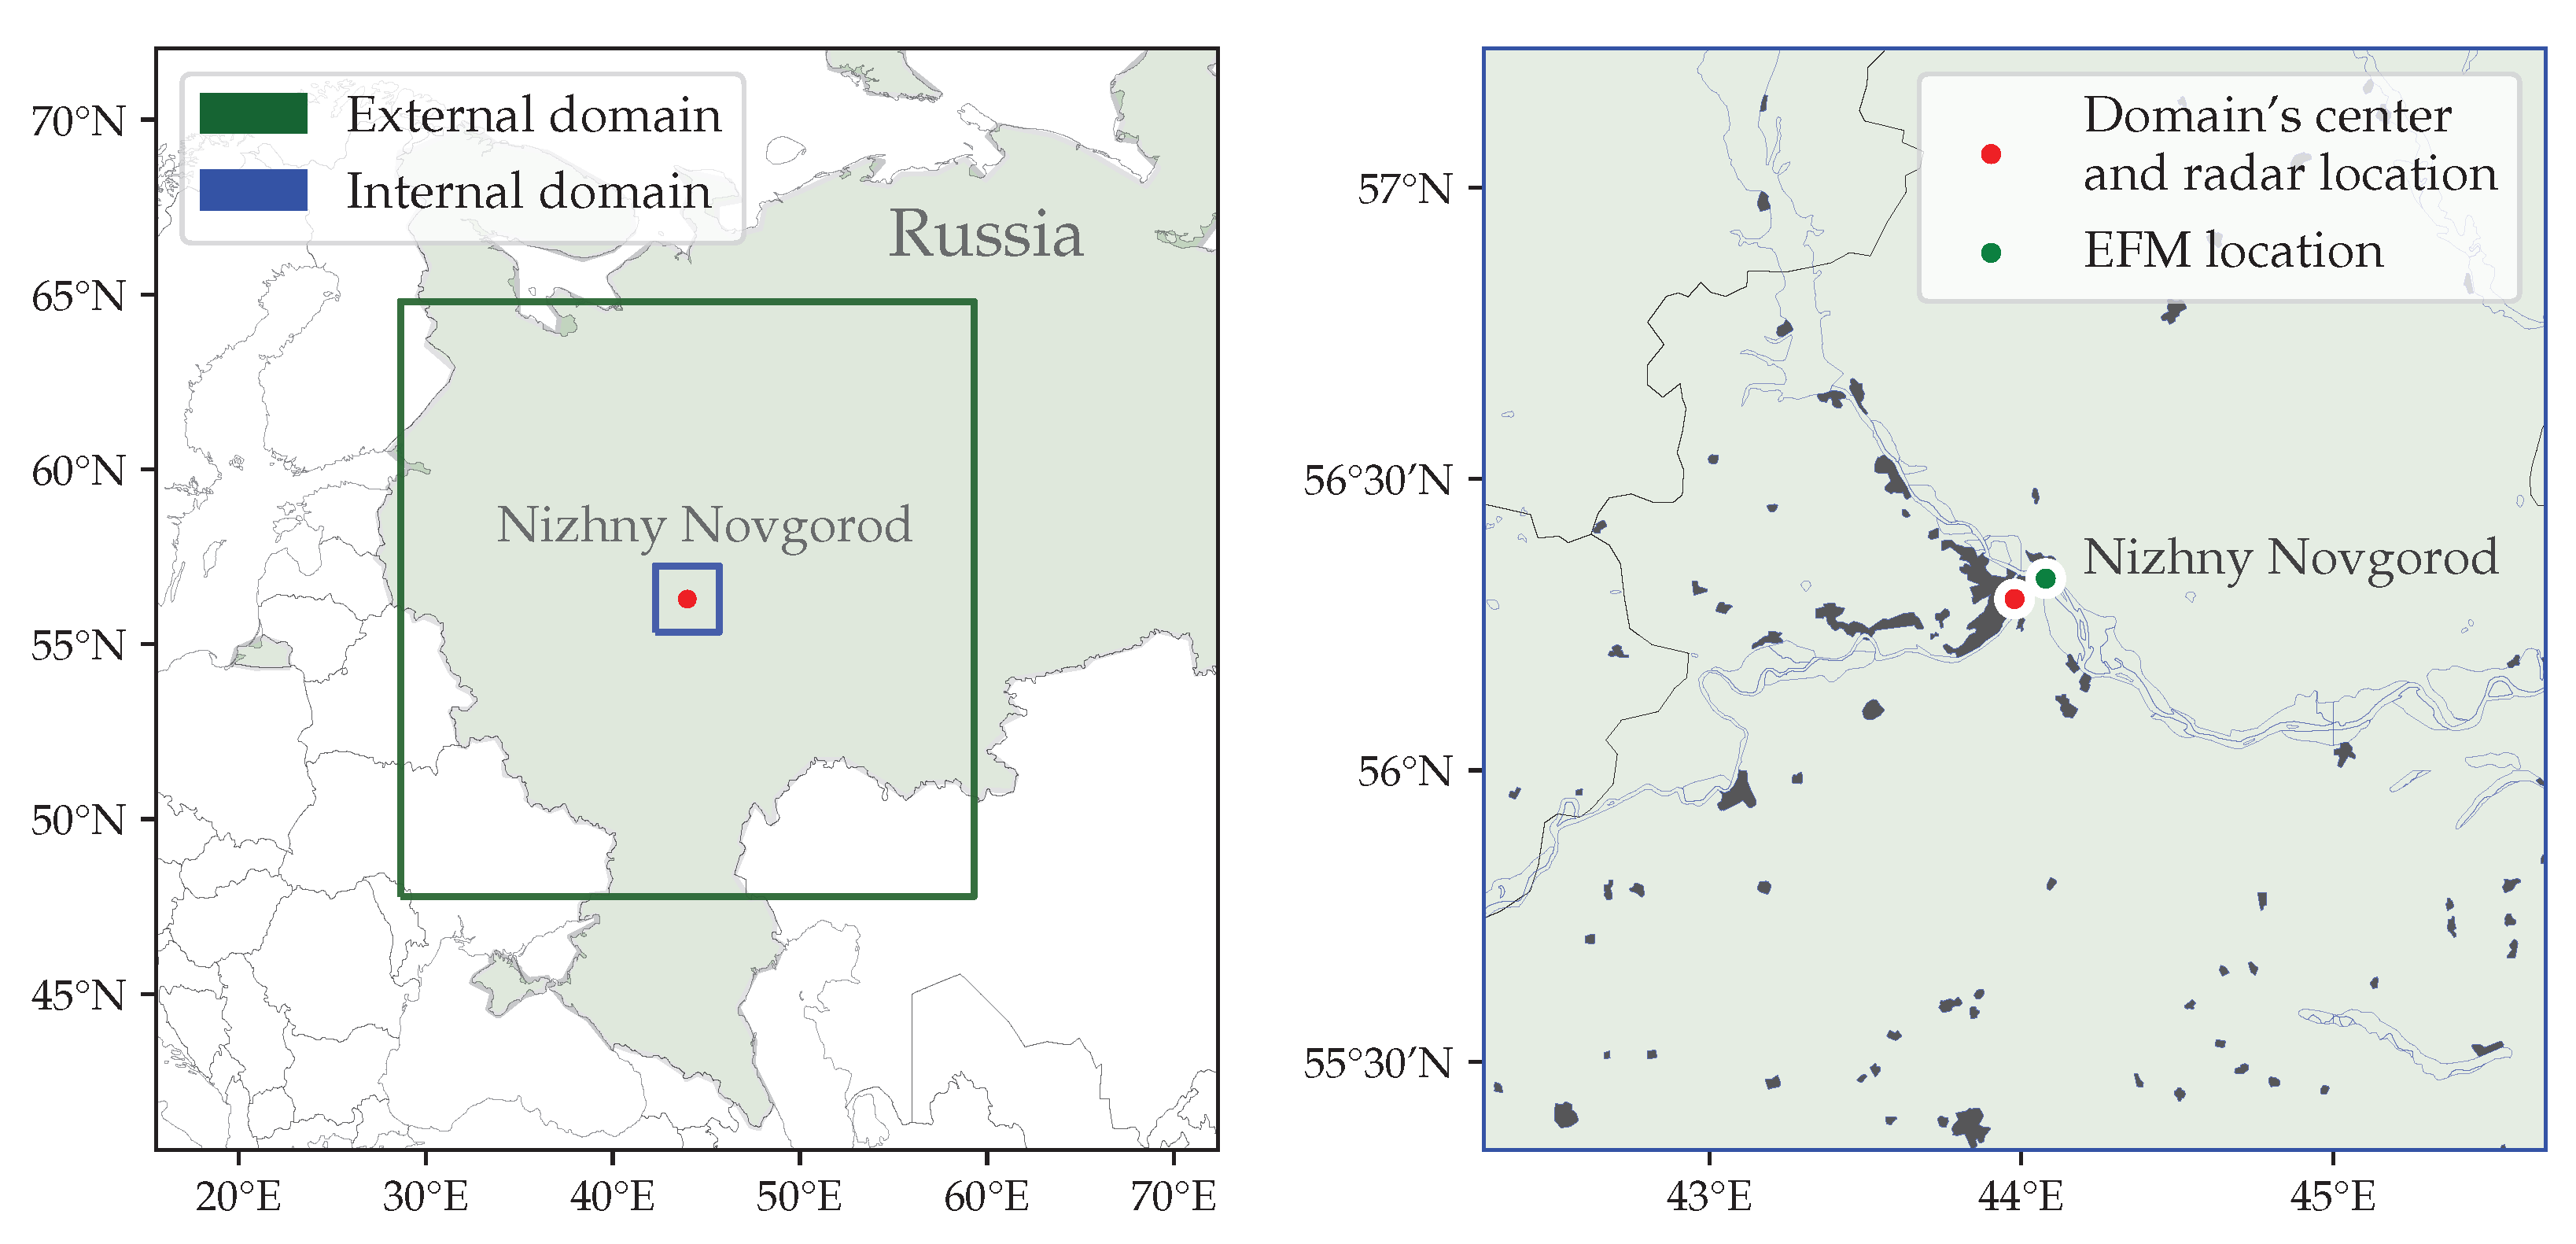
The numerical simulation was performed on two nested domains: the 1890 km × 1890 km external domain with a horizontal grid spacing of 3 km and the 210 km × 210 km internal domain with a horizontal grid spacing of 1 km. The center of the computational area is chosen to coincide with the location of the Nizhny Novgorod aerological station (56.29 N, 43.98 E), equipped with a meteorological radar and involved in monitoring the state of the atmosphere. The internal domain in this work is used as the area under consideration unless otherwise noted.
The computational domains used to simulate the thunderstorms in the Nizhny Novgorod region are shown in Figure 1 (left panel). The area outlined in green corresponds to the external domain, and the area outlined in blue to the internal domain. The vertical grid contains 40 levels from 0 to 20 km. The calculations were made for 36 h, with the start time such that the thunderstorms did not fall into the model’s adjustment period to the initial conditions. For each convective event, the start time of the calculation was set as a standard meteorological hour that is at least 6 h before the beginning of the thunderstorm.
Two types of Thompson’s microphysical parametrizations were used in the numerical simulations by the WRF-ARW model for studying the impact of aerosols on thundercloud development. The first of them [39] described only solid hydrometeors, which include graupel, snow, and ice. The second parametrization [24] also took into account the presence of aerosol particles in the atmosphere. In this parametrization, the initial distributions of the aerosol mass mixing ratios are taken from multi-year global model simulations by the Goddard Chemistry Aerosol Radiation and Transport (GOCART) model [40]. We use background mass mixing ratios from the GOCART model as the initial distribution of aerosols in our research.
Since a rather weak instantaneous correlation between the simulation and the observational data is obvious, in this paper, we propose visualizing the characteristics of a thunderstorm using a function that best resembles the trace of a cloud (such as the trace that a tornado leaves behind). This function corresponds to the 2D horizontal distribution of the maximum value of the parameter in the vertical column for the selected time interval. In this paper, we use 3 h observation intervals with the initial times at 0, 3, 6, 9, 12, 15, 18, and 21 UTC.
2.6. Electric Parameters Calculation
The electric potential and electric field are the parameters of thunderclouds that directly affect the occurrence of electric discharges and lightning activity. For a detailed analysis of the features of a convective event’s development, the electric parameters of the clouds are calculated. The parametrization of the electric processes described in [41] is used in this work to calculate the electric parameters of thunderstorms.
This parametrization is based on the assumption of non-inductive charging of solid hydrometeors. The main charge-transfer particles are small ice particles and graupel pellets [42]. The electric charge accumulated on snow particles is much less than on ice crystals or graupel pellets [43]; therefore, it is not considered as a charge carrier in this work. The reversal temperature is assumed to be equal to −15 C. The ice particles have a negative charge and the graupel pellets have a positive charge up to the reverse point and vice versa above it. The spatial distribution of the electric charge at each time step is calculated from the hydrometeors mixing ratios. It is supposed that the charge density of each type of hydrometeor is proportional to the mass per unit volume of these hydrometeors:
where is the mixing ratio of the graupel and ice particles (in g·g), is their maximum value, is the maximum charge that can accumulate on a graupel pellet (in C), and is the maximum graupel concentration (in m). It is also assumed that charge separation occurs mainly due to collisions of solid hydrometeors in vertical air flows; therefore, is the coefficient (in C·m) that is found from the condition of general electric neutrality in a vertical column where charge separation occurs. The maximum charge on the graupel is taken to be equal to C, while the maximum graupel concentration is assumed to be 200 m [44].
The temporal resolution of the WRF output data is 10 min, which allows us to consider the pattern of the electric processes at each time step to be a quasi-static one. To calculate the electric potential , the three-dimensional Poisson equation is solved:
where is the electric charge density, which is the sum of the charge densities on the graupel and ice particles, and is the vacuum permittivity.
The electric field at each grid point is defined as the electric potential gradient with an opposite sign:
The discharge processes are not directly included in the description of the electric processes in thunderclouds. However, the growth of the electric field strength is limited by the maximum electric charge density on the particles. It should also be noted that due to the coarse spatiotemporal resolution (compared to the field measurements), the obtained distributions of the electric parameters are averaged.
3. Results
3.1. General Patterns of Lightning Activity in the Convective Season of 2020
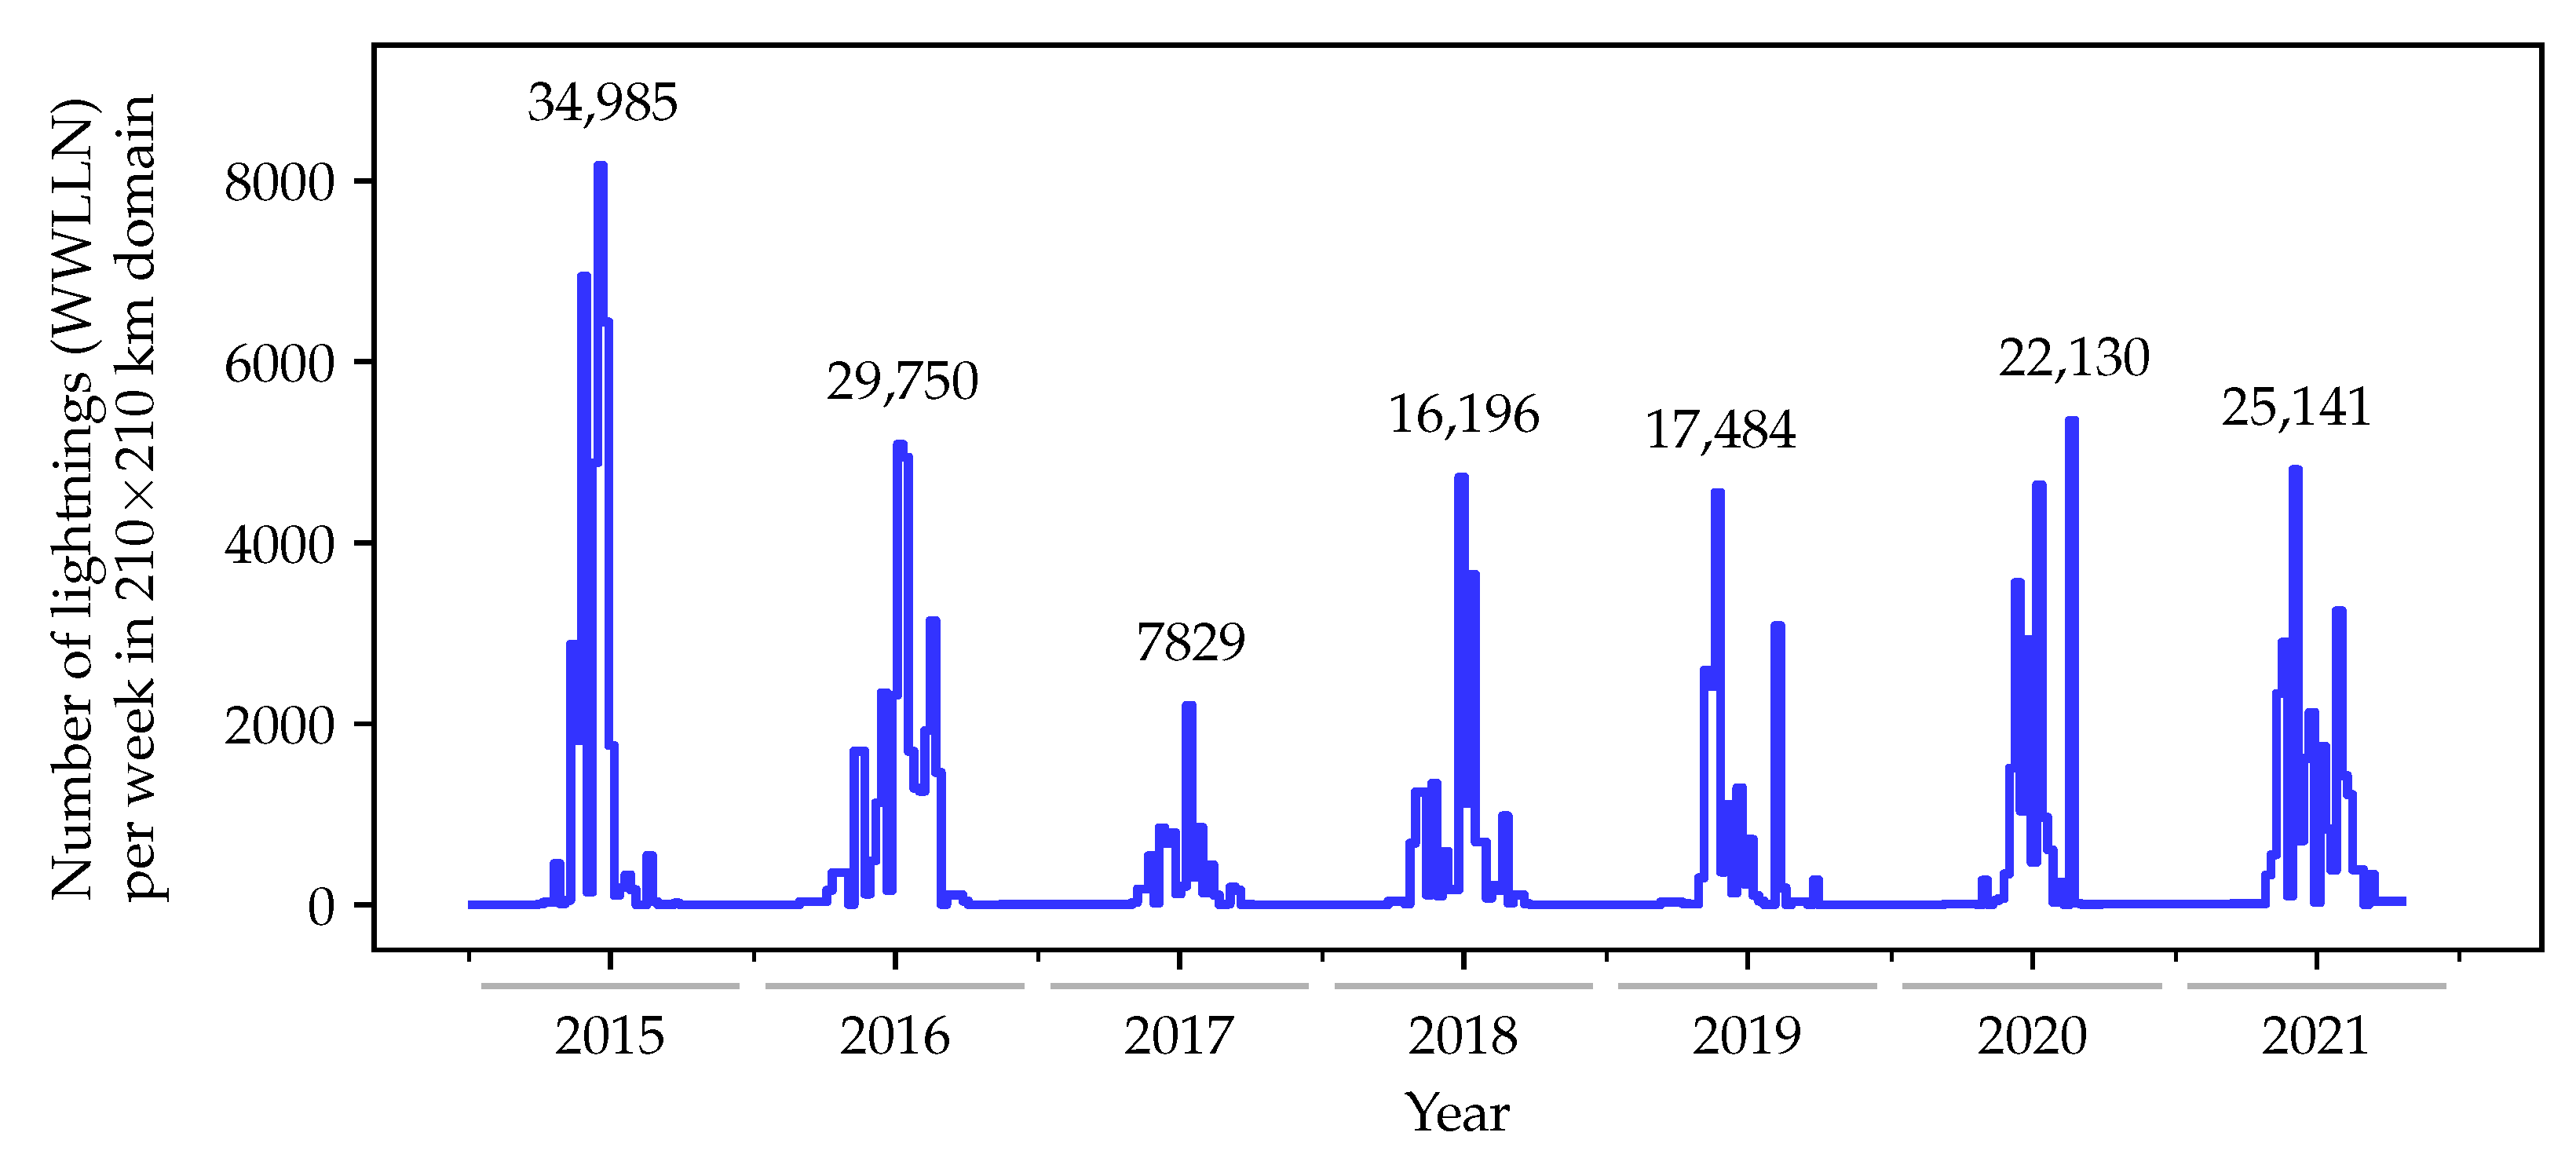
The previous studies revealed that about 34 convective events (including several severe thunderstorms) in Nizhny Novgorod occur annually [45]. The most powerful and prolonged thunderstorms are usually intra-mass ones and come from the southern direction. Such thunderstorms are characterized by a long duration (sometimes more than 6 h) and continuous lightning activity, while the number of lightning discharges can reach 1500. The year-by-year trend of lightning activity in the investigated domain is shown in Figure 3. The total number of detected lightning events for each year is labeled on the chart. The relatively low thunderstorm activity of 2016 is explained by the cold summer (the average air temperature did not exceed 13.7 C [32]). It can be seen that since 2016 the annual number of lightning events has been monotonically increasing.
The number of WWLLN stations increased from 58 to 63 during 2015–2020. Until 2014, the total number of global lightning strikes registered by the WWLLN and the number of active WWLLN stations varied proportionally. After 2014, the changes in the number of strikes and the number of stations are hardly related (see, for example, [46,47]). The global amount of lightning has changed little from 2014 to 2020, except for a decline of about 10% in 2016–2017 [47]. At the same time, the trend of lightning activity in the Upper Volga region has differences. There is a big drop in the amount of lightning in 2017 only, and, since then, the amount of lightning has only increased. Therefore, the trend shown in this work cannot be associated with the WWLLN accuracy.
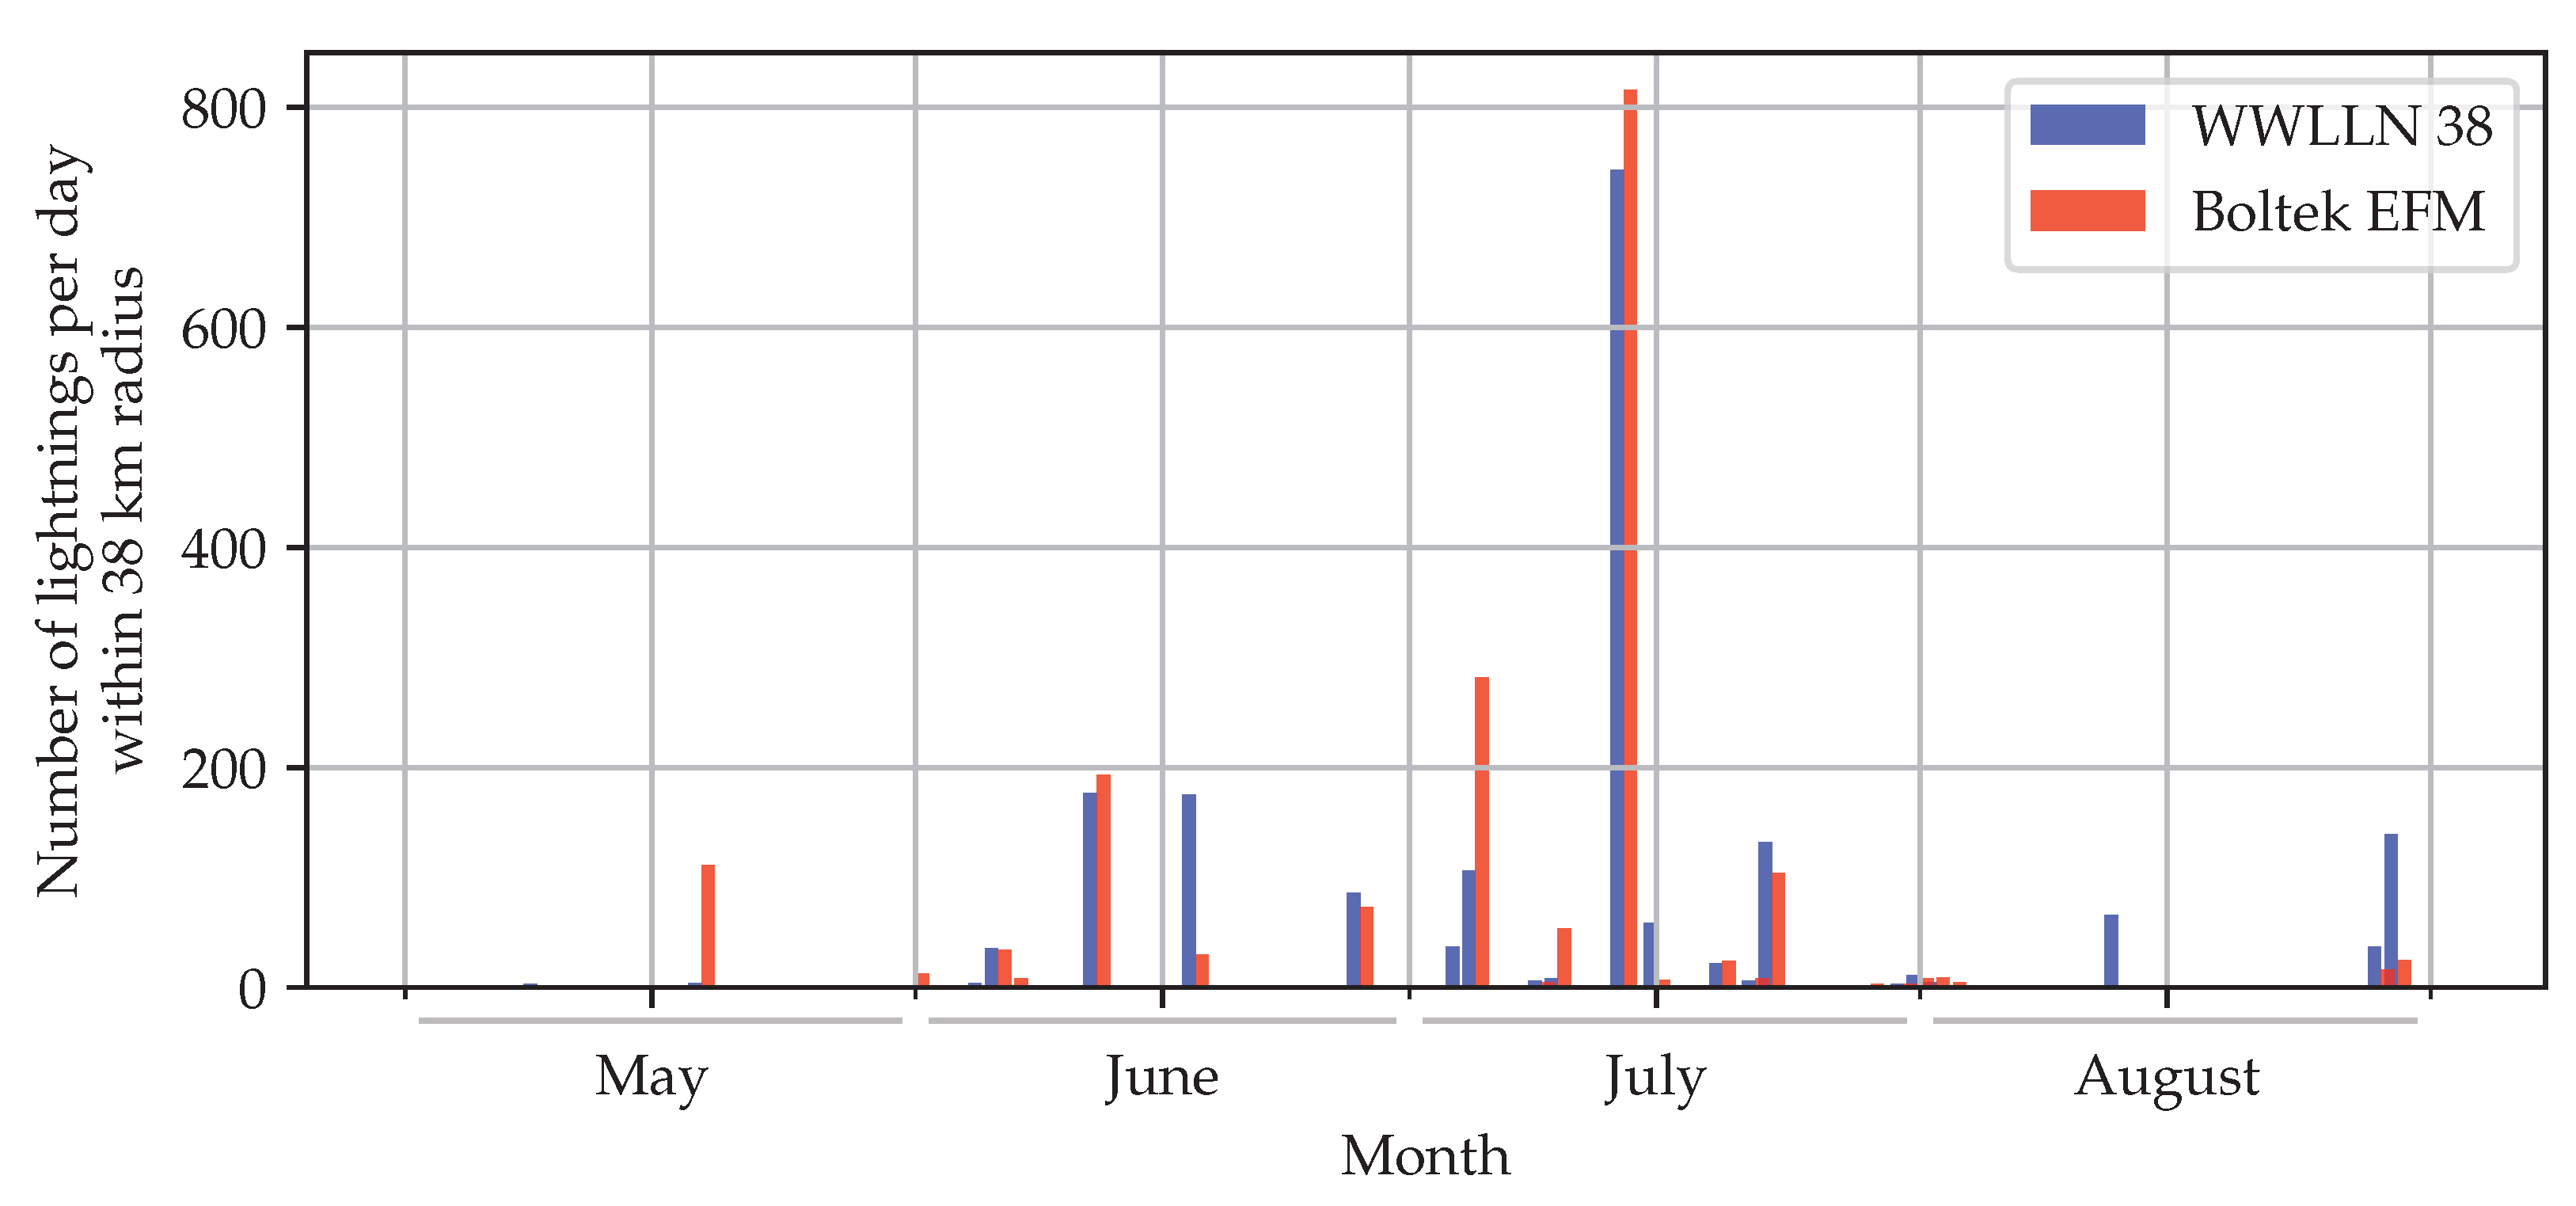
Figure 4 shows the number of lightning discharges in the convective season of 2020, registered using the WWLLN and EFM. The presented WWLLN data have been selected for an area with a radius of 38 km around the observation point (the radius was chosen according to the Boltek EFM Operators Guide [34]).
Noticeable differences for some thunderstorms in favor of a particular measurement method can be explained by restrictions on measuring instruments, as well as the features of convective events. According to the weather archive data, there were 15 thunderstorms over Nizhny Novgorod in May–August 2020, which correlates well with the presented data from the WWLLN and Boltek EFM. The most powerful thunderstorm in the 2020 convective season was observed on 13–14 July. In Figure 4, this convective event is distinguished by sharp peaks.
3.2. Features of Development and Electrification of Thunderstorm on 13–14 July 2020
Weather archive. According to the weather archive data, a thunderstorm was observed at the Nizhny Novgorod meteorological station from 12:00 to 03:00 (+1) UTC (15:00–06:00 (+1) LT). Before the thunderstorm, the air temperature was moderate (up to 22.5 C), the humidity was 65–70%, the east wind, the wind speed was 2 m/s, and the cloud base height was low (300–600 m). During the thunderstorm, the wind subsided to 1 m/s, the height of the cloud base did not change, the temperature dropped slightly to 18 C, and the humidity increased to 98%.
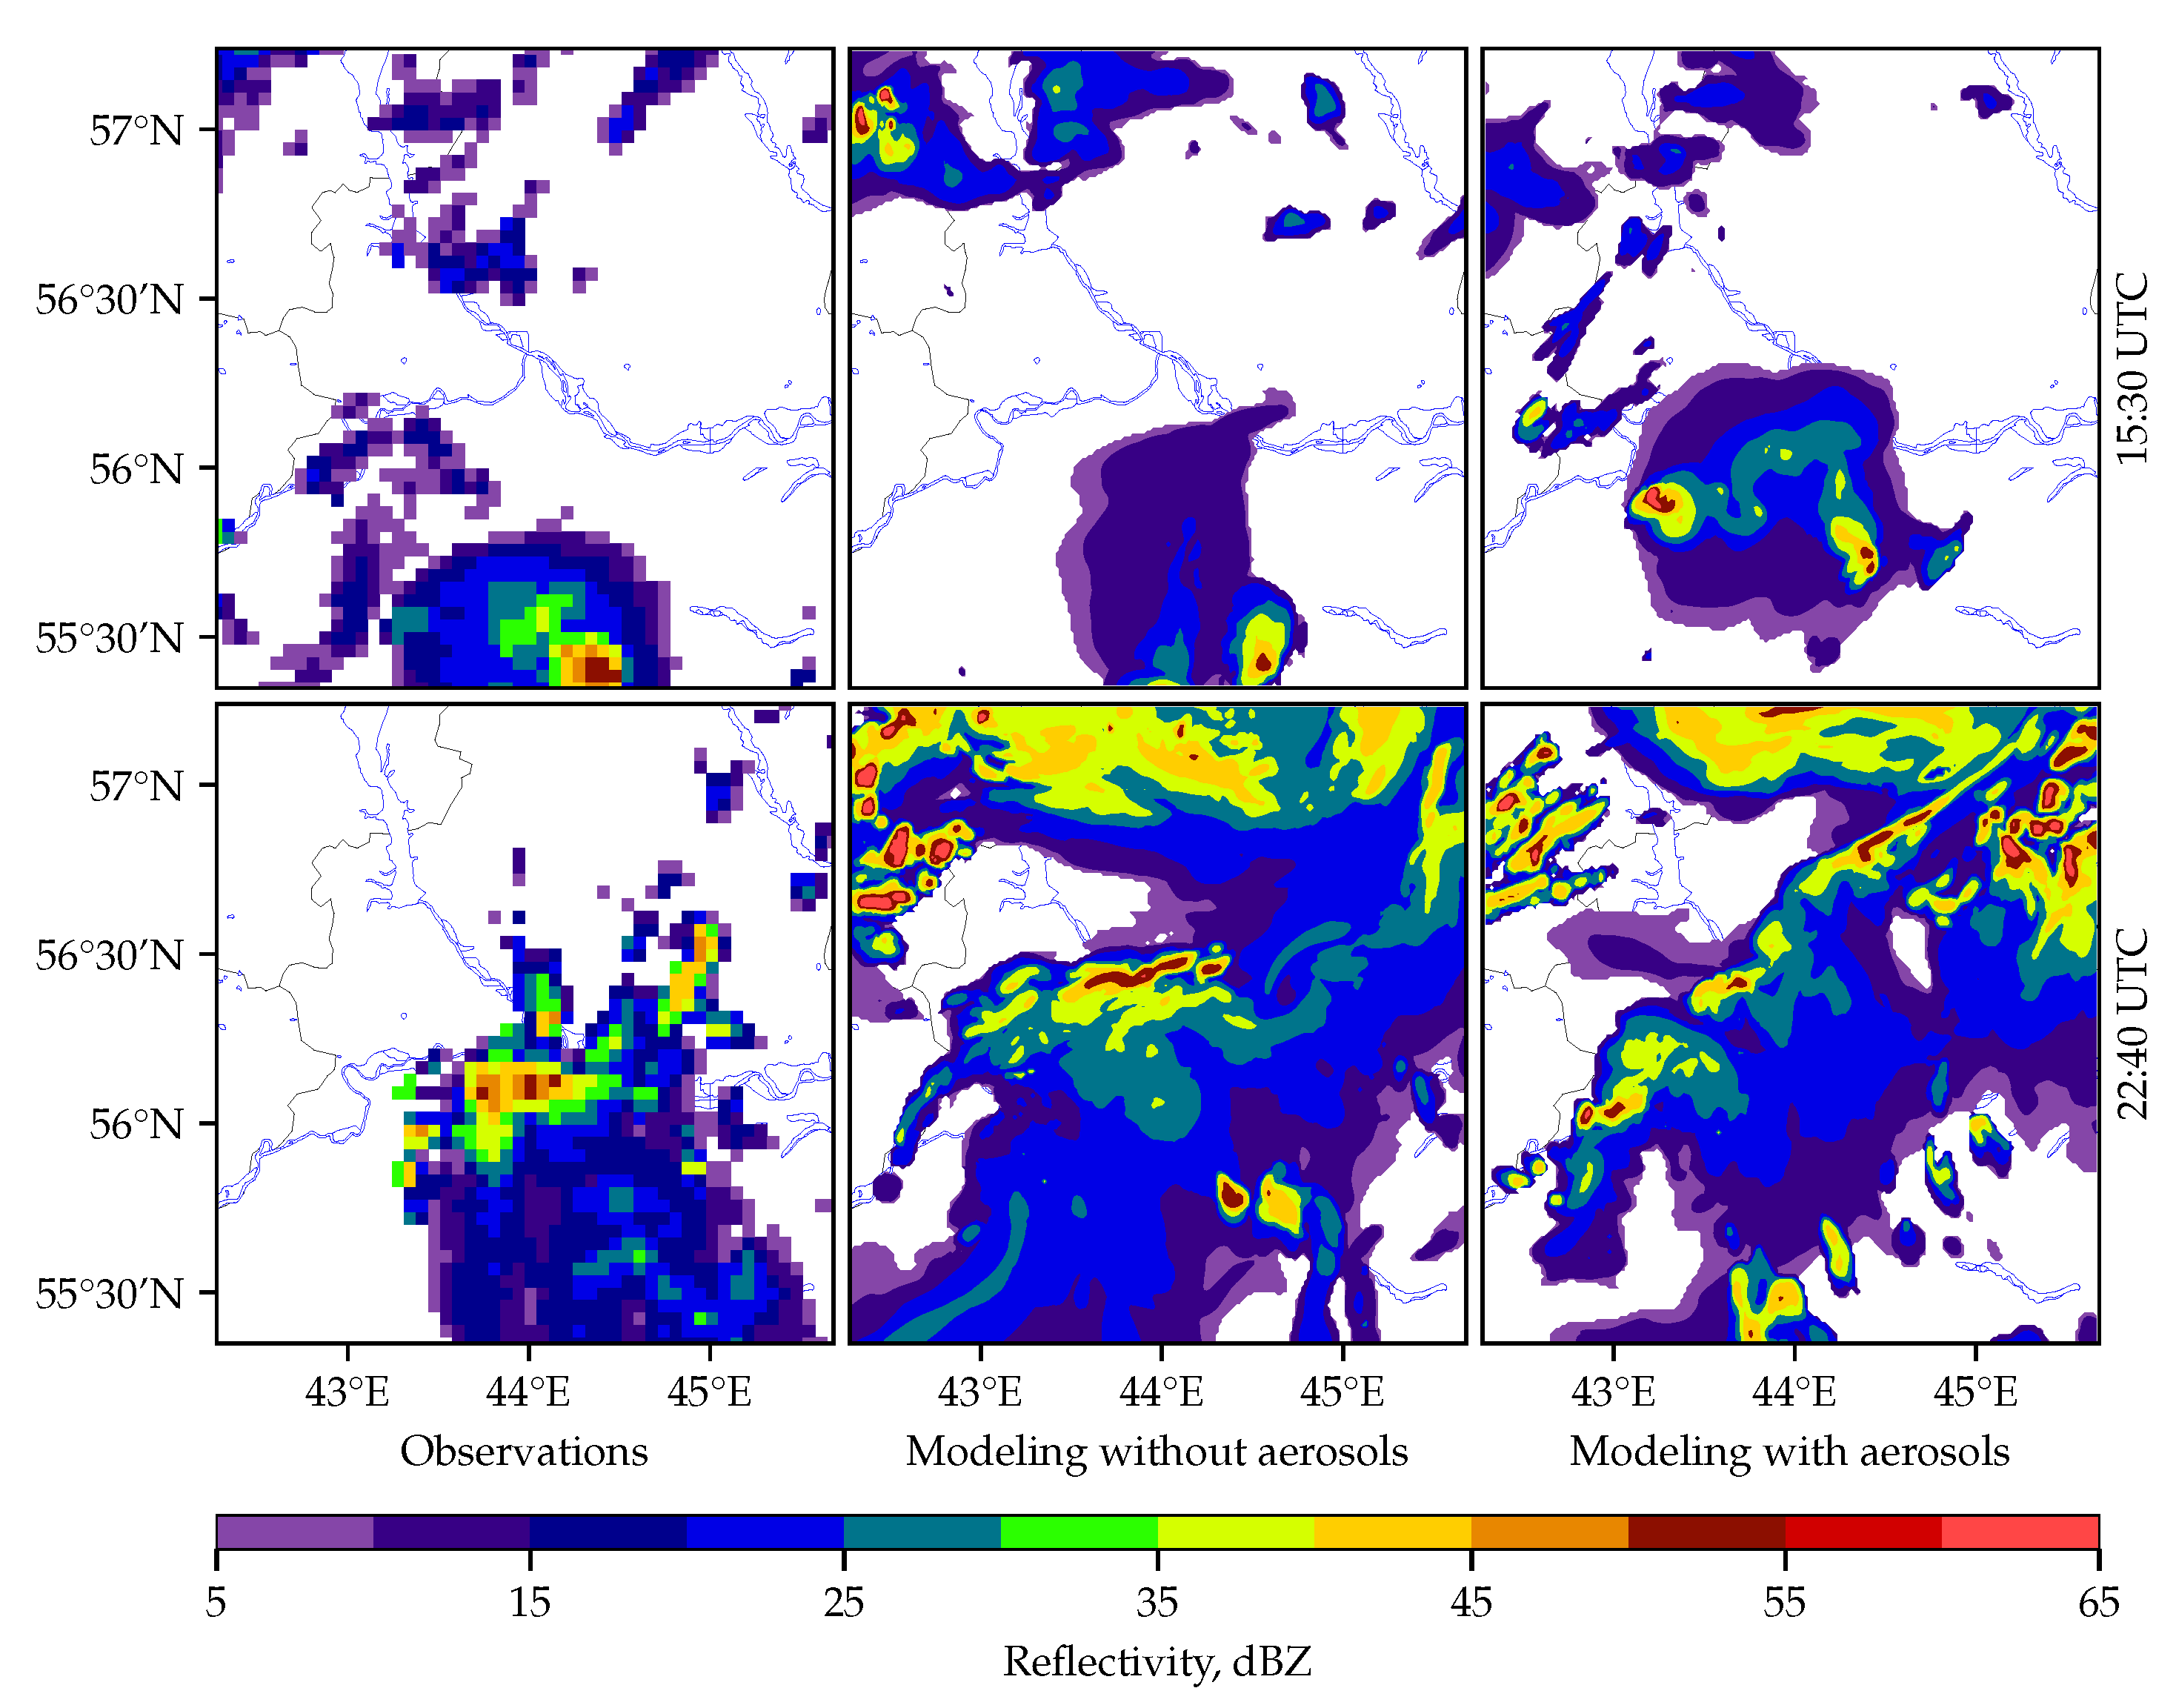
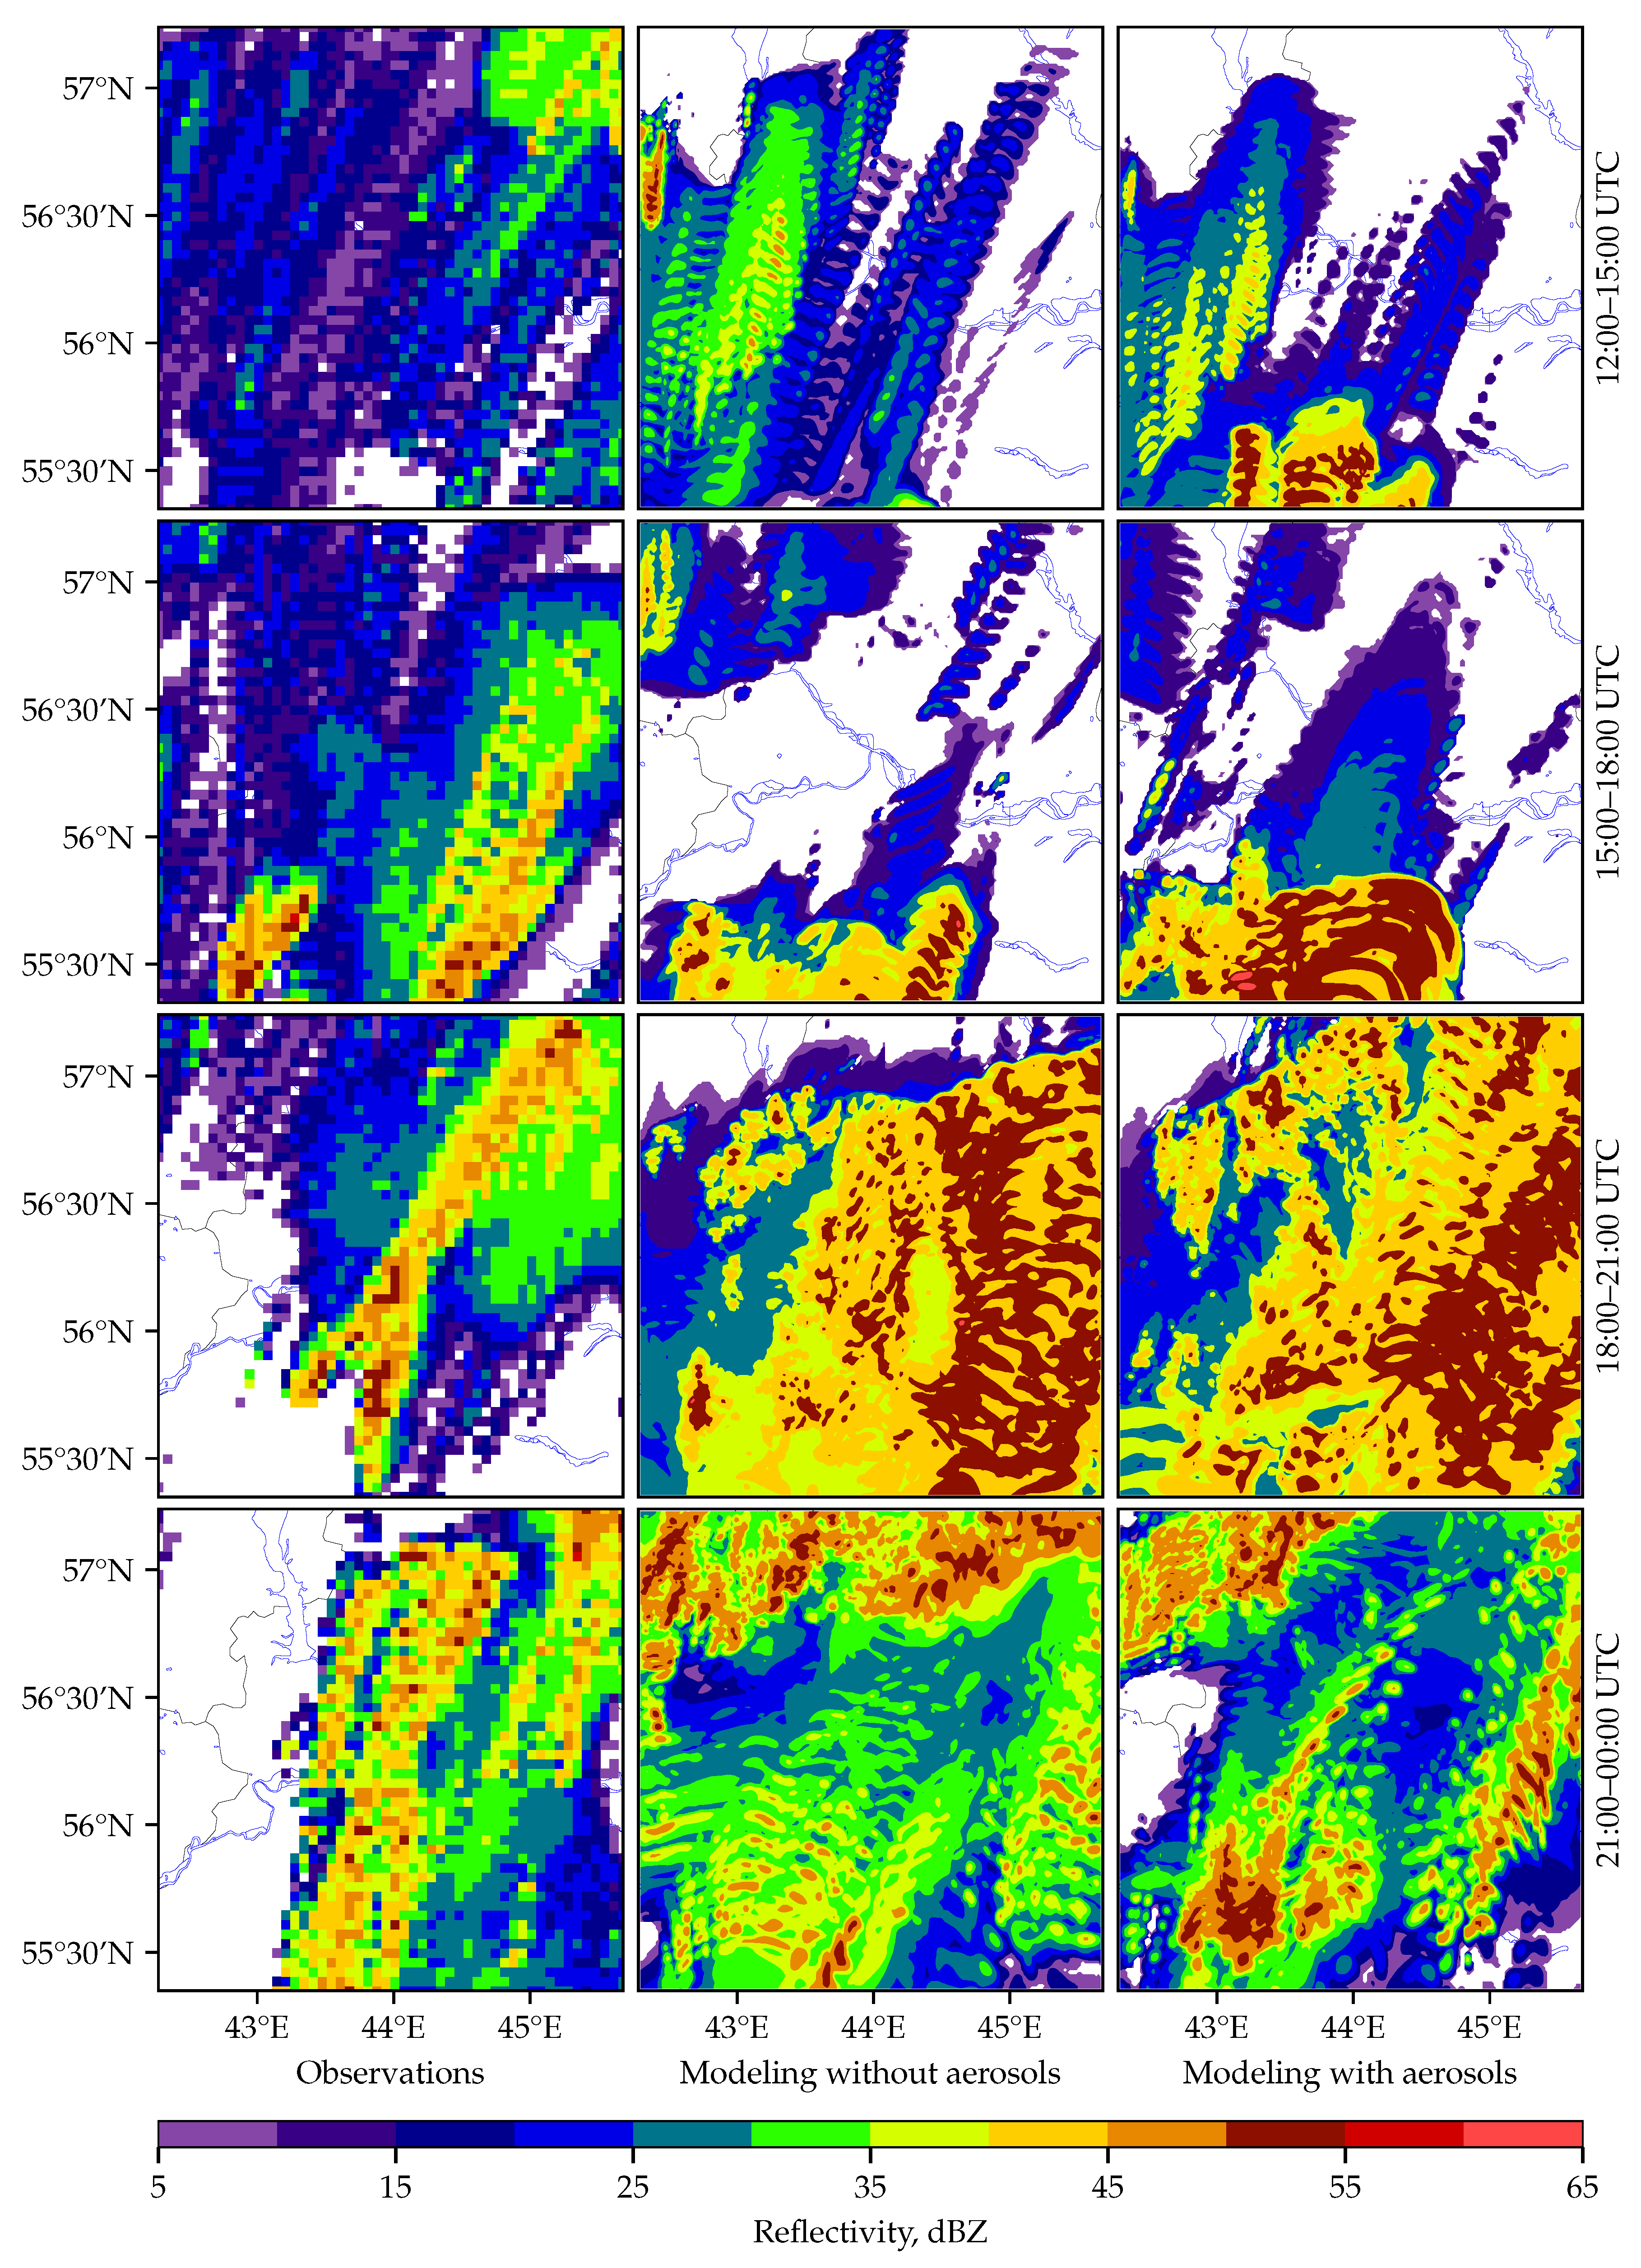
Radar reflectivity. The radar data were used to analyze the dynamics of the convective system that formed over the territory of the Nizhny Novgorod region on 13 July 2020. A comparison of the simulated radar reflectivity with the DMRL-C observational data makes it possible to analyze the quality of modeling and the agreement of the results in terms of the microphysical parameters. The distributions of the maximum values of radar reflectivity in the vertical column for 15:30 UTC and 22:40 UTC are shown in Figure 5. The distributions of the maximum values of radar reflectivity at an altitude of 2 km at 3 h intervals are shown in Figure 6. In Figure 5 and Figure 6, the left column presents the DMRL-C observations, and the central and right columns show the results of numerical modeling with non-aerosol and aerosol parametrizations of the microphysics, respectively.
In the considered event, the storm front propagated from the south to the northeast. As noted above, the most powerful thunderstorms in the Nizhny Novgorod region usually come from the southern direction. High values of radar reflectivity were observed approximately from 15:00 to 03:00 (+1) UTC. The results of modeling the radar reflectivity are in a good agreement with the observational data in space. It can be seen that the thunderstorm simulation using the aerosol parametrization of the microphysics is slightly ahead of that using the non-aerosol simulation and has a longer duration. The simulated thundercloud trace covers a larger area than the observed one, as the simulation predicted a wider thunderstorm front than that seen on the radar.
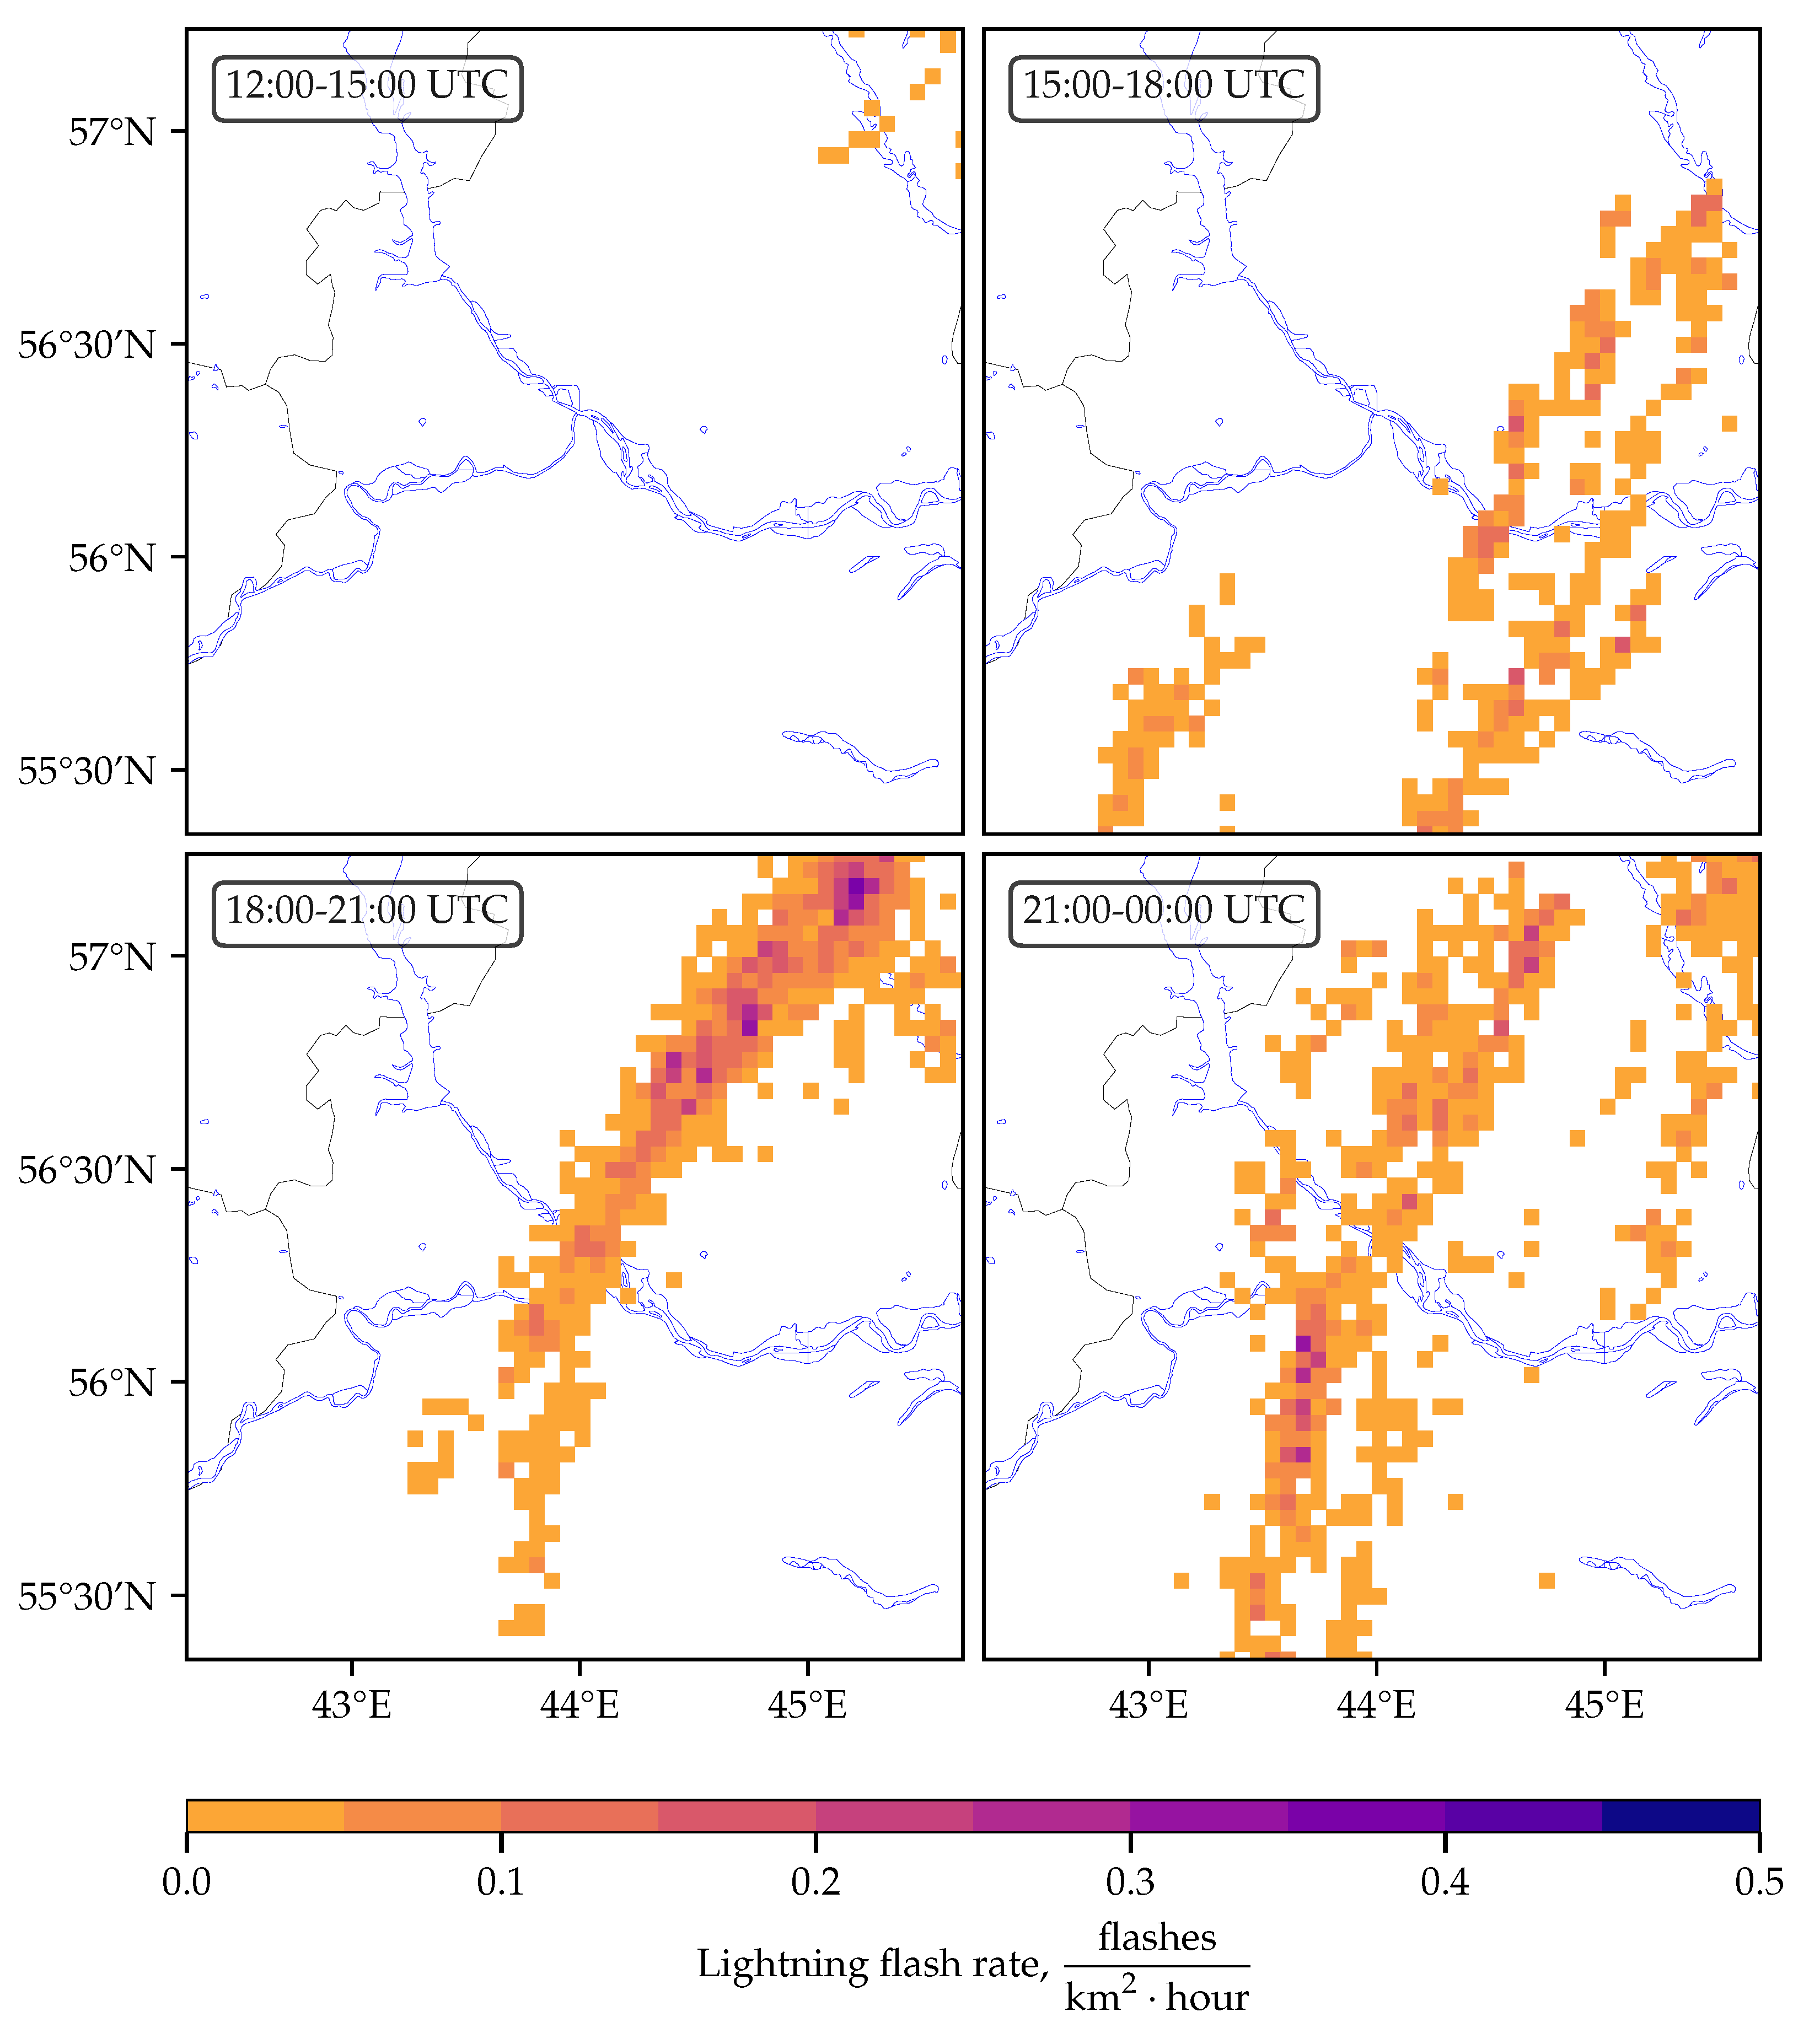
Lightning data. According to the WWLLN data, lightning events in the area under consideration were observed from 15:04 UTC 13 July to 00:45 UTC 14 July. The total number of flashes for 13–14 July was 4037. The lightning flash rate summed up for every 3 h is shown in Figure 7. It can be seen that the area in which the discharges are marked corresponds well to the area in which the observed maximum radar reflectivity exceeds 45 dBZ (see Figure 6).
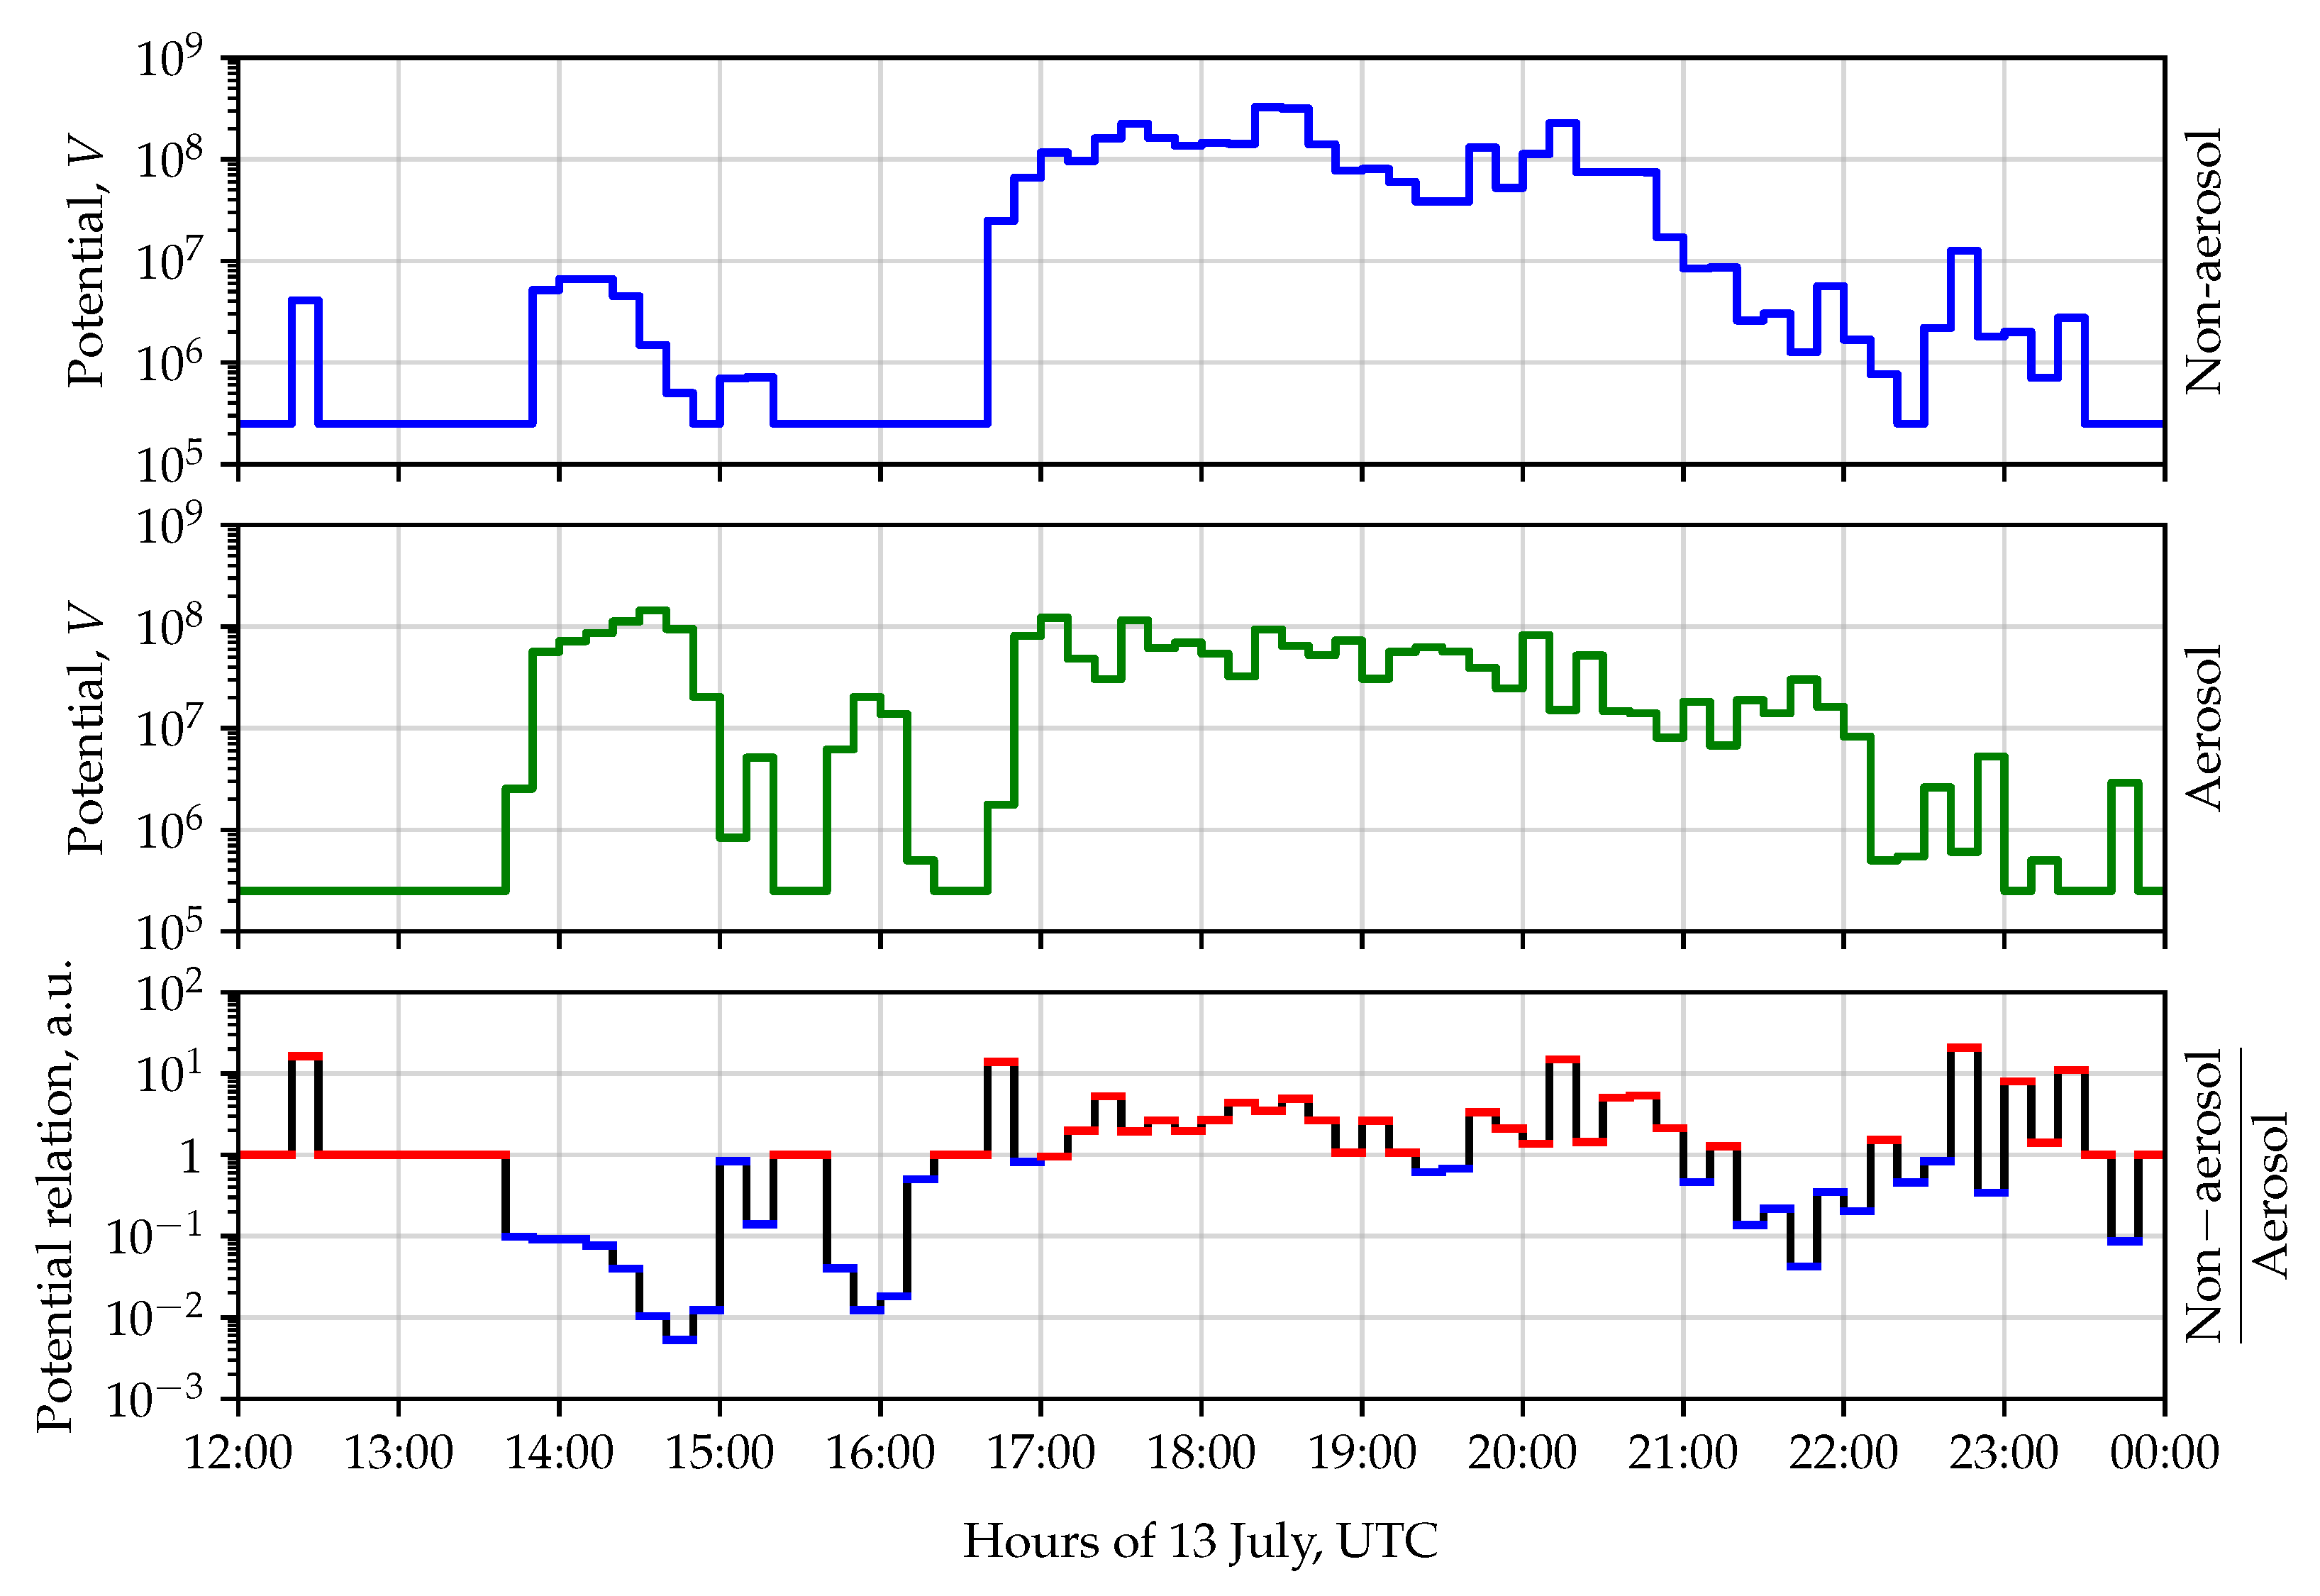
Electric parameters. To study the electric characteristics of the thunderstorm in the Nizhny Novgorod region on 13–14 July, the electric potential and the intracloud electric field were calculated. According to the simulation data, high values of the electric potential were observed from 14:20 to 00:00 (+1) UTC, preceded by a single cell from 12:40 to 13:00 for the non-aerosol modeling and from 14:00 to 00:20 (+1) UTC for the aerosol modeling. Figure 8 shows the time dependences of the maximum values of electric potential for the non-aerosol and aerosol parametrizations of the microphysics, as well as the time dependence of their ratio. The vertical axis is on a logarithmic scale. When the ratio of the potentials takes on a value less than one, this means that, for a given time interval, the electric processes in the aerosol simulation are more intense, and, conversely, for values greater than one, the electric processes simulated without aerosols are more intense. The thunderstorm began to develop more rapidly in the aerosol simulation, and the thunderstorm duration was longer. The maximum simulated electric potential was 328 MV without aerosols and 144 MV with aerosols. The maximum values of the electric potential obtained in the experiments vary from 0.4 MV to 1300 MV (see, for example, [48,49,50,51]); that is, the values obtained in this work fall within the range of observed values.
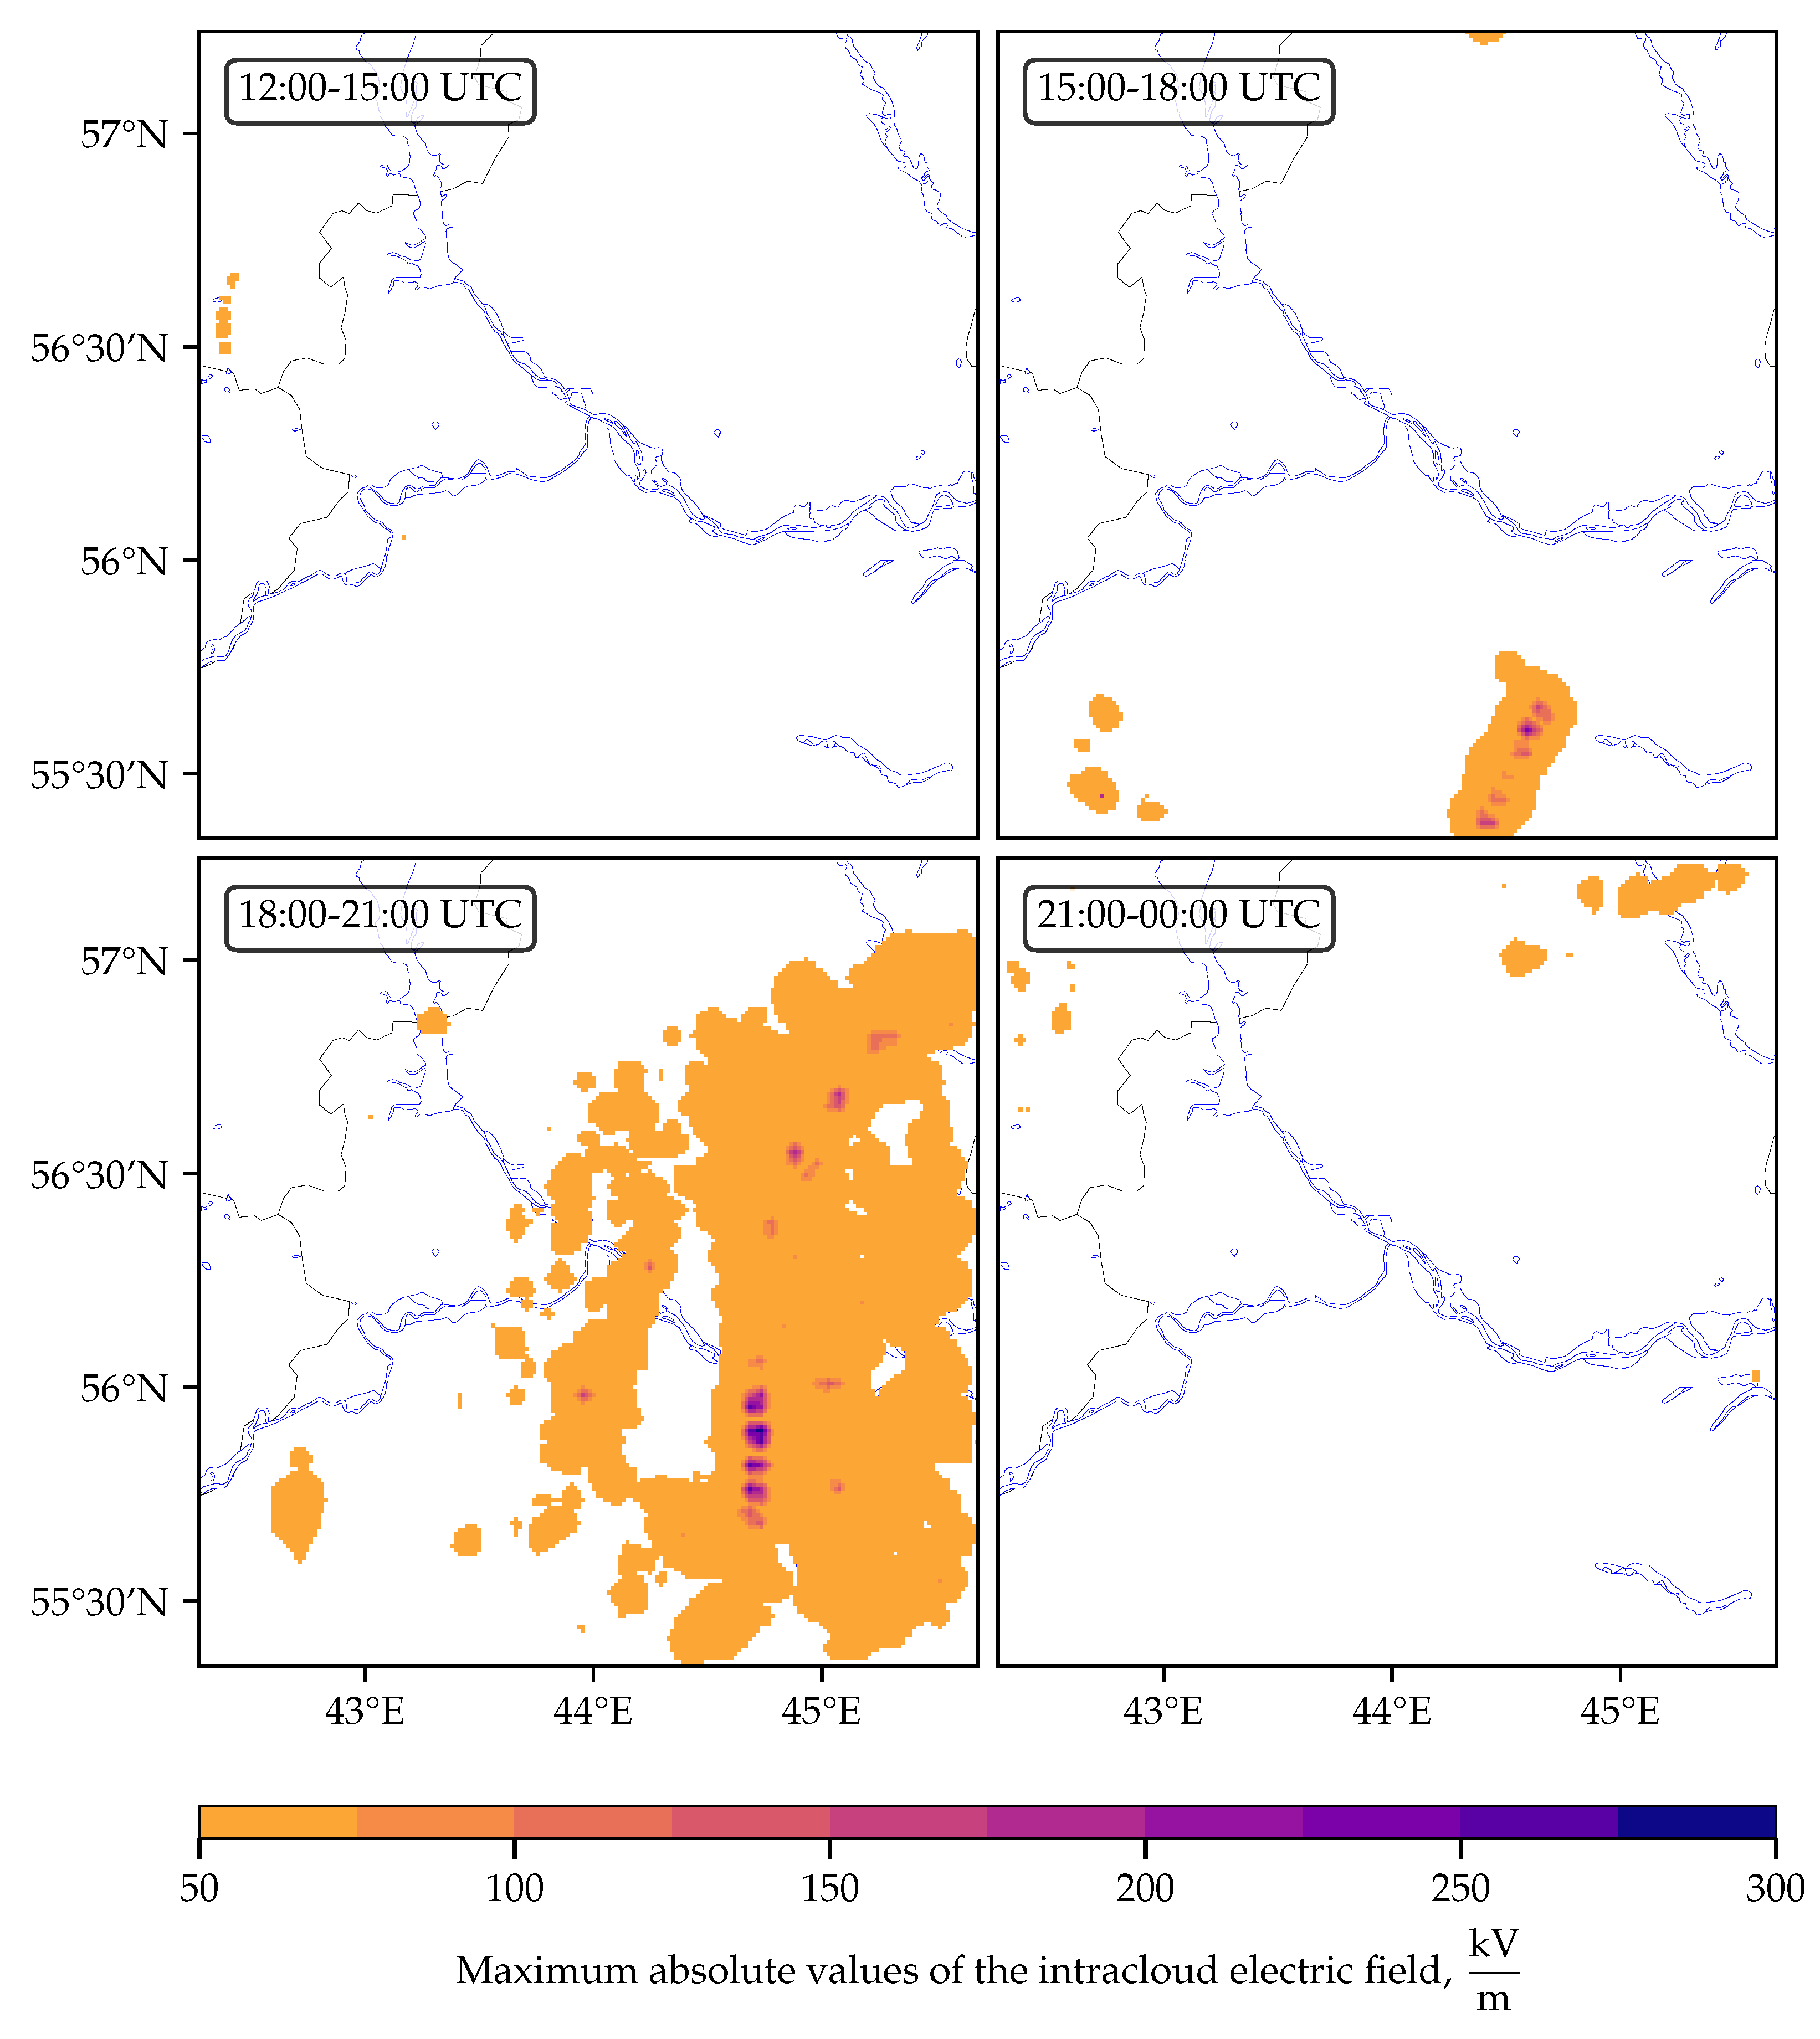
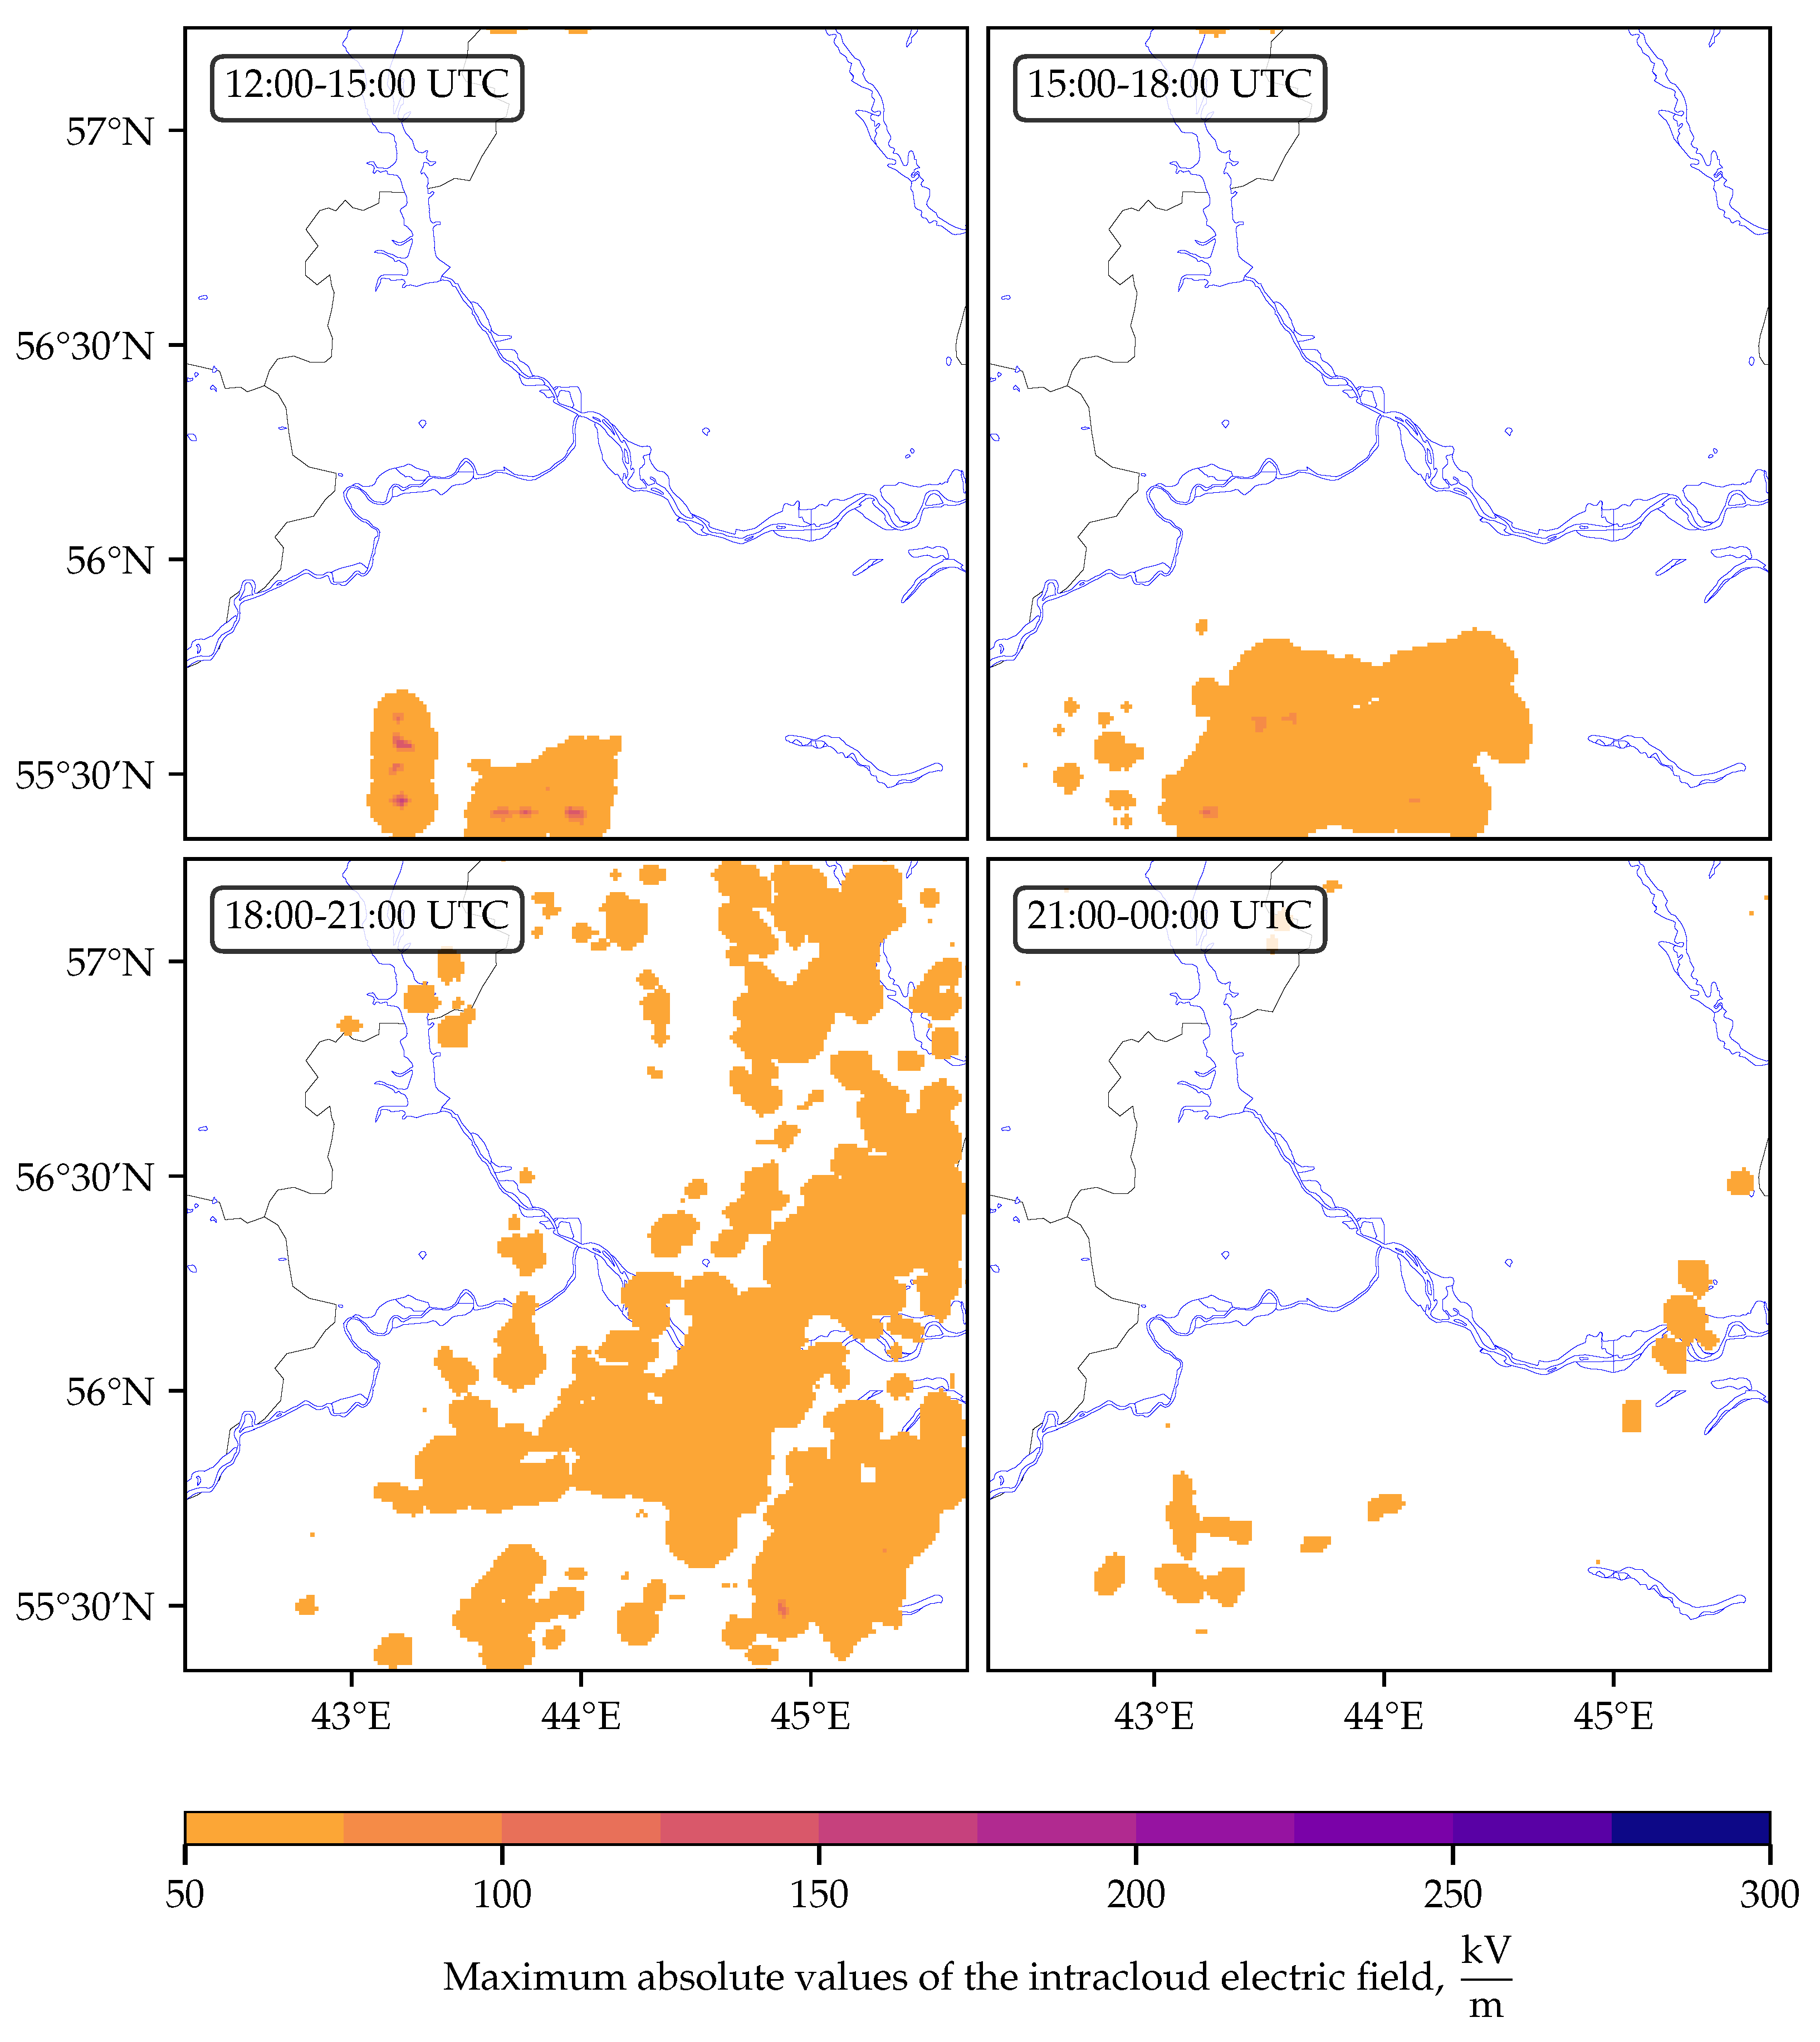
Figure 9 and Figure 10 show the maximum absolute values of the intracloud electric field every 3 h from 12:00 13 July 2020 to 03:00 14 July 2020, obtained by the modeling with non-aerosol and aerosol parametrizations of the microphysics, respectively. In these figures, one can also see an earlier onset and a longer duration of the thunderstorm in the aerosol simulations. At the same time, the maximum value of the intracloud electric field strength obtained in simulations with the non-aerosol microphysical parametrization exceeds the same value obtained in the modeling with aerosols.
The analysis of the obtained distributions of the electric potential and electric field in the thundercloud allows us to make some remarks. The aerosol parametrization reflects the earlier development of the thundercloud with high values for the electric field and potential within the considered area. The comparison of the simulated distributions of the maximum absolute values for the electric field with the WWLLN data does not confirm such an early development of lightning-active regions as obtained in the aerosol modeling. In terms of the start time of the lightning activity, the results of the modeling using non-aerosol microphysics are in better agreement with the WWLLN data. However, the thunderstorm obtained using non-aerosol parametrization has a shorter duration compared to the aerosol simulation. The non-aerosol simulation poorly depicts the final stage of thundercloud development; in this simulation, the thunderstorm front decays too fast. Thus, it can be noted that the aerosol modeling demonstrated the presence of lightning activity for a sufficient time. However, high values of the electric field strength and potential arose too early compared to the WWLLN data. The non-aerosol modeling, in turn, reproduced the stage of growth and development of the convective system quite well; however, in this variant, the lifetime of the lightning-active regions is underestimated.
4. Discussion
In this paper, we analyze the lightning activity and characteristics of thunderstorms in the Upper Volga region. It was revealed before that about 34 convective events in Nizhny Novgorod (the center of the considered region) and its surroundings occur annually. According to the data presented in Figure 4, about 15 thunderstorms occurred in the 2020 convective season. The difference in the number is due to the presence of weak local thunderstorms with a small number of discharges, which are not displayed on the graph against the background of more powerful events and were not recorded by meteorological observation stations.
Every year one or two severe thunderstorms similar to the thunderstorm of 13–14 July 2020 studied in this article occur in the territory of the Upper Volga region [45]. For example, a similar thunderstorm that occurred on 1–2 June 2015 was studied in [52]. The forecast for that thunderstorm in the territory of the Nizhny Novgorod region was based on the numerical simulations of the WRF model with the same non-aerosol parametrization of the microphysics as in the present work. The same algorithm for calculation of the electric parameters was used. The data from continuous EFM measurements and weather radar data were used for verification of the simulation results. The powerful continuous thunderstorm of 1–2 June 2015 passed through the Nizhny Novgorod region from south to north. According to the EFM measurements, the thunderstorm began at about 20:00 UTC and lasted almost 8 h; the total area of the thundercloud, according to radar observations and modeling results, reached 20,000 km. During the first stage of the thunderstorm, which was about three hours of the developed thunderstorm activity, there was a maximum correspondence between the simulation results and the real parameters of the thunderstorm. The agreement between the simulated and observed parameters worsened towards the end of the thunderstorm activity.
Thus, in both cases, we dealt with thunderstorms that were the most powerful intra-mass events in the convective season usually starting in the afternoon local time, moving into the next day, and continuing through the night. In addition, these thunderstorms usually come from the southern direction. Interestingly, when simulating both thunderstorms (1–2 June 2015 and 13–14 July 2020) using the WRF model, there was no final stage of the thunderstorm; thereby, the modeled thunderstorms ended too early. Thus, it can be assumed that such long-term thunderstorms can be classified as a separate type and similar parameters can be expected to be obtained both as a result of observations and numerical simulation.
In this work, to visualize the spatial distributions of the characteristics of a thundercloud, a 3 h trace is used, which is the distribution on the plane of the maximum value of the parameter in a vertical column for a selected time interval (3 h). The use of 3 h averages (see, for example, [10]) greatly smooths the real picture of a thunderstorm and, from our point of view, is not correct when studying the parameters of a thundercloud, which in fact determine the risk of lightning activity in the area under consideration. The 3 h trace of thundercloud proposed in this paper seems to be a more appropriate function for comparison with the WWLLN data summed over the same period.
The analysis of the simulated distributions of the electric potential and electric field for the thunderstorm of 13–14 July allows us to make several remarks. The aerosol simulation reflects an earlier development of a thundercloud with high values for the electric field and potential and a longer duration of the thunderstorm. The results of the modeling using non-aerosol microphysical parametrization, in turn, show a later start of a thunderstorm compared to aerosol modeling and approximately the same end time of the thunderstorm.
The comparison of the simulation results with the radar and WWLLN data shows that the features of the initial stage of thunderstorm development are more correctly described by non-aerosol modeling; the end time of the thunderstorm is underestimated in simulations with both parametrizations of microphysics; the duration of the thunderstorm (disregarding the time offset) is correctly predicted by aerosol simulations. It is worth noting that on 14 July 2020, there was also a powerful thunderstorm in Moscow (located about 400 km from Nizhny Novgorod). If we consider these events as parts of the same cyclone, then we can assume that the error in the aerosol modeling is due to the fact that the main part of the thunderstorm shifted toward a more powerful aerosol island.
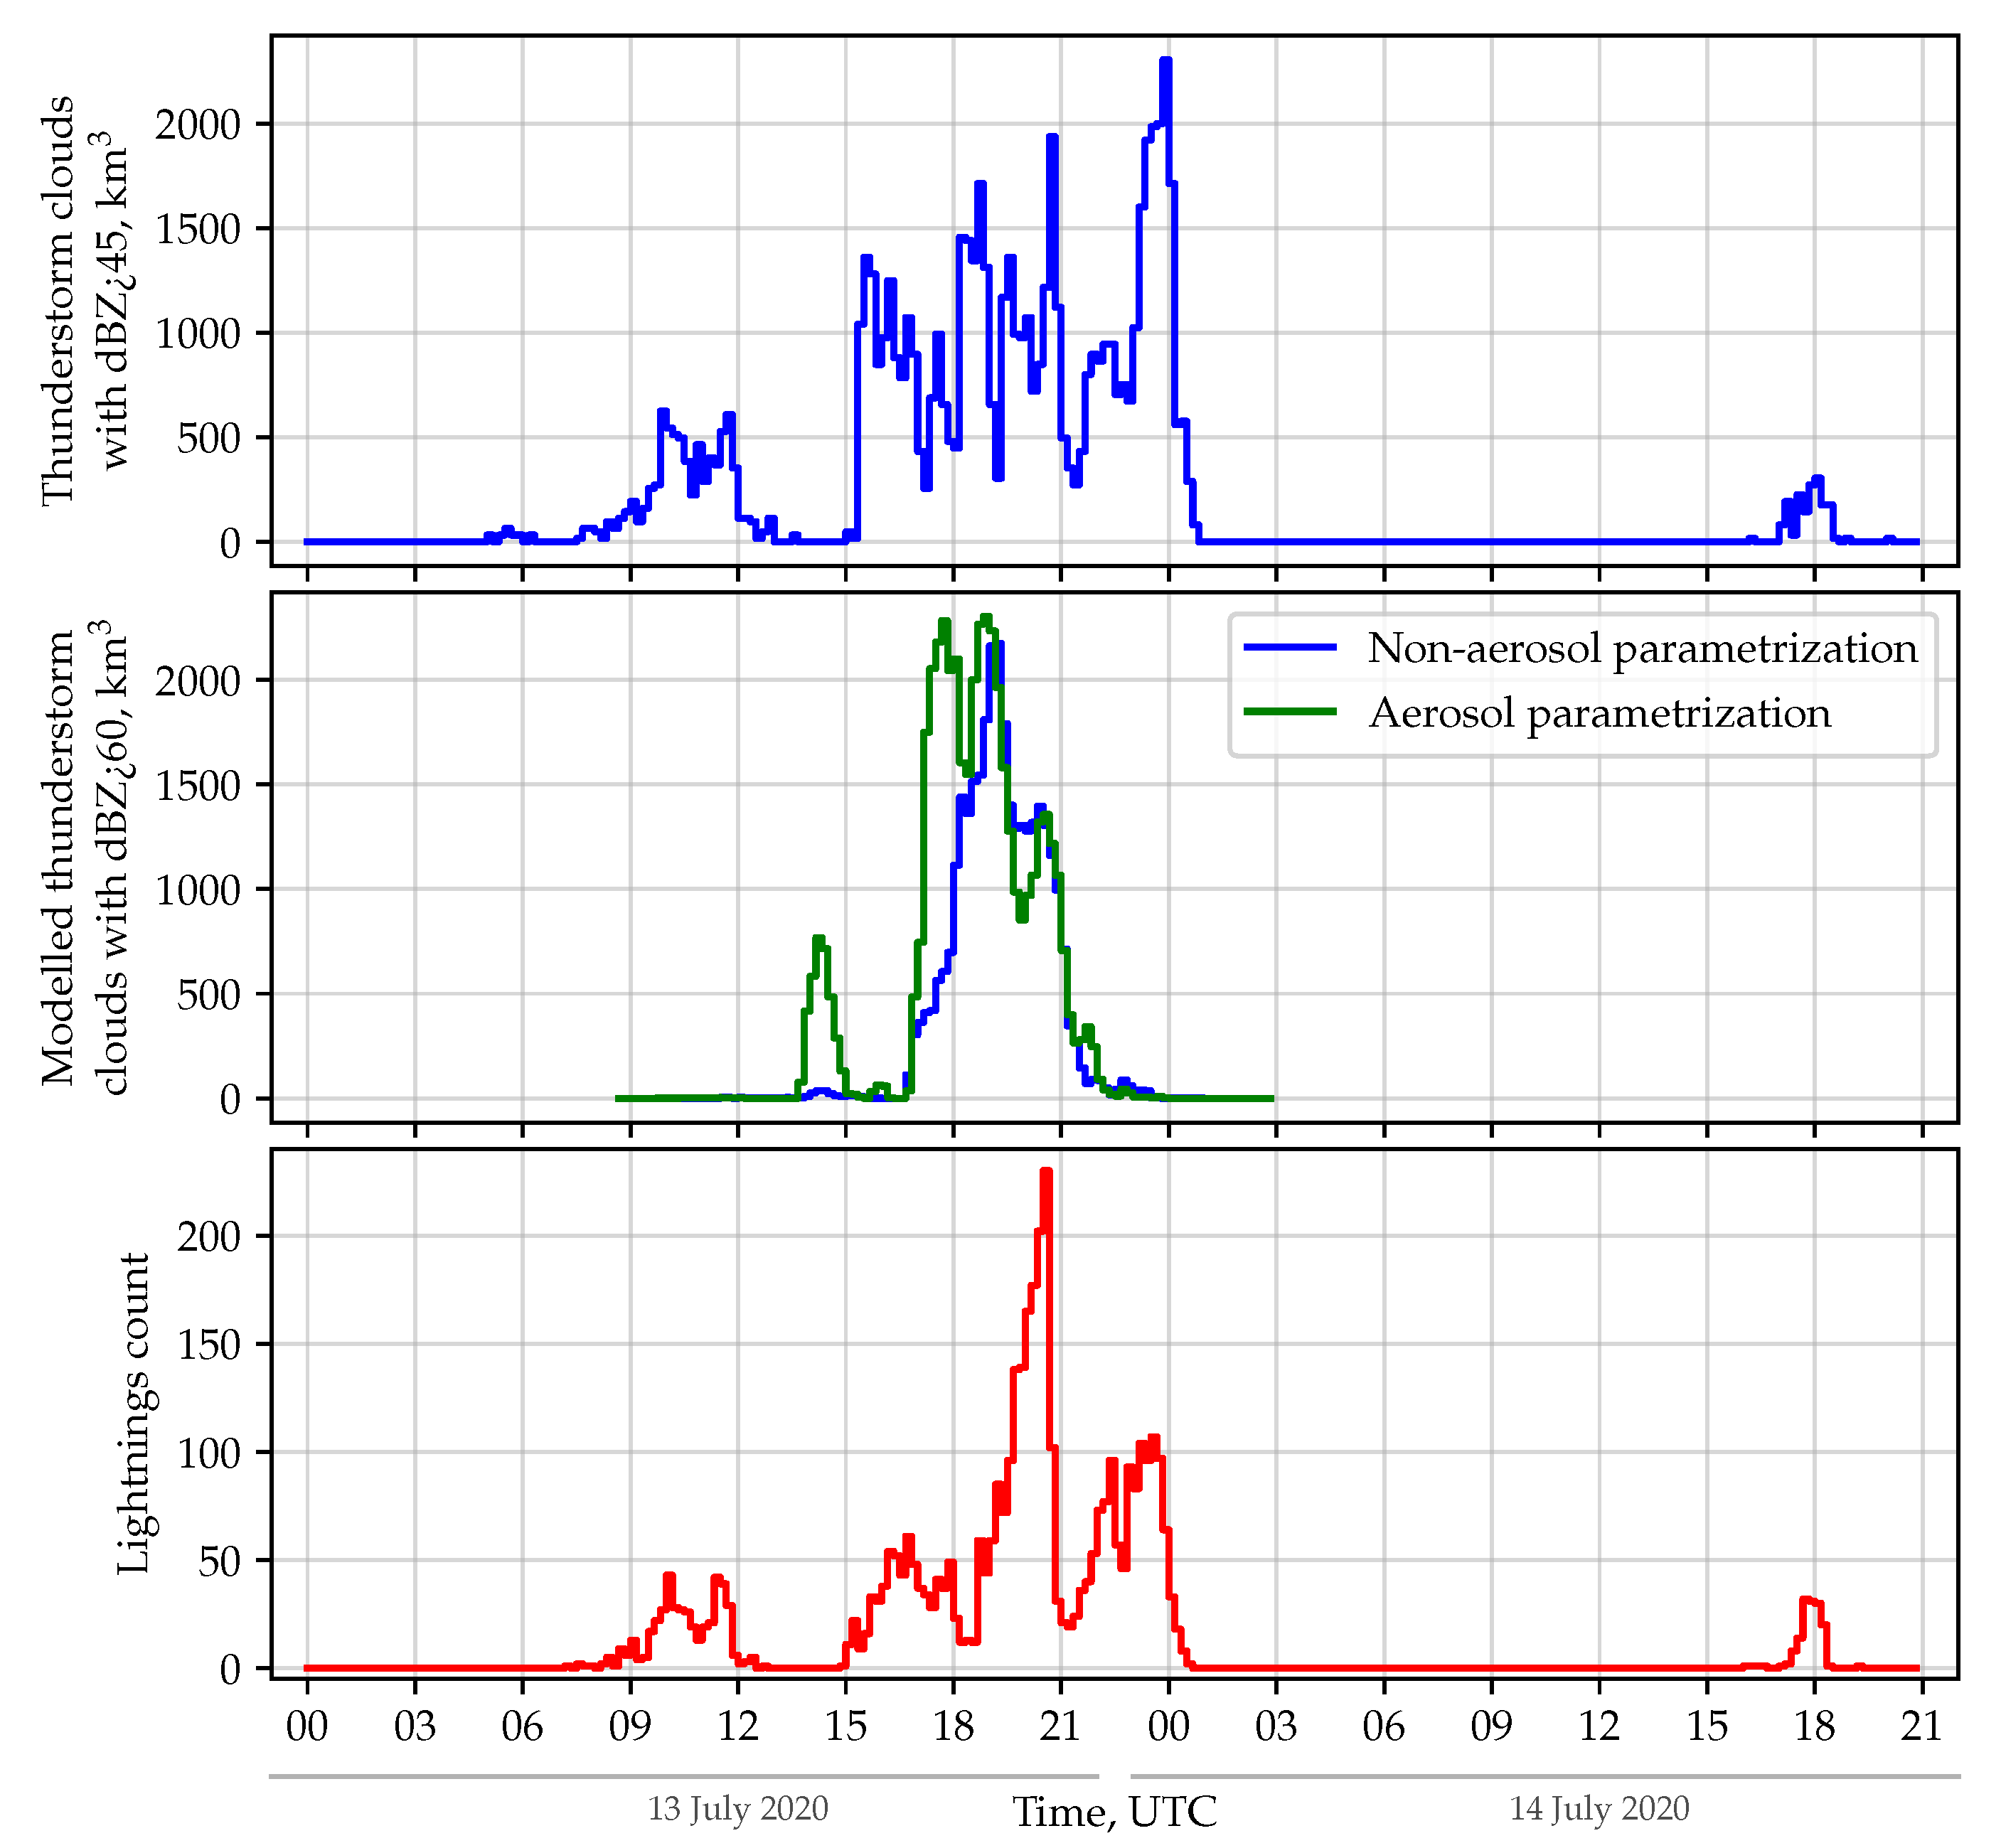
In this work, an attempt was made to count cells with high reflectivity in the radar data, which can probably be associated with the electroactive part of the cloud (that is, the part in which lightning activity is most likely). The applied thresholds have not been validated yet, so we will only briefly discuss such an observational tool. The volume of thunderclouds (the sum of volume cells) observed by a meteorological radar with a radar reflectivity of more than 45 dBZ is shown in Figure 11 (upper panel). Temperature and altitude were not taken into account when calculating the volume of thunderclouds with high radar reflectivity. There is a fairly good agreement between the observed time dependence and the WWLLN data on the number of lightning discharges when such a threshold is used (see the lower panel of Figure 11). In addition, it should be noted that the characteristic volume of a single thunderstorm cell is about 300 km with characteristic dimensions of 5–7 km in radius and 2–3 km in height. For example, Mason [53] gives an estimate of the horizontal scales of the cell of 5–14 km when observing the mature stage of the cell. A similar cell with a size of 260 km was observed during the thunderstorm at 18:00 UTC on 14 July 2020.
When comparing the radar reflectivity obtained from observations and simulations, we found that the model overestimates the reflectivity values. The threshold value was selected according to the maximum volume of thunderstorm cells. The volume of simulated thunderclouds with a radar reflectivity of more than 60 dBZ is shown in Figure 11 (central panel). The blue curve is used for the non-aerosol simulation, and the green curve is used for the aerosol one. When counting cell volume with a reflectivity above 45 dBZ (as for the radar data), we obtained values that are an order of magnitude larger than for radar observations. To obtain comparable maximum values, we had to raise the reflectivity threshold to 60 dBZ (see the central panel of Figure 11). Previously, the results of radar reflectivity simulations using the WRF model and the WWLLN data for several convective seasons in the Nizhny Novgorod region were compared in [15]. It was shown that, for the area under consideration, the best correlation was observed at a threshold value of 55 dBZ. Thus, some differences in the maximum values of the radar reflectivity obtained in the simulations and according to the observational data (see Figure 6) can be associated with a systematic overestimation of this parameter in the simulation of convective events in this area.
As seen from the simulation results, both considered parametrizations of the microphysics have their advantages and disadvantages. For an accurate representation of all stages of thunderstorm development, the advantages of both parametrizations should be combined. In the aerosol parametrization of the microphysics considered in this paper, the initial distributions of aerosol mass mixing ratios are taken from multi-year global model simulations by the GOCART model. However, the same aerosol parametrization lets us multiply the initial distribution of the aerosol mass mixing ratio by any factor (see, for example, [54]). Thus, as a further development of this study, it is possible to perform a set of simulations with different configurations of the initial distribution of the aerosol mass mixing ratio. If we assume that the initial distributions of the aerosol mass mixing ratios taken from the GOCART model are too rough (the spatial resolution of the GOCART model is 0.5 degrees in longitude and 1.25 degrees in latitude) or do not correspond sufficiently well to the observed ones in the territory under consideration, then we can affect the aerosol load by changing the initial distribution of the aerosols (for example, by increasing their number in the immediate neighborhood of the metropolis and decreasing on the periphery). Since the thunderstorm under consideration comes from the south of the region, this approach will probably make it possible to bring the results of modeling the beginning of a thunderstorm closer to the results of non-aerosol modeling. At the same time, a high aerosol load will remain over Nizhny Novgorod, which will probably maintain the lifetime of the convective system for a sufficiently long time.
5. Conclusions
In this paper, the annual variability in the number of lightning discharges in the territory of the Nizhny Novgorod region has been analyzed using the WWLLN data. It has been shown that the total number of discharges for the convective seasons of 2016–2021 increased. For the convective season of 2020, the daily number of discharges in the neighborhood of Nizhny Novgorod was calculated according to the WWLLN data and the EFM measurements. The most powerful thunderstorm was observed on 13–14 July 2020. The total number of discharges in the Nizhny Novgorod area with a radius of 38 km on 13–14 July exceeded 800 lightning events, which was several times higher than the number of lightning events during the other thunderstorms of the considered season. A few years earlier, a similar thunderstorm was studied [52]. These thunderstorms have a number of similar features, which is why it can be assumed that such convective events can be classified as a separate type of thunderstorms, and similar parameters can be expected to be obtained both as a result of observations and numerical simulation.
A numerical simulation of the thunderstorm was performed using the WRF model coupled with a calculation of the intracloud electric parameters to study the parameters of the convective system. The simulation was carried out using two parametrizations of the microphysical processes to reveal the features associated with the allowance for aerosol particles. The data from the DMRL-C were used to validate the radar reflectivity simulation results of the WRF model. The results of modeling radar reflectivity are in good agreement with the observational data in space. According to the simulation using the aerosol parametrization of the microphysics, the thunderstorm begins earlier and lasts longer compared to the non-aerosol simulation. It is noted that the simulated thundercloud also has a wider thunderstorm front than seen on the radar.
The electric potential and the intracloud electric field were calculated to study the electric characteristics of the thunderstorm. In the aerosol simulation, the thunderstorm started developing faster, and the duration of the thunderstorm was longer. The WWLLN data on the detected lightning events were used to test the obtained simulation results. A comparison of the aerosol simulations with the WWLLN data did not confirm such an early development of lightning-active regions. In terms of the start time of the lightning activity, the results of the modeling using non-aerosol microphysics were in better agreement with the WWLLN data, but the duration of the thunderstorm obtained using non-aerosol parametrization was too short. The maximum value of the electric potential for the non-aerosol modeling exceeded the same parameter for the aerosol simulations. Thus, we can conclude that, when modeling severe thunderstorms in the Upper Volga region, the non-aerosol microphysical parametrization gives a more correct description of the thunderstorm development (with the exception of the final stage of the convective system development). For a convective event to have the required duration (more than 6 h), it is necessary to take aerosol particles into account.
Author Contributions
Conceptualization, S.D. and M.S.; methodology, S.D., M.S. and M.K.; software, S.D., M.S., F.S. and A.P.; validation, F.S. and A.P.; formal analysis, M.S. and M.K.; investigation, S.D., M.S., A.P., F.S. and M.K.; resources, S.D., M.S. and E.M.; data curation, F.S.; writing—original draft preparation, S.D., M.S., A.P. and F.S.; writing—review and editing, M.K. and E.M.; visualization, S.D., M.S., A.P. and F.S.; supervision, E.M.; project administration, S.D. and E.M.; funding acquisition, S.D. All authors have read and agreed to the published version of the manuscript.
Funding
The analysis of the features of the development and electrification of the thunderstorm on 13–14 July 2020 was carried out at the expense of the Russian Science Foundation Grant No. 21-77-00089 [55]. General patterns of lightning activity were analyzed within the State Assignment (Project No. 0729-2020-0037).
Institutional Review Board Statement
Not applicable.
Informed Consent Statement
Not applicable.
Data Availability Statement
Acknowledgments
We thank the three anonymous reviewers for their valuable comments that helped to improve our manuscript.
Conflicts of Interest
The authors declare no conflict of interest. The funders had no role in the design of the study; in the collection, analyses, or interpretation of data; in the writing of the manuscript; or in the decision to publish the results.
References
- Alimonti, G.; Mariani, L.; Prodi, F.; Ricci, R.A. A critical assessment of extreme events trends in times of global warming. Eur. Phys. J. Plus 2022, 137, 112. [Google Scholar] [CrossRef]
- Shikhov, A.; Chernokulsky, A.; Kalinin, N.; Bykov, A.; Pischalnikova, E. Climatology and formation environments of severe convective windstorms and tornadoes in the Perm region (Russia) in 1984–2020. Atmosphere 2021, 12, 1407. [Google Scholar] [CrossRef]
- Brooks, H.E.; Doswell, C.A., III; Zhang, X.; Chernokulsky, A.; Tochimoto, E.; Hanstrum, B.; Nascimento, E.; Sills, D.; Antonescu, B.; Barrett, B. A century of progress in severe convective storm research and forecasting. Meteor. Monogr. 2018, 59, 18.1–18.41. [Google Scholar]
- Taszarek, M.; Groenemeijer, P.; Allen, J.T.; Edwards, R.; Brooks, H.E.; Chmielewski, V.; Enno, S.E. Severe convective storms across Europe and the United States. Part I: Climatology of lightning, large hail, severe wind, and tornadoes. J. Clim. 2020, 33, 10239–10261. [Google Scholar] [CrossRef]
- Price, C.G. Lightning Applications in Weather and Climate Research. Surv. Geophys. 2013, 34, 755–767. [Google Scholar] [CrossRef]
- Chernokulsky, A.; Kozlov, F.; Mokhov, I.I.; Semenov, V.A.; Zolina, O.; Bulygina, O. Observed changes in convective and stratiform precipitation in Northern Eurasia over the last five decades. Env. Res. Lett. 2019, 14, 045001. [Google Scholar] [CrossRef]
- Chernokulsky, A.V.; Kurgansky, M.V.; Mokhov, I.I. Analysis of changes in tornadogenesis conditions over Northern Eurasia based on a simple index of atmospheric convective instability. Dokl. Earth Sci. 2017, 477, 1504–1509. [Google Scholar] [CrossRef]
- Haklander, A.J.; Van Delden, A. Thunderstorm predictors and their forecast skill for the Netherlands. Atmos. Res. 2003, 67–68, 273–299. [Google Scholar] [CrossRef]
- Kunz, M. The skill of convective parameters and indices to predict isolated and severe thunderstorms. Nat. Hazards Earth Syst. Sci. 2007, 7, 327–342. [Google Scholar] [CrossRef] [Green Version]
- Yair, Y.; Lynn, B.; Price, C.; Kotroni, V.; Lagouvardos, K.; Morin, E.; Mugnai, A.; del Carmen Llasat, M. Predicting the potential for lightning activity in Mediterranean storms based on the Weather Research and Forecasting (WRF) model dynamic and microphysical fields. J. Geophys. Res. 2010, 115, D04205. [Google Scholar] [CrossRef] [Green Version]
- Kulikov, M.Y.; Belikovich, M.V.; Skalyga, N.K.; Shatalina, M.V.; Dementyeva, S.O.; Ryskin, V.G.; Shvetsov, A.A.; Krasil’nikov, A.A.; Serov, E.A.; Feigin, A.M. Skills of Thunderstorm Prediction by Convective Indices over a Metropolitan Area: Comparison of Microwave and Radiosonde Data. Remote Sens. 2020, 12, 604. [Google Scholar] [CrossRef] [Green Version]
- Zipser, E.J.; Lutz, K.R. The Vertical Profile of Radar Reflectivity of Convective Cells: A Strong Indicator of Storm Intensity and Lightning Probability? Mon. Weather. Rev. 1994, 122, 1751–1759. [Google Scholar] [CrossRef]
- Liu, C.; Cecil, D.J.; Zipser, E.J.; Kronfeld, K.; Robertson, R. Relation between lightning flash rate and radar reflectivity vertical structure in thunderstorms over the tropics and subtropics. J. Geophys. Res. Atmos. 2012, 117, 6212. [Google Scholar]
- Basarab, B.M.; Rutledge, S.A.; Fuchs, B.R. An improved lightning flash rate parameterization developed from Colorado DC3 thunderstorm data for use in cloud-resolving chemical transport models. J. Geophys. Res. Atmos. 2015, 120, 9481–9499. [Google Scholar] [CrossRef]
- Dementyeva, S.O.; Ilin, N.V.; Shatalina, M.V.; Mareev, E.A. Forecast of convective events and its verification against atmospheric electricity observations. Izv. Atmos. Ocean. Phys. 2020, 56, 123–129. [Google Scholar] [CrossRef]
- Ilin, N.V.; Kuterin, F.A. Accuracy of Thunderstorm Detection Based on DMRL-C Weather Radar Data. Russ. Meteorol. Hydrol. 2020, 45, 669–675. [Google Scholar] [CrossRef]
- Mansell, E.R.; MacGorman, D.R.; Ziegler, C.L.; Straka, J.M. Charge structure and lightning sensitivity in a simulated multicell thunderstorm. J. Geophys. Res. 2005, 110, D12101. [Google Scholar] [CrossRef] [Green Version]
- Mansell, E.R.; Ziegler, C.L.; Bruning, E.C. Simulated Electrification of a Small Thunderstorm with Two-Moment Bulk Microphysics. J. Atmos. Sci. 2010, 67, 171–194. [Google Scholar] [CrossRef]
- Zhao, P.; Yin, Y.; Xiao, H. The effects of aerosol on development of thunderstorm electrification: A numerical study. Atmos. Res. 2015, 153, 376–391. [Google Scholar] [CrossRef]
- Takahashi, T. Riming Electrification as a Charge Generation Mechanism in Thunderstorms. J. Atmos. Sci. 1978, 35, 1536–1548. [Google Scholar] [CrossRef]
- Saunders, C.P.R.; Peck, S. Laboratory studies of the influence of rime accretion rate on charge transfer during crystal/graupel collisions. J. Geophys. Res. 2008, 1031, 13949–13956. [Google Scholar] [CrossRef]
- Khain, A.; Lynn, B.; Dudhia, J. Aerosol Effects on Intensity of Landfalling Hurricanes as Seen from Simulations with the WRF Model with Spectral Bin Microphysics. J. Atmos. Sci. 2010, 67, 365–384. [Google Scholar] [CrossRef] [Green Version]
- Rosenfeld, D.; Lohmann, U.; Raga, G.B.; O’Dowd, C.D.; Kulmala, M.; Fuzzi, S.; Reissell, A.; Andreae, M.O. Flood or drought: How do aerosols affect precipitation? Science 2008, 321, 1309–1313. [Google Scholar] [CrossRef] [PubMed] [Green Version]
- Thompson, G.; Eidhammer, T. A Study of Aerosol Impacts on Clouds and Precipitation Development in a Large Winter Cyclone. J. Atmos. Sci. 2014, 71, 3636–3658. [Google Scholar] [CrossRef]
- Poliukhov, A.A.; Chubarova, N.E.; Blinov, D.V.; Tarasova, T.A.; Makshtas, A.P.; Muskatel, H. Radiation Effects of Different Types of Aerosol in Eurasia According to Observations and Model Calculations. Russ. Meteorol. Hydrol. 2019, 44, 579–587. [Google Scholar] [CrossRef]
- Da Silva, N.; Mailler, S.; Drobinski, P. Aerosol indirect effects on the temperature–precipitation scaling. Atm. Chem. Phys. 2020, 20, 6207–6223. [Google Scholar] [CrossRef]
- Zhao, P.; Li, Z.; Xiao, H.; Wu, F.; Zheng, Y.; Cribb, M.C.; Jin, X.; Zhou, Y. Distinct aerosol effects on cloud-to-ground lightning in the plateau and basin regions of Sichuan, Southwest China. Atm. Chem. Phys. 2020, 20, 13379–13397. [Google Scholar] [CrossRef]
- Yair, Y. Lightning hazards to human societies in a changing climate. Env. Res. Lett. 2018, 13, 13. [Google Scholar] [CrossRef]
- Thornton, J.A.; Virts, K.S.; Holzworth, R.H.; Mitchell, T.P. Lightning enhancement over major oceanic shipping lanes. Geophys. Res. Lett. 2017, 44, 9102–9111. [Google Scholar] [CrossRef] [Green Version]
- Sun, M.; Liu, D.; Qie, X.; Mansell, E.R.; Yair, Y.; Fierro, A.O.; Yuan, S.; Chen, Z.; Wang, D. Aerosol effects on electrification and lightning discharges in a multicell thunderstorm simulated by the WRF-ELEC model. Atm. Chem. Phys. 2021, 21, 14141–14158. [Google Scholar] [CrossRef]
- Zheng, D.; Zhang, Y.; Meng, Q.; Lu, W.; Zhong, M. Lightning activity and electrical structure in a thunderstorm that continued for more than 24h. Atmos. Res. 2010, 97, 241–256. [Google Scholar] [CrossRef]
- Reliable Prognosis. Weather for 243 Countries of the World. Available online: https://rp5.ru/ (accessed on 15 February 2023).
- Doppler Meteorological Radar <<DMRL-C>> Description. Available online: lemz.ru/en/dmrl-c/ (accessed on 17 February 2023).
- Lightning Detection EFM-100 Atmospheric Electric Field Monitor: Installation/Operators Guide for model EFM-100C. Available online: www.boltek.com/downloads/efm-100/ (accessed on 16 February 2023).
- Klimenko, V.V.; Mareev, E.A.; Shatalina, M.V.; Shlyugaev, Y.V.; Sokolov, V.V.; Bulatov, A.A.; Denisov, V.P. On Statistical Characteristics of Electric Fields of the Thunderstorm Clouds in the Atmosphere. Radiophys. Quantum Electron. 2014, 56, 778–787. [Google Scholar] [CrossRef]
- World Wide Lightning Location Network. Available online: https://wwlln.net (accessed on 15 February 2023).
- Weather Research & Forecasting Model (WRF). Available online: https://www.mmm.ucar.edu/models/wrf (accessed on 15 February 2023).
- Skamarock, W.C.; Klemp, J.B.; Dudhia, J.; Gill, D.O.; Barker, D.; Duda, M.G.; Huang, X.-Y.; Wang, W.; Powers, J.G. A Description of the Advanced Research WRF Version 3; (No. NCAR/TN-475+STR); University Corporation for Atmospheric Research: Boulder, CO, USA, 2008; p. 125. [Google Scholar]
- Thompson, G.; Field, P.R.; Rasmussen, R.M.; Hall, W.D. Explicit Forecasts of Winter Precipitation Using an Improved Bulk Microphysics Scheme. Part II: Implementation of a New Snow Parameterization. Mon. Weather. Rev. 2009, 136, 5095–5115. [Google Scholar] [CrossRef]
- Ginoux, P.; Chin, M.; Tegen, I.; Prospero, J.M.; Holben, B.; Dubovik, O.; Lin, S.-J. Sources and distributions of dust aerosols simulated with the GOCART model. J. Geophys. Res. 2001, 106, 20255–20273. [Google Scholar] [CrossRef]
- Dementyeva, S.O.; Ilin, N.V.; Mareev, E.A. Calculation of the Lightning Potential Index and Electric Field in Numerical Weather Prediction Models. Izv. Atmos. Ocean. Phys. 2015, 51, 210–217. [Google Scholar] [CrossRef]
- Saunders, C.P.R. Charge Separation Mechanisms in Clouds. Space Sci. Rev. 2008, 137, 335–353. [Google Scholar] [CrossRef]
- Guo, Z.; Zhao, J.; Zhao, P.; He, M.; Yang, Z.; Su, D. Simulation Study of Microphysical and Electrical Processes of a Thunderstorm in Sichuan Basin. Atmosphere 2023, 14, 574. [Google Scholar] [CrossRef]
- Volland, H. Atmospheric Electrodynamics; Springer: Berlin, Germany, 1984; p. 208. [Google Scholar]
- Shatalina, M.V.; Ilin, N.V.; Mareev, E.A. Characteristics of hydrometeorological hazards in Nizhny Novgorod according to in-situ observations of electric field. Russ. Meteorol. Hydrol. 2021, 6, 107–111. [Google Scholar] [CrossRef]
- Holzworth, R.; Brundell, J.; McCarthy, M.; Jacobson, A.; Rodger, C.; Anderson, T. Lightning in the Arctic. Geophys. Res. Lett. 2021, 48, e2020GL091366. [Google Scholar] [CrossRef]
- Kaplan, J.O.; Lau, K.H.-K. The WGLC global gridded lightning climatology and time series. Earth Syst. Sci. Data 2021, 13, 3219–3237. [Google Scholar] [CrossRef]
- Marshall, T.C.; Stolzenburg, M. Voltage inside and just above thunderstorms. J. Geophys. Res. 2001, 106, 4757–4768. [Google Scholar] [CrossRef]
- Stolzenburg, M.; Marshall, T.C. Serial profiles of electrostatic potential in five New Mexico thunderstorms. J. Geophys. Res. 2008, 113, D13207. [Google Scholar] [CrossRef] [Green Version]
- Buguet, M.; Lalande, P.; Laroche, P.; Blanchet, P.; Bouchard, A.; Chazottes, A. Thundercloud Electrostatic Field Measurements during the Inflight EXAEDRE Campaign and during Lightning Strike to the Aircraft. Atmosphere 2021, 12, 1645. [Google Scholar] [CrossRef]
- Hariharan, B.; Chandra, A.; Dugad, S.R.; Gupta, S.K.; Jagadeesan, P.; Jain, A.; Mohanty, P.K.; Morris, S.D.; Nayak, P.K.; Rakshe, P.S.; et al. Measurement of the Electrical Properties of a Thundercloud Through Muon Imaging by the GRAPES-3 Experiment. Phys. Rev. Lett. 2019, 122, 105101. [Google Scholar] [CrossRef] [PubMed] [Green Version]
- Shatalina, M.V.; Dementyeva, S.O.; Mareev, E.A. Monitoring and modeling of thunderstorm events in the Nizhny Novgorod region: Intense thunderstorm on June 1–2, 2015. Russ. Meteorol. Hydrol. (In Russ.) 2016, 11, 81–87. [Google Scholar]
- Mason, B.J. A Critical Examination of Theories of Charge Generation in Thunderstorms. Tellus 1953, 5, 446–460. [Google Scholar] [CrossRef]
- Fan, J.; Rosenfeld, D.; Zhang, Y.; Giangrande, S.E.; Li, Z.; Machado, L.A.T.; Martin, S.T.; Yang, Y.; Wang, J.; Artaxo, P.; et al. Substantial convection and precipitation enhancements by ultrafine aerosol particles. Science 2018, 359, 411–418. [Google Scholar] [CrossRef] [Green Version]
- Russian Science Foundation: Project Card. Available online: https://rscf.ru/project/21-77-00089/ (accessed on 30 March 2023).
- Data Directory. Available online: https://eee.ipfran.ru/files/lightning-atmosphere-2023 (accessed on 30 March 2023).
Figure 1.
Locations of the computational domains used for simulations of thunderstorms in the Nizhny Novgorod region. The area outlined by in green corresponds to the external domain, and the area outlined in blue corresponds to the internal domain, (left panel). The center of the computational area is chosen to coincide with the location of the meteorological radar marked with the red dot. The right panel presents the layout of the measurement points in Nizhny Novgorod: the electric field mill and weather radar. The right panel corresponds to the internal domain outlined in the left panel.

Figure 2.
Illustration of the efficiency of lightning detection using field mill <<Boltek EFM-100>> on the example of lightning activity on 13–14 July 2020 in the Nizhny Novgorod region. Left panel: all lightning events detected by the WWLLN within a radius of 100 km from the observation point are shown by the blue color; the discharges that coincided in time with the discharges determined according to the EFM measurements are marked by the red color. Right panel: the ratio of the number of lightning events registered by both the EFM and WWLLN to the number of all lightning events detected by the WWLLN.

Figure 3.
The number of lightnings detected by WWLLN in the area under consideration per week: year-by-year trend. Total number of the detected lightnings for each year is labeled on the chart.
Figure 3.
The number of lightnings detected by WWLLN in the area under consideration per week: year-by-year trend. Total number of the detected lightnings for each year is labeled on the chart.

Figure 4.
The number of discharges detected by the WWLLN and Boltek EFM-100.

Figure 5.
Maximum values of radar reflectivity in the vertical column for several specific moments of the thunderstorm in the Nizhny Novgorod region on 13 July 2020. Time series of the panels include sets for 15:30 UTC (first row) and 22:40 UTC (second row). Left column—DMRL-C observations; central and right columns—results of numerical simulation with non-aerosol and aerosol parametrizations of the microphysics, respectively.

Figure 6.
Maximum values of radar reflectivity at an altitude of 2 km at 3 h intervals for the thunderstorm in the Nizhny Novgorod region on 13–14 July 2020. Time series of the panels include 3-hour sets from 12:00 UTC 13.07.2020 (first row) to 00:00 14.07.2020 (last row) with a 3-hour step. Left column—DMRL-C observations, central and right columns—results of numerical simulation with non-aerosol and aerosol parametrizations of microphysics, respectively.

Figure 7.
Lightning flash rate calculated for every cell at 3 h intervals. Time domain of the panels is from 12:00 UTC 13 July 2020 to 03:00 14 July 2020.
Figure 7.
Lightning flash rate calculated for every cell at 3 h intervals. Time domain of the panels is from 12:00 UTC 13 July 2020 to 03:00 14 July 2020.

Figure 8.
Thunderstorm in the Nizhny Novgorod region on 13–14 July 2020. Upper panel: time dependence of the maximum value of electric potential for non-aerosol parametrization of the microphysics. Central panel: time dependence of the maximum value of electric potential for aerosol parametrization of the microphysics. Lower panel: time dependence of the ratio of the maximum values of electric potential for non-aerosol and aerosol parametrizations of microphysics. The vertical axis is on a logarithmic scale.

Figure 9.
Maximum absolute values of the intracloud electric field every 3 h from 12:00 13 July 2020 to 03:00 14 July 2020, obtained by modeling with non-aerosol parametrization of the microphysics.
Figure 9.
Maximum absolute values of the intracloud electric field every 3 h from 12:00 13 July 2020 to 03:00 14 July 2020, obtained by modeling with non-aerosol parametrization of the microphysics.

Figure 10.
Maximum absolute values of the intracloud electric field strength every 3 h from 12:00 13 July 2020 to 03:00 14 July 2020, obtained by modeling with aerosol parametrization of the microphysics.
Figure 10.
Maximum absolute values of the intracloud electric field strength every 3 h from 12:00 13 July 2020 to 03:00 14 July 2020, obtained by modeling with aerosol parametrization of the microphysics.

Figure 11.
Upper panel: volume of thunderclouds (sum of volume cells) observed by meteorological radar with radar reflectivity more than 45 dBZ. Central panel: volume of thunderclouds with simulated reflectivity more than 60 dBZ. Lower panel: number of lightning discharges in 210 × 210 km domain every 10 min according to the WWLLN data.

Disclaimer/Publisher’s Note: The statements, opinions and data contained in all publications are solely those of the individual author(s) and contributor(s) and not of MDPI and/or the editor(s). MDPI and/or the editor(s) disclaim responsibility for any injury to people or property resulting from any ideas, methods, instructions or products referred to in the content. |
© 2023 by the authors. Licensee MDPI, Basel, Switzerland. This article is an open access article distributed under the terms and conditions of the Creative Commons Attribution (CC BY) license (https://creativecommons.org/licenses/by/4.0/).
Share and Cite
MDPI and ACS Style
Dementyeva, S.; Shatalina, M.; Popykina, A.; Sarafanov, F.; Kulikov, M.; Mareev, E. Trends and Features of Thunderstorms and Lightning Activity in the Upper Volga Region. Atmosphere 2023, 14, 674. https://doi.org/10.3390/atmos14040674
AMA Style
Dementyeva S, Shatalina M, Popykina A, Sarafanov F, Kulikov M, Mareev E. Trends and Features of Thunderstorms and Lightning Activity in the Upper Volga Region. Atmosphere. 2023; 14(4):674. https://doi.org/10.3390/atmos14040674
Chicago/Turabian StyleDementyeva, Svetlana, Maria Shatalina, Alena Popykina, Fedor Sarafanov, Mikhail Kulikov, and Evgeny Mareev. 2023. "Trends and Features of Thunderstorms and Lightning Activity in the Upper Volga Region" Atmosphere 14, no. 4: 674. https://doi.org/10.3390/atmos14040674
Note that from the first issue of 2016, this journal uses article numbers instead of page numbers. See further details here.