
Meteorological Influences on Short-Term Carbon-Water Relationships in Two Forests in Subtropical China


1
Key Laboratory for Humid Subtropical Eco-Geographical Processes of the Ministry of Education, Fujian Normal University, Fuzhou 350117, China
2
School of Geographical Sciences, Fujian Normal University, Fuzhou 350117, China
3
Department of Geography and Planning, University of Toronto, Toronto, ON M5S 3G3, Canada
*
Author to whom correspondence should be addressed.
Atmosphere 2023, 14(3), 457; https://doi.org/10.3390/atmos14030457
Submission received: 2 February 2023
/
Revised: 19 February 2023
/
Accepted: 22 February 2023
/
Published: 24 February 2023
(This article belongs to the Special Issue Forests and Climate Interactions)
Abstract
:Carbon and water fluxes in ecosystems are tightly coupled by gas diffusion through stomata. However, carbon–water (C–W) relationships vary largely across time scales, vegetation types, and regions. Subtropical forests in China play an important role in the global carbon and water cycles, yet studies of C–W relationships in this region remain limited. Here, we investigated summer-time C–W relationships in this region at two subtropical sites: the evergreen broadleaved forest at Dinghushan (23.17° N, 112.53° E, 300 m) and the evergreen coniferous forest at Qianyanzhou (26.74° N, 115.06° W, 106 m), using the flux tower data from the FLUXNET2015. The C–W relationship was examined using two measures. The first was daily water use efficiency (WUE), which is the ratio of daily gross primary productivity (GPP) to evapotranspiration (ET). The second was the correlation coefficient (r) of hourly GPP and ET. Our analysis showed that the daily WUE in the two forests ranged over 4–14 mg CO2 per g H2O, higher in the coniferous forest than in the broadleaved forest. The mean values of r for hourly C–W coupling were similar at the two forests, being 0.5–0.6, which suggests asynchronous diurnal variations in GPP and ET. Both daily WUE and r were modulated by meteorological conditions. In general, high radiation, air temperature, and humidity can reduce WUE at both sites. For the broadleaved forest, the most influential factor on WUE was VPD, followed by radiation, while in the coniferous forest, VPD, air temperature, and radiation were almost equally important. For hourly C–W coupling, VPD plays a significant role. The drier the air is, the weaker the coupling in the two forests. The daily WUE and hourly C–W coupling reflect the C–W relationship from different perspectives. Both showed the strongest response to VPD but with different sensitivity.
1. Introduction
Anthropogenic climate change has become one of the most important issues nowadays. Biosphere–atmosphere interactions under this background have attracted increasing attention [1,2,3,4,5,6]. On one hand, vegetation can mitigate global warming through photosynthesis, which absorbs carbon dioxide (CO2) in the atmosphere. On the other hand, the changed climate can directly or indirectly impact vegetation, which vegetation may or may not be able to adopt. Among all the interactions, forest–climate interactions are critical because forests have high photosynthesis capacities and are also sensitive to climate change [7,8]. Two processes of particular interest are photosynthesis and transpiration. Taking the pathway of stomata, forests absorb CO2 through photosynthesis and release water through transpiration [9] to regulate the carbon–water balance between ecosystems and the atmosphere. Therefore, photosynthesis and transpiration are tightly coupled [10,11]. The relationship between these carbon and water fluxes has been the subject of multiple studies. For example, Novick et al. [12] stated that atmospheric demand plays an increasingly important role in modulating the carbon and water fluxes.
With advances in the eddy covariance (EC) measurement, the gross primary productivity (GPP) and evapotranspiration (ET) can be measured over forest sites worldwide [13]. GPP is a good measure of photosynthesis [14], while for forests with high vegetation closure, a large portion of ET comes from transpiration on no-rain days, as soil evaporation is weak. Therefore, GPP and ET are widely used in studying the carbon–water relationship [4,15], in terms of water use efficiency (WUE, a ratio of GPP to ET), or some GPP–ET coupling indices. Previous studies suggested that GPP is linearly correlated with ET in most ecosystems at yearly or monthly time steps [3,14,16]. However, GPP–ET relationships at daily or hourly time steps can be different [2,17].
The GPP and ET of an ecosystem are collectively modulated by a diversity of climatic factors. Each ecosystem has its special responses to climate conditions. In an arid grassland, the coupling between GPP and ET is limited by water [1,18]. For forests in China, vapor pressure deficit (VPD) has dominant influence on the carbon–water relationship [2]. Radiation and air temperature have a negative effect on the coupling between GPP and ET in tea gardens over southeastern China [19]. Drought can exacerbate the morning shift of GPP compared to ET in forests and can increase the frequency of decoupling of diurnal GPP and ET in grasslands [17].
Subtropical forests in China are the only oasis at the same latitudes in the world and play an important role in global carbon and water cycles [20,21]. Subtropical forests are rich in tree species, complex stand structure, and diverse environmental conditions [22,23]. Yet, how climatic conditions affect the GPP–ET relationship in China’s subtropical forests remains to be explored. Therefore, in this study, we selected two typical subtropical forests in southeast China: Dinghushan evergreen broadleaved forest and Qianyanzhou evergreen needleleaf forest. Based on the FLUXNET2015 dataset, we analyzed the short-term GPP–ET relationships using two measures: (1) daily WUE, which is the ratio of GPP to ET, and (2) r, which is the correlation coefficient of hourly GPP and ET and a measure of C–W coupling. Specific objectives were (1) to characterize daily WUE and C–W coupling in the subtropical evergreen broadleaved and evergreen needleleaf forests, and (2) to identify meteorological impacts on daily WUE and C–W coupling in the two subtropical forests.
2. Data and Methods
2.1. Study Sites
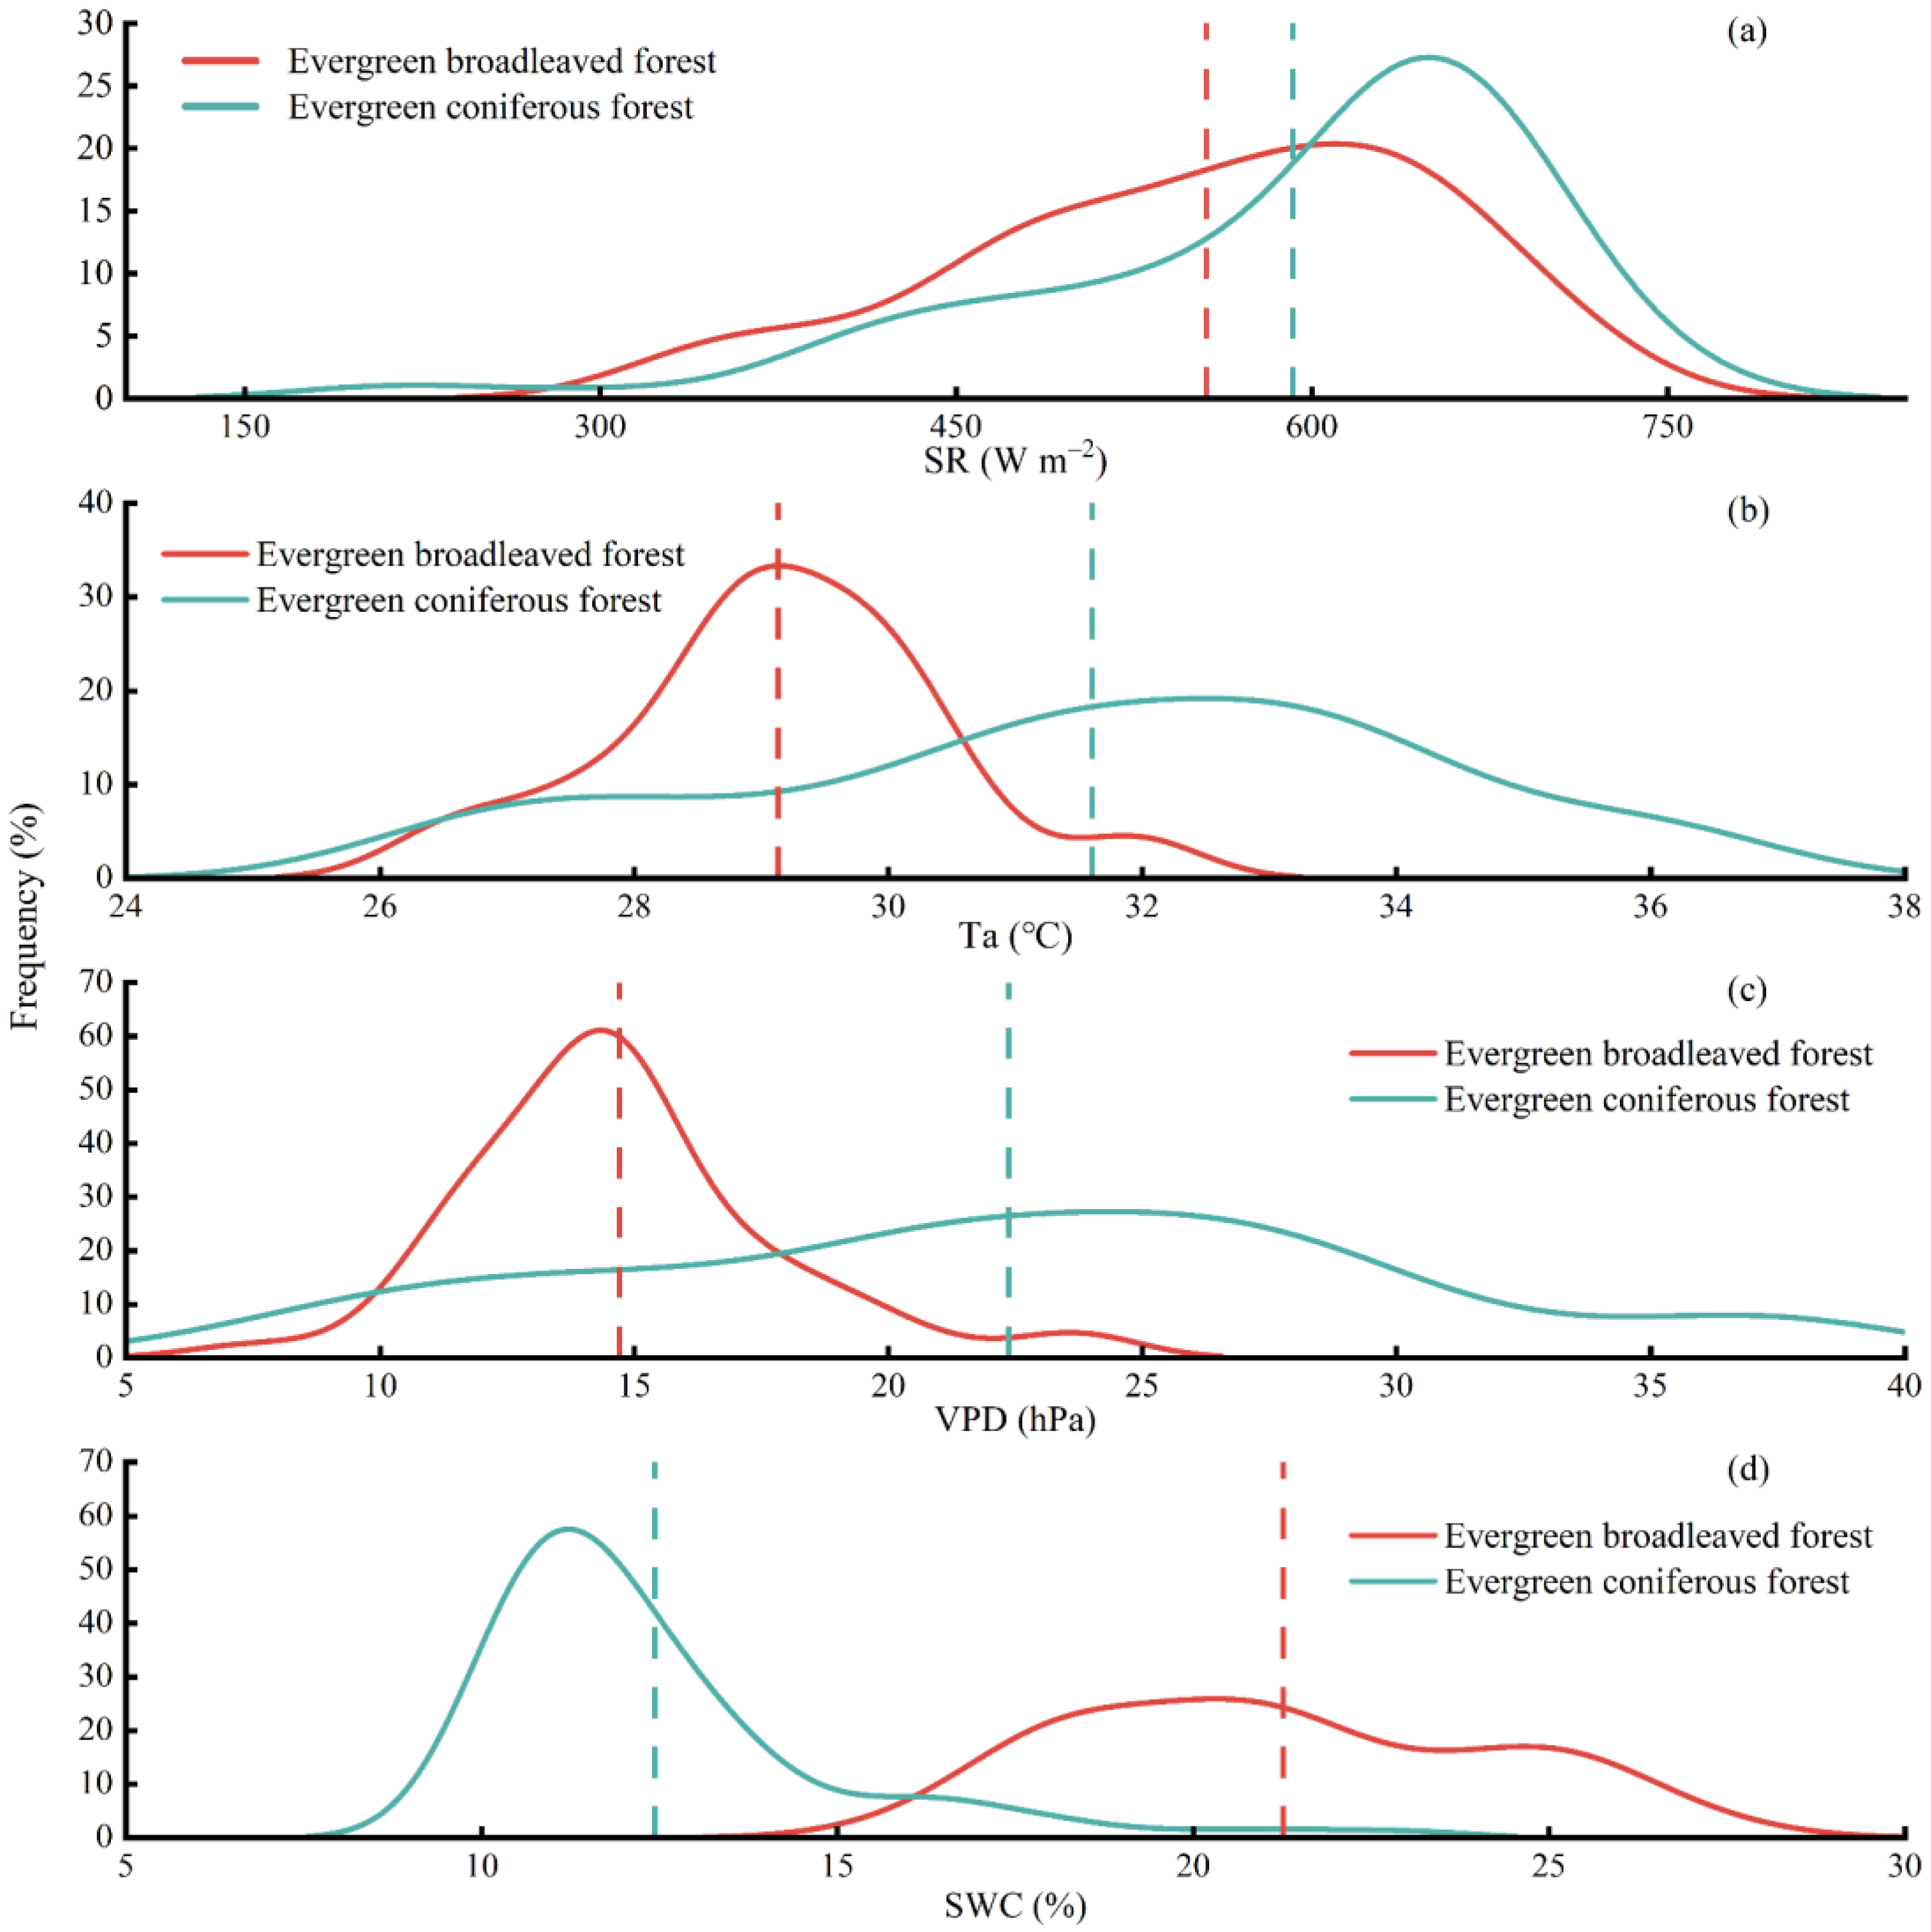
The two flux tower sites include Dinghushan subtropical evergreen broadleaved forest (CN-Din) and Qianyanzhou subtropical evergreen needleleaf forest (CN-Qia). Both sites are located in the subtropical region of southeast China, which is an important part of the Chinese terrestrial ecosystem flux research network. The data for the two sites were available from the FLUXNET2015 dataset [24]. Dinghushan and Qianyanzhou sites are representatives for subtropical ecosystems in China and have enough data coverage to span longer than 3 years. Table 1 lists the geographic, vegetation, and climate conditions at the two sites, including the annual climate conditions and summer climate conditions in the daytime. Overall, the meteorological conditions are similar to the moderate temperature and adequate precipitation, reflecting the characteristics of a subtropical monsoon climate. The histogram of meteorological variables in the summer over 2003–2005 is shown in Figure 1. Owing to the close proximity, solar radiation at the two sites was similar (Figure 1a), although the mean solar radiation at Dinghushan was ~50 W m−2 lower than at Qianyanzhou. Notably, Dinghushan is at a higher elevation (300 m) than Qianyanzhou (100 m); thus, air temperature and VPD there are lower than those at Qianyanzhou. In contrast, precipitation at Dinghushan is higher than at Qianyanzhou. Accordingly, summertime soil is much moister at Dinghushan than at Qianyanzhou. These differences in meteorological conditions can lead to different responses in WUE and C–W coupling to meteorology, which are discussed in Section 3.
2.2. Data and Data Preprocessing
The GPP, ET, and meteorological data during 2003–2005 are from the FLUXNET2015 dataset (http://fluxnet.fluxdata.org, accessed on 1 July 2022). Both sites have data from 2003 to 2005. Meteorological data include shortwave radiation (SR), air temperature (Ta), vapor pressure deficit (VPD), precipitation (P), and soil water content (SWC).
To reduce the impact of noise in the data, we filtered the data as follows [2,25]. First, only measured and high-quality gap-filled data were selected. Second, to reduce the influence of surface evapotranspiration on ET in the growing season and to minimize the impact of seasonality in leaf area index (LAI), only summer daytime data (6 a.m. to 6 p.m. in June, July, and August) were chosen, and the data on rainy days and the day after the rainy days were excluded. Since the LAI of the two forest stations both exceeded 3.5, the filtered ET value included a large portion of transpiration (T). Third, to avoid the boundary layer stability, we selected the data when the shortwave radiation was larger than 50 W m−2 and the sensible heat flux was larger than 5 W m−2.
2.3. Statistical Methods
In this study, we used two measures to illustrate the carbon–water relationship on a short-term time scale. To be specific, we focused on the relationship between daytime GPP and ET on a daily and hourly scale. We used WUE to discover the carbon–water relationship on a daily scale, while using the correlation coefficient to represent the coupling of carbon and water on a sub-daily scale.
WUE indicates the fixed carbon amount by vegetation with the consumption of per unit amount of water, which reflects the balance between carbon absorption and water supply for vegetation. The daytime WUE (hereafter referred to as WUEdt) is calculated by the ratio of daytime GPP to ET at a daily time step. To characterize the GPP–ET relationship at the sub-daily step, we used the correlation coefficient (r) between hourly GPP and ET: r(GPP, ET). The correlation strength can represent how tightly the variations in hourly GPP and ET are correlated. We only considered cases for positive r, which was 98% of the available cases at Dinghushan and 93% of the available cases at Qianyanzhou.
The response of the carbon–water relationship to meteorological factors was analyzed using a ridge regression model, which can reduce the influence of collinearity among meteorological factors [25,26,27]. All meteorological variables were standardized before conducting the regression; thus, the regression coefficient between WUE and each of the meteorological variables can describe the relative importance of that variable to the variation in WUE, and so it was for r(GPP, ET).
3. Results and Discussion
3.1. Daily Water Use Efficiency
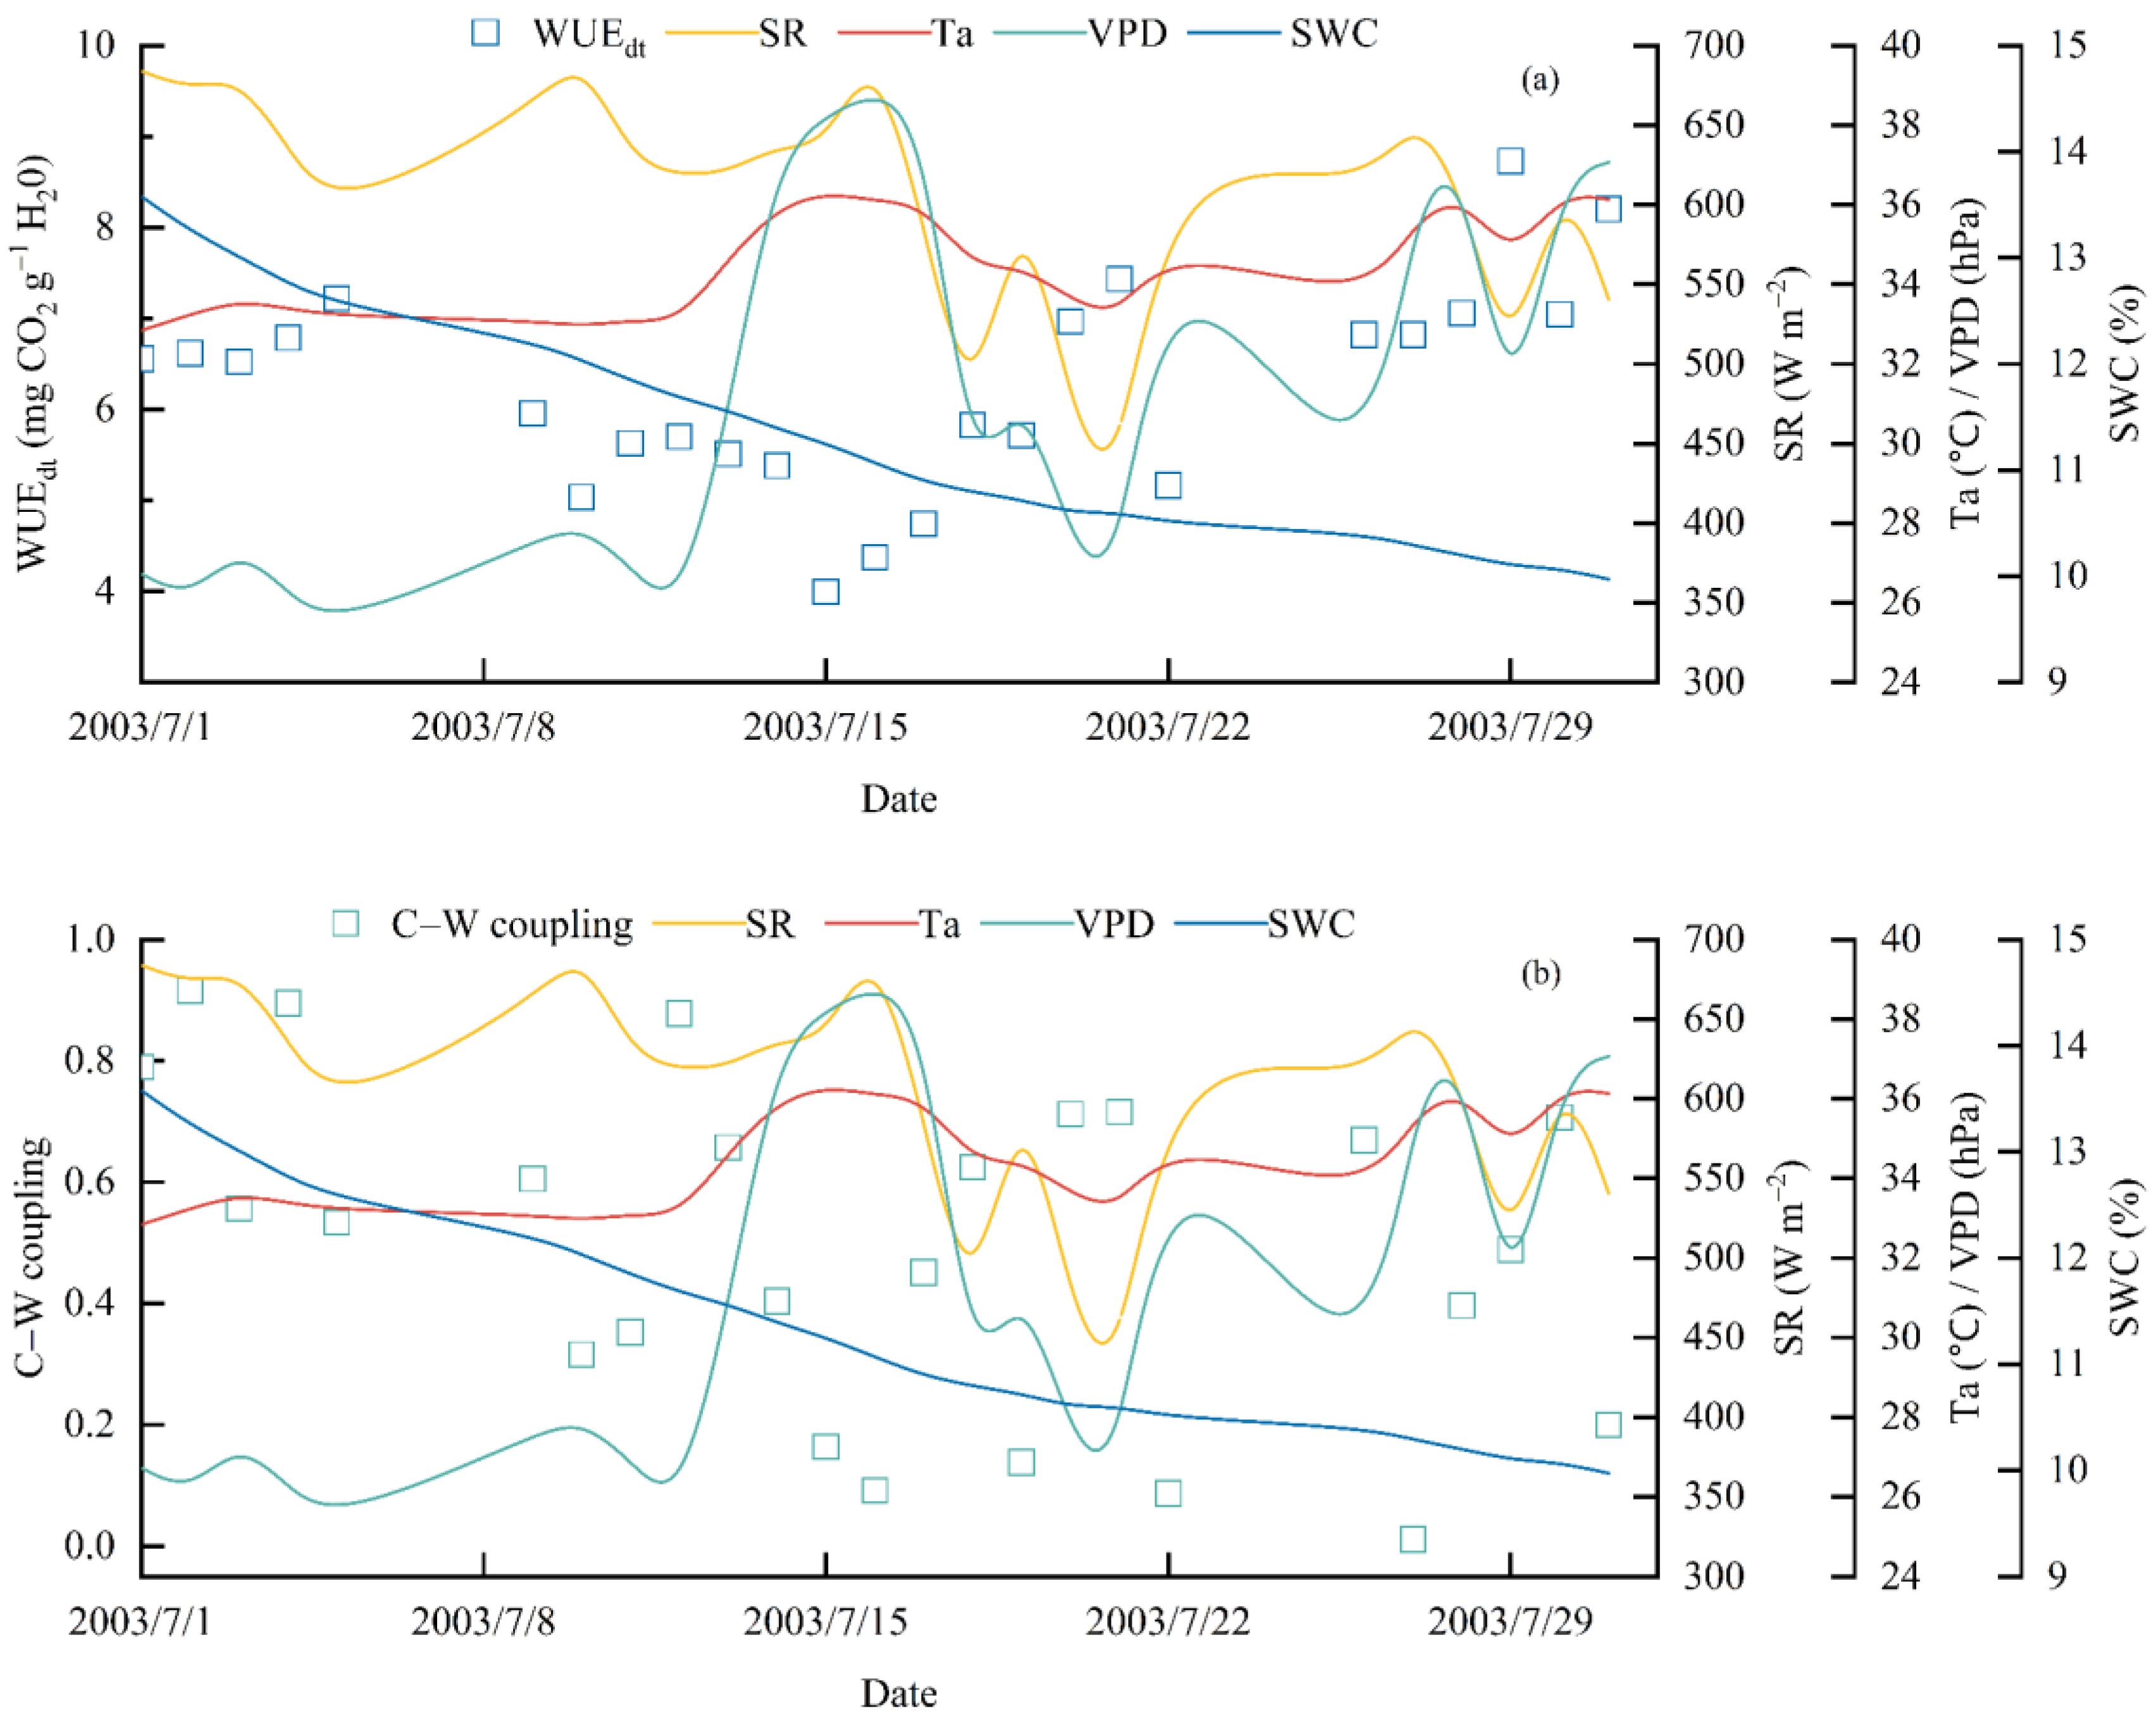
Figure 2a shows an example of daily WUEdt varying with meteorological conditions at Qianyanzhou during July 2023. There are large day-to-day variations in the WUEdt values, ranging between 4 and 9 mg CO2 per g H2O. These large variations in WUE can also be observed at the Dinghushan broadleaved forest (not shown). The WUEdt values were the lowest around 15 July 2003 when VPD, Ta, and radiation were high. WUEdt was the highest around 29 July 2003, when VPD, Ta, and radiation were comparatively low. Daily WUEdt showed low sensitivity to soil moisture content, suggesting that soil moisture was not a controlling factor for WUEdt at this site.
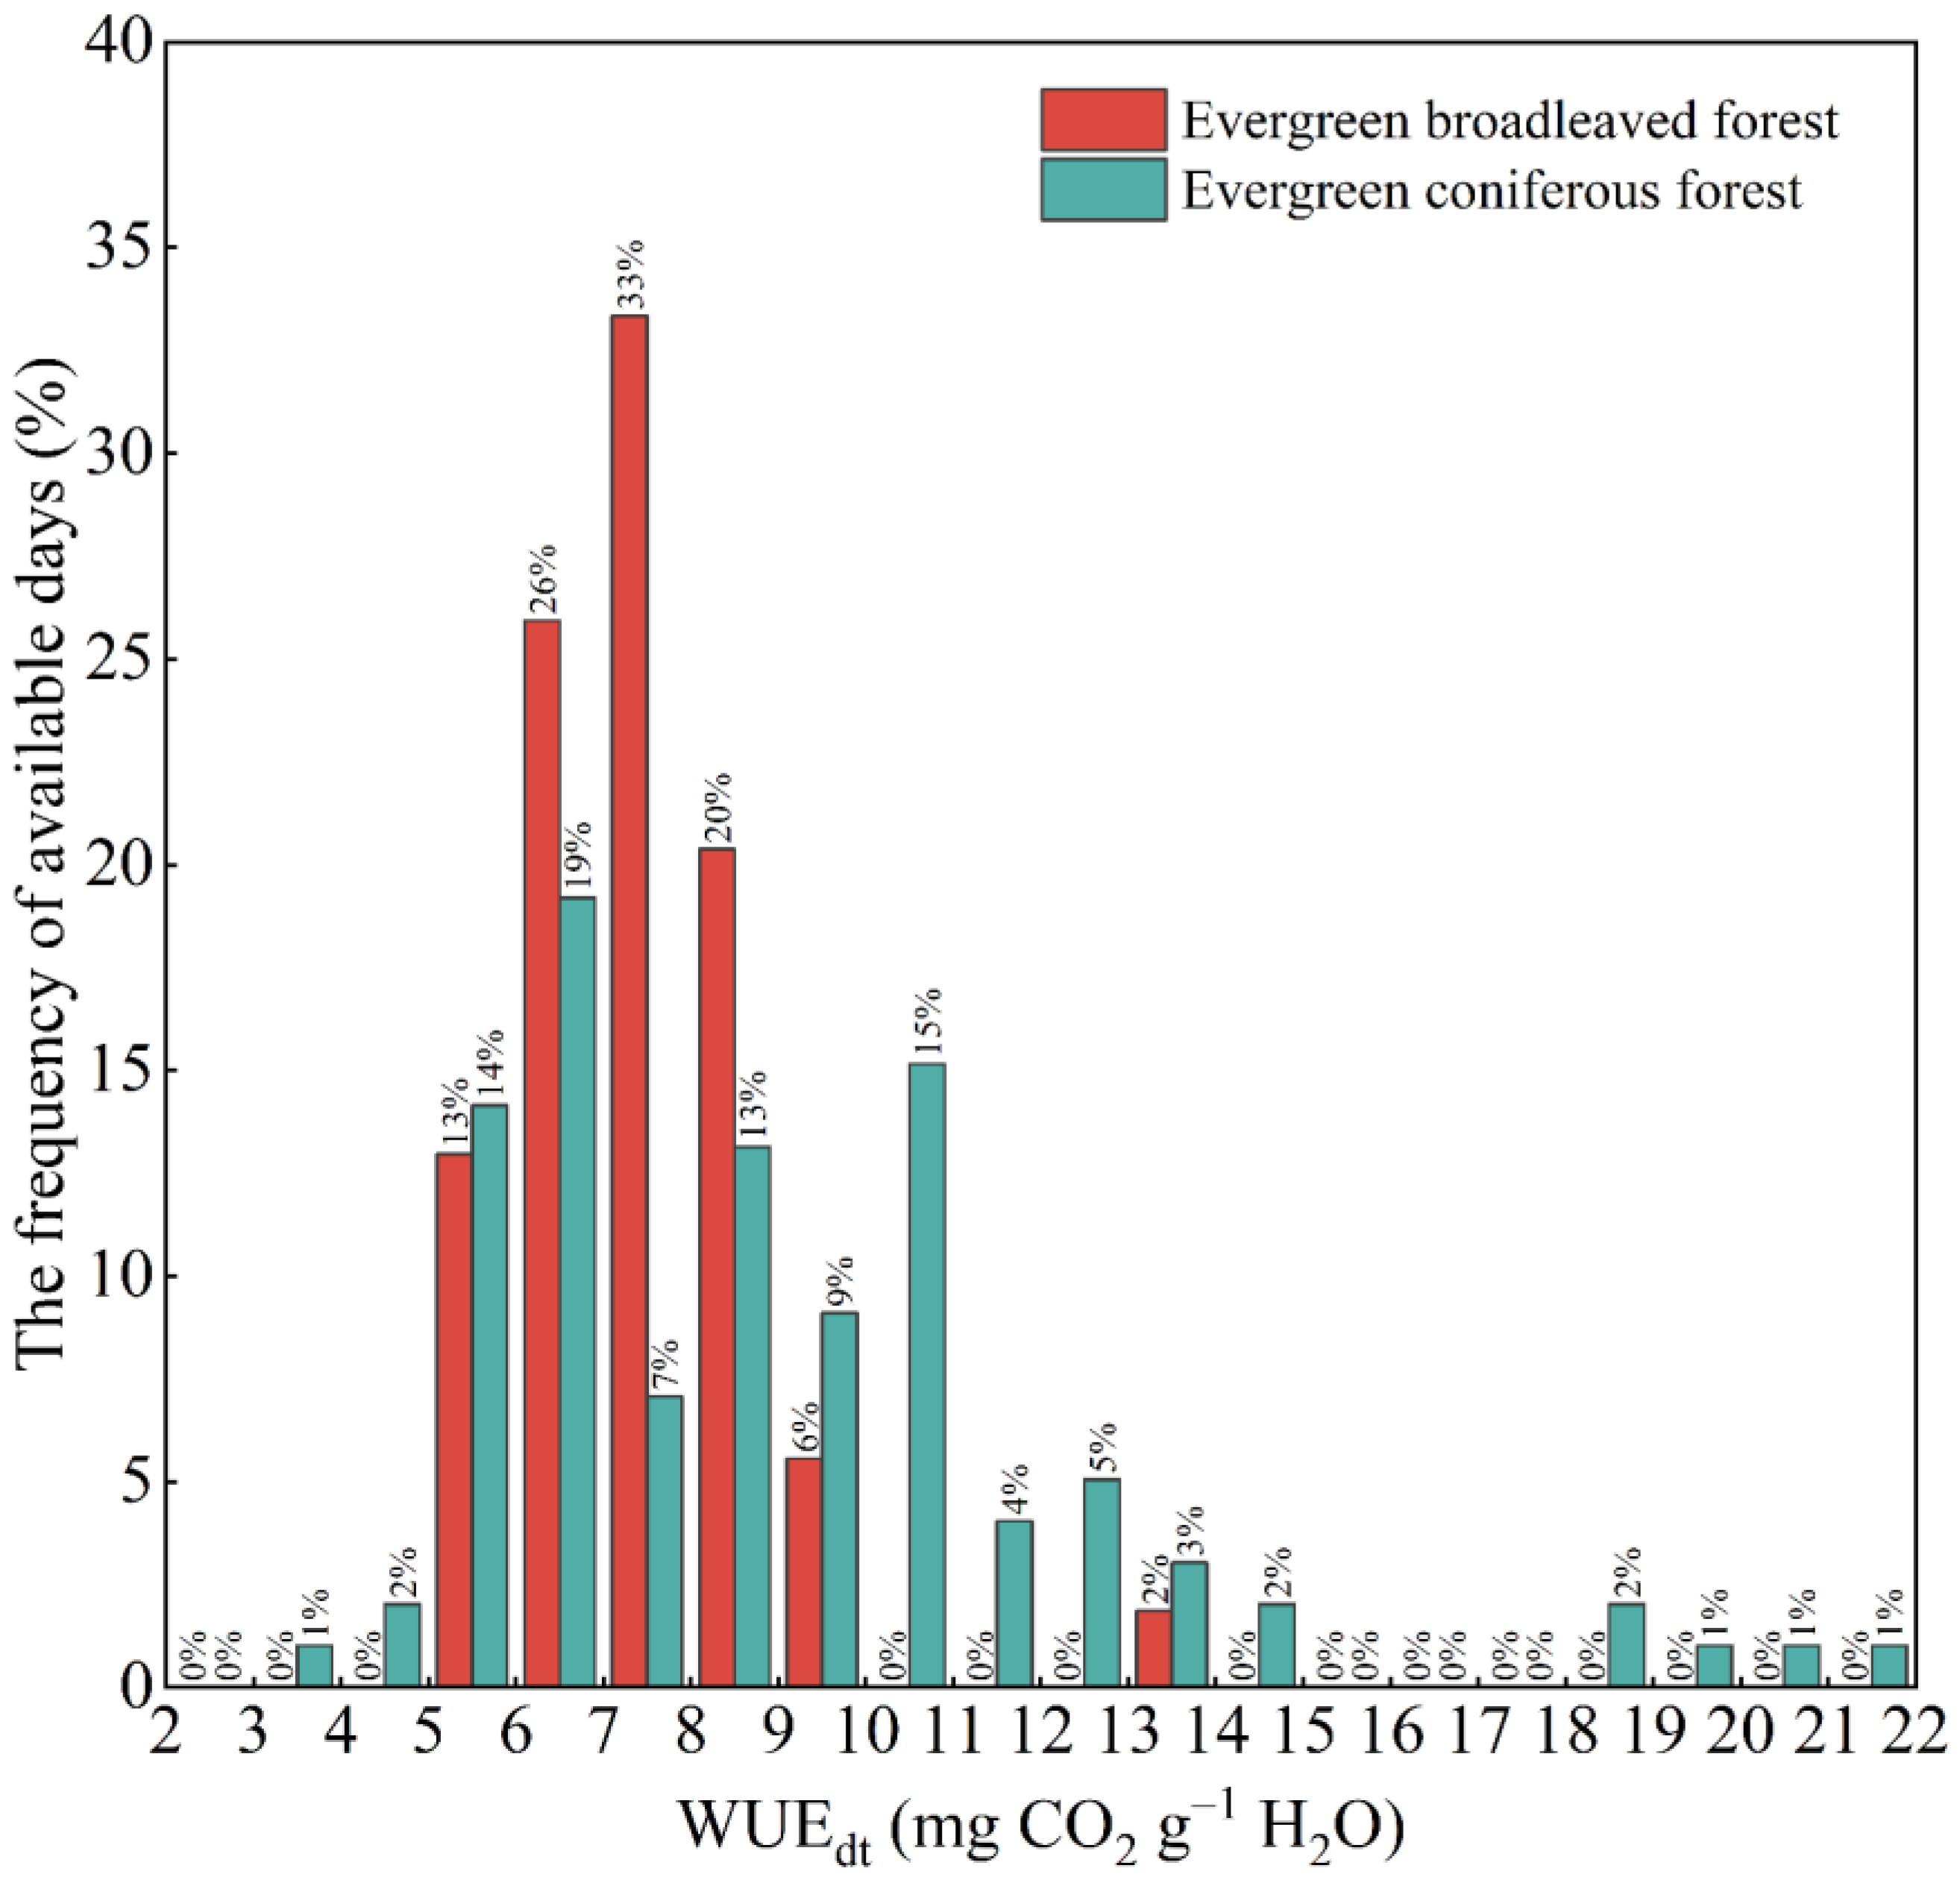
The mean WUEdt over 2003–2005 was 7.387 mg CO2 per g H2O for the broadleaved forest at Dinghushan and 9.014 mg CO2 per g H2O for the coniferous forest at Qianyanzhou (Table 2). The coniferous forest also showed larger variations in WUEdt (Figure 3), likely due to the large variations in VPD and air temperature (Figure 1). In addition, the soil of the coniferous forest is much drier than that of the broadleaved forest. The means are similar to those of forests in other subtropical regions (i.e., a pine ecosystem [28]), but the variations are smaller, as only summertime was focused on.
3.2. Meteorological Influences on Daily Water Use Efficiency
In summer, high solar radiation, air temperature, and dry air all tend to reduce daily WUE. Such WUE responses to meteorological conditions in summer are rather different from those in other seasons. This is the case for both broadleaved and needleleaf forests.
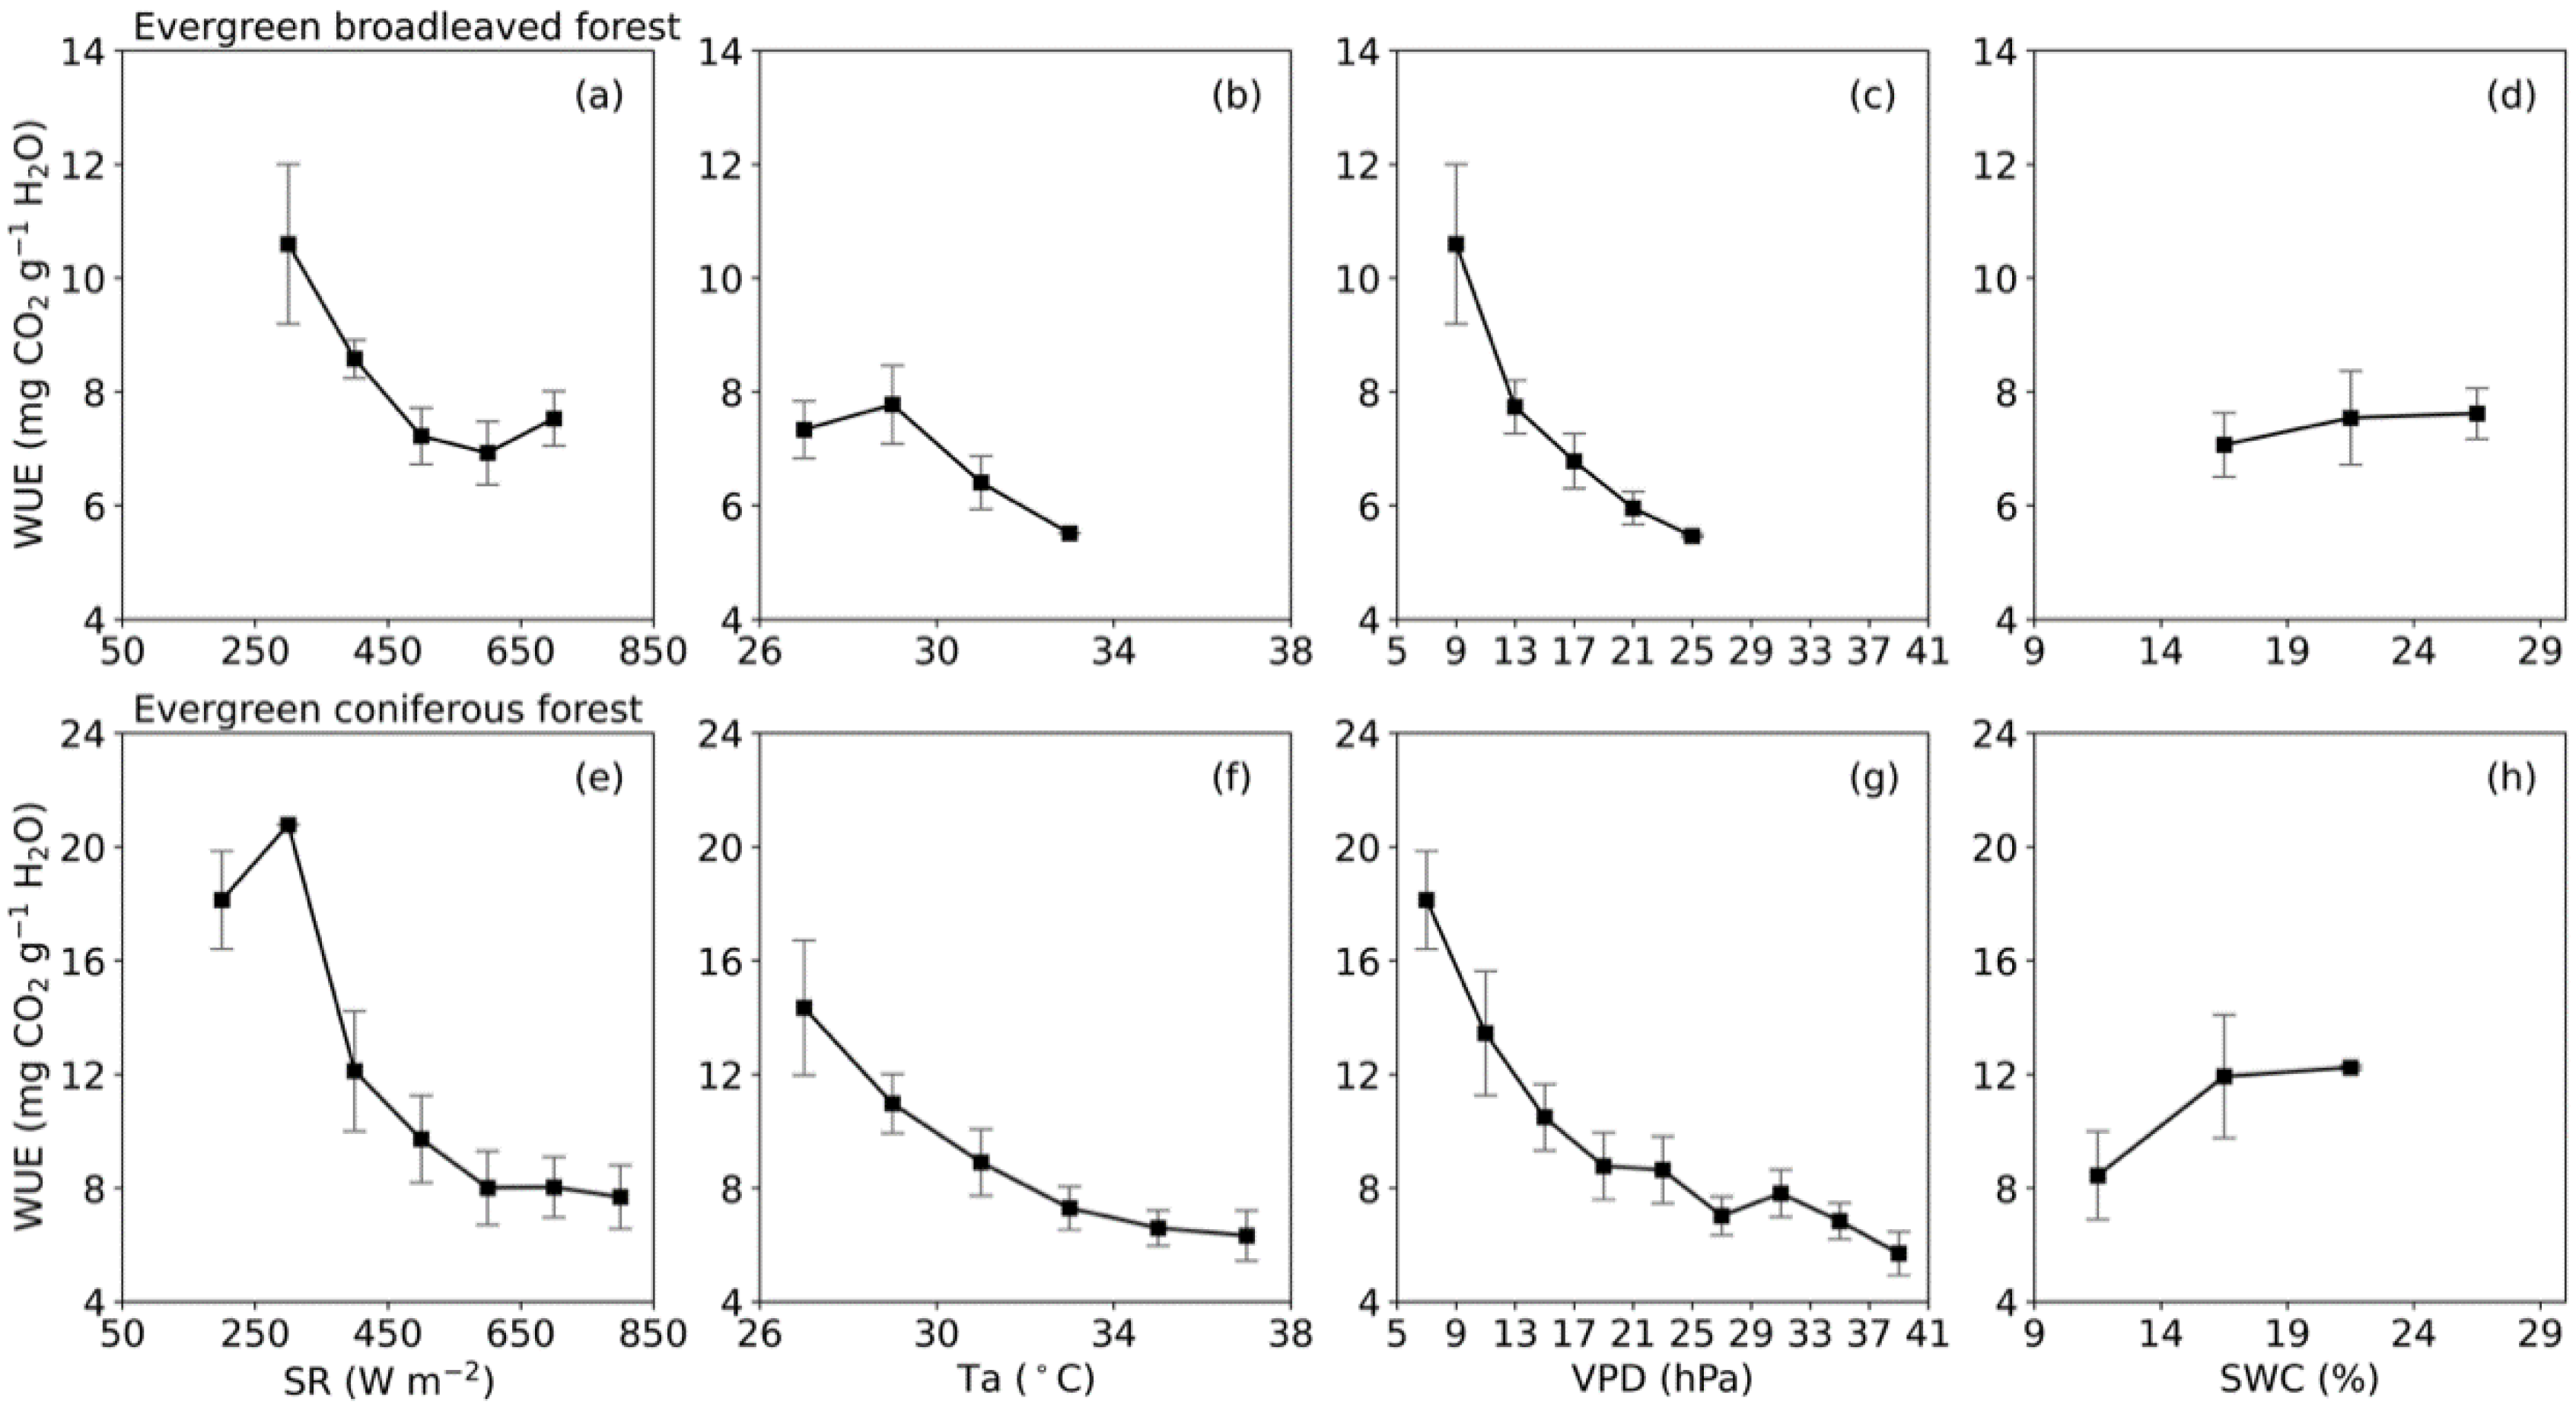
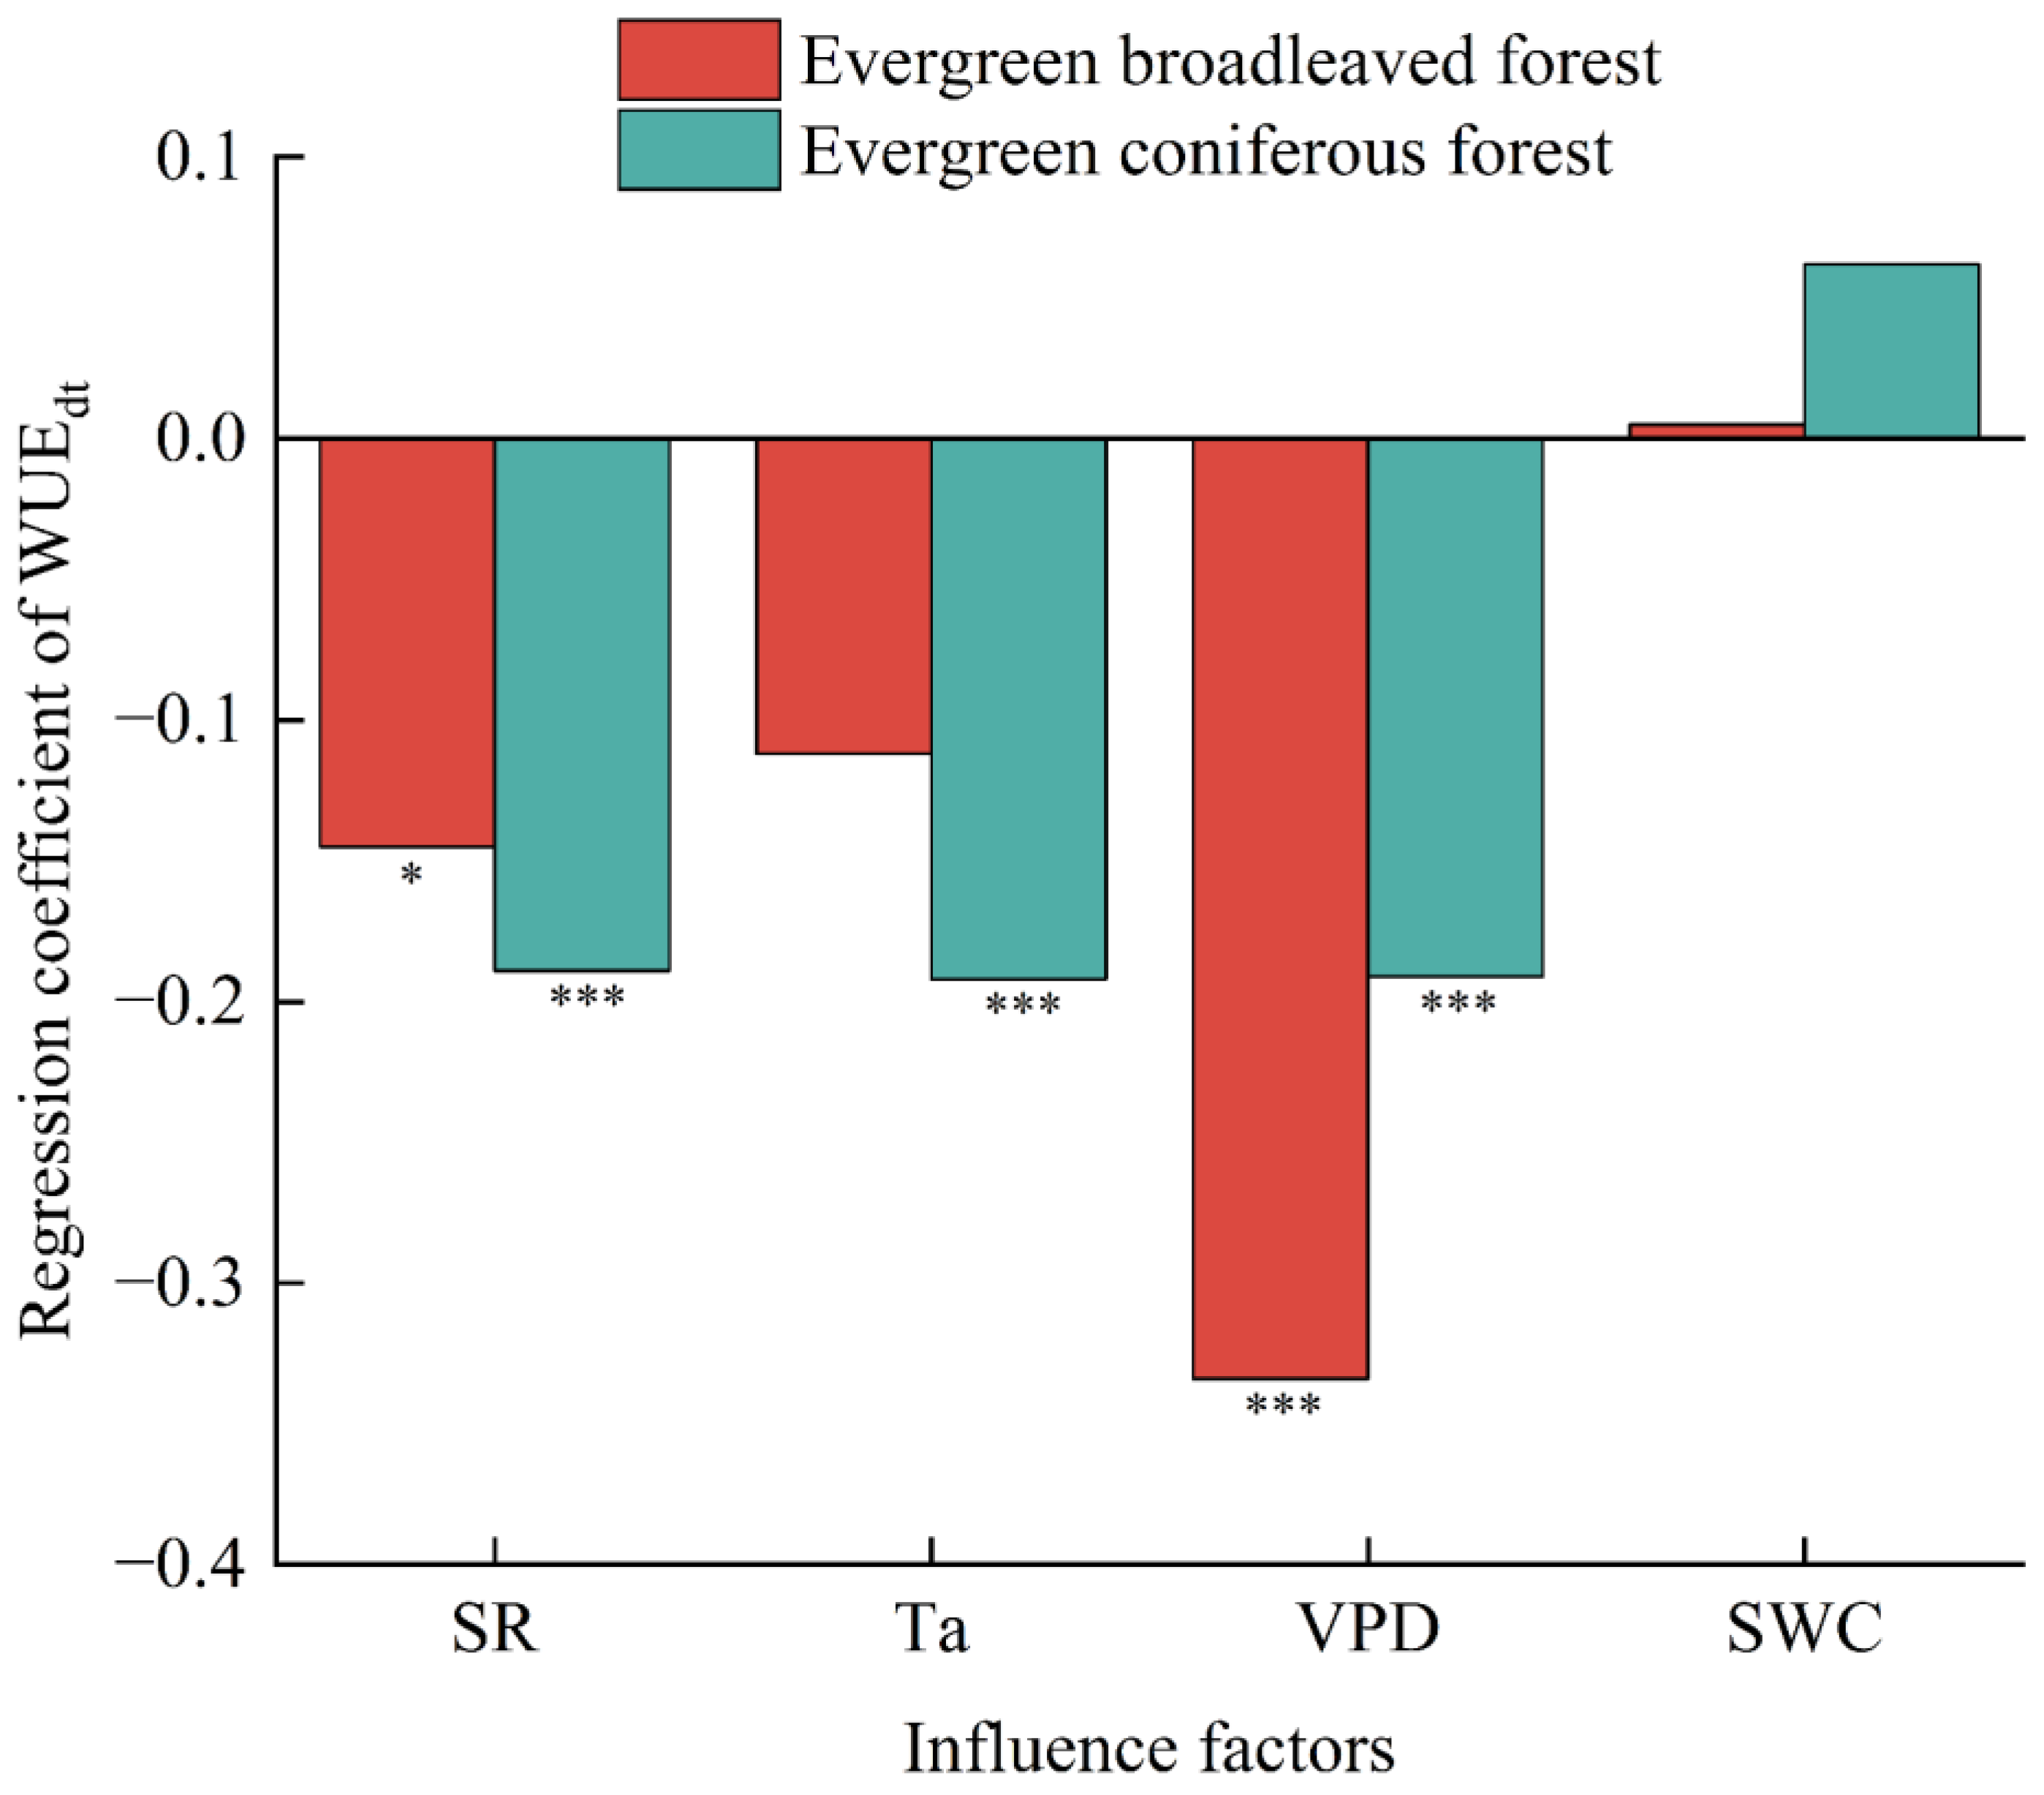
The responses of WUEdt to four meteorological factors in summer are shown for the broadleaved forest (Figure 4a–d) and coniferous forest (Figure 4e–h). In the two forests, WUEdt decreased with increases in radiation, air temperature, and VPD. However, the degree of the WUEdt responses to meteorological factors were different between the two forests. In the broadleaved forest, high VPD can reduce WUEdt most significantly. In the coniferous forest, the negative effects of VPD and air temperature on WUEdt are nearly equal, and they are the main factors affecting WUEdt. As for soil water content, WUEdt in both forests showed slight increases with increasing soil moisture, and the sensitivity is larger in the coniferous forest than in the broadleaved forest.
Meteorological factors affect the variation in WUE by controlling GPP and ET [5]. Overall, VPD is the dominant factor for WUE variation, as discussed. The negative effect of VPD on WUE was reported [2,12,29]. High VPD tends to reduce stomatal conductance in plants, limiting GPP and ET to some extent [30]. Meanwhile, if the water vapor gradient between leaves and air is high, ET still increases [31], leading to a decrease in WUE.
Solar radiation is an important factor driving photosynthesis and transpiration [15]. Under high radiation, photosynthesis saturates even if water is sufficient [32], while ET increases with radiation almost linearly [33], and thus, WUE decreases with an increase in radiation.
For the coniferous forest at Qianyanzhou, the negative effect of temperature on WUE is significant. Generally, transpiration increases with air temperature. However, photosynthesis varies with temperature roughly in a Bell curve that peaks within an optimum range of air temperature. When air temperature is higher than this range, photosynthesis decreases with temperature, but transpiration still increases with temperature, and thus WUE decreases with temperature [34]. Such a negative correlation between temperature and WUE has also been documented [2,4,35]. However, Zhang et al. [36] reported that the forest annual WUE generally decreases with temperature in the latitude of 10°–25° N and 40°–55° N but increases with temperature in the latitudes of 25°–40° N. Examining the results from Zhang et al. [36] closely, we noticed that the three latitudinal zones were drawn approximately. Qianyanzhou is located at 26.76° N, where it is likely within the zone with a negative temperature–WUE relationship extended from 10° to 25° N, at least in summer.
The sensitivity of WUEdt to various meteorological factors was assessed by the regression coefficients of the ridge regression (Figure 5). For the Dinghushan broadleaved forest, WUEdt is mostly modulated by VPD, followed by radiation, while air temperature and soil water status showed no significant effect. For the Qianyanzhou coniferous forest, radiation, air temperature, and VPD all have similarly negative effects on WUEdt. Soil moisture showed a positive but insignificant impact on WUEdt.
3.3. GPP–ET Coupling
Figure 2b shows an example of daily variation of C–W coupling in July 2003 at the Qianyanzhou site. The C–W coupling was measured by the correlation coefficient r between hourly GPP and ET in the daytime (6 a.m.–6 p.m.). The r shows large day-to-day variations between 0 and 1, which can be commonly seen in other months at both the Qianyanzhou and Dinghushan sites (not shown here). Notably, around July 15, the C–W coupling strength was reduced each day continuously for 5 days from an r close to 1 to nearly zero, when VPD kept increasing. Although WUEdt also decreased during these days (Figure 2a), the response of the C–W coupling appeared more sensitive to the change in VPD than that of WUEdt.
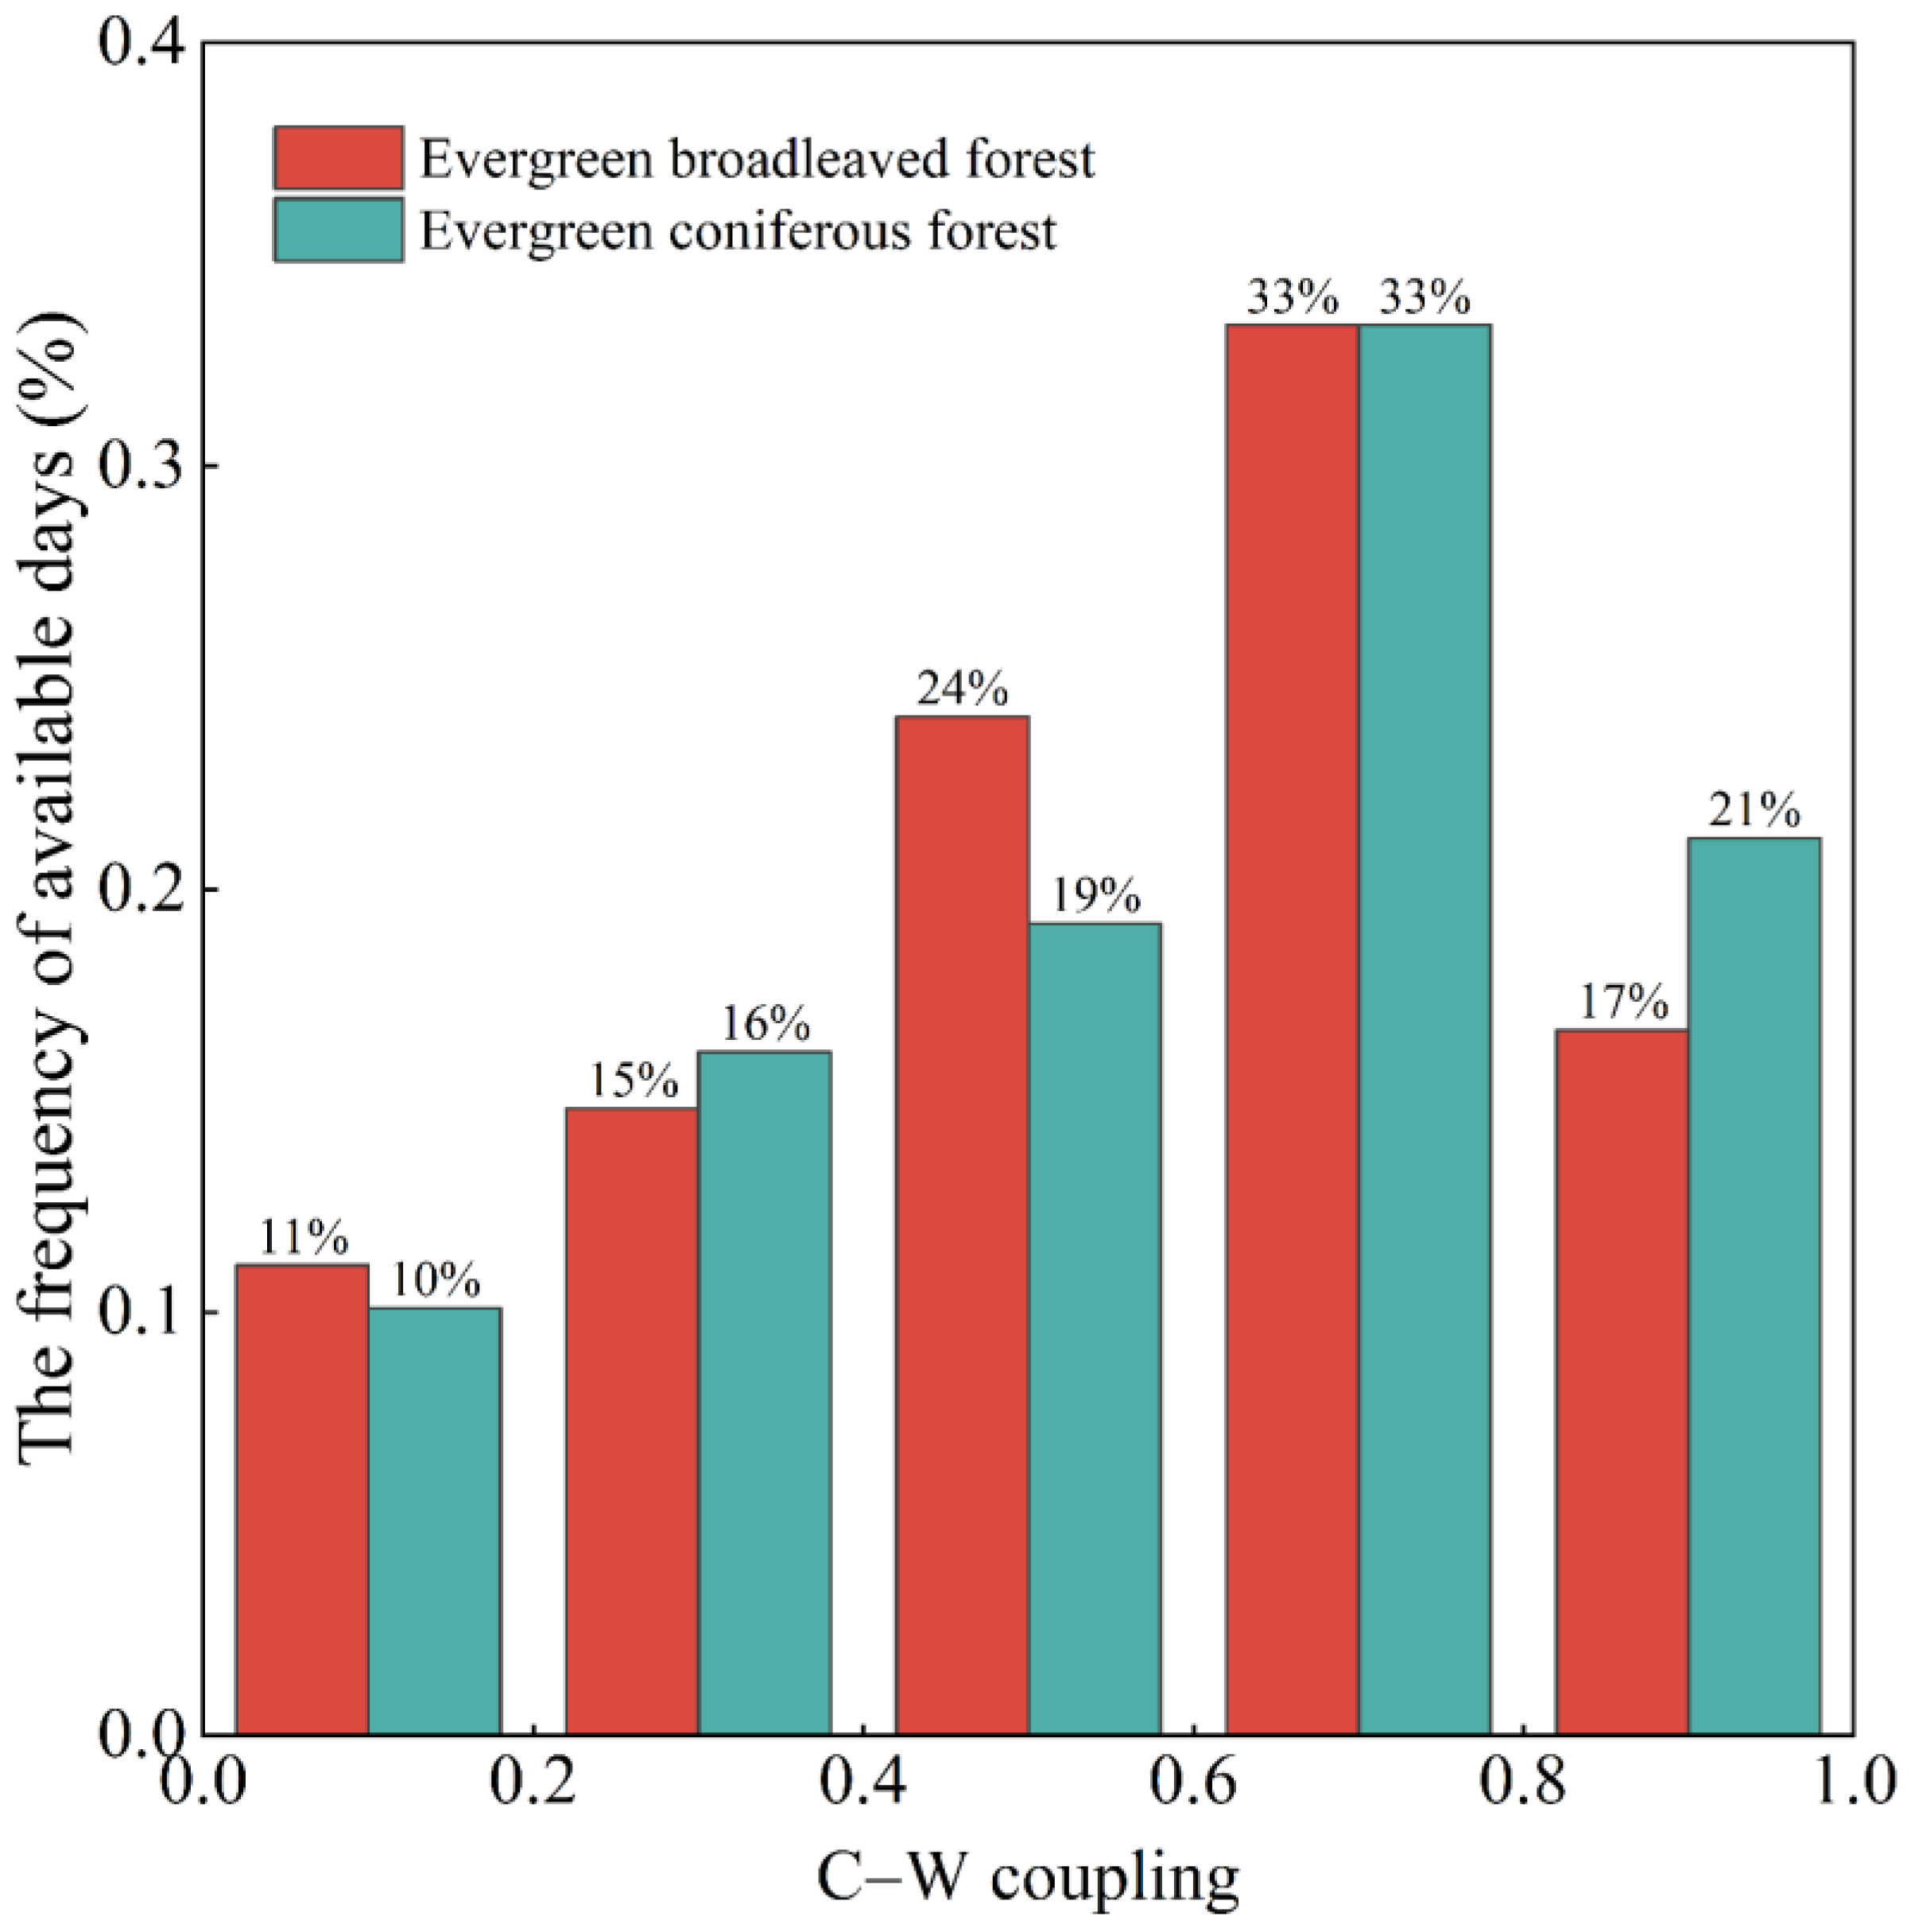
C–W coupling strength was similar at both sites, with an average r around 0.56; thus means that GPP and ET are moderately coupled during summer daytime on a sub-daily time scale. The histogram of r over 2003–2005 in the summer showed similar distributions for both broadleaved and coniferous forests (Figure 6). This histogram differs from that of WUEdt shown in Figure 3, suggesting different perspectives from which WUE and r describe C–W coupling. The r occurrence pattern shows a skewed Bell curve, being least between 0 and 0.2 (~10%) and most between 0.6 and 0.8 (~33%). The mean r values for both forests are close to 0.6, indicating a modest level of diurnal C–W coupling in the forests.
3.4. Meteorological Influences on C–W Coupling
Meteorological conditions can impact GPP, ET, and the GPP–ET relationship individually and collectively in complicated ways (Figure 2). Due to differences in meteorological conditions at the two sites, the relative importance of meteorological conditions to C–W coupling can be different in the two forests.
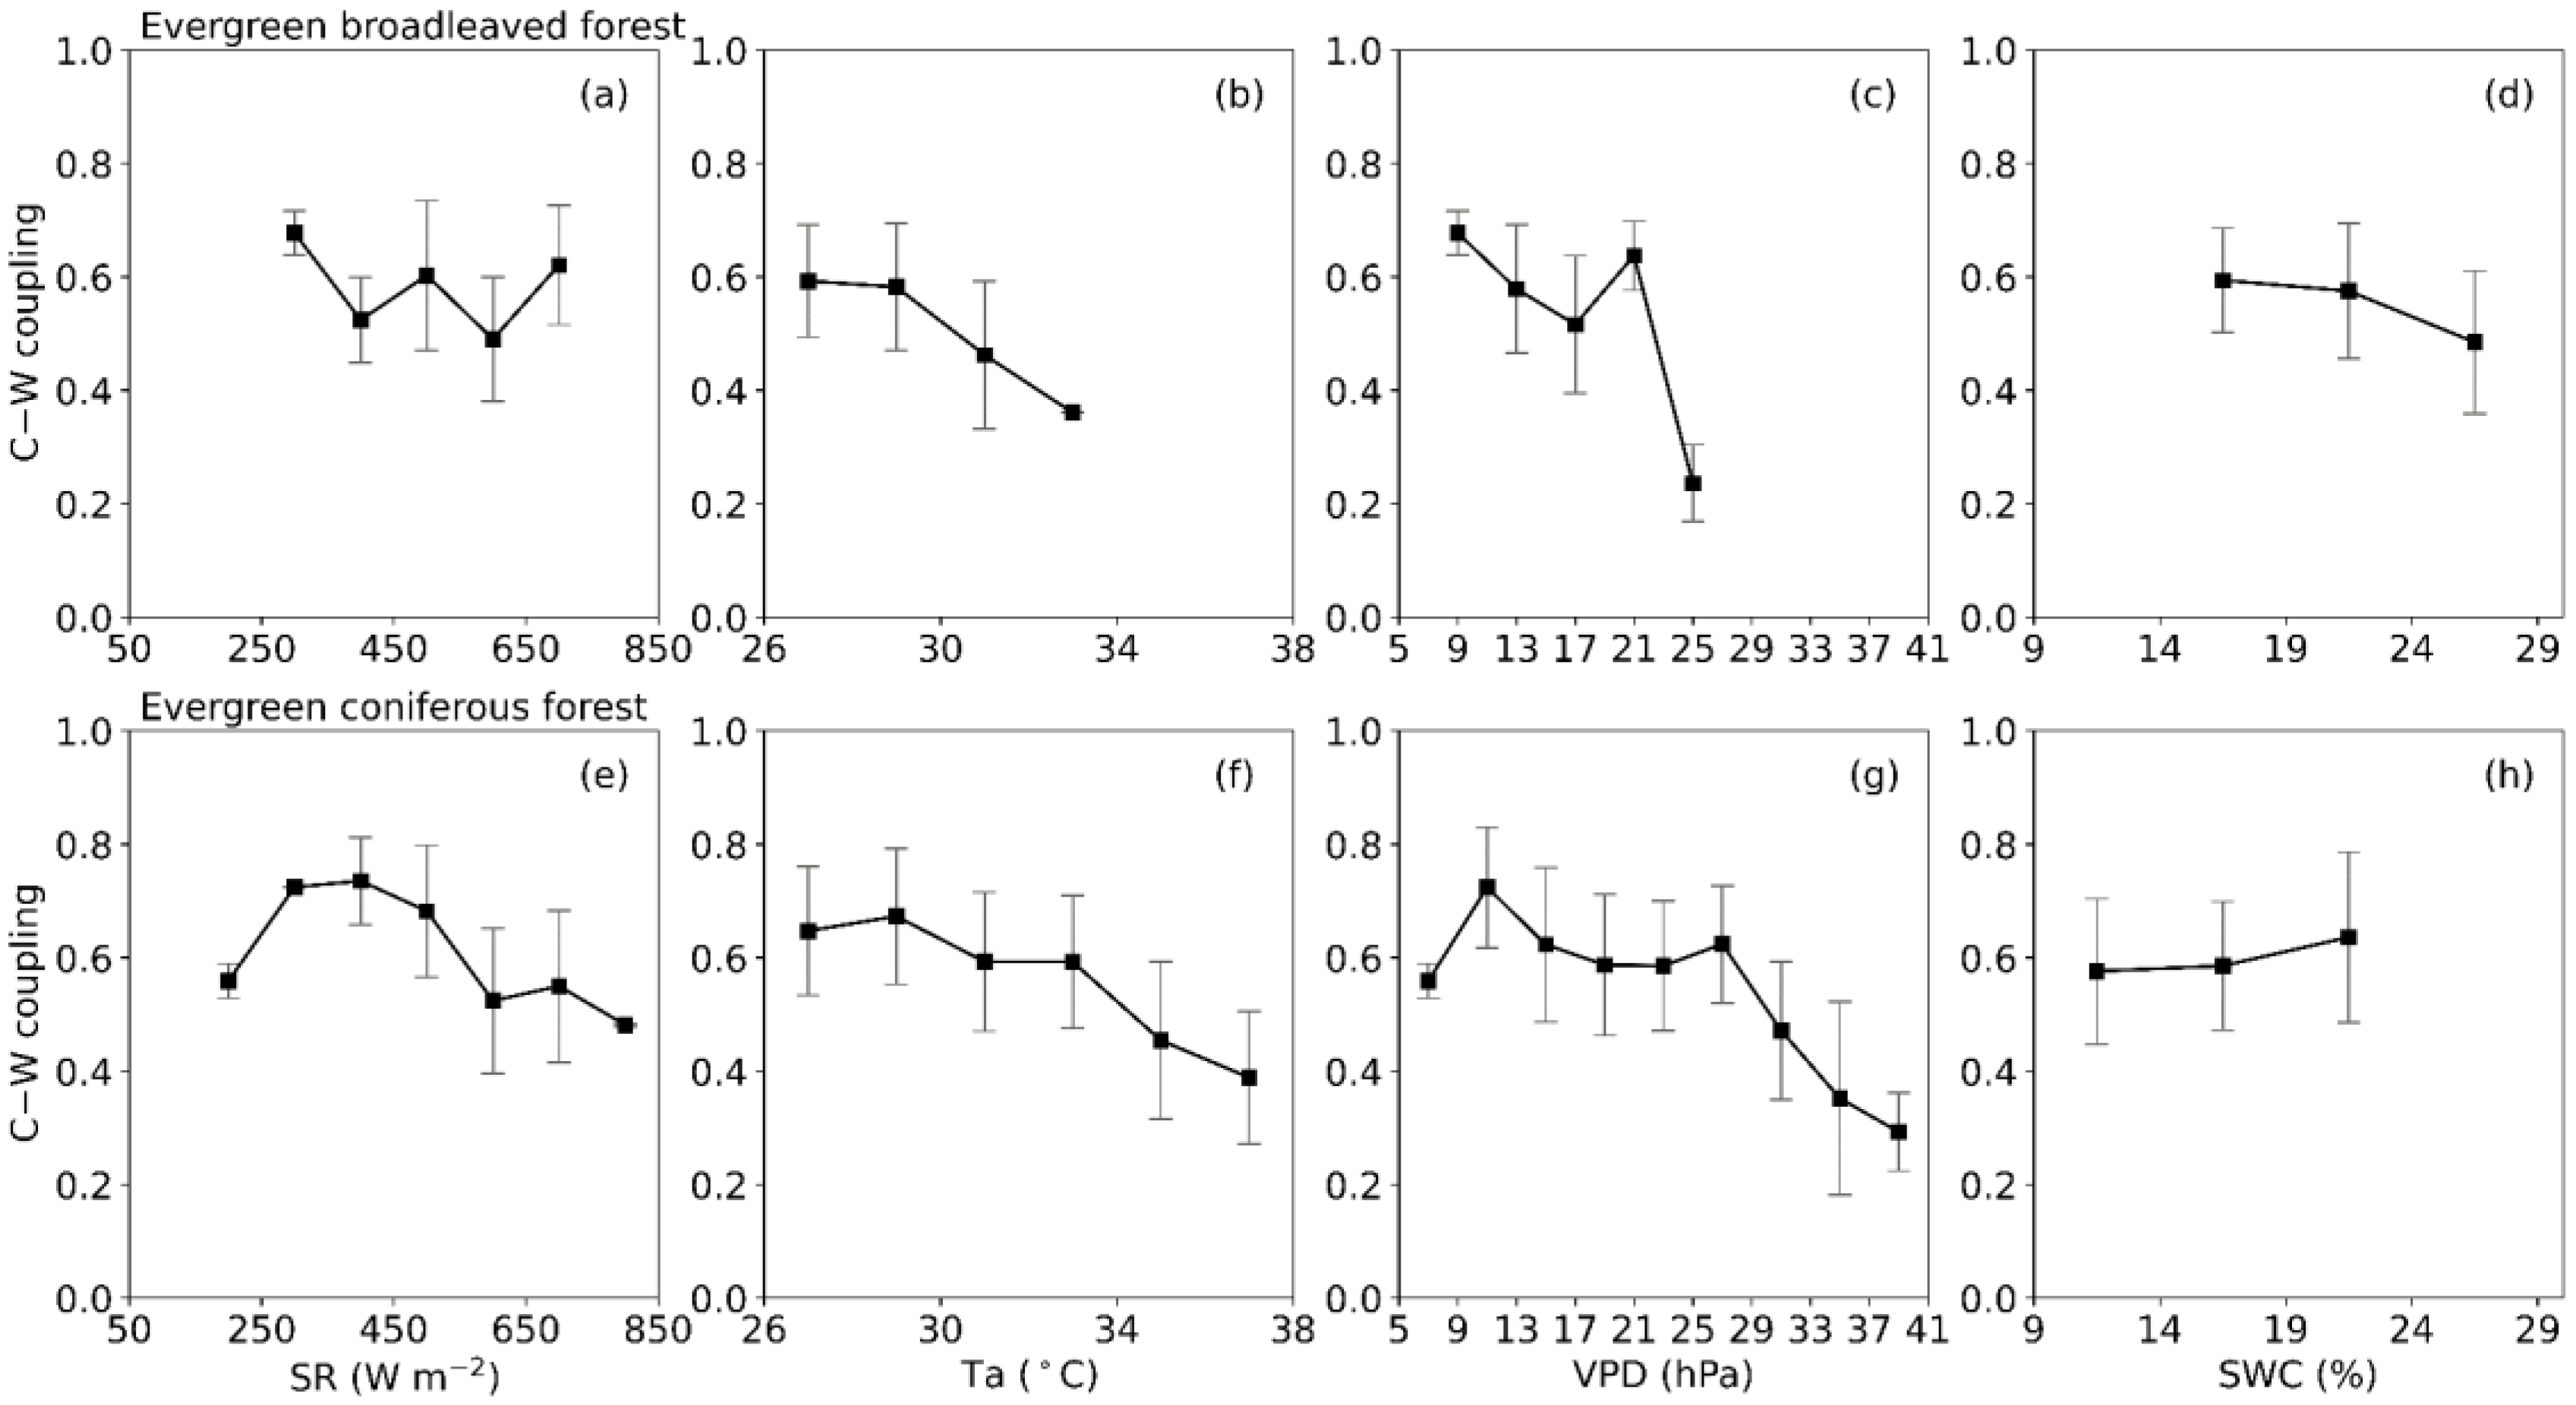
Taking all the data, we show in Figure 7 how the r value varies with each of the daily meteorological factors for the broadleaved forest (Figure 7a–d) and coniferous forest (Figure 7e–h), although this figure cannot fully separate the independent impact from each of the meteorological factors. In the broadleaved forest at Dinghushan (Figure 7a–d), VPD is shown to be the most influential factor for C–W coupling. High VPD conditions tend to increase the vapor gradient between the leaf and air but lower stomatal conductance, which can reduce GPP but may increase ET. Therefore, C–W coupling is compromised. The r value also decreases with increases in air temperature but is less responsive to variations in solar radiation. Interestingly, soil moisture has a negative effect on r. In the coniferous forest at Qianyanzhou, r decreases with radiation, air temperature, and VPD. However, r increases slightly with soil moisture, as the soil at this site is much drier than at Dinghushan (Figure 1d), which results from the different amounts of precipitation in the summer at the two sites.
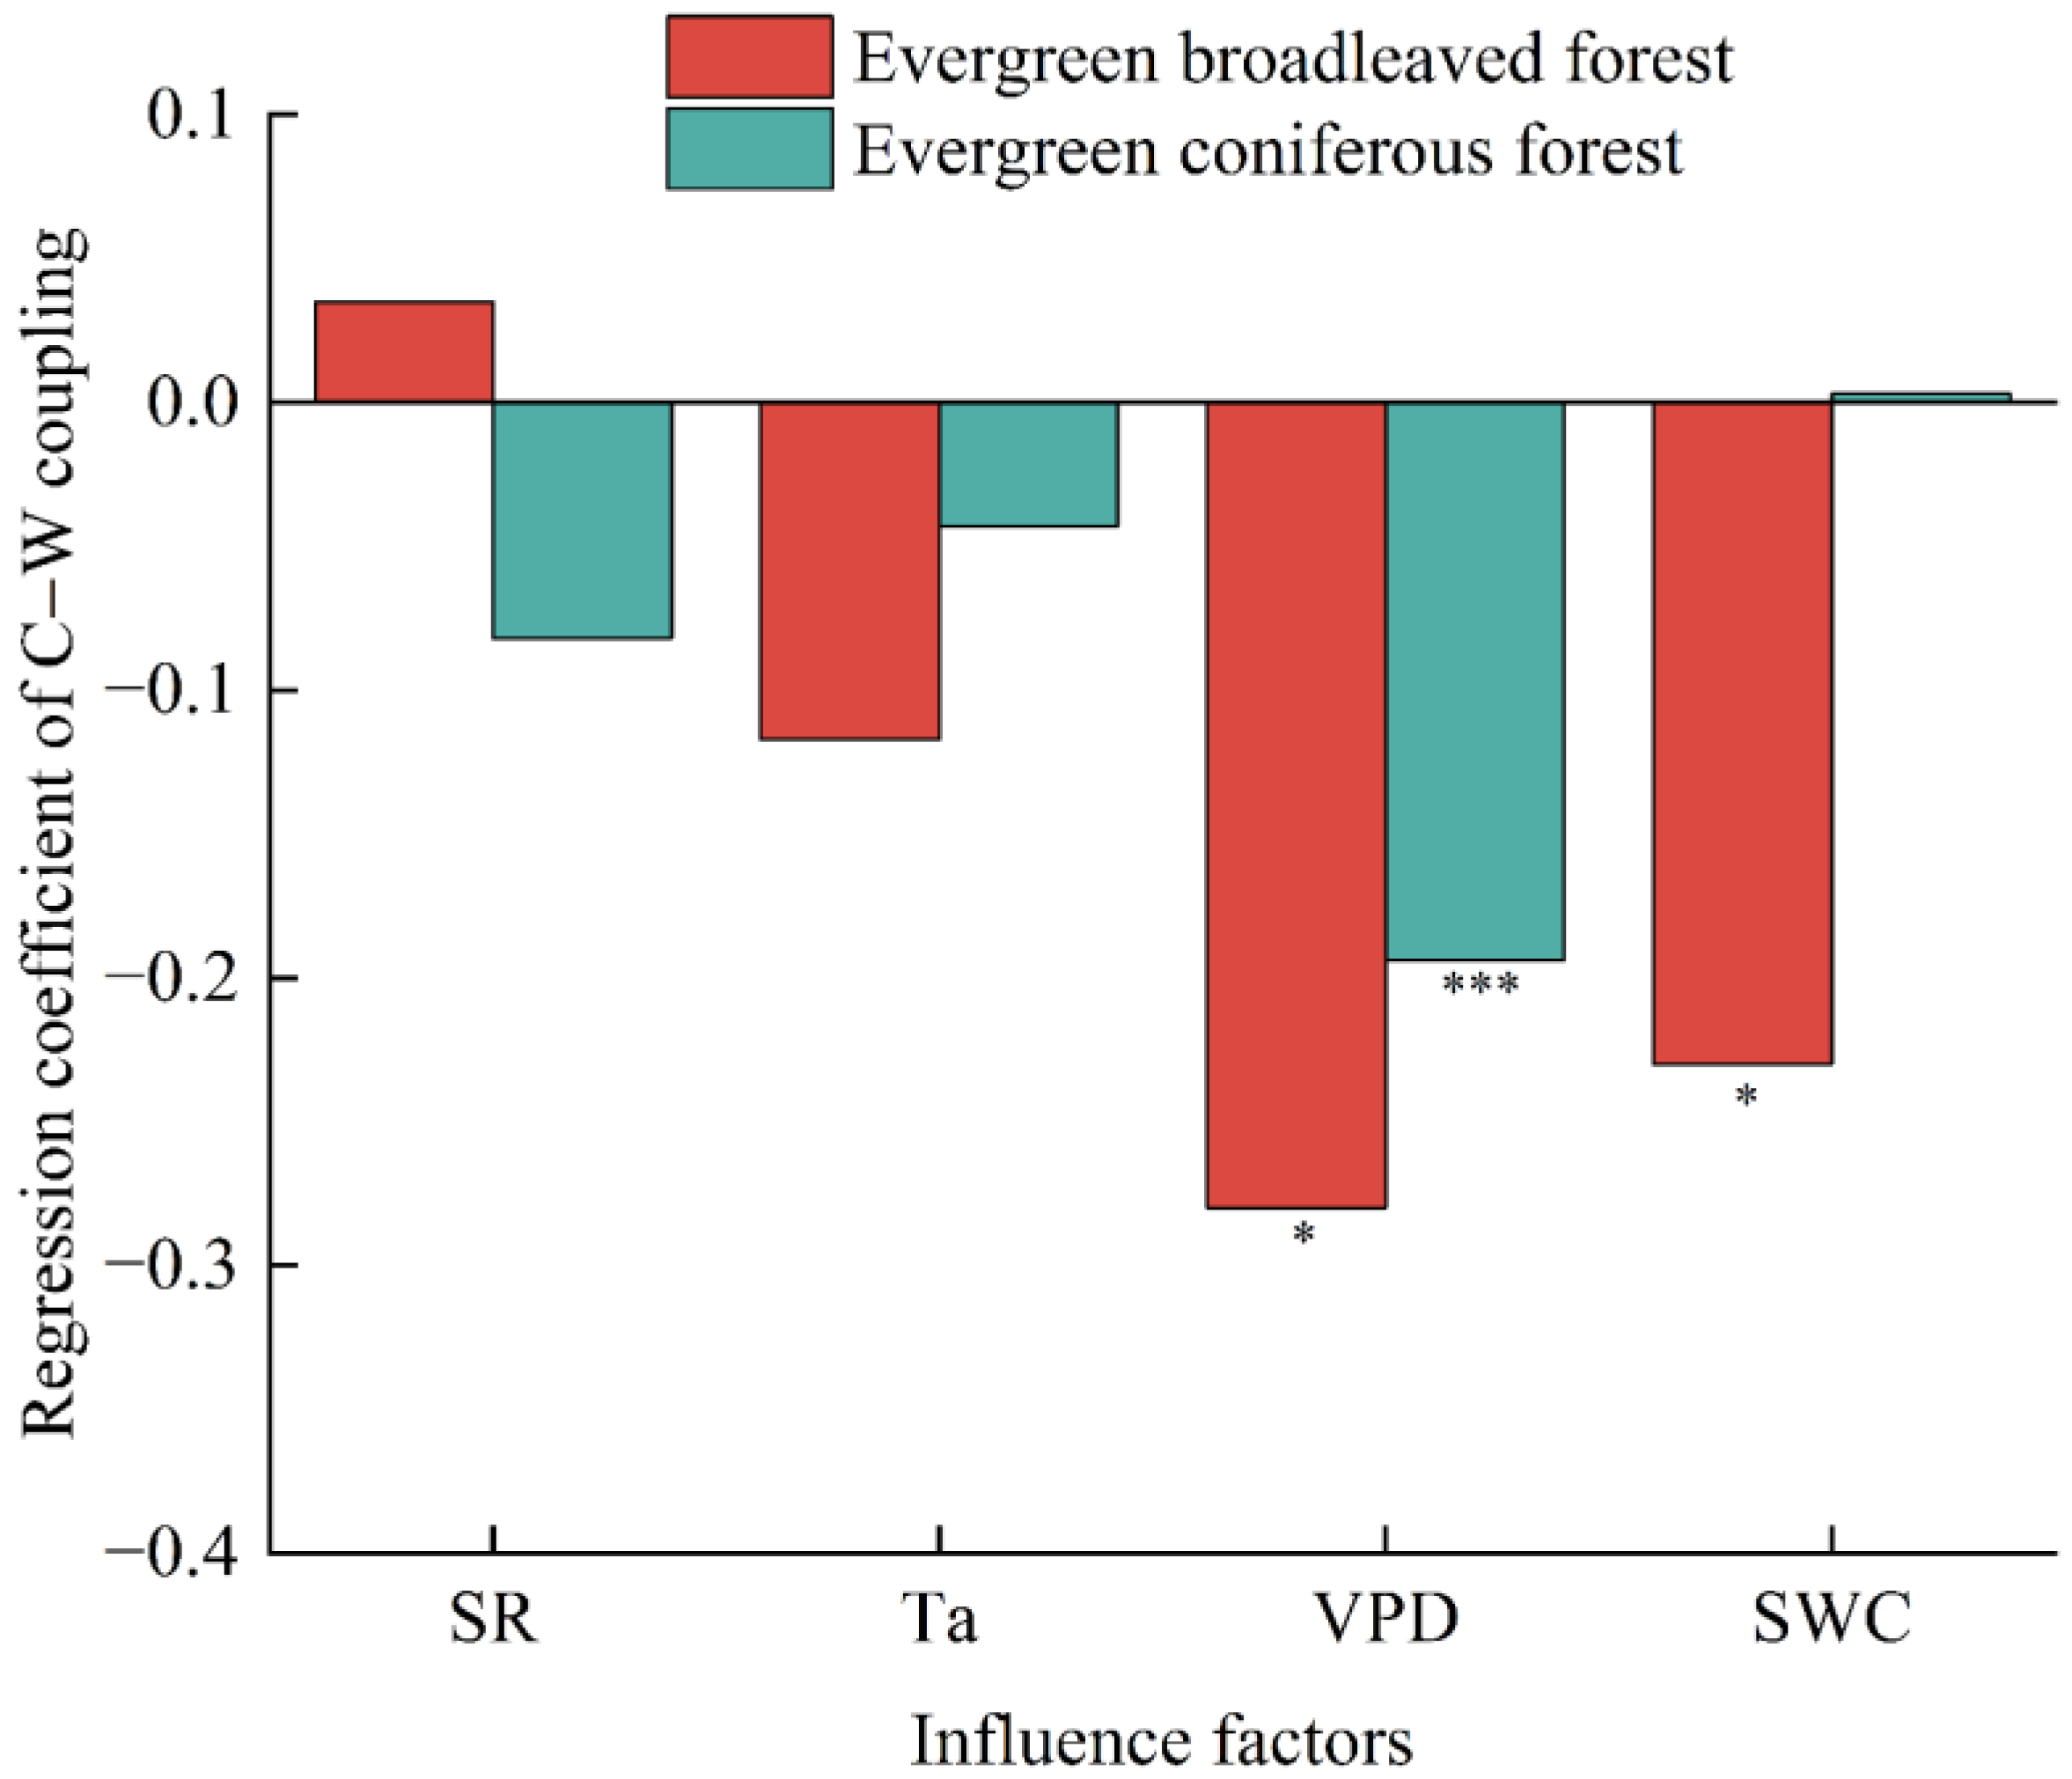
The relative importance of each meteorological factor can be assessed with regression coefficients through ridge regression analysis (Figure 8). For the broadleaved forest at Dinghushan, VPD showed the most significant effect on C–W coupling, followed by SWC, while Ta and solar radiation showed insignificant negative and positive effects, respectively. Increases in VPD led to decreases in C–W coupling. More soil moisture also tended to reduce C–W coupling, due to plenty of soil water at the site (Figure 1d). In the coniferous forest at Qianyanzhou, increasing VPD can lead to a decrease in C–W coupling even more significantly than in the broadleaved forest. In fact, VPD is the only meteorological variable that can significantly impact the C–W coupling strength at Qianyanzhou.
VPD is the key meteorological factor affecting the coupling of diurnal variation of GPP and ET at the two sites. In addition to VPD, the impact of other meteorological factors cannot be ignored, and the extent of the impact varies from site to site. For the broadleaved forest, the negative effects of soil water content are of secondary importance, while in the coniferous forest, the negative effects of radiation are secondary. Yu et al. [2] reported a weak correlation between daily GPP and ET in subtropical forests in China, and they attributed this asynchronous correlation to the stomatal response to dry air. Pang et al. [19] studied the diurnal variation relationship between GPP and ET in tea plantations in hilly areas of southeast China, and they showed that high VPD reduced stomatal conductance and regulated photosynthetic rate, resulting in asynchronous phenomenon between GPP and ET and the weakened coupling of GPP and ET.
With the increasing VPD and temperature throughout the day, both forests reduce the stomatal opening to prevent excessive water loss due to transpiration [37], which also leads to the decline of photosynthesis. However, if soil moisture in the forests is sufficient, the stomata are not completely closed [38]. Therefore, partial stomatal closure cannot effectively limit transpiration when VPD is high. If a decrease in stomatal conductance is proportional to an increase in VPD, transpiration still increases; meanwhile, GPP decreases [39].
3.5. GPP–ET Relationship Based on WUEdt and Coupling Strength r
Daily WUEdt and the coupling correlation r of hourly ET and GPP both can reflect the C–W coupling but from different perspectives. As shown in Figure 2, the daily variation of WUEdt and r differs greatly. For example, with similar WUEs at the beginning of July, the C–W coupling strength can range from moderately coupled (around 0.5) to highly coupled (around 0.9). Based on the definition of these two terms, we further explored the relationship between GPP and ET at both a daily and hourly scale from WUEdt and r, respectively.
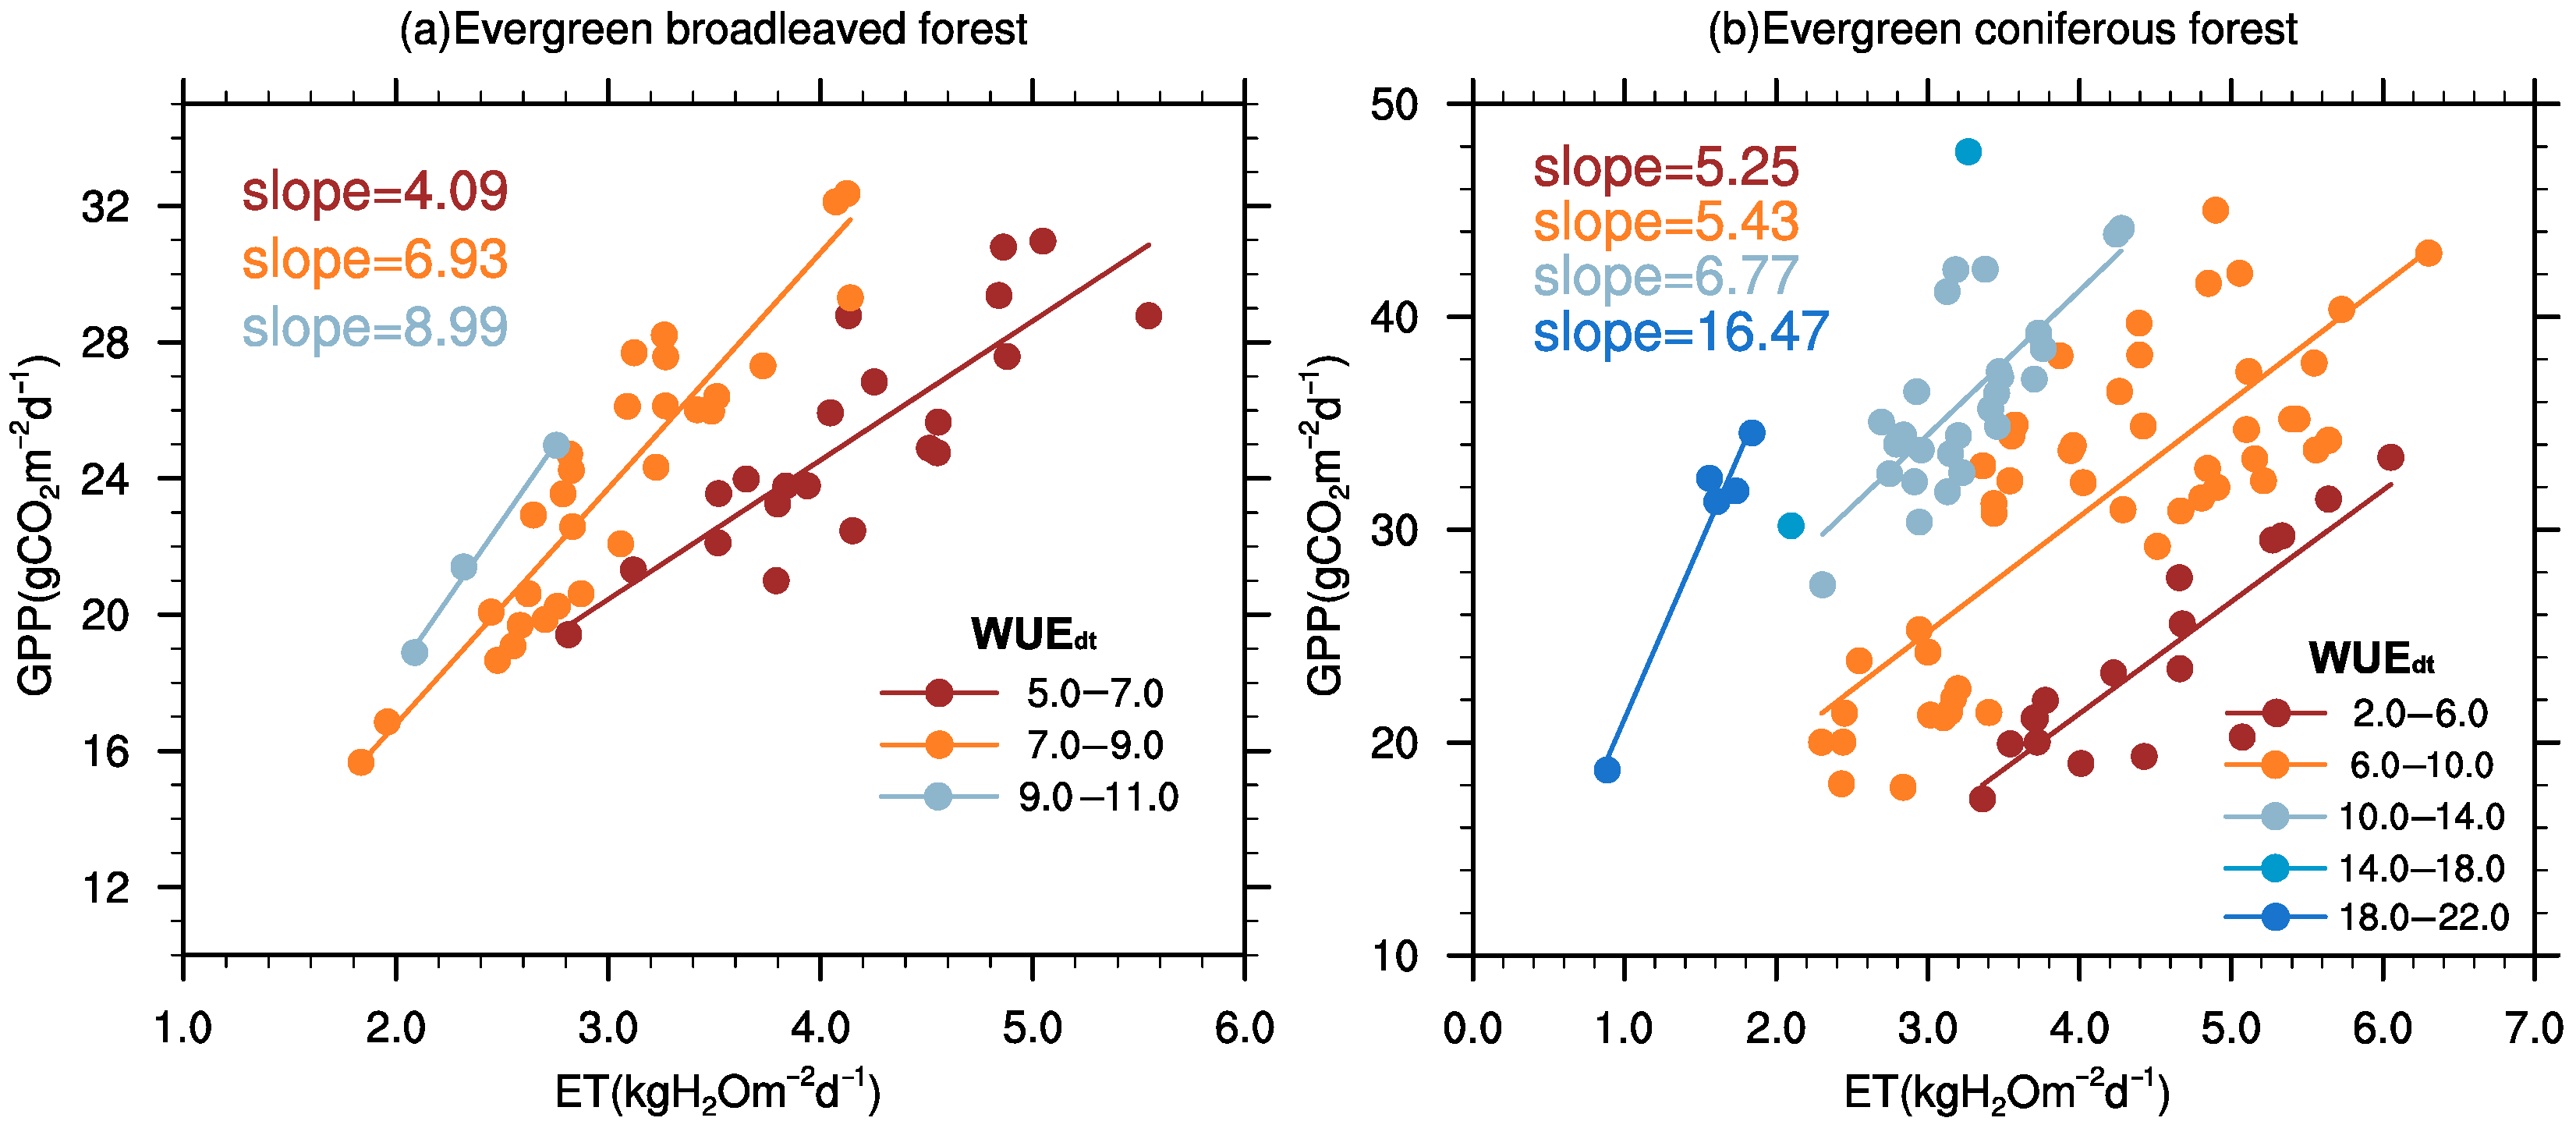
Figure 9 shows the relationship between daily GPP and ET for summer no-rain days based on different values of WUEdt. The slope of the GPP–ET relationship can be regarded as a reflection of the ecosystem WUE [16]. Based on all available data, the slope of GPP–ET was larger in the broadleaved forest (3.19 g CO2/kg H2O) than in the coniferous forest (2.0 g CO2/kg H2O), but this does not mean that WUEdt is larger in the broadleaved forest. Actually, in the coniferous forest at Qianyanzhou, the small slope of all available data is due to its large day-to-day fluctuation in the GPP–ET relationship. This may be the result of larger variations in environmental conditions at this site (Figure 1). The slope in the coniferous forest site can be up to 16.47 g CO2/kg H2O. Under certain meteorological conditions (small SR, Ta, and VPD), a large GPP can be generated at a low cost of water. For the broadleaved forest, the difference in the slopes among different values of WUEdt is small. WUEdt reflects the relationship between GPP and ET on a daily scale. Daily GPP and ET are strongly coupled when WUEdt is at a comparable level.
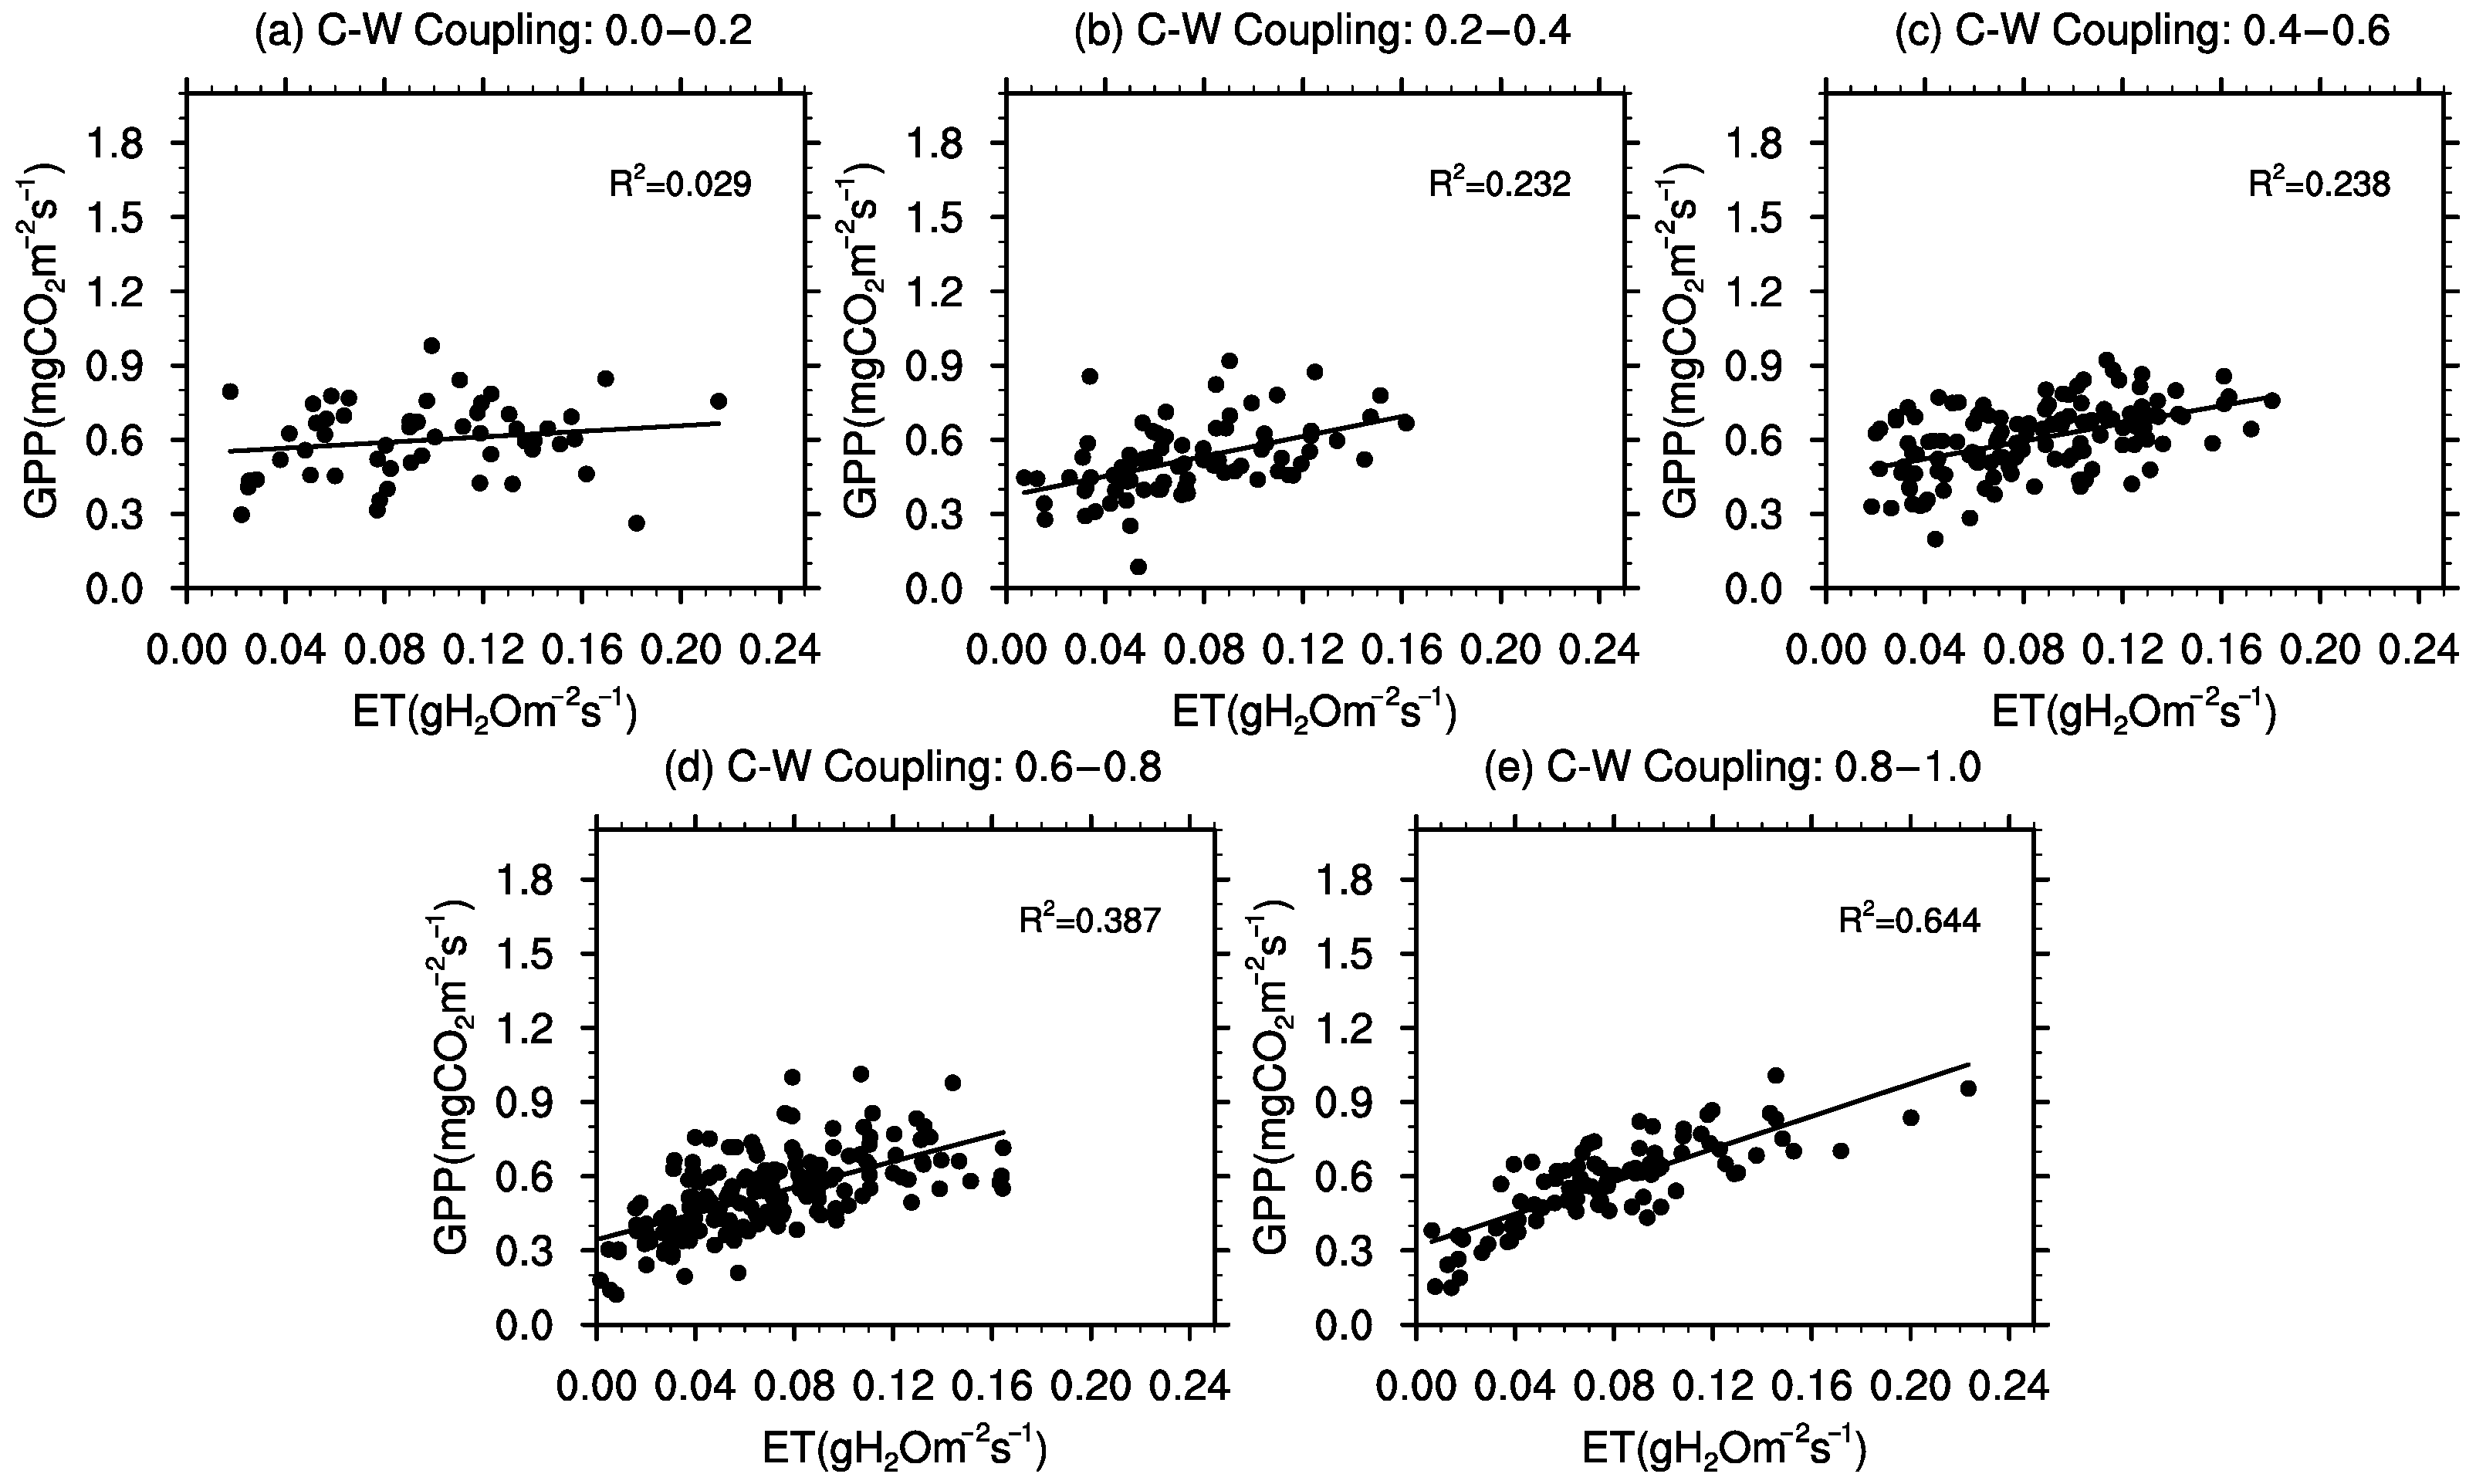
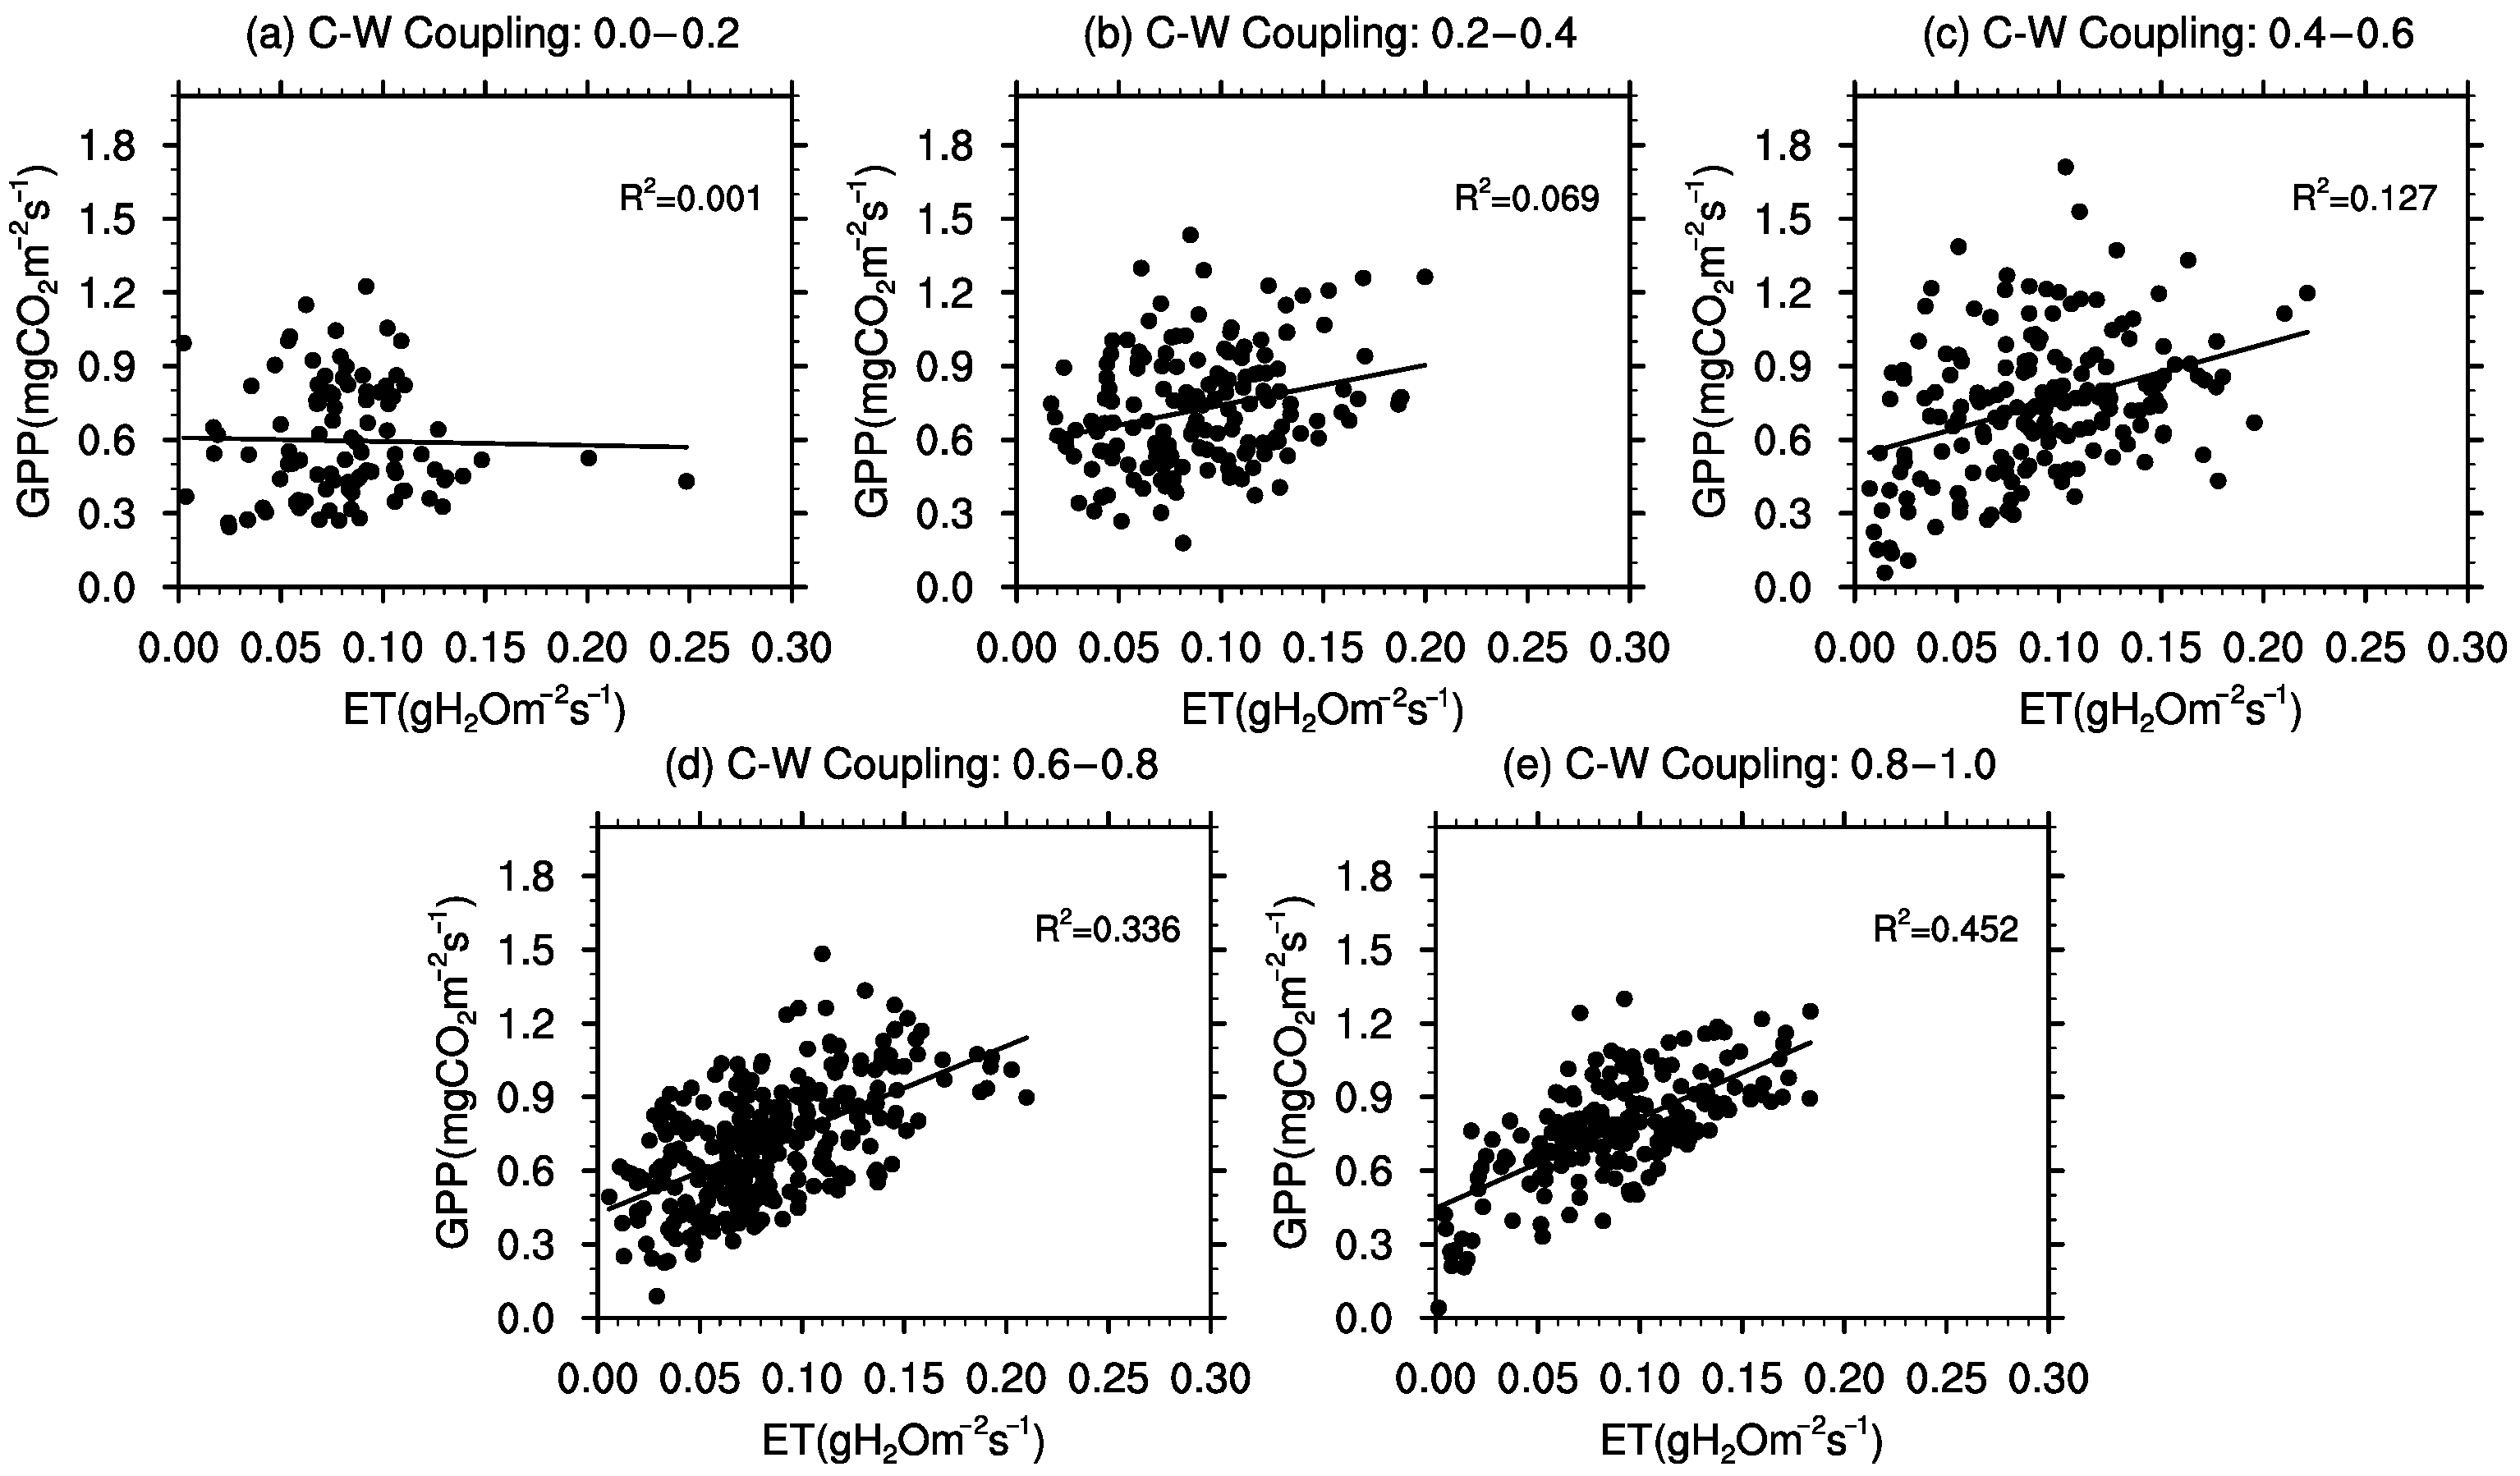
On an hourly scale, GPP and ET are not strongly coupled all the time at both forest sites, as shown in Figure 10 and Figure 11. Overall, the R2 is 0.33 for broadleaved forest and only 0.19 for coniferous forest. In contrast to the daily WUE, C–W coupling can depict the relationship between GPP and ET on a sub-daily scale well. For both broadleaved and needleleaf forests, with high C–W coupling strength, sub-daily variations in GPP and ET are highly synchronized, while with a small C–W coupling strength, hourly GPP and ET are distributed randomly.
4. Conclusions
In this study, we investigated carbon and water relationships at two subtropical forests in southeast China: an evergreen broadleaved forest at Dinghushan (23.17° N, 112.53° E, 300 m) and an evergreen coniferous forest at Qianyanzhou (26.74° N, 115.06° W, 102 m). Besides the differences in vegetation types and elevations, the meteorological conditions are also different at the two sites; Dinghushan has lower radiation, temperature, and VPD but higher soil moisture than Qianyanzhou. We focused on short-term carbon and water relationships in summer by assessing the daytime water use efficiency (WUEdt) and the correlation of hourly GPP and ET on a day (r), using the FLUXNET2015 dataset. The conclusions for this study are drawn as follows.
1. The WUEdt in the subtropical forests in southeast China is moderate in the summer. The daily WUEdt in the two forests ranges from 4 to 14 mg CO2 per g H2O. The daily WUE dt is lower and more concentrated in the broadleaved forest at Dinghushan than in the coniferous forest at Qianyanzhou.
2. Daily WUEdt is closely modulated by daily meteorological conditions. In general, high radiation, air temperature, and humidity reduce summertime WUEdt in the two forests. For the broadleaved forest, the most influential factor on WUEdt is VPD, followed by radiation, while in the coniferous forest, VPD, air temperature, and radiation are almost equally important.
3. The r values for C–W coupling on an hourly time scale are similar for the two forests, in terms of the mean and its histogram. The skewed normal distribution of r peaks around 0.6–0.8. This distribution pattern differs from that for WUEdt at the two sites. The mean r is 0.5–0.6, suggesting asynchronous diurnal variations in GPP and ET. The C–W coupling in the coniferous forest is slightly stronger than in the broadleaved forest.
4. Air dryness (VPD) plays a key role in regulating hourly C–W coupling in the two forests. The drier the air is, the weaker the coupling is.
5. The terms of WUEdt and r reflect the C–W relationship from different perspectives. WUEdt reflects the C–W relationship on a daily scale, while r is an indicator of the C–W relationship at sub-daily scale. Both showed the strongest response to VPD among all the daily meteorological factors. However, WUEdt and r responded to VPD with different levels of sensitivity. The same was observed for the other meteorological factors.
Our study highlights the role of meteorological factors in controlling the short-term C–W relationships in subtropical forests in southeast China. As known, subtropical forests in China play an important role in the global carbon and water cycle. Yet, there are few studies on the C–W relationship in this region on such a time scale. Therefore, the C–W relationship and its response to meteorological conditions in this region are still unclear on a short-term scale. Under climate change, the day-to-day fluctuation is intensified. As a result, the interaction between climate and forest on a shorter time scale gained increasing attention. Ignoring the short-term C–W relationship prevents us from comprehensively understanding the variations in GPP and ET, as well as the response of forest ecosystems to climate variations. Future studies can go further to separate evaporation from transpiration, analyze the effect of other abiotic or biotic factors, and compare the C–W relationship in other regions or ecosystems or both.
Author Contributions
Conceptualization, M.Y. and J.L.; methodology, J.P.; validation, J.L., M.Y. and R.W.; formal analysis, J.P. and M.Y.; investigation, M.Y. and J.L.; data curation, J.P.; writing—original draft preparation, J.L., J.P. and M.Y.; writing—review and editing, M.Y. and R.W.; visualization, J.L. and R.W.; supervision, J.L. and M.Y.; funding acquisition, M.Y. and R.W. All authors have read and agreed to the published version of the manuscript.
Funding
This work was supported by the National Key Research and Development Program of China (Grant: 2020YFA0608701). M. Yang is supported by the Science Foundation of Fujian Provincial Department of Education on Education and Research Program for Young Teachers (JAT210046), and R. Wang is supported by the National Natural Science Foundation of China (Grant: 42101368).
Institutional Review Board Statement
Not applicable.
Informed Consent Statement
Not applicable.
Data Availability Statement
Not applicable.
Acknowledgments
We thank the PIs at Qianyanzhou and Dinghushan of FLUXNET2015 sites for providing these valuable data on which this study is based.
Conflicts of Interest
The authors declare no conflict of interest.
References
- Nelson, J.A.; Carvalhais, N.; Migliavacca, M.; Reichstein, M.; Jung, M. Water-stress-induced breakdown of carbon–water relations: Indicators from diurnal FLUXNET patterns. Biogeosciences 2018, 15, 2433–2447. [Google Scholar] [CrossRef] [Green Version]
- Yu, G.; Song, X.; Wang, Q.; Liu, Y.; Guan, D.; Yan, J.; Sun, X.; Zhang, L.; Wen, X. Water-use efficiency of forest ecosystems in eastern China and its relations to climatic variables. New Phytol. 2008, 177, 927–937. [Google Scholar] [CrossRef]
- Gao, L.; Kang, S.; Bai, X.; Li, S.; Niu, J.; Ding, R. Water-carbon relationships and variations from the canopy to ecosystem scale in a sparse vineyard in the northwest China. J. Hydrol. 2021, 600, 126469. [Google Scholar] [CrossRef]
- Hou, Q.; Pei, T.; Yu, X.; Chen, Y.; Ji, Z.; Xie, B. The seasonal response of vegetation water use efficiency to temperature and precipitation in the Loess Plateau, China. Glob. Ecol. Conserv. 2022, 33, e01984. [Google Scholar] [CrossRef]
- Liu, D.; Mishra, A.K.; Ray, D.K. Sensitivity of global major crop yields to climate variables: A non-parametric elasticity analysis. Sci. Total Environ. 2020, 748, 141431. [Google Scholar] [CrossRef] [PubMed]
- Kirschbaum, M.U. Direct and indirect climate change effects on photosynthesis and transpiration. Plant Biol. 2004, 6, 242–253. [Google Scholar] [CrossRef] [Green Version]
- Kramer, R.D.; Ishii, H.R.; Carter, K.R.; Miyazaki, Y.; Cavaleri, M.A.; Araki, M.G.; Azuma, W.A.; Inoue, Y.; Hara, C. Predicting effects of climate change on productivity and persistence of forest trees. Ecol. Res. 2020, 35, 562–574. [Google Scholar] [CrossRef]
- Price, D.T.; Alfaro, R.I.; Brown, K.J.; Flannigan, M.D.; Fleming, R.A.; Hogg, E.H.; Girardin, M.P.; Lakusta, T.; Johnston, M.; McKenney, D.W. Anticipating the consequences of climate change for Canada’s boreal forest ecosystems. Environ. Rev. 2013, 21, 322–365. [Google Scholar] [CrossRef]
- Wu, J.; Serbin, S.P.; Ely, K.S.; Wolfe, B.T.; Dickman, L.T.; Grossiord, C.; Michaletz, S.T.; Collins, A.D.; Detto, M.; McDowell, N.G. The response of stomatal conductance to seasonal drought in tropical forests. Glob. Chang. Biol. 2020, 26, 823–839. [Google Scholar] [CrossRef] [PubMed]
- Jarvis, P.G. The interpretation of the variations in leaf water potential and stomatal conductance found in canopies in the field. Philos. Trans. R. Soc. London B Biol. Sci. 1976, 273, 593–610. [Google Scholar]
- Ball, J.T.; Woodrow, I.E.; Berry, J.A. A model predicting stomatal conductance and its contribution to the control of photosynthesis under different environmental conditions. In Progress in Photosynthesis Research; Biggins, J., Ed.; Springer: Dordrecht, The Netherlands, 1987; pp. 221–224. [Google Scholar]
- Novick, K.A.; Ficklin, D.L.; Stoy, P.C.; Williams, C.A.; Bohrer, G.; Oishi, A.C.; Papuga, S.A.; Blanken, P.D.; Noormets, A.; Sulman, B.N. The increasing importance of atmospheric demand for ecosystem water and carbon fluxes. Nat. Clim. Chang. 2016, 6, 1023–1027. [Google Scholar] [CrossRef] [Green Version]
- Baldocchi, D.; Falge, E.; Gu, L.; Olson, R.; Hollinger, D.; Running, S.; Anthoni, P.; Bernhofer, C.; Davis, K.; Evans, R. FLUXNET: A new tool to study the temporal and spatial variability of ecosystem-scale carbon dioxide, water vapor, and energy flux densities. Bull. Am. Meteorol. Soc. 2001, 82, 2415–2434. [Google Scholar] [CrossRef]
- Beer, C.; Ciais, P.; Reichstein, M.; Baldocchi, D.; Law, B.E.; Papale, D.; Soussana, J.-F.; Ammann, C.; Buchmann, N.; Frank, D. Temporal and among-site variability of inherent water use efficiency at the ecosystem level. Glob. Biogeochem. Cycles 2009, 23, GB2018. [Google Scholar] [CrossRef] [Green Version]
- Boese, S.; Jung, M.; Carvalhais, N.; Reichstein, M. The importance of radiation for semiempirical water-use efficiency models. Biogeosciences 2017, 14, 3015–3026. [Google Scholar] [CrossRef] [Green Version]
- Law, B.E.; Falge, E.; Gu, L.V.; Baldocchi, D.D.; Bakwin, P.; Berbigier, P.; Davis, K.; Dolman, A.J.; Falk, M.; Fuentes, J.D. Environmental controls over carbon dioxide and water vapor exchange of terrestrial vegetation. Agric. For. Meteorol. 2002, 113, 97–120. [Google Scholar] [CrossRef] [Green Version]
- Niu, S.; Wu, M.; Han, Y.; Xia, J.; Li, L.; Wan, S. Water-mediated responses of ecosystem carbon fluxes to climatic change in a temperate steppe. New Phytol. 2008, 177, 209–219. [Google Scholar] [CrossRef]
- Li, H.; Wang, C.; Zhang, F.; He, Y.; Shi, P.; Guo, X.; Wang, J.; Zhang, L.; Li, Y.; Cao, G. Atmospheric water vapor and soil moisture jointly determine the spatiotemporal variations of CO2 fluxes and evapotranspiration across the Qinghai-Tibetan Plateau grasslands. Sci. Total Environ. 2021, 791, 148379. [Google Scholar] [CrossRef] [PubMed]
- Pang, J.; Li, H.; Yu, F.; Geng, J.; Zhang, W. Environmental controls on water use efficiency in a hilly tea plantation in southeast China. Agric. Water Manag. 2022, 269, 107678. [Google Scholar] [CrossRef]
- Zhang, M.; Huang, X.; Chuai, X.; Yang, H.; Lai, L.; Tan, J. Impact of land use type conversion on carbon storage in terrestrial ecosystems of China: A spatial-temporal perspective. Sci. Rep. 2015, 5, 10233. [Google Scholar] [CrossRef] [PubMed] [Green Version]
- Chang, Y.; Zhong, Q.; Yang, H.; Xu, C.; Hua, W.; Li, B. Patterns and driving factors of leaf C, N, and P stoichiometry in two forest types with different stand ages in a mid-subtropical zone. For. Ecosyst. 2022, 9, 100005. [Google Scholar] [CrossRef]
- Liu, X.; Trogisch, S.; He, J.-S.; Niklaus, P.A.; Bruelheide, H.; Tang, Z.; Erfmeier, A.; Scherer-Lorenzen, M.; Pietsch, K.A.; Yang, B. Tree species richness increases ecosystem carbon storage in subtropical forests. Proc. R. Soc. B 2018, 285, 20181240. [Google Scholar] [CrossRef] [Green Version]
- Xiang, W.; Zhou, J.; Ouyang, S.; Zhang, S.; Lei, P.; Li, J.; Deng, X.; Fang, X.; Forrester, D.I. Species-specific and general allometric equations for estimating tree biomass components of subtropical forests in southern China. Eur. J. For. Res. 2016, 135, 963–979. [Google Scholar] [CrossRef]
- Pastorello, G.; Trotta, C.; Canfora, E.; Chu, H.; Christianson, D.; Cheah, Y.-W.; Poindexter, C.; Chen, J.; Elbashandy, A.; Humphrey, M. The FLUXNET2015 dataset and the ONEFlux processing pipeline for eddy covariance data. Sci. Data 2020, 7, 225. [Google Scholar] [CrossRef]
- Lin, C.; Gentine, P.; Frankenberg, C.; Zhou, S.; Kennedy, D.; Li, X. Evaluation and mechanism exploration of the diurnal hysteresis of ecosystem fluxes. Agric. For. Meteorol. 2019, 278, 107642. [Google Scholar] [CrossRef]
- Liu, W.; Mo, X.; Liu, S.; Lin, Z.; Lv, C. Attributing the changes of grass growth, water consumed and water use efficiency over the Tibetan Plateau. J. Hydrol. 2021, 598, 126464. [Google Scholar] [CrossRef]
- Meloun, M.; Militký, J.; Hill, M.; Brereton, R.G. Crucial problems in regression modelling and their solutions. Analyst 2002, 127, 433–450. [Google Scholar] [CrossRef] [PubMed]
- Singh, N.; Patel, N.R.; Bhattacharya, B.K.; Soni, P.; Parida, B.R.; Parihar, J.S. Analyzing the dynamics and inter-linkages of carbon and water fluxes in subtropical pine (Pinus roxburghii) ecosystem. Agric. For. Meteorol. 2014, 197, 206–218. [Google Scholar] [CrossRef]
- Wu, X.; Li, X.; Chen, Y.; Bai, Y.; Tong, Y.; Wang, P.; Liu, H.; Wang, M.; Shi, F.; Zhang, C. Atmospheric water demand dominates daily variations in water use efficiency in alpine meadows, northeastern Tibetan Plateau. J. Geophys. Res. Biogeosci. 2019, 124, 2174–2185. [Google Scholar] [CrossRef]
- Sulman, B.N.; Roman, D.T.; Yi, K.; Wang, L.; Phillips, R.P.; Novick, K.A. High atmospheric demand for water can limit forest carbon uptake and transpiration as severely as dry soil. Geophys. Res. Lett. 2016, 43, 9686–9695. [Google Scholar] [CrossRef]
- Farquhar, G.D.; Sharkey, T.D. Stomatal conductance and photosynthesis. Annu. Rev. Plant Physiol. 1982, 33, 317–345. [Google Scholar] [CrossRef]
- Farquhar, G.D.; von Caemmerer, S.; Berry, J.A. A biochemical model of photosynthetic CO2 assimilation in leaves of C3 species. Planta 1980, 149, 78–90. [Google Scholar] [CrossRef] [Green Version]
- Zhang, Y.; Kang, S.; Ward, E.J.; Ding, R.; Zhang, X.; Zheng, R. Evapotranspiration components determined by sap flow and microlysimetry techniques of a vineyard in northwest China: Dynamics and influential factors. Agric. Water Manag. 2011, 98, 1207–1214. [Google Scholar] [CrossRef]
- Sakata, T.; Nakano, T.; Kachi, N. Effects of internal conductance and Rubisco on the optimum temperature for leaf photosynthesis in Fallopia japonica growing at different altitudes. Ecol. Res. 2015, 30, 163–171. [Google Scholar] [CrossRef]
- Xue, L.; Fu, F.; Chen, X.; Liu, Y.; Han, Q.; Liao, S.; Wei, Q. Analysis on water use efficiency of Populus euphratica forest ecosystem in arid area. Theor. Appl. Climatol. 2021, 145, 717–730. [Google Scholar] [CrossRef]
- Zhang, F.; Ju, W.; Shen, S.; Wang, S.; Yu, G.; Han, S. How recent climate change influences water use efficiency in East Asia. Theor. Appl. Climatol. 2014, 116, 359–370. [Google Scholar] [CrossRef]
- Zhou, S.; Duursma, R.A.; Medlyn, B.E.; Kelly, J.W.G.; Prentice, I.C. How should we model plant responses to drought? An analysis of stomatal and non-stomatal responses to water stress. Agric. For. Meteorol. 2013, 182, 204–214. [Google Scholar] [CrossRef]
- Blanken, P.D.; Rouse, W.R. Evidence of water conservation mechanisms in several subarctic wetland species. J. Appl. Ecol. 1996, 33, 842–850. [Google Scholar] [CrossRef]
- Scott, R.L.; Edwards, E.A.; Shuttleworth, W.J.; Huxman, T.E.; Watts, C.; Goodrich, D.C. Interannual and seasonal variation in fluxes of water and carbon dioxide from a riparian woodland ecosystem. Agric. For. Meteorol. 2004, 122, 65–84. [Google Scholar] [CrossRef]
Figure 1.
The frequency of summer daytime shortwave radiation (SR, (a)), air temperature (Ta, (b)), vapor pressure deficit (VPD, (c)), and soil water content (SWC, (d)) in the Dinghushan evergreen broadleaved forest (red solid line) and Qianyanzhou evergreen coniferous forest (cyan solid line). The dashed lines show the mean value of the meteorological variables at Dinghushan (red dashed line) and Qianyanzhou (cyan dashed line) during summer daytime; the specific values are presented in Table 1.

Figure 2.
An example of daily variations in daytime water use efficiency (WUEdt, (a), blue hollow squares) and diurnal carbon–water coupling (C–W coupling, (b), cyan hollow squares) in July 2003 at Qianyanzhou, along with meteorological conditions. The solid lines in yellow, red, cyan, and blue indicate the daily means of shortwave radiation (SR), air temperature (Ta), vapor pressure deficit (VPD), and soil water content (SWC), respectively, during the daytime (6 a.m.–6 p.m.).

Figure 3.
Histogram of WUEdt in the broadleaved forest at Dinghushan and in the coniferous forest at Qianyanzhou on summer no-rain days over 2003–2005.
Figure 3.
Histogram of WUEdt in the broadleaved forest at Dinghushan and in the coniferous forest at Qianyanzhou on summer no-rain days over 2003–2005.

Figure 4.
Variation in WUEdt with meteorological conditions (SR, Ta, VPD, and SWC) in the broadleaved forest at Dinghushan (a–d) and in the coniferous forest at Qianyanzhou (e–h), where (a,c) are WUEdt variations with SR, (b,f) are for Ta, (c,g) are for VPD, (d,h) are for SWC. The means and standard deviations of WUEdt varying with meteorological conditions are marked with dots and error bars, respectively.

Figure 5.
Regression coefficients of meteorological conditions (SR, Ta, VPD, and SWC) with WUEdt in the broadleaved forest at Dinghushan and in the coniferous forest at Qianyanzhou. “*” indicates that r is at the 90% significance level (p < 0.10), and “***” at the 99% level (p < 0.01).
Figure 5.
Regression coefficients of meteorological conditions (SR, Ta, VPD, and SWC) with WUEdt in the broadleaved forest at Dinghushan and in the coniferous forest at Qianyanzhou. “*” indicates that r is at the 90% significance level (p < 0.10), and “***” at the 99% level (p < 0.01).

Figure 6.
Histogram of diurnal C–W coupling in the broadleaved forest at Dinghushan and in the coniferous forest at Qianyanzhou on summer no-rain days over 2003–2005.
Figure 6.
Histogram of diurnal C–W coupling in the broadleaved forest at Dinghushan and in the coniferous forest at Qianyanzhou on summer no-rain days over 2003–2005.

Figure 7.
Diurnal C–W coupling varying with meteorological conditions (SR, Ta, VPD, and SWC) in the broadleaved forest at Dinghushan (a–d) and in the coniferous forest at Qianyanzhou (e–h), where (a,c) are WUEdt variations with SR, (b,f) are for Ta, (c,g) are for VPD, (d,h) are for SWC. The means and standard deviations of C–W coupling varying with meteorological conditions are marked with dots and error bars, respectively.

Figure 8.
Regression coefficients of meteorological conditions (SR, Ta, VPD, and SWC) with diurnal C–W coupling in the broadleaved forest at Dinghushan and in the coniferous forest at Qianyanzhou. “*” indicates that r is at the 90% significance level (p < 0.10), and “***” at the 99% level (p < 0.01).

Figure 9.
The daily GPP and ET relationship in the broadleaved forest at Dinghushan (a) and in the coniferous forest at Qianyanzhou (b) with different values of WUEdt in colors. The slope of each regression line is listed in different colors. All values are on summer no-rain days over 2003–2005.
Figure 9.
The daily GPP and ET relationship in the broadleaved forest at Dinghushan (a) and in the coniferous forest at Qianyanzhou (b) with different values of WUEdt in colors. The slope of each regression line is listed in different colors. All values are on summer no-rain days over 2003–2005.

Figure 10.
The hourly GPP and ET relationship in the broadleaved forest at Dinghushan with different C–W couplings (r): (a) 0.0–0.2, (b) 0.2–0.4, (c) 0.4–0.6, (d) 0.6–0.8, and (e) 0.8–1.0. Coefficient of determination R2 is listed in each panel. All values are on summer no-rain days over 2003–2005.
Figure 10.
The hourly GPP and ET relationship in the broadleaved forest at Dinghushan with different C–W couplings (r): (a) 0.0–0.2, (b) 0.2–0.4, (c) 0.4–0.6, (d) 0.6–0.8, and (e) 0.8–1.0. Coefficient of determination R2 is listed in each panel. All values are on summer no-rain days over 2003–2005.

Figure 11.
The hourly GPP and ET relationship in the coniferous forest at Qianyanzhou with different C–W couplings (r): (a) 0.0–0.2, (b) 0.2–0.4, (c) 0.4–0.6, (d) 0.6–0.8, and (e) 0.8–1.0. Coefficient of determination R2 is listed in each panel. All values are on summer no-rain days over 2003–2005.
Figure 11.
The hourly GPP and ET relationship in the coniferous forest at Qianyanzhou with different C–W couplings (r): (a) 0.0–0.2, (b) 0.2–0.4, (c) 0.4–0.6, (d) 0.6–0.8, and (e) 0.8–1.0. Coefficient of determination R2 is listed in each panel. All values are on summer no-rain days over 2003–2005.


Table 1.
Description of site characteristics.
| Sites | Dinghushan (CN-Din) | Qianyanzhou (CN-Qia) |
|---|---|---|
| Vegetation type | Evergreen broadleaved forest | Evergreen coniferous forest |
| Latitude (°N) | 23.17 | 26.74 |
| Longitude (°W) | 112.53 | 115.06 |
| Elevation (m) | 300 | 102 |
| Mean annual temperature (°C) | 19.6 | 19.0 |
| Mean annual precipitation (mm) | 1618.1 | 1466.8 |
| Leaf area index (LAI, m2/m2) | 4.0 | 3.5 |
| Mean daytime solar radiation (W m−2) in summer | 555.6 | 592.0 |
| Mean daytime air temperature (°C) in summer | 29.1 | 31.6 |
| Mean daytime vapor pressure deficit (hPar) in summer | 14.7 | 22.4 |
| Mean daytime soil water content (%) in summer | 21.26 | 12.43 |
| Dominant species | Pinus massoniana Lam, Pinus elliottii Engelm, Cunninghamia lanceolate et al. | Schima superb, Castanea henry, Pinus massoniana Lamb et al. |
| Frequency | Half-hour | Half-hour |
| Time series | 2003–2005 | 2003–2005 |
Table 2.
The mean and standard deviation of WUEdt and diurnal C–W coupling (correlation coefficient r between hourly GPP and ET) in the broadleaved forest at Dinghushan and in the coniferous forest at Qianyanzhou on summer no-rain days over 2003–2005. The form of values in the table is mean ± standard deviation.
| Broadleaved Forest | Coniferous Forest | |
|---|---|---|
| WUE (mg CO2 g−1 H2O) | 7.387 ± 1.385 | 9.014 ± 3.466 |
| C–W coupling (r) | 0.551 ± 0.236 | 0.585 ± 0.254 |
Disclaimer/Publisher’s Note: The statements, opinions and data contained in all publications are solely those of the individual author(s) and contributor(s) and not of MDPI and/or the editor(s). MDPI and/or the editor(s) disclaim responsibility for any injury to people or property resulting from any ideas, methods, instructions or products referred to in the content. |
© 2023 by the authors. Licensee MDPI, Basel, Switzerland. This article is an open access article distributed under the terms and conditions of the Creative Commons Attribution (CC BY) license (https://creativecommons.org/licenses/by/4.0/).
Share and Cite
MDPI and ACS Style
Pan, J.; Liu, J.; Yang, M.; Wang, R. Meteorological Influences on Short-Term Carbon-Water Relationships in Two Forests in Subtropical China. Atmosphere 2023, 14, 457. https://doi.org/10.3390/atmos14030457
AMA Style
Pan J, Liu J, Yang M, Wang R. Meteorological Influences on Short-Term Carbon-Water Relationships in Two Forests in Subtropical China. Atmosphere. 2023; 14(3):457. https://doi.org/10.3390/atmos14030457
Chicago/Turabian StylePan, Jihua, Jane Liu, Mengmiao Yang, and Rong Wang. 2023. "Meteorological Influences on Short-Term Carbon-Water Relationships in Two Forests in Subtropical China" Atmosphere 14, no. 3: 457. https://doi.org/10.3390/atmos14030457
Note that from the first issue of 2016, this journal uses article numbers instead of page numbers. See further details here.