Article

Characteristics and Oxidative Potential of Ambient PM2.5 in the Yangtze River Delta Region: Pollution Level and Source Apportionment

School of Resources and Environmental Engineering, Jiangsu University of Technology, Changzhou 213001, China
*
Author to whom correspondence should be addressed.
Atmosphere 2023, 14(3), 425; https://doi.org/10.3390/atmos14030425
Submission received: 9 January 2023 / Revised: 15 February 2023 / Accepted: 15 February 2023 / Published: 21 February 2023
(This article belongs to the Special Issue Air Pollution, Air Quality and Human Health)

Abstract

:
Fine particulate matter (PM2.5) is a major contributor to the degree of air pollution, and it is associated with a range of adverse health impacts. Moreover, the oxidative potential (OP, as a tracer of oxidative stress) of PM2.5 has been thought to be a possible determinant of its health impact. In this study, the OP of 136 fine aerosol filter samples collected in Changzhou in two seasons (spring and summer) were determined using a dithiothreitol (DTT) assay. Source apportionments of the PM2.5 and DTT activity were further performed. Our results showed that the daily average ± standard deviation of the DTTv (volume-normalized DTT activity) in the PM2.5 was 1.16 ± 0.58 nmol/min/m3 and 0.85 ± 0.16 nmol/min/m3 in the spring and summer, respectively, and the DTTm (mass-normalized DTT activity) was 13.56 ± 5.45 pmol/min/μg and 19.97 ± 6.54 pmol/min/μg in the spring and summer, respectively. The DTTv was higher in the spring compared to the summer while the opposite was true for the DTTm. Most of the detected components (including the organic component, element component, NH4+, Mn, Cu, Zn, etc.) exhibited a moderately positive correlation with the DTTv, but the opposite was found with the DTTm. An aerodyne high-resolution aerosol mass spectrometer (HP-AMS) was deployed to probe the chemical properties of the water-soluble organic matter (WSOA). Positive matrix factorization (PMF) coupled with multiple linear regression was used to obtain the relative source contributions to the DTT activity for the WSOA in the PM2.5. The results showed that the sensitivity sequences of the DTTv to the WSOA sources were oxygenated organic aerosol (OOA) > biomass burning OA (BBOA) > hydrocarbon-like OA (HOA) in the spring and HOA > nitrogen-enriched OA (NOA) > OOA in the summer. The PMF suggested the highest contribution from traffic emissions to the DTTv of the PM2.5 in both seasons. Our findings point to the importance of both organic components from secondary formation and transition metals to adverse health effects in this region. This study can provide an important reference for adopting appropriate public health policies regarding the detrimental outcomes of exposure to PM2.5.

1. Introduction

Particulate matter (PM) is composed of a wide range of chemical components with potentially varying toxicity, implying that mass concentration of PM cannot be used directly to assess its health effects. For instance, some specific species of PM (e.g., polycyclic aromatic hydrocarbons (PAHs), metals) could play a disproportionally large role in the adverse health effects on human beings despite occupying a small mass fraction [1,2,3,4]. So far, the mechanisms for explaining the linkage between PM mass and adverse health effects have not been effectively established, but most researchers currently believe that it is related to the particle’s ability to induce oxidative stress via the generation of reactive oxygen species (ROS) within the affected cells [5,6,7]. The capability of ambient PM to generate ROS is referred to as the oxidative potential (OP), which is an important evaluation index of the currently accepted PM-induced adverse health effects. Therefore, the OP of PM could be a more relevant parameter to reflect PM toxicity in comparison to PM mass concentration.
Several different assays have been developed to quantify the OP of PM samples [8,9,10]. Among these, a dithiothreitol (DTT) assay was extensively used to measure the water-soluble OP of ambient particles [11,12,13,14,15,16]. The OP of PM was influenced by chemical components, although it is currently not possible to fully understand their influence mechanism due to synergistic effects. Research on the relationship between PM chemical components and OP is the hottest and most challenging scientific issue [17,18]. Specific redox-active components in ambient PM, including transition metals (e.g., Mn, Fe, V, Ni, and Cu), humic-like substances (HULIS), and quinones are known to influence the particle OP [19,20,21]. Several studies [22,23] have found a close link between PM chemical composition and PM-induced ROS generation. For example, several reports even showed that PAHs most strongly correlated with DTT loss [1,2,24]. Similarly, Chen et al. [17] reported high correlations between the PM OP and water-soluble organic carbon (WSOC). Certain studies [20,25] have revealed that transition metals contribute significantly to the ambient OP of PM.
Although a large number of studies have investigated the OP of PM2.5, to our knowledge, studies on the contributions of different emission sources to the PM2.5 OP are scarce [6,18,26,27]. For instance, a study in California [28] reported that vehicular-derived particles had a greater mass-normalized OP (DTTm) than that of biomass-burning ones, and another study [6] showed that the source contribution of the OP of the water-soluble fraction in the PM2.5 from Shanghai was dominated by vehicle emissions. Recent studies in Beijing [29,30] paid attention to the important role of anthropogenic organic aerosols by measuring the DTT consumption rate and OH formation rate and noted that reducing WSOC can effectively decrease the OP of the PM2.5.
Overall, our understanding regarding the sources responsible for the OP (ROS generation) is very inadequate as sources vary greatly at different locations. It is therefore necessary to conduct such analyses in order to efficiently reduce the adverse health effects of ambient atmospheric particles.
The primary objectives of the current study were to determine the main ROS-related sources of PM2.5 and its relative contribution to DTT activity at a suburban site in Changzhou, which is one of the representative cities in the Yangtze River Delta region in China. The PM2.5 mass concentration, concentrations of water-soluble ions, trace elements, and DTT activity of the 136 collected PM2.5 samples were determined in two seasons (spring and summer). The particulate species responsible for DTT oxidation were typically examined by correlating the DTT activity with the PM composition. A positive matrix factorization (PMF) analysis was conducted to determine the sources of the PM2.5 and its water-soluble organic matter (WSOA). Then, a multiple linear regression (MLR) combined with identified PMF-WSOA factors was applied for the source apportionment to the associated DTT activity of the WSOA in the PM2.5, which provided a comparison of the health effects between different WSOA components. Such a comprehensive source apportionment study of WSOA-related ROS-generation potential has not been previously reported.

2. Methods

2.1. PM2.5 Sample Collection

The PM2.5 samples were collected at a campus site at the Jiangsu University of Technology in Changzhou (31.7° N, 119.9° E) from March to August 2021, which was set as spring (March and April, 48 samples) and summer (June, July, and August, 88 samples). The sampling duration was 23 h, from 6:00 p.m. to 5:00 p.m. of the next day. The site was located in a suburban area and its surroundings were described in detail elsewhere [31]. A total of 136 ambient PM2.5 samples were collected onto the quartz filters (20.3 × 25.4 cm, Whatman QMA), which were prebaked at 500 °C for 4 h to eliminate possible organic matters using a high-volume sampler (KB-1000, Qingdao Jinsida Co., Ltd., Qingdao, China) with a flow rate of 1.05 m3/min.
The filters were weighed with a precision balance before and after sampling (accuracy of 0.01 mg) to obtain the quantity of the samples, and then they were divided by the sampled air volume to calculate the mass concentration of the PM2.5. The collected samples were wrapped in prebaked aluminum foil packages separately and were stored in a freezer at −20 °C until analyzed.
Concentrations of the gas-phase species including SO2 and NO2 were monitored by the air quality monitoring station inside the campus, which was about 500 m away from the site.

2.2. Oxidative Potential (OP) Measurement Using DTT Assay

We followed the procedure of previous DTT assays [7] with minor modifications. In brief, one-sixteenth of each filter was extracted in 30 mL of Milli-Q water (>18.2 MΩ/cm) in polypropylene vials (Nuggen) by sonication for 30 min by partly immersing the tube in an ultrasonic cleanser bath. The extracted samples were filtered using syringe filters (0.45 µm PTFE membrane, Advantec MFS, Pleasanton, CA, USA) to obtain the aqueous PM2.5 extracts. Then, small aliquot (200 µL) extracts were transferred into a 10 mL tube, mixed with 1 mL of 0.1 mM phosphate buffer (pH = 7.4), and 50 µL of 2.5 mM DTT thoroughly. The samples were placed in the water bath at a controlled temperature (37 ± 1 °C) for incubation. Subsequently, 100 µL of 5 mM DTNB (prepared in 0.1 mM phosphate buffer) was added to each sample five different times (15, 30, 45, 60, and 90 min). The quick reaction between the DTNB and remaining DTT formed the colored 2-nitro-5-thiobenzoic (TNB), which could be quantified using a UV-vis spectrometer at 412 nm of wavelengths within 30 min. Therefore, we could obtain the DTT consumption over time by quantifying the remaining DTT concentration.
The consumption rate of the DTT is generally expressed in two ways: one is volume standardization, representing the DTT consumption rate per cubic meter of atmospheric volume (namely the volume-normalized oxidative potential DTTv), and the other is quantity standardization, representing the DTT consumption rate per microgram of PM (namely the mass-normalized oxidative potential DTTm). The DTTv is directly related to the health impact of human exposure, while the DTTm characterizes the intrinsic OP of PM [32]. Meanwhile, blank filter samples were tested using the identical method to correct the real PM2.5 samples. The averaged DTTv and DTTm of the blank samples were 0.045 ± 0.004 nmol/min/m3 and 0.030 ± 0.003 pmol/min/μg, respectively, which we obtained by using ten blank samples test.
The final DTT activity of the water-soluble PM2.5 was calculated as follows [4,27,33]:
D T T v = R s R b V t × A h A t × V s V e
D T T m = R s R b M t × A h A t × V s V e
Here, Rs and Rb are the DTT consumption rate of the sample and the blank, respectively (nmol/min); Vt and Mt are the total atmospheric sampling volume (m3) and PM2.5 mass (g), respectively; Ah and At are the used area of the DTT experiment and the total area of the sampling filter (cm2), respectively; and Vs and Ve are the sample volume and the extraction volume (mL) involved in the DTT reaction, respectively. Each PM2.5 sample was analyzed in triplicate, and the standard deviation of the parallel sample was less than 5%.

2.3. Chemical Analysis on PM Filters

2.3.1. Water-Soluble Ions (WSIs)

The PM2.5 samples were extracted in Milli-Q water and filtered for the OP analysis. The extracted samples were subsequently transferred to a PolyVial tube and analyzed for water-soluble ions via an ion chromatograph (IC, Thermo Electron Corporation, 81 Wyman Street Waltham, MA, USA). The cations including Na+, NH4+, K+, Mg2+, and Ca2+ were measured with an IC equipped with a CS12A separation columnand a CSRS II suppressor with an eluent of methane sulfonic acid (22 mmol/L) at a flow rate of 1.0 mL/min. Another IC (ICS-2000, Dionex, USA) equipped with an AS11-HC separation column and an ASRS 300 suppressor with an eluent of KOH (30 mmol/L) at a flow rate of 1.0 mL/min were used to measure the anions (F, Cl, NO3, SO42−). During the measurement, the standard with known concentrations of WSIs was tested for every 10 samples to ensure the measurement accuracies and reproducibility.

2.3.2. Trace Elements Analysis

The concentrations of the trace elements collected on the PM2.5 quartz-fiber filters were determined with Energy Dispersive X-Ray Fluorescence (ED-XRF) spectrometry (Epsilon 5, PANalytical, The Netherlands) [34,35]. The X-ray source was a side window X-ray tube with a gadolinium anode; the instrument operated at an acceleration voltage between 25 and 100 kV and a current of 0.5 to 24 mA. The characteristic X-ray radiation was detected with a PAN 32 germanium detector. For quality assurance/quality control (QA/QC) procedures of the ED-XRF measurements, NIST Standard Reference Material (SRM) 2783 was employed to validate the accuracy. The relative errors for all the measured elements were well within the required range of error (˂6% between SRM 2783 and ED-XRF results). A replicate analysis of one quartz-filter sample (five times) yielded an analytical precision below 10%. Details of the ED-XRF measurements were described in a previous publication [36].

2.3.3. Carbonaceous Components

The concentrations of organic carbon (OC) and elemental carbon (EC) on the quartz filters were determined using a Desert Research Institute Model 2001A OC/EC carbon analyzer (Atmoslytic Inc., Calabasas, CA, USA) following a thermal/optical reflectance protocol [37]. Details of the bulk OC and EC analysis were given in elsewhere [31]. The sample concentrations (OC and EC) were corrected by subtracting the average blank concentrations. To ensure the accuracy of the measurement, a known concentration of CH4 was used to calibrate the analyzer daily. One-tenth of the samples were used for reproducibility measurements, and the relative standard deviation from the replicate analysis was found to be below 5% for the OC and EC. The method detection limits (MDLs) for the OC and EC were 0.05 μg/m3 and 0.04 μg/m3, respectively.

2.4. HR-AMS Data Analysis

An offline HR-AMS was applied to analyze the ion group and elemental ratios of the extracted WSOA. The HP-AMS data were processed using the Igor-based software toolkit SQUIRREL (version 1.56D) and PIKA (version 1.15D). The HR-AMS instrument was calibrated for ionization efficiency (IE) and relative ionization efficiency (RIE), and this was conducted at the beginning of the measurement by using 350 nm NH4NO3 and (NH4)2SO4 particles. Standard RIEs of 1.4, 1.1, 3.7, and 1.3 were used for the organics, nitrate, ammonium, and sulfate, respectively. The details of the analyses were described elsewhere [38,39]. In brief, the extracts were nebulized with Ar gas by an atomizer (TSI, Model 3076), and the mist was dehumidified using a diffusion dryer filled with silica gel. The dried particles were sent to the HR-AMS, evaporated at 600 °C, and ionized by electron impact (70 eV). Finally, the positively charged ions were analyzed by mass spectrometry, and high-resolution mass spectra (HRMS) were obtained. Elemental analyses were performed to determine the atomic ratios (the oxygen-to-carbon (O/C), hydrogen-to-carbon (H/C), nitrogen-to-carbon (N/C)), and organic-mass-to-organic-carbon (OM/OC) ratio). The N/C ratio was derived according to Aiken et al. [40], and the O/C, H/C, and OM/OC ratios were derived according to the improved-ambient method recommended by Canagaratna et al. [41]. The time series of the elemental ratios are presented in Figures S1 and S2 in the Supplementary Materials.

2.5. Chemical Analysis on PM Filters

2.5.1. Source Apportionment of DTTv by PMF Coupled with MLR

The PMF Evaluation Toolkit v 2.06 [42] built-in Igor software was applied to the HRMS for the WSOA source apportionment. The data pretreatment and PMF operation followed the procedure presented by Ulbrich et al. [42], and a summary of the key diagnostic plots is presented in Figure S3 (spring) and Figure S4 (summer). In short, multiple solutions (1–7 factors) were generated with a rotational forcing parameter (fpeak) from −1 to 1 with an increment of 0.1. The most satisfactory solution was obtained after carefully examining the scaled residuals, factor correlation with tracer species, and characteristic signatures in the mass spectrum, following the protocol described by Zhang et al. [43]. After an overall evaluation of the PMF results, the 3-factor solution with fpeak = 0 (Q/Qexp = 1.92) appeared to make sense (Figure S3a). The 3-factor solution was capable of reconstructing the total WSOA mass (Figures S3b and S4b) and its temporal profile very well (Figures S3c and S4c). The fitting residuals in terms of both the time series and mass profiles showed near-normal distributions, indicating that the solution was robust and representative and was not strongly influenced by a few outlier runs or m/z’s. For clarification, the MS of the 3-factor and 5-factor solutions are presented in the Supplementary Information (Figures S5 and S6).
Next, the source allocation of DTT activity was quantified by MLR using the WSOA source distribution as the dependent variable, which involved the following equation:
y = β 1 x 1 + β 2 x 2 + + β i x i
where y represents the DTTv, subscripts 1 to i represent the different emission sources of the WSOA, independent variables x1 to xi denote the concentration from different WSOA sources, and β1 to βi indicate the regression coefficients corresponding to the individual independent variables. The details can be found in previous work [14,26].

2.5.2. PMF Analysis for PM2.5 Sources

As is known to all, the PMF model is a traceability data analysis method that does not require a source spectrum. Thus, the PMF model (EPA PMF 5.0 software) was used to identify the source allocations by the PM2.5. Then, we could obtain each source contribution of the PM2.5 to the DTTv according to the PMF results. This method has been introduced in previous work [31]. Briefly, the following species were input into the PMF software for the model calculation: PM2.5, WSOC, OC, EC, SO42−, NO3, NH4+, Cl, K+, Mg2+, and Ca2+, as well as the major elements (Pb, As, Zn, Cu, Fe, Mn, Cr, and V). However, due to the relatively low concentrations in most samples, the species such as Sc, Ti, Co, Ga, Ba, Se, and Sr were excluded from the PMF model. When the measured concentration was higher than the MDLs, the uncertainty for individual species was set as 10% of the concentration. Referring to the study of Wang et al. [44], we applied 5/6 MDLs to the uncertainty and replaced the concentration with 1/2 MDLs accordingly if the concentration was below the MDLs. Furthermore, the detailed QA/QC procedures linked with the PMF were provided in the report of Tao et al. [31] in our group. Two-to-eight solutions were examined to obtain a minimized Q value in the model. Finally, the 4-factor solution was selected as the optimal result by performing 100 bootstrap runs with a lower value of Qrobust/Qtrue = 0.96–1.2. As shown in Figure S7, a high correlation was found between the apportioned PM2.5 (spring r = 0.96, summer r = 0.98) and the measured PM2.5 concentrations. However, it should be noted that the PMF model has some limitations, for instance, the choice of factors retained is subjective since there are no objective criteria for choosing the ideal solutions.

3. Results and Discussions

3.1. PM2.5 Mass and Bulk Chemical Components
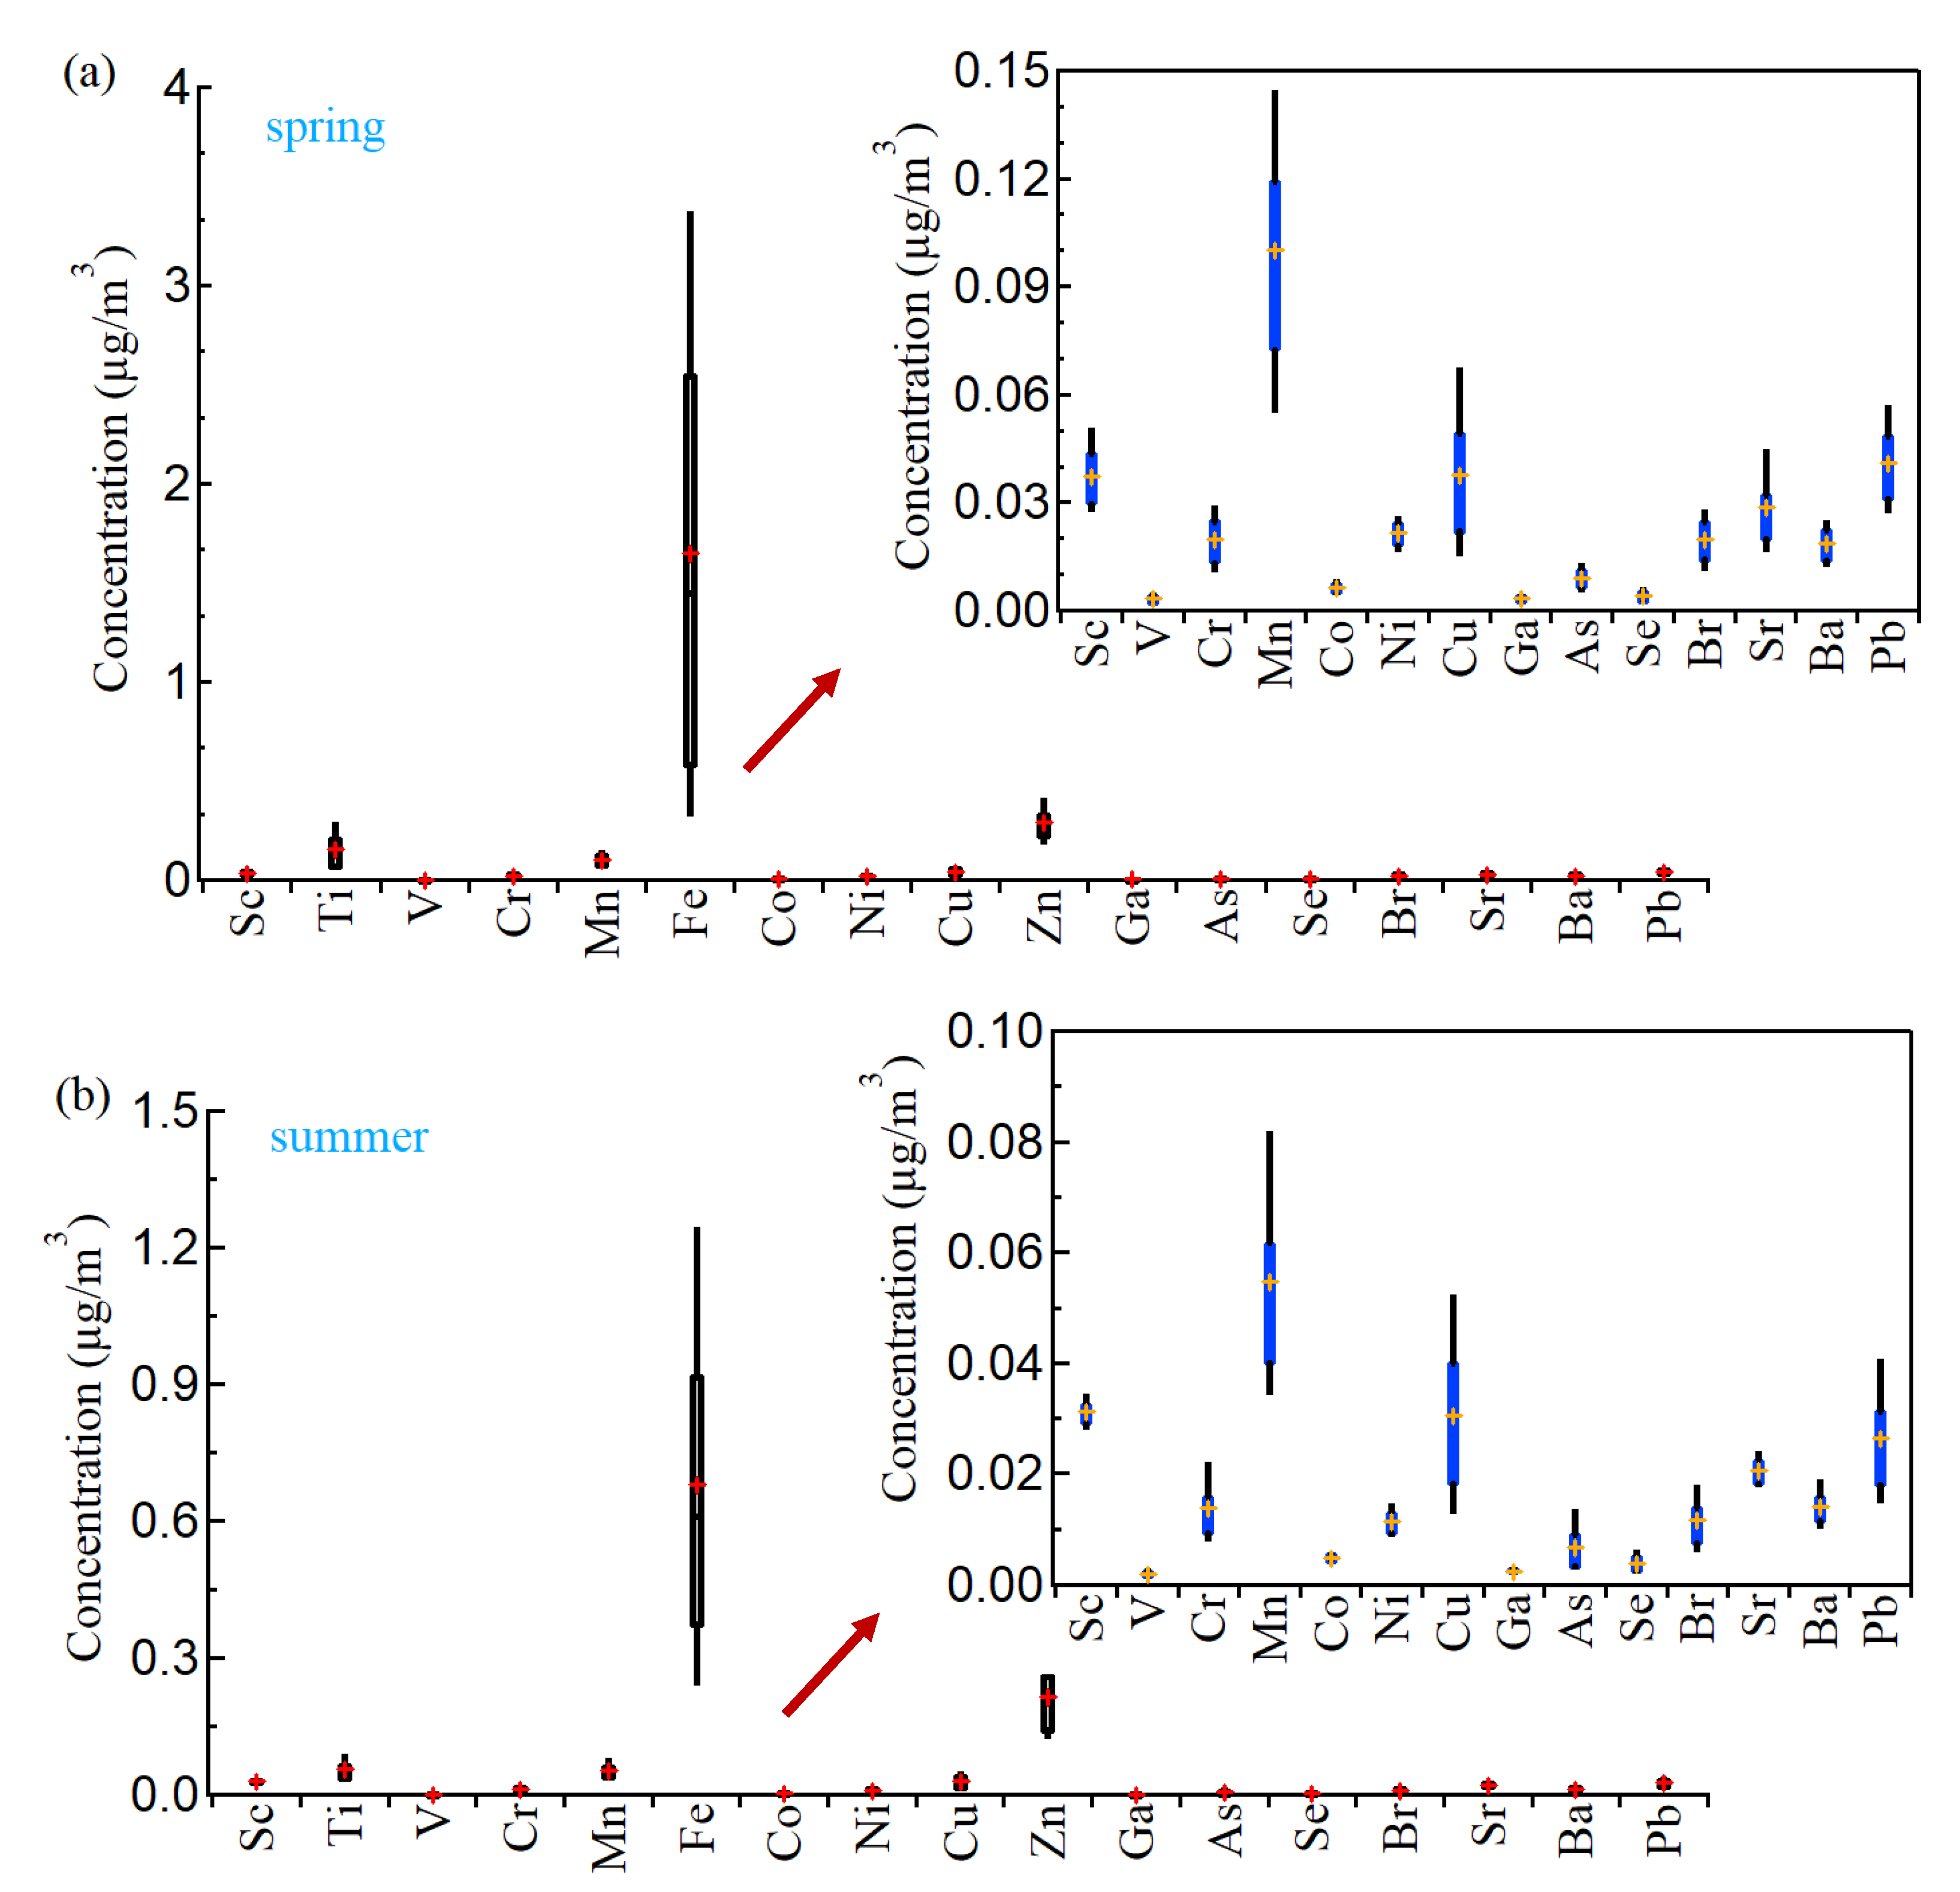
The summary of the statistics of the PM2.5 mass concentration, water-soluble ions, EC and OC in the PM2.5 during the two seasons are shown in Table 1. The concentration of the PM2.5 ranged from 43.62 to 157.35 μg/m3 and the mean ± standard deviation of the mass concentrations was 91.44 ± 27.18 μg/m3 in the spring, which was higher than the limited value (daily limit of 75 μg/m3 from GB 3095-2012), while the concentration of the PM2.5 ranged from 17.36 to 95.67 μg/m3, with an average concentration of 46.26 ± 15.80 μg/m3 in the summer, which was lower than the daily limit. It can obviously be seen that the air pollution of the PM2.5 in the spring was more serious than it was in the summer. The analysis of nine water-soluble ions in the PM2.5 samples showed that the contributions of the total WSIs to the PM2.5 were 49.25% and 45.40% in the spring and summer, respectively, with no significant difference. These values were within the general range (20–70%) previously reported for atmospheric aerosols [4,45], and they were higher than those of Xi’an in 2017 (30.6%) [26], but lower than those observed during Hangzhou and Nanjing (~60%) [4,46]. Secondary inorganic aerosols (SIAs) including SO42−, NO3, and NH4+ were the main ions, accounting for 78.4% of the total WSIs in the spring and 75.7% in the summer, which was similar to what was found in Nanjing [46]. Among the inorganic ions, NO3 was the most abundant species, followed by SO42− and NH4+ in the spring, whereas SO42− was the most abundant species in the summer. As we know, the SIA was transformed from the gaseous precursors SO2, NH3, and NOx in the air, and was generally used to reflect the secondary transformation of aerosols. Figure S8 shows the time series of the gaseous SO2 and NO2 for the two seasons. As can be seen, the average NO2 concentration was higher in the spring than that in the summer, but there was a slight difference for SO2. The higher precursor concentration of NO3 might be the main reason for the higher concentration of NO3 in the spring than in the summer.
The decreased profile of the SIA indicated that the secondary precursor control was effectively implemented. Clearly, the ratio of the OC to EC (OC/EC) was nearly 5.5, indicating the probable formation of the secondary organic aerosol for two seasons [47].
The averaged DTTv level in the spring and summer was 1.16 ± 0.58 nmol/min/m3 and 0.85 ± 0.16 nmol/min/m3, respectively. The DTTm in the spring and summer was 13.56 ± 5.45 pmol/min/μg and 19.97 ± 6.54 pmol/min/μg, respectively. Our measurements of DTT activity were in the range of the typical levels observed for ambient particles (e.g., 5–170 pmol/min/μg for the DTTm) [48].

3.2. Trace Elements

Although we have not yet obtained adequate information on the factors influencing the DTT activity, both the OA and transition metals were verified to be the major factors driving ROS generation by acting as catalysts [23,28]. An investigation by Charrier and Anastasio [20] estimated that about 80% of DTT consumption in ambient PM samples collected in San Joaquin Valley, California is due to transition metals (mainly soluble Cu and Mn). These transition metals mainly originated from traffic emissions or combustion processes. In this study, the total concentration of 17 measured metals in the PM2.5 was 2.18 ± 1.41 μg/m3 and 1.19 ± 0.52 μg/m3 in the spring and summer, respectively (Table 1). Figure 1 depicts the daily average mass concentration of 17 metal elements for the two seasons. As shown in Figure 1, Fe had the highest average concentration among all the detected metals, representing nearly 50–70% of the total concentration of elements in this study. According to the previous literature, the relative importance of various metals in DTT consumption from atmospheric PM differs, with Cu dominating DTT loss, followed by Mn. Previous studies showed [25,49] that despite the high concentration of Fe in the PM2.5 in most cases, Fe accounted for a small fraction of DTT loss (<4%) due to its hydrophobic properties. The contribution of Fe to DTT consumption is verified in Section 3.3.2 via the correlation analysis between DTT and Fe.

3.3. Oxidative Potential (DTT Measurements)

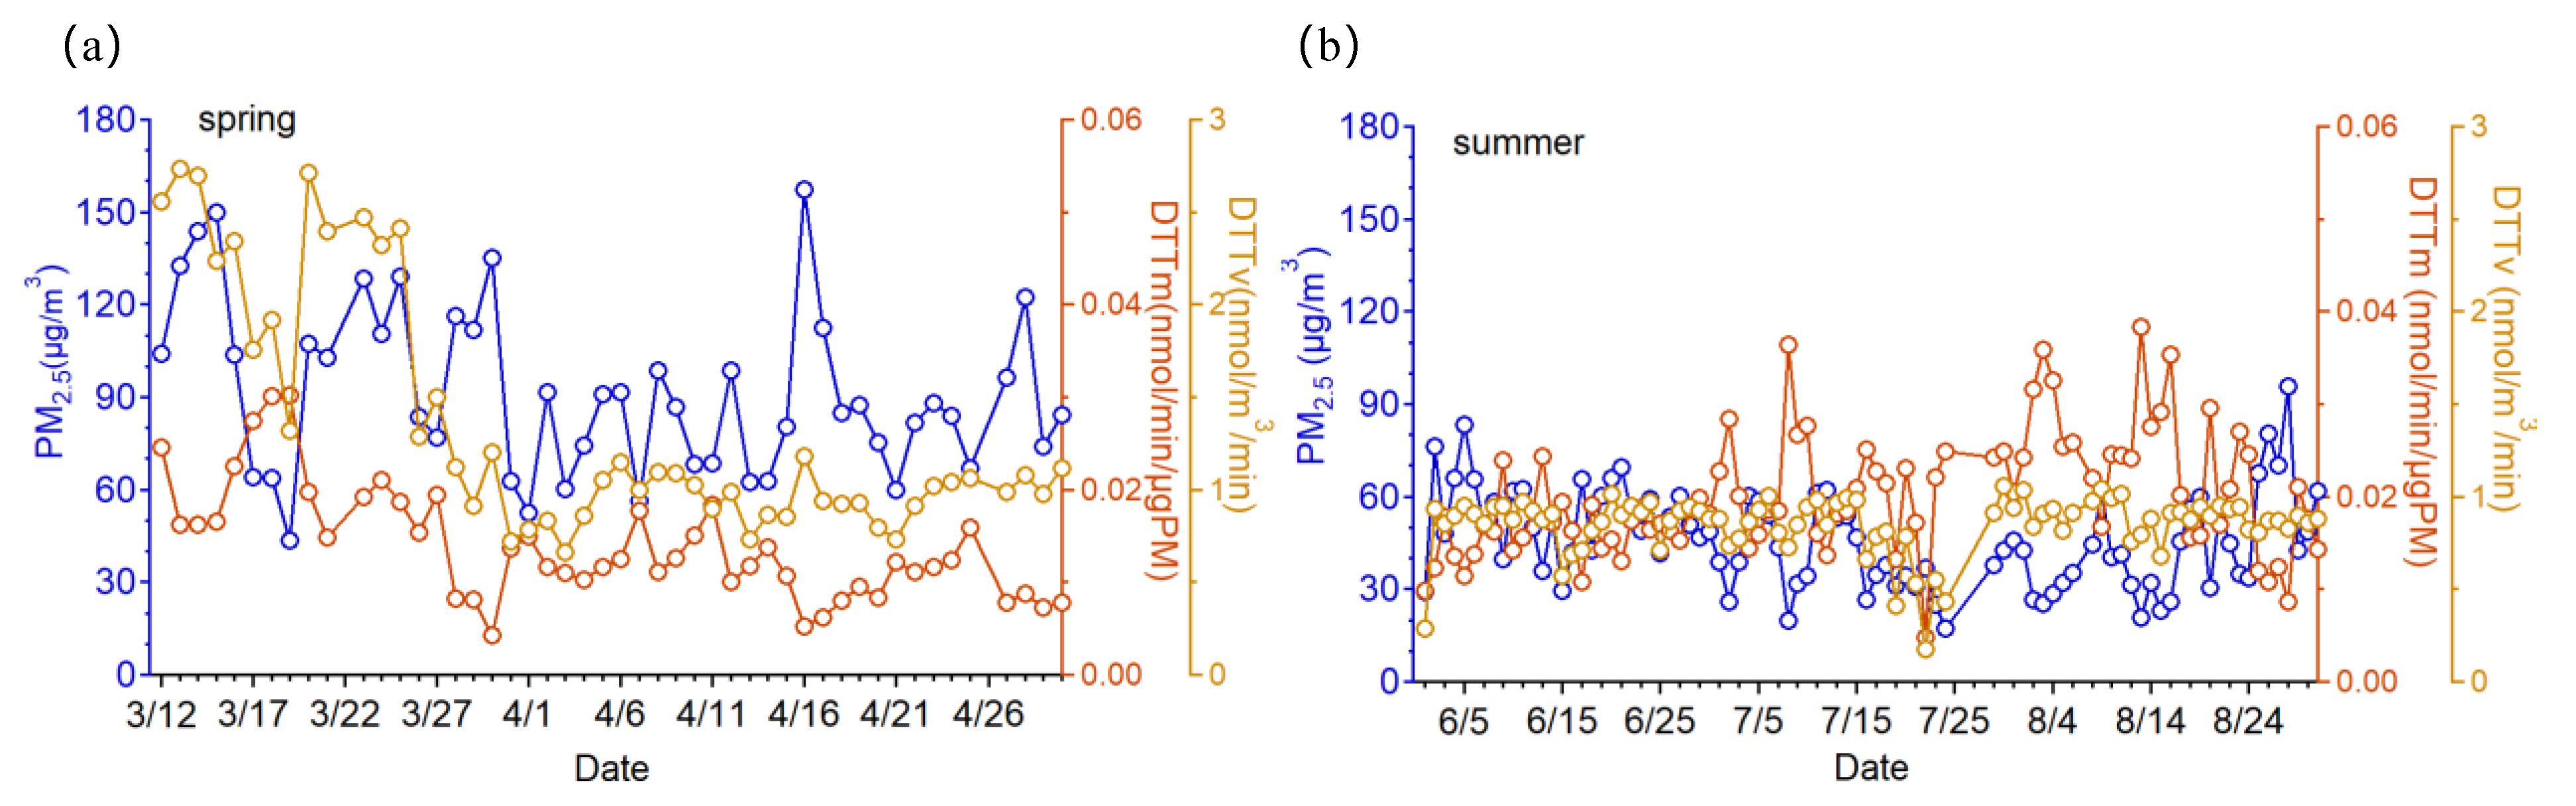
3.3.1. DTT Temporal Distribution

Several assays were utilized to quantify the oxidative potential of the PM samples, such as the ascorbic acid assay and DTT assay [9]. This study only focused on the OP of water-soluble components in the atmospheric PM2.5 samples via the DTT assay, although insoluble species are also important. The time series of the DTTv and DTTm during the observation period are depicted in Figure 2. It is not hard to find that the overall DTTv levels of the summer PM2.5 samples were lower than the spring samples due to the lower overall PM concentration. However, the corresponding DTTm in the PM2.5 samples in the spring was lower than in the summer. This result indicated that although the PM concentrations were higher in the spring, the DTT consumption rates of the unit mass PM were relatively lower, illustrating that the OP is related to its chemical composition and source. Due to the prevalent photochemical formation of the secondary organic aerosol (SOA) in the summer, the unit PM2.5 exhibited high DTT activity [50,51]. Moreover, the fluctuation in the DTTv with the sampling date was not distinct compared with the DTTm. The differences in terms of the DTT between the spring and summer samples may have been intrinsically linked to the different ranges of the PM mass concentration.
As shown in Figure 2, the DTTv covaried with the mass concentration of the PM2.5, while the DTTm was correlated oppositely with the PM mass. This trend was already documented previously by other authors for other regions [4,8]. The possible reason for the PM2.5 DTTm decreasing with the increasing ambient PM2.5 concentration was attributed to the higher percentage of inorganic components in the high PM2.5 concentration [8].
Table 2 summarizes the relevant studies on the PM2.5 oxidative potential in other cities in China. In comparison to the DTT values in other cities, the DTTm (13.55 pmol/min/μgPM) of the PM2.5 in the spring over Changzhou was comparable to that over Guangzhou (14.66 pmol/min/μgPM), but it was far lower than those in Jinzhou (27 pmol/min/μgPM), Tianjin (44 pmol/min/μgPM), Yantai (21 pmol/min/μgPM), and Nanjing (55 pmol/min/μgPM). Likewise, the averaged DTTv at the two seasons (spring: 1.16 nmol/min/m3, summer: 0.85 nmol/min/m3) was lower than the measured value in the neighboring city, Nanjing (2.1 nmol/min/m3), but higher than that in Xi’an (~0.50 nmol/min/m3). One likely reason behind this difference in the OP level might be the dissimilarity in the emission sources and the associated chemical composition of the PM particles. Another reason might be the different added initial DTT concentrations for analysis between the different studies since the initial DTT concentration had some influence on the measured DTT value [15].

3.3.2. Correlation of DTT Activities with PM2.5 Chemical Components

To further identify the major sources for DTT, a correlation analysis was performed between the DTTv, DTTm, and several selected chemical components of the PM2.5. Previous studies [25,51] also showed that the DTTv was broadly associated with some species at significance levels of p < 0.05, including BrC, WSOC, transition metals (e.g., Cu, Fe, Zn, V, Ni, Mn), as well as mineral dust (Ca). Thus, correlation coefficients based on linear regressions between the DTTv and some chemical species (Pearson’s r) were listed in Table 3. Most detected chemical species exhibited significantly (moderately) positive correlations with the DTTv (p < 0.01) but negative correlations with the DTTm. The DTTm was appropriate for assessing the relative PM toxicity from different sources, while the DTTv was important in the context of the overall public exposure. This is in contrast to previous studies [51] showing rather modest-to-strong positive correlation between the DTTm and many components. The negative correlation of the measured chemical components with the DTTm may be explained by their lowered concentrations. The positive correlation between the DTTv and chemical compositions showed that the increased high concentration of the DTT in the unit volume enhanced the capability of the PM to generate ROS.
The analysis showed that the OC was positively correlated with the DTTv in the two seasons. A certain positive correlation between the DTT activity and WSOC suggested that the WSOA may have significantly contributed to the DTT activity. Similarly, significant correlations between the DTTv and WSOC were also previously obtained by Wang et al. [26]. In addition, the DTTv was positively associated with the SIA during the two seasons, similar to the results obtained in Wuhan [53]. It was found that the oxidative potential of the atmospheric particles had a good correlation with transition metals, such as Cu, Mn, etc. [25,50]. Some other transition metals (e.g., V, Zn, Ni, Cr, Co) could also generate ROS and thus exhibit a certain correlation with the OP [23]. Moderate correlations with the DTTv were observed for Cu, although the Pearson’s r in this work (0.2–0.5) was lower (0.6–0.7) than the finding by Wang et al. [50]. This can be explained by the fact that we measured the total elemental concentrations and that the other studies used water-soluble transition metals. A good correlation showed that Cu was the dominant contributor to DTT activity. Compared to Cu, Fe had a weak correlation with the DTTv (r = 0.11) in part due to its lower water solubility (10%) [9], similar to the results reported by Chen et al. [17]. The weak correlation between the DTTv and Na+ suggested that Na+ was nearly inactive in ROS generation. A certain positive relationship between the DTTv (r = 0.37) and Mn suggested that vehicle emissions or combustion sources may have been important contributors to the PM DTTv during the two seasons [17]. When comparing the two seasons, no apparent seasonal patterns for the correlations between the chemical species and the DTTv were observed.

3.4. Contribution of WSOA Sources to DTT Activity

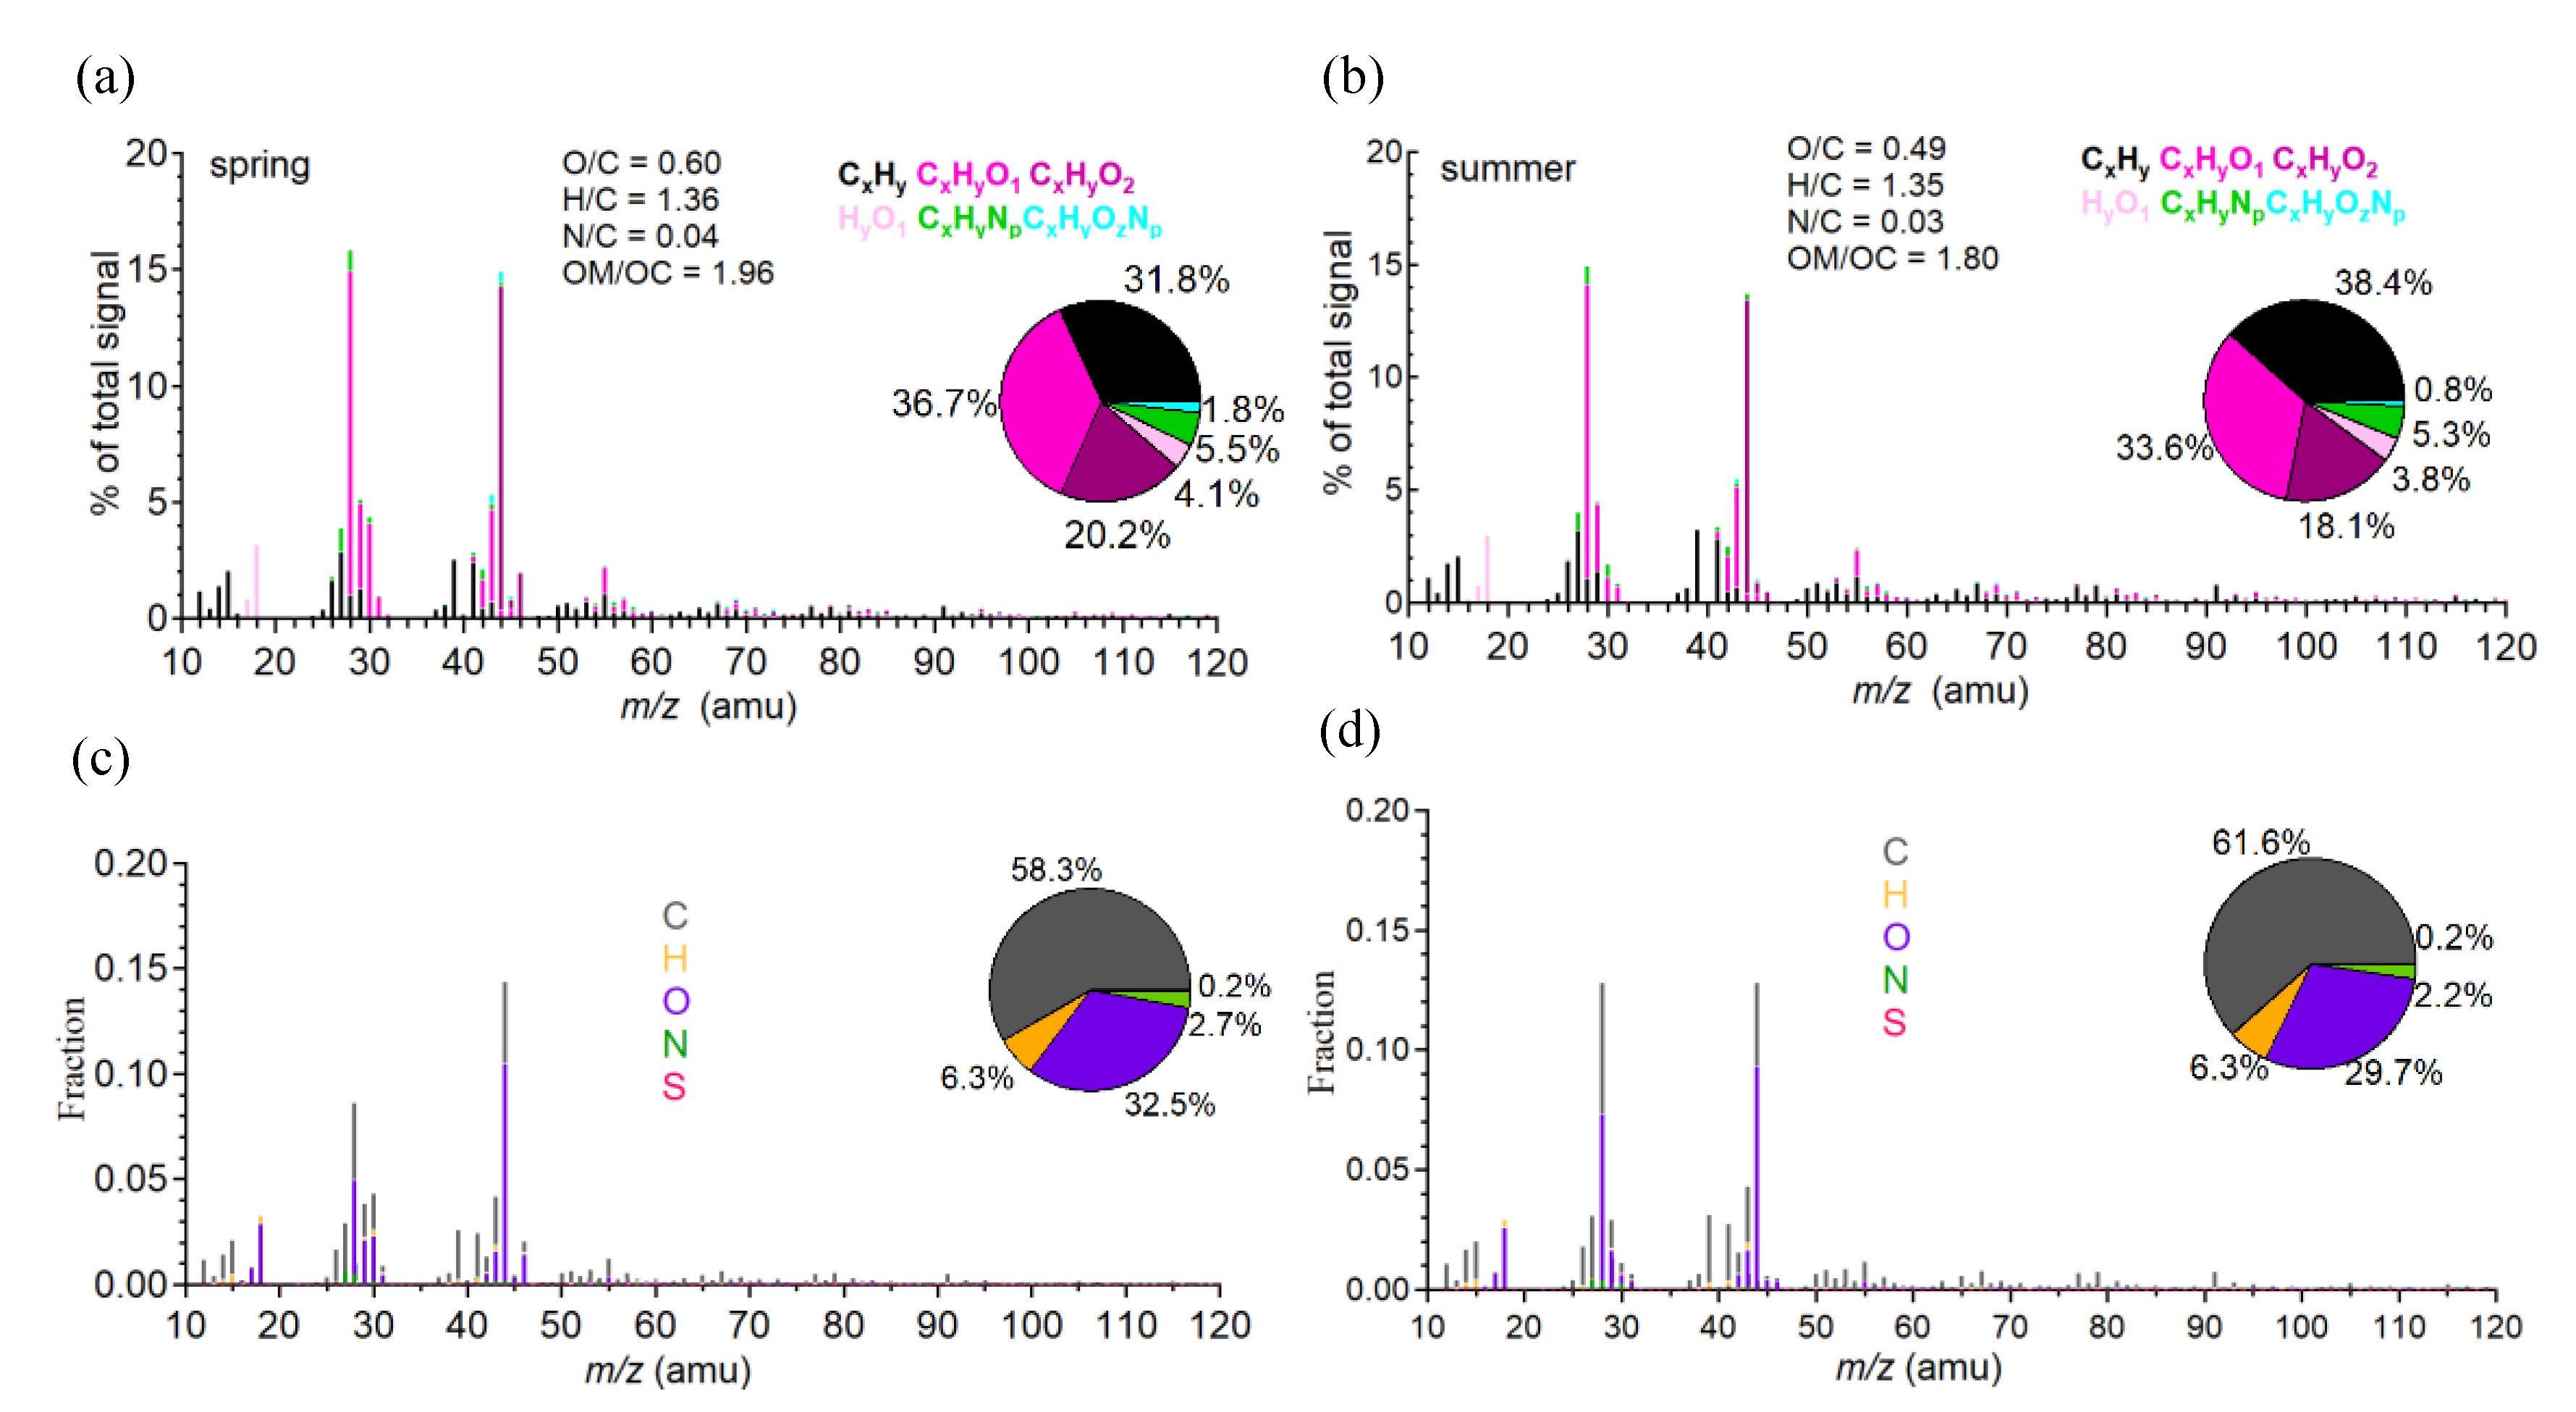
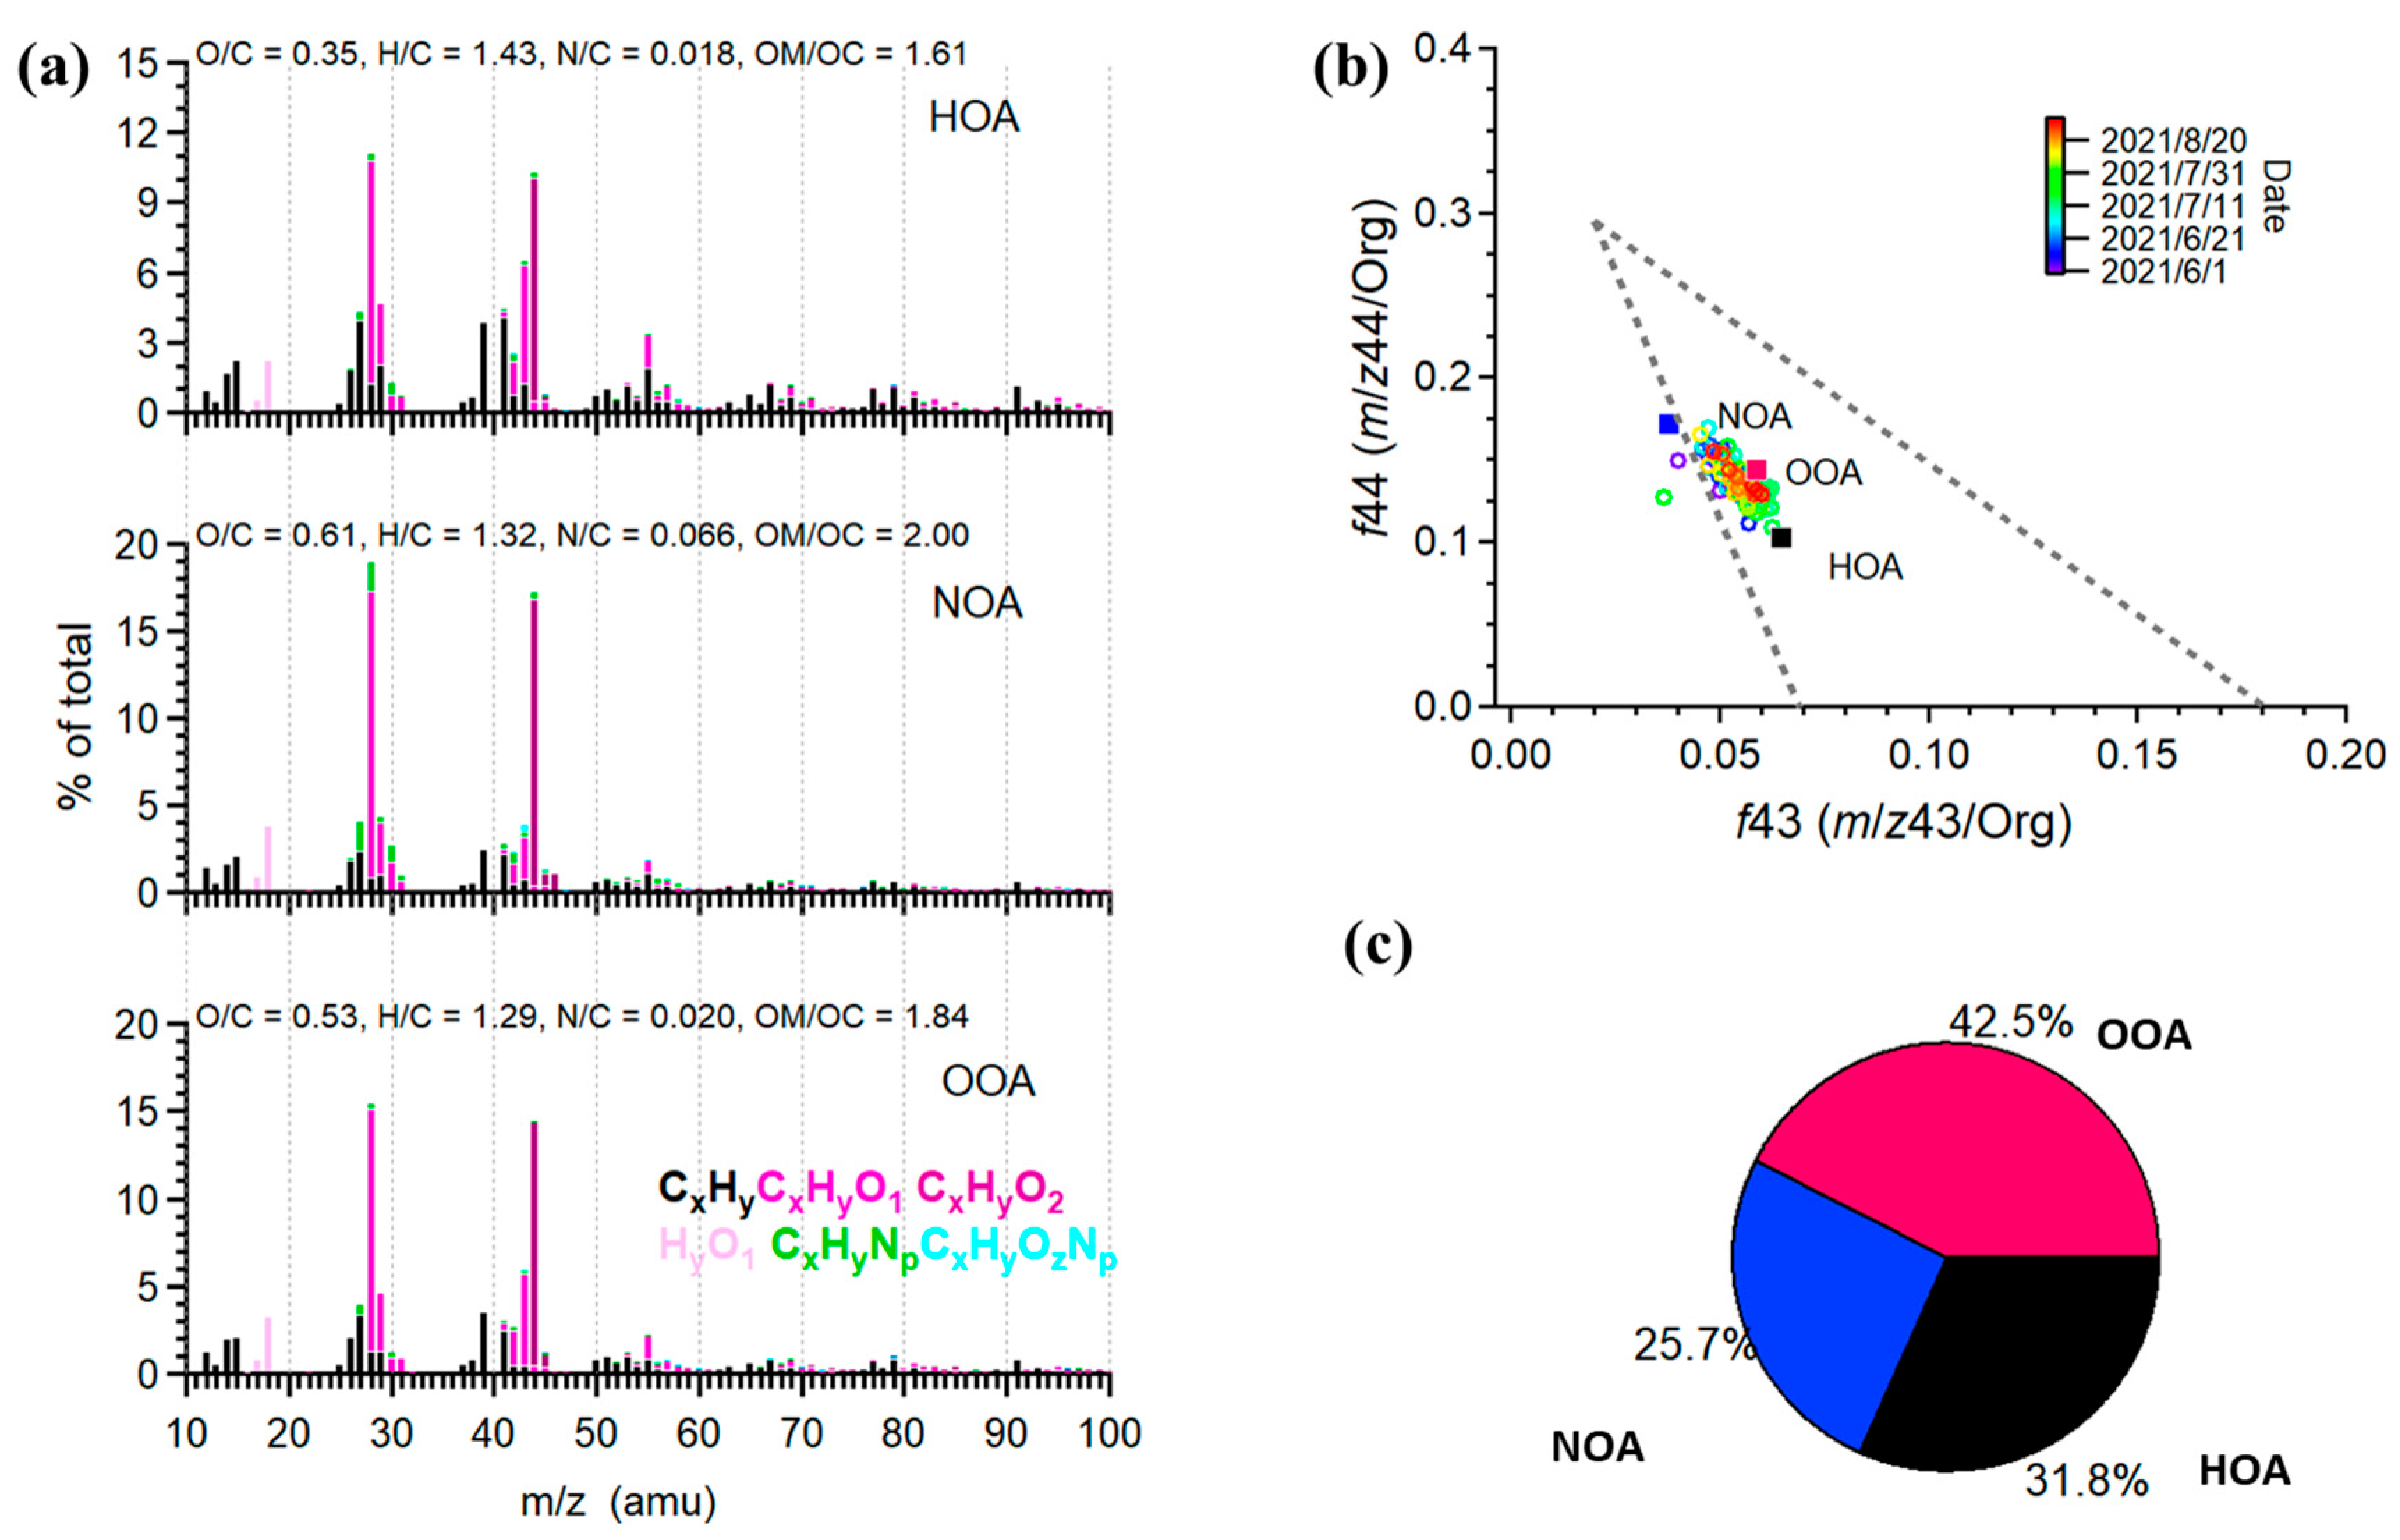
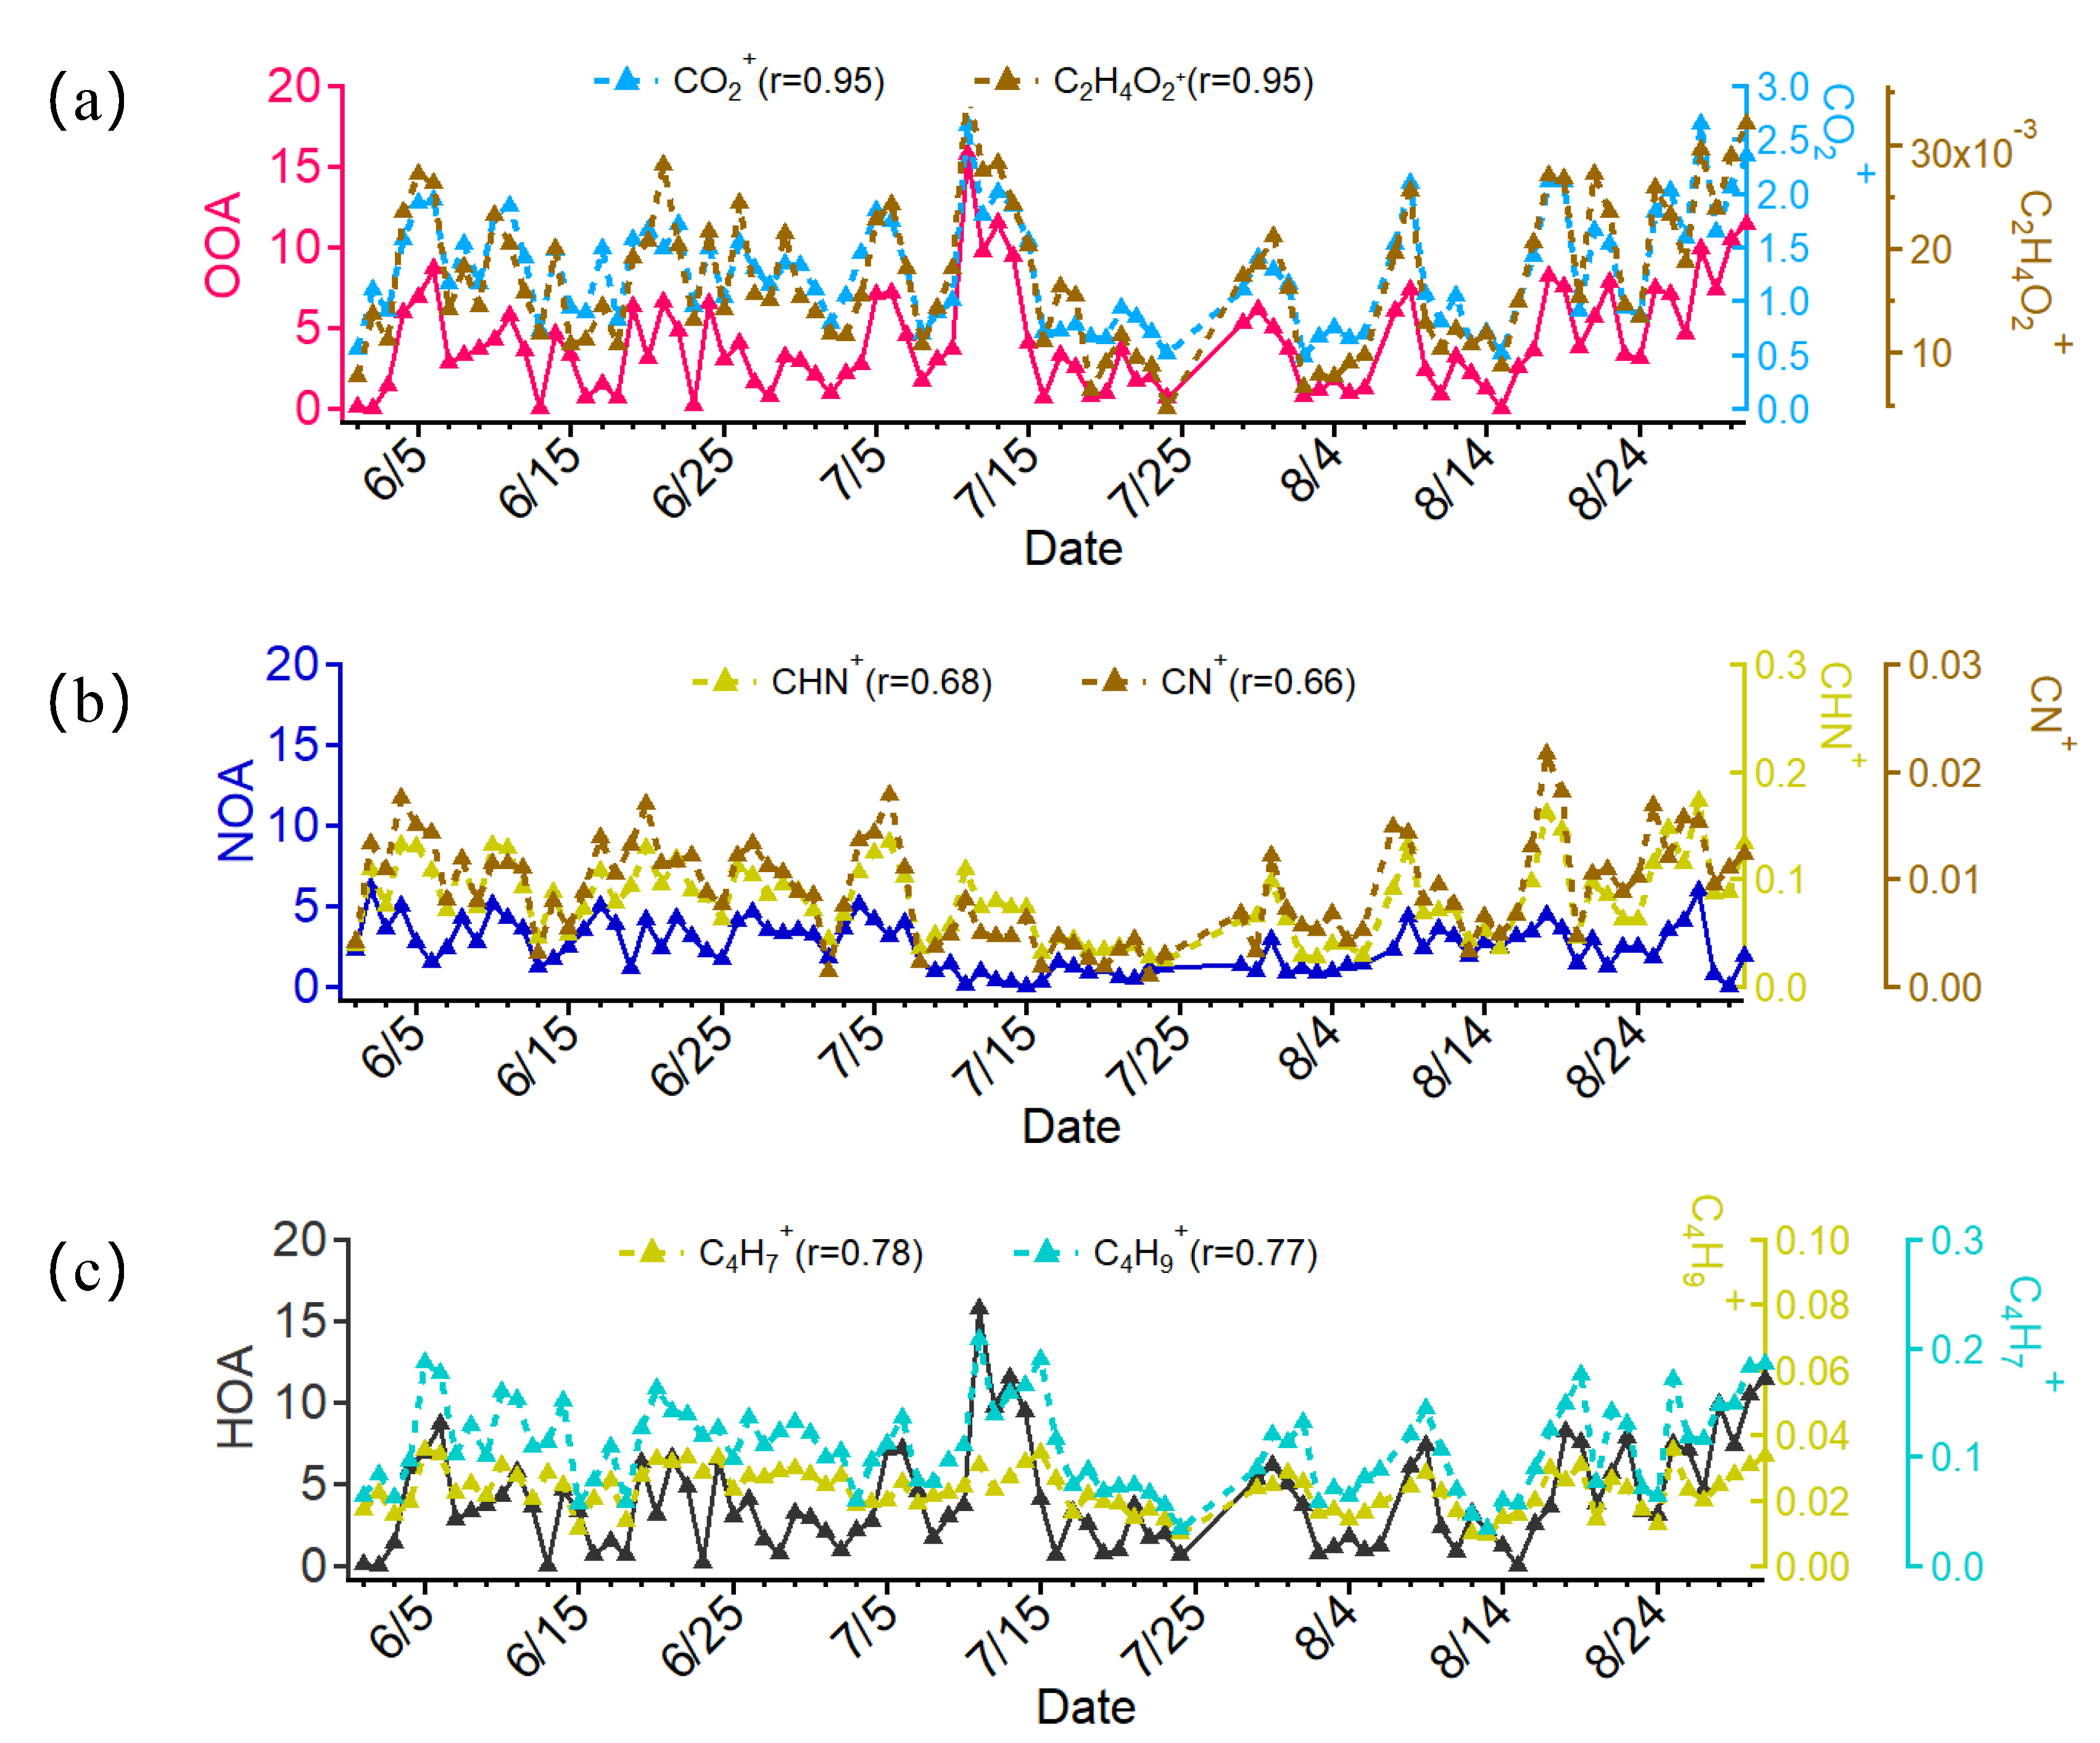
3.4.1. WSOA Sources via PMF Coupled with HR-AMS Data

To gain further insights into the organic matter characteristics of the PM2.5, we conducted HR-AMS analyses on water-soluble PM2.5 samples. The averaged HRMS of the WSOA was characterized by six ion categories and five elements (C, H, O, N, S), which are shown in Figure 3. The inset pie charts represent the corresponding mass fraction. As shown in Figure 3b, the CxHy+ ion family accounted for 38.4% of the WSOA HRMS, followed by CxHyO1+(33.6%), CxHyO2+ (18.1%), and CxHyNp+ (5.3%) in the summer. On the contrary, the CxHyO1+ ion family occupied the largest proportion (36.7%) in the spring (Figure 3a), and as a result, the O/C ratio (0.60) was slightly higher than the observed value in the summer (0.49).
Overall, the mean elemental ratios of the WSOA at the sampling site were 0.49 for the O/C ratio, 1.35 for the H/C ratio, 0.03 for the N/C ratio, and 1.80 for the OM/OC ratio in summer, and 0.60 for the O/C ratio, 1.36 for the H/C ratio, 0.04 for the N/C ratio, and 1.96 for the OM/OC ratio in spring. C, H, O, and N accounted for 61.6% (58.3% in spring), 6.3% (6.3% in spring), 29.7% (32.5% in spring), and 2.7% (2.7% in spring) of the total OA in the summer. S represented a negligible fraction (0.2%).
The PMF of the HR-AMS data resolved the WSOA into three factors: a traffic-related factor (hydrocarbon-like OA, HOA), nitrogen-enriched OA (NOA), and oxygenated OA(OOA) mixed with a biomass-burning OA (BBOA) in the summer (Figure 3), as well as HOA, BBOA, and OOA in the spring (Figure S9). The time series of the three resolved factors are also shown in Figure 4 (summer) and Figure S10 (spring) together with the relevant tracer species.
The bottom factor in the MS profiles was characterized by a higher signal of oxygenated ion series CxHyO1+ and CxHyO2+ (Figure 3a). This factor was highly correlated with CO2+ at m/z 44 (r = 0.95) and C2H4O2+ at m/z 60 (r = 0.95) (Figure 4). Since C2H4O2+ is often used as a tracer of BB emission and CO2+ and is associated with organics from oxygenated sources, we defined this factor as OOA mixed with BBOA. The O/C ratio value (0.53) was also in the range of OOA (>0.6) and BBOA (~0.4). A series of strong signals of CxHyNp+ fragments were found in the middle factor profile; hence, this factor was identified as NOA. Further support for the presence of NOA is its good correlation with some NOA tracers, e.g., CHN+(r = 0.68, Figure 5) and CN+ (r = 0.66, Figure 5). As seen in Figure 4, the HOA factor was characterized by prominent hydrocarbon ions (CnH2n+1+ and CnH2n-1+) at m/z 29 (C2H5+), m/z 39 (C3H3+), m/z 41 (C3H5+), m/z 55 (C4H7+), and m/z 57 (C4H9+), which are typically related to combustion or vehicle exhaust [54]. Moreover, tight correlations with HOA for C4H7+ (r = 0.78) and C4H9+ (r = 0.77) were found, which verified the probable primary source. The relative intensity of CO2+ was much lower than that in the OOA source, and as a result, the O/C ratio of HOA was lower than the other two factors.
The f44 (mass fraction of m/z 44 to total OA) vs. f43 (mass fraction of m/z 43 to the total OA) suggested by Ng et al. [54] is considered to be a good indicator of the oxygenated degree. As shown in Figure 4b, both the HOA and OOA factors fell within a well-defined triangular region, while the NOA was located on the borderline. The mass contributions of the three factors to the total WSOA were 42.5%, 25.7%, and 31.8% for OOA, NOA, and HOA, respectively, in the summer. According to Fig.S9, the WSOA in the spring was resolved to HOA, BBOA, and OOA, accounting for 30.5%, 34.0%, and 35.5%, respectively.

3.4.2. Relative Contribution of WSOA Sources to DTT Activity

Previous studies showed that OA contributed about 60% to the DTT activity [19], indicating the importance of OA to health. To attempt to quantify the relative contributions of different sources resolved by PMF to the WSOA DTTv, this study used the MLR technique. The individual contributions from different sources of WSOA were linked with the time series of the DTTv. Next, the MLR equation accounting for the contributions by different sources to DTT activity with the adjusted r2 = 0.831 and 0.936 in the spring and summer, respectively, could be established as follows:
Spring: DTTv = 0.496 × Factor1 + 0.255 × Factor2 + 0.295 × Factor3
Summer: DTTv = 0.179 × Factor1 + 0.443 × Factor2 + 0.453 × Factor3
The MLR results are listed in Table 4 and Table 5. The corresponding contributions of the three identified WSOA sources to the DTTv are plotted in Figure S11. In general, the OOA contributed nearly half (47.4%) to the DTTv in the spring, but the HOA contributed the most (42.1%) to the DTTv in the summer. Another work by Verma et al. [49] also found that low-volatility OOA contributed to DTT activity, though with less toxicity. Thus, our results indicated that both less-oxidized HOA and more-oxidized OOA would contribute significantly to DTT activity, independently of their oxygenated degree.

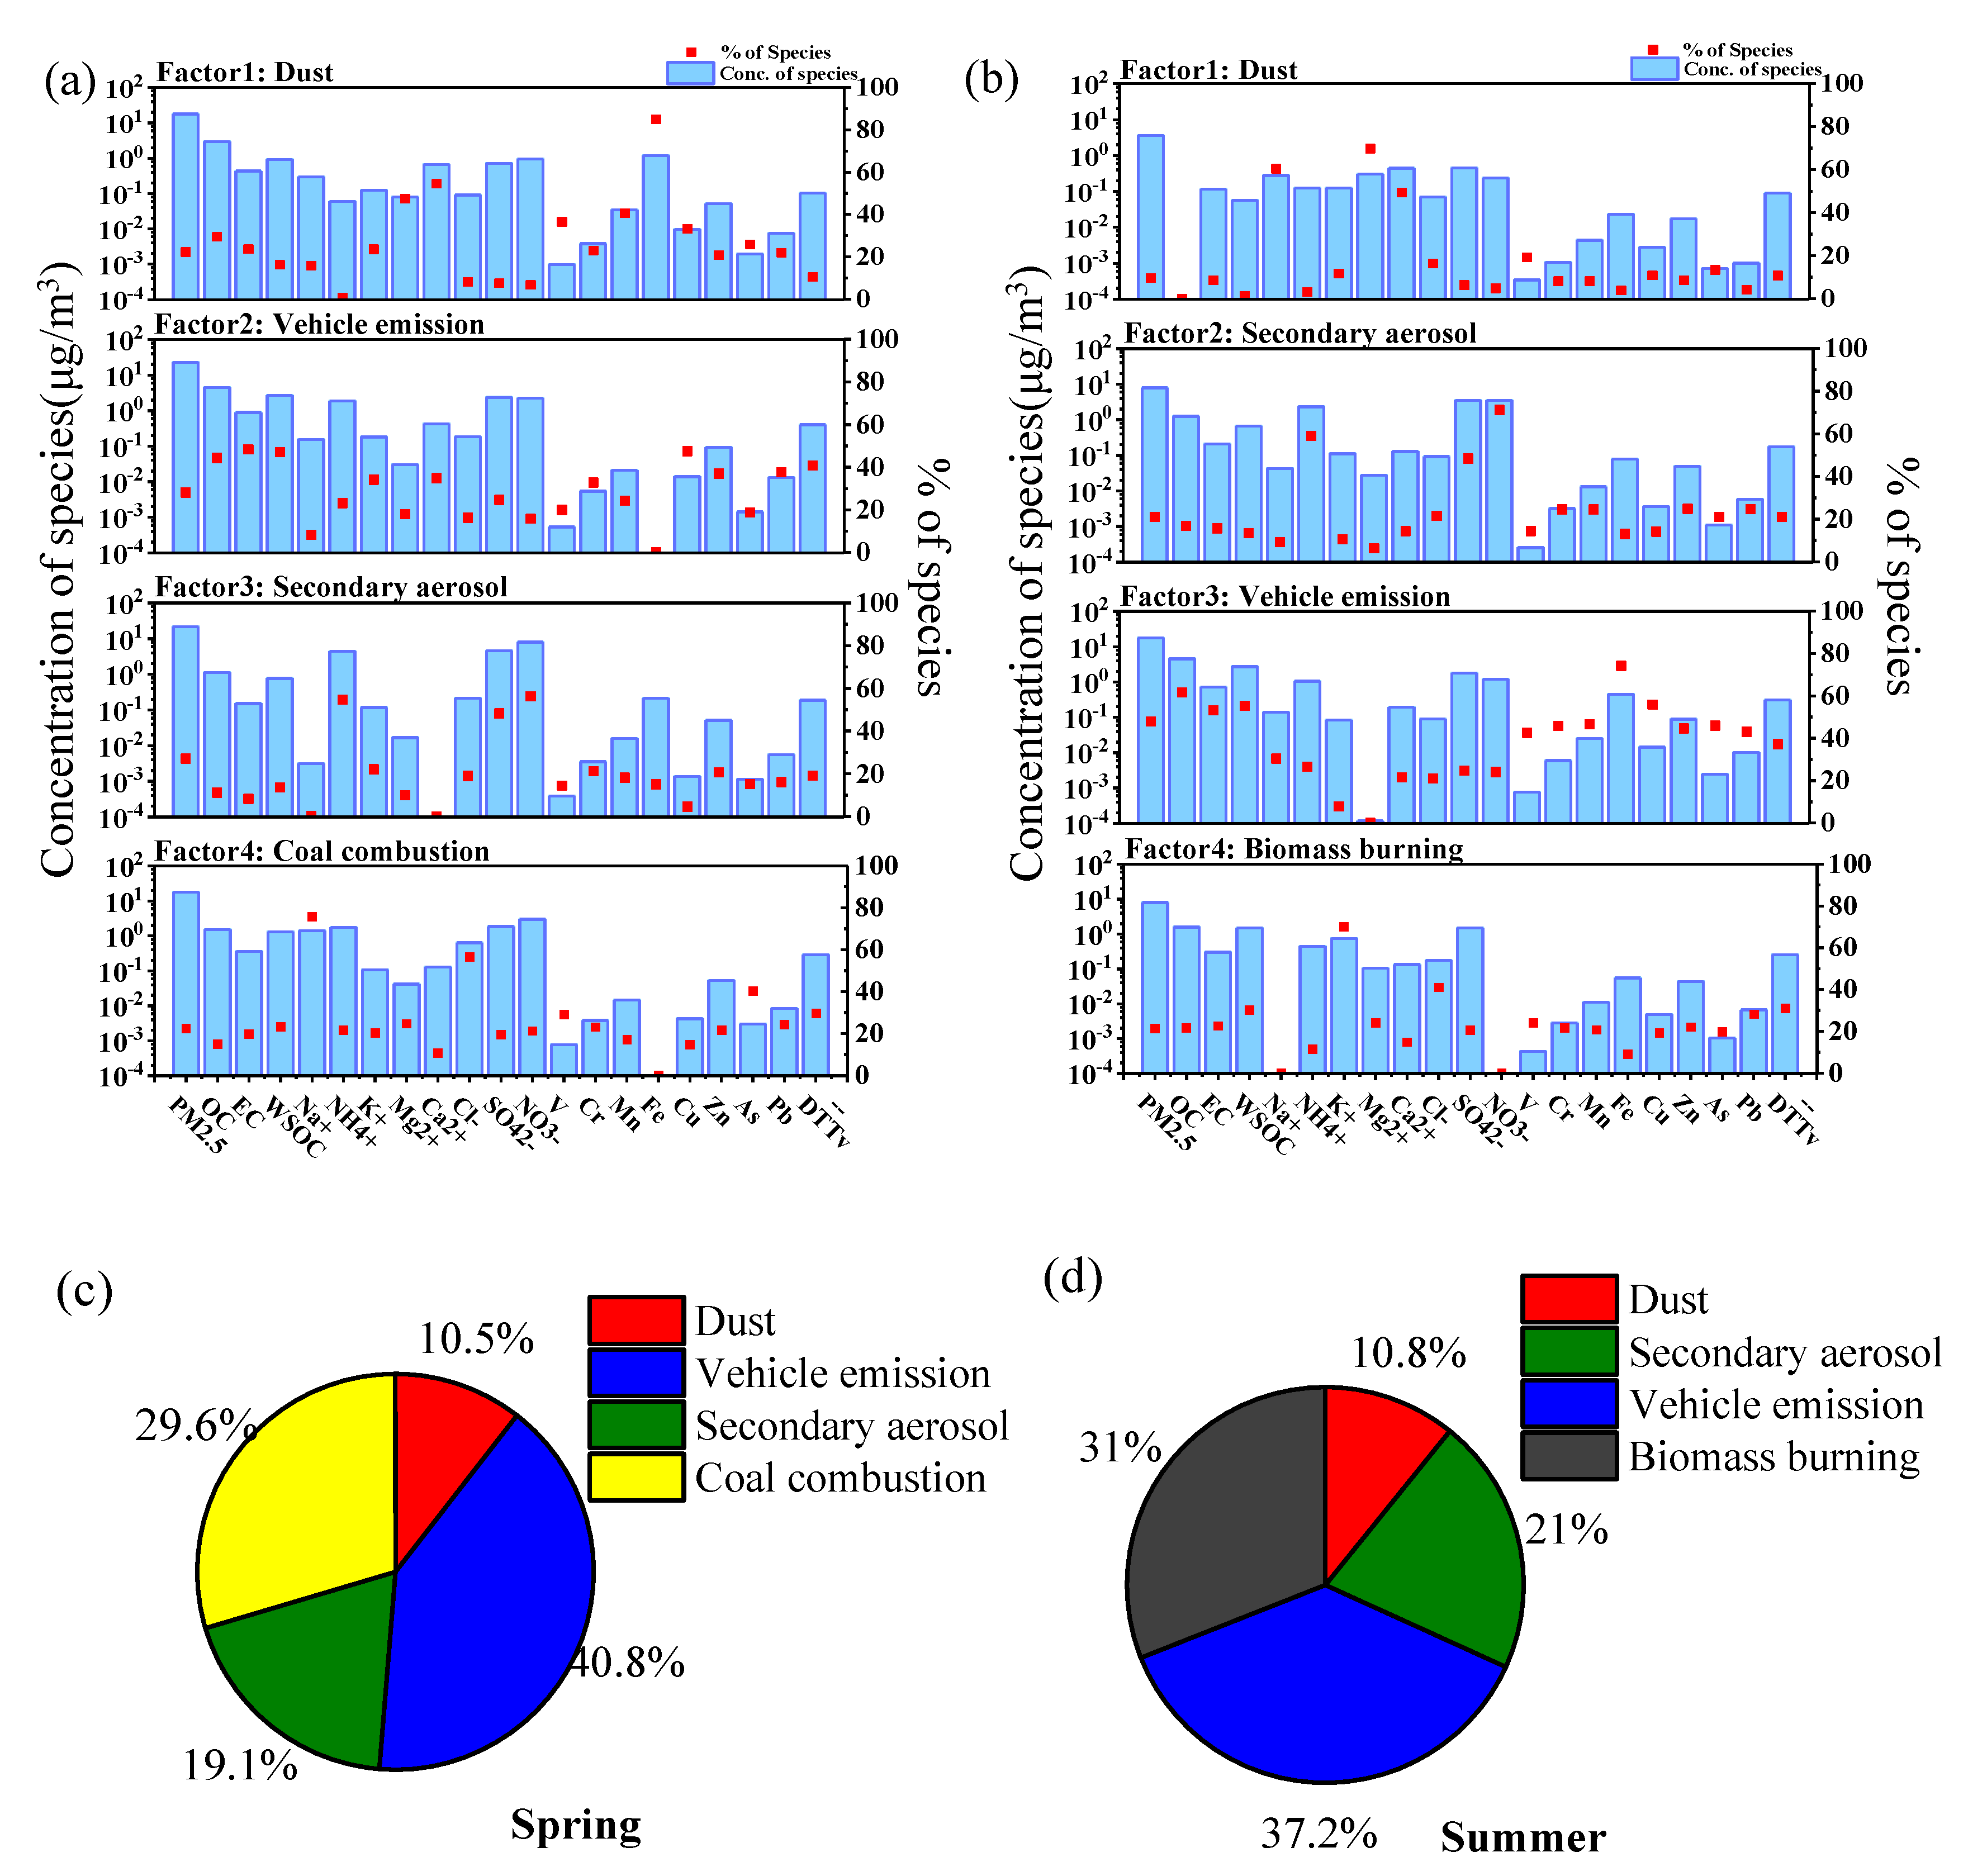
3.5. Source Apportionment of PM2.5 and Its Associated DTT Activity

As discussed above, the WSOA analysis indicated that both the primary OA (POA) and SOA were important substances in the WSOA that contributed to DTT activity. However, the sources that the PM2.5 included and how these sources contributed to the PM2.5 and its associated DTT activity were unknown. So, the source apportionment for the PM2.5 and DTTv were directly determined by using PMF. Through multiple simulation optimization and comparative analyses, four factors were finally identified in the two seasons, namely dust, vehicle emission, secondary aerosol, and coal combustion (spring) or biomass burning (summer). The results are shown in Figure 6a,b. Furthermore, Figure S12 and Figure 6c,d displayed the relative contribution of various resolved sources to the PM2.5 and DTTv. As shown in Figure 6c,d, there were large differences in the seasonal contributions of different sources to the DTTv.
As shown in Figure 6a,b, Factor 1 for the two seasons was identified as the dust source [14], which had a high percentage of Mg2+ and Ca2+ ions. This factor accounted for approximately an 11% contribution to the DTTv (Figure 6c,d). Factor 2 in the spring had a high loading of Zn, Mn, and Pb and was determined to be vehicle emissions [55]. Likewise, Factor 3 in the summer was also attributed to vehicle emissions due to the high metal loading of the marker tracers (Fe, Cu, As, Pb, V, etc.). As for this factor, during the two seasons, the contribution to the DTTv was the most significant (~40%). According to previous findings that Cu is highly DTT active [56,57], a higher concentration of Cu in the vehicle emission factors at two seasons is a good explanation for the highest contribution to the DTTv.
Factor 3 (spring) and Factor 2 (summer) were dominated by three secondary ions (SO42−, NO3, and NH4+), which were therefore identified as secondary aerosol formation sources [32] contributing 19.1% and 21.0% to the DTTv in the PM2.5, respectively. These secondary ions do not play a direct role in ROS generation but can accelerate the formation of other redox-active species that are responsible for ROS generation [50]. Factor 4 in the spring was attributed to coal combustion since it had high a percentage of As and Cl [31]. Differently, Factor 4 in the summer was characterized by a predominant loading of K and Cl ions; thus, it was considered as biomass burning, contributing 31.0% to the DTTv in the PM2.5.
As seen in Figure S12, the PM2.5 sources for the two seasons had some differences. The secondary aerosol had the highest average contributions to the PM2.5 (35.2%), while vehicle emissions (41.2%) had the highest average contributions to the PM2.5 in the summer.
Furthermore, previous studies showed that the same emission sources exhibited different contributions to the PM2.5 mass and DTT activity [18]. For instance, a study conducted by Yu et al. [14] at an urban site in Beijing found that vehicular emissions were responsible for only ~10% of the PM2.5 mass in the summer but resulted in more than half of the contribution to the DTTv. In this study, some significant differences also existed in the spring. For example, the secondary aerosols contributed the most to the PM2.5 mass (35.2%, Figure S12), but vehicles were the major contributor to the DTTv in the spring (40.8%, Figure 6c). On the contrary, the source’s contribution differences between the PM2.5 and DTTv appeared to be nonsignificant in the summer.
In conclusion, there are divergent profiles of the emission sources contributing to the DTTv vs. PM2.5 mass. Moreover, primary sources contributed nearly 80% to the DTTv during the two seasons, which was much higher than secondary sources.

4. Conclusions

In this study, 136 collected PM2.5 filter samples were analyzed via a suite of analytical techniques. The DTTv was higher in the spring compared to the summer, while the opposite was true for the DTTm. The DTTv was related to the PM2.5 mass concentration, while the DTTm was correlated oppositely with PM mass. Good correlations with the DTTv were observed for some transition metals (Mn, Cu, and Zn) and carbonaceous components (WSOC, OC, and EC). Since more attention should be paid to the influences of atmospheric PM2.5 on human health and on controlling the potential sources of ROS, we only selected the DTTv to conduct a source apportionment analysis. We combined PMF and MLR to quantify the WSOA emission sources contributing to the DTTv. Moreover, the source apportionment of the DTTv was directly determined by PMF.
The PMF results during the two seasons indicated that The secondary aerosol had the highest average contributions to the PM2.5, while vehicle emissions had the highest average contributions to the PM2.5 in the summer. Furthermore, the same emission sources exhibited different contributions to the PM2.5 mass and DTT activity, e.g., the contributions of vehicle emissions, secondary aerosols, coal combustion, and dust to the PM2.5 mass of 29.8%, 35.2%, 13%, and 22%, respectively, compared to 40.8%, 19.1%, 29.6%, and 10.5% contributions to the DTTv in the spring, indicating that considering some health-relevant emission sources will become increasingly more important than only concerning the PM2.5 mass concentration in the future. Such divergent profiles of the emission sources contributing to the DTT vs. PM2.5 mass also demonstrate the need to consider the DTT-based OP in the design of air-pollution-control strategies. It is not hard to see that vehicle emissions highly contributed to the PM2.5 during the two seasons due to the large population of automobiles, followed by secondary aerosols. The primary sources contributing to the DTTv (nearly 80%) outweighed the secondary sources during the two seasons.
This study provides a new method of studying the relative contribution of various WSOA components to DTT activity via a combination of MLR with WSOA-PMF results; as a result, we can establish some relationship between WSOA components with human health damage in the future.

Supplementary Materials

The following supporting information can be downloaded at https://www.mdpi.com/article/10.3390/atmos14030425/s1: Figure S1: Elementary ratios (H/C, O/C and N/C) and organic matter to organic carbon ratio (OM/OC) in spring.; Figure S2: Elementary ratios (H/C, O/C and N/C) and organic matter to organic carbon ratio (OM/OC) in summer.; Figure S3: Summary of key diagnostic plots of the PMF results in spring: (a) Q/Qexp as a function of number of factors (b) the box and whiskers plot showing the distributions of scaled residuals for each m/z, (c) time series of the measured WSOA and the reconstructed WSOA.; Figure S4: Summary of key diagnostic plots of the PMF results in summer: (a) Q/Qexp as a function of number of factors (b) the box and whiskers plot showing the distributions of scaled residuals for each m/z, (c) time series of the measured WSOA and the reconstructed WSOA.; Figure S5: Positive matrix factorization of AMS data of WSOM in spring for (a) three-solution, (b) four-solution and (c) five-solution.; Figure S6: Positive matrix factorization of AMS data of WSOM in summer for (a) three-solution, (b) four-solution and (c) five-solution.; Figure S7: Correlations between PMF-predicted PM2.5 mass concentration and measured PM2.5 mass concentrations for three factors.; Figure S8: Time series of gaseous SO2 and NO2 during sampling period.; Figure S9: (a) High resolution mass spectra and time series of WSOA components of 3-factor solution from PMF, (b) Triangle plots (f44 vs. f43) of WSOA and (c) contributions of resolved factors to WSOA in spring.; Figure S10: Correlation of resolved factors from PMF with special tracers in spring.; Figure S11: Average mass contributions of identified sources to DTTv of WSOM during (a) spring and (b) summer.; Figure S12: verage mass contributions of identified sources to PM2.5 during (a) spring and (b) summer.

Author Contributions

Conceptualization, Y.C. and L.Z.; methodology, S.M.; software, H.W. and Z.Z.; investigation, Z.Z.; writing—original draft preparation, Y.C.; writing—review and editing, Z.Y.; funding acquisition, Z.Y. All authors have read and agreed to the published version of the manuscript.

Funding

This research was funded by the Natural Science Foundation of Jiangsu Province (BK20221405) and the Changzhou Science and Technology Bureau (CM20223017).

Institutional Review Board Statement

Not applicable.

Informed Consent Statement

Not applicable.

Data Availability Statement

Not applicable.

Acknowledgments

These authors acknowledge the support from the Natural Science Foundation of Jiangsu Province (BK20221405), the Postgraduate Research and Practice Innovation Program of Jiangsu Province (SJCX21_1332, SJCX22_1455), and Jiangsu University of Technology (XSJCX21_64).

Conflicts of Interest

The authors declare no conflict of interest.

References

  1. Hong, Y.; Xu, X.; Liao, D.; Ji, X.; Hong, Z.; Chen, Y.; Xu, L.; Li, M.; Wang, H.; Zhang, H.; et al. Air pollution increases human health risks of PM2.5-bound PAHs and nitro-PAHs in the Yangtze River Delta, China. Sci. Total Environ. 2021, 770, 145402. [Google Scholar] [CrossRef] [PubMed]
  2. Zhang, L.; Morisaki, H.; Wei, Y.; Li, Z.; Yang, L.; Zhou, Q.; Zhang, X.; Xing, W.; Hu, M.; Shima, M.; et al. PM2.5-bound polycyclic aromatic hydrocarbons and nitro-polycyclic aromatic hydrocarbons inside and outside a primary school classroom in Beijing: Concentration, composition, and inhalation cancer risk. Sci. Total Environ. 2020, 705, 135840. [Google Scholar] [CrossRef] [PubMed]
  3. Bi, C.; Chen, Y.; Zhao, Z.; Li, Q.; Zhou, Q.; Ye, Z.; Ge, X. Characteristics, sources and health risks of toxic species (PCDD/Fs, PAHs and heavy metals) in PM2.5 during fall and winter in an industrial area. Chemosphere 2020, 238, 124620. [Google Scholar] [CrossRef] [PubMed]
  4. Wang, S.; Yan, Q.; Zhang, R.; Jiang, N.; Yin, S.; Ye, H. Size-fractionated particulate elements in an inland city of China: Deposition flux in human respiratory, health risks, source apportionment, and dry deposition. Environ. Pollut. 2019, 247, 515–523. [Google Scholar] [CrossRef] [PubMed]
  5. Bates, J.T.; Fang, T.; Verma, V.; Zeng, L.; Weber, R.J.; Tolbert, P.E.; Abrams, J.Y.; Sarnat, S.E.; Klein, M.; Mulholland, J.A.; et al. Review of acellular assays of ambient particulate matter oxidative potential: Methods and relationships with composition, sources, and health effects. Environ. Sci. Technol. 2019, 53, 4003–4019. [Google Scholar] [CrossRef]
  6. Verma, V.; Fang, T.; Guo, H.; King, L.; Bates, J.T.; Peltier, R.E.; Edgerton, E.; Russell, A.G.; Weber, R.J. Reactive oxygen species associated with water-soluble PM2.5; in the southeastern United States: Spatiotemporal trends and source apportionment. Atmos. Chem. Phys. 2014, 14, 12915–12930. [Google Scholar] [CrossRef] [Green Version]
  7. Cho, A.K.; Sioutas, C.; Miguel, A.H.; Kumagai, Y.; Schmitz, D.A.; Singh, M.; Eiguren-Fernandez, A.; Froines, J.R. Redox activity of airborne particulate matter at different sites in the Los Angeles Basin. Environ. Res. 2005, 99, 40–47. [Google Scholar] [CrossRef]
  8. Xu, X.; Lu, X.; Li, X.; Liu, Y.; Wang, X.; Chen, H.; Chen, J.; Yang, X.; Fu, T.M.; Zhao, Q.; et al. Ros-generation potential of Humic-like substances (HULIS) in ambient PM2.5 in urban Shanghai: Association with HULIS concentration and light absorbance. Chemosphere 2020, 256, 127050. [Google Scholar] [CrossRef]
  9. Fang, T.; Verma, V.; Bates, J.T.; Abrams, J.; Klein, M.; Strickland, M.J.; Sarnat, S.E.; Chang, H.H.; Mulholland, J.A.; Tolbert, P.E.; et al. Oxidative potential of ambient water-soluble PM2.5 in the southeastern United States: Contrasts in sources and health associations between ascorbic acid (AA) and dithiothreitol (DTT) assays. Atmos. Chem. Phys. 2016, 16, 3865–3879. [Google Scholar] [CrossRef] [Green Version]
  10. Hellack, B.; Yang, A.; Cassee, F.R.; Janssen, N.A.H.; Schins, R.P.F.; Kuhlbusch, T.A.J. Intrinsic hydroxyl radical generation measurements directly from sampled filters as a metric for the oxidative potential of ambient particulate matter. J. Aerosol Sci. 2014, 72, 47–55. [Google Scholar] [CrossRef]
  11. Ma, X.; Nie, D.; Chen, M.; Ge, P.; Liu, Z.; Ge, X.; Li, Z.; Gu, R. The relative contributions of different chemical components to the oxidative potential of ambient fine particles in nanjing area. Int. J. Environ. Res. Public Health 2021, 18, 2789. [Google Scholar] [CrossRef] [PubMed]
  12. Li, Z.; Nie, D.; Chen, M.; Ge, P.; Liu, Z.; Ma, X.; Ge, X.; Gu, R. Seasonal variation of oxidative potential of water-soluble components in PM2.5 and PM1 in the Yangtze River Delta, China. Air Qual. Atmos. Health 2021, 14, 1825–1836. [Google Scholar] [CrossRef]
  13. Cao, T.; Li, M.; Zou, C.; Fan, X.; Song, J.; Jia, W.; Yu, C.; Yu, Z.; Peng, P.A. Chemical composition, optical properties, and oxidative potential of water- and methanol-soluble organic compounds emitted from the combustion of biomass materials and coal. Atmos. Chem. Phys. 2021, 21, 13187–13205. [Google Scholar] [CrossRef]
  14. Yu, S.; Liu, W.; Xu, Y.; Yi, K.; Zhou, M.; Tao, S.; Liu, W. Characteristics and oxidative potential of atmospheric PM2.5 in Beijing: Source apportionment and seasonal variation. Sci. Total Environ. 2019, 650, 277–287. [Google Scholar] [CrossRef]
  15. Lin, M.; Yu, J.Z. Dithiothreitol (DTT) concentration effect and its implications on the applicability of DTT assay to evaluate the oxidative potential of atmospheric aerosol samples. Environ. Pollut. 2019, 251, 938–944. [Google Scholar] [CrossRef]
  16. Charrier, J.G.; Richards-Henderson, N.K.; Bein, K.J.; McFall, A.S.; Wexler, A.S.; Anastasio, C. Oxidant production from source-oriented particulate matter—Part 1: Oxidative potential using the dithiothreitol (DTT) assay. Atmos. Chem. Phys. 2015, 15, 2327–2340. [Google Scholar] [CrossRef] [Green Version]
  17. Chen, Q.; Wang, M.; Wang, Y.; Zhang, L.; Li, Y.; Han, Y. Oxidative potential of water-soluble matter associated with chromophoric substances in PM2.5 over Xi’an, China. Environ. Sci. Technol. 2019, 53, 8574–8584. [Google Scholar] [CrossRef]
  18. Saffari, A.; Daher, N.; Shafer, M.M.; Schauer, J.J.; Sioutas, C. Seasonal and spatial variation in dithiothreitol (DTT) activity of quasi-ultrafine particles in the Los Angeles Basin and its association with chemical species. J. Environ. Sci. Health Part A 2014, 49, 441–451. [Google Scholar] [CrossRef]
  19. Verma, V.; Wang, Y.; El-Afifi, R.; Fang, T.; Rowland, J.; Russell, A.G.; Weber, R.J. Fractionating ambient humic-like substances (HULIS) for their reactive oxygen species activity—Assessing the importance of quinones and atmospheric aging. Atmos. Environ. 2015, 120, 351–359. [Google Scholar] [CrossRef]
  20. Charrier, J.G.; Anastasio, C. On dithiothreitol (DTT) as a measure of oxidative potential for ambient particles: Evidence for the importance of soluble transition metals. Atmos. Chem. Phys. 2012, 12, 9321–9333. [Google Scholar] [CrossRef] [Green Version]
  21. Lin, P.; Yu, J.Z. Generation of reactive oxygen species mediated by humic-like substances in atmospheric aerosols. Environ. Sci. Technol. 2011, 45, 10362–10368. [Google Scholar] [CrossRef]
  22. Tuet, W.Y.; Liu, F.; de Oliveira Alves, N.; Fok, S.; Artaxo, P.; Vasconcellos, P.; Champion, J.A.; Ng, N.L. Chemical oxidative potential and cellular oxidative stress from open biomass burning aerosol. Environ. Sci. Technol. Lett. 2019, 6, 126–132. [Google Scholar] [CrossRef]
  23. Yu, H.; Wei, J.; Cheng, Y.; Subedi, K.; Verma, V. Synergistic and antagonistic interactions among the particulate matter components in generating reactive oxygen species based on the dithiothreitol assay. Environ. Sci. Technol. 2018, 52, 2261–2270. [Google Scholar] [CrossRef]
  24. Sricharoenvech, P.; Lai, A.; Tefera, W.; Kumie, A.; Berhane, K.; Gilliland, F.; Samet, J.; Patz, J.; Schauer, J.J. Reactive oxygen species (ROS) activity of fine particulate matter health impacts in Addis Ababa, Ethiopia. Atmos. Pollut. Res. 2021, 12, 101149. [Google Scholar] [CrossRef]
  25. Guo, H.B.; Li, M.; Lyu, Y.; Cheng, T.T.; Xv, J.J.; Li, X. Size-resolved particle oxidative potential in the office, laboratory, and home: Evidence for the importance of water-soluble transition metals. Environ. Pollut. 2019, 246, 704–709. [Google Scholar] [CrossRef] [PubMed]
  26. Wang, Y.; Wang, M.; Li, S.; Sun, H.; Mu, Z.; Zhang, L.; Li, Y.; Chen, Q. Study on the oxidation potential of the water-soluble components of ambient PM2.5 over Xi’an, China: Pollution levels, source apportionment and transport pathways. Environ. Int. 2020, 136, 105515. [Google Scholar] [CrossRef] [PubMed]
  27. Ma, Y.; Cheng, Y.; Qiu, X.; Cao, G.; Fang, Y.; Wang, J.; Zhu, T.; Yu, J.; Hu, D. Sources and oxidative potential of water-soluble humic-like substances (HULISWS) in fine particulate matter (PM2.5) in Beijing. Atmos. Chem. Phys. 2018, 18, 5607–5617. [Google Scholar] [CrossRef] [Green Version]
  28. Shirmohammadi, F.; Hasheminassab, S.; Wang, D.; Saffari, A.; Schauer, J.J.; Shafer, M.M.; Delfino, R.J.; Sioutas, C. Oxidative potential of coarse particulate matter (PM10-2.5) and its relation to water solubility and sources of trace elements and metals in the Los Angeles Basin. Environ. Sci. Process. Impacts 2015, 17, 2110–2121. [Google Scholar] [CrossRef] [PubMed] [Green Version]
  29. Yu, Q.; Chen, J.; Qin, W.; Ahmad, M.; Zhang, Y.; Sun, Y.; Xin, K.; Ai, J. Oxidative potential associated with water-soluble components of PM2.5 in Beijing: The important role of anthropogenic organic aerosols. J. Hazard. Mater. 2022, 433, 128839. [Google Scholar] [CrossRef]
  30. Yu, Q.; Chen, J.; Qin, W.; Cheng, S.; Zhang, Y.; Sun, Y.; Xin, K.; Ahmad, M. Characteristics, primary sources and secondary formation of water-soluble organic aerosols in downtown Beijing. Atmos. Chem. Phys. 2021, 21, 1775–1796. [Google Scholar] [CrossRef]
  31. Tao, Y.; Yuan, Y.; Cui, Y.; Zhu, L.; Zhao, Z.; Ma, S.; Ye, Z.; Ge, X. Comparative analysis of the chemical characteristics and sources of fine atmospheric particulate matter (PM2.5) at two sites in Changzhou, China. Atmos. Pollut. Res. 2021, 12, 101124. [Google Scholar] [CrossRef]
  32. Liu, W.; Xu, Y.; Liu, W.; Liu, Q.; Yu, S.; Liu, Y.; Wang, X.; Tao, S. Oxidative potential of ambient PM2.5 in the coastal cities of the Bohai Sea, northern China: Seasonal variation and source apportionment. Environ. Pollut. 2018, 236, 514–528. [Google Scholar] [CrossRef] [PubMed]
  33. Ma, Y.; Cheng, Y.; Qiu, X.; Cao, G.; Kuang, B.; Yu, J.Z.; Hu, D. Optical properties, source apportionment and redox activity of humic-like substances (HULIS) in airborne fine particulates in Hong Kong. Environ. Pollut. 2019, 255, 113087. [Google Scholar] [CrossRef] [PubMed]
  34. Xu, H.M.; Cao, J.J.; Ho, K.F.; Ding, H.; Han, Y.M.; Wang, G.H.; Chow, J.C.; Watson, J.G.; Khol, S.D.; Qiang, J.; et al. Lead concentrations in fine particulate matter after the phasing out of leaded gasoline in Xi’an, China. Atmos. Environ. 2012, 46, 217–224. [Google Scholar] [CrossRef]
  35. Dannecker, G.S.O.H.W. Fast determination of trace elements on aerosol-loaded filters by X-ray fluorescence analysis considering the inhomogeneous elemental distribution. Fresenius J. Anal. Chem. 2000, 366, 174–177. [Google Scholar]
  36. Xu, H.; Cao, J.; Chow, J.C.; Huang, R.J.; Shen, Z.; Chen, L.W.; Ho, K.F.; Watson, J.G. Inter-annual variability of wintertime PM2.5 chemical composition in Xi’an, China: Evidences of changing source emissions. Sci. Total Environ. 2016, 545–546, 546–555. [Google Scholar] [CrossRef]
  37. Chow, J.C.; Watson, J.G.; Chen, L.W.A.; Arnott, W.P.; Moosmüller, H.; Fung, K. Equivalence of elemental carbon by thermal/optical reflectance and transmittance with different temperature protocols. Environ. Sci. Technol. 2004, 38, 4414–4422. [Google Scholar] [CrossRef]
  38. Ye, Z.; Liu, J.; Gu, A.; Feng, F.; Liu, Y.; Bi, C.; Xu, J.; Li, L.; Chen, H.; Chen, Y.; et al. Chemical characterization of fine particulate matter in Changzhou, China, and source apportionment with offline aerosol mass spectrometry. Atmos. Chem. Phys. 2017, 17, 2573–2592. [Google Scholar] [CrossRef] [Green Version]
  39. Ge, X.; Li, L.; Chen, Y.; Chen, H.; Wu, D.; Wang, J.; Xie, X.; Ge, S.; Ye, Z.; Xu, J.; et al. Aerosol characteristics and sources in Yangzhou, China resolved by offline aerosol mass spectrometry and other techniques. Environ. Pollut. 2017, 225, 74–85. [Google Scholar] [CrossRef]
  40. Aiken, A.C.; Decarlo, P.F.; Kroll, J.H.; Worsnop, D.R.; Huffman, J.A.; Docherty, K.S.; Ulbrich, I.M.; Mohr, C.; Kimmel, J.R.; Sueper, D.; et al. O/C and OM/OC ratios of primary, secondary, and ambient organic aerosols with high-resolution time-of-flight aerosol mass spectrometry. Environ. Sci. Technol. 2008, 42, 4478–4485. [Google Scholar] [CrossRef]
  41. Canagaratna, M.R.; Jimenez, J.L.; Kroll, J.H.; Chen, Q.; Kessler, S.H.; Massoli, P.; Hildebrandt Ruiz, L.; Fortner, E.; Williams, L.R.; Wilson, K.R.; et al. Elemental ratio measurements of organic compounds using aerosol mass spectrometry: Characterization, improved calibration, and implications. Atmos. Chem. Phys. 2015, 15, 253–272. [Google Scholar] [CrossRef] [Green Version]
  42. Ulbrich, I.M.; Canagaratna, M.R.; Zhang, Q.; Worsnop, D.R.; Jimenez, J.L. Interpretation of organic components from Positive Matrix Factorization of aerosol mass spectrometric data. Atmos. Chem. Phys. 2009, 9, 2891–2918. [Google Scholar] [CrossRef] [Green Version]
  43. Zhang, Q.; Jimenez, J.L.; Canagaratna, M.R.; Ulbrich, I.M.; Ng, N.L.; Worsnop, D.R.; Sun, Y. Understanding atmospheric organic aerosols via factor analysis of aerosol mass spectrometry: A review. Anal. Bioanal. Chem. 2011, 401, 3045–3067. [Google Scholar] [CrossRef] [Green Version]
  44. Wang, Y.; Zhang, Y.; Schauer, J.J.; de Foy, B.; Guo, B.; Zhang, Y. Relative impact of emissions controls and meteorology on air pollution mitigation associated with the Asia-Pacific Economic Cooperation (APEC) conference in Beijing, China. Sci. Total Environ. 2016, 571, 1467–1476. [Google Scholar] [CrossRef]
  45. Guo, W.; Zhang, Z.; Zheng, N.; Luo, L.; Xiao, H.; Xiao, H. Chemical characterization and source analysis of water-soluble inorganic ions in PM2.5 from a plateau city of Kunming at different seasons. Atmos. Res. 2020, 234, 104687. [Google Scholar] [CrossRef]
  46. Liu, Y.; Li, H.; Cui, S.; Nie, D.; Chen, Y.; Ge, X. Chemical characteristics and sources of water-soluble organic nitrogen species in PM2.5 in Nanjing, China. Atmosphere 2021, 12, 574. [Google Scholar] [CrossRef]
  47. Jamhari, A.A.; Latif, M.T.; Wahab, M.I.A.; Hassan, H.; Othman, M.; Abd Hamid, H.H.; Tekasakul, P.; Phairuang, W.; Hata, M.; Furuchi, M.; et al. Seasonal variation and size distribution of inorganic and carbonaceous components, source identification of size-fractioned urban air particles in Kuala Lumpur, Malaysia. Chemosphere 2022, 287, 132309. [Google Scholar] [CrossRef]
  48. Verma, V.; Rico-Martinez, R.; Kotra, N.; King, L.; Liu, J.; Snell, T.W.; Weber, R.J. Contribution of water-soluble and insoluble components and their hydrophobic/hydrophilic subfractions to the reactive oxygen species-generating potential of fine ambient aerosols. Environ. Sci. Technol. 2012, 46, 11384–11392. [Google Scholar] [CrossRef]
  49. Verma, V.; Fang, T.; Xu, L.; Peltier, R.E.; Russell, A.G.; Ng, N.L.; Weber, R.J. Organic aerosols associated with the generation of reactive oxygen species (ROS) by water-soluble PM2.5. Environ. Sci. Technol. 2015, 49, 4646–4656. [Google Scholar] [CrossRef]
  50. Wang, Y.; Puthussery, J.V.; Yu, H.; Liu, Y.; Salana, S.; Verma, V. Sources of cellular oxidative potential of water-soluble fine ambient particulate matter in the Midwestern United States. J. Hazard. Mater. 2022, 425, 127777. [Google Scholar] [CrossRef]
  51. Verma, V.; Ning, Z.; Cho, A.K.; Schauer, J.J.; Shafer, M.M.; Sioutas, C. Redox activity of urban quasi-ultrafine particles from primary and secondary sources. Atmos. Environ. 2009, 43, 6360–6368. [Google Scholar] [CrossRef]
  52. Yang, F.; Liu, C.; Qian, H. Comparison of indoor and outdoor oxidative potential of PM2.5: Pollution levels, temporal patterns, and key constituents. Environ. Int. 2021, 155, 106684. [Google Scholar] [CrossRef]
  53. Liu, Q.; Lu, Z.; Xiong, Y.; Huang, F.; Zhou, J.; Schauer, J.J. Oxidative potential of ambient PM2.5 in Wuhan and its comparisons with eight areas of China. Sci. Total. Environ. 2020, 701, 134844. [Google Scholar] [CrossRef]
  54. Ng, N.L.; Canagaratna, M.R.; Zhang, Q.; Jimenez, J.L.; Tian, J.; Ulbrich, I.M.; Kroll, J.H.; Docherty, K.S.; Chhabra, P.S.; Bahreini, R.; et al. Organic aerosol components observed in Northern Hemispheric datasets from aerosol mass spectrometry. Atmos. Chem. Phys. 2010, 10, 4625–4641. [Google Scholar] [CrossRef] [Green Version]
  55. Sulaymon, I.D.; Mei, X.; Yang, S.; Chen, S.; Zhang, Y.; Hopke, P.K.; Schauer, J.J.; Zhang, Y. PM2.5 in abuja, nigeria: Chemical characterization, source apportionment, temporal variations, transport pathways and the health risks assessment. Atmos. Res. 2020, 237, 104833. [Google Scholar] [CrossRef]
  56. Velali, E.; Papachristou, E.; Pantazaki, A.; Choli-Papadopoulou, T.; Planou, S.; Kouras, A.; Manoli, E.; Besis, A.; Voutsa, D.; Samara, C. Redox activity and in vitro bioactivity of the water-soluble fraction of urban particulate matter in relation to particle size and chemical composition. Environ. Pollut. 2016, 208, 774–786. [Google Scholar] [CrossRef]
  57. Liu, Q.; Baumgartner, J.; Zhang, Y.; Liu, Y.; Sun, Y.; Zhang, M. Oxidative potential and inflammatory impacts of source apportioned ambient air pollution in Beijing. Environ. Sci. Technol. 2014, 48, 12920–12929. [Google Scholar] [CrossRef]
Figure 1. Box plots of daily average mass concentration of trace elements in PM2.5 in spring and summer. The whiskers above and below the boxes are the 90th and 10th percentiles, the upper lower boundaries of the boxes are the 75th and 25th percentiles, the lines in the boxes represent the median values, and the dots indicate the mean values. (a) spring, (b) summe.
Atmosphere 14 00425 g001
Figure 2. Time series of volume- and mass-normalized DTT at the sampling site during (a) spring and (b) summer.
Atmosphere 14 00425 g002
Figure 3. (a) High-resolution mass spectra (HRMS) profile of WSOA classified by six ion categories (a) in spring and (b) in summer and classified by five elements (C, H, O, N, and S) (c) in spring and (d) in summer. Elemental ratios and OM/OC ratio of each component are shown in the legends; mass fractions of C, H, O, N, S are shown in inserted pie chart.
Atmosphere 14 00425 g003
Figure 4. (a) High-resolution mass spectra and time series of WSOA components of 3-factor solution from PMF (left panel), (b) triangle plots (f44 vs. f43) of WSOA, and (c) contributions of resolved factors to WSOA in summer.
Atmosphere 14 00425 g004
Figure 5. Correlation of resolved factors from PMF with special tracers in summer for (a) OOA, (b) NOA, and (c) HOA.
Atmosphere 14 00425 g005
Figure 6. Profiles of four sources resolved by PMF model analysis in (a) spring and (b) summer, and calculated contributions of different PM2.5 sources to DTTv in (c) spring and (d) summer.
Atmosphere 14 00425 g006
Table 1. Concentration range and mean ± standard deviation concentrations of PM2.5 and its chemical components.
ItemsUnitsSpringSummer
Mean ± StandardRangeMean ± StandardRange
PM2.5μg/m391.44 ± 27.1843.62~157.3546.45 ± 15.7917.36~95.67
OCμg/m310.99 ± 3.804.33~21.137.54 ± 3.072.32~15.39
ECμg/m31.92 ± 0.501.15~3.231.37 ± 0.340.60~2.23
OC/EC/5.65 ± 1.003.55~8.275.35 ± 1.332.54~7.80
WSOCμg/m36.15 ± 1.563.22~10.694.99 ± 1.992.03~10.78
Fμg/m30.16 ± 0.040.07~0.240.21 ± 0.060.16~0.55
Clμg/m31.48 ± 0.340.59~2.160.48 ± 0.220.27~1.80
SO42−μg/m310.49 ± 4.054.66~20.227.41 ± 2.862.45~16.38
NO3μg/m316.03 ± 6.245.65~29.164.88 ± 3.321.00~12.96
PO43−μg/m32.46 ± 0.641.19~4.280.68 ± 0.120.31~0.93
Na+μg/m32.42 ± 0.490.64~3.230.47 ± 0.340.11~1.72
NH4+μg/m38.90 ± 3.723.44~17.663.94 ± 2.140.83~11.46
K+μg/m30.58 ± 0.150.30~1.031.17 ± 0.790.14~4.25
Mg2+μg/m30.20 ± 0.050.12~0.370.44 ± 0.260.04~0.90
Ca2+μg/m31.41 ± 0.680.25~2.781.02 ± 0.480.20~2.64
SIAμg/m335.42 ± 13.8115.46~65.0816.24 ± 7.895.19~39.89
total WSISμg/m344.13 ± 13.8321.42~72.2020.71 ± 8.098.82~44.00
SIA/WSIs%78.44 ± 6.8062.93~90.5275.70 ± 9.4152.45~90.88
WSIs/PM2.5%49.25 ± 11.1229.01~76.4745.40 ± 11.0522.81~69.72
DTTmpmol/min/μg13.55 ± 5.453.69~30.2219.97 ± 6.544.76~38.36
DTTvnmol/min/m31.16 ± 0.580.55~2.730.85 ± 0.160.17~1.06
Table 2. Literature summary of DTTv and DTTm in atmospheric aerosol.
CityYearSeasonDTTm (pmol/min/μgPM)DTTv (nmol/min/m3)
Jinzhou2016spring27 ± 134.0 ± 2.3[32]
summer23 ± 152.3 ± 1.3
Tianjin2016spring44 ± 85.6 ± 2.1
summer36 ± 154.2 ± 1.3
Yantai2016spring21 ± 83.8 ± 1.8
summer24 ± 142.6 ± 1.4
Guangzhou2017winter13.47 ± 3.864.67 ± 1.06[9]
2018spring14.66 ± 4.494.45 ± 1.02
Xi’an2017spring11.720.53[26]
summer15.670.5
Nanjing2020year round55 ± 242.1 ± 1.1[52]
Changzhou2021spring13.55 ± 5.451.16 ± 0.58this study
summer19.97 ± 6.540.85 ± 0.16
Table 3. A summary of correlation coefficients (Pearson’s r) between DTT activity and chemical components in PM2.5.
SpeciesSpringSummerSpeciesSpringSummer
rDTTmrDTTvrDTTmrDTTvrDTTmrDTTvrDTTmrDTTv
PM2.50.0250.62 **−0.77 **0.42 **V−0.080.22−0.110.08
OC−0.040.49 **−0.56 **0.50 **Cr0.080.30 *−0.38 **0.19
EC0.050.45 **−0.46 **0.38 **Mn0.030.37 **−0.51 **0.37 **
WSOC−0.010.41 **−0.51 **0.50 **Fe−0.160.21−0.53 **0.33 **
Na+0.09−0.040.09−0.35 **Co−0.040.28 *−0.35 **0.15
NH4+0.130.49 **−0.55 **0.27 *Ni0.180.36 **−0.47 **0.22 *
K+0.180.58 **−0.140.23 *Cu0.170.33 *−0.21 *0.53 **
Mg2+−0.130.260.190.08Zn0.140.32 *−0.42 **0.35 **
Ca2+−0.220.18−0.070.34 **Ga0.010.30 *−0.35 **0.23 *
F0.31 *0.36 **0.070.03As0.100.44 **−0.27 *0.30 **
Cl0.31 *0.36 **−0.29 **−0.06Se0.110.34 *−0.42 **0.45 **
SO42−0.130.53 **−0.57 **0.34 **Br0.32 *0.40 **−0.54 **0.27 *
NO30.120.50 **−0.49 **0.22 *Sr−0.160.21−0.43 **0.19
Sc−0.140.16−0.33 **0.26 *Ba0.050.34 *−0.30 **0.31 **
Ti−0.080.29 *−0.45 **0.26 *Pb0.170.54 **−0.30 **0.34 **
** All the particle samples are significant at p < 0.01, respectively; * All the particle samples are significant at p < 0.05, respectively.
Table 4. Multiple linear regression between DTTv and individual source contribution resolved by PMF to WSOA in spring.
SpringUnstandardized CoefficientsStandardized Coefficientst-STATp-Value
BStandard ErrorBeta
n = 48, r2 = 0.688, Adj.ar2 = 0.681
OOA (Factor 1)0.2210.0220.82910.180.000
n = 48, r2 = 0.802, Adj.r2 = 0.793
OOA (Factor 1)0.1570.0220.5897.2990.000
HOA (Factor 3)0.1280.0250.4145.1290.000
n = 48, r2 = 0.831, Adj.r2 = 0.820
OOA (Factor 1)0.1320.0220.4966.0410.000
HOA (Facto 3)0.0910.0270.2953.4250.001
BBOA (Factor 2)0.0760.0270.2552.8080.007
Table 5. Multiple linear regression between DTTv and individual source contribution resolved by PMF to WSOA in summer.
SummerUnstandardized CoefficientsStandardized Coefficientst-STATp-Value
BStandard ErrorBeta
n = 88, r2 = 0.798, Adj.ar2 = 0.796
HOA0.2230.0120.89318.4290.000
n = 88, r2 = 0.925, Adj.ar2 = 0.923
HOA0.1420.010.56814.0710.000
NOA0.1450.0120.48211.9420.000
n = 88, r2 = 0.936, Adj.ar2 = 0.934
HOA (Facto 3)0.1130.0120.4539.5390.000
NOA (Factor 2)0.1330.0120.44311.4560.000
OOA (Factor 1)0.030.0080.1793.8970.000
Disclaimer/Publisher’s Note: The statements, opinions and data contained in all publications are solely those of the individual author(s) and contributor(s) and not of MDPI and/or the editor(s). MDPI and/or the editor(s) disclaim responsibility for any injury to people or property resulting from any ideas, methods, instructions or products referred to in the content.

