
The Atmospheric Pollution Characteristics and Health Risk Assessment of Perfluorohexane Sulfonic Acid in Beijing


1
The Key Laboratory of Resource and Environmental System Optimization, Ministry of Education, College of Environmental Science and Engineering, North China Electric Power University, Beijing 102206, China
2
Engineering Research Center of Clean and Low-Carbon Technology for Intelligent Transportation, Ministry of Education, School of Environment, Beijing Jiaotong University, Beijing 100044, China
3
Institute of Transport Energy and Environment, Beijing Jiaotong University, Beijing 100044, China
*
Authors to whom correspondence should be addressed.
Atmosphere 2023, 14(2), 365; https://doi.org/10.3390/atmos14020365
Submission received: 26 December 2022
/
Revised: 22 January 2023
/
Accepted: 11 February 2023
/
Published: 13 February 2023
(This article belongs to the Section Air Quality and Human Health)
Abstract
:Perfluorohexane sulfonic acid (PFHxS), one of the substitutes for perfluorooctane sulfonic acid (PFOS), has been widely discussed around the world. In this study, the atmospheric concentrations of PFHxS in Beijing in the summer and autumn of 2021 were monitored, and the gas–particle partitioning and wet and dry deposition characteristics were analyzed. The results show that the average total concentrations of PFHxS in Beijing in the summer and autumn were 1.61 pg/m3 and 1.41 pg/m3, respectively. The particulate fraction φ of PFHxS was about 48% during the research period, and there was a significant positive correlation between φ and air temperatures. The linear fitting relationship between (gas–particle partition coefficient) and (compound vapor pressure) showed that the absorption between the PFHxS molecule and particulate matter dominated the process of gas–particle partitioning. The total deposition flux of PFHxS was the largest in July and the smallest in October, with values of 55.2 and 23.7 ng/m2, respectively. During the study period, PFHxS in the atmosphere had no obvious health impacts on humans. However, with their extensive use, the possible harmful effects on children should be continuously investigated.
1. Introduction
Perfluorohexane sulfonic acid (PFHxS) is a type of perfluoroalkyl and polyfluoroalkyl compound (PFAS), which is a strong acid with six carbon atoms. Because of its excellent hydrophobic and oleophobic surface activity, as well as good thermal and chemical stability, it has waterproofing, oil repellency, and easy decontamination functions. So, it is widely used in the production of surfactants, paper, and textile protective coatings [1]. Similar to other PFASs, PFHxS also has persistence [2], bioaccumulation [3,4], potential for long-range environmental transport [5,6,7,8,9], and adverse effects [10,11]. With perfluorooctane sulfonic acid (PFOS) and its salts listed in Annex B of the Stockholm Convention [12], PFHxS has been widely promoted and used as one of the main substitutes [13,14]. More PFHxS was needed to achieve the same effect as PFOS, so its use, emissions, and exposure levels are rapidly increasing [15]. The risk assessment of PFHxS, as well as its salts and related compounds, was reported in 2019 [16]. The Persistent Organic Pollutants Review Committee (POPRC) has adopted the risk profile and risk management evaluation and recommended listing PFHxS, its salts, and related compounds in Annex A to the Stockholm Convention in 2021 [17]. The pollution situation and environmental behavior of PFHxS have gradually attracted worldwide attention.
The atmospheric transport of PFHxS is a significant mode of its global distribution [5]. The existing form and deposition of PFHxS in the atmospheric environment can be affected by its distribution in gas and particle phases. At present, many studies have reported the existence of PFHxS in the atmosphere [18,19,20,21,22], but there is little research on its gas–particle partitioning [22,23]. Atmospheric PFHxS mainly enters water and soil through the dry and wet deposition. Therefore, the wet and dry deposition will affect the fate of PFHxS in the atmosphere. In addition, PFHxS in the atmosphere may enter the human body through exposure routes, such as respiration and skin contact, thus endangering human health. However, few studies explore the wet and dry deposition and the health effects of PFHxS based on its atmospheric concentrations [24,25].
With the restricted use of PFOS, some PFAS-manufacturers in China have started to produce perfluorohexane sulfonyl fluoride (PFHxSF) and its derivatives as replacements for PFOSF-based chemicals (e.g., in textile finishing agents) [26], which are major raw materials for PFHxS [27]. As a result, the mass production of PFHxSF will probably greatly increase the manufacturing and emissions of PFHxS. Moreover, studies have pointed out that the concentrations of PFHxS in Taihu lake in China rose by about 60 times from 2009 to 2015 [28]. Therefore, it is essential to study PFHxS levels in the atmosphere of China. This paper uses Beijing as an example to study (a) the concentrations and variation characteristics of PFHxS in the atmosphere; (b) the gas–particle partitioning process; (c) the wet and dry deposition characteristics; and (d) the impact on human health in Beijing.
2. Materials and Methods
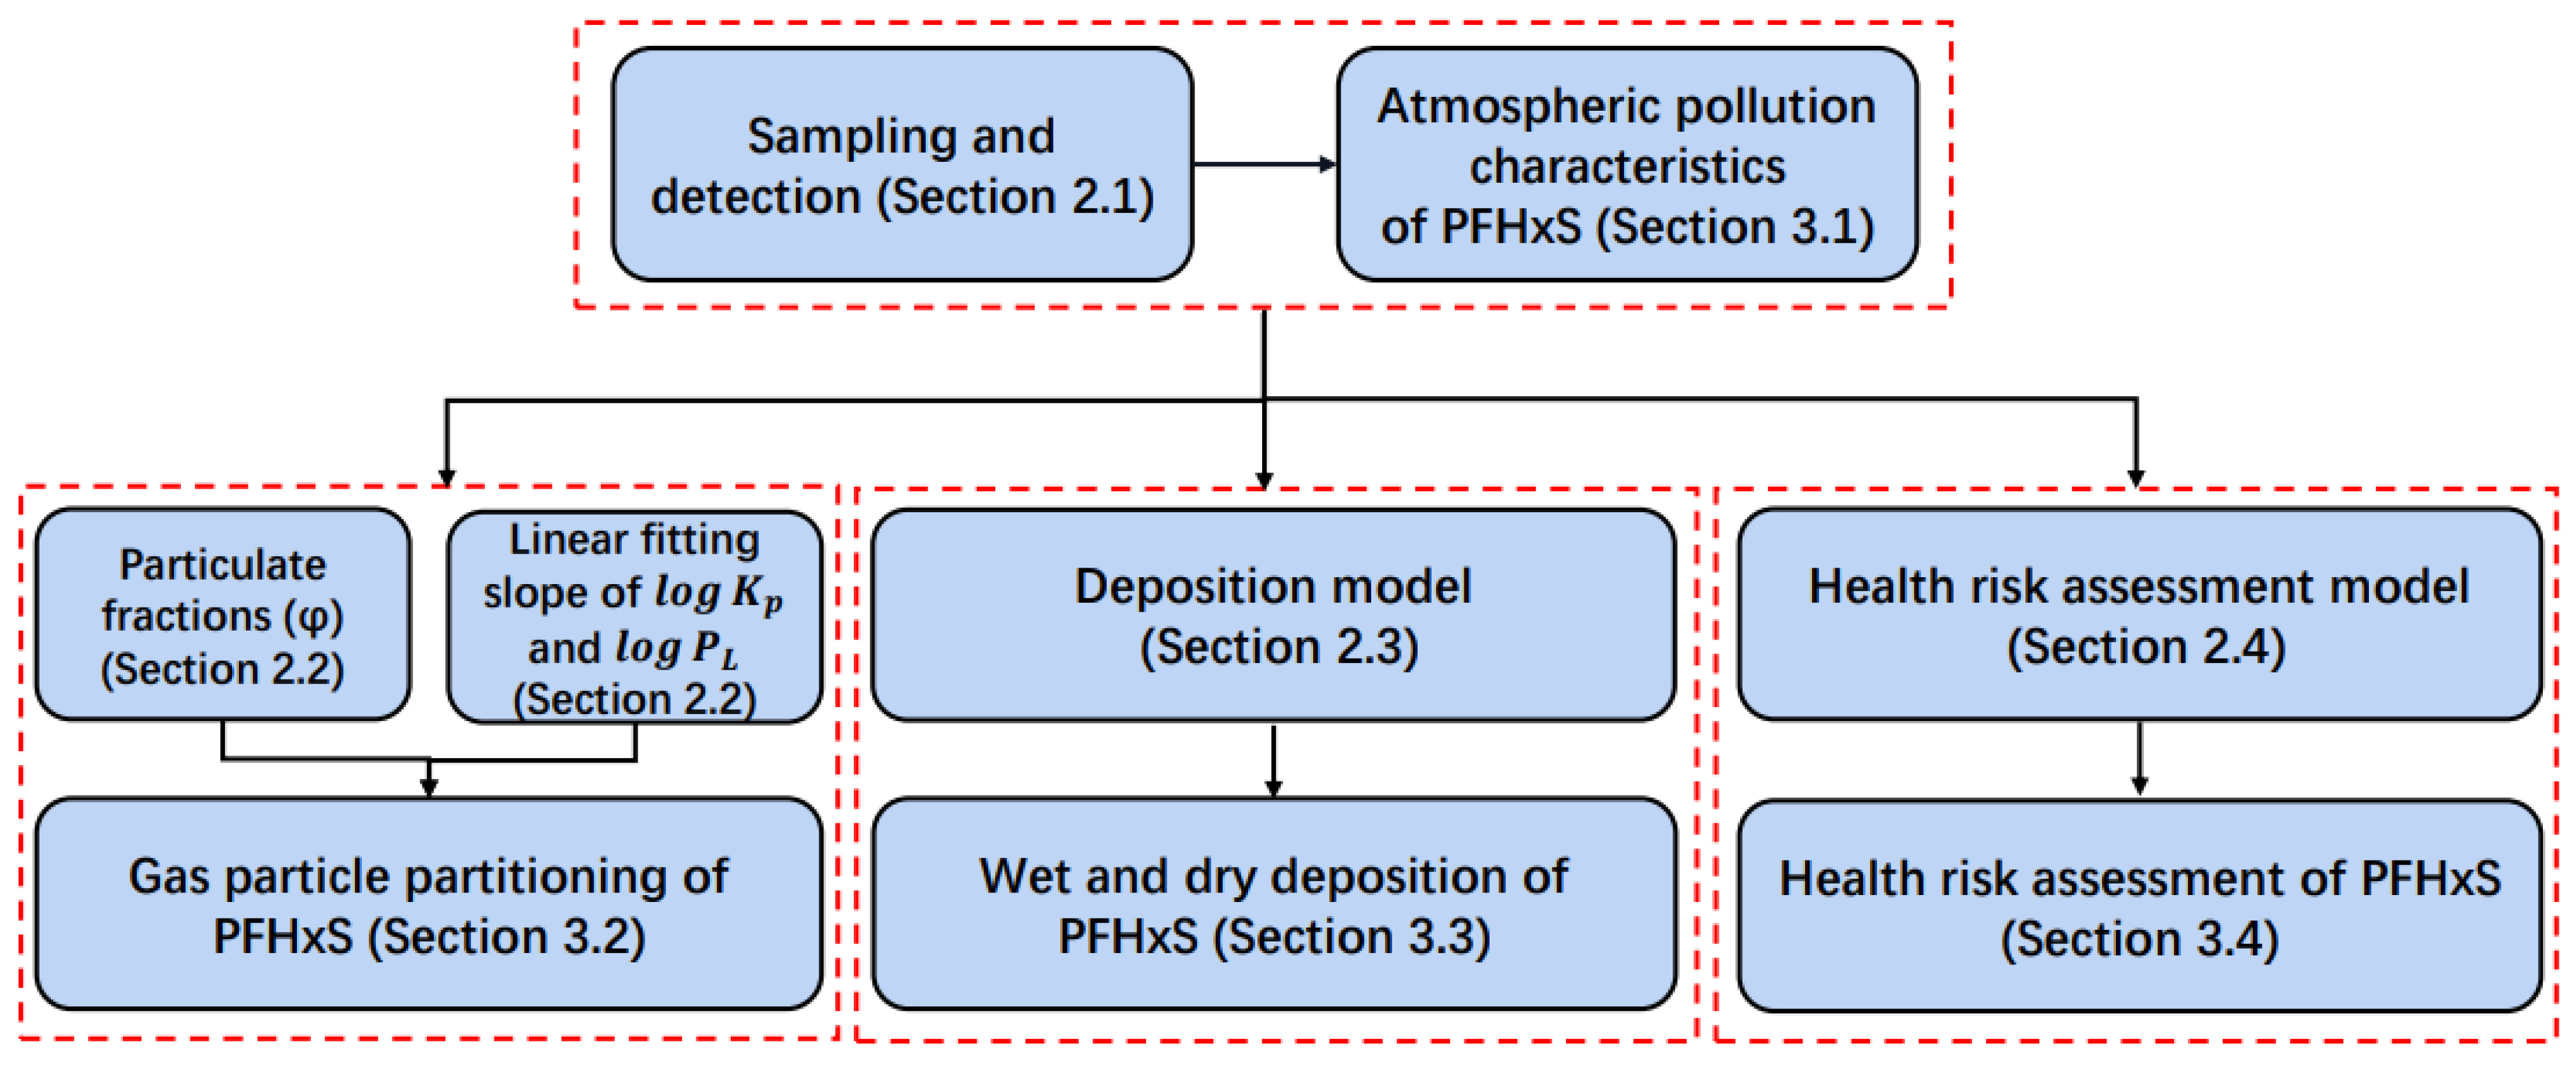
The methodology chart is shown in Figure 1. The experiment is discussed in Section 2.1 and the atmospheric concentrations of PFHxS obtained are analyzed in Section 3.1. The methods used to calculate the particulate fraction (φ) and the linear fitting slope of and of PFHxS are described in Section 2.2, while those used to assess the gas–particle partitioning of PFHxS are described in Section 3.2. The deposition models are introduced in Section 2.3 and applied in Section 3.3 for the discussion of the wet–dry deposition flux of PFHxS in each month. Health risk assessment models are interpreted in Section 2.4 and used in Section 3.4 to assess the health risk of PFHxS. Some abbreviations that were used in this study are shown in Table S1.
2.1. Sampling and Detection
Standards and reagents. The analyte standard (L-PFHxS, 2 μg/mL) and isotopically labeled analog used as an internal standard (IS, MPFHxS, 500 ng/mL) were purchased from Wellington Laboratories (Ontario, CA). Analyte and IS diluted working solutions (500 ng/mL) were configured in MeOH. Methanol (MeOH, LC-MS grade), acetic acid (glacial, Reagent Plus®, ≥99%), and ammonium acetate (UPLC-MS grade) were purchased from Merck KGaA (Shanghai, China). Ammonium hydroxide solution (NH4OH, ≥ 25%, puriss) was obtained from Yongda Reagent (Tianjin, China). Glycerol (HPLC grade) was purchased from ANPEL (Shanghai, China). Hexane (≥95%, UV-HPLC grade) and ultrapure water (HPLC grade) were from CNW (German). Acetone (≥99.5%, purity) and anhydrous sodium carbonate (≥99.8%, purity) were supplied by Beijing Chemical Works (Beijing, China). Oasis WAX SPE cartridges (6 mL, 500 mg) were purchased from Waters (Shanghai, China). The nitrogen used was of ≥99.999% purity. All diluted working solutions were kept at −20 °C away from light prior to use.
Sampling. To collect PFHxS in the gas and particle phases separately, an annular denuder/filter pack collection system previously used by Martin et al. [29] and Wu et al. [23,30] was deployed on top of the first teaching building of North China Electric Power University (40.10° N, 116.31° E, about 20 m above the ground). Two annular denuders (URG-2000-30x242-3CSS) coupled in series were used to collect gas phase samples, and a ringed quartz fiber filter was used to collect particle phase samples.
Before sampling, denuders were pre-rinsed with ultrapure water, acetone, and hexane. They were then blow-dried with high-purity nitrogen. The internal walls of denuders were coated with 1% Na2CO3–water solution and 1% glycerol–methanol solution (v/v 1:1). The dried denuders under high purity nitrogen flow were then sealed and stored. Quartz fiber filters were baked at 450 °C for 4 h, wrapped in aluminum foil, and stored at 4 °C for later use.
Between June and November 2021, seven sets of samples were collected sequentially, one by one, with approximately one set collected on the 10th of each month. Each sampling time was 48 h at a rate of 16.7 L/min (mass flow), and the volume of each sample was about 48 m3. The samples eluted from the annular denuders and the filters were stored at 4 °C until detection. In addition, during each sampling period, coated annular denuders and blank filters were set at the sampling points for blank analysis. Precipitation sampling was carried out every time it rained, and 500 mL of each sample was collected using a bucket made of PP material. Twenty rainfall samples were collected in total.
Sample preparation and analysis. The gas samples collected in denuders were eluted by rotating and oscillating. The eluents were 10 mL of water, 10 mL of MeOH, and 5 mL of methanol/water (v/v 1:1), successively. Before extraction, 5 ng of IS was added to the eluent, and then vacuum filtration was conducted using a 0.22 μm acetate membrane. Then, the Oasis WAX cartridges were used for solid phase extraction with a flow rate of 1–2 drops/s. Before loading the samples, the cartridges were activated sequentially with 4 mL of 0.1% NH4OH in MeOH, 4 mL of MeOH, and 4 mL of deionized water. After extraction, the cartridges were treated with 4 mL of 0.1% acetic acid. Then, the PFHxS was collected with 6 mL of 0.5% NH4OH in MeOH. The eluent was concentrated to 100 μL in a water bath at 40 °C under mild nitrogen flow. Then, 2 mM ammonium acetate/MeOH solution (v/v 9:1) was used to redissolve the eluent to 250 μL. For the particle phase samples, the filter was cut before elution, and then the sample was sequentially eluted with 10 mL of water, 10 mL of MeOH, and 5 mL of methanol/water (v/v 1:1). An ultrasound was required for each elution for 30 min, and the eluents were combined after three times of ultrasound. After that, the pretreatment process was the same as that of the gas phase samples. The precipitation samples were directly added with IS and then filtered. After that, the pretreatment process was the same as that of the gas samples.
All samples were analyzed using a UPLC-MS/MS system consisting of Waters Acquity UPLC® I class system (Waters, Milford, MA, USA) and a triple quadrupole mass spectrometry Xevo TQ-S (Waters, USA). An ACQUITY UPLC BEH Shield RP18 column (2.1 × 100 mm, 1.7 μm, Waters, USA), along with a 2.1 mm Security-Guard pre-column (BEH Shield RP18, 2.1 × 5 mm, 1.8 μm, Waters, USA), was used to achieve chromatographic separations at a column temperature of 40 °C. The mobile phase used in UPLC was 2 mM ammonium acetate in H2O (A) and MeOH (B) with a total flow rate of 0.3 mL/min. The elution gradients were as follows: 0~10 min 10~98% B; 10~13 min 98% B; 13~14 min 98~10% B; and 14~16 min 10% B. The Xevo T-QS was equipped with an electrospray ionization source (ESI) to detect compounds in a negative mode. The ionization parameters were as follows: a capillary voltage of 3 kV, a source temperature of 150 °C, a desolvation temperature of 400 °C, a cone voltage (CV) of 30 V, collision energy (CE) of 40 eV, as well as a retention time (RT) of 7.27 min. The MS/MS transition used to quantify PFHxS and the corresponding IS were m/z 399.0/80.0 and 402.9/102.9, respectively.
Quality assurance (QA)/quality control (QC). Six groups of standard solutions with different PFHxS concentrations were set and tested. The results show that the correlation coefficient of the standard curve was 0.998 in the linear range of 0.2–50 μg/L. The method detection limits (MDLs) of PFHxS were calculated using the average concentrations of PFHxS in all blank samples plus 5 times the standard deviation of detection concentrations. In this study, the MDLs of PFHxS in the gas phase, particle phase, and precipitation samples were 0.20 pg/m3, 1.50 pg/m3, and 14.1 pg/L, respectively. The spiked recovery experiments were carried out six times. The results show that the average recoveries of PFHxS in the gas phase, particle phase, and precipitations were 106 ± 4%, 92 ± 11%, and 96 ± 8%, respectively. In addition, the standard analyte with different concentrations (0.1 ng/mL and 2 ng/mL) was repeatedly determined 6 times to reflect the precision of the instrument. The performance of the instrument was acceptable as long as the relative standard deviation (RSD) was less than 3.6%.
2.2. Gas–Particle Partitioning Model
Two methods were used to analyze the partitioning characteristics of PFHxS in the atmosphere in the gas and particle phases (PM2.5). First, the particulate fraction φ of PFHxS was calculated using the following formula:
where is the concentration in the particle phase (pg/m3) and is the concentration in the gas phase (pg/m3).
Then, the linear fitting slope of and of PFHxS was calculated to discuss the gas–particle partitioning characteristics of PFHxS in the study area [31]. The related expression is as follows:
where is the vapor pressure (Pa), is the slope of the adsorption model, and is the intercept. (m3/μg) is the gas–particle partition coefficient and was calculated using the following formula:
2.3. Deposition Model
The Atkinson deposition model [32] was applied to estimate the monthly dry and wet deposition fluxes of PFHxS. The wet deposition model is:
where is the monthly wet deposition flux μg/m2 of PFHxS. and are the monthly average concentrations of the gas and particle phases of PFHxS, pg/m3, respectively. and are the washout ratios of gas and particle phase PFHxS, respectively. is the monthly rainfall (mm). depends on meteorological conditions, particle characteristics, and chemical properties, and is generally between 105 and 106. The median value of 5 × 10⁵ was used for calculation. depends on the dissolution of substances in raindrops and the adsorption on the surface of raindrops. Atkinson (2000) thought that trace organic matter maintains the gas-liquid distribution balance between each falling raindrop and the gas phase in the process of a 10 m precipitation, so it can be considered that trace organic matter is in a phase equilibrium state in the process of wet deposition [32]. Thus, the gas–liquid equilibrium distribution coefficient can be used to estimate :
where is the gas constant 8.314 J/(mol K); is Henry’s constant; and and are the reference temperature and the atmospheric temperature (K), respectively. Bowden et al. pointed out that Henry’s coefficient changed with the temperature at 278.15–308.15 K [33,34]. For the convenience of estimation, this study selected the value at 298.15 K to estimate .
The dry deposition model is:
where is the dry deposition flux μg/m2, and and are the dry deposition rates (cm/s) of the gas phase and particle phase of PFASs, respectively. Considering different aerosol particle sizes, wind speeds, and other related factors, the dry deposition rate of persistent organic pollutants (POPs) is about 0.01–0.8 cm/s [35,36]. Moreover, 0.5 cm/s was selected as the dry settling rate of PFHxS in this study.
2.4. Health Risk Assessment Model
PFHxS in the atmosphere can enter the human body through respiration and skin contact. The hazard quotient (HQ) was used to assess the health risk of residents’ PFASs [37], i.e., the ratio of the average daily dose (ADD, ng/ (kg d)) to the reference dose (RfD, ng/(kg d)). The daily intake of human includes the amount entering the human body through respiration (), skin contact (), and ingestion route (). At present, there has been no RfD of PFHxS. This study estimated the HQ of PFHxS by referring to the practice of Ao et al. [25] and using the RfD value of PFOS (80 ng/(kg d)) given by Liu et al. [38]. The calculation method is as follows:
where C is the concentration of PFASs in the atmosphere (gas phase + particle phase) (ng/m3). IR is the inhibition rate (m3/d), ED is the exposure duration (yr), EF is the exposure frequency (d/yr), BW is the body weight (kg), AT is the average time (d), SA is the exposed skin area (cm2). ABF is the dermal adsorption fraction, AF is the skin adhesion factor (mg/(m2 d)), CF is the conversion factor (kg/mg), and SRI is the ingestion rate (mg/d). At present, the research object of the skin contact and ingestion route is particulate matter, so only the risk of particle phase PFHxS was evaluated in this study. The values of relevant parameters are provided in Table S2 in Supplementary Materials.
3. Results and Discussion
3.1. Atmospheric Pollution Characteristics of PFHxS
The atmospheric concentrations of PFHxS in Beijing from June to November 2021 are shown in Table 1. Among the 42 gas and 42 particle samples, the PFHxS concentrations of 20 gas and 14 particle samples were higher than the detection limit. Therefore, the PFHxS detection rates of gas and particle samples were 47.6 and 33.3%, respectively. In the summer (from June to August), the detection rate in the gas phase was 61.9%, which was higher than that in autumn (from September to November) by 33.3%. However, there was no obvious difference in the particle phase detection rate between summer and autumn. The gas phase PFHxS concentrations and particle phase PFHxS concentrations both ranged from 0.625 to 1.875 pg/m3, which were close to the existing studies (Table S3). During the study period, the mean PFHxS level was 1.51 pg/m3, while the mean concentrations were 1.61 pg/m3 and 1.41 pg/m3 in the summer and autumn, respectively. The highest concentrations in the gas phase were 1.07 pg/m3 in June, followed by 0.94 pg/m3 in November, and those in other months had no significant differences. The average concentration of the gas phase was 0.84 pg/m3 in the summer, which was slightly higher than 0.73 pg/m3 in the autumn. The highest mean concentration of the particle phase was 1.04 pg/m3 in August, followed by 0.78 pg/m3 in September. The levels in other observed months were almost the same.
3.2. Gas–Particle Partitioning of PFHxS
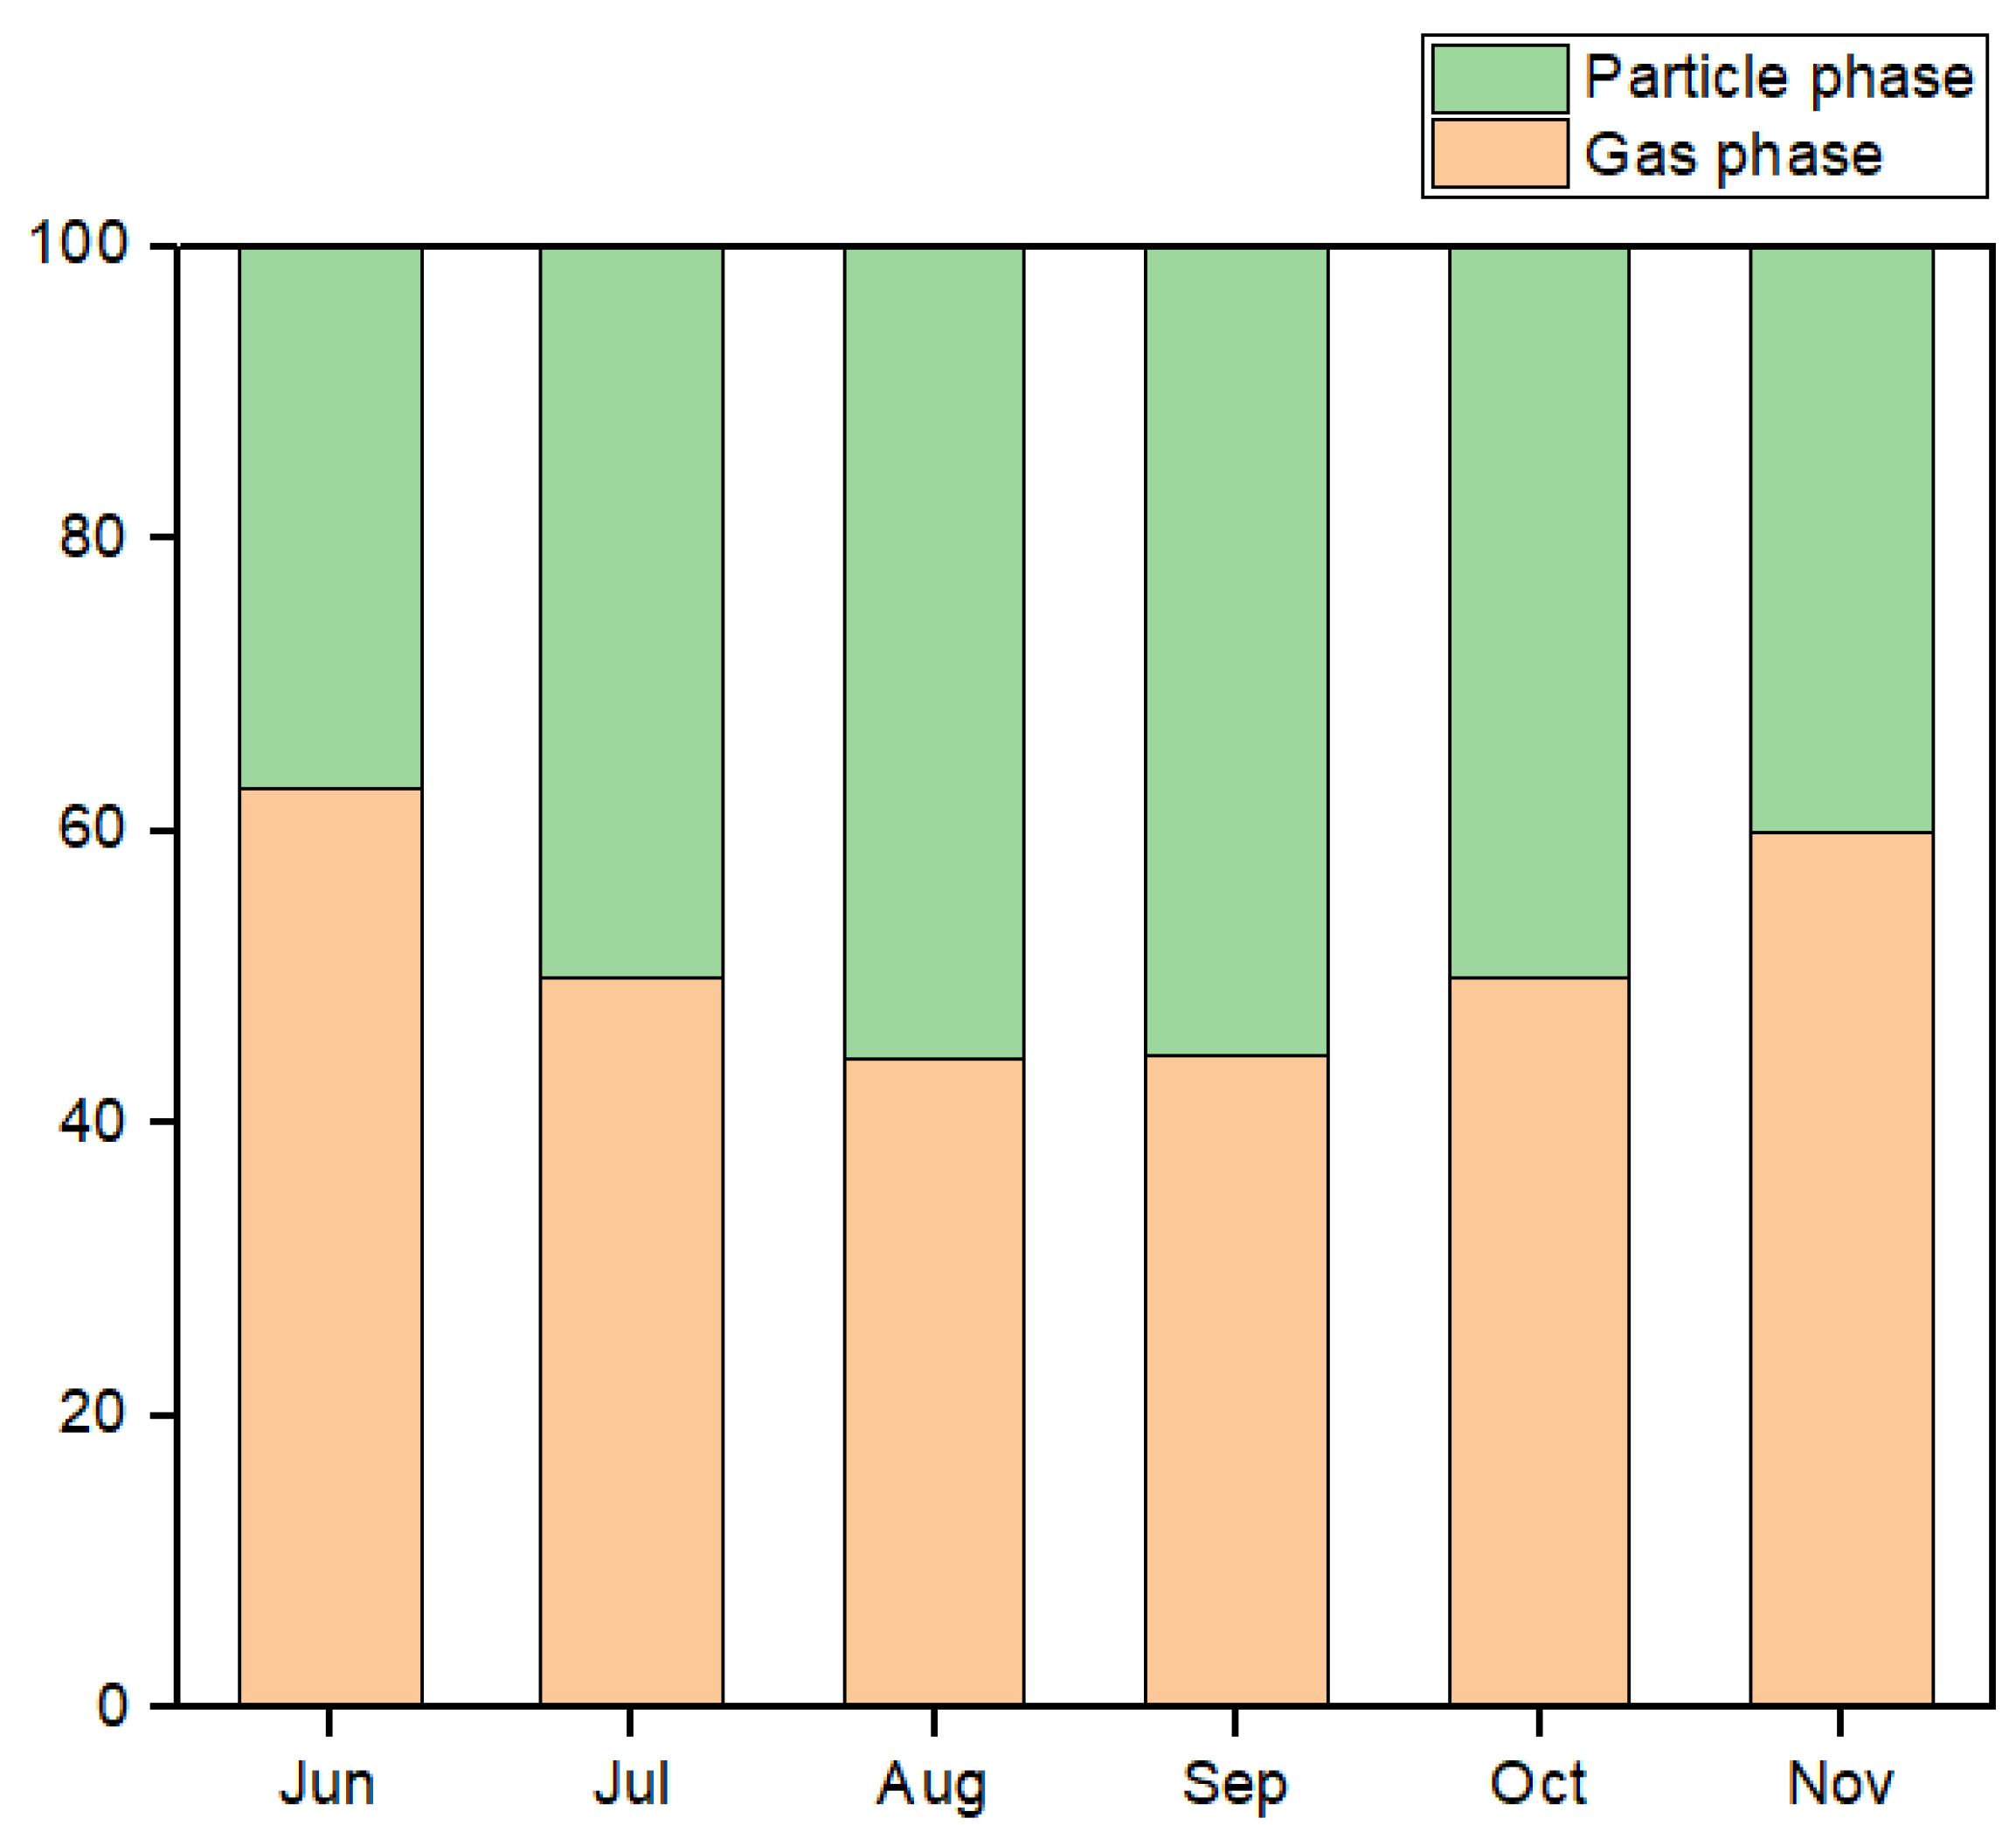
During the monitoring period, the particulate fraction (φ) of PFHxS was 0.48 ± 0.08, which was comparable to that of Beijing (0.65 ± 0.13) in 2013 [23] and Xiamen (0.41 ± 0.14) in 2019 [22]. Figure 2 shows the gas and particulate fractions of PFHxS from June to November 2021. During this period, the φ initially increased and then decreased. The lowest value of φ in June was 36.9%, and then it gradually increased until it peaked at 55.6% in August. After that, it began to decrease and finally reached the lowest value of 40.0% in November. In terms of seasons, the temperature during summer, from June to August, rose gradually. In autumn, the temperature declined. There was a significant positive correlation between the φ and temperatures. The higher the temperature was, the easier it was for PFHxS to partition in the particle phase. With the decrease in temperature, it was easier to distribute in the gas phase.
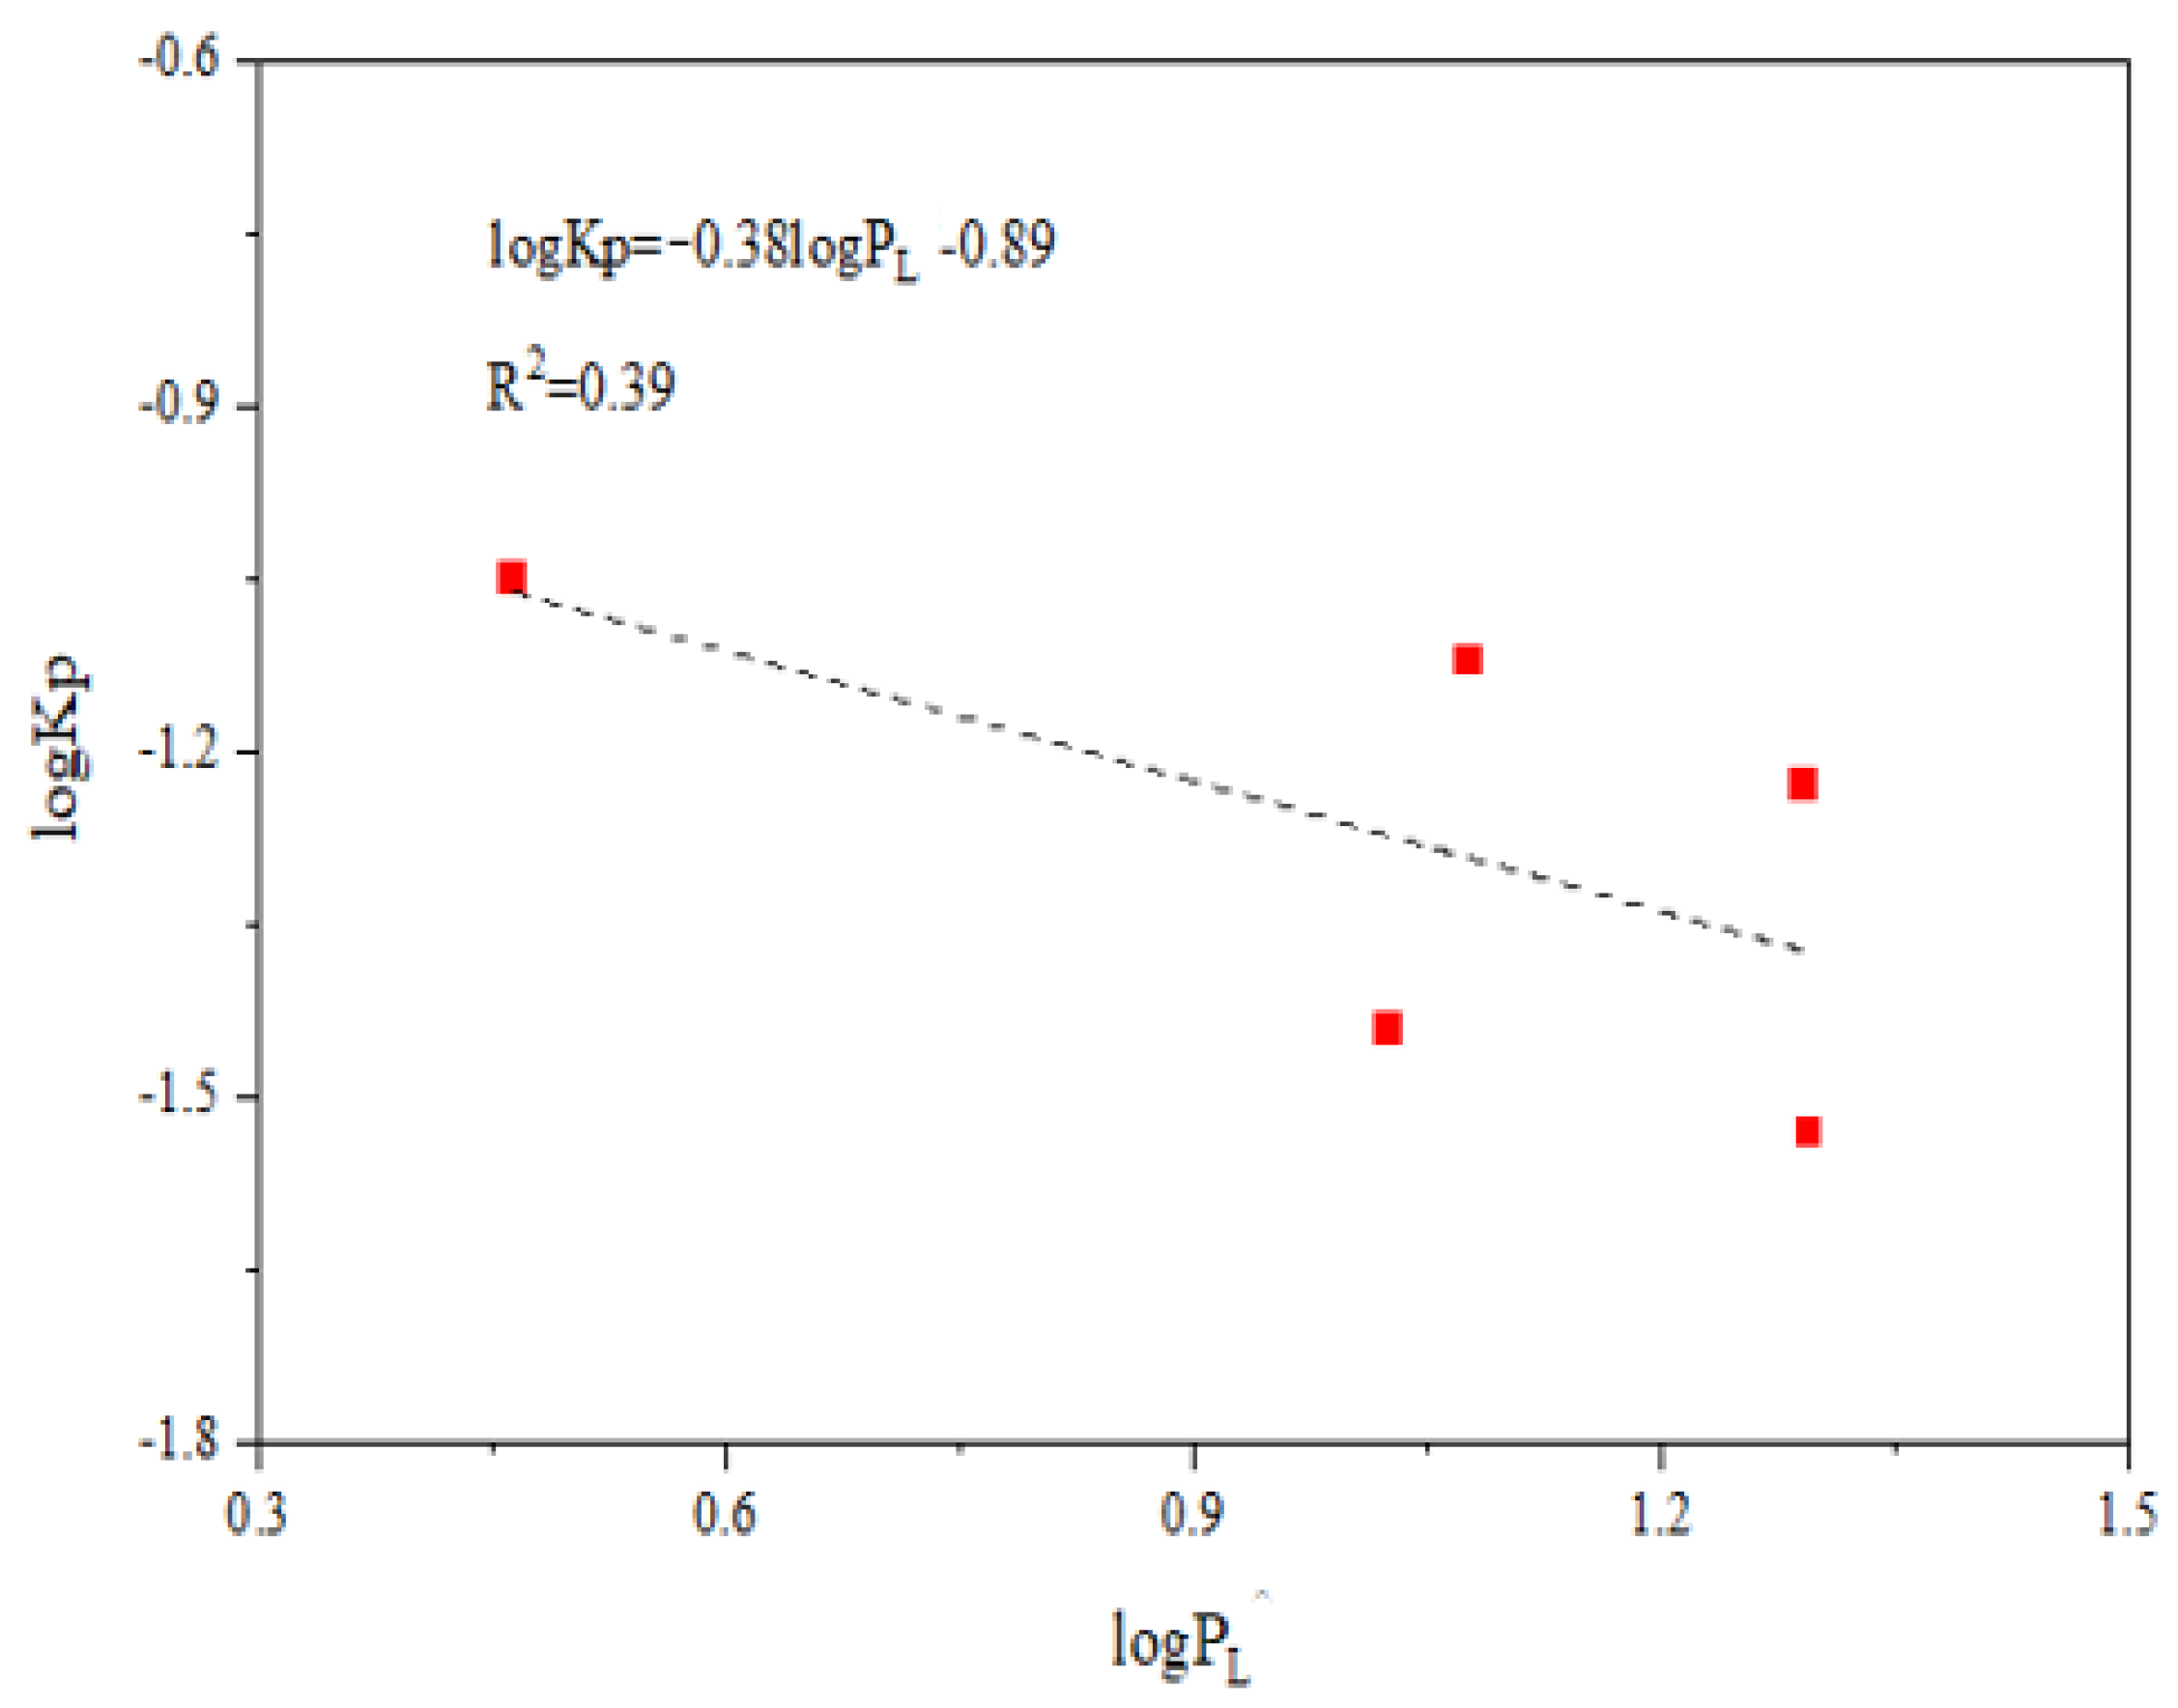
Formula (3) in Section 2.2 was used to calculate the gas–particle partition coefficient of PFHxS, and the result was −1.53 to −1.05 m3/μg. Then, referring to the study of Ahrens et al. [39], the following formula was used to calculate the value of PFHxS based on the sampling temperature.
where T is the temperature in Kelvin.
The and values were linearly fitted, and the results are shown in Figure 3. The linear regression slope value m was −0.381. It should be noted that our sample size was limited and the linear relationship between and was not strong enough (R² = 0.39). Therefore, the calculated slope m may be not representative enough, and the related discussion about gas–particle partitioning characteristics of PFHxS was preliminary with certain uncertainties. When |m| is close or equal to 1, the partitioning of POPs between the gas phase and the particle phase is in equilibrium [31,40]. In this study, |m| deviated from 1, so PFHxS could not reach the equilibrium state. Moreover, slopes shallower than −0.6 point to the absorption between POPs and the particulate matter [41]. The m in this study was bigger than −0.6, which indicated that the absorption probably dominated the partitioning process.
3.3. Wet–Dry Deposition of PFHxS
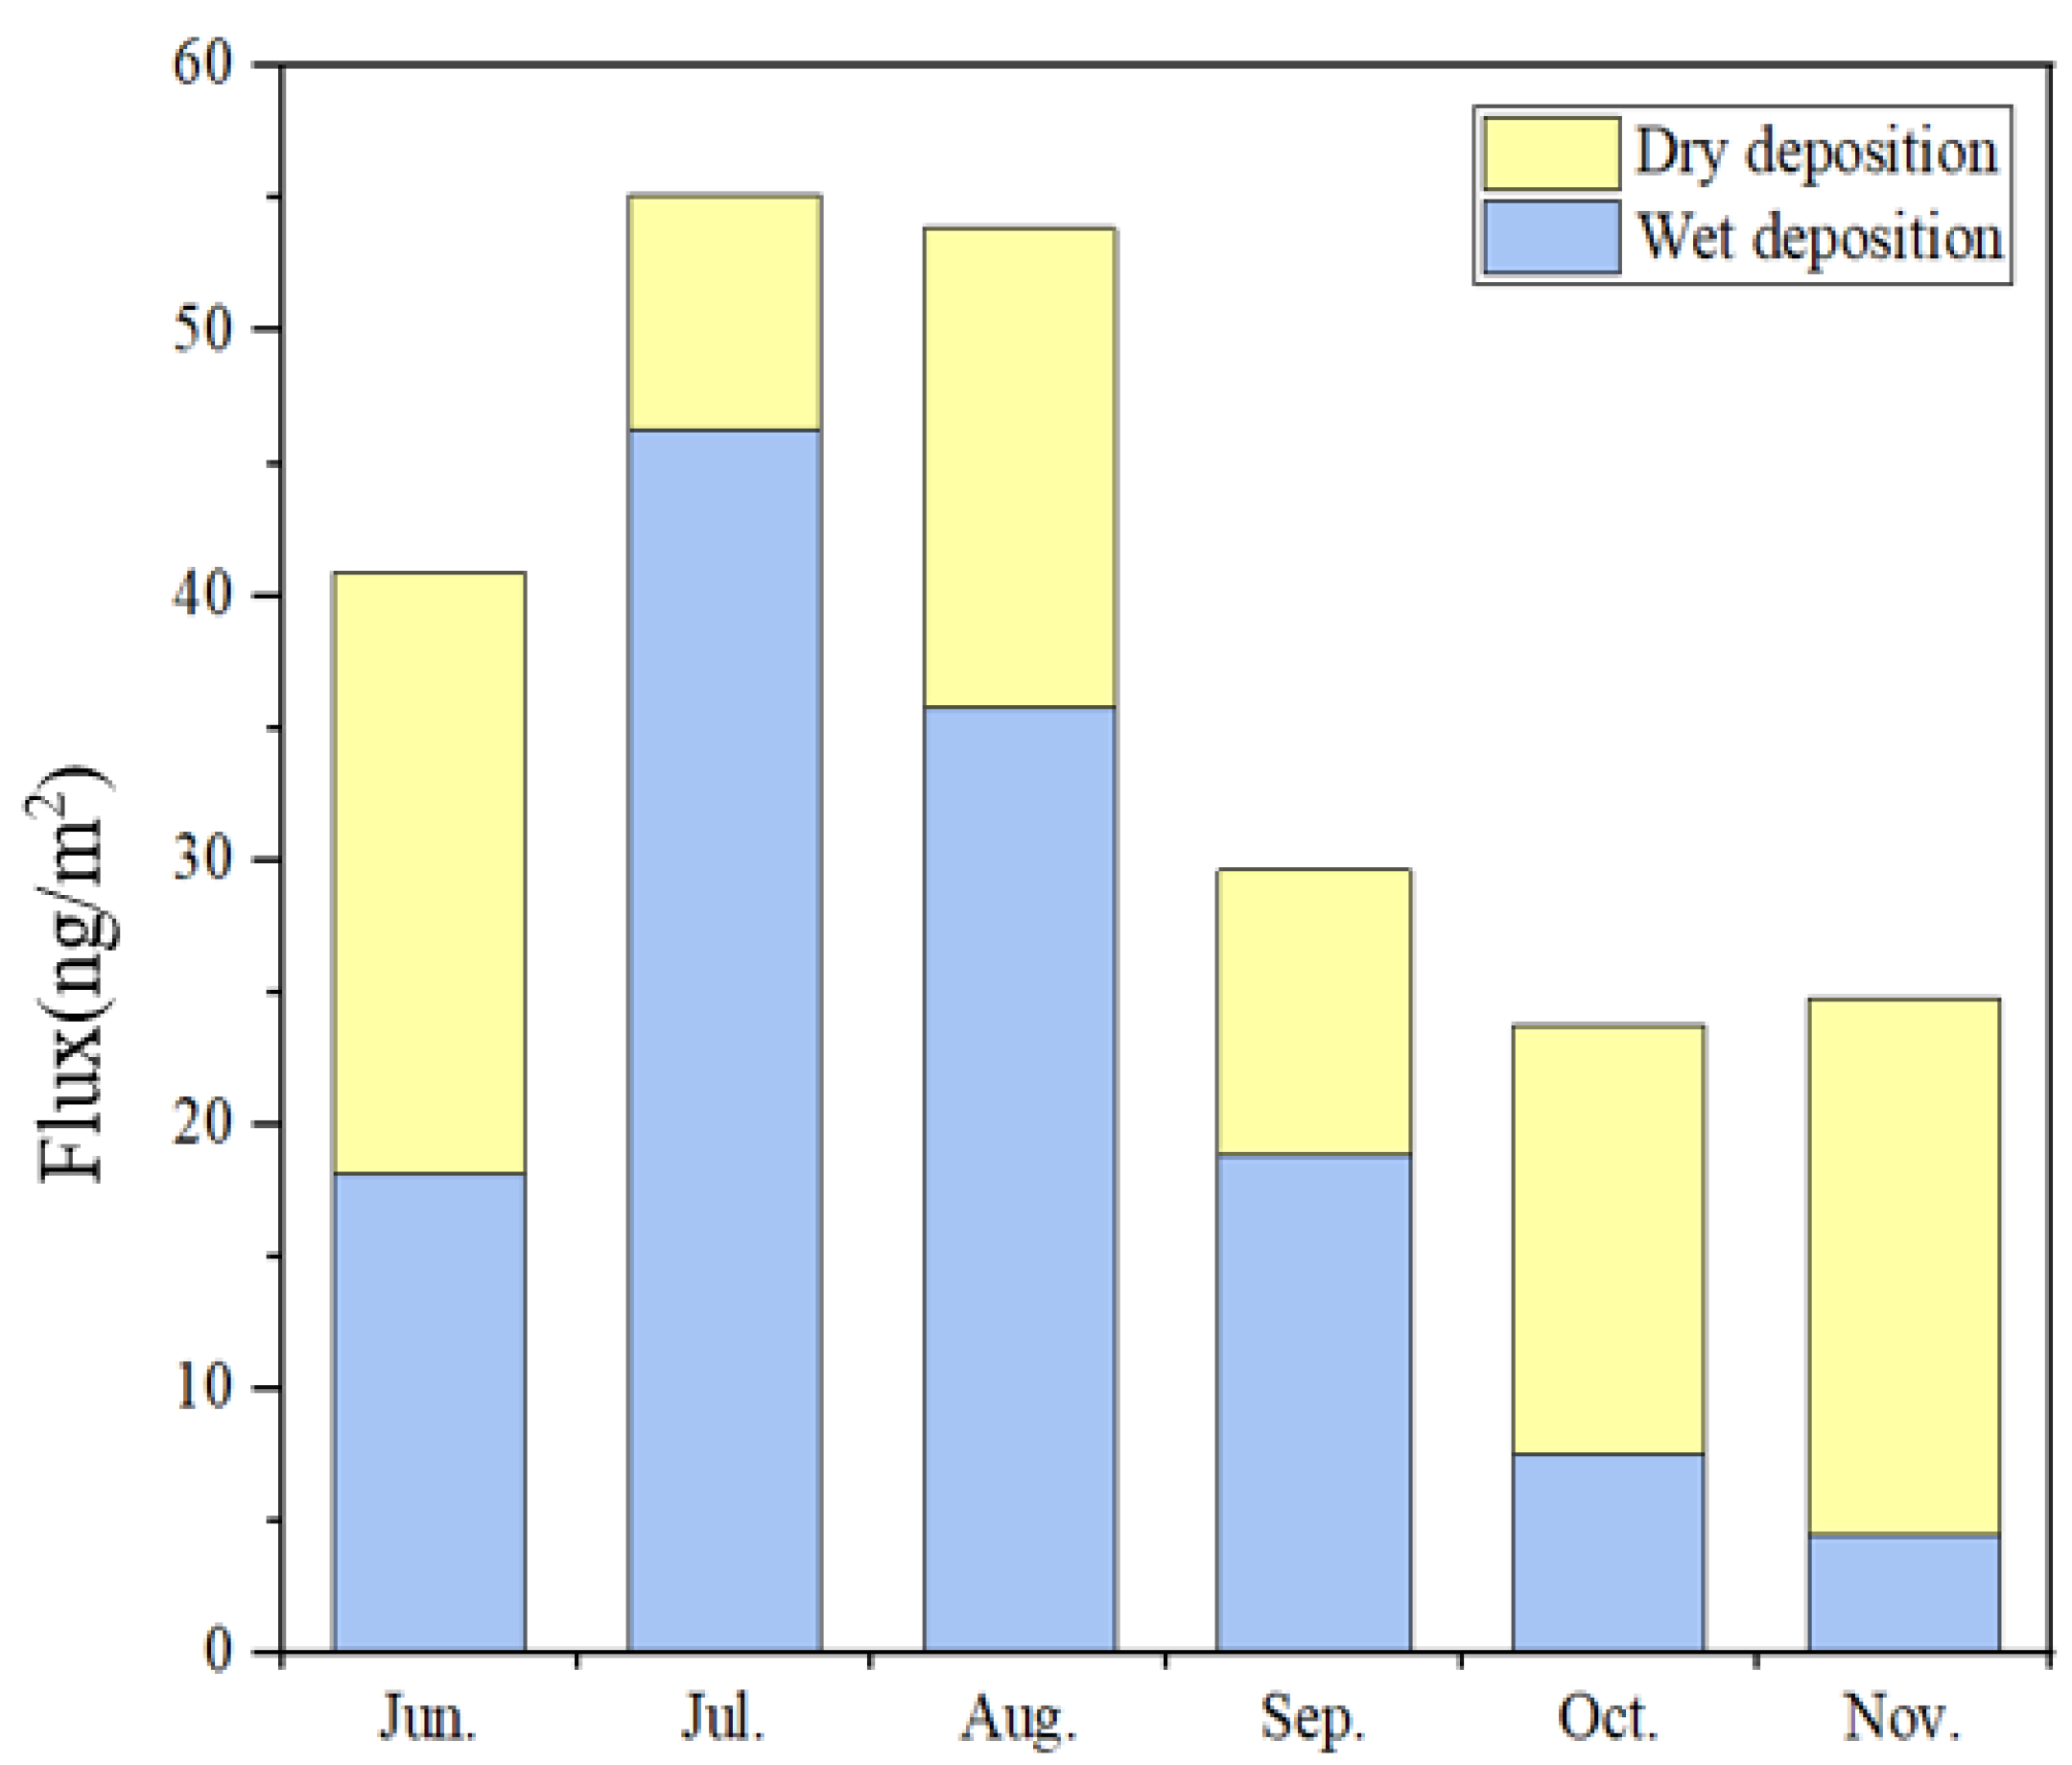
The monthly rainfall (https://rp5.ru/, accessed on 21 January 2023) and wet–dry deposition flux of PFHxS are shown in Figure 4 and Table S3. The results show that the total wet–dry deposition flux of PFHxS was the largest in July, which was 55.2 ng/m2. In October, the deposition flux was the smallest at 23.7 ng/m2.
The monthly mean wet deposition flux of PFHxS was 21.8 ± 16.2 ng/m2, which is equivalent to that of Fuxin (8.40 ng/(m2 d) and Weifang (12 ng/(m2 d), but lower than that of Xingtai (34 ng/(m2 d) [42]. The wet deposition in July contributed the most, accounting for 35% of the half-year deposition flux, followed by August and September. The monthly rainfall totals in July, August, and September were higher than 200 mm, significantly larger than that in other months (Table S4), and the average monthly PFHxS concentration was relatively high. Therefore, more rainfall washed PFHxS in the atmosphere, resulting in higher monthly deposition flux than in other months. In November, the monthly average concentration of PFHxS was high, but the wet deposition flux was the lowest, which was mainly due to the sharp decrease in rainfall in November. The rainfall in other months and the atmospheric concentrations of PFHxS were relatively low, so the wet deposition flux was low. To sum up, the rainfall and atmospheric concentrations of PFHxS were the main factors that affect the monthly wet deposition flux of PFHxS.
The average monthly dry deposition flux of PFHxS was 16.2 ± 5.38 ng/m2. The maximum dry deposition flux of PFHxS in June was 22.7 ng/m2, accounting for 23% of the half-year dry deposition flux, followed by November and August, accounting for 21% and 19%, respectively. Since we assumed that the dry deposition rate of the gas phase and the particle phase of PFHxS in different months was the same (0.5 cm/s), the dry deposition flux mainly depended on the total atmospheric concentrations in each month. The monthly dry deposition flux was larger when the total atmospheric concentrations were higher, and vice versa.
In this study, the precipitation samples from June to November were collected, in which the average concentration of PFHxS was 0.19 ± 0.18 ng/L. The PFHxS level of precipitation was estimated to be 0.15 ± 0.07 ng/L by the deposition model, which was slightly lower than the precipitation samples. The possible reason is that only the PFHxS partitioning on PM2.5 was collected and detected in this study. Particulate matters with a diameter larger than 2.5 μm were not considered.
3.4. Health Risk Assessment of PFHxS
The daily intake ADD and HQ values of people of different ages were estimated to assess the health risk of PFHxS. The results show that the (3.47 × 10⁻⁴ to 8.55 × 10⁻⁴ ng/ (kg d)) of children was about twice that of adults (1.67 × 10⁻⁴ to 4.13 × 10⁻⁴ ng/ (kg d)), mainly due to the lower body weight (BW). The (9.13 × 10⁻² to 0.30 ng/ (kg d)) and (2.56 × 10⁻⁴ to 8.52 × 10⁻⁴ ng/ (kg d)) values of children were about six and four times that of adults (1.42 × 10⁻² to 4.73 × 10⁻² ng/ (kg d) and 0.57 × 10⁻⁴ to 1.89 × 10⁻⁴ ng/ (kg d)). The main reasons were that the weight (BW) of children was low and the skin adhesion factor (AF) of PFHxS particles was high. Among the above exposure routes, the ingestion route was the most important source. The proportions of children and adults were 99.4 and 98.6%, respectively. Respiration and skin contact were both less than 1% in children. For adults, breathing accounted for 1.05% and skin contact only accounted for 0.39%.
The HQ values of children and adults ranged between 0.75 × 10⁻⁵ and 2.13 × 10⁻⁵ and between 2.90 × 10⁻⁶ and 7.52 × 10⁻⁶, respectively. The HQ values were all far below 1, indicating that PFHxS in Beijing’s atmosphere has no obvious health impact on the human body during the study period. However, the HQ value of children was one order of magnitude higher than that of adults. Therefore, with the extensive use of PFHxS, the atmospheric concentrations of PFHxS and its possible harmful effects on children should be continuously investigated. In 2017, the POPs Convention put forward the adverse effects of PFHxS on organisms [43], but there has been no reference dose (RfD) of PFHxS at present. In this study, only particles with a diameter size of 2.5 μm or less were collected. However, there are still coarse particles in the atmosphere, such as PM10. Furthermore, in addition to respiration, ingestion, and skin contact, PFHxS can enter the human body through drinking water or consuming food. Therefore, future health risk assessment research needs to comprehensively consider the above factors and the health risk assessment results of PFHxS will be more accurate.
4. Conclusions
In this study, the atmospheric concentrations of the gas and particle phases of PFHxS in Beijing from June to November 2021 were continuously monitored. Then, the gas–particle partitioning, the wet and dry deposition, and the health risk assessment of PFHxS were discussed. Studies on the gas–particle partitioning process showed that the particulate fraction φ of PFHxS was about 48% during the research period and that PFHxS was easier to partition in the particles when the temperature was higher. Research on dry and wet deposition found that the total and the wet deposition fluxes were the largest (55.2 ng/m2 and 46.3 ng/m2, respectively) in July because of the abundant precipitation. However, due to the high atmospheric concentrations, the dry deposition flux of PFHxS was the highest (22.7 ng/m2) in June. Finally, the health risk assessment of PFHxS during the study period indicated that the atmospheric concentrations of PFHxS would not cause adverse effects on human health, and the ingestion route was the most significant means of PFHxS intake. However, with the extensive use of PFHxS as a substitute for PFOS, the atmospheric concentrations of PFHxS and its possible harmful effects on children should be continuously investigated.
In this research, only particles with diameter sizes of 2.5 μm or less were collected, and sampling was not conducted in the winter and spring. Annual monitoring can be carried out, and particles of other sizes should be collected to further study the air pollution characteristics of PFHxS in the future. Furthermore, humans can intake PFHxS through drinking water or food. Future health risk assessment research studies need to comprehensively consider the above factors to ensure that the assessment results will be more scientific and accurate.
Supplementary Materials
The following supporting information can be downloaded at https://www.mdpi.com/article/10.3390/atmos14020365/s1. Table S1: Some abbreviations in this paper. Table S2: Health risk assessment parameters. Table S3: Atmospheric PFHxS concentrations reported by publications. Table S4: Wet–dry deposition flux of PFHxS [18,19,20,21,22,37,38,44,45,46,47,48,49,50,51,52,53,54,55,56].
Author Contributions
F.W.: Conceptualization, methodology, investigation, writing original draft, Validation; J.W.: conceptualization, methodology, supervision, writing—reviewing and editing, project administration, validation; Y.Z. (Yiru Zhuang): conceptualization, methodology, investigation, writing original draft; B.D.: conceptualization, methodology, investigation. Y.Z. (Yueling Zhang): conceptualization, methodology, investigation; L.P.: supervision, writing—reviewing and editing, project administration. All authors have read and agreed to the published version of the manuscript.
Funding
This work was supported by the Second Tibetan Plateau Scientific Expedition and Research Program (STEP) (no. 2019QZKK0103).
Institutional Review Board Statement
Not applicable.
Informed Consent Statement
Not applicable.
Data Availability Statement
Not applicable.
Acknowledgments
This work was supported by the Second Tibetan Plateau Scientific Expedition and Research Program (STEP) (no. 2019QZKK0103). The authors thank all individuals involved in this work.
Conflicts of Interest
The authors declare no conflict of interest.
References
- Herzke, D.; Olsson, E.; Posner, S. Perfluoroalkyl and polyfluoroalkyl substances (PFASs) in consumer products in Norway—A pilot study. Chemosphere 2012, 88, 980–987. [Google Scholar] [CrossRef] [PubMed]
- Taniyasu, S.; Yamashita, N.; Yamazaki, E.; Petrick, G.; Kannan, K. The environmental photolysis of perfluorooctanesulfonate, perfluorooctanoate, and related fluorochemicals. Chemosphere 2013, 90, 1686–1692. [Google Scholar] [CrossRef] [PubMed]
- Martin, J.W.; Mabury, S.A.; Solomon, K.R.; Muir, D.C.G. Bioconcentration and tissue distribution of perfluorinated acids in rainbow trout (Oncorhynchus mykiss). Environ. Toxicol. Chem. 2003, 22, 196–204. [Google Scholar] [CrossRef] [PubMed]
- Goeritz, I.; Falk, S.; Stahl, T.; Schafers, C.; Schlechtriem, C. Biomagnification and tissue distribution of perfluoroalkyl substances (PFASs) in market-size rainbow trout (Oncorhynchus mykiss). Environ. Toxicol. Chem. 2013, 32, 2078–2088. [Google Scholar] [CrossRef] [PubMed]
- Alava, J.J.; McDougall, M.R.R.; Borbor-Córdova, M.J.; Paola Calle, K.; Riofrio, M.; Calle, N.; Ikonomou, M.G.; Gobas, F.A.P.C. Chapter 3. Perfluorinated chemicals in sediments, lichens and seabirds from the Antarctic Peninsula—Environmental assessment and management perspectives. In Emerging Pollutants in the Environment—Current and Further Implications, 2nd ed.; Larramendy, M.L., Solonesk, S., Eds.; IntechOpen: London, UK, 2015. [Google Scholar]
- Rankin, K.; Mabury, S.A.; Jenkins, T.M.; Washington, J.W. A North American and global survey of perfluoroalkyl substances in surface soils: Distribution patterns and mode of occurrence. Chemosphere 2016, 161, 33–41. [Google Scholar] [CrossRef] [PubMed]
- Routti, H.; Gabrielsen, G.W.; Herzke, D.; Kovacs, K.M.; Lydersen, C. Spatial and temporal trends in perfluoroalkyl substances (PFASs) in ringed seals (Pusa hispida) from Svalbard. Environ. Pollut. 2016, 214, 230–238. [Google Scholar] [CrossRef]
- Todorov, V.; Dimov, I. Innovative digital stochastic methods for multidimensional sensitivity analysis in air pollution modelling. Mathematics 2022, 10, 2146. [Google Scholar] [CrossRef]
- Zhang, L.; Ding, S.; Qian, W.; Zhao, A.; Zhao, S.; Yang, Y.; Weng, G.; Tao, M.; Chen, H.; Zhao, S.; et al. The Impact of Long-Range Transport of Biomass Burning Emissions in Southeast Asia on Southern China. Atmosphere 2022, 13, 1029. [Google Scholar] [CrossRef]
- Giesy, J.P.; Naile, J.E.; Khim, J.S.; Jones, P.D.; Newsted, J.L. Aquatic toxicology of perfluorinated chemicals. Rev. Environ. Contam. Toxicol. 2010, 202, 1–52. [Google Scholar]
- Fisher, M.; Arbuckle, T.E.; Wade, M.; Haines, D.A. Do perfluoroalkyl substances affect metabolic function and plasma lipids?-Analysis of the 2007-2009, Canadian Health Measures Survey (CHMS) Cycle 1. Environ. Res. 2013, 121, 95–103. [Google Scholar] [CrossRef]
- Wu, J.; Wang, F.; Wang, Z.W.; Hu, H.M.; Yang, L.N.; Fu, H.Z. Global performance and trends of research on per- and polyfluoroalkyl substances (PFASs) between 2001 and 2018 using bibliometric analysis. Chemosphere 2022, 295, 133853. [Google Scholar] [CrossRef] [PubMed]
- Zhou, J.; Li, Z.; Guo, X.T.; Li, Y.; Wu, Z.H.; Zhu, L.Y. Evidences for replacing legacy per- and polyfluoroalkyl substances with emerging ones in Fen and Wei River basins in central and western China. J. Hazard. Mater. 2019, 377, 78–87. [Google Scholar] [CrossRef] [PubMed]
- Gilljam, J.L.; Leonel, J.; Cousins, I.T.; Benskin, J.P. Is ongoing sulfluramid use in South America a significant source of perfluorooctanesulfonate (PFOS)? Production inventories, environmental fate, and local occurrence. Environ. Sci. Technol. 2016, 50, 653–659. [Google Scholar] [CrossRef]
- Scheringer, M.; Trier, X.; Cousins, I.T.; de Voogt, P.; Fletcher, T.; Wang, Z.Y.; Webster, T.F. Helsingor statement on poly- and perfluorinated alkyl substances (PFASs). Chemosphere 2014, 114, 337–339. [Google Scholar] [CrossRef] [PubMed]
- Stockholm Convention on Persistent Organic Pollutants. Available online: http://www.pops.int/TheConvention/POPsReviewCommittee/Meetings/POPRC15/Overview/tabid/8052/Default.aspx (accessed on 9 December 2022).
- Stockholm Convention on Persistent Organic Pollutants. Available online: http://chm.pops.int/TheConvention/ConferenceoftheParties/Meetings/COP10/tabid/8397/Default.aspx (accessed on 9 December 2022).
- Fang, X.G.; Wang, Q.; Zhao, Z.; Tang, J.H.; Tian, C.G.; Yao, Y.M.; Yu, J.C.; Sun, H.W. Distribution and dry deposition of alternative and legacy perfluoroalkyl and polyfluoroalkyl substances in the air above the Bohai and Yellow Seas, China. Atmos. Environ. 2018, 192, 128–135. [Google Scholar] [CrossRef]
- Yu, N.Y.; Guo, H.W.; Yang, J.P.; Jin, L.; Wang, X.B. Non-Target and Suspect Screening of Per- and Polyfluoroalkyl Substances in Airborne Particulate Matter in China. Environ. Sci. Technol. 2018, 52, 8205–8214. [Google Scholar] [CrossRef]
- Paragot, N.; Becanova, J.; Karaskova, P.; Prokes, R.; Klanova, J.; Lammel, G.; Degrendele, C. Multi-year atmospheric concentrations of per- and polyfluoroalkyl substances (PFASs) at a background site in central Europe. Environ. Pollut. 2020, 265, 114851. [Google Scholar] [CrossRef] [PubMed]
- Zhao, N.; Zhao, M.R.; Liu, W.P.; Jin, H.B. Atmospheric particulate represents a source of C8-C12 perfluoroalkyl carboxylates and 10:2 fluorotelomer alcohol in tree bark. Environ. Pollut. 2021, 273, 116475. [Google Scholar] [CrossRef]
- Yamazaki, E.; Taniyasu, S.; Wang, X.H.; Yamashita, N. Per- and polyfluoroalkyl substances in surface water, gas and particle in open ocean and coastal environment. Chemosphere 2021, 272, 129869. [Google Scholar] [CrossRef]
- Wu, J.; Jin, H.B.; Li, L.; Zhai, Z.H.; Martin, J.W.; Hu, J.X.; Peng, L.; Wu, P.F. Atmospheric perfluoroalkyl acid occurrence and isomer profiles in Beijing, China. Environ. Pollut. 2019, 255, 113129. [Google Scholar] [CrossRef]
- Casas, G.; Martinez-Varela, A.; Vila-Costa, M.; Jimenez, B.; Dachs, J. Rain Amplification of Persistent Organic Pollutants. Environ. Sci. Technol. 2021, 55, 12961–12972. [Google Scholar] [CrossRef] [PubMed]
- Ao, J.J.; Yuan, T.; Xia, H.; Ma, Y.N.; Shen, Z.M.; Shi, R.; Tian, Y.; Zhang, J.; Ding, W.J.; Gao, L. Characteristic and human exposure risk assessment of per- and polyfluoroalkyl substances: A study based on indoor dust and drinking water in China. Environ. Pollut. 2019, 254, 112873. [Google Scholar] [CrossRef] [PubMed]
- Swedish Chemicals Agency (KEMI). Occurence and Use of Highly Fluorinated Substances and Alternatives; Rapport 7/15; Swedish Chemicals Agency: Kemi, Finland, 2015.
- Buck, R.C.; Franklin, J.; Berger, U.; Conder, J.M.; Cousins, I.T.; de Voogt, P.; Jensen, A.A.; Kannan, K.; Mabury, S.A.; van Leeuwen, S.P.J. Perfluoroalkyl and polyfluoroalkyl substances in the environment: Terminology, classification, and origins. Integr. Environ. Assess. Manag. 2011, 7, 513–541. [Google Scholar] [CrossRef]
- Ma, X.; Shan, G.; Chen, M.; Zhao, J.; Zhu, L. Riverine inputs and source tracing of perfluoroalkyl substances (PFASs) in Taihu Lake, China. Sci. Total Environ. 2018, 612, 18–25. [Google Scholar] [CrossRef] [PubMed]
- Martin, J.W.; Mabury, S.A.; Wong, C.S.; Noventa, F.; Solomon, K.R.; Alaee, M.; Muir, D.C.G. Airborne haloacetic acids. Environ. Sci. Technol. 2003, 37, 2889–2897. [Google Scholar] [CrossRef]
- Wu, J.; Martin, J.W.; Zhai, Z.H.; Lu, K.D.; Li, L.; Fang, X.K.; Jin, H.B.; Hu, J.X.; Zhang, J.B. Airborne trifluoroacetic acid and its fraction from the degradation of HFC-134a in Beijing, China. Environ. Sci. Technol. 2014, 48, 3675–3681. [Google Scholar] [CrossRef]
- Pankow, J.F. An absorption model of gas/particle partitioning of organic compounds in the atmosphere. Atmos. Environ. 1994, 28, 185–188. [Google Scholar] [CrossRef]
- Atkinson, R. Handbook of Property Estimation Methods for Chemicals; CRC Press: Boca Raton, FL, USA, 2000. [Google Scholar]
- Bowden, D.J.; Clegg, S.L.; Brimblecombe, P. The Henry’s law constant of trifluoroacetic acid and its partitioning into liquid water in the atmosphere. Chemosphere 1996, 32, 405–420. [Google Scholar] [CrossRef]
- Bowden, D.J.; Clegg, S.L.; Brimblecombe, P. The Henry’s law constants of the haloacetic acids. J. Atmos. Chem. 1998, 29, 85–107. [Google Scholar] [CrossRef]
- Gigliotti, C.L.; Totten, L.A.; Offenberg, J.H.; Dachs, J.; Reinfelder, J.R.; Nelson, E.D.; Glenn, T.R.; Eisenreich, S.J. Atmospheric concentrations and deposition of polycyclic aromatic hydrocarbons to the Mid-Atlantic East Coast Region. Environ. Sci. Technol. 2005, 39, 5550–5559. [Google Scholar] [CrossRef]
- Wang, Z.; Xie, Z.Y.; Moller, A.; Mi, W.Y.; Wolschke, H.; Ebinghaus, R. Estimating dry deposition and gas/particle partition coefficients of neutral poly-/perfluoroalkyl substances in northern German coast. Environ. Pollut. 2015, 202, 120–125. [Google Scholar] [CrossRef] [PubMed]
- U.S. Environmental Protection Agency (USEPA). Available online: https://www.epa.gov/risk/risk-assessment-guidance-superfund-rags-part-e (accessed on 9 December 2022).
- Liu, B.L.; Zhang, H.; Yao, D.; Li, J.Y.; Xie, L.W.; Wang, X.X.; Wang, Y.P.; Liu, G.Q.; Yang, B. Perfluorinated compounds (PFCs) in the atmosphere of Shenzhen, China: Spatial distribution, sources and health risk assessment. Chemosphere 2015, 138, 511–518. [Google Scholar] [CrossRef] [PubMed]
- Ahrens, L.; Harner, T.; Shoeib, M.; Lane, D.A.; Murphy, J.G. Improved characterization of gas-particle partitioning for per- and polyfluoroalkyl substances in the atmosphere using annular diffusion denuder samplers. Environ. Sci. Technol. 2012, 46, 7199–7206. [Google Scholar] [CrossRef] [PubMed]
- Zhou, Z.F.; Feng, S.J.; Xie, C.X.; Pan, D.; Li, K. Pollution characteristics and distribution in gas-particle phase of polychlorinated biphenyls (PCBs) in the West Third Ring area in Beijing, China. Environ. Chem. 2018, 37, 871–879. (In Chinese) [Google Scholar]
- Khairy, M.A.; Luek, J.L.; Dickhut, R.; Lohmann, R. Levels, sources and chemical fate of persistent organic pollutants in the atmosphere and snow along the western Antarctic Peninsula. Environ. Pollut. 2016, 216, 304–313. [Google Scholar] [CrossRef]
- Chen, H.; Zhang, L.; Li, M.; Yao, Y.; Zhao, Z.; Munoz, G.; Sun, H. Per- and polyfluoroalkyl substances (PFASs) in precipitation from mainland China: Contributions of unknown precursors and short-chain (C2–C3) perfluoroalkyl carboxylic acids. Water Res. 2019, 153, 169–177. [Google Scholar] [CrossRef]
- Stockholm Convention on Persistent Organic Pollutants. Available online: http://www.pops.int/TheConvention/POPsReviewCommittee/Meetings/POPRC13/Overview/tabid/5965/Default.aspx (accessed on 9 December 2022).
- Ministry of Environmental Protection of the People’s Republic of China. Exposure Factors Handbook of Chinese Population (Adult); China Environmental Press: Beijing, China, 2013. (In Chinese) [Google Scholar]
- Ministry of Environmental Protection of the People’s Republic of China. Exposure Factors Handbook of Chinese Population (Children); China Environmental Press: Beijing, China, 2016. (In Chinese) [Google Scholar]
- Liu, Y.; Liu, W.J.; Xu, Y.S.; Zhao, Y.Z.; Wang, P.; Yu, S.Y.; Zhang, J.D.; Tang, Y.; Xiong, G.N.; Tao, S.; et al. Characteristics and human inhalation exposure of ionic per- and polyfluoroalkyl substances (PFASs) in PM10 of cities around the Bohai Sea: Diurnal variation and effects of heating activity. Sci. Total Environ. 2019, 687, 177–187. [Google Scholar] [CrossRef]
- Sanchez-Pinero, J.; Novo-Quiza, N.; Pernas-Castano, C.; Moreda-Pineiro, J.; Muniategui-Lorenzo, S.; Lopez-Mahia, P. Inhalation bioaccessibility of multi-class organic pollutants associated to atmospheric PM2.5: Correlation with PM2.5 properties and health risk assessment. Environ. Pollut. 2022, 307, 119577. [Google Scholar] [CrossRef]
- Xu, Z.J.; Zhu, H.B.; Shu, L.Y.; Lai, X.X.; Lu, W.; Fu, L.; Jiang, B.; He, T.; Wang, F.P.; Li, Q.S. Estimation of the fraction of soil-borne particulates in indoor air by PMF and its impact on health risk assessment of soil contamination in Guangzhou, China. Environ. Pollut. 2022, 308, 119623. [Google Scholar] [CrossRef]
- Li, J.F.; Zhang, Z.Z.; Ma, L.Y.; Zhang, Y.; Niu, Z.G. Implementation of USEPA RfD and SFO for improved risk assessment of organophosphate esters (organophosphate flame retardants and plasticizers). Environ. Int. 2018, 114, 21–26. [Google Scholar] [CrossRef]
- Shi, G.T.; Chen, Z.L.; Bi, C.J.; Wang, L.; Teng, J.Y.; Li, Y.S.; Xu, S.Y. A comparative study of health risk of potentially toxic metals in urban and suburban road dust in the most populated city of China. Atmos. Environ. 2011, 45, 764–771. [Google Scholar] [CrossRef]
- Han, D.M.; Ma, Y.G.; Huang, C.; Zhang, X.F.; Xu, H.; Zhou, Y.; Liang, S.; Chen, X.J.; Huang, X.Q.; Liao, H.X.; et al. Occurrence and source apportionment of perfluoroalkyl acids (PFAAs) in the atmosphere in China. Atmos. Chem. Phys. 2019, 19, 14107–14117. [Google Scholar] [CrossRef] [Green Version]
- Rauert, C.; Harner, T.; Schuster, J.K.; Eng, A.; Fillmann, G.; Castillo, L.E.; Fentanes, O.; Ibarra, M.V.; Miglioranza, K.S.B.; Rivadeneira, I.M.; et al. Atmospheric Concentrations of New Persistent Organic Pollutants and Emerging Chemicals of Concern in the Group of Latin America and Caribbean (GRULAC) Region. Environ. Sci. Technol. 2018, 52, 7240–7249. [Google Scholar] [CrossRef] [PubMed]
- Liu, W.X.; He, W.; Wu, J.Y.; Wu, W.J.; Xu, F.L. Distribution, partitioning and inhalation exposure of perfluoroalkyl acids (PFAAs) in urban and rural air near Lake Chaohu, China. Environ. Pollut. 2018, 243, 143–151. [Google Scholar] [CrossRef] [PubMed]
- Shoeib, M.; Schuster, J.; Rauert, C.; Su, K.; Smyth, S.A.; Harner, T. Emission of poly and perfluoroalkyl substances, UV-filters and siloxanes to air from wastewater treatment plants. Environ. Pollut. 2016, 218, 595–604. [Google Scholar] [CrossRef]
- Karásková, P.; Codling, G.; Melymuk, L.; Klanova, J. A critical assessment of passive air samplers for per- and polyfluoroalkyl substances. Atmos. Environ. 2018, 185, 186–195. [Google Scholar] [CrossRef]
- Wong, F.; Shoeib, M.; Katsoyiannis, A.; Eckhardt, S.; Stohl, A.; Bohlin-Nizzetto, P.; Li, H.; Fellin, P.; Su, Y.S.; Hung, H. Assessing temporal trends and source regions of per- and polyfluoroalkyl substances (PFASs) in air under the Arctic Monitoring and Assessment Programme (AMAP). Atmos. Environ. 2018, 172, 65–73. [Google Scholar] [CrossRef]
Figure 1.
The methodology chart of this study.

Figure 2.
Gas and particulate fractions of PFHxS from June to November 2021.

Figure 3.
The linear relationship between and .

Figure 4.
Wet–dry deposition flux of PFHxS from June to November 2021.


Table 1.
Monthly average atmospheric concentrations of PFHxS.
| Gas Phase (pg/m3) | Particle Phase (pg/m3) | Total Concentration (pg/m3) | |
|---|---|---|---|
| June | 1.07 | 0.63 | 1.70 |
| July | 0.63 | 0.63 | 1.26 |
| August | 0.83 | 1.04 | 1.87 |
| September | 0.63 | 0.78 | 1.41 |
| October | 0.63 | 0.63 | 1.26 |
| November | 0.94 | 0.63 | 1.57 |
Note: The values are the average concentrations of seven groups of samples in each month.
Disclaimer/Publisher’s Note: The statements, opinions and data contained in all publications are solely those of the individual author(s) and contributor(s) and not of MDPI and/or the editor(s). MDPI and/or the editor(s) disclaim responsibility for any injury to people or property resulting from any ideas, methods, instructions or products referred to in the content. |
© 2023 by the authors. Licensee MDPI, Basel, Switzerland. This article is an open access article distributed under the terms and conditions of the Creative Commons Attribution (CC BY) license (https://creativecommons.org/licenses/by/4.0/).
Share and Cite
MDPI and ACS Style
Wang, F.; Wu, J.; Zhuang, Y.; Dong, B.; Zhang, Y.; Peng, L. The Atmospheric Pollution Characteristics and Health Risk Assessment of Perfluorohexane Sulfonic Acid in Beijing. Atmosphere 2023, 14, 365. https://doi.org/10.3390/atmos14020365
AMA Style
Wang F, Wu J, Zhuang Y, Dong B, Zhang Y, Peng L. The Atmospheric Pollution Characteristics and Health Risk Assessment of Perfluorohexane Sulfonic Acid in Beijing. Atmosphere. 2023; 14(2):365. https://doi.org/10.3390/atmos14020365
Chicago/Turabian StyleWang, Fan, Jing Wu, Yiru Zhuang, Bingqi Dong, Yueling Zhang, and Lin Peng. 2023. "The Atmospheric Pollution Characteristics and Health Risk Assessment of Perfluorohexane Sulfonic Acid in Beijing" Atmosphere 14, no. 2: 365. https://doi.org/10.3390/atmos14020365
Note that from the first issue of 2016, this journal uses article numbers instead of page numbers. See further details here.