
Simultaneous Use of Ground-Based and Satellite Observation to Evaluate Atmospheric Air Pollution over Amman, Jordan


1
Department of Physics, Institute for Advanced Studies in Basic Sciences (IASBS), Zanjan 4513766731, Iran
2
Institute for Atmospheric and Earth System Research (INAR/Physics), University of Helsinki, FI-00014 Helsinki, Finland
3
Environmental and Atmospheric Research Laboratory (EARL), Department of Physics, School of Science, The University of Jordan, Amman 11942, Jordan
*
Author to whom correspondence should be addressed.
Atmosphere 2023, 14(2), 274; https://doi.org/10.3390/atmos14020274
Submission received: 11 November 2022
/
Revised: 24 January 2023
/
Accepted: 26 January 2023
/
Published: 30 January 2023
(This article belongs to the Special Issue Sand and Dust Storms: Impact and Mitigation Methods)
Abstract
:In this study, a combination of ground-based particulate matter measurements in synergy with space-borne CALIOP lidar recordings, meteorological observations, and reanalysis models have been used to study atmospheric air pollution over Amman, Jordan. The measurement was conducted over a 24-month period spanning from January 2018 to the end of December 2019. The CALIOP aerosol profiles and aerosol layer products version 4.21, level 2, with 5 km horizontal resolution were used to evaluate the vertical structure of the atmospheric constituent over the Amman region. The particle depolarization ratio (PDR) was extracted from CALIOP recordings and has been utilized to classify the type of atmospheric aerosols. This method reveals that the atmosphere above Amman mostly contains three different aerosol types including coarse-mode dust, fine-mode dust (polluted dust), and non-dust aerosols (pollution). Aerosols with 0 < 0.075 are categorized as pollution, aerosols with 0.075 < 0.20 as polluted dust, and aerosols with 0.20 < 0.40 are classified as dust. Both the one- and two-step POlarization-LIdar PHOtometer Networking (POLIPHON) approaches have been applied to the CALIOP aerosol profile product to retrieve the vertical profile of the optical and micro-physical properties of each aerosol type. Lofted-layer top heights and layer thickness in the atmosphere above Amman during the study period were also extracted from the CALIOP aerosol layer products. The highest frequency of occurrence was observed for layers with a top height of 0.5 to 2.5 km with a second smaller peak at 3.5 km. The maximum frequency of the lofted layers (40% of cases) were observed with layer thickness below 0.5 km. For layers with a top height lower than 500 m above ground level, the atmosphere was mostly impacted by polluted dust and pollution aerosols. On the other hand, for layers with a top height above 2500 m agl, the atmosphere was contaminated by depolarizing dust particles.
1. Introduction
Over recent decades, many studies have been done to investigate the chemical, physical, or optical properties of atmospheric air pollution over the Eastern Mediterranean (EM) region [1,2,3,4,5,6,7,8,9]. Most of these measurements have mainly relied on ground-based in situ recordings in addition to meteorological observations [7,8,9,10]. Hussein et al., measured the concentration of PM, PM, and organic and elemental carbon during an 11-month campaign (May 2018–March 2019) in the urban atmosphere of Amman, Jordan [2,7]. In another study, a suite of portable instruments was utilized by Hussein et al. to determine the size-resolved aerosol number in addition to the black carbon mass concentrations in Amman [4]. Along with other ground-based measurements, Hussein et al. distinguished aerosol particle size and concentration in coarse and sub-micron modes in Amman, and even in some other cities of Jordan during different periods [3]. They also investigated wind speed, temperature, and relative humidity effects on aerosol size distributions and concentrations [3]. There have also been several attempts at ground-based in situ measurements to investigate the contribution of mineral dust on the PM and PM concentrations in the Middle East [8,10]. Ganor et al. showed that the contribution of dust storms can cause the PM to exceed annual standards [10]. Pey et al. also showed that African dust outbreaks are more frequent in southern sites across the Mediterranean, whereas they occur less frequently in northern sites [8]. Regarding meteorological observations, Dyan et al. identified Sharav cyclones, Red Sea, and Persian troughs as major weather patterns that caused dust transport to the EM region [9].
Recently, some studies have been done by use of ground-based and satellite remote sensing measurements in the Middle East [1,6]. Heese et al. performed vertically resolved lidar measurements for the first time in the western part of the Middle East. They utilized a combination of a multi-wavelength Raman and polarization lidar (PollyXT), a novel aerosol typing method, and automated time-height source apportionment [11,12]. Rogozovsky et al. created a comprehensive data set to characterize aerosol layer composition and its possible impact on AOD retrieval. They used the MAIAC AOD data, PollyXT lidar, and AERONET observation in synergy with a local network of particulate matter concentration recordings [6]. Furthermore, the physical and optical properties of atmospheric aerosols over Cyprus were studied by the use of a ground-based lidar [13,14,15,16]. Mamouri et al. reported dust storm cases over Limassol, Cyprus, and other parts of the EM region that originated from Turkey and the Arabian desert in Syria [16]. As another example of an investigation of aerosol types and vertical distribution in the Mediterranean region, Wang et al. studied the vertical variability of aerosol types using lidar measurements combined with in situ measurements in the Vipava Valley, a representative Alpine mountainous region in southwestern Slovenia. This research aimed to perform aerosol identification by combining aerosol optical properties (particle depolarization ratio ()), lidar ratio, and vertical structure information. The data were obtained by a ground-based dual-wavelength Raman polarization lidar system. Aerosols over the Vipava Valley during this campaign were identified as mixtures of marine aerosols, mineral dust, traffic emissions, and particles from biomass burning [17]. Wang et al. also obtained the vertical aerosol mass concentration profile using Mie scattering lidar and ground-based measurements in Vipava Valley as a part of the Mediterranean region [18]. Despite all the mentioned research, there has not been any investigation into the vertical aerosol-type distribution over Jordan, and the knowledge of this aspect of Amman’s atmosphere is still insufficient.
In this paper, a combination of ground-based particulate matter concentration measurement and satellite observations is applied to investigate frequencies, vertical aerosol distribution, and optical properties of atmospheric aerosols over Amman. The measurements were performed during the 24 months from January 2018 to the end of December 2019. In the first step, air pollution cases are determined using ground-based mass concentration measurements in Amman. Next, the columnar and vertically resolved characteristics of detected cases are retrieved from satellite observations. The particle depolarization ratio (PDR) was extracted from space-borne lidar CALIOP recordings and used to characterize the type of aerosols over Amman’s atmosphere. Then, a predetermined lidar ratio is assigned to each aerosol class. The CALIOP observations are used to determine aerosol layer height and thickness. A multi-step POLIPHON approach is applied to retrieve coarse dust, fine dust, and urban pollution aerosol contributions in the atmosphere of the study region. The vertical profile of optical and physical properties of atmospheric air pollution is retrieved using this method. Finally, source regions are identified using the trajectories’ models. The paper is composed of five sections as follows. Section 2 is dedicated to an explanation of the observation site, methodologies of the measurements, and data set. Ground-based and satellite observations are described in Section 3. In Section 4, the aerosol is classified by lidar optical properties, and the layered structure of the aerosol is analyzed. The paper ends with conclusions in Section 5.
2. Materials and Methods
A geographical description of the study region, ground-based measurements, satellite data, reanalysis model, and the POLIPHON method are described in the following.
2.1. Measurement Location and Study Region
Amman ( N, E), the capital of Jordan, is situated in the Eastern Mediterranean (EM) region and Southwest Asia. This city is part of the global dust belt, the Middle East and North Africa (MENA) region, and the Levant [19]. Due to Amman’s geographical location, this city has a very complex atmosphere. It contains different atmospheric constituents that originate from either natural or anthropogenic sources [7,20]. For example, it is quite frequent that mineral dust is transported from deserts located in Africa, Iraq, Syria, and Saudi Arabia to Amman’s atmosphere. Besides dust aerosols, pollution from Europe, anthropogenic aerosols from the local industrial region, and background marine aerosols have considerable influence on the atmospheric air quality of this city [3,4,5,7,21].
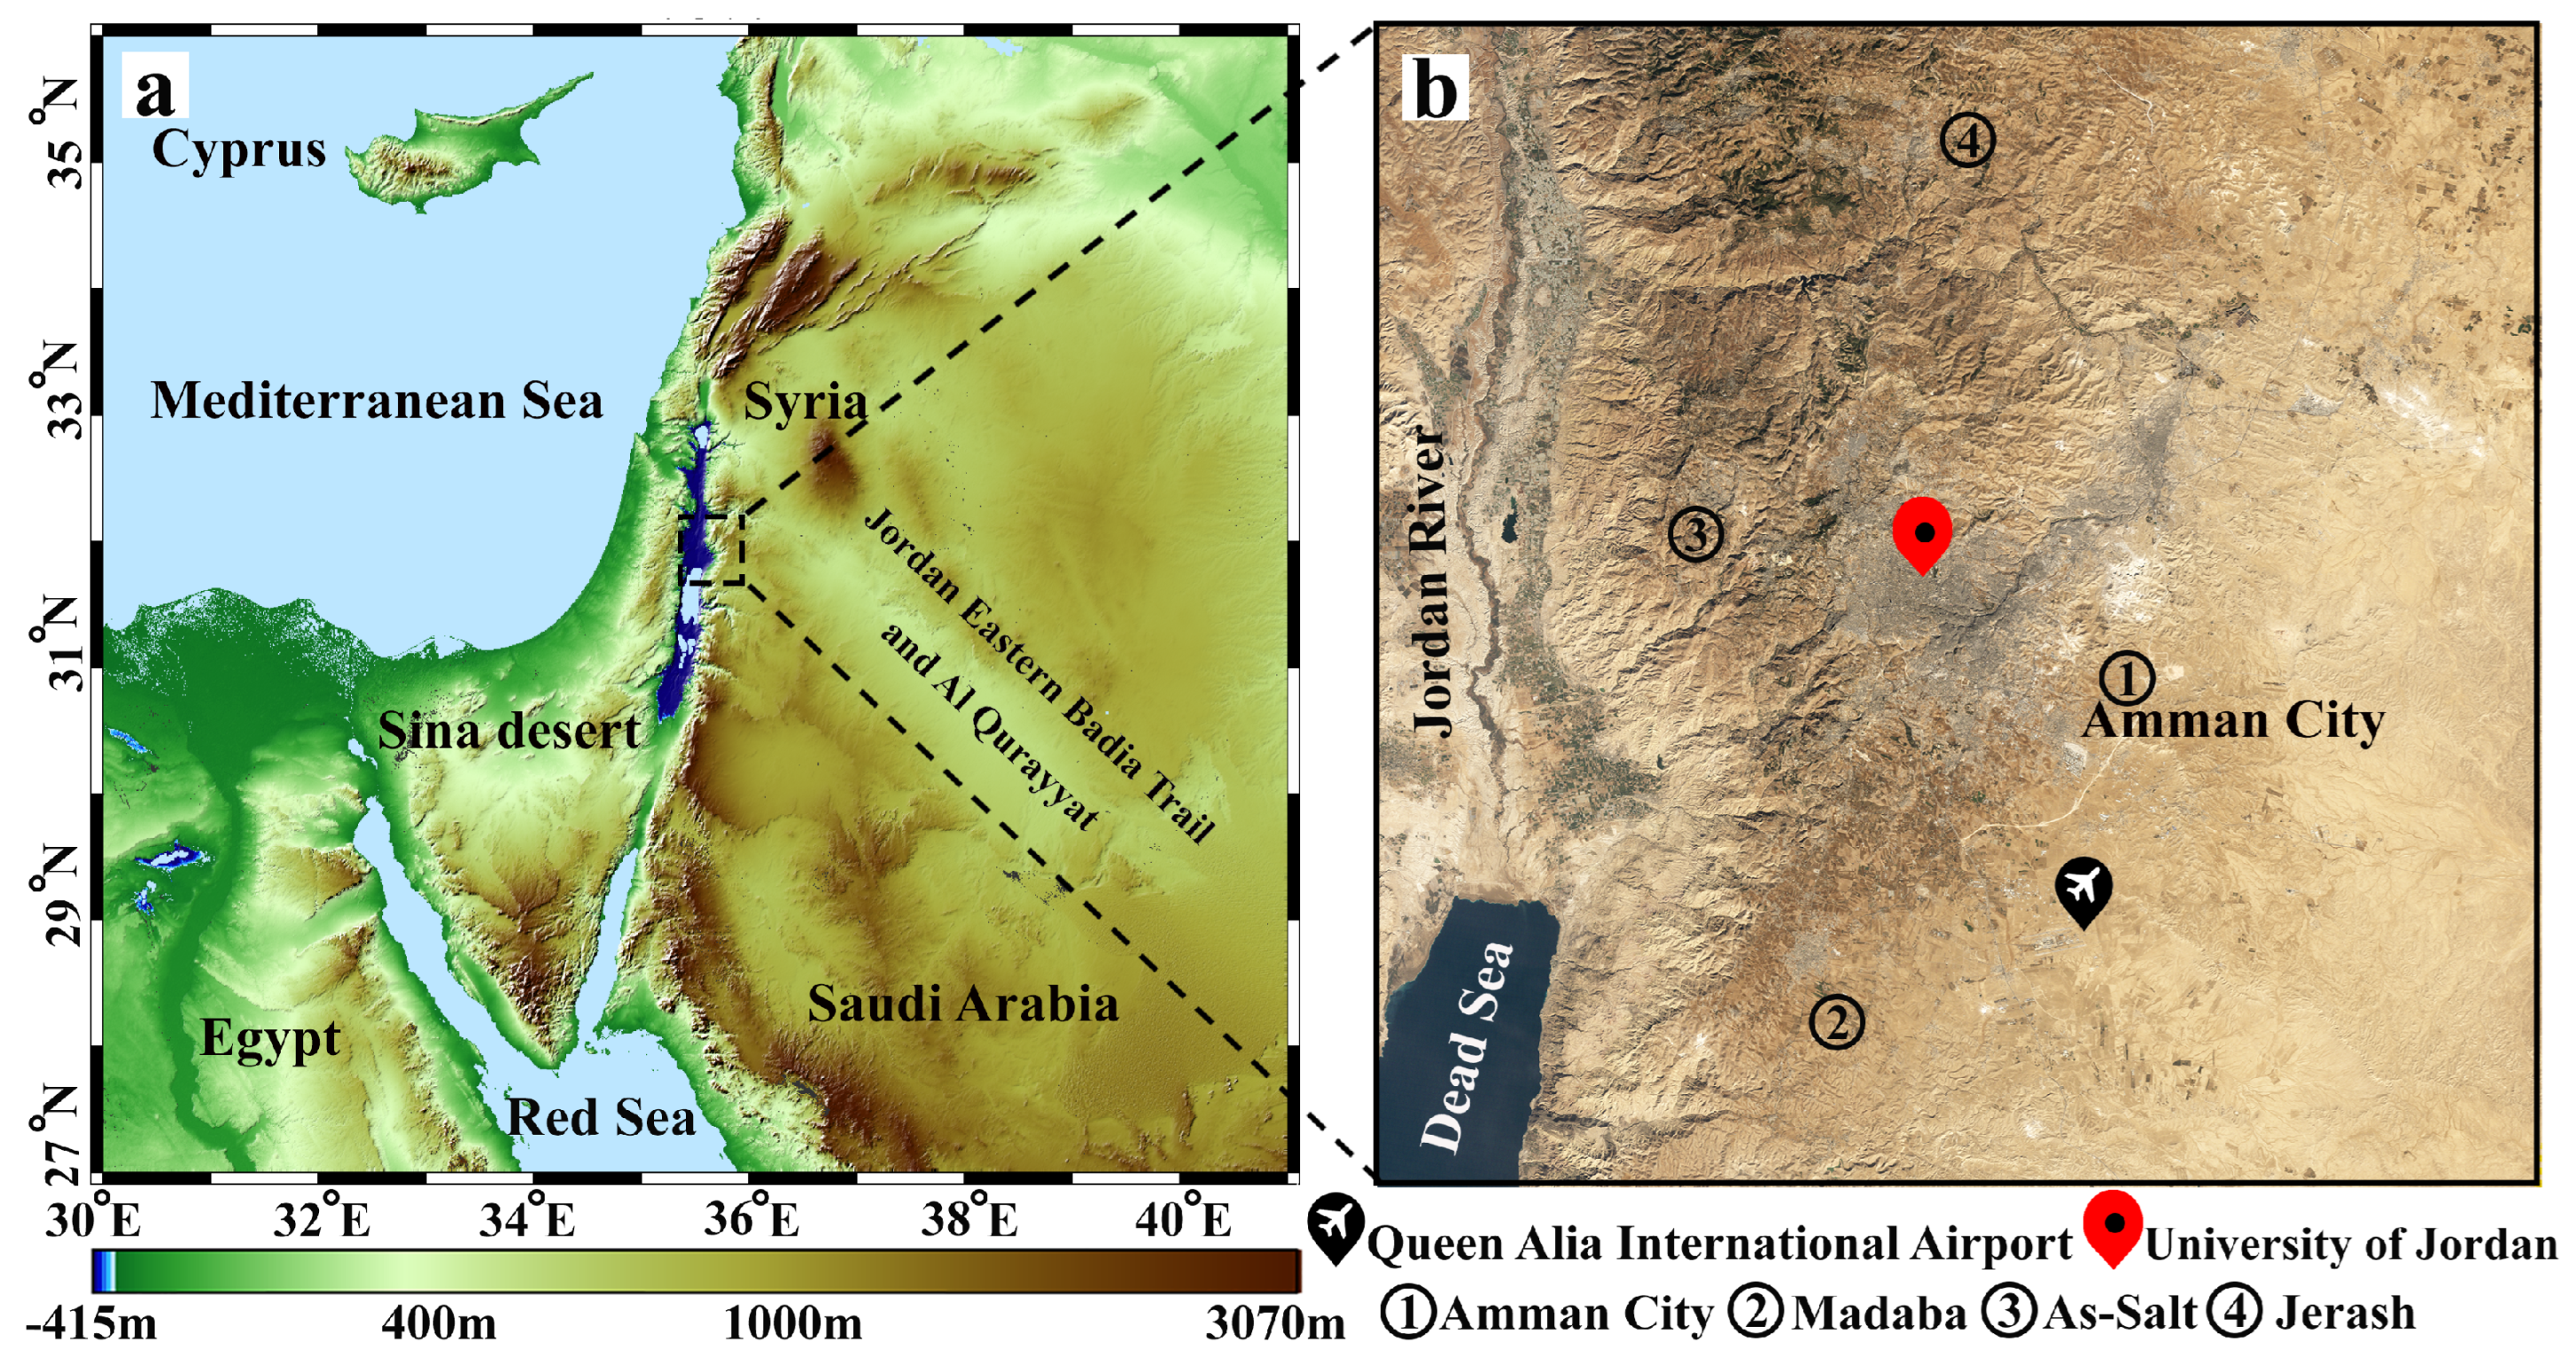
The topographical map of Jordan and surrounding countries, in addition to the region across which CALIOP recordings are averaged (black dashed box), are represented in Figure 1a. This figure shows that Jordan is bordered by Saudi Arabia to the south and east, Iraq to the northeast, and Syria to the north. The climate in Jordan is influenced by the aridity of the Arabian desert and the humidity of the eastern Mediterranean. It comprises three distinct climatic zones: Jordan Valley, the Eastern Desert (also known as Badia), and Mountain Height Plateau [22]. Figure 1b shows Amman forms a rough V shape in gray. On the west of the city, the terrain is more rugged, with small valleys extending toward the Jordan River. The elevation across the city ranges from ∼600 m above mean sea level (amsl) in the east to ∼1000 m amsl in the western part. The Dead Sea is located ∼90 km southwest of Amman. Ground-based particulate matter sampling was performed on the rooftop of the Department of Physics on the campus of the University of Jordan, Amman ( N, E, red balloon in Figure 1b). The ground-based observation was conducted from May 2018 to March 2019, but the CALIOP recordings are used as satellite data for comparison purposes for the whole of 2018 and 2019.
2.2. Ground-Based Measurement
Hussein et al. provided a detailed description of ground-based instruments, which have been used in this study [7]. In addition to particulate matter concentration, the ambient temperature, pressure, relative humidity, wind speed and direction were monitored at 5-min intervals using a weather station. The general specification of these instruments is listed in Table 1.
2.3. Satellite Data
2.3.1. CALIPSO
CALIPSO as a polar sun-synchronized satellite was launched on 28 April 2006 [23]. This satellite carries Cloud-Aerosol Lidar with Orthogonal Polarization (CALIOP). This space-borne lidar has been recording optical parameters of aerosols and clouds at 532 nm and 1064 nm wavelengths since June 2006 [23,24]. In this study, the CALIOP aerosol profile and aerosol layer products version 4.21, level 2, with 5 km horizontal resolution are used to characterize the atmospheric status over Amman region. The particle backscatter coefficient () and particle depolarzation ratio () are retrieved from the aerosol profile products of CALIOP recording [24,25]. While is a factor related to the amount of aerosol mass concentration [26], is merely sensitive to the type of aerosols [27,28]. Therefore, these two parameters can provide useful information about the type of aerosols and related mass concentrations in an atmospheric column. To screen high quality data, the atmospheric volume description (AVD), the cloud aerosol discrimination (CAD) score, and the extinction quality control (QC) flag are used after filtering fill values. The AVD is applied on each bin of the CALIOP signal to select aerosol features [29]. The CAD score is used to evaluate whether each feature is aerosol or cloud. To confidently select aerosols, we choose bins with a CAD score between −100 and −20 [30]. The QC flag is applied to retrieve extinction with acceptable quality. In this research, bins with QC = 0 or 1 are selected to screen out aerosol features with good quality [31]. After applying theses considerations, the screened and data are ready to use in the case study analysis.
On the other hand, the aerosol layer product has also been used to do a climatological study during the 24-month period from January 2018 to December 2019. Subtype classification, the height, thickness, and the integrated particle depolarization ratio (IPDR) of detected layers are four parameters that are extracted from this product. The tropospheric aerosol layer subtype in the CALIPSO version 4 algorithm is classified into seven different subtypes. This classification includes dust, polluted dust, dusty marine, clean marine, clean continental, polluted continental/smoke, and elevated smoke [32]. By examining the aerosol layers during these two years, it can be seen that four aerosol layer subtypes often exist in the study region. These four subtypes are dust, polluted dust, polluted continental/smoke, and elevated smoke. We consider polluted continental/smoke and elevated smoke layers as pollution in the atmosphere of the study region.
2.3.2. MODIS
To monitor the processes of aerosol emission and transport, the aerosol optical depth at 550 nm (AOD550) and angström exponent (AE) from Moderate Resolution Imaging Spectroradiometer (MODIS) recordings have been used in this study [33]. The AOD550 with 10 km resolution from collection 6.1 of Terra-MODIS daily aerosol products, level 2 (MOD04) from the Deep Blue (DB) algorithm, are used. In addition, the AOD550 and the AE with 1 degree resolution from collection 6.1 of Terra- and Aqua-MODIS products, level 3 (MOD08 and MYD08), by a combination of the Dark Target (DT) and DB algorithms are also utilized [33,34,35,36].
2.3.3. MSG-SEVIRI, RGB Dust Product
The Meteosat Second Generation (MSG) system is established under cooperation between EUMETSAT and the ESA to perform continuous meteorological observations from geostationary orbit. The Spinning Enhanced Visible and InfraRed Imager (SEVIRI) is MSG’s primary instrument and has the capacity to observe the Earth in 12 spectral channels. The RGB composite is produced using the following SEVIRI IR channels: IR12.0–IR10.8 (on red), IR10.8–IR8.7 (on green); and IR10.8 (on blue) [37,38]. Dust appears pink or magenta in this RGB combination. Dry land appears pale blue (daytime) to pale green (nighttime). Thick, high-level clouds have red-brown tones, and thin, high-level clouds appear very dark (nearly black). The full disc view includes the whole of Europe, all of Africa, and the Middle East and allows for frequent sampling every 15 min, with a spatial resolution of 3 km in the nadir [39].
2.4. Reanalysis Models
The HYSPLIT (Hybrid Single Particle Lagrangian Integrated Trajectory) model is used to provide information about air masses along their transport path. To determine the trajectories, the Global Data Analysis System (GDAS) with six-hour time steps was used in different heights over the study region [40,41]. The information about surface wind patterns is extracted from the recent reanalysis product of the European Centre for Medium-Range Weather Forecasts (ECMWF) [42,43]. ERA5 produces data on hourly global surface wind speed and direction with 0.1 resolution [43].
2.5. POLIPHON Method
The POlarization-LIdar PHOtometer Networking (POLIPHON) method was developed by Mamouri and Ansmann to determine the contribution of different aerosol components in the aerosol mixture within the vertical structure of the atmosphere. This technique also can retrieve the optical and micro-physical properties of aerosol mixture components. These components include fine-mode, coarse-mode, and non-dust particles. The method is based on the appropriate assumption of the linear depolarization ratio for each type of specific aerosol [16,44]. In the current research, both the one- and two-step POLIPHON approaches have been applied to the CALIOP aerosol profile product. To do this, the screened and (Section 2.3.1) are averaged across the study region, which is outlined by a black dashed box in Figure 1a. The one-step separation considers only two types of aerosols and is performed by an assumption of threshold and for linear depolarization ratios of dust and non-dust particles, respectively [16,45,46].
The two-step approach considers three types of aerosols and is performed by the assumption of threshold , , and for linear depolarization ratios of coarse-mode dust, fine-mode dust, and non-dust particles, respectively [44,47]. In the first round of the two-step POLIPHON method, the coarse-mode dust backscatter fraction () has been separated from the residual particle backscatter coefficient () caused by non-dust and fine-dust particles, as in Equation (1). In the second round, the non-dust backscatter coefficient () has been detached from the fine-dust backscatter coefficient (), as in Equation (2) [16,44].
The first step is mathematically written as:
Here, the , , and are particle depolarization ratio, coarse dust, and a mixture of non-dust and fine dust particles depolarization ratios, respectively. The latter describes the estimated (index e) depolarization ratio for the residual aerosol without the coarse dust fraction. Mamouri and Ansmann assumed, after the removal of the coarse-mode dust effects, the remaining part of the particle backscatter coefficient () is caused by 33% of non-dust particles and 67% of fine-mode dust particles [16]. Therefore, considering the fine-mode dust and non-dust particle contribution, the = 0.39 and an estimated = 0.12 was set in Equation (1a–c) [16,48]. After removing coarse-mode dust particles () using Equation (1a), the fine-mode () and non-dust backscatter coefficients () could be separated using Equation (2) in the second step [16,44], which is mathematically written as:
Finally, the vertical profile of mass concentrations for each component of the aerosol mixture can be computed by applying appropriate values for particle density values (), extinction-to-volume conversion factors (), and appropriate lidar ratio (S) of coarse-mode, fine-mode, and non-dust particles [14,16,49]. The mass concentrations of each type of particles can be obtained by using Equation (3) [16,44].
3. Results
As previously reported by Hussein et al., sand and dust storms (SDS) generally might have reached Jordan (the Eastern Mediterranean region) from three main source regions [7]. These sources include the Sahara, the Arabian Peninsula, and the Levant. Sometimes, the SDS might have originated from a combination of two or three regions. By considering the probable sources, the SDS type identification suggests the following:
- S-type originated from the Sahara region,
- SL-type originated from Sahara and the Levant region (i.e., SDS combined from these two regions), and
- SLA-type originated from all three regions. This type is the most commonly reported in Jordan.
In this study, we consider two illustrative SDS cases and discuss the atmospheric condition in detail. The first case was one of the SL-type SDS and occurred on 7 June 2018. For this case, the POLIPHON algorithm runs in a two-step version, and a three-component separation is performed. The second case was an S-type SDS and a one-step POLIPHON method is applied to retrieve the vertical profile of dust aerosols for this case.
3.1. Overview of the PM Concentrations
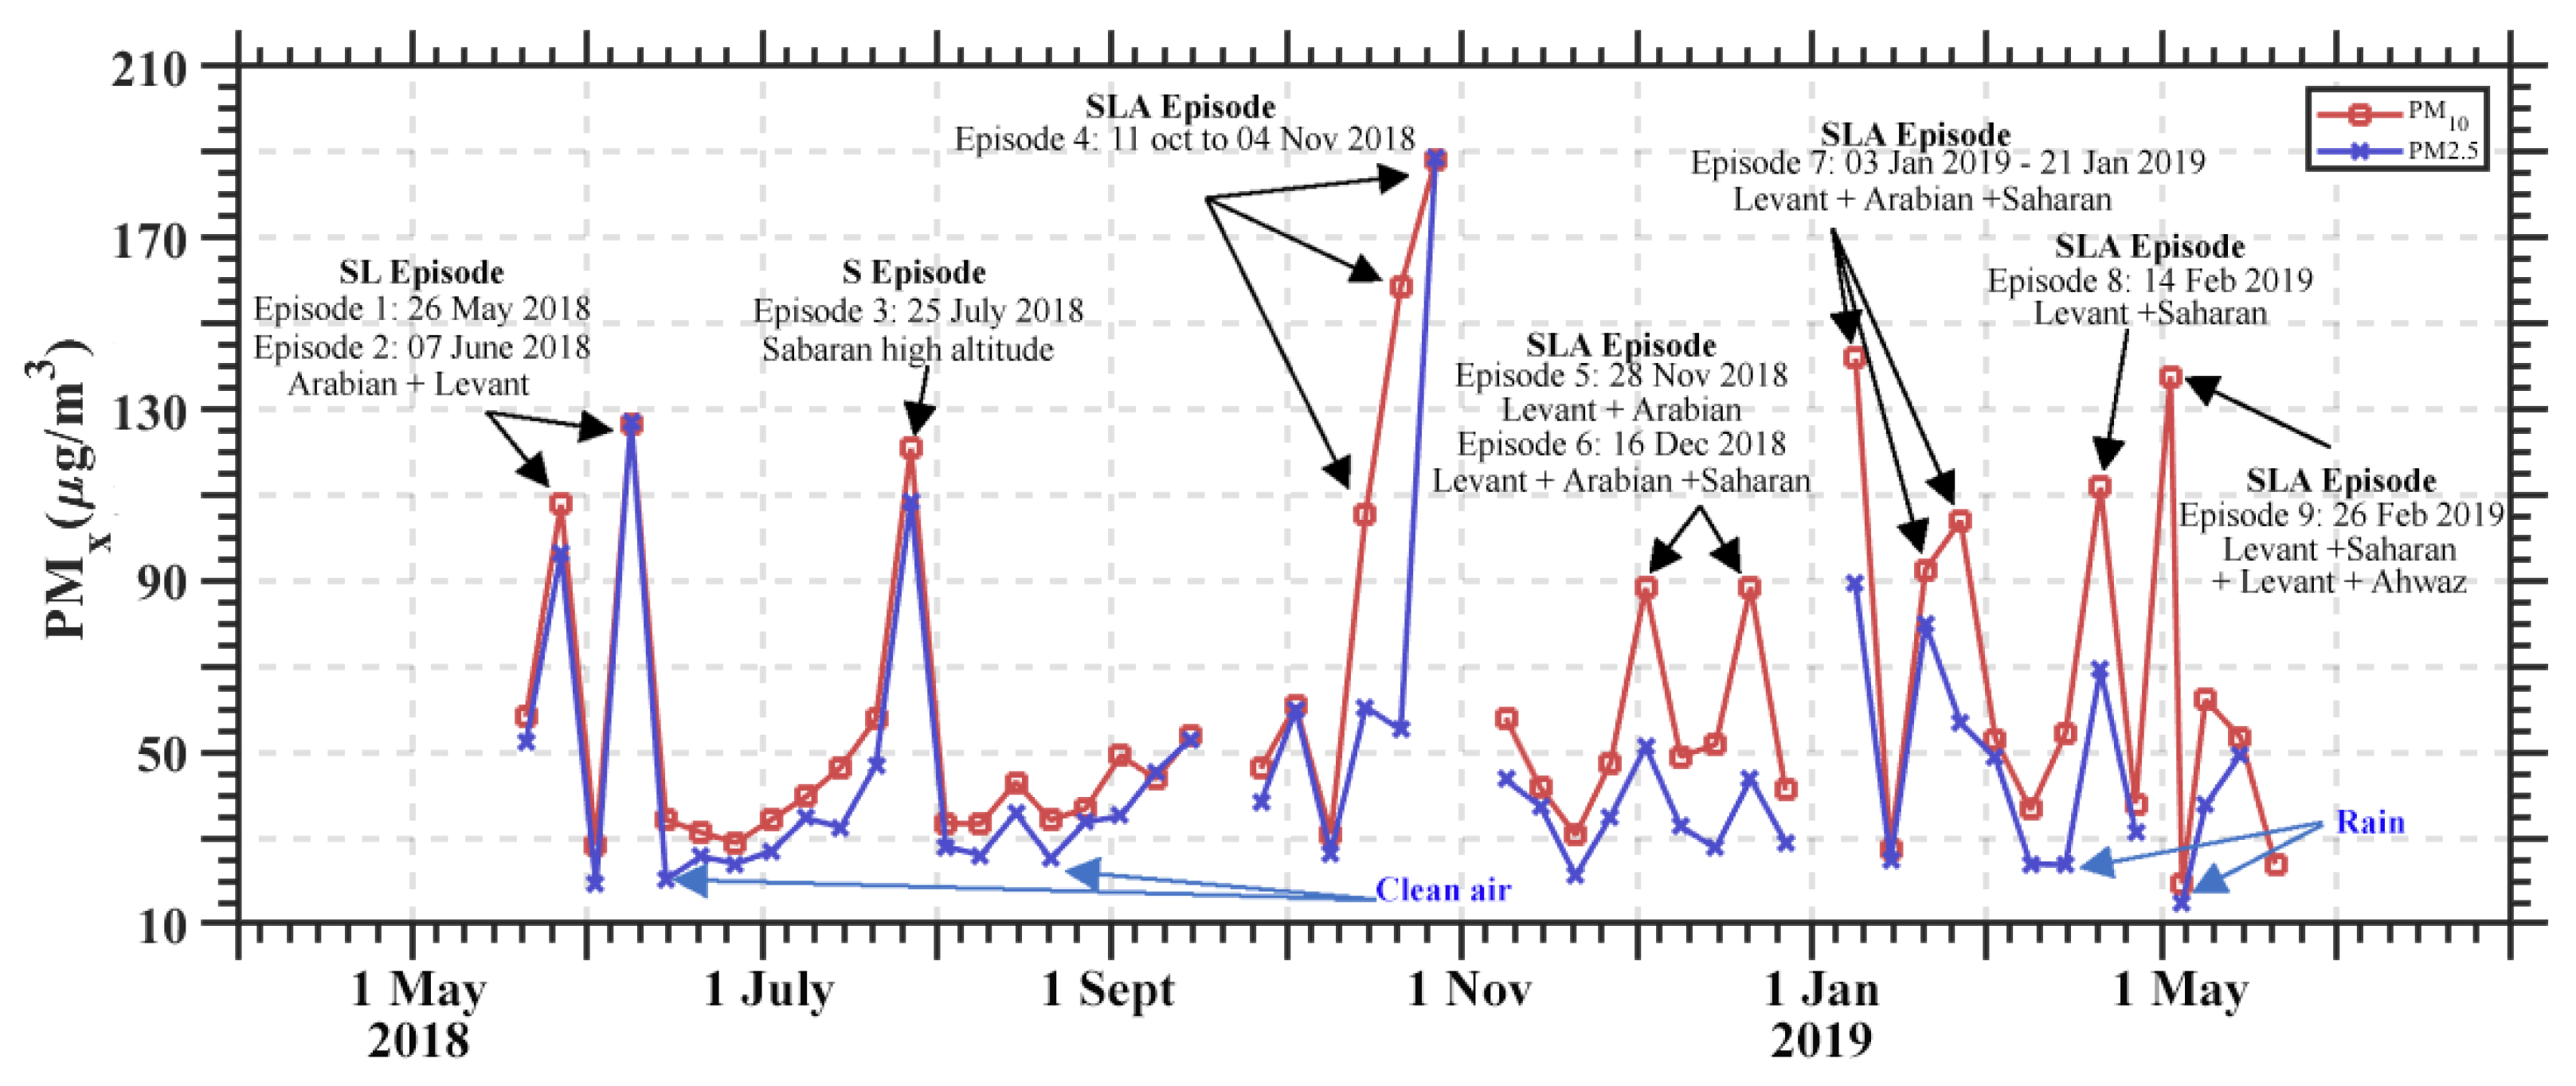
According to the Jordanian ambient air quality standards, the annual mean of PM and PM must not exceed 70 and 15 , respectively (JS-1140/2006). The time series of the PM concentration measurements is presented in Figure 2 with markups for different SDS types observed in Amman. There was a single S-type SDS episode with PM(PM)∼121(109) on 25 July 2018. Besides that, there were two SL-type SDS episodes during the measurement campaign. The first and second episodes with PM∼108 and ∼127 occurred on 26 May and 7 June 2018, respectively. In addition, there were also 10 SLA-type SDS episodes with PM concentration in the range of 88–188 . Seven days of clean air observed with PM concentration was in the range of 19–43 .
3.2. Case Study 1: 7 June 2018
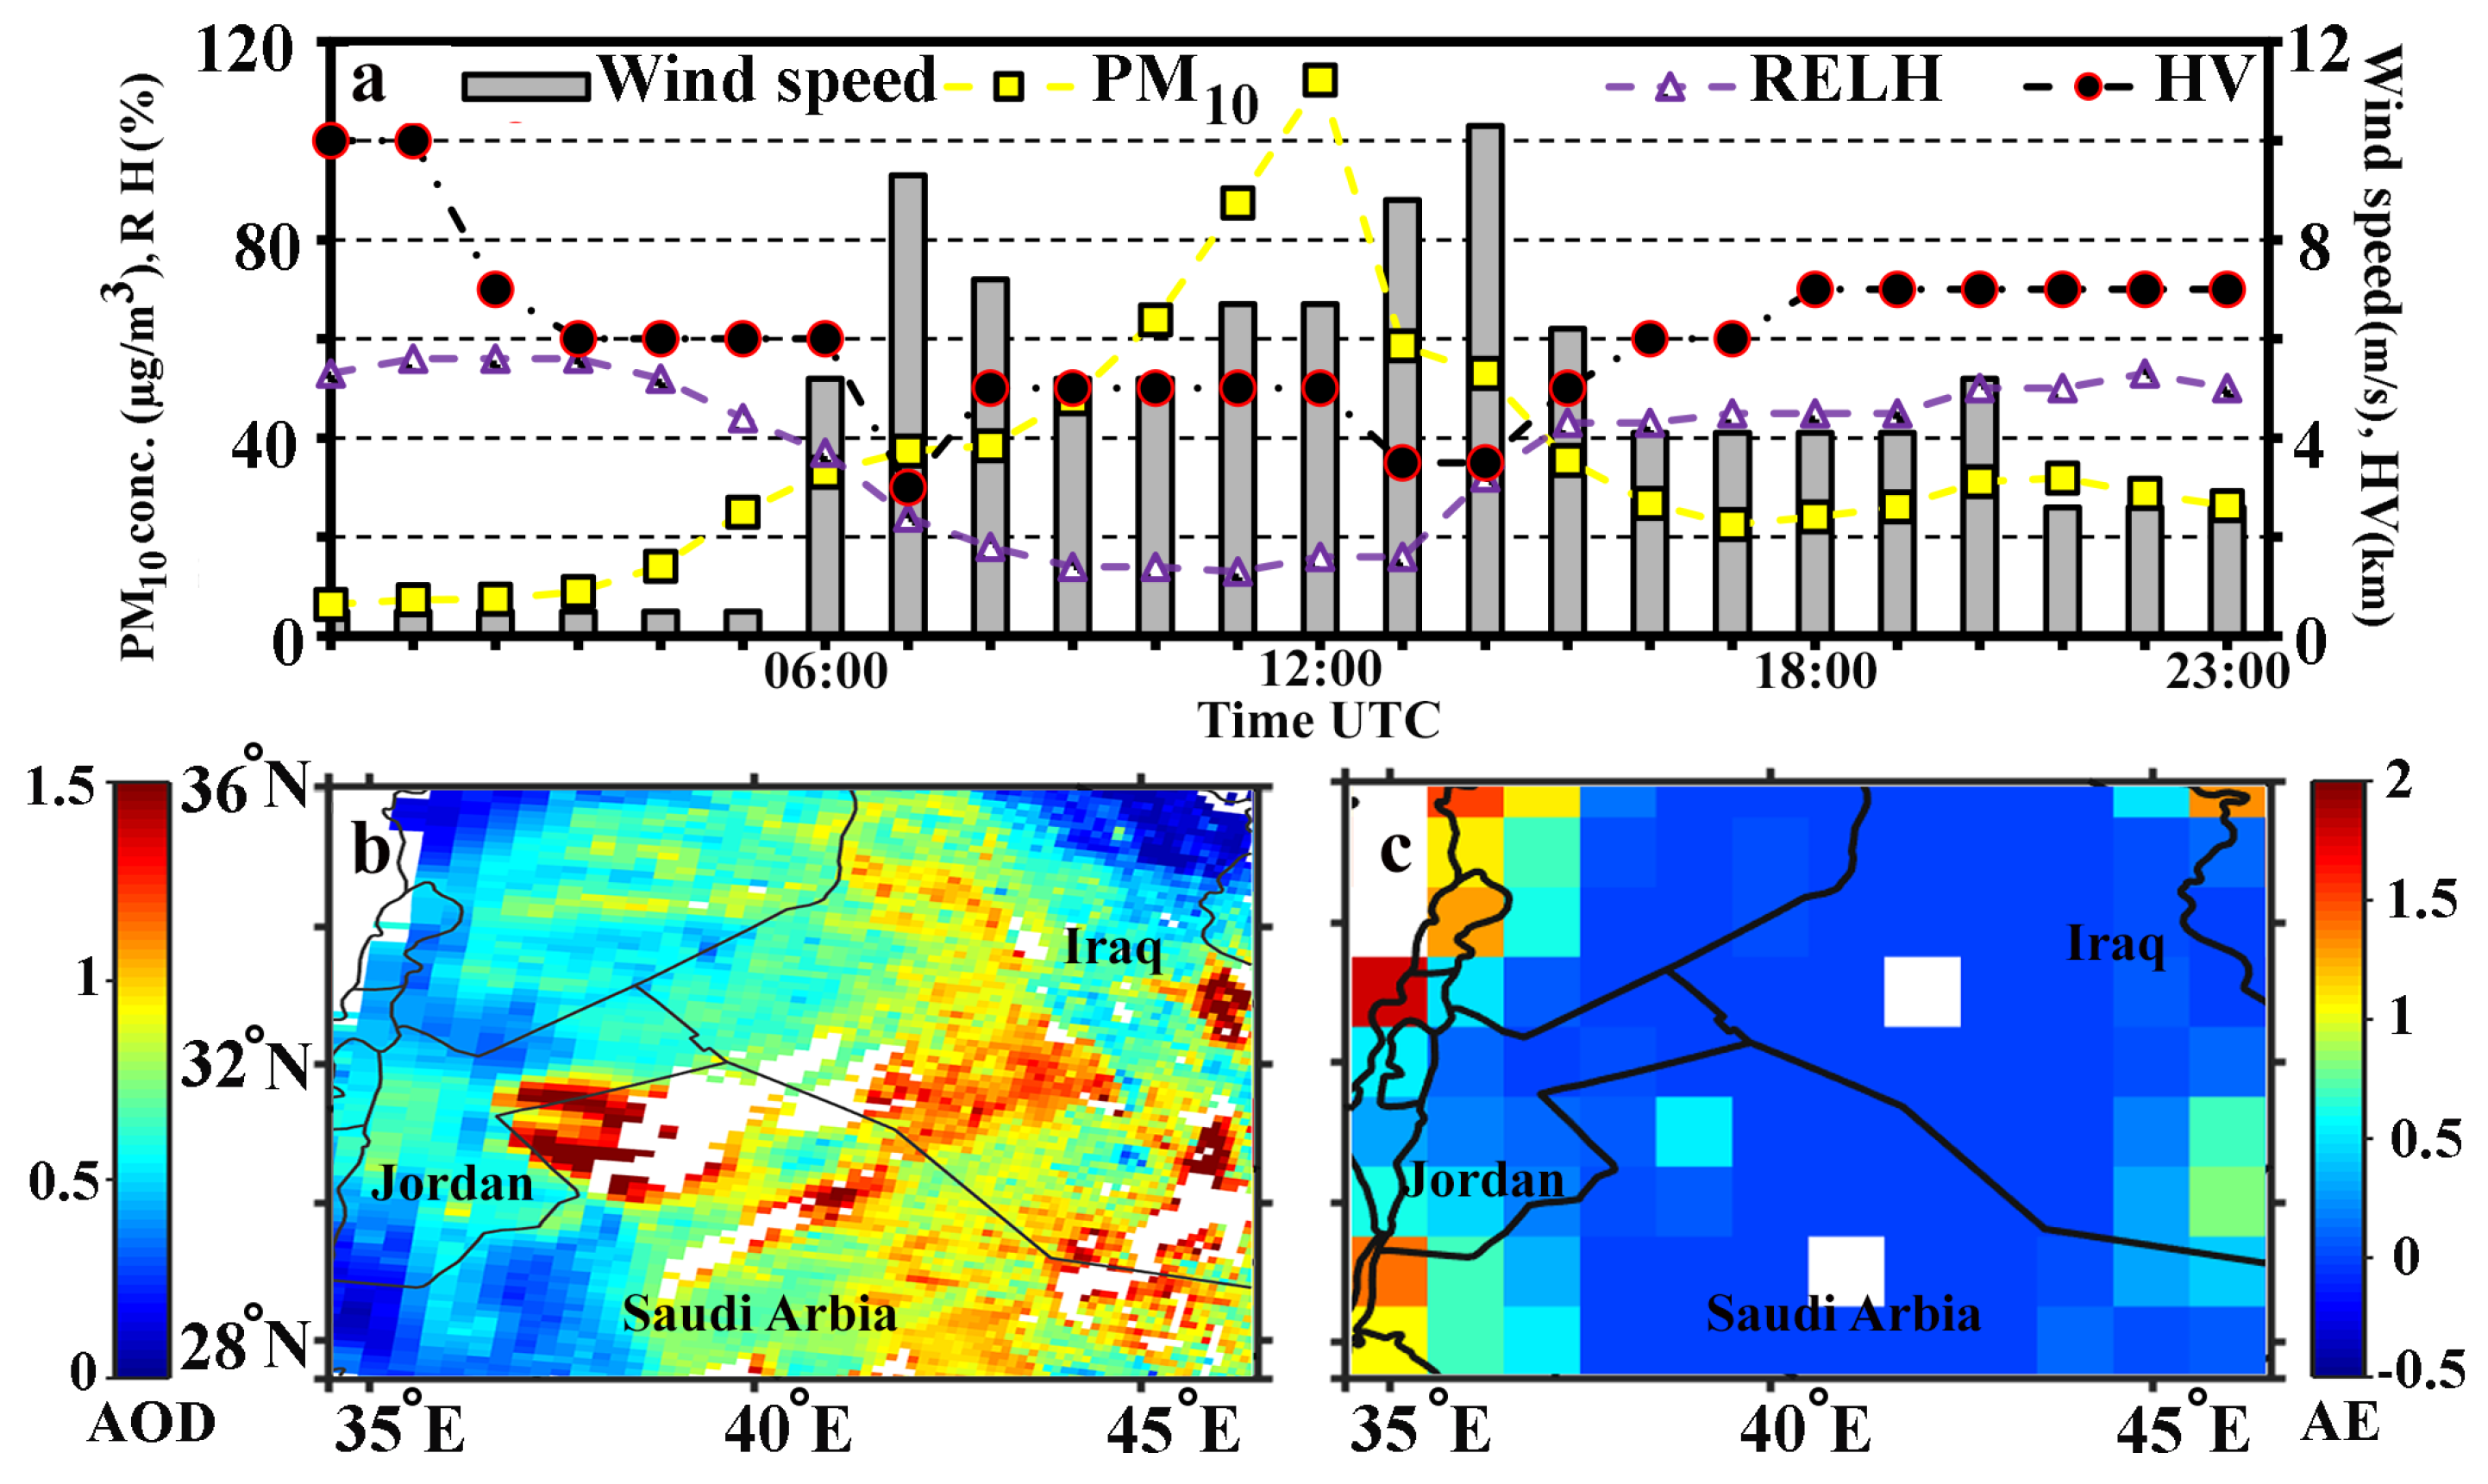
Figure 3a illustrates the temporal evolution of the PM concentration in addition to the relative humidity (RH), horizontal visibility (HV), and surface wind speed recordings. The measurement was performed by use of a series of ground-based instruments (Section 2.2) installed on the rooftop of the Department of Physics on the campus of the University of Jordan, Amman (Section 2.1). This SDS case is categorized as an SL-type and reached Amman’s atmosphere at around 06:00 AM and lasted until 02:00 PM on 7 June 2018. Figure 3a shows that a gusty wind, with a speed of more than 10 m/s, brought airborne dust plumes over Amman. Upon the arrival of the SDS in the measurement location, the PM concentration rose to about 120 , the HV dropped to about 4 km, and the RH reached values below 20%. Figure 3b,c shows the AOD550 of Terra-MODIS with 10 km resolution (MOD04) and angström exponent (AE) with 1 degree resolution (MOD08 and MYD08), respectively. The AOD550 was greater than 0.75, and the AE was less than 0.5 in most areas of Iraq and the border of Jordan and Saudi Arabia on 7 June. The large value for AOD550 (>1) and small value for AE (<0.5) indicate that coarse-mode dust particles were dominant over mentioned regions.
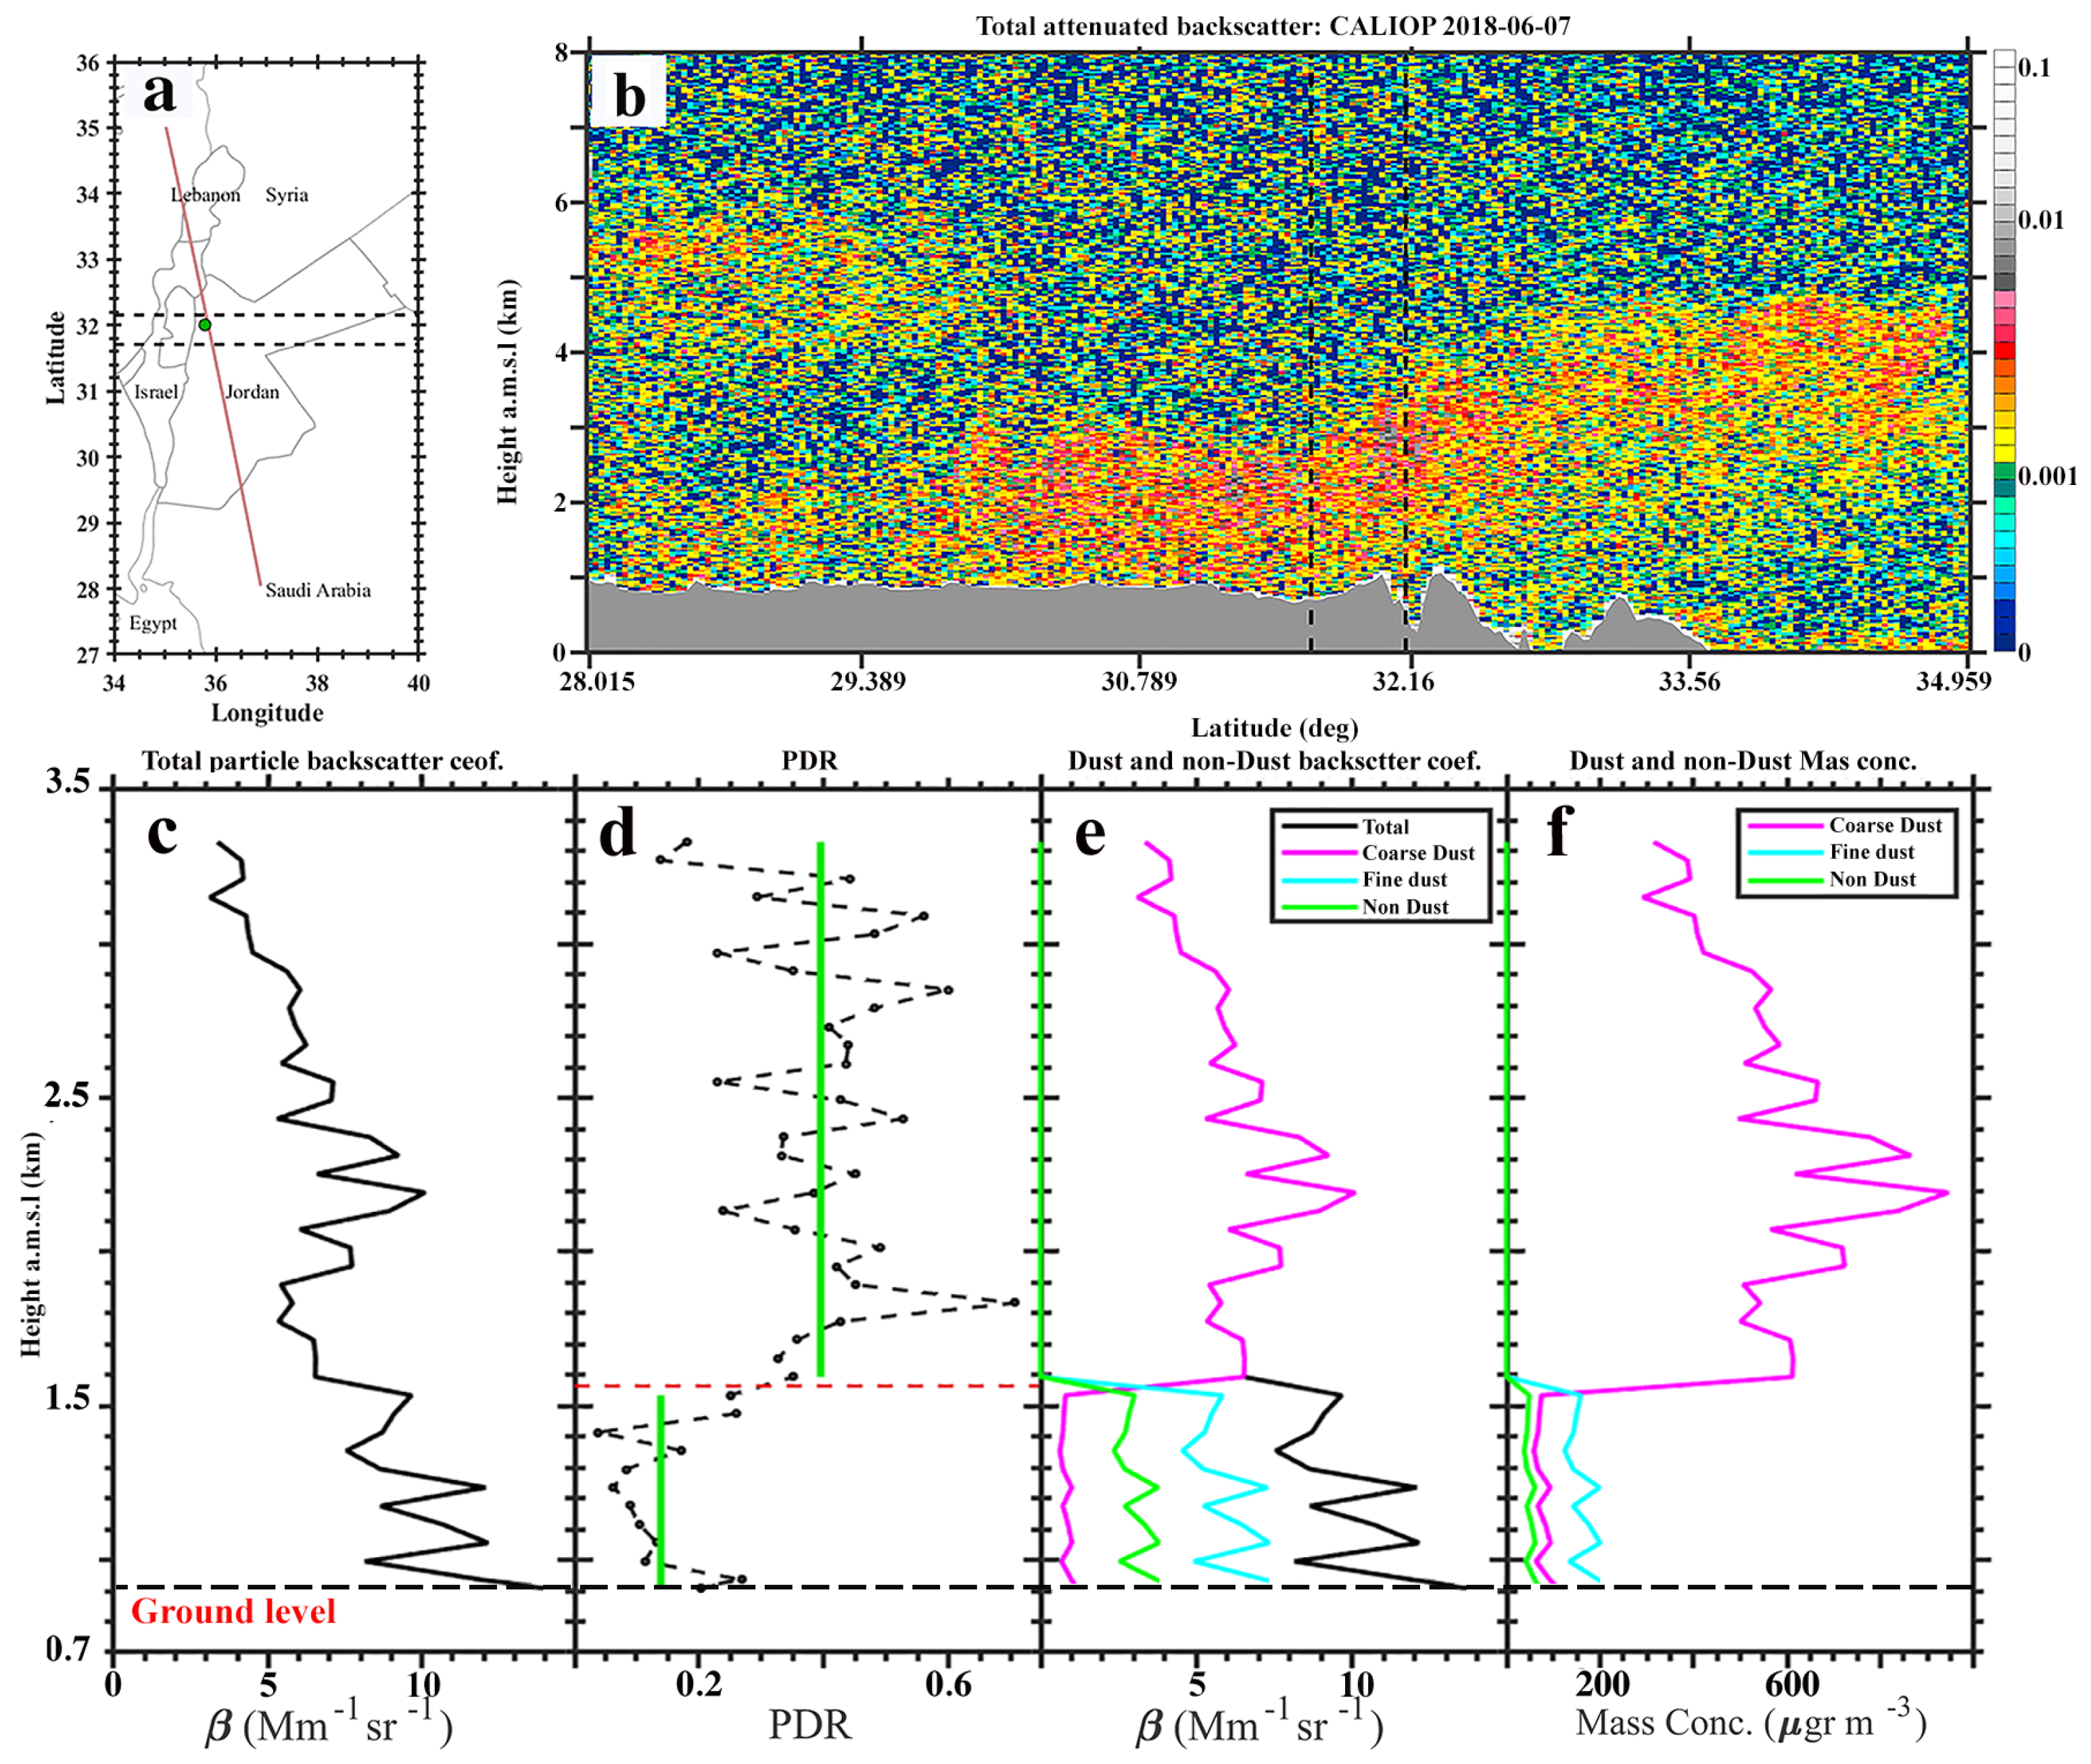
Figure 4a depicts the CALIPSO satellite ground track and the location of Amman with a red line and a green circle, respectively. The cross-section of the total attenuated backscatter coefficient in arbitrary units (AU) captured by the satellite CALIOP lidar is shown in Figure 4b. The bottom horizontal axis shows the along-track latitude, and the vertical axis shows the height above mean sea level (amsl). The existence of a lofted dust layer that extends from the surface up to 3.5 km in height is clear in Figure 4b. The CALIOP signals within the dashed area in Figure 4a,b are averaged to retrieve the vertical profile of the optical and micro-physical properties of atmospheric aerosols. Due to geographical features of Amman and the CALIOP lidar ground track, the elevation of the region of interest is ∼900 m amsl in this case (dashed black line in Figure 4c–f). In the first step, the vertical profile of and are retrieved from CALIOP data (Figure 4c,d) [23]. As it is shown in Figure 4d, there are some very high PDR values () above 1.5 km. Some research has shown that the PDR of CALIOP is relatively noisy in comparison with the ground-based depolarized lidar and sometimes shows an unrealistic value [25,50,51]. Therefore, it is suggested to discard the PDR of CALIPSO with values greater than 0.6 [50]. In this paper, the layer-integrated particle depolarization ratio has been calculated by averaging all the PDR values within a layer (green vertical line in Figure 4d). This value of the PDR has been used in the following POLIPHON analyses. A two-layer structure in the vertical profile of the atmosphere is perceived in Figure 4c,d. The lower layer extends from the ground surface up to ∼700 m above the ground level (agl), and the average of the for this layer is ∼0.14. On the other hand, the upper layer extends from 700 m agl to 2500 agl, and the average of the for this layer is ∼0.39. Then, by considering the average values of the , a two-step POLIPHON method (Section 2.5) was used to separate fine-mode, coarse-mode, and non-dust contribution in the aerosol mixture within the vertical structure of the atmosphere (Figure 4e,f). In the lower layer, as it is illustrated in Figure 4e, fine-mode dust particles are the dominant aerosol type and are mixed with anthropogenic (non-dust) pollution. Meanwhile, the upper layer only contains coarse-mode dust particles. Figure 4f shows the vertical distribution of mass concentration for each aerosol type that is retrieved by use of appropriate conversion factors (Equation (3a–c) and Table 2).
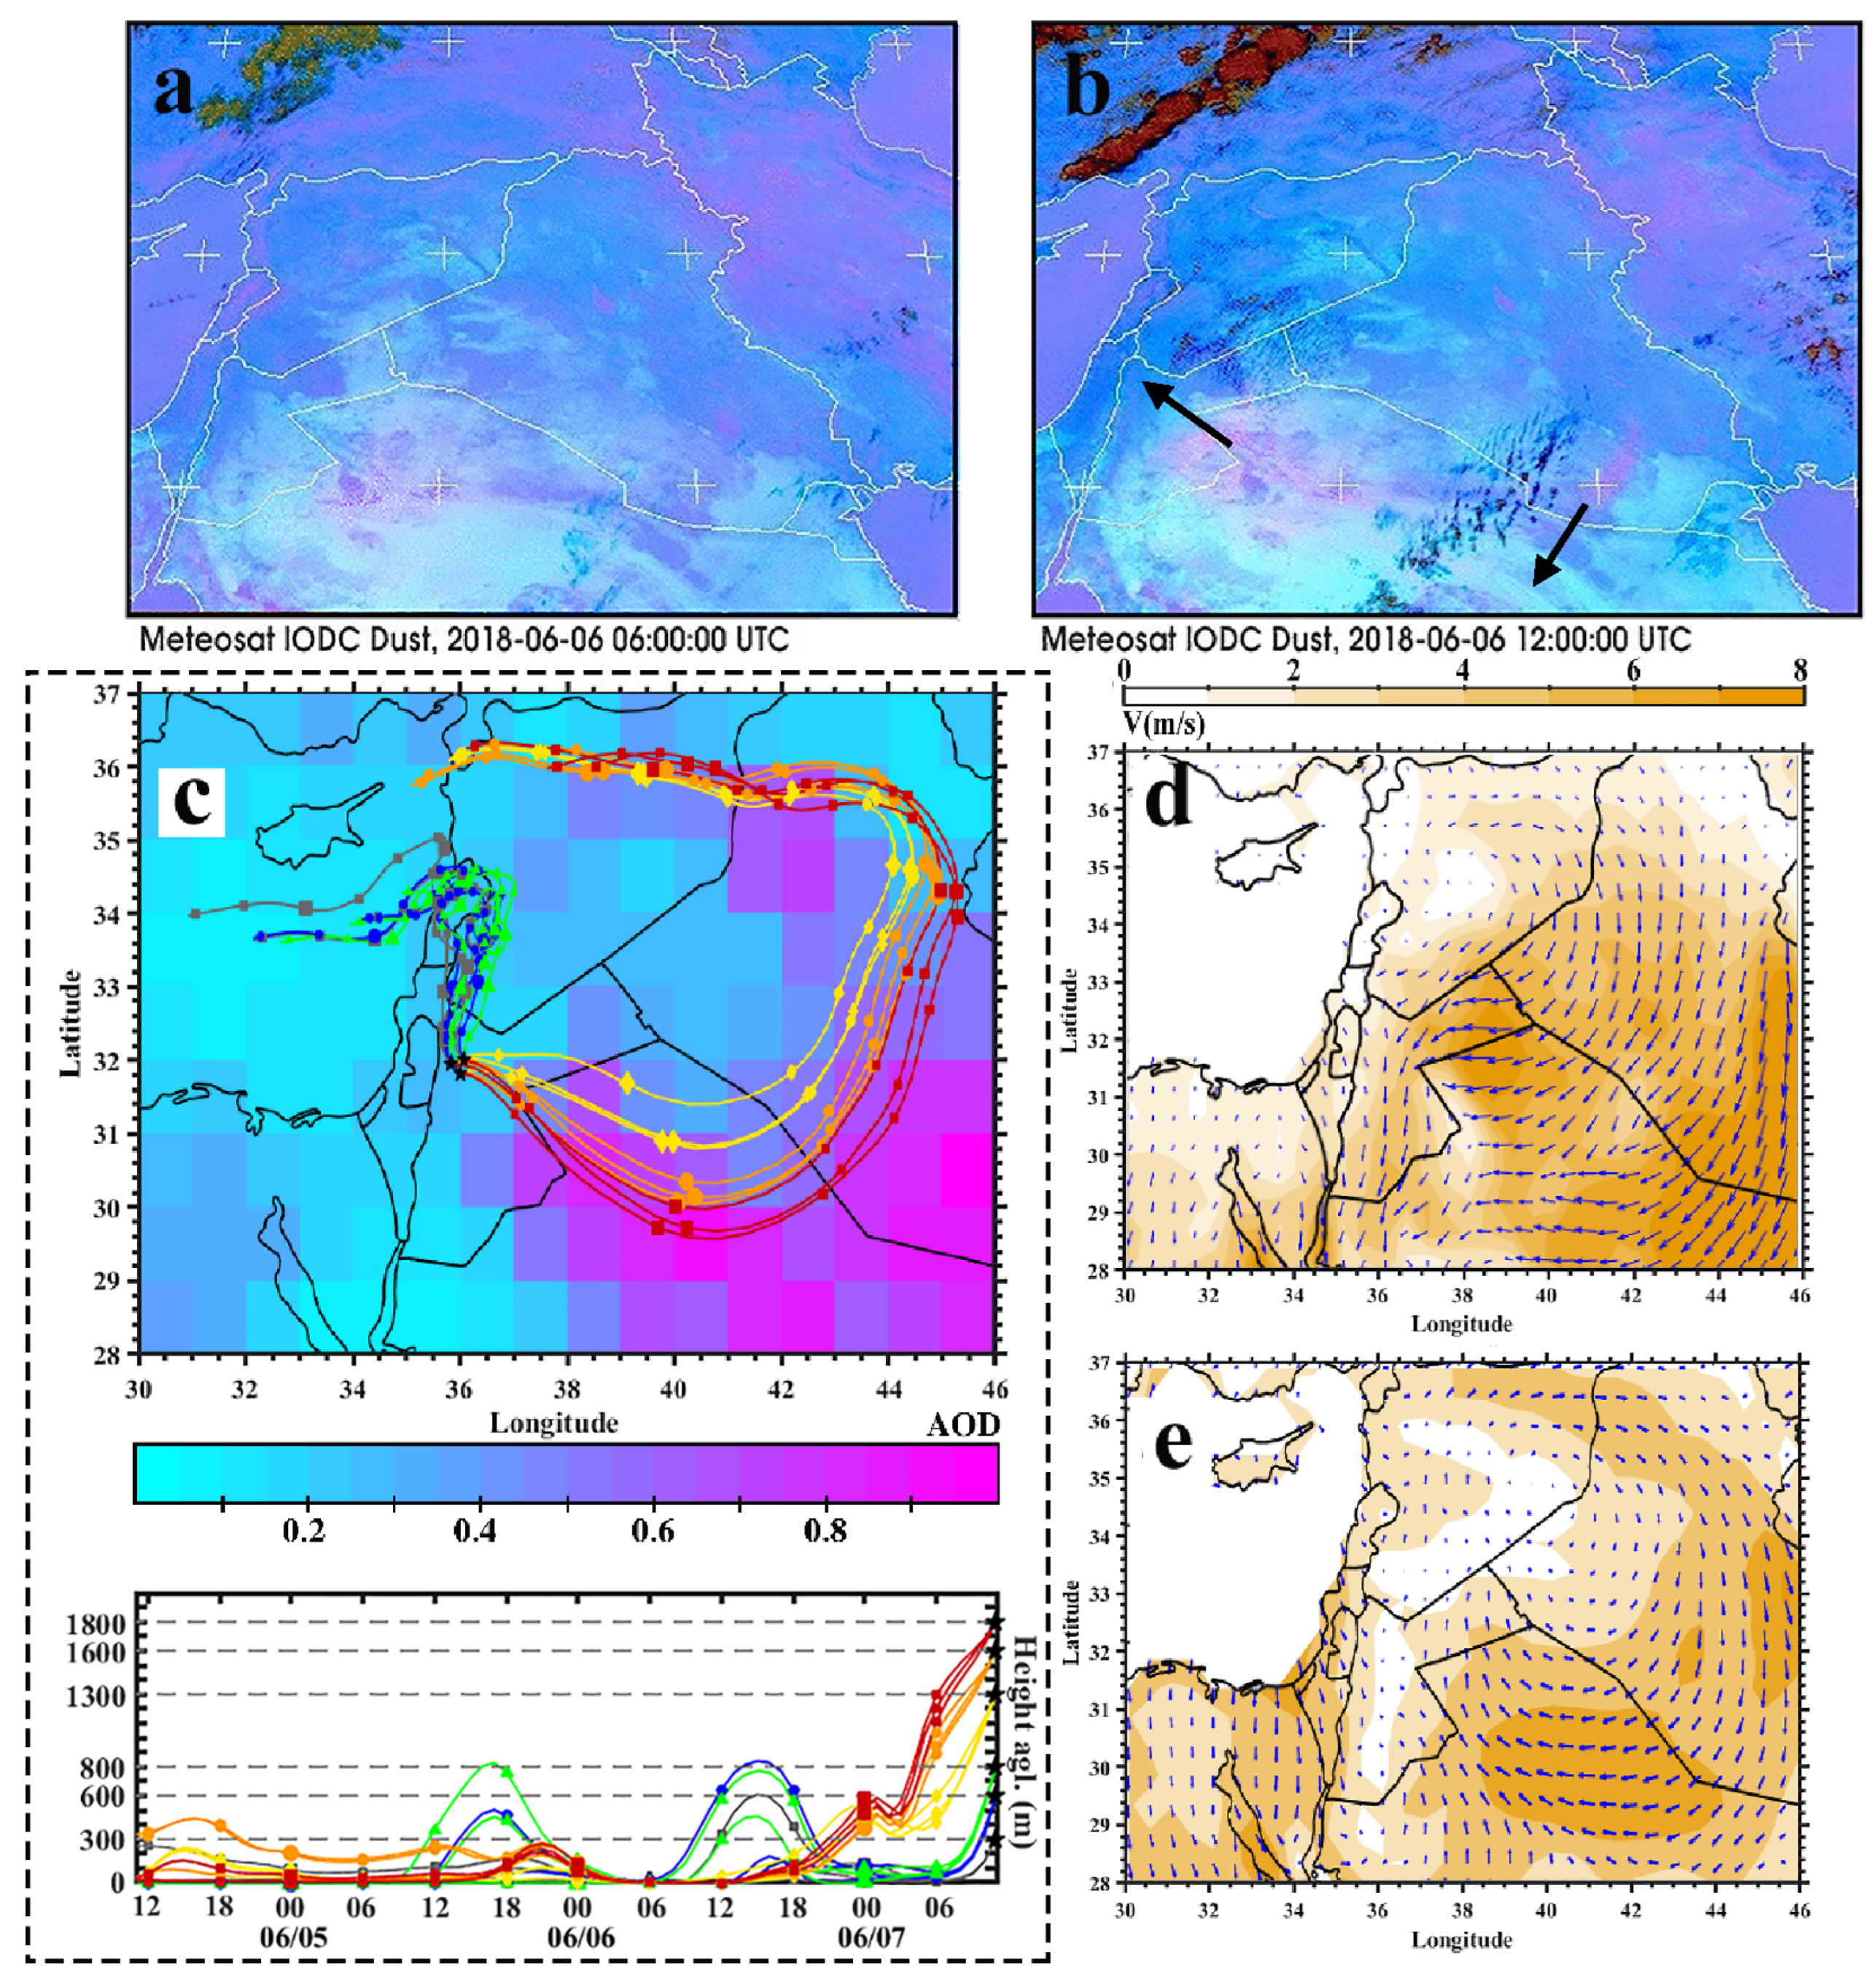
To analyze the source and the transport path of different aerosol types, a series of evidence is used as follows. As the first evidence, emissions and subsequent transport of dust aerosols are depicted in the RGB composite pictures. Figure 5a,b illustrates the RGB dust composite retrieved from the MSG SEVIRI measurements at 06:00 UTC and 12:00 UTC, 6 June 2018. The pale pink color in Figure 5a depicts the emission of two dust plumes from the south of Iraq and northwest of Saudi Arabia at 06:00 UTC. In the following hours (12:00 UTC), these two dust plumes stretched from their sources in the direction that are shown by black arrows in Figure 5b. According to this figure, the dust plume over the south of Iraq moved toward Saudi Arabia, and the plume originating from northwest Saudi Arabia was transported toward Jordan. As a second line of evidence, the 72 h backward trajectories of air masses were calculated using the HYSPLIT model. The initial time of the model is 12:00 UTC, 7 June 2018. The starting location contains three different points in a triangle format that cover the region of Amman. The HYSPLIT trajectories were calculated for six different heights, including 300 m, 600 m, and 800 m agl as representative of the lower layer. Meanwhile, the heights 1300 m, 1600 m, and 1800 were chosen for starting heights as representative of the upper layer (Figure 5c).
According to Figure 5c, trajectories belonging to the upper layer (red, orange, and yellow lines) passed through deserts between Saudi Arabia and Jordan, and returned to central Iraq at noon on 6 June 2018. Although the HYSPLIT back trajectories path is consistent with dust source identification from the RGB dust composite, it can not determine the exact source of dust plumes that reached over Amman’s atmosphere. As another line of evidence, Aqua-MODIS aerosol optical depth with 1 degree spatial resolution has also been shown in the background of Figure 5c (cool color bar on the background). The spatial distribution of indicates that the aerosol optical depth was enhanced over central Iraq, northwest of Saudi Arabia, and deserts on the border of Saudi Arabia and Jordan. Finally, the ECMWF reanalysis of surface wind speed and direction at 06:00 UTC and 12:00 UTC is presented in Figure 5d,e. Wind patterns reveal there was a strong surface wind in the shape of a cyclone blowing across Iraq and especially northwest Saudi Arabia. Figure 5e shows the edge of the cyclone extending from central Iraq and reaching the desert located in northwest Saudi Arabia. The surface wind speed reached almost 10 m/s over the Al-Nefud desert and south of Iraq. Considering all evidence, the coarse-mode dust particles observed over Amman’s atmosphere originated from northwest Saudi Arabia on 6 June 2018 and were transported toward Jordan in the following hours. On the other hand, trajectories belonging to the lower layer (green, blue, and gray lines) turned back to the northwest of Amman. The backward trajectories confirm that aerosols within the lower layer, which mainly include fine-mode dust and urban pollution (Figure 4e), originated from the local industrial region.
3.3. Case Study 2: 25 July 2018
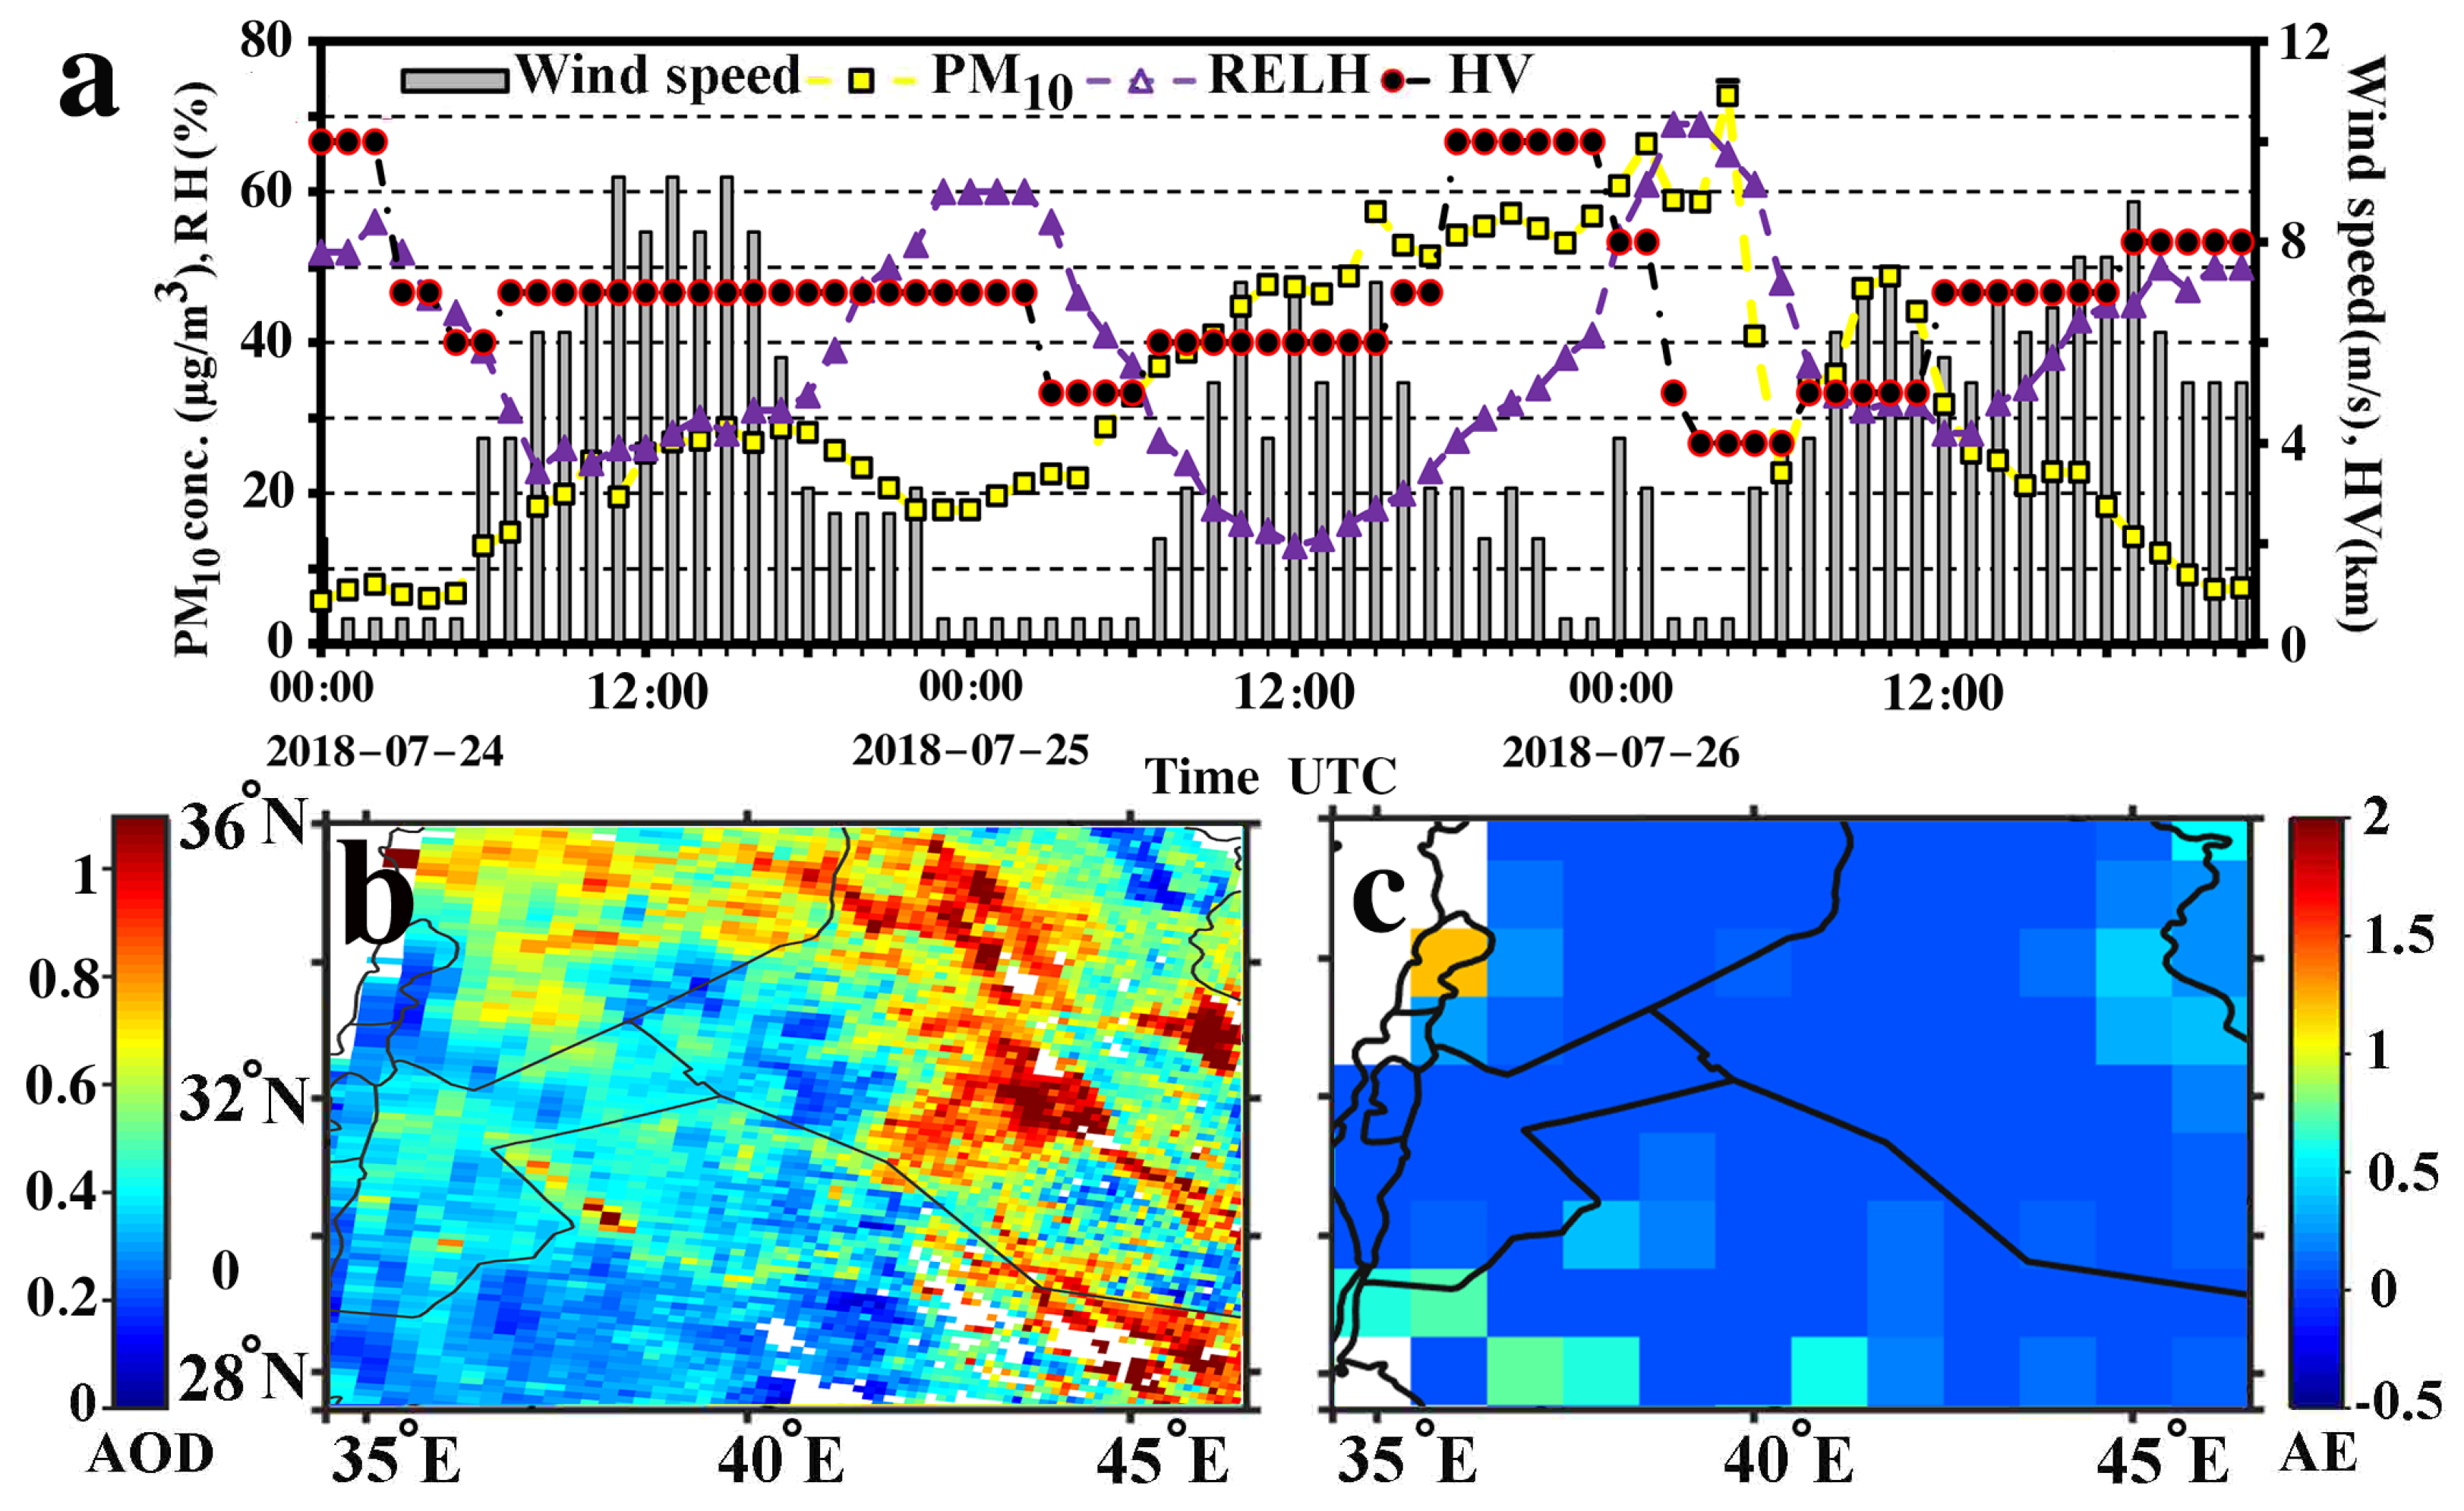
Figure 6a illustrates the time evolution of the PM concentration in addition to the relative humidity (RH), horizontal visibility (HV), and surface wind speed recordings. The measurement was performed by use of a series of ground-based instruments (Section 2.2) installed on the rooftop of the Department of Physics on the campus of the University of Jordan, Amman (Section 2.1). This SDS case is categorized as an S-type and reached Amman’s atmosphere at around noon on 25 July and lasted for one day over the measurement location.
Figure 6a depicts a gusty wind with a speed of more than 6 m/s that brought an airborne dust plume over Amman. During this selected SDS episode, the PM concentration increased to ∼70 , the horizontal visibility fell to ∼4 km, and the relative humidity decreased to lower than 20%. Figure 6b,c shows the AOD550 of Terra-MODIS with 10 km resolution (MOD04) and angström exponent (AE) with 1 degree resolution (MOD08 and MYD08), respectively. The large value for AOD550 and small value for AE (<0.5) indicate that coarse-mode dust particles were dominant over Amman.
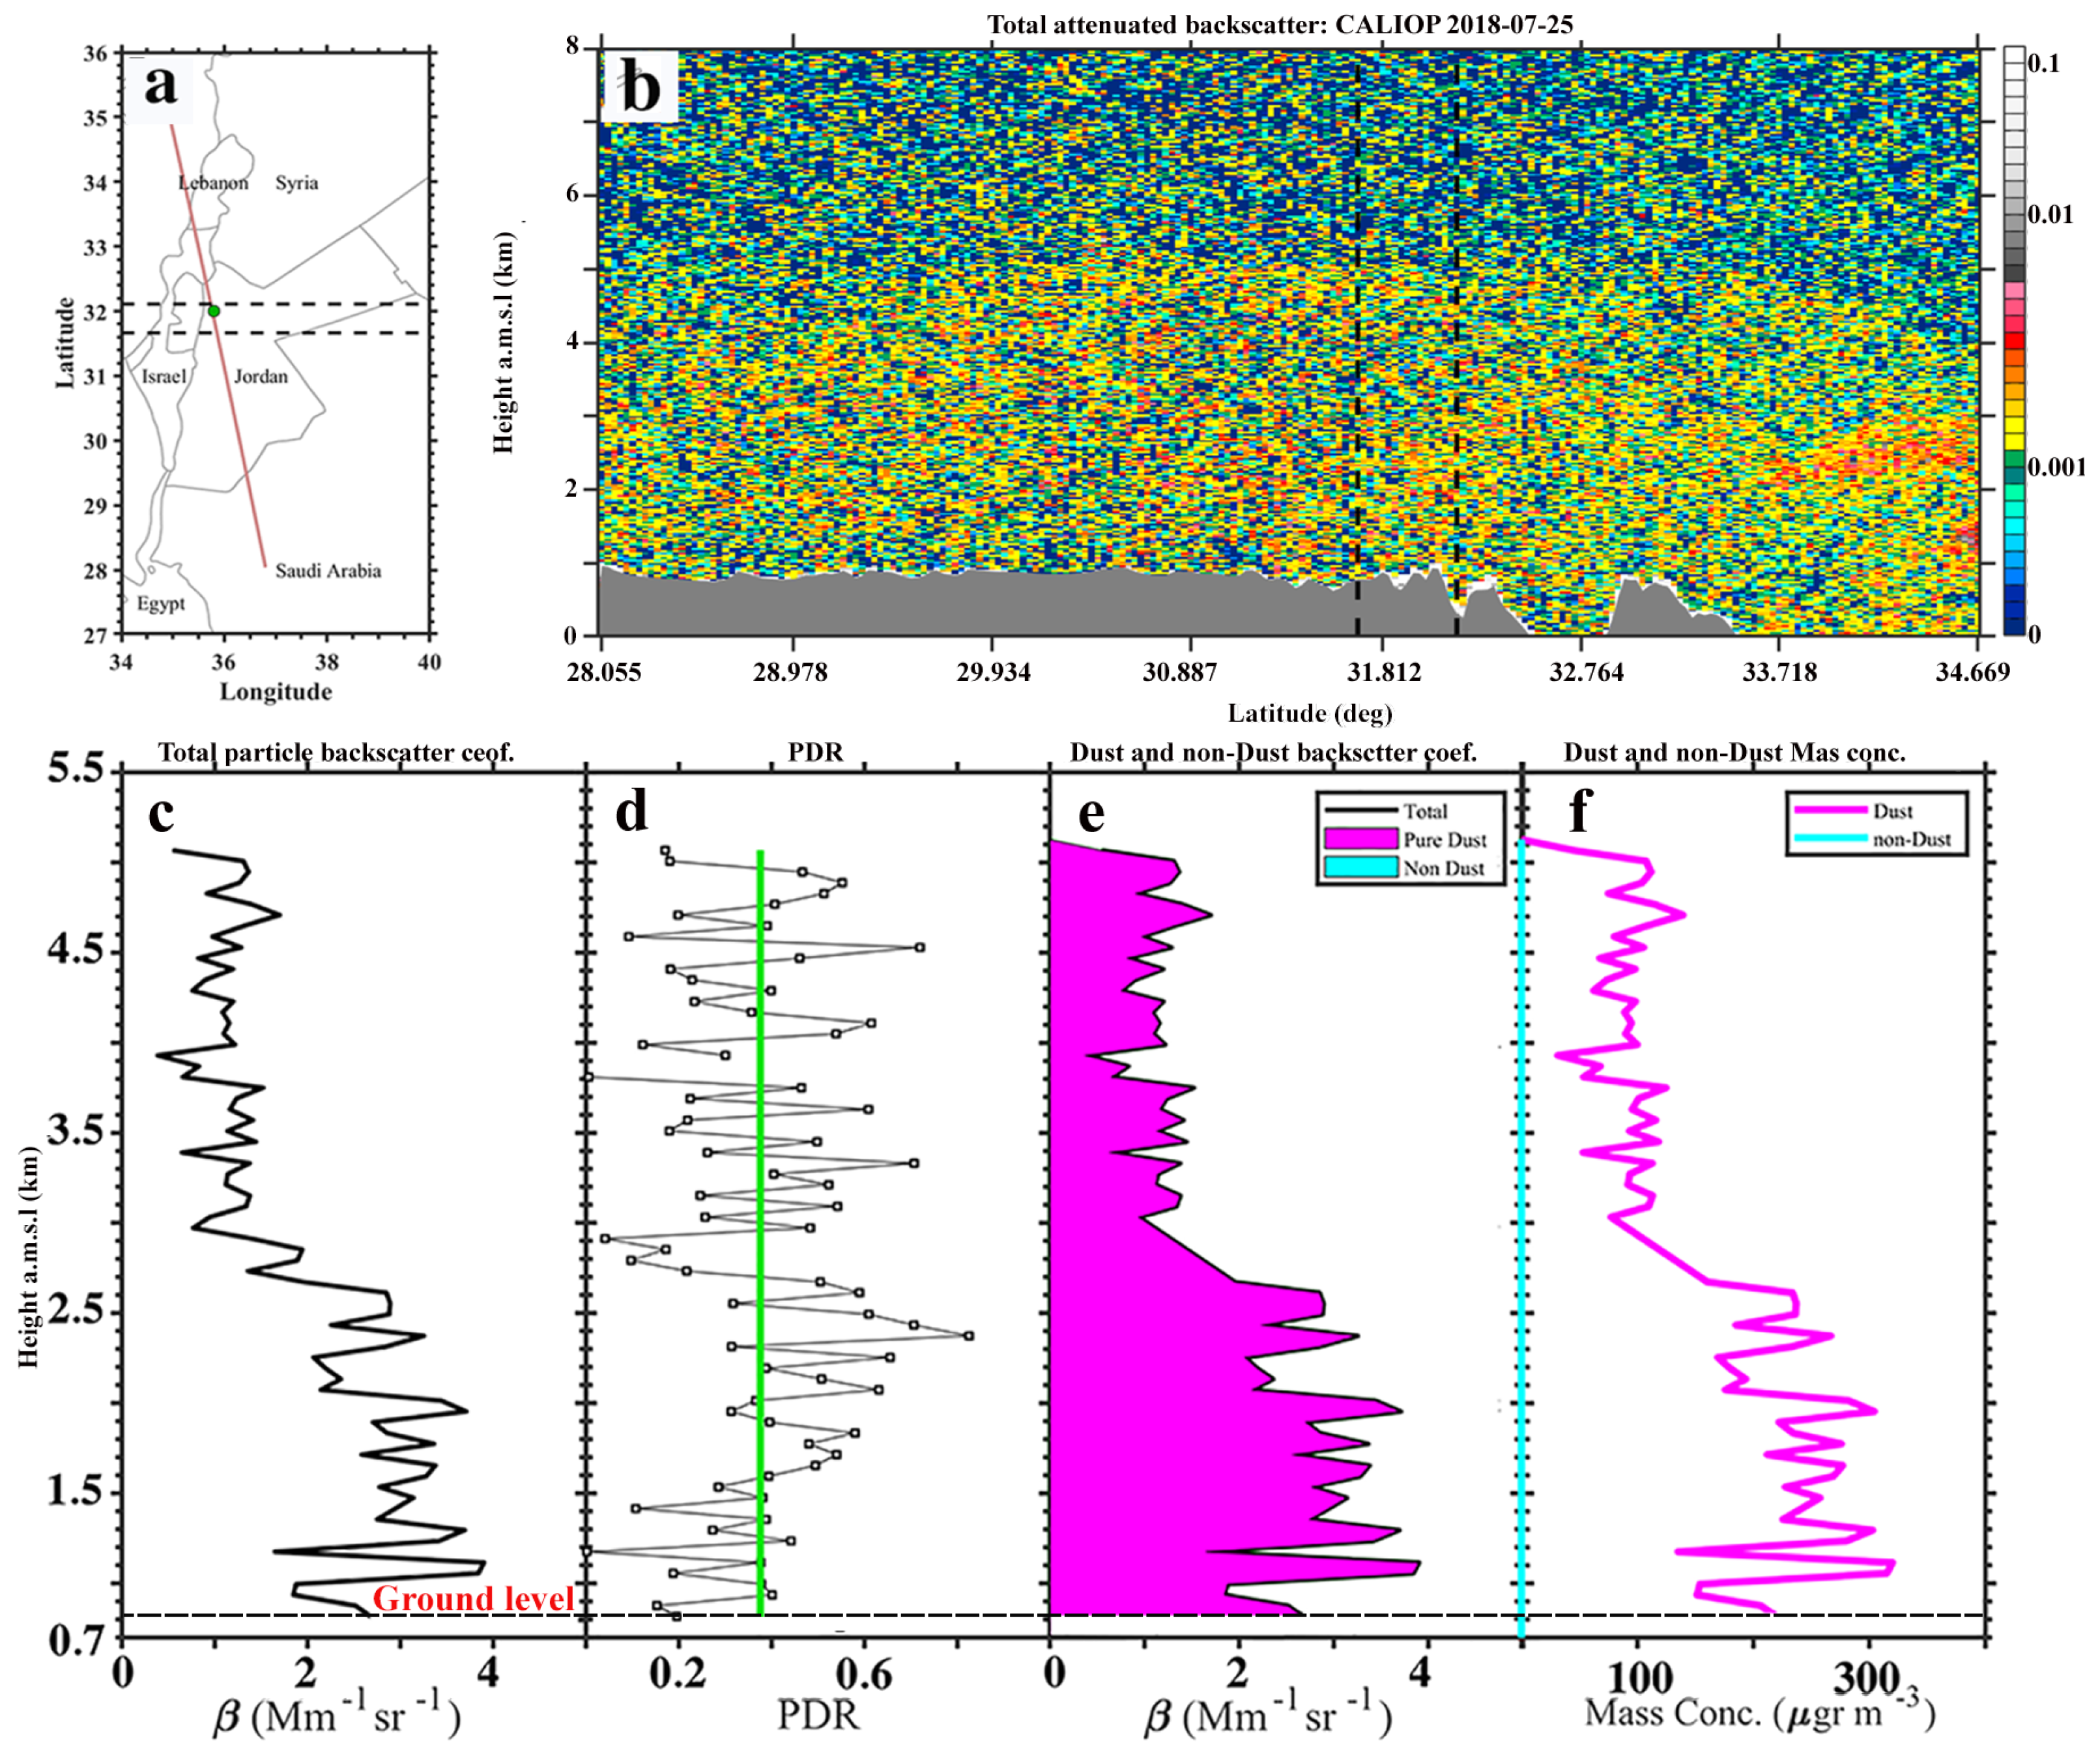
Figure 7a depicts the CALIPSO satellite ground track and the location of Amman by a red line and green circle, respectively. The cross-section of the total attenuated backscatter coefficient in arbitrary units (AU) captured by the satellite CALIOP lidar is shown in Figure 7b. The bottom horizontal axis shows the along-track latitude, and the vertical axis shows the height above mean sea level (amsl). The existence of a lofted dust layer that extends from the surface up to 4.5 km in height is clear in Figure 7b. The CALIOP signals within the dashed area in Figure 7a,b are averaged to retrieve the vertical profile of the optical and micro-physical properties of atmospheric aerosols. Due to geographical features of Amman and CALIOP lidar ground track, the elevation of the region of interest is ∼800 m amsl in this case (dashed black line in Figure 7c–f). In the first step, the vertical profile of the and are retrieved from CALIOP data (Figure 7c,d) [23]. Figure 7d illustrates that there are very low values () and very unrealistic high values (), but the average of is always greater than 0.20. Therefore, it is concluded that there is a dust layer that extends from the ground surface up to ∼4.5 km above the ground level (agl), and the average of the for this layer is ∼0.39. Then, by considering the average values of the , a one-step POLIPHON method (Section 2.5) was used to determine the coarse-mode dust contribution in the vertical structure of the atmosphere (Figure 7e,f). As it is illustrated in Figure 7e, the atmosphere only contains coarse-mode dust particles. Figure 7f shows the vertical distribution of mass concentration for each aerosol type that is retrieved using appropriate conversion factors (Equation (3a–c) and Table 2).
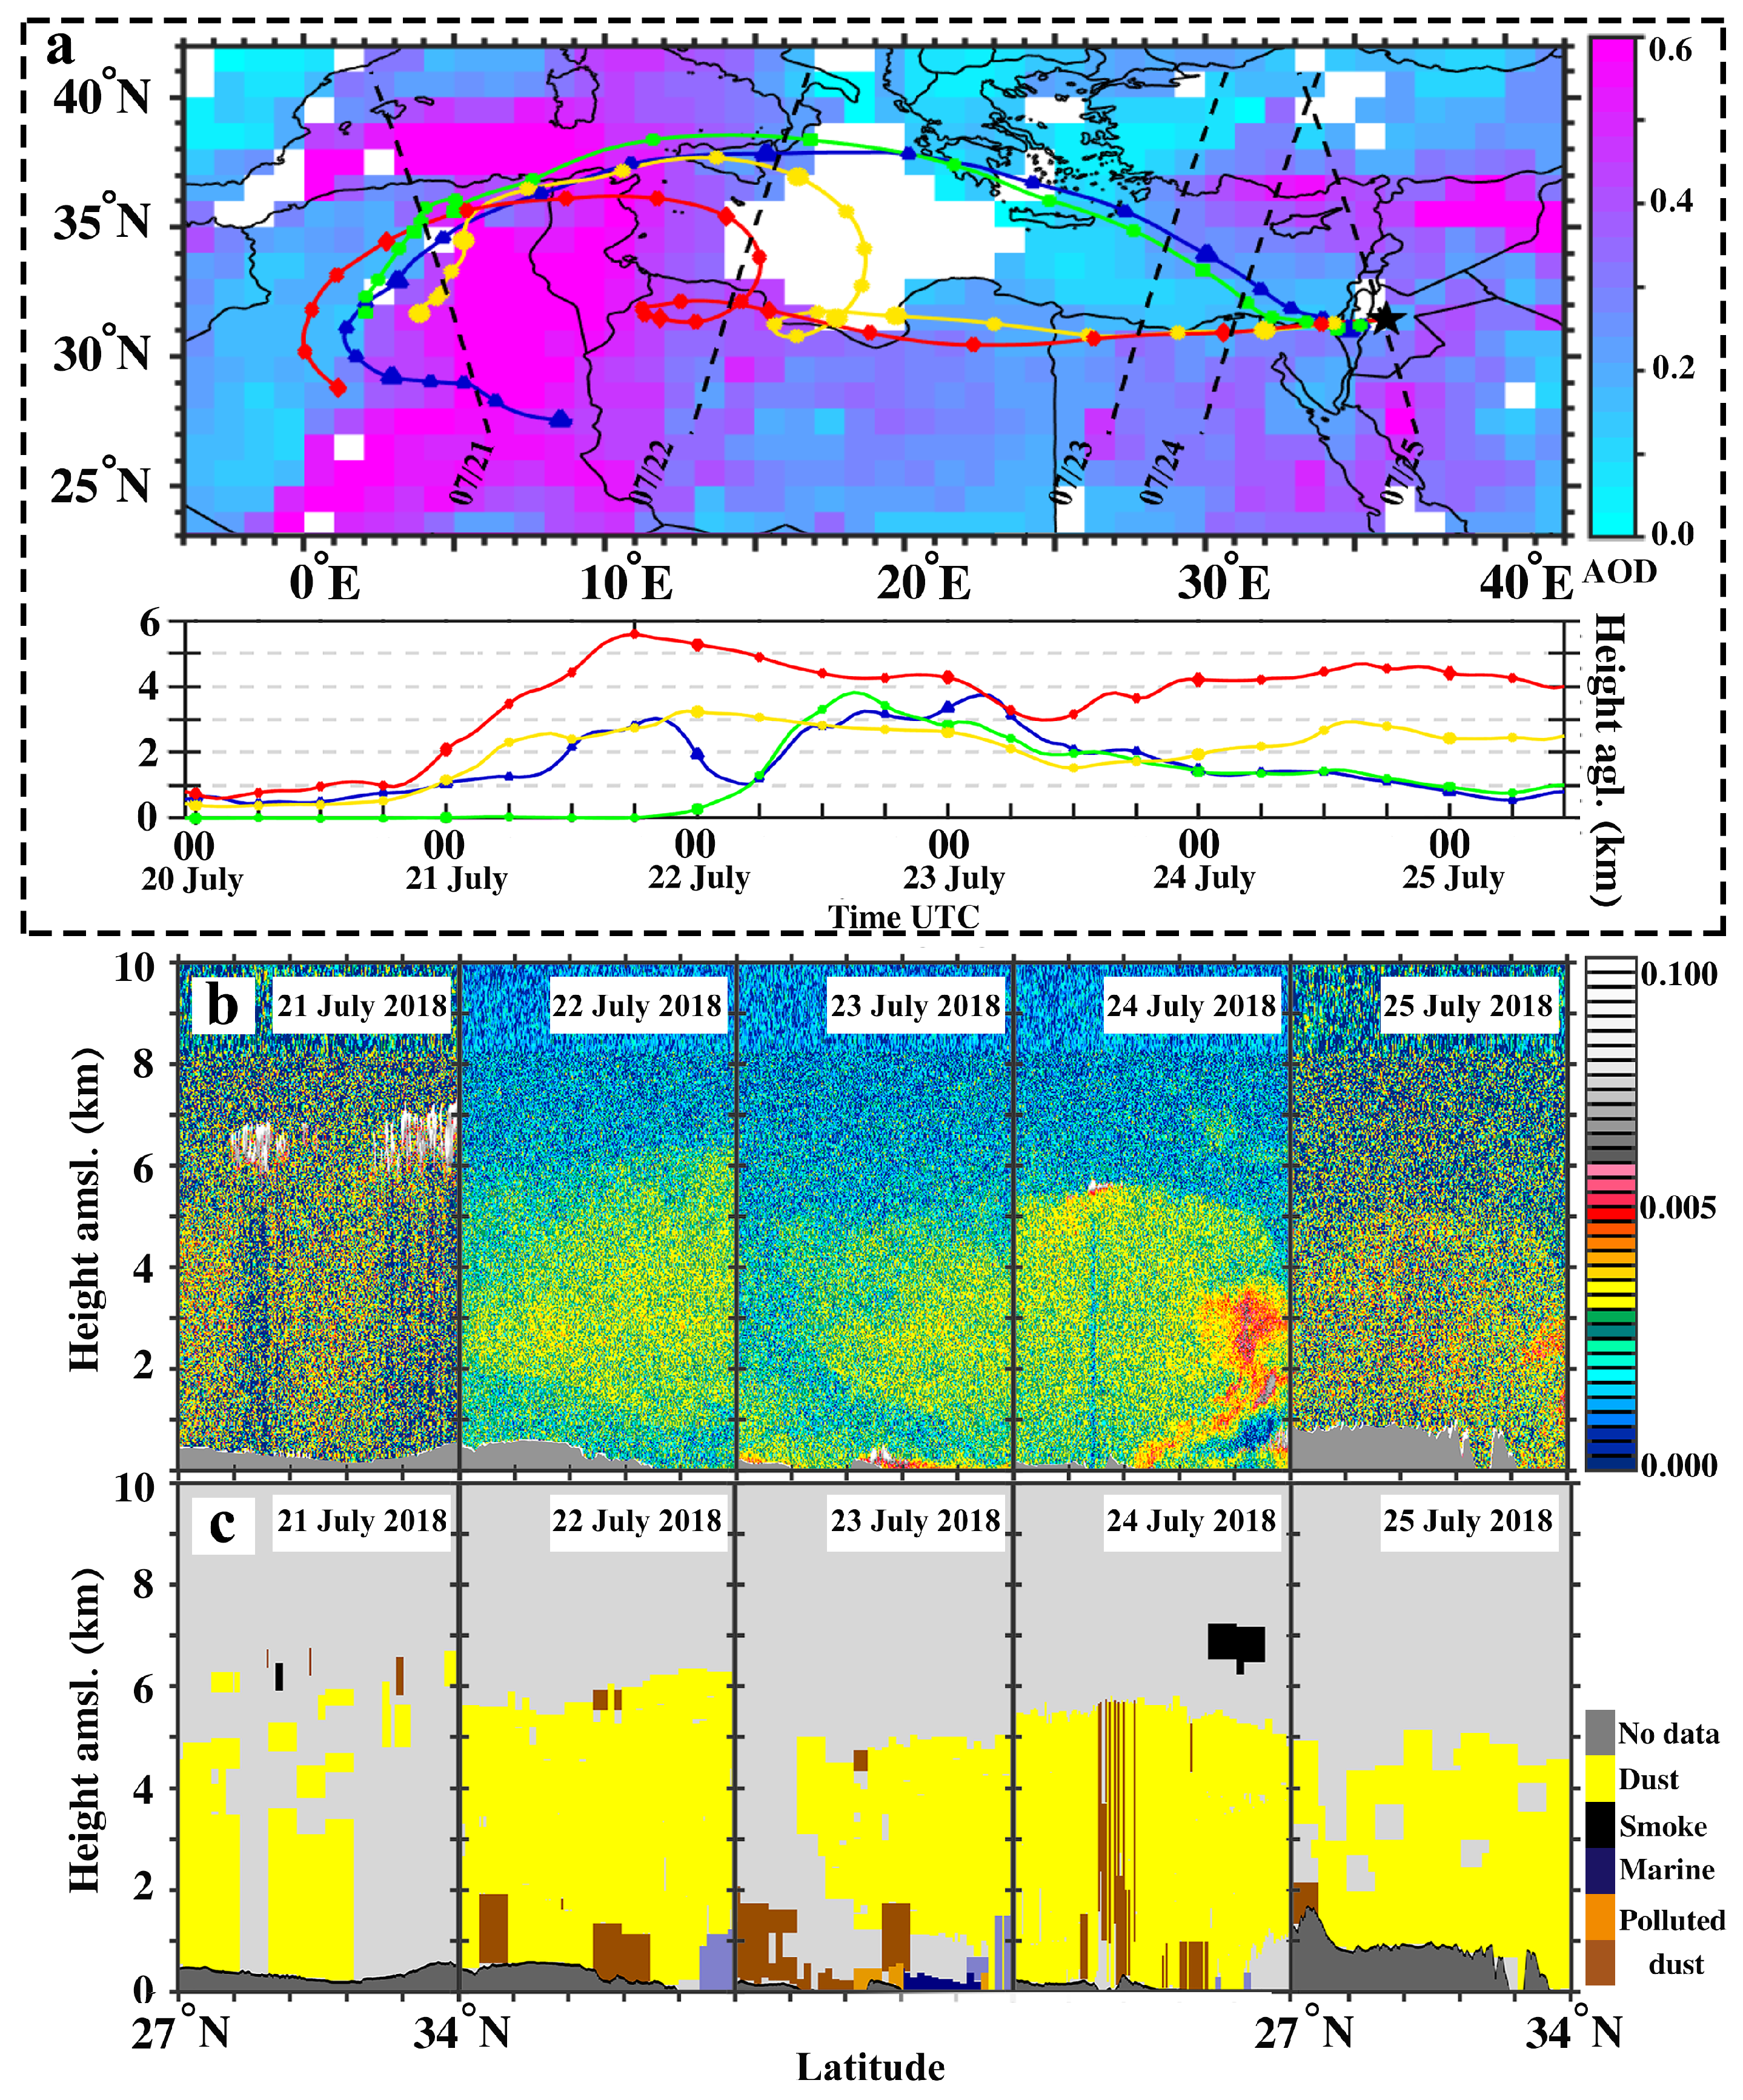
Figure 8a shows the 132 h backward trajectory analysis that was performed using the HYSPLIT model to determine the origin and the sources of the observed aerosol layers. The initial time of the model is 12:00 UTC, 25 July 2018. The starting location is Amman ( N, E, red balloon in Figure 1b), and the backward trajectories are calculated for 4 different heights including 800 m, 1 km, 1.5 km, and 4 km agl. All trajectories return to the northwest of the Sahara (Figure 8a). Aqua-MODIS aerosol optical depth with 1 degree spatial resolution captured on 21 July is shown in the background of Figure 8a (cool color bar in the background). The AOD550 greater than 0.40 over the northwest Sahara, in addition to the HYSPLIT trajectory analysis, confirms that coarse-mode dust particles originated from the mentioned region. The CALIPSO ground track for each day during dust transport is indicated by black dotted lines in Figure 8a. The attenuated backscatter coefficient, as well as the CALIPSO aerosol subtype classification, are shown for corresponding days in Figure 8b,c, respectively. Figure 8 clearly illustrates the emission of dust aerosols on 21 July and its transport toward Amman in the next 4 days.
4. Discussion
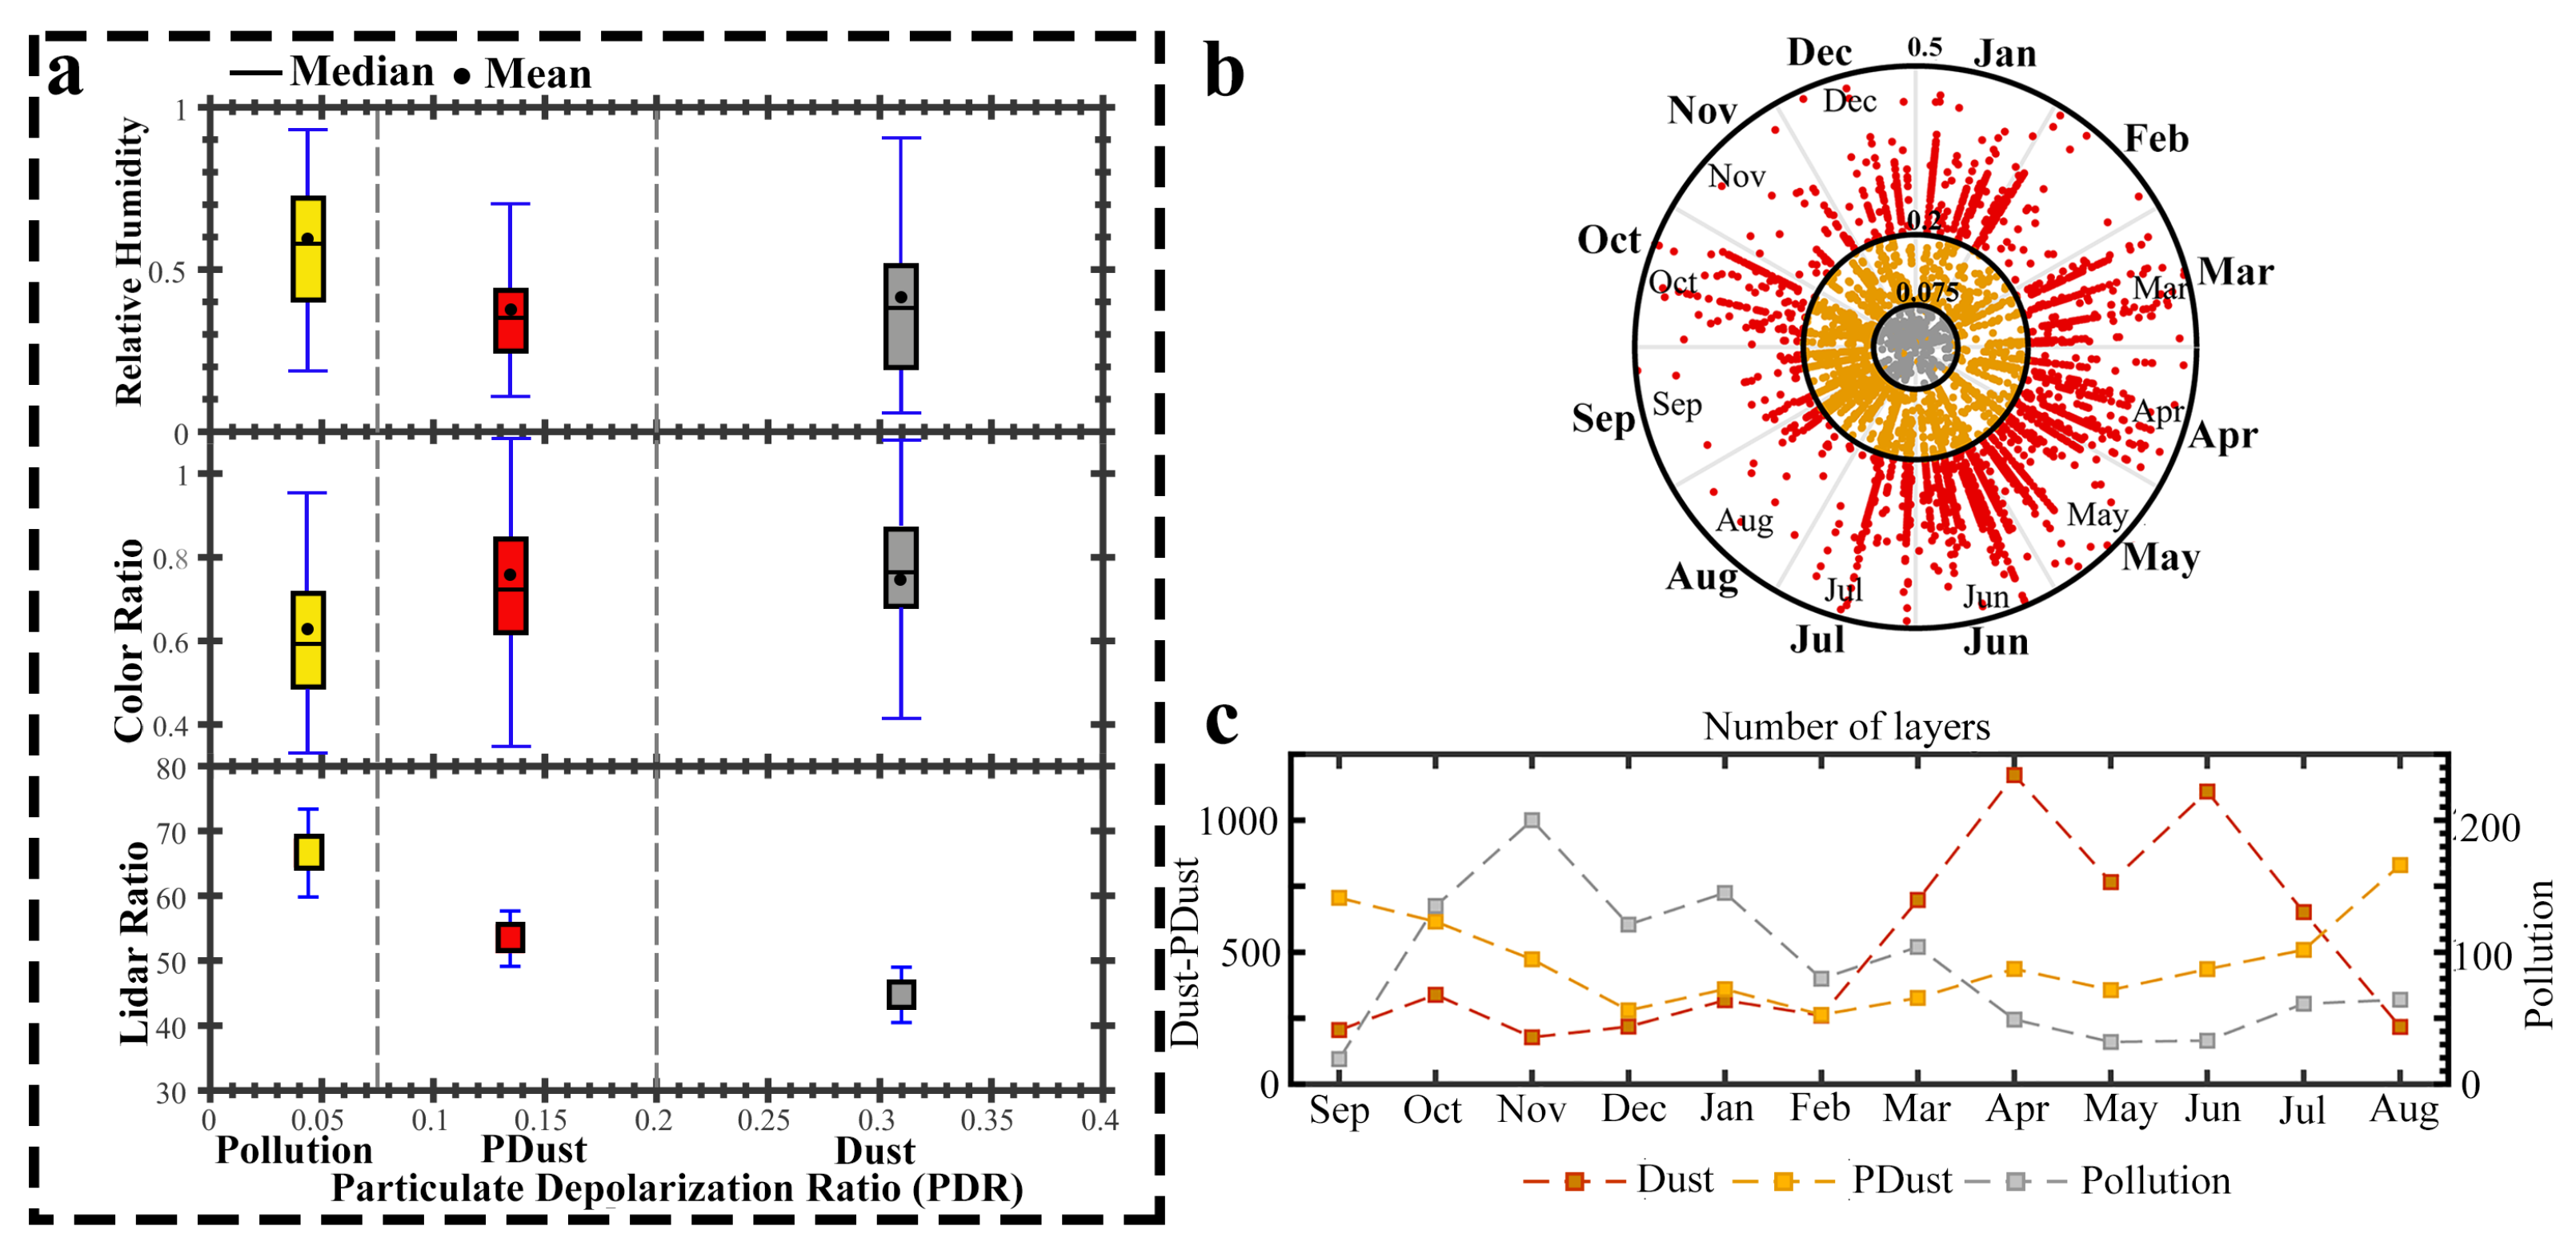
To give a comprehensive overview of the typical aerosol conditions in the atmosphere above Amman, all CALIOP recordings over the study region (dashed black box in Figure 1a) have been used during a 24-month period from January 2018 to December 2019. The optical properties of the observed aerosol layers (Section 2.3.1) are utilized to perform statistical analysis. These optical properties include the linear particle depolarization ratio and the color ratio, which are directly measured by the CALIOP, and the assumed lidar ratio. The CALIOP version 4 (V4) level 2 released an improved lidar ratio selection algorithm with an associated uncertainty [32]. An overview of mean particle depolarization ratio for each layer is illustrated in Figure 9a. The figure presents cumulative bar plots with the median (black horizontal line), mean (black circle), the 25–75 percentile (box), and the 5–95 percentile (whiskers) for all classifying parameters. The figure highlights the discriminatory power of and lidar ratio to classify the fine-mode, coarse-mode dust, and non-dust aerosols.
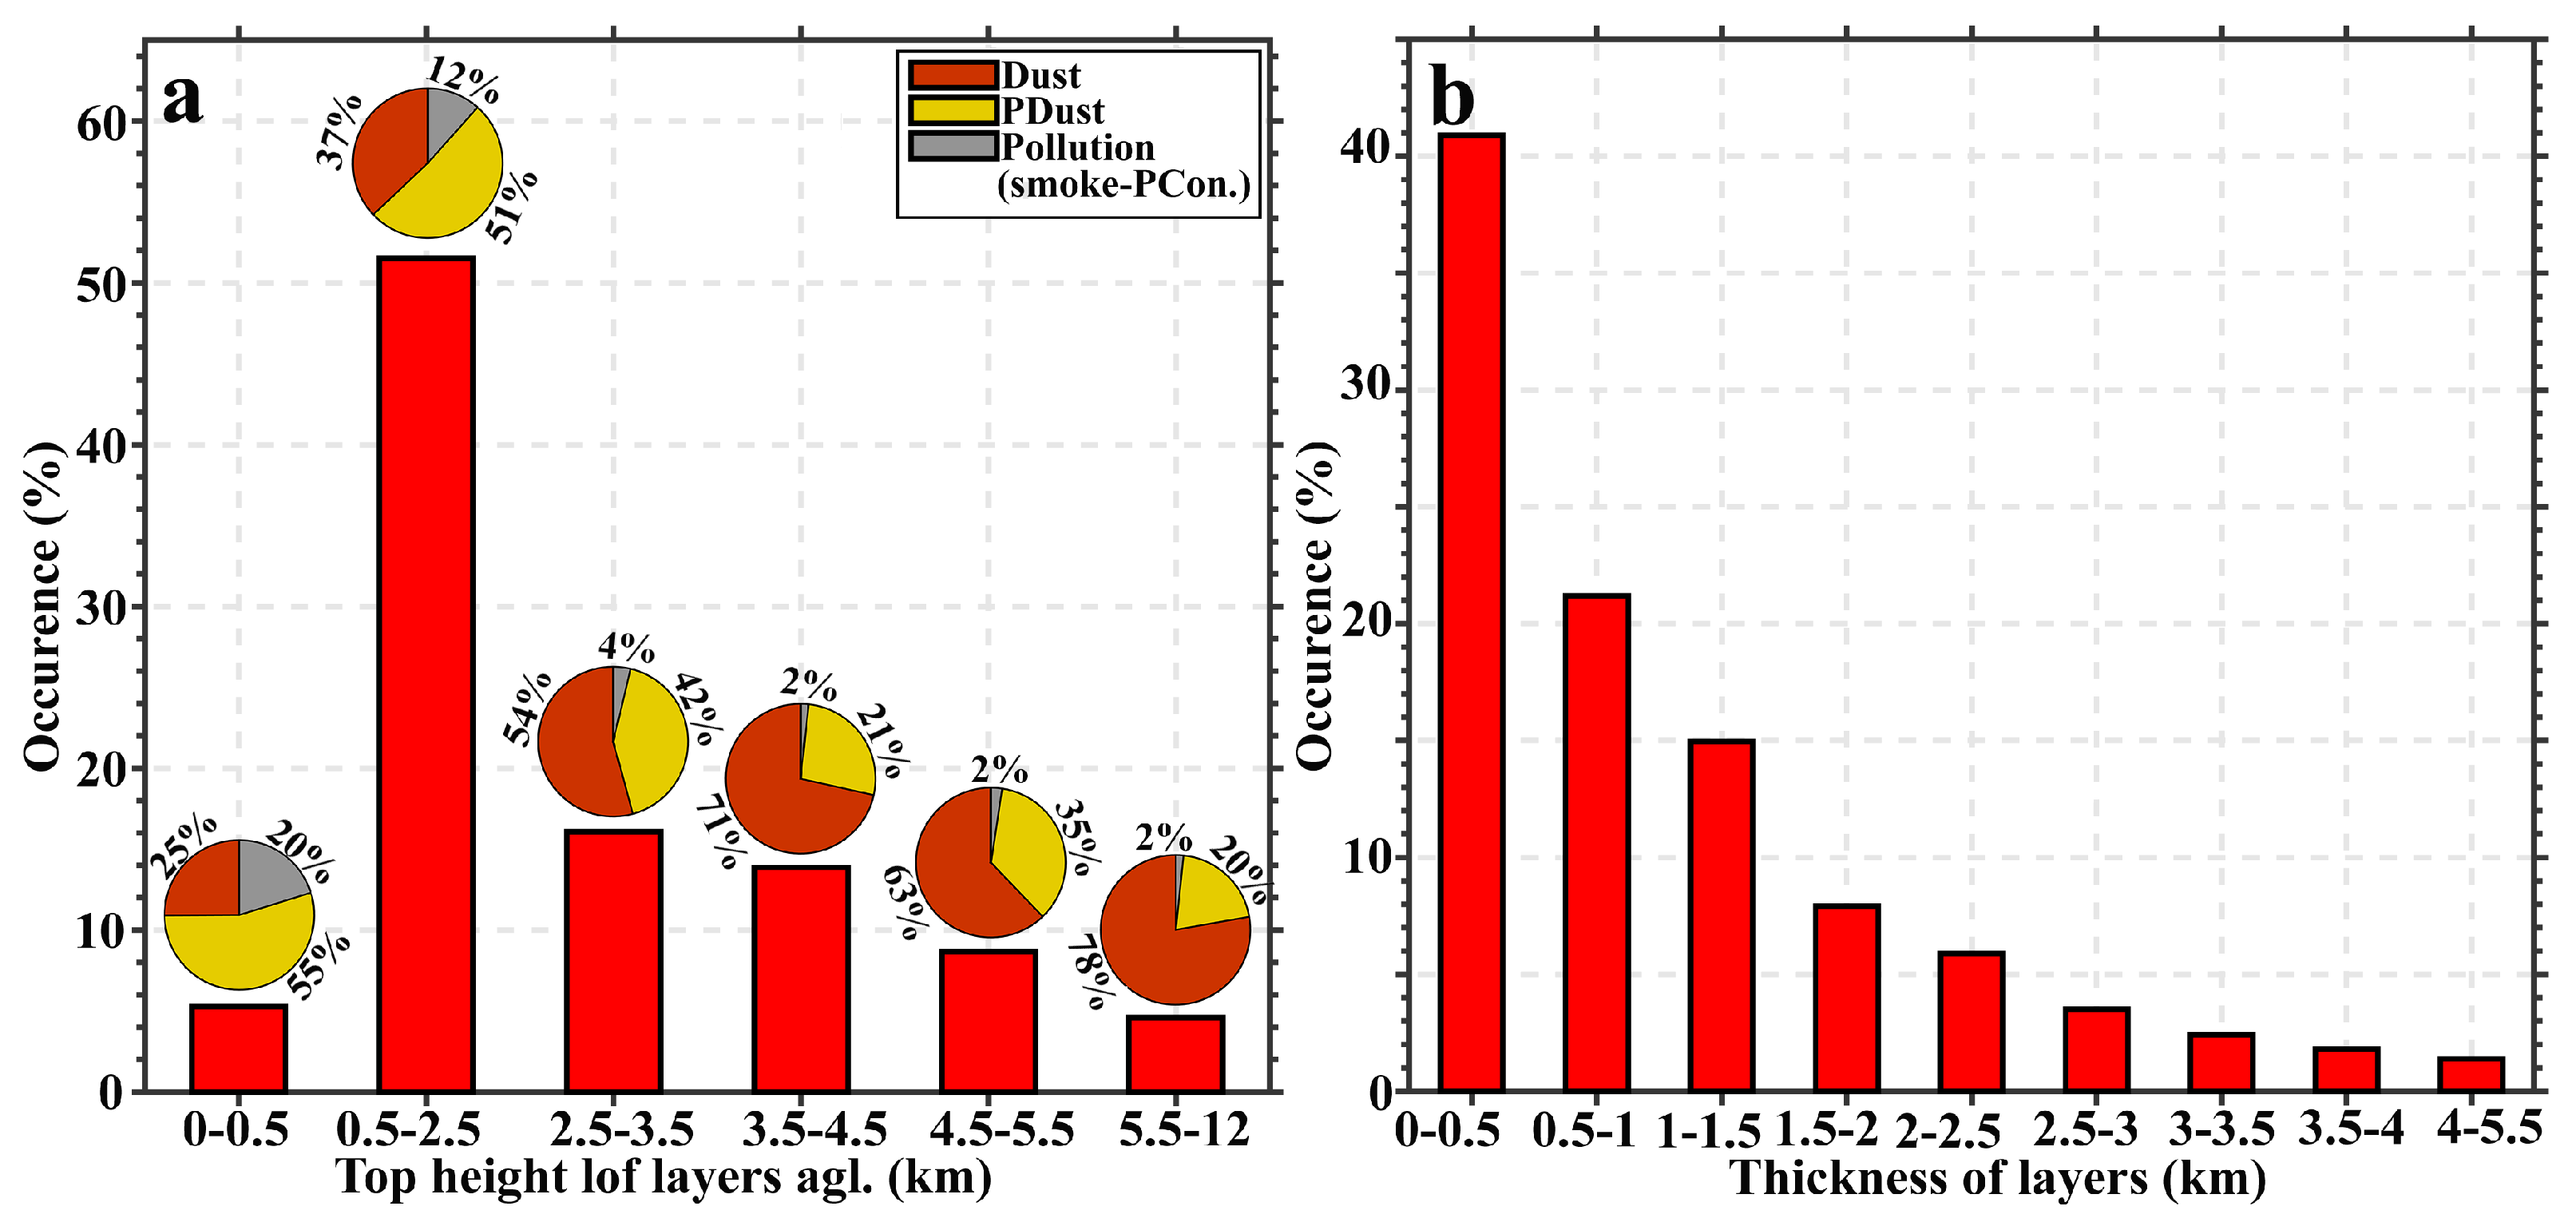
According to this result, three different aerosol types are recognized in Amman’s atmosphere. As it is shown in the lowest panel of Figure 9a, aerosols with 0 < 0.075 and lidar ratio ∼ 60 Sr are categorized as pollution. The second type is polluted dust with 0.075 < 0.20 and a lidar ratio of ∼ 55 Sr. These aerosols are the most prominent aerosol types in the atmosphere above Amman. The third aerosol type is dust particles with 0.20 < 0.40 and a lidar ratio of ∼ 40 Sr. The middle panel of Figure 9a shows that the color ratio associated with pollution, polluted dust, and dust particles is 0.6, 0.7, and 0.8, respectively. The upper panel of Figure 9a shows the relative humidity corresponding to each type. These results indicate that air that contains pollution aerosols is more humid (RH) in comparison with dust particles (RH). Figure 9b depicts the variation of all measured particle depolarization ratios during the study period using the polar scatter plot. The aerosol type classification is performed based on Figure 9a. In addition, the seasonal behavior of three different aerosol types is shown in Figure 9c. This figure indicates that the maximum occurrence of observed layers containing dust particles took place from March to July. On the other hand, aerosols that are categorized as pollution are more frequently observed from September to February. The number of observed layers that contained polluted dust particles is approximately the same throughout the year. Figure 10 illustrates the histogram of lofted-layer top heights and their depths in the atmosphere above Amman during the study period. Both values were extracted from the CALIOP aerosol layer products. For each layer, the percentage of different aerosol types is shown by pie plots in Figure 9a. The highest frequency of occurrences was observed for layers with a top height from 0.5 to 2.5 km, with a second smaller peak at 3.5 km. Regarding the depths of the observed lofted layers, the maximum frequency occurs in 40% of cases below 0.5 km in depth and in a few cases with less than 4.5 km. Figure 9a depicts that for layers with a top height lower than 500 m agl, the atmosphere was mostly impacted by polluted dust and pollution aerosols. On the other hand, for layers with a top height upper than 2500 m agl, the atmosphere was contaminated by polarizing dust particles.
5. Conclusions
Simultaneous ground-based and satellite observations were utilized to investigate atmospheric air pollution over Amman, Jordan. The measurements were performed during a 24-month period from January 2018 to the end of December 2019. For the first time, the vertical distributions of aerosol spatial, optical, and physical properties over Amman’s atmosphere were studied by use of the satellite CALIOP lidar. The aerosol profile and aerosol layer products version 4.21, level 2 with 5 km horizontal resolution, were used in this study. The particle backscatter coefficient () and particle depolarization ratio () are two important parameters retrieved from the aerosol profile products of CALIOP data. Using these two parameters, the one- and two-step POLIPHON approaches were applied to retrieve the vertical profile of optical and physical properties of coarse-mode, fine-mode, and non-dust particles. On the other hand, aerosol layer products were also used to do climatological studies during the study period. Sub-type classification and its number of occurrences, top height, thickness of the lofted aerosol layer, and the particle depolarization ratio (PDR) of detected layers are four parameters extracted from this product.
In this study, two illustrative SDS cases have been investigated in detail. The first case was of the SL-type and reached Amman’s atmosphere at around 06:00 AM and lasted until 02:00 PM on 7 June 2018. It originated from northwest Saudi Arabia and was transported toward Jordan. A gusty wind with a speed of more than 10 m/s brought an airborne dust plume over Amman. By the arrival of the SDS in the measurement location, the PM concentration rose to about 120 , the HV dropped to about 4 km, and the RH reached values below 20%. The CALIOP signals across the study region are averaged to retrieve the vertical profile of the optical properties ( and ) and mass concentration of atmospheric aerosols. According to these results, there was a two-layer structure in the vertical profiles of and . The lower layer extends from the ground surface up to ∼700 m agl with an average of the of ∼0.14. The upper layer extends from 700 m agl to 2500 agl, and the layer average of is ∼0.39. Considering the average values of the , a two-step POLIPHON method was used to separate coarse-mode, fine-mode, and non-dust contributions in the aerosol mixture within the vertical structure of the atmosphere. In the lower layer, fine-mode dust particles are the dominant aerosol type, while it is mixed with anthropogenic (non-dust) pollution. Meanwhile, the upper layer only contains coarse-mode dust particles. The vertical distribution of mass concentration for each aerosol type is also retrieved using appropriate conversion factors.
The second SDS case is categorized as an S-type and reached Amman’s atmosphere at around 12:00 UTC on 25 July and lasted for one day over the measurement location. The 132-h backward trajectory analysis was calculated for different heights including 800 m, 1 km, 1.5 km, and 4 km. According to this result, all trajectories return northwest of the Sahara. Ground-based measurements depict a gusty wind with a speed of more than 10 m/s brought an airborne dust plume over Amman. During this selected SDS episode, the PM concentration increased to ∼70 , the horizontal visibility fell to ∼4 km, and the relative humidity decreased to lower than 20%. Again, the vertical profile of the optical and micro-physical properties of atmospheric aerosols are retrieved from the CALIOP observation. A dust layer extended from the ground surface up to ∼4.5 km agl, and the layer average of the is ∼0.39.
The seasonal behavior of three different aerosol types indicates that the maximum occurrence of observed layers containing dust particles happened from March to July. On the other hand, pollution is more observed from September to February. The number of layers containing polluted dust particles is approximately the same throughout the year. The histogram of lofted-layer top heights and their depths in the atmosphere above Amman, during the study period, were extracted from the CALIOP aerosol layer products. According to these results, layers with a top height of 0.5 km to 2.5 km occurred with the highest frequency, with a second smaller peak at 3.5 km. Concerning the depths of the observed lofted layers, the maximum frequency of the lofted layers (40% of cases) were observed with layer thickness below 0.5 km. There were also a few cases with a layer thickness fewer than 4.5 km. For layers with a top height lower than 500 m agl, the atmosphere was mostly impacted by the polluted dust and pollution aerosols. On the other hand, for layers with a top height higher than 2500 m agl, the atmosphere was contaminated by depolarizing dust particles.
Author Contributions
Conceptualization, T.H. and H.P.; methodology, T.H. and H.P.; software, H.P. and F.B.; validation, T.H., H.P. and F.B.; formal analysis, T.H., H.P. and F.B.; investigation, T.H., H.P. and F.B.; resources, T.H. and H.P.; data curation, T.H., H.P. and F.B.; writing—original draft preparation, T.H and H.P.; writing—review and editing, T.H., H.P. and F.B.; visualization, H.P. and F.B.; supervision, T.H.; project administration, T.H. and H.P.; funding acquisition, T.H. and H.P. All authors have read and agreed to the published version of the manuscript.
Funding
This research was funded by the Deanship of Scientific Research (DSR, project number 1516, 2015 and 2087) at the University of Jordan, the Scientific Research Support Fund (SRF, project number BAS-1-2-2015) at the Jordanian Ministry of Higher Education, the Spanish Ministry of Science and Innovation (Project CEX2018-000794-S), AGAUR (project 2017 SGR41), H2020 project RI-URBANS (H2020-LC-GD-2020-6, reference 101036245), Academy of Finland Center of Excellence (project No. 272041)m and flagship on Atmosphere and Climate Competence Center (ACCC, project number 337549).
Institutional Review Board Statement
Not applicable.
Informed Consent Statement
Not applicable.
Data Availability Statement
Data is available upon request.
Acknowledgments
This research was part of a close collaboration between the Environmental and Atmospheric Research Laboratory (EARL, University of Jordan), Institute of Environmental Assessment and Water Research (IDAEA-CSIC), the Institute for Atmospheric and Earth System Research (INAR/Physics, University of Helsinki), and Institute for Advanced Studies in Basic Sciences (IASBS, Zanjan),. T.H. acknowledges support by the EMME-CARE project, which has received funding from the European Union’s Horizon 2020 Research and Innovation Programme (grant agreement no. 856612) and the Government of Cyprus. The sole responsibility of this publication lies with the author. The European Union is not responsible for any use that may be made of the information contained therein. The research for this paper were undertaken while Hossein Panahifar and Farizeh Bayat were employed at the Sepehr Payesh Hoshmand Vira Knowledge Enterprise Company. H.P. and F.B. acknowledge Sepehr Payesh Hoshmand Vira Knowledge Enterprise Company for its support in undertaking this research. Open access funding provided by University of Helsinki.
Conflicts of Interest
The authors declare no conflict of interest.
References
- Heese, B.; Floutsi, A.A.; Baars, H.; Althausen, D.; Hofer, J.; Herzog, A.; Mewes, S.; Radenz, M.; Schechner, Y.Y. The vertical aerosol type distribution above Israel–2 years of lidar observations at the coastal city of Haifa. Atmos. Chem. Phys. 2022, 22, 1633–1648. [Google Scholar] [CrossRef]
- Hussein, T.; Li, X.; Bakri, Z.; Alastuey, A.; Arar, S.; Al-Hunaiti, A.; Viana, M.; Petäjä, T. Organic and Elemental Carbon in the Urban Background in an Eastern Mediterranean City. Atmosphere 2022, 13, 197. [Google Scholar] [CrossRef]
- Hussein, T.; Dada, L.; Hakala, S.; Petäjä, T.; Kulmala, M. Urban aerosol particle size characterization in Eastern Mediterranean conditions. Atmosphere 2019, 10, 710. [Google Scholar] [CrossRef] [Green Version]
- Hussein, T.; Saleh, S.S.A.; dos Santos, V.N.; Abdullah, H.; Boor, B.E. Black carbon and particulate matter concentrations in Eastern Mediterranean urban conditions: An assessment based on integrated stationary and mobile observations. Atmosphere 2019, 10, 323. [Google Scholar] [CrossRef] [Green Version]
- Lelieveld, J.; Berresheim, H.; Borrmann, S.; Crutzen, P.; Dentener, F.; Fischer, H.; Feichter, J.; Flatau, P.; Heland, J.; Holzinger, R.; et al. Global air pollution crossroads over the Mediterranean. Science 2002, 298, 794–799. [Google Scholar] [CrossRef] [Green Version]
- Rogozovsky, I.; Ansmann, A.; Althausen, D.; Heese, B.; Engelmann, R.; Hofer, J.; Baars, H.; Schechner, Y.; Lyapustin, A.; Chudnovsky, A. Impact of aerosol layering, complex aerosol mixing, and cloud coverage on high-resolution MAIAC aerosol optical depth measurements: Fusion of lidar, AERONET, satellite, and ground-based measurements. Atmos. Environ. 2021, 247, 118163. [Google Scholar] [CrossRef]
- Hussein, T.; Li, X.; Al-Dulaimi, Q.; Daour, S.; Atashi, N.; Viana, M.; Alastuey, A.; Sogacheva, L.; Arar, S.; Al-Hunaiti, A.; et al. Particulate matter concentrations in a middle eastern city–An insight to sand and dust storm episodes. Aerosol Air Qual. Res. 2020, 20, 2780–2792. [Google Scholar] [CrossRef]
- Pey, J.; Querol, X.; Alastuey, A.; Forastiere, F.; Stafoggia, M. African dust outbreaks over the Mediterranean Basin during 2001–2011: PM 10 concentrations, phenomenology and trends, and its relation with synoptic and mesoscale meteorology. Atmos. Chem. Phys. 2013, 13, 1395–1410. [Google Scholar] [CrossRef] [Green Version]
- Dayan, U.; Ziv, B.; Shoob, T.; Enzel, Y. Suspended dust over southeastern Mediterranean and its relation to atmospheric circulations. Int. J. Climatol. J. R. Meteorol. Soc. 2008, 28, 915–924. [Google Scholar] [CrossRef]
- Ganor, E.; Osetinsky, I.; Stupp, A.; Alpert, P. Increasing trend of African dust, over 49 years, in the eastern Mediterranean. J. Geophys. Res. Atmos. 2010, 115, D07201. [Google Scholar] [CrossRef]
- Engelmann, R.; Kanitz, T.; Baars, H.; Heese, B.; Althausen, D.; Skupin, A.; Wandinger, U.; Komppula, M.; Stachlewska, I.S.; Amiridis, V.; et al. The automated multiwavelength Raman polarization and water-vapor lidar Polly XT: The neXT generation. Atmos. Meas. Tech. 2016, 9, 1767–1784. [Google Scholar] [CrossRef] [Green Version]
- Radenz, M.; Seifert, P.; Baars, H.; Floutsi, A.A.; Yin, Z.; Bühl, J. Automated time–height-resolved air mass source attribution for profiling remote sensing applications. Atmos. Chem. Phys. 2021, 21, 3015–3033. [Google Scholar] [CrossRef]
- Nisantzi, A.; Mamouri, R.E.; Ansmann, A.; Schuster, G.; Hadjimitsis, D.G. Middle East versus Saharan dust extinction-to-backscatter ratios. Atmos. Chem. Phys. 2015, 15, 7071–7084. [Google Scholar] [CrossRef] [Green Version]
- Mamouri, R.E.; Ansmann, A.; Nisantzi, A.; Kokkalis, P.; Schwarz, A.; Hadjimitsis, D. Low Arabian dust extinction-to-backscatter ratio. Geophys. Res. Lett. 2013, 40, 4762–4766. [Google Scholar] [CrossRef]
- Papayannis, A.; Amiridis, V.; Mona, L.; Tsaknakis, G.; Balis, D.; Bösenberg, J.; Chaikovski, A.; De Tomasi, F.; Grigorov, I.; Mattis, I.; et al. Systematic lidar observations of Saharan dust over Europe in the frame of EARLINET (2000–2002). J. Geophys. Res. Atmos. 2008, 113, D10204. [Google Scholar] [CrossRef] [Green Version]
- Mamouri, R.E.; Ansmann, A. Fine and coarse dust separation with polarization lidar. Atmos. Meas. Tech. 2014, 7, 3717–3735. [Google Scholar] [CrossRef] [Green Version]
- Wang, L.; Mačak, M.B.; Stanič, S.; Bergant, K.; Gregorič, A.; Drinovec, L.; Močnik, G.; Yin, Z.; Yi, Y.; Müller, D.; et al. Investigation of Aerosol Types and Vertical Distributions Using Polarization Raman Lidar over Vipava Valley. Remote Sens. 2022, 14, 3482. [Google Scholar] [CrossRef]
- Wang, L.; Stanič, S.; Bergant, K.; Eichinger, W.; Močnik, G.; Drinovec, L.; Vaupotič, J.; Miler, M.; Gosar, M.; Gregorič, A. Retrieval of vertical mass concentration distributions—Vipava valley case study. Remote Sens. 2019, 11, 106. [Google Scholar] [CrossRef] [Green Version]
- Ginoux, P.; Prospero, J.M.; Gill, T.E.; Hsu, N.C.; Zhao, M. Global-scale attribution of anthropogenic and natural dust sources and their emission rates based on MODIS Deep Blue aerosol products. Rev. Geophys. 2012, 50, RG3005. [Google Scholar] [CrossRef]
- Hussein, T.; Alameer, A.; Jaghbeir, O.; Albeitshaweesh, K.; Malkawi, M.; Boor, B.E.; Koivisto, A.J.; Löndahl, J.; Alrifai, O.; Al-Hunaiti, A. Indoor particle concentrations, size distributions, and exposures in middle eastern microenvironments. Atmosphere 2019, 11, 41. [Google Scholar] [CrossRef]
- Kishcha, P.; Volpov, E.; Starobinets, B.; Alpert, P.; Nickovic, S. Dust dry deposition over Israel. Atmosphere 2020, 11, 197. [Google Scholar] [CrossRef] [Green Version]
- Atashi, N.; Rahimi, D.; Al Kuisi, M.; Jiries, A.; Vuollekoski, H.; Kulmala, M.; Vesala, T.; Hussein, T. Modeling long-term temporal variation of dew formation in Jordan and its link to climate change. Water 2020, 12, 2186. [Google Scholar] [CrossRef]
- Winker, D.M.; Hunt, W.H.; McGill, M.J. Initial performance assessment of CALIOP. Geophys. Res. Lett. 2007, 34, L19803. [Google Scholar] [CrossRef] [Green Version]
- Winker, D.M.; Vaughan, M.A.; Omar, A.; Hu, Y.; Powell, K.A.; Liu, Z.; Hunt, W.H.; Young, S.A. Overview of the CALIPSO mission and CALIOP data processing algorithms. J. Atmos. Ocean. Technol. 2009, 26, 2310–2323. [Google Scholar] [CrossRef]
- Hu, Y.; Winker, D.; Vaughan, M.; Lin, B.; Omar, A.; Trepte, C.; Flittner, D.; Yang, P.; Nasiri, S.L.; Baum, B.; et al. CALIPSO/CALIOP cloud phase discrimination algorithm. J. Atmos. Ocean. Technol. 2009, 26, 2293–2309. [Google Scholar] [CrossRef] [Green Version]
- Di Girolamo, P.; Gagliardi, R.; Pappalardo, G.; Spinelli, N.; Velotta, R.; Berardi, V. Two wavelength lidar analysis of stratospheric aerosol size distribution. J. Aerosol Sci. 1995, 26, 989–1001. [Google Scholar] [CrossRef]
- Burton, S.; Ferrare, R.; Hostetler, C.; Hair, J.; Rogers, R.; Obland, M.; Butler, C.; Cook, A.; Harper, D.; Froyd, K. Aerosol classification using airborne High Spectral Resolution Lidar measurements–methodology and examples. Atmos. Meas. Tech. 2012, 5, 73–98. [Google Scholar] [CrossRef] [Green Version]
- Groß, S.; Esselborn, M.; Weinzierl, B.; Wirth, M.; Fix, A.; Petzold, A. Aerosol classification by airborne high spectral resolution lidar observations. Atmos. Chem. Phys. 2013, 13, 2487–2505. [Google Scholar] [CrossRef] [Green Version]
- Vaughan, M.A.; Powell, K.A.; Winker, D.M.; Hostetler, C.A.; Kuehn, R.E.; Hunt, W.H.; Getzewich, B.J.; Young, S.A.; Liu, Z.; McGill, M.J. Fully automated detection of cloud and aerosol layers in the CALIPSO lidar measurements. J. Atmos. Ocean. Technol. 2009, 26, 2034–2050. [Google Scholar] [CrossRef]
- Liu, Z.; Vaughan, M.; Winker, D.; Kittaka, C.; Getzewich, B.; Kuehn, R.; Omar, A.; Powell, K.; Trepte, C.; Hostetler, C. The CALIPSO lidar cloud and aerosol discrimination: Version 2 algorithm and initial assessment of performance. J. Atmos. Ocean. Technol. 2009, 26, 1198–1213. [Google Scholar] [CrossRef]
- Young, S.A.; Vaughan, M.A.; Garnier, A.; Tackett, J.L.; Lambeth, J.D.; Powell, K.A. Extinction and optical depth retrievals for CALIPSO’s Version 4 data release. Atmos. Meas. Tech. 2018, 11, 5701–5727. [Google Scholar] [CrossRef] [Green Version]
- Kim, M.H.; Omar, A.H.; Tackett, J.L.; Vaughan, M.A.; Winker, D.M.; Trepte, C.R.; Hu, Y.; Liu, Z.; Poole, L.R.; Pitts, M.C.; et al. The CALIPSO version 4 automated aerosol classification and lidar ratio selection algorithm. Atmos. Meas. Tech. 2018, 11, 6107–6135. [Google Scholar] [CrossRef] [PubMed] [Green Version]
- Levy, R.; Mattoo, S.; Munchak, L.; Remer, L.; Sayer, A.; Patadia, F.; Hsu, N. The Collection 6 MODIS aerosol products over land and ocean. Atmos. Meas. Tech. 2013, 6, 2989–3034. [Google Scholar] [CrossRef] [Green Version]
- Levy, R.; Remer, L.; Kleidman, R.; Mattoo, S.; Ichoku, C.; Kahn, R.; Eck, T. Global evaluation of the Collection 5 MODIS dark-target aerosol products over land. Atmos. Chem. Phys. 2010, 10, 10399–10420. [Google Scholar] [CrossRef] [Green Version]
- Kaufman, Y.; Tanré, D.; Remer, L.A.; Vermote, E.; Chu, A.; Holben, B. Operational remote sensing of tropospheric aerosol over land from EOS moderate resolution imaging spectroradiometer. J. Geophys. Res. Atmos. 1997, 102, 17051–17067. [Google Scholar] [CrossRef]
- Hsu, N.; Jeong, M.J.; Bettenhausen, C.; Sayer, A.; Hansell, R.; Seftor, C.; Huang, J.; Tsay, S.C. Enhanced Deep Blue aerosol retrieval algorithm: The second generation. J. Geophys. Res. Atmos. 2013, 118, 9296–9315. [Google Scholar] [CrossRef]
- Reinhardt, B.; Buras, R.; Bugliaro, L.; Wilbert, S.; Mayer, B. Determination of circumsolar radiation from Meteosat Second Generation. Atmos. Meas. Tech. 2014, 7, 823–838. [Google Scholar] [CrossRef] [Green Version]
- Joro, S.; Samain, O.; Yildirim, A.; Van De Berg, L.; Lutz, H.J.; EUMETSAT. Towards an improved active fire monitoring product for MSG satellites. In Proceedings of the EUMETSAT Meteorological Satellite Conference, Darmstadt, Germany, 8–12 September 2008; pp. 8–12. [Google Scholar]
- Knippertz, P.; Todd, M.C. Mineral dust aerosols over the Sahara: Meteorological controls on emission and transport and implications for modeling. Rev. Geophys. 2012, 50, RG1007. [Google Scholar] [CrossRef]
- Stein, A.; Draxler, R.R.; Rolph, G.D.; Stunder, B.J.; Cohen, M.; Ngan, F. NOAA’s HYSPLIT atmospheric transport and dispersion modeling system. Bull. Am. Meteorol. Soc. 2015, 96, 2059–2077. [Google Scholar] [CrossRef]
- Draxler, R.R. Hysplit (Hybrid Single-Particle Lagrangian Integrated Trajectory) Model Access via NOAA ARL Ready Website. 2003. Available online: http://www.arl.noaa.gov/ready/hysplit4.html (accessed on 1 November 2022).
- ERA, C. Fifth Generation of ECMWF Atmospheric Reanalyses of the Global Climate. Copernicus Climate Change Service Climate Data Store (CDS) 2017. Available online: https://www.ecmwf.int/en/forecasts/dataset/ecmwf-reanalysis-v5 (accessed on 1 November 2022).
- Hersbach, H.; Dee, D. ERA5 reanalysis is in production. ECMWF Newsletter 2016, 147, 5–6. [Google Scholar]
- Mamouri, R.E.; Ansmann, A. Potential of polarization/Raman lidar to separate fine dust, coarse dust, maritime, and anthropogenic aerosol profiles. Atmos. Meas. Tech. 2017, 10, 3403–3427. [Google Scholar] [CrossRef]
- Panahifar, H.; Moradhaseli, R.; Khalesifard, H.R. Monitoring atmospheric particulate matters using vertically resolved measurements of a polarization lidar, in-situ recordings and satellite data over Tehran, Iran. Sci. Rep. 2020, 10, 1–15. [Google Scholar] [CrossRef] [PubMed]
- Tesche, M.; Ansmann, A.; Müller, D.; Althausen, D.; Engelmann, R.; Freudenthaler, V.; Groß, S. Vertically resolved separation of dust and smoke over Cape Verde using multiwavelength Raman and polarization lidars during Saharan Mineral Dust Experiment 2008. J. Geophys. Res. Atmos. 2009, 114. [Google Scholar] [CrossRef]
- Ansmann, A.; Mamouri, R.E.; Hofer, J.; Baars, H.; Althausen, D.; Abdullaev, S.F. Dust mass, cloud condensation nuclei, and ice-nucleating particle profiling with polarization lidar: Updated POLIPHON conversion factors from global AERONET analysis. Atmos. Meas. Tech. 2019, 12, 4849–4865. [Google Scholar] [CrossRef] [Green Version]
- Sakai, T.; Nagai, T.; Zaizen, Y.; Mano, Y. Backscattering linear depolarization ratio measurements of mineral, sea-salt, and ammonium sulfate particles simulated in a laboratory chamber. Appl. Opt. 2010, 49, 4441–4449. [Google Scholar] [CrossRef] [PubMed]
- Ansmann, A.; Seifert, P.; Tesche, M.; Wandinger, U. Profiling of fine and coarse particle mass: Case studies of Saharan dust and Eyjafjallajökull/Grimsvötn volcanic plumes. Atmos. Chem. Phys. 2012, 12, 9399–9415. [Google Scholar] [CrossRef] [Green Version]
- Wang, Z.; Liu, C.; Hu, Q.; Dong, Y.; Liu, H.; Xing, C.; Tan, W. Quantify the Contribution of Dust and Anthropogenic Sources to Aerosols in North China by Lidar and Validated with CALIPSO. Remote. Sens. 2021, 13, 1811. [Google Scholar] [CrossRef]
- Tesche, M.; Wandinger, U.; Ansmann, A.; Althausen, D.; Müller, D.; Omar, A. Ground-based validation of CALIPSO observations of dust and smoke in the Cape Verde region. J. Geophys. Res. Atmos. 2013, 118, 2889–2902. [Google Scholar] [CrossRef]
Figure 1.
(a) Topography of Jordan and neighboring countries provided by Shuttle Radar Topography Mission project (SRTM) and (b) Landsat 8 true color image of Amman, ground-based particulate matter station, and some important locations surrounding Amman.
Figure 1.
(a) Topography of Jordan and neighboring countries provided by Shuttle Radar Topography Mission project (SRTM) and (b) Landsat 8 true color image of Amman, ground-based particulate matter station, and some important locations surrounding Amman.

Figure 2.
Daily average PM concentrations were measured at the in situ station with markups for sand and dust episodes (SDS), precipitation, and clean air periods.
Figure 2.
Daily average PM concentrations were measured at the in situ station with markups for sand and dust episodes (SDS), precipitation, and clean air periods.

Figure 3.
(a) Time series of the PM concentration in addition to the surface wind speed, HV, and RH recordings on 7 June 2018. (b) Terra-MODIS with 10 km resolution (MOD04).(c) Angström exponent (AE) with 1 degree resolution (MOD08 and MYD08).
Figure 3.
(a) Time series of the PM concentration in addition to the surface wind speed, HV, and RH recordings on 7 June 2018. (b) Terra-MODIS with 10 km resolution (MOD04).(c) Angström exponent (AE) with 1 degree resolution (MOD08 and MYD08).

Figure 4.
(a) CALIPSO satellite ground track (red line) and the location of Amman (green circle) on 7 June 7 2018. (b) Cross-section of attenuated backscatter coefficient in arbitrary units (AU) by CALIPSO over Amman and the neighboring area. Vertical profile of optical and physical properties of aerosols within the region determined by a dashed line in Figure 4a in (c) total particle backscatter coefficient. (d) Particle depolarization ratio; the horizontal red dashed line is drawn to depict a two-layer structure in the atmosphere. (e) Dust and non-dust backscatter coefficient. (f) Dust and non-dust mass concentration.

Figure 5.
(a) SEVIRI false-color images at 06:00 UTC and (b) 12:00 UTC on 6 June 2018. In these RGB images, clouds appear in orange or brown, dust in magenta or pink, sandy regions in white, and dry land in pale blue. (c) Backward trajectories during the past 72 h by the HYSPLIT model on 7 June 2018 calculated at different heights and overlaid by MODIS Deep Blue AOD. (d,e) Corresponding surface wind speed and direction at 06:00 UTC and 12:00 UTC by the ECMWF reanalysis.

Figure 6.
Sand and dust storm episode observed on 25 July 2018, which was an S-type SDS. (a) PM concentrations observed during the ground-based measurement, (b) MODIS 1 degree Deep Blue aerosol optical depth, and (c) MODIS 1 degree Deep Blue angström exponent.
Figure 6.
Sand and dust storm episode observed on 25 July 2018, which was an S-type SDS. (a) PM concentrations observed during the ground-based measurement, (b) MODIS 1 degree Deep Blue aerosol optical depth, and (c) MODIS 1 degree Deep Blue angström exponent.

Figure 7.
(a) CALIPSO satellite ground track (red line) and the location of Amman (green circle) on 25 July 2018. (b) Cross-section of attenuated backscatter coefficient in arbitrary units (AU) by CALIPSO over Amman and the neighboring area. Vertical profile of optical and physical properties of aerosols within the region determined by a dashed line in Figure 7a in (c) total particle backscatter coefficient. (d) Particle depolarization ratio. (e) Dust and non-dust backscatter coefficient. (f) Dust and non-dust mass concentration.

Figure 8.
(a) Backward trajectories during the past 132 h by the HYSPLIT model on 25 July 2018 calculated at different heights, overlaid by MODIS Deep Blue AOD (on 21 July 2018) and corresponding CALIPSO ground track during transport path. (b) The attenuated backscatter coefficient in arbitrary units (AU). (c) The CALIPSO aerosol subtype classification. The horizontal axis for all panels of Figure 8b,c is the same. This axis shows latitude from N to N.

Figure 9.
(a) Bar plots show the median (horizontal line), 25–75 percentile (box), and 5–95 percentile (whisker) of layer-mean particlulate linear depolarization ratio and lidar ratio at 532 nm wavelength, the same for color ratio and relative humidity. (b) Polar scatter plots of daily IPDR values along the period of study. (c) Monthly distribution of the observed layer containing different aerosol types (Dust, Polluted dust, Pollution).

Figure 10.
Histogram of (a) lofted-layer top heights and (b) depths during January 2018–December 2019. The type of observed aerosol layer has also been shown by a pie chart for each category.
Figure 10.
Histogram of (a) lofted-layer top heights and (b) depths during January 2018–December 2019. The type of observed aerosol layer has also been shown by a pie chart for each category.


Table 1.
General specifications of the ground-based instruments.
| No. | Instrument | Model |
|---|---|---|
| 1 | High volume sampler | Cascade heads: PM1025-CAV, MCV, S.A. Filter media: Pallflex, PALLXQ250ETDS0150, TISSUQUARTZ 2500 QAT-UP. |
| 2 | Optical particle sizer | OPS, TSI model 3330, USA |
| 3 | Scanning mobility particle sizer | NanoScan SMPS 3910, TSI, Minnesota, USA |
| 4 | Weather station | WH-1080, Clas Ohlson: Art.no. 36-3242 |
Table 2.
Parameters applied to convert particle backscatter coefficient to mass concentration.
| Aerosol Type | Parameter | ||
|---|---|---|---|
| S (sr) | mm | (g/cm) | |
| Coarse dust | 40 | 0.9 | 2.6 |
| Fine dust | 35 | 0.3 | 2.6 |
| Non-dust | 60 | 0.18 | 1.5 |
Disclaimer/Publisher’s Note: The statements, opinions and data contained in all publications are solely those of the individual author(s) and contributor(s) and not of MDPI and/or the editor(s). MDPI and/or the editor(s) disclaim responsibility for any injury to people or property resulting from any ideas, methods, instructions or products referred to in the content. |
© 2023 by the authors. Licensee MDPI, Basel, Switzerland. This article is an open access article distributed under the terms and conditions of the Creative Commons Attribution (CC BY) license (https://creativecommons.org/licenses/by/4.0/).
Share and Cite
MDPI and ACS Style
Panahifar, H.; Bayat, F.; Hussein, T. Simultaneous Use of Ground-Based and Satellite Observation to Evaluate Atmospheric Air Pollution over Amman, Jordan. Atmosphere 2023, 14, 274. https://doi.org/10.3390/atmos14020274
AMA Style
Panahifar H, Bayat F, Hussein T. Simultaneous Use of Ground-Based and Satellite Observation to Evaluate Atmospheric Air Pollution over Amman, Jordan. Atmosphere. 2023; 14(2):274. https://doi.org/10.3390/atmos14020274
Chicago/Turabian StylePanahifar, Hossein, Farizeh Bayat, and Tareq Hussein. 2023. "Simultaneous Use of Ground-Based and Satellite Observation to Evaluate Atmospheric Air Pollution over Amman, Jordan" Atmosphere 14, no. 2: 274. https://doi.org/10.3390/atmos14020274
Note that from the first issue of 2016, this journal uses article numbers instead of page numbers. See further details here.