
Investigation of Wind Characteristics and Cooling Effects of Crushed-Rock Embankment with Different Pavement Widths in Permafrost Region

1
School of Civil Engineering and Architecture, Jiaxing Nanhu University, Jiaxing 314001, China
2
College of Civil Engineering and Architecture, Jiaxing University, Jiaxing 314001, China
*
Author to whom correspondence should be addressed.
Atmosphere 2023, 14(1), 166; https://doi.org/10.3390/atmos14010166
Submission received: 25 November 2022
/
Revised: 6 January 2023
/
Accepted: 7 January 2023
/
Published: 12 January 2023
(This article belongs to the Special Issue Interactions of Atmosphere and Permafrost)
Abstract
:A crushed-rock embankment (CRE) with a high porous crushed-rock layer (CRL) can effectively cool the underlying permafrost through natural ventilation within the layer. However, in addition to the ambient conditions, the ventilation efficiency of the CRL and its cooling effect are significantly affected by the pavement width. In this study, the local wind flow around an embankment section was first analyzed based on field monitoring data. Then, considering climate warming, a 2-D coupled model of heat and mass transfer was established to investigate the wind characteristics and the cooling effects of the CRE with different pavement widths. The results showed that the pavement width exerted considerable impacts on the wind characteristics and cooling effects of the CRE. These impacts were evaluated via variations in the wind speed, the permafrost table, and the soil temperatures. An increase in pavement width can lower the wind speed within the CRL, which is adverse to the long-term thermal regimes of the embankment and the underlying permafrost. In addition, due to differential wind flows around the embankments, an asymmetric distribution of the soil temperatures beneath the windward and leeward sides of the embankments existed. Overall, it is hoped that the results of this study can provide informative references for the Qinghai–Tibet expressway that is constructed in permafrost regions.
1. Introduction
Permafrost is mainly distributed in Siberia, North America, and the Qinghai–Tibet Plateau. It is extremely sensitive to changes in ambient conditions, due to the existence of ice [1,2,3,4]. Ongoing climate warming and increasing anthropogenic activities have caused extensive permafrost thawing and degradation, which threaten the long-term stability and integrity of engineering facilities constructed in vast permafrost zones [5,6,7,8,9,10,11,12]. The thermal stability of the permafrost subgrade is a foundation for the safe operation of overlying structures; it is usually evaluated by considering variations in soil temperature. The thermal disturbance derived from the dual impacts of climate warming and engineering construction leads to a rise in permafrost temperature; as a result, the poor thermal stability of the underlying permafrost adversely affects engineering projects because of permafrost degradation and consequent thaw settlements. Overall, the thermal stability of the permafrost subgrade is a big challenge for the construction and maintenance of engineering projects in permafrost regions.
During the past decade, cooling measures, including crushed-rock layers, ventilation ducts, and thermosyphons, have been successfully applied in the construction of roads and railways to cool down the underlying permafrost by utilizing seasonal cold energy from the ambient environment [7,13,14,15,16]. Among these measures, crushed-rock embankments (CREs), constructed with a high porosity crushed-rock layer (CRL), are among the popular engineering measures because of their low cost and environmentally friendly characteristics [7,17,18,19]. The cooling efficiency and mechanism of the CRL have been studied in abundant in situ and laboratory tests [13,20,21,22,23,24]. The results show that the CRE produces a better cooling effect under climate warming, strengthening the thermal stability of the embankment and the underlying soils [9,13,14,15,25,26,27].
In engineering practice, however, the long-term thermal performance of CRE could be affected by many factors. In addition to the ambient conditions, the pavement width is an important factor affecting the ventilation efficiency of the CRL. The wider the pavement is, the greater the resistance of crushed rock to wind flow within the CRL is. Qian et al. [28] and Liu et al. [29] analyzed the wind speed within the CRL and the related heat exchange, based on the field observations. Moreover, a wider pavement surface introduces more heat energy into underlying soils, which partially offsets the cooling effect of the CRL [26,28,30]. Yu et al. [30,31] indicated that an increase in pavement width causes a heat-gathering effect, and also affects the ventilation efficiency of the CRL. Most of the previous studies on the embankments constructed in permafrost zones were based on low-grade roadways. For the more advanced expressways, which have a wider embankment for more traffic, the long-term thermal performance of the CREs with the CRL requires more research.
In this study, the characteristics of wind flow around an embankment in a permafrost region were first investigated via measuring wind speeds at different heights and locations. Then, considering the effects of climate warming, a 2-D coupled model of heat and mass transfer was established to investigate the wind characteristics and cooling effects of the CRE with different pavement widths. The measured and simulated results provide informative references for the construction of the Qinghai–Tibet expressway in permafrost regions.
2. Experimental Site and Monitoring System
2.1. Site Description and Monitoring System
The experimental section was built between the Qinghai–Tibet highway and the Qinghai–Tibet railway. It is located in the southwest of the Beiluhe Observation Station of Frozen Soil Environment and Engineering (34°49′ N, 92°55′ E), as shown in Figure 1. The height of the embankment at this location was 3 m above the ground; the width of the pavement surface was 13 m; and the gradient of slope was 1:1.5. More information concerning the experimental embankment can be found in the references [8,31].
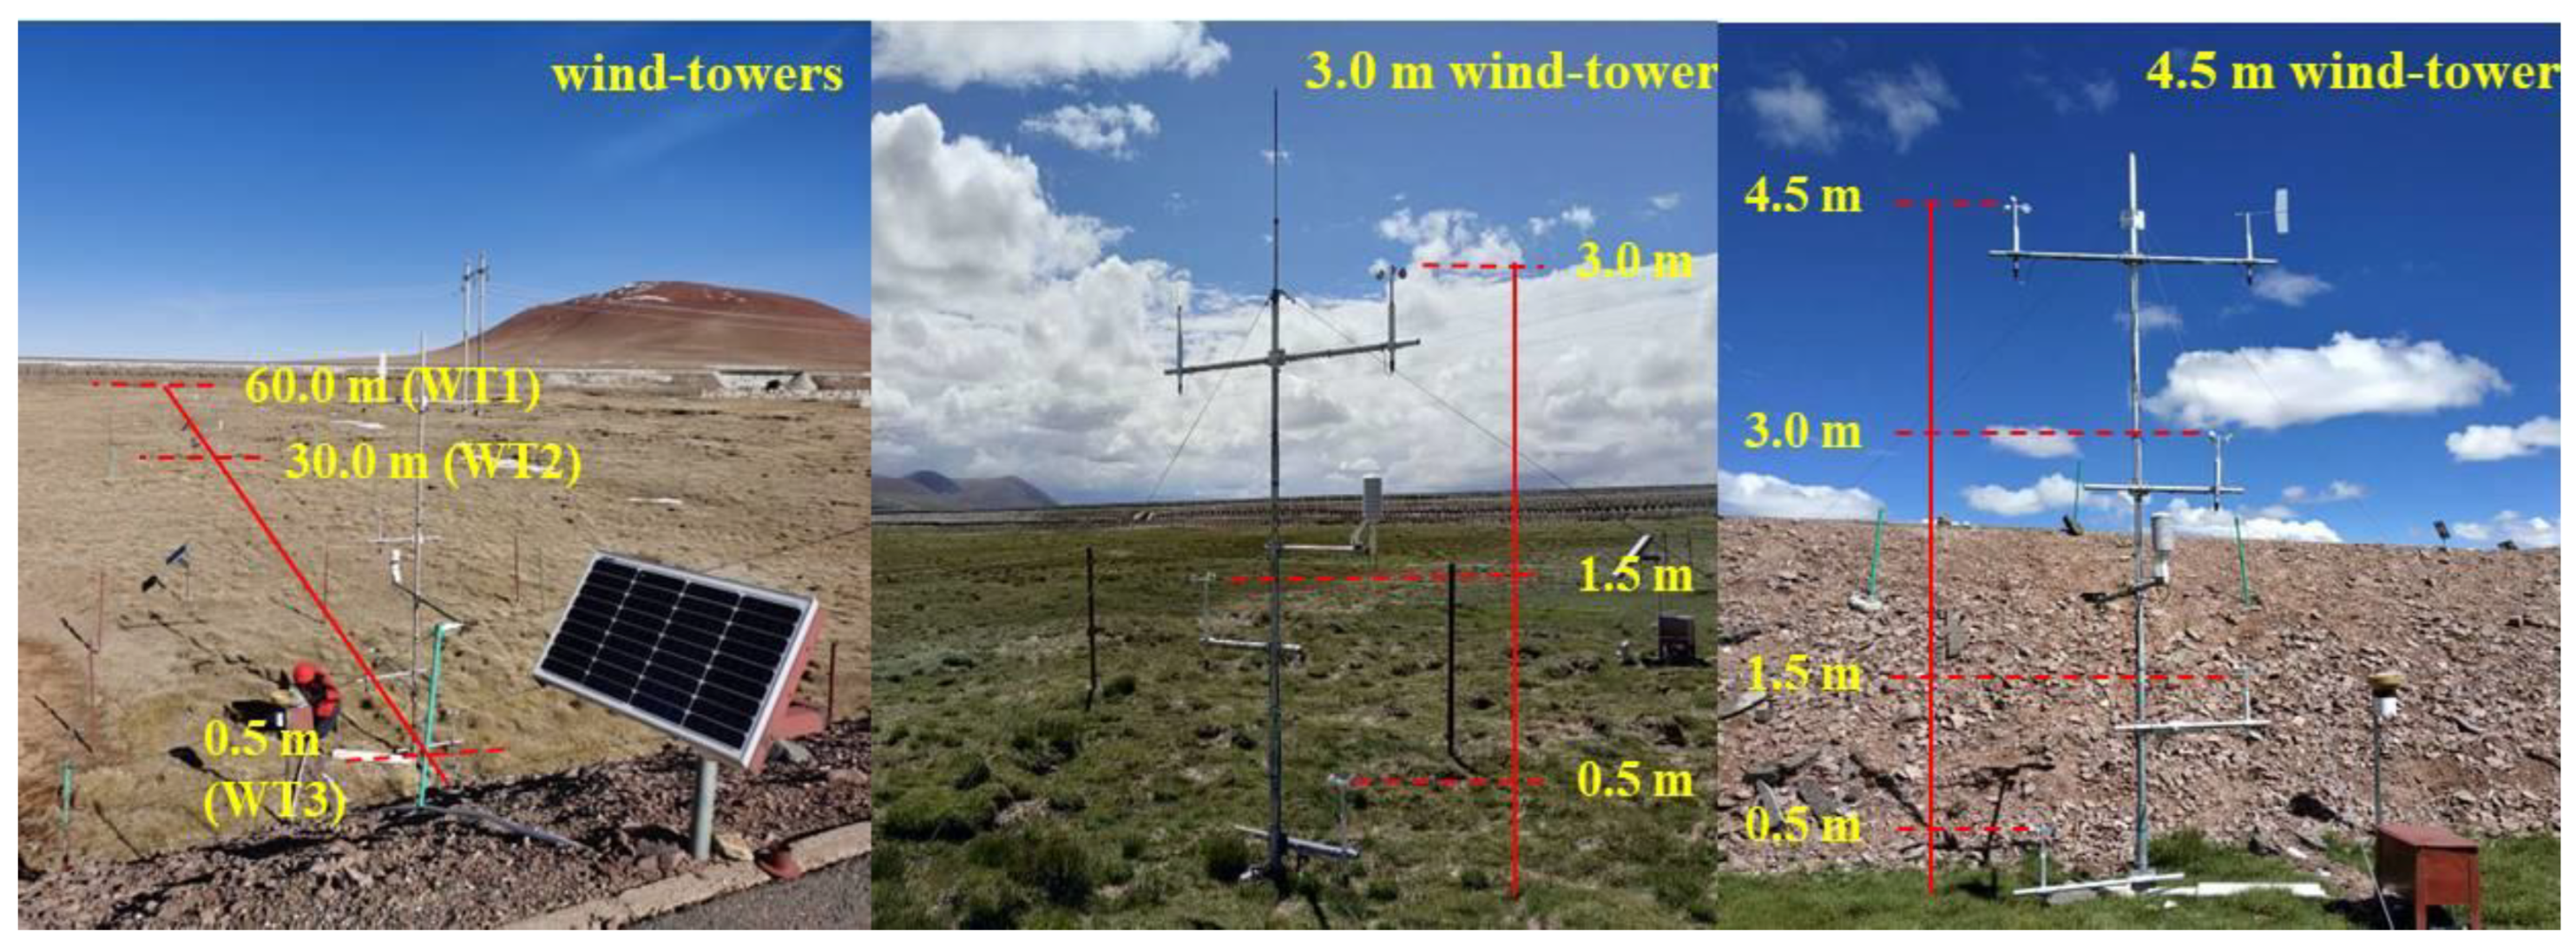
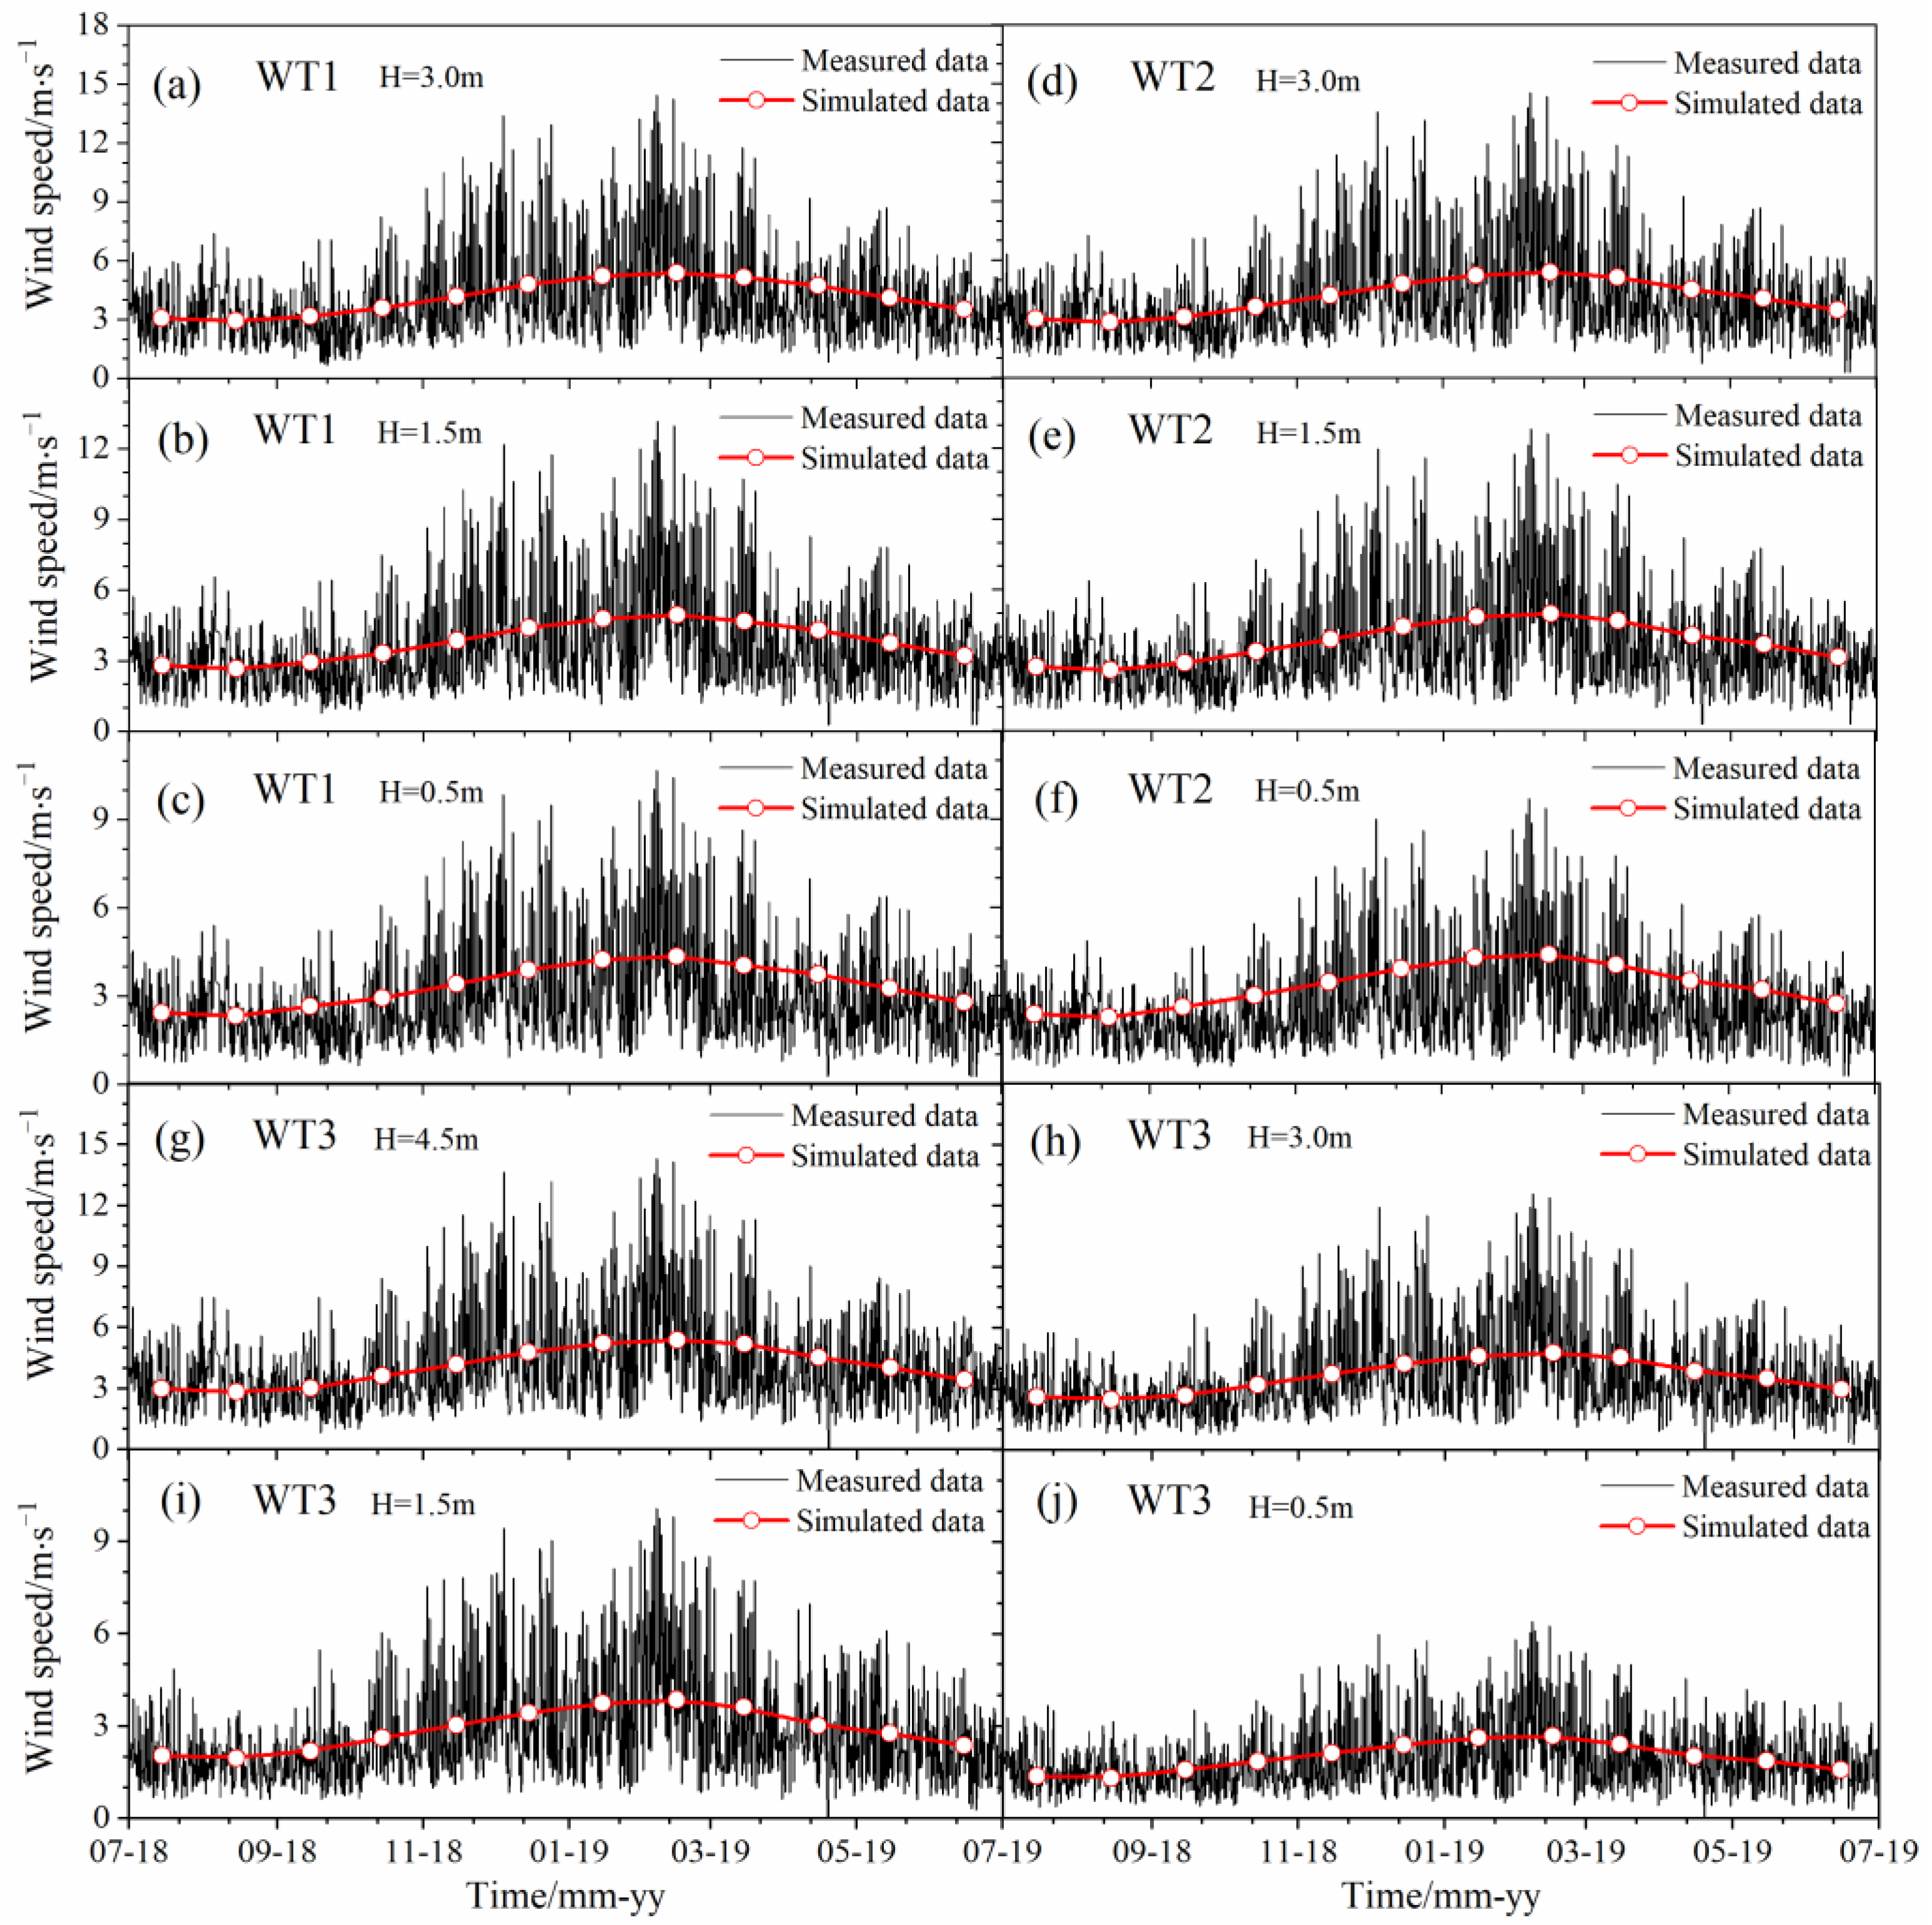
In order to investigate the disturbance of the embankment on wind flow, two types of three wind-towers were installed on the northwest side of the embankment, as shown in Figure 2. The closest one to the embankment was 4.5 m in height, and had four layers of wind speed monitoring equipment at the heights of 0.5, 1.5, 3.0, and 4.5 m above the ground surface, respectively. The other two wind-towers were 3.0 m in height, equipped with three layers of wind speed monitoring at the heights of 0.5, 1.5, and 3.0 m above the ground surface. The locations of the three wind-towers were 60.0 m (WT1), 30.0 m (WT2), and 0.5 m (WT3) from the slope toe of the embankment, respectively. The wind speed at different locations and heights were collected by the monitoring systems and recorded automatically by the data logger every 10 min. The on-site observations began in July 2018.
2.2. Analysis of the Monitoring Data
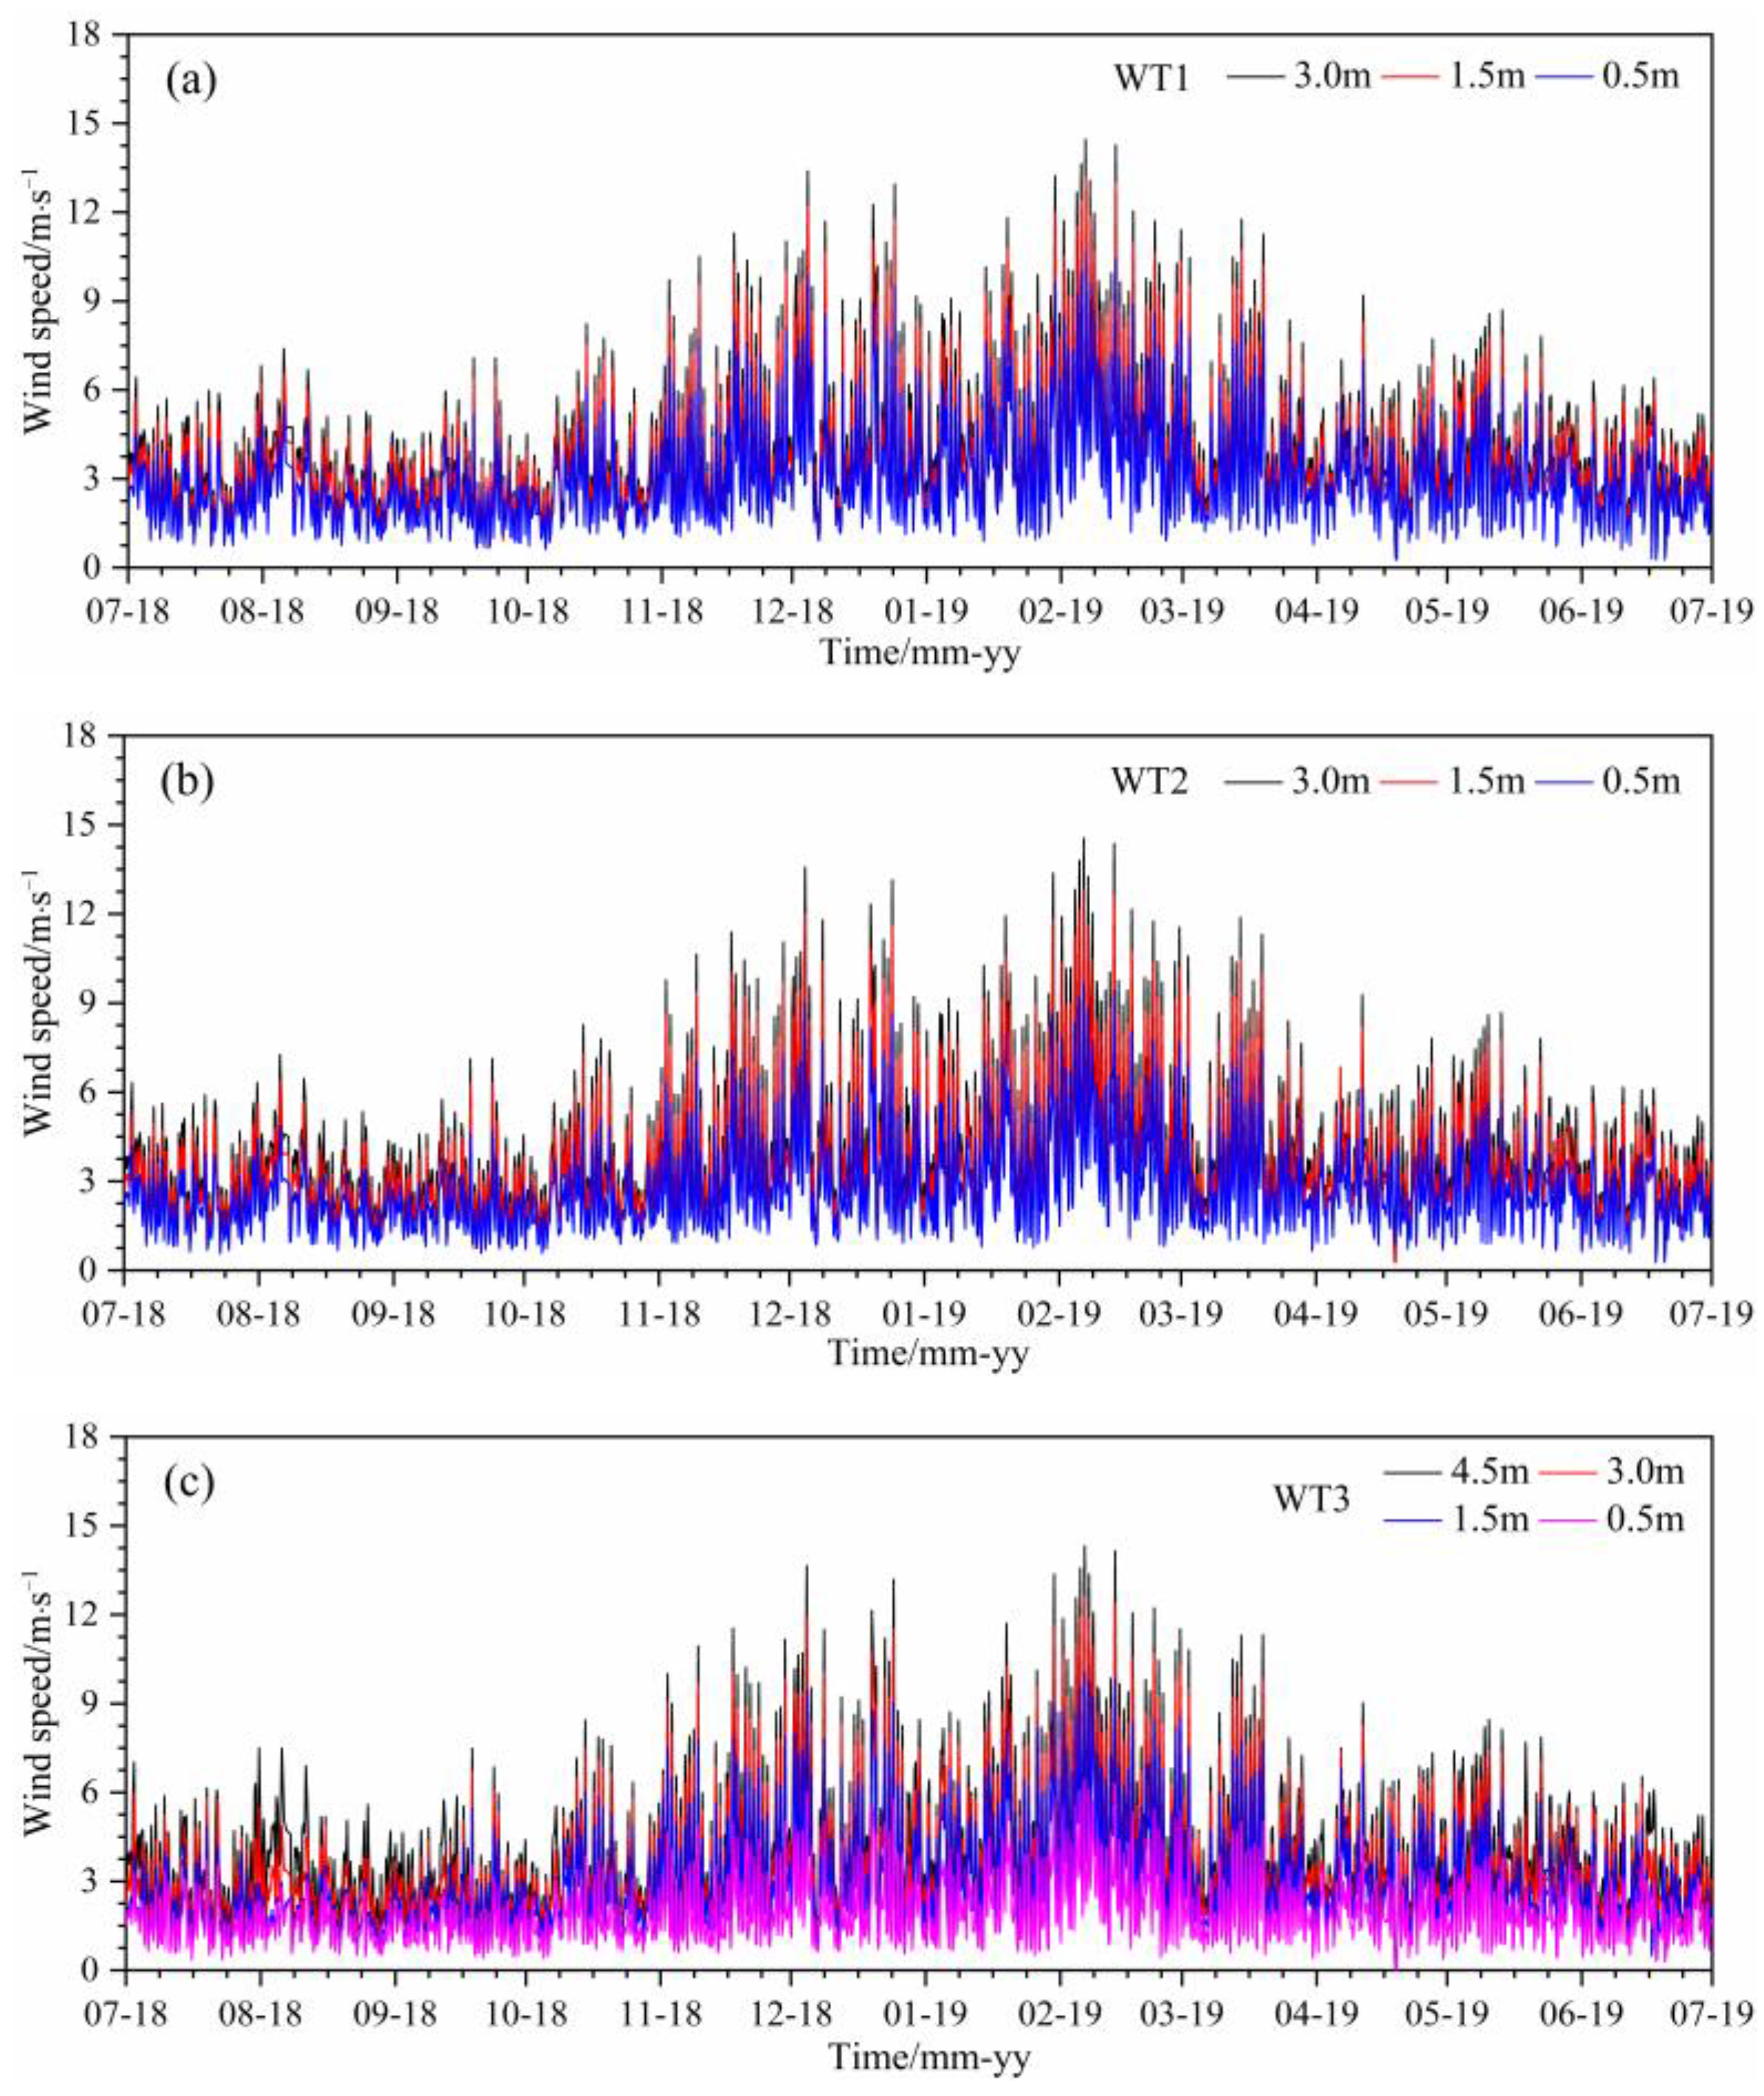
Figure 3 shows the variations in the wind speed at different heights of the three wind-towers from July 2018 to July 2019. It can be seen that the wind speed at these wind-towers increased with height and there were obvious seasonal variations in the wind speed. In the cold season, from November to next April, the wind speed was significantly higher than the other times of the year, and the maximum wind speed can reach 14.5 m·s−1. Additionally, wind speeds of more than 6 m·s−1 occurred frequently in the cold season. By contrast, the wind speed was relatively small in the warm season, and the maximum wind speed is approximately 8.7 m·s−1.
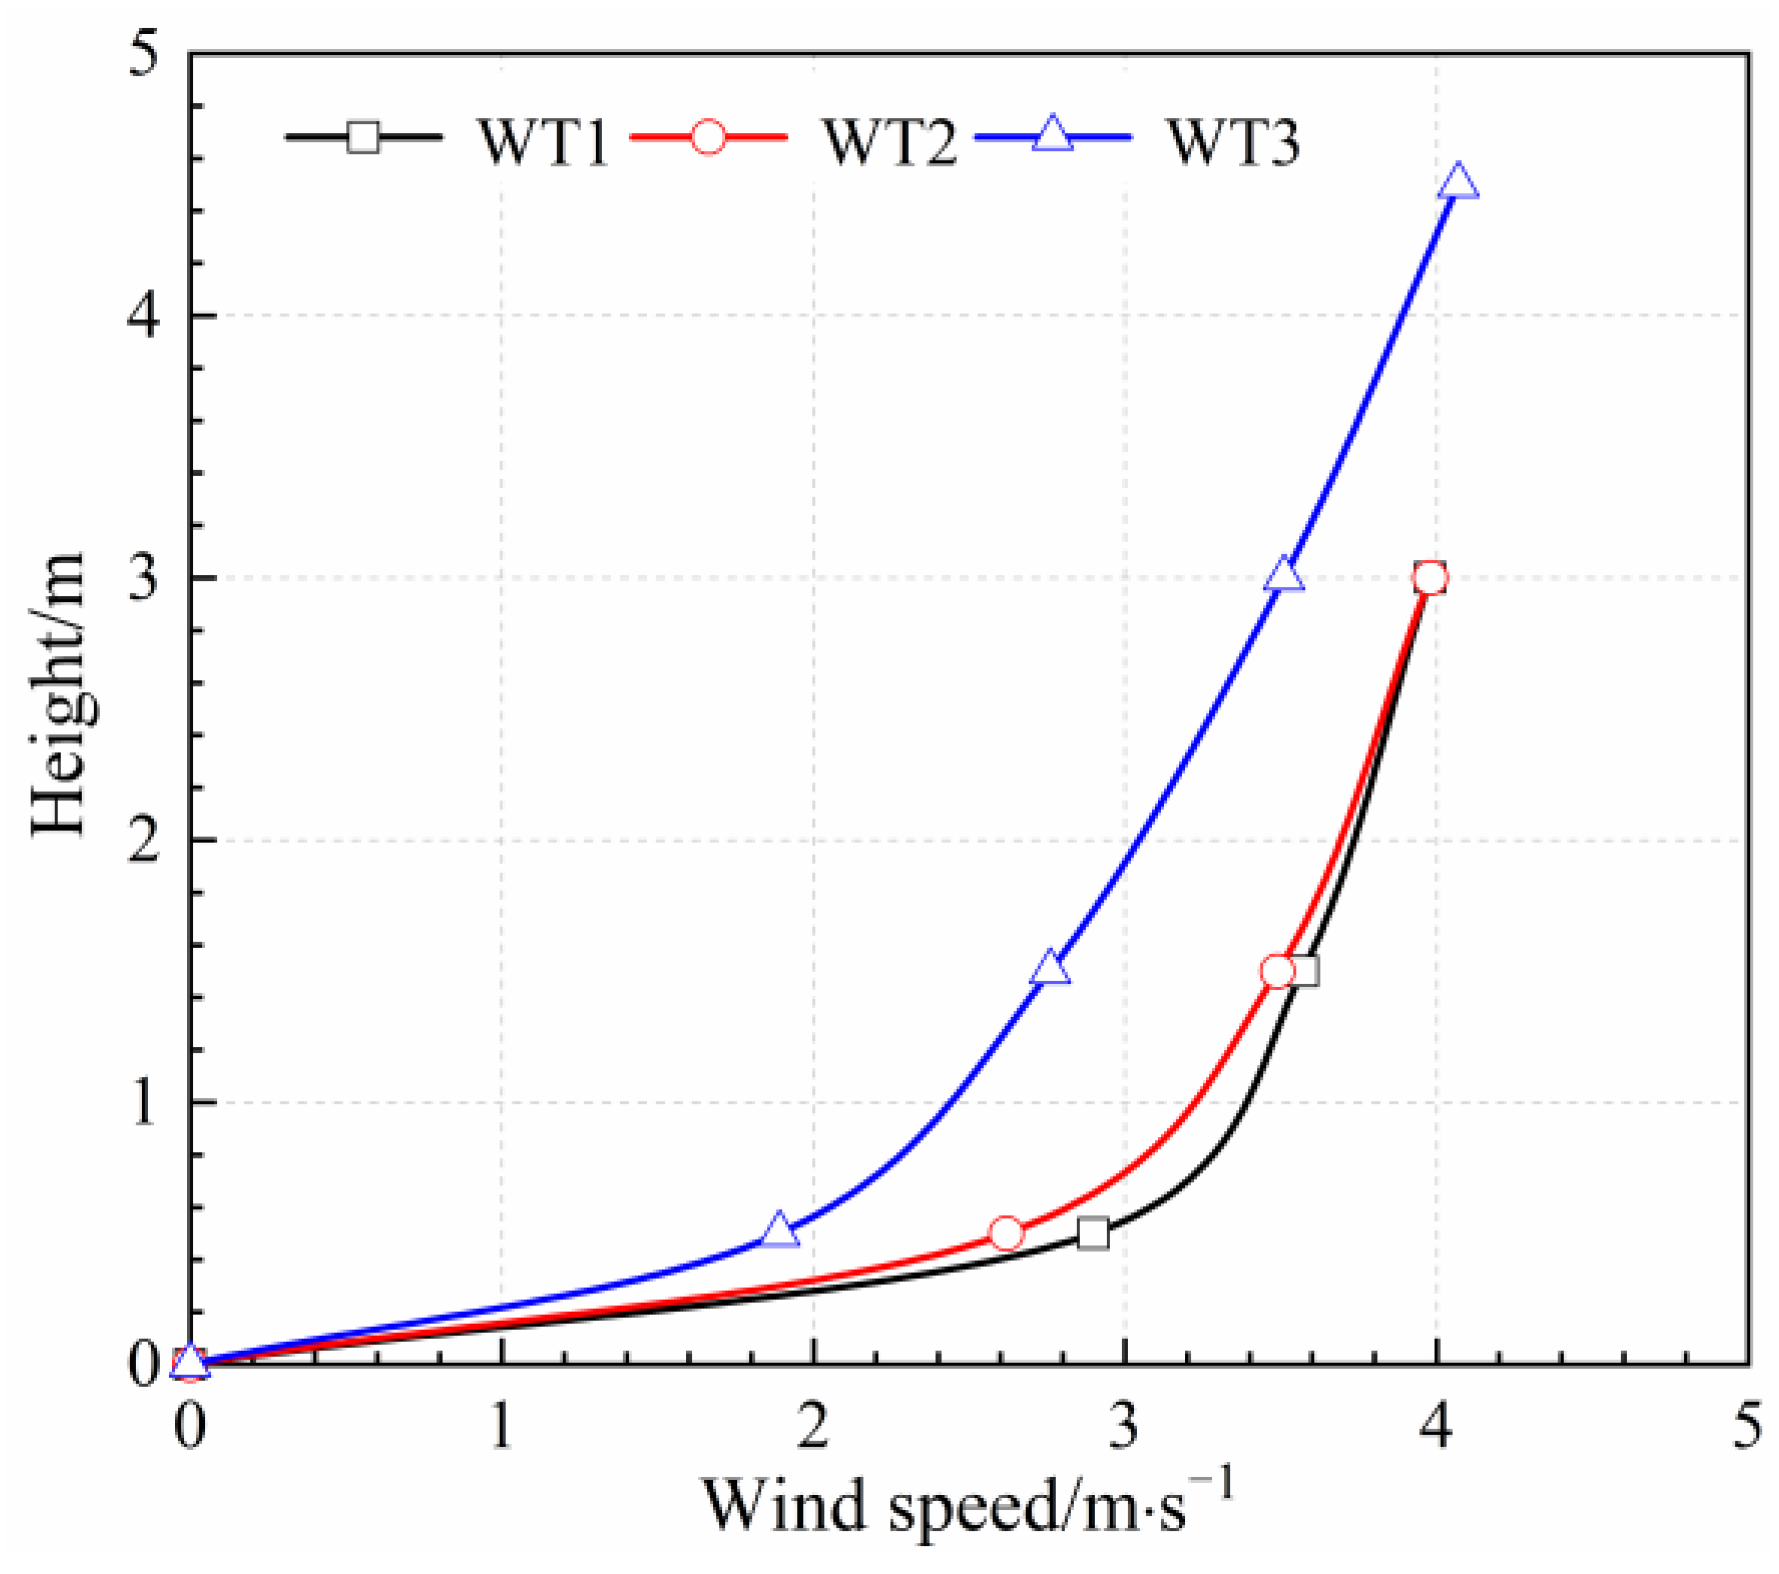
According to the “power law of wind profiles” of the atmospheric surface layer [32] and assumed that the wind speed at the ground surface is 0 m·s−1, the mean annual wind speed at these wind-towers could be characterized by an exponential function with the increase in height, as shown in Figure 4. Based on the observations, the disturbance of the experimental embankment to natural wind flow was analyzed. Because of the blocking of the embankment to the wind flow, the wind speed at the closest wind-tower (WT3) to the embankment was significantly changed, which was smaller than those from the other wind-towers (WT1 and WT2) at the same heights. Compared with the WT1, the mean annual wind speed at the WT3 decreased 1.01, 0.81, 0.47 m·s−1 at the heights of 0.5, 1.5, 3.0 m, respectively. These differences also revealed that the closer to the ground, the bigger disturbance of the embankment to the wind flow happened.
Table 1 shows the frequency distribution of the mean daily wind speed at the height of 3.0 m from the three wind-towers. The wind speeds at these wind-towers were mainly distributed from 2 to 6 m·s−1, of which the frequency distribution of the wind speed at the WT1, WT2, and WT3 reached 85.72%, 86.00%, and 86.80%, respectively. There was totally 35 days in a year with the wind speed more than 6 m·s−1. Meanwhile, it can be seen that the frequency distribution of the wind speed at the WT3 was considerably different with those at the WT1 and WT2. In comparison with the WT1, the frequency distribution of the wind speed at the WT3 increased when the wind speed varied from 1 to 3 m·s−1, especially for the interval of 2–3 m·s−1 with an increase by 11.81%. However, when the wind speed at the WT3 was greater than 3 m·s−1, its frequency distribution is less than that at the WT1. Additionally, the maximum wind speed decreased from 9.40 (WT1) to 8.12 (WT3) m·s−1. The above analyses illustrate the blocking effect of embankment on natural wind flow.
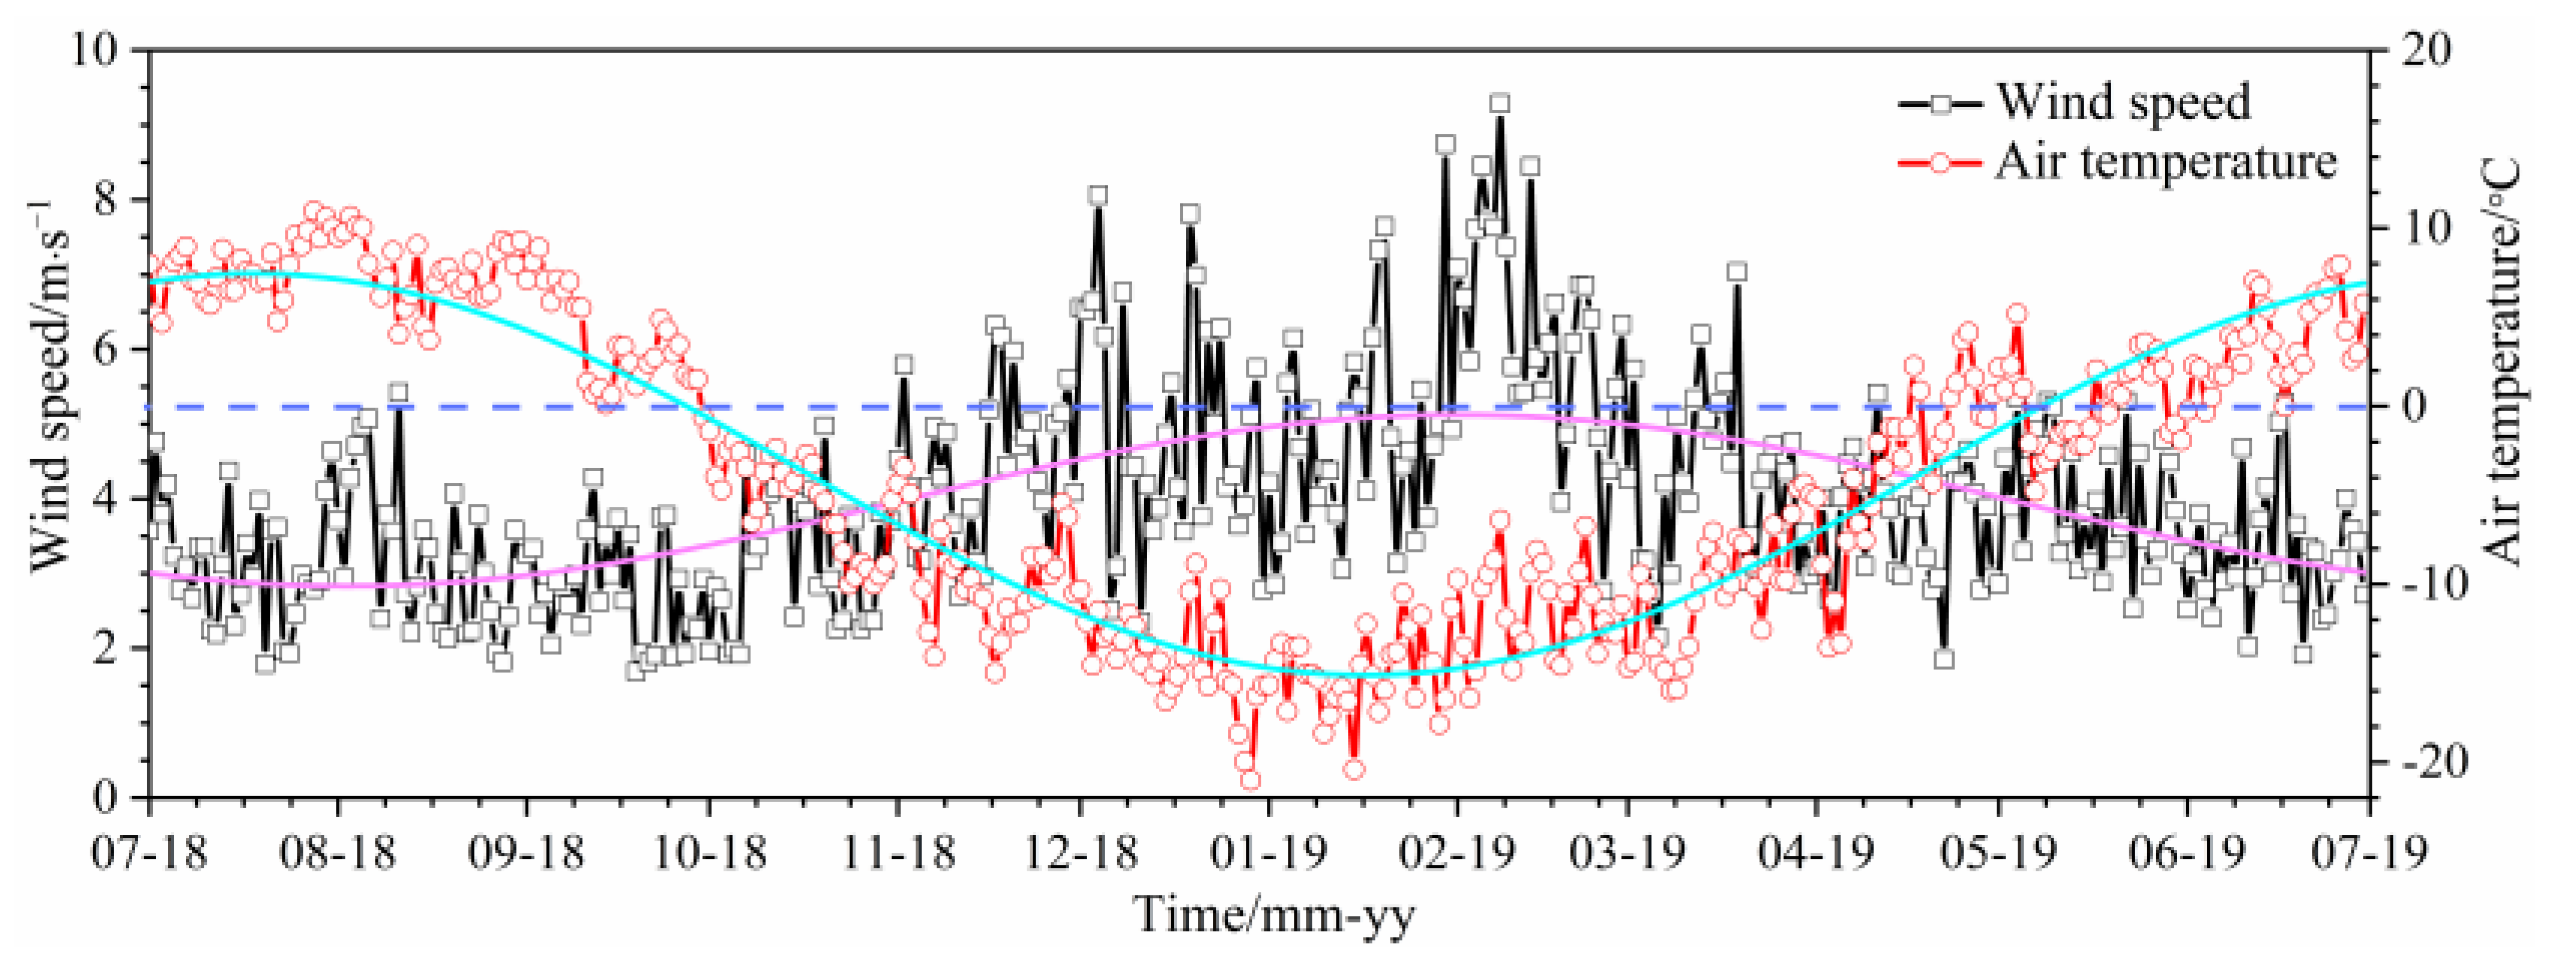
Figure 5 shows the variations in the mean daily wind speed at the height of 3.0 m and the mean daily air temperature at the height of 2 m above the ground at the WT1 in a year, from July 2018 to July 2019. It can be seen that the changes of both the wind speed and the air temperature with time could be fitted roughly by using a sinusoidal function. For the air temperature, it reached the maximum in July and the minimum in January, respectively. The period of cold seasons (meaning the air temperature below 0 °C) lasted for about eight mouths from October to next May, which was much longer than the period of the warm season. For the wind speed, it reached the maximum in February and the minimum in August. The period of strong wind, which means that the mean month wind speed is more than 3.98 m·s−1, was from November to April. Accordingly, the strong wind season in the study region corresponded to the period of cold seasons. The opposite seasonal change laws of the wind speed and the air temperature are highly beneficial to the cooling performance of the CRE with the CRL.
3. Numerical Simulation
3.1. Theory Model
Because of the differential heat transfer characteristics of different media, the model can be divided into three zones: the air zone outside the CRL of the embankment, the zone of the CRL and the zone of the soil layers. First of all, air is assumed to be an incompressible fluid with constant physical properties, the influence of air temperature on airflow speed could be neglected. Based on the heat transfer theories [13,33,34], the air-convection within the CRL, heat conduction and phase change occurring in freeze−thaw soil layers are considered in the model. The air-convection with the CRL is an unsteady seepage, so the motion of the interstitial air is only considered in the model. The heat conduction with phase change is major form of energy exchange in soil layers, and the problem of the phase change is solved by using the method of sensible heat capacity. Thus, the continuity, momentum, energy equations for these three zones are presented by the references [13,15,33,35].
3.2. Physical Model and Parameters
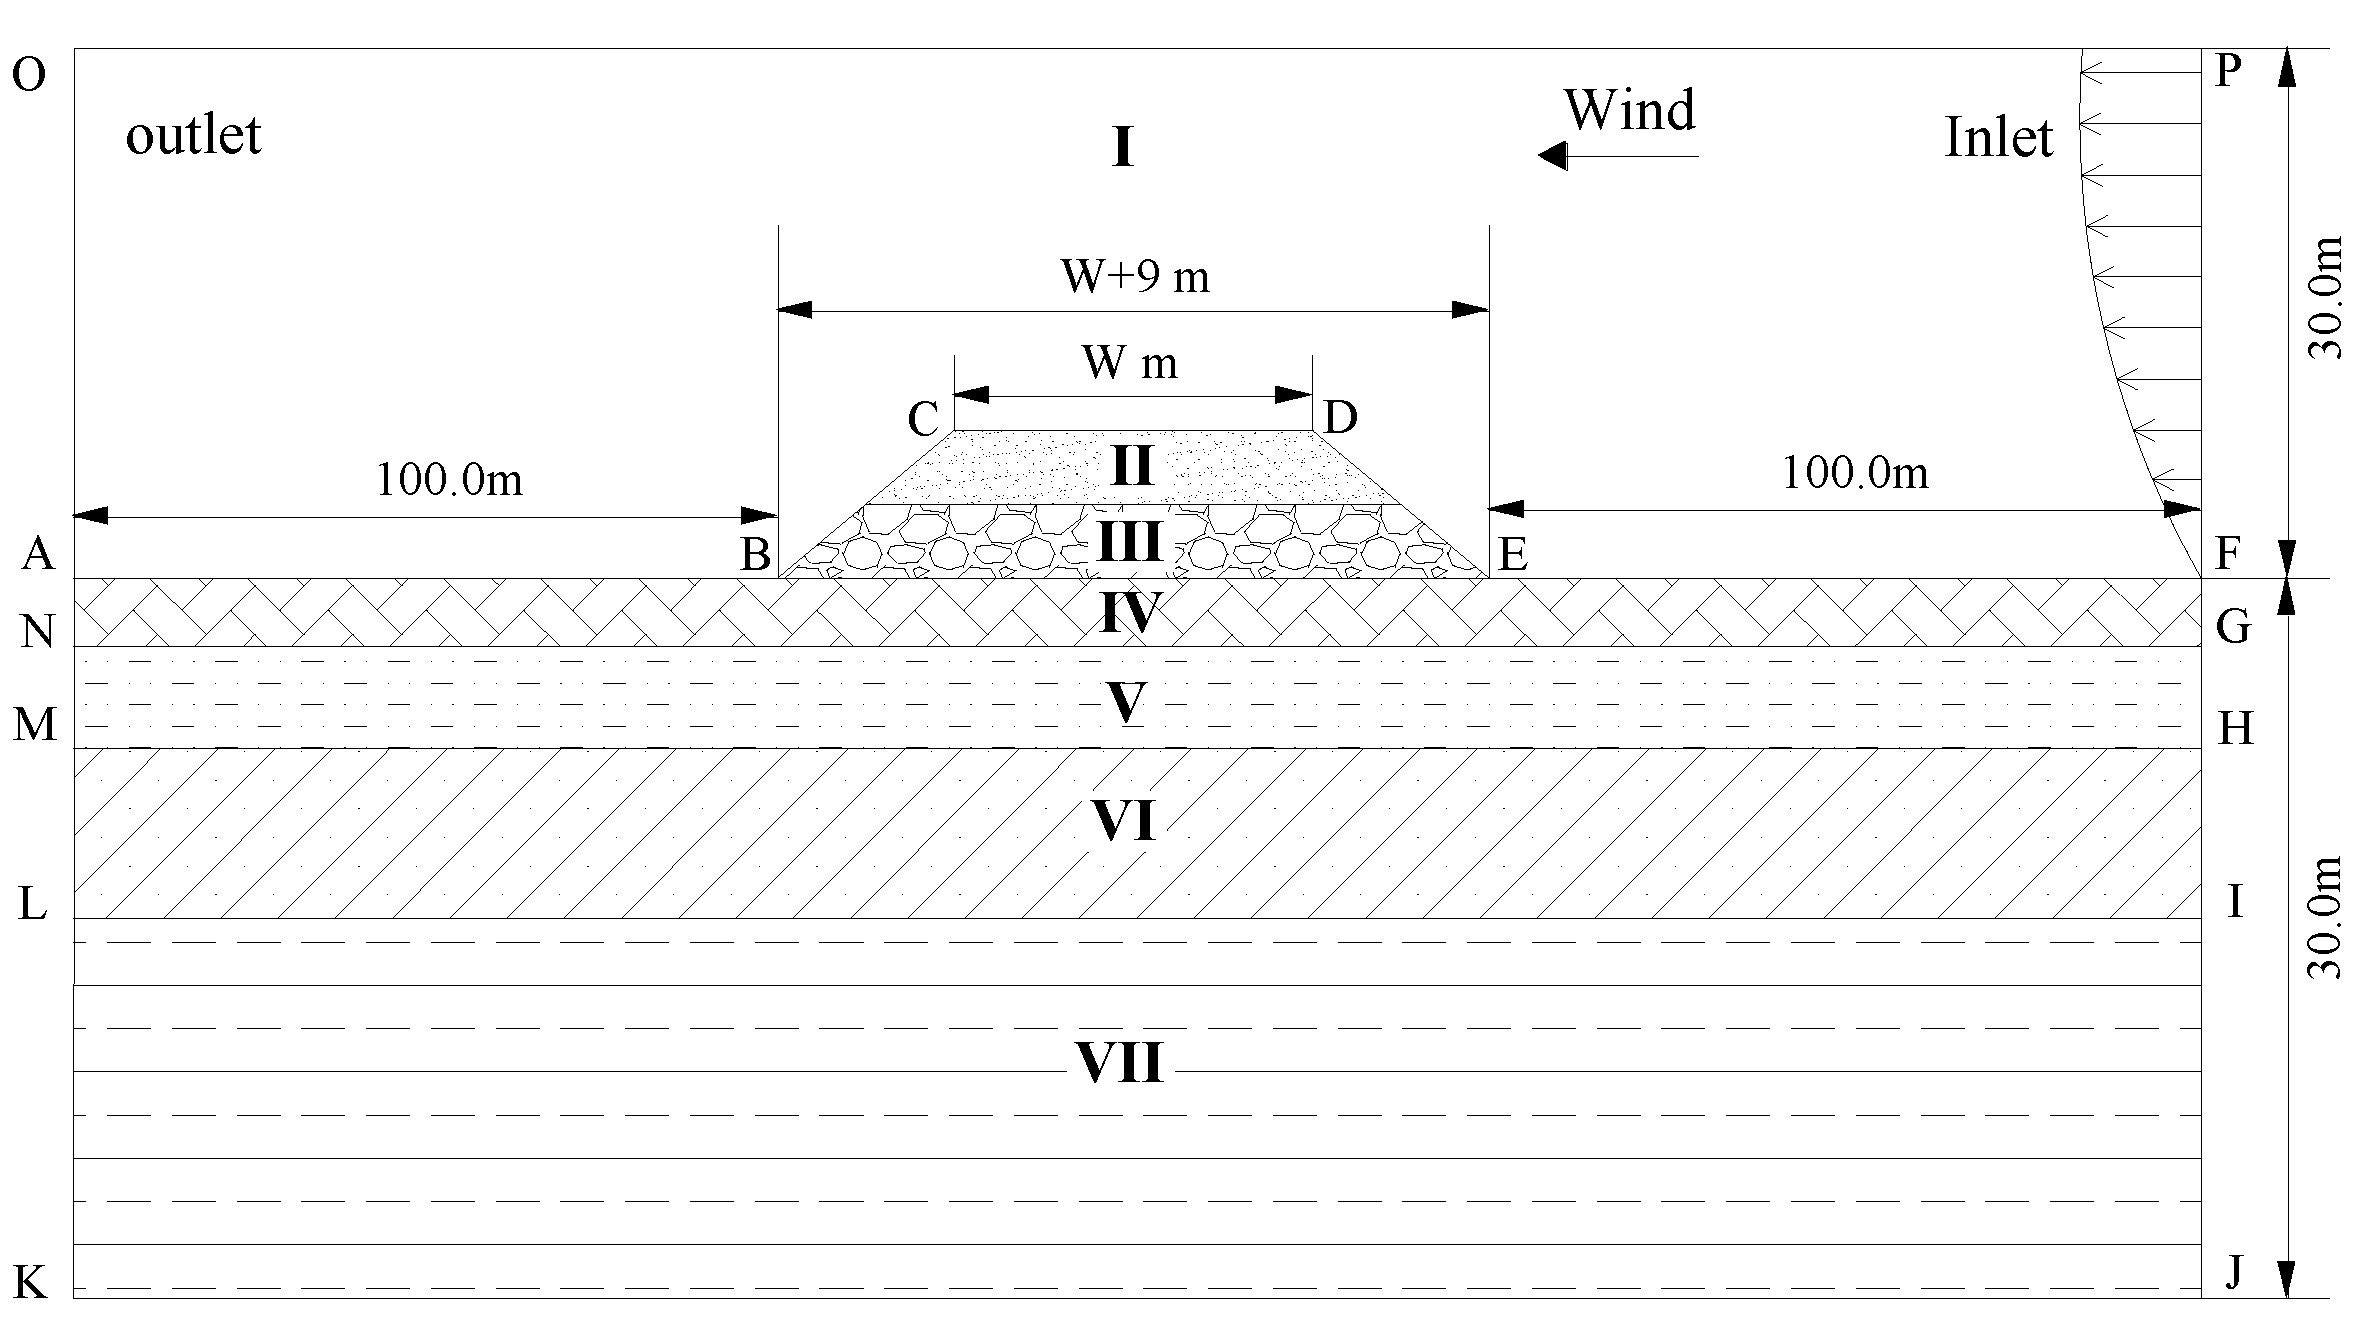
In this study, the physical model of CRE with the CRL is sketched in Figure 6. The W stands for the pavement width of the embankment. The height of the embankment is 3 m. The gradient of slope is 1:1.5. The CRL is 1.2 m thick and built as the bottom layer of the embankment. The porosity of the CRL is selected as 0.3 based on the diameters of the crushed rocks, and its related permeability (k) and inertial resistance (B) are 2.98 × 10⁻⁶ m2 and 180.19 m−1 [36]. The pavement width of the embankment is 26 m, which is called as the wide crushed-rock embankment (WCRE) corresponding to the proposed expressway in permafrost region. Comparatively, the embankment with the pavement width of 13 m is called as the narrow crushed-rock embankment (NCRE) corresponding to the ordinary highway. In order to eliminate the boundary effect, the domain is extended to 100 m on both sides away from the two slope toes of the embankment in horizontally and to 30 m beneath/above the natural ground surface in vertically. In the picture, Parts I~VII are respectively air, embankment filling, CRL, gravel and clayey, gravel soil, silty clay, and weathered mudstone. The parameters of parts I~VII are given in Table 2 and Table 3 [13,37].
3.3. Boundary and Initial Conditions
In the computational model, the thermal boundary of natural ground surfaces and embankment surfaces are determined by the adherent layer theory [38], which could simplify the complex heat transfer at the surface and is widely used in the numerical simulation of permafrost engineering. Meanwhile, the climate warming that occurred in the Qinghai−Tibet Plateau is also considered by a mean annual warming rate, so the thermal boundary could be expressed by the following equation [13,15,35]:
where T0 is the mean annual temperature; A is the annual changing amplitude of the temperature; th is the time; α0 is the phase angle, determined by the finishing time of embankment construction; Trate is the predicted mean annual warming rate of air temperatures on the Qinghai−Tibet Plateau, which was 0.052 °C·a−1 according to Qin [39]; a constant heat flux of 0.03 W·m−2 is set at the bottom surface (KJ in the Figure 6); and the lateral boundaries (ANMLK and FGHIJ in the Figure 6) are assumed to be adiabatic.
In the calculation, the mean annual air temperature was approximately −3.5 °C in the study area. The mean annual temperatures on the natural ground surfaces (AB and EF in the Figure 6), on the side slope surfaces (BC and DE in the Figure 6), and on the asphalt pavement surfaces (CD in the Figure 6) were calculated based on the mean annual air temperature and increase by 2.5, 4.7, and 6.5 °C, respectively. Thus, the values of T0 and A are obtained and shown in Table 4.
According to the field monitoring data for the wind speed at Beiluhe on the Qinghai−Tibet Plateau, the airflow inlet boundary (PF) in the Figure 6 is expressed as follows [35]:
where is the time; y is the height above the natural ground; and and are the wind speeds at the height of 10 m and H m above the ground, respectively.
Without considering the climate warming, the initial temperature fields of the soil layers beneath the embankment (Parts IV~VII in Figure 6) on July 15 were calculated and obtained through a long-term transient solution using the thermal boundary condition. The initial temperatures of Parts II and III were determined by the temperature of shallow soil layers on July 15, and the initial wind temperature was set as the air temperature on that date. The initial wind field in Part I was obtained by using the airflow inlet boundary (Equations (2) and (3)) without considering the effect of thermal boundary conditions.
3.4. Model Validation
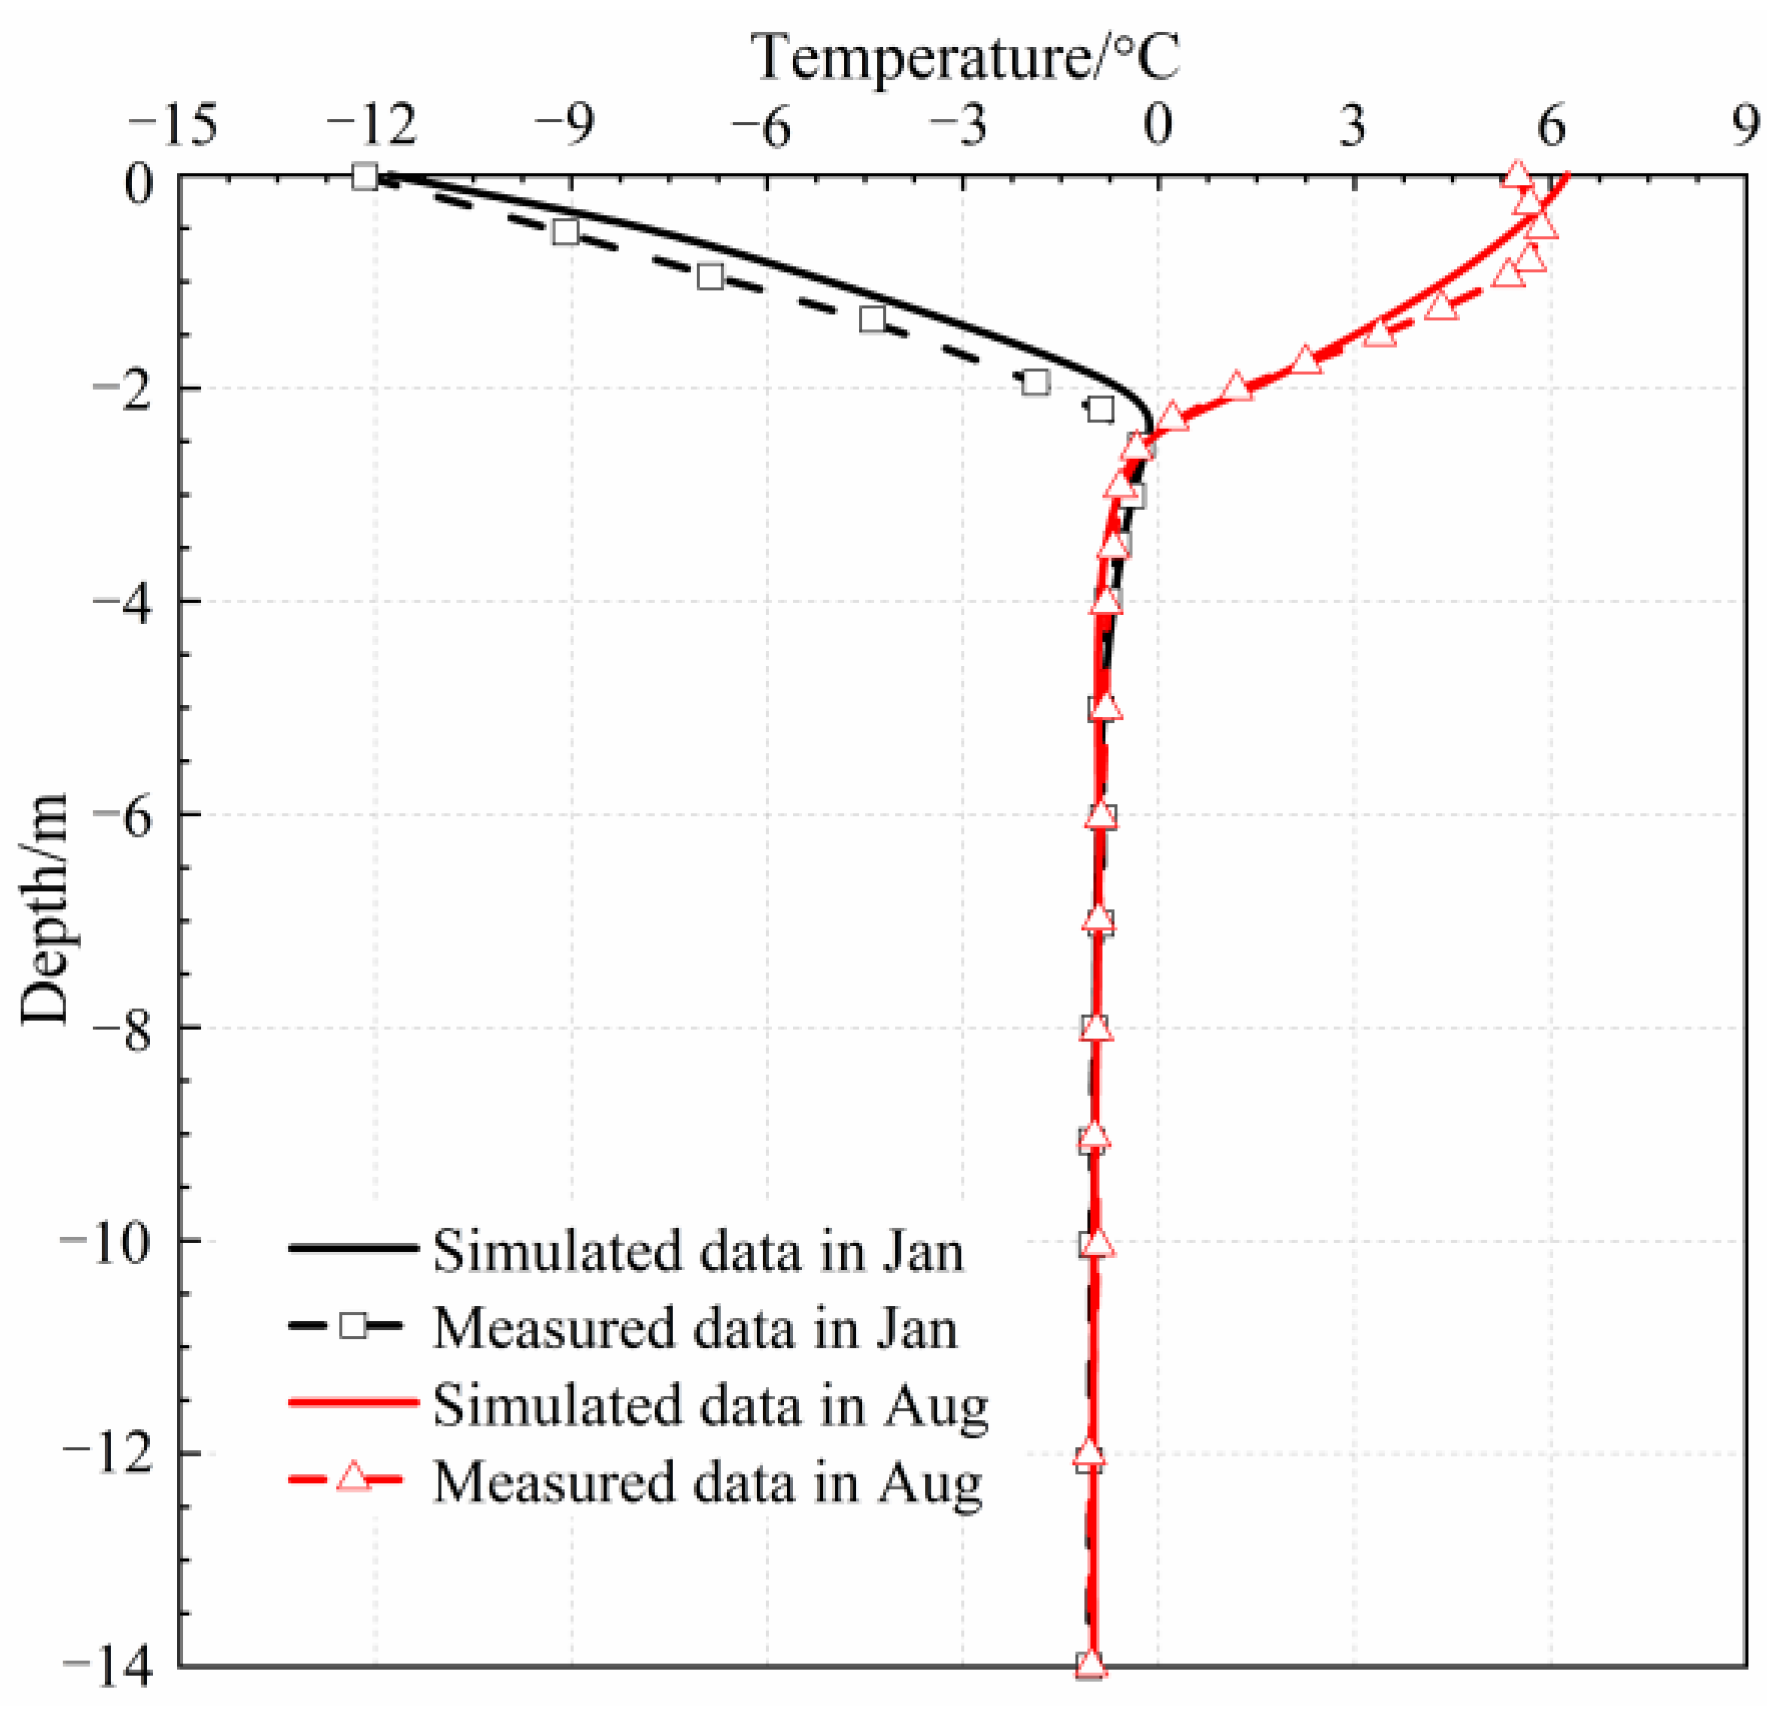
A physical model of the embankment is established according to the scale of the experimental embankment. The numerical model can be well-verified by using the field observations of wind speeds from the three wind-towers and soil temperatures on the natural ground. Figure 7 shows the variations in measurements of wind speeds at the three wind-towers, as well as the simulated mean monthly wind speeds at the corresponding locations. The simulated wind speeds are obtained by the calculation model with the airflow inlet boundary (Equations (2) and (3)). It is found that the simulated results agreed well with the measured data. Figure 8 shows the comparison between the measured and simulated soil temperatures in January and August. When the depth is lower than 2.5 m, the simulated soil temperatures agreed well with the measured data, and both of them reached to a constant of −0.99 °C. In the active layer, which is from the ground surface to the depth of 2.5 m below, a difference between the measured and simulated soil temperatures existed. This discrepancy may a result of the simplification of thermal boundaries and soil parameters. Therefore, the numerical model could be used to investigate the wind field around the embankment and the temperature field of embankment and underlying soils.
4. Results and Analysis
4.1. Characteristics of Wind Flow around the Embankment
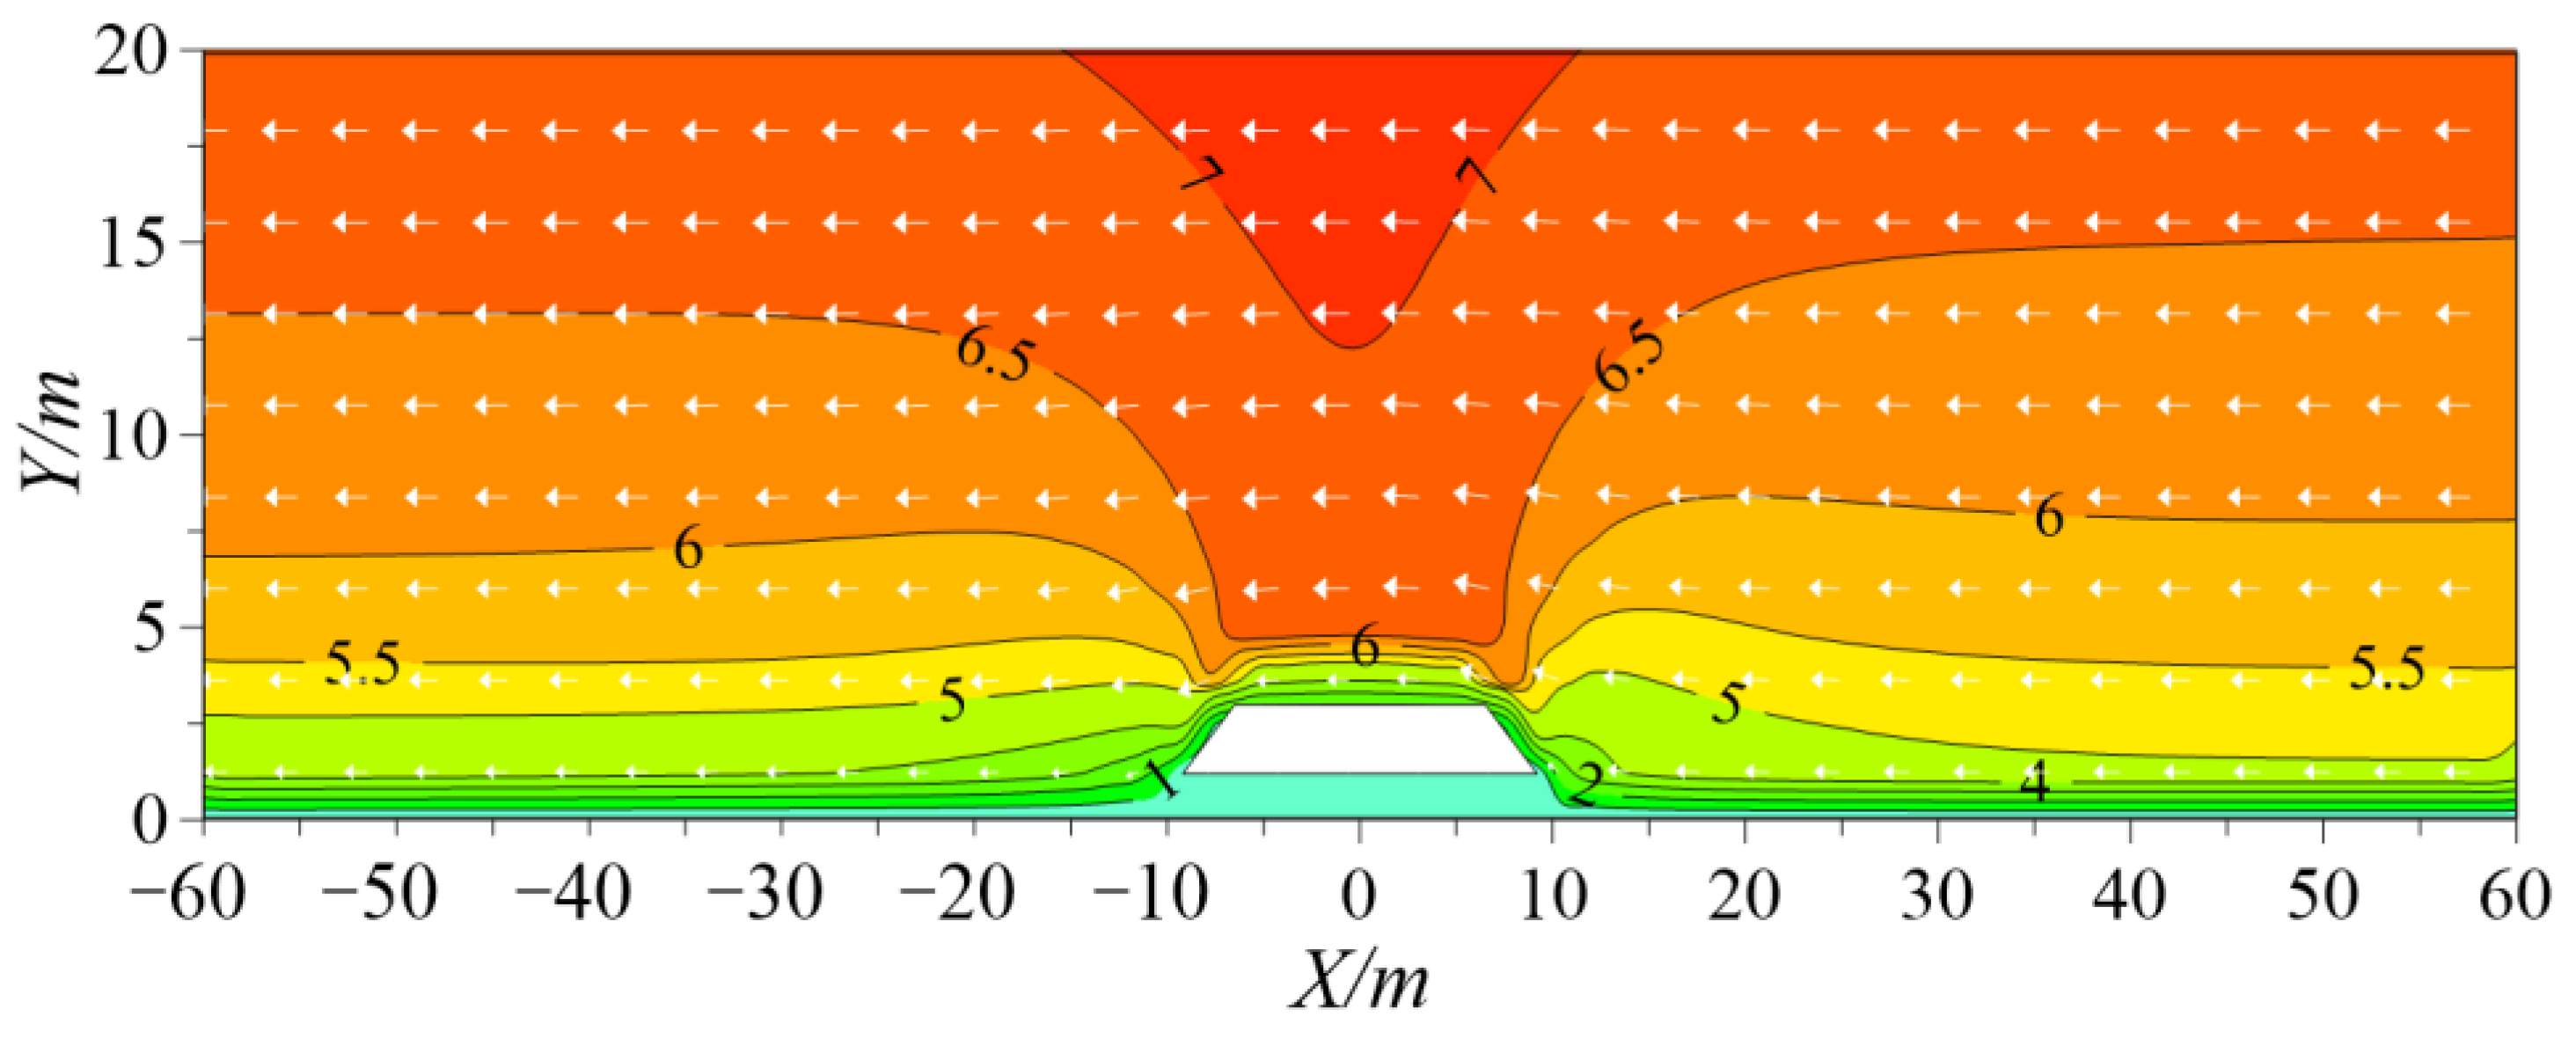
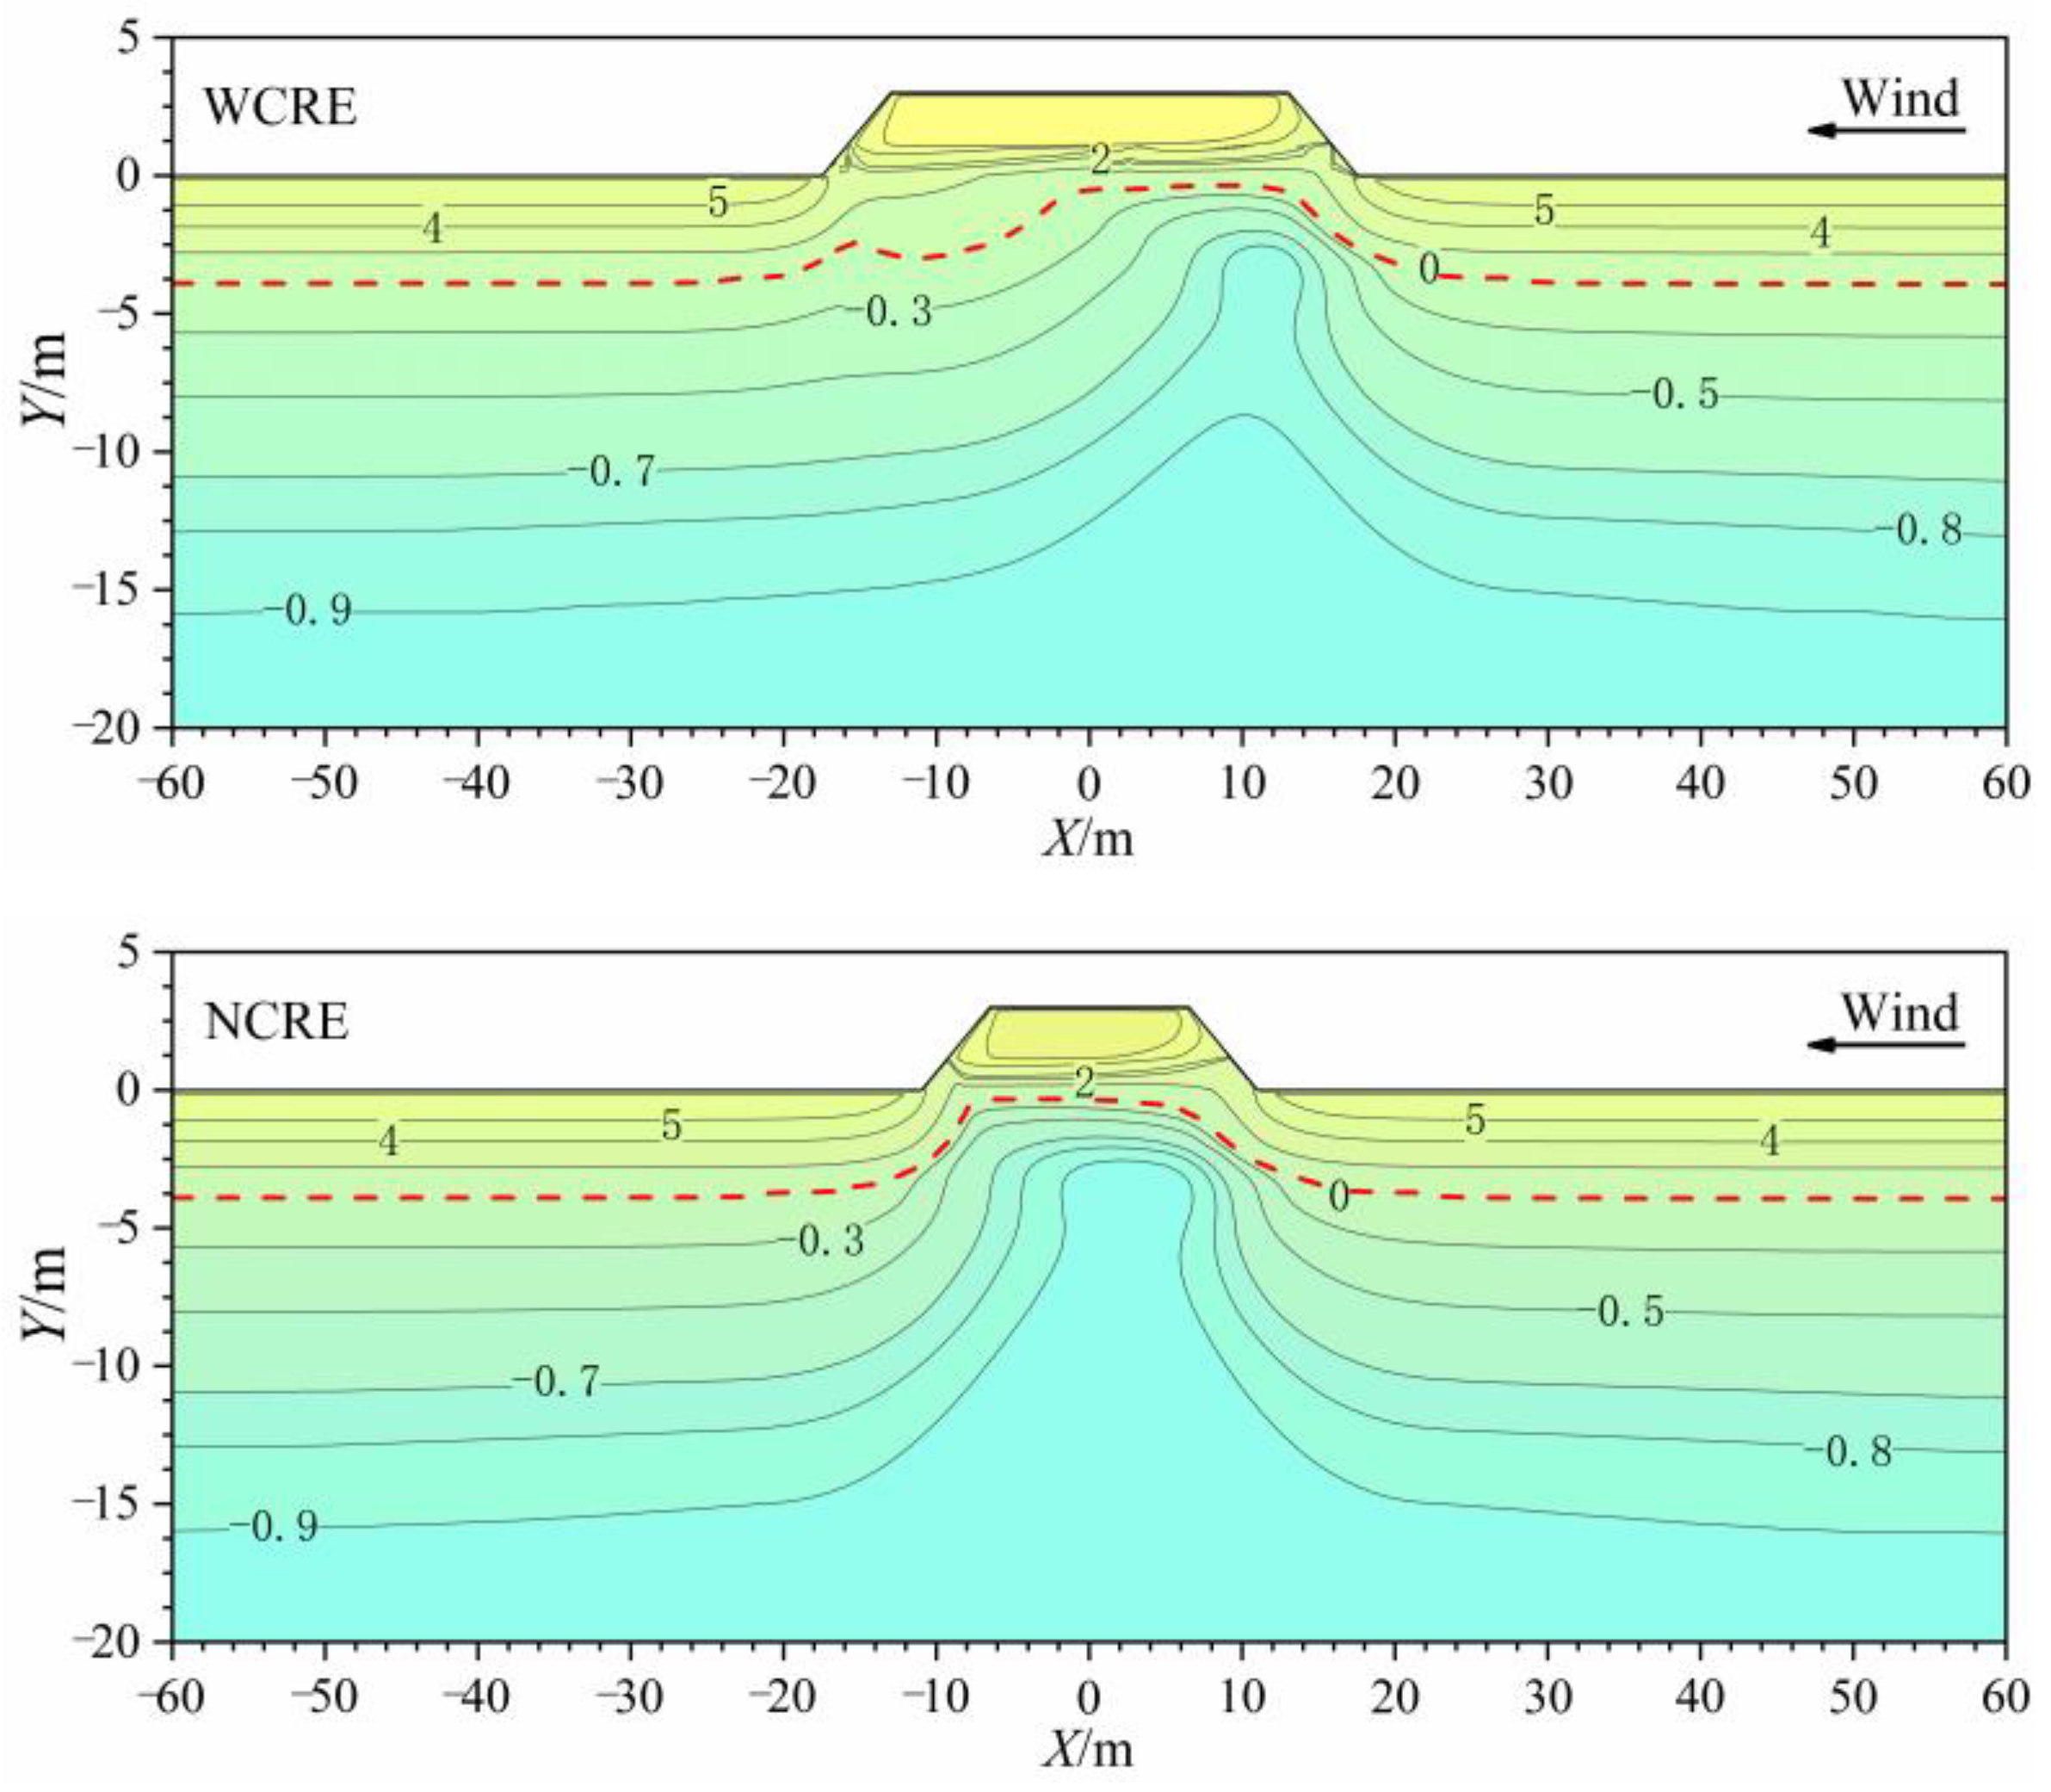
Because the variations in the wind speed at the boundary are based on the Equations (2) and (3), the change characteristics of the wind flow around the embankments with different pavement widths are pretty similar to each other. The distribution of the wind flow around the NCRE in February was selected for the analysis. As shown in Figure 9, the X-axis stands for the distance from the centerline of the embankment in horizontally, the Y-axis stands for the height above the ground in vertically, and the white arrow indicates the wind direction. It can be seen that the existence of the embankment remarkably changed the magnitude of wind speed, as well as the direction of wind flow in the area close to the embankment. The wind was blocked on the windward slope of the embankment, and the wind speed increased as it flew up the slope and reached the maximum at the shoulder. The direction of the disturbed wind flow above the pavement was basically in horizontally, the wind speed in this area was faster compared to the other locations with same heights because of the wind flow accelerating along the windward slope. However, the wind speed around the leeward slope decreased as the height went down, which reached the minimum at the leeward slope toe. After passing by the embankment, the wind speed would gradually recover to the natural conditions in the flowing speed and direction.
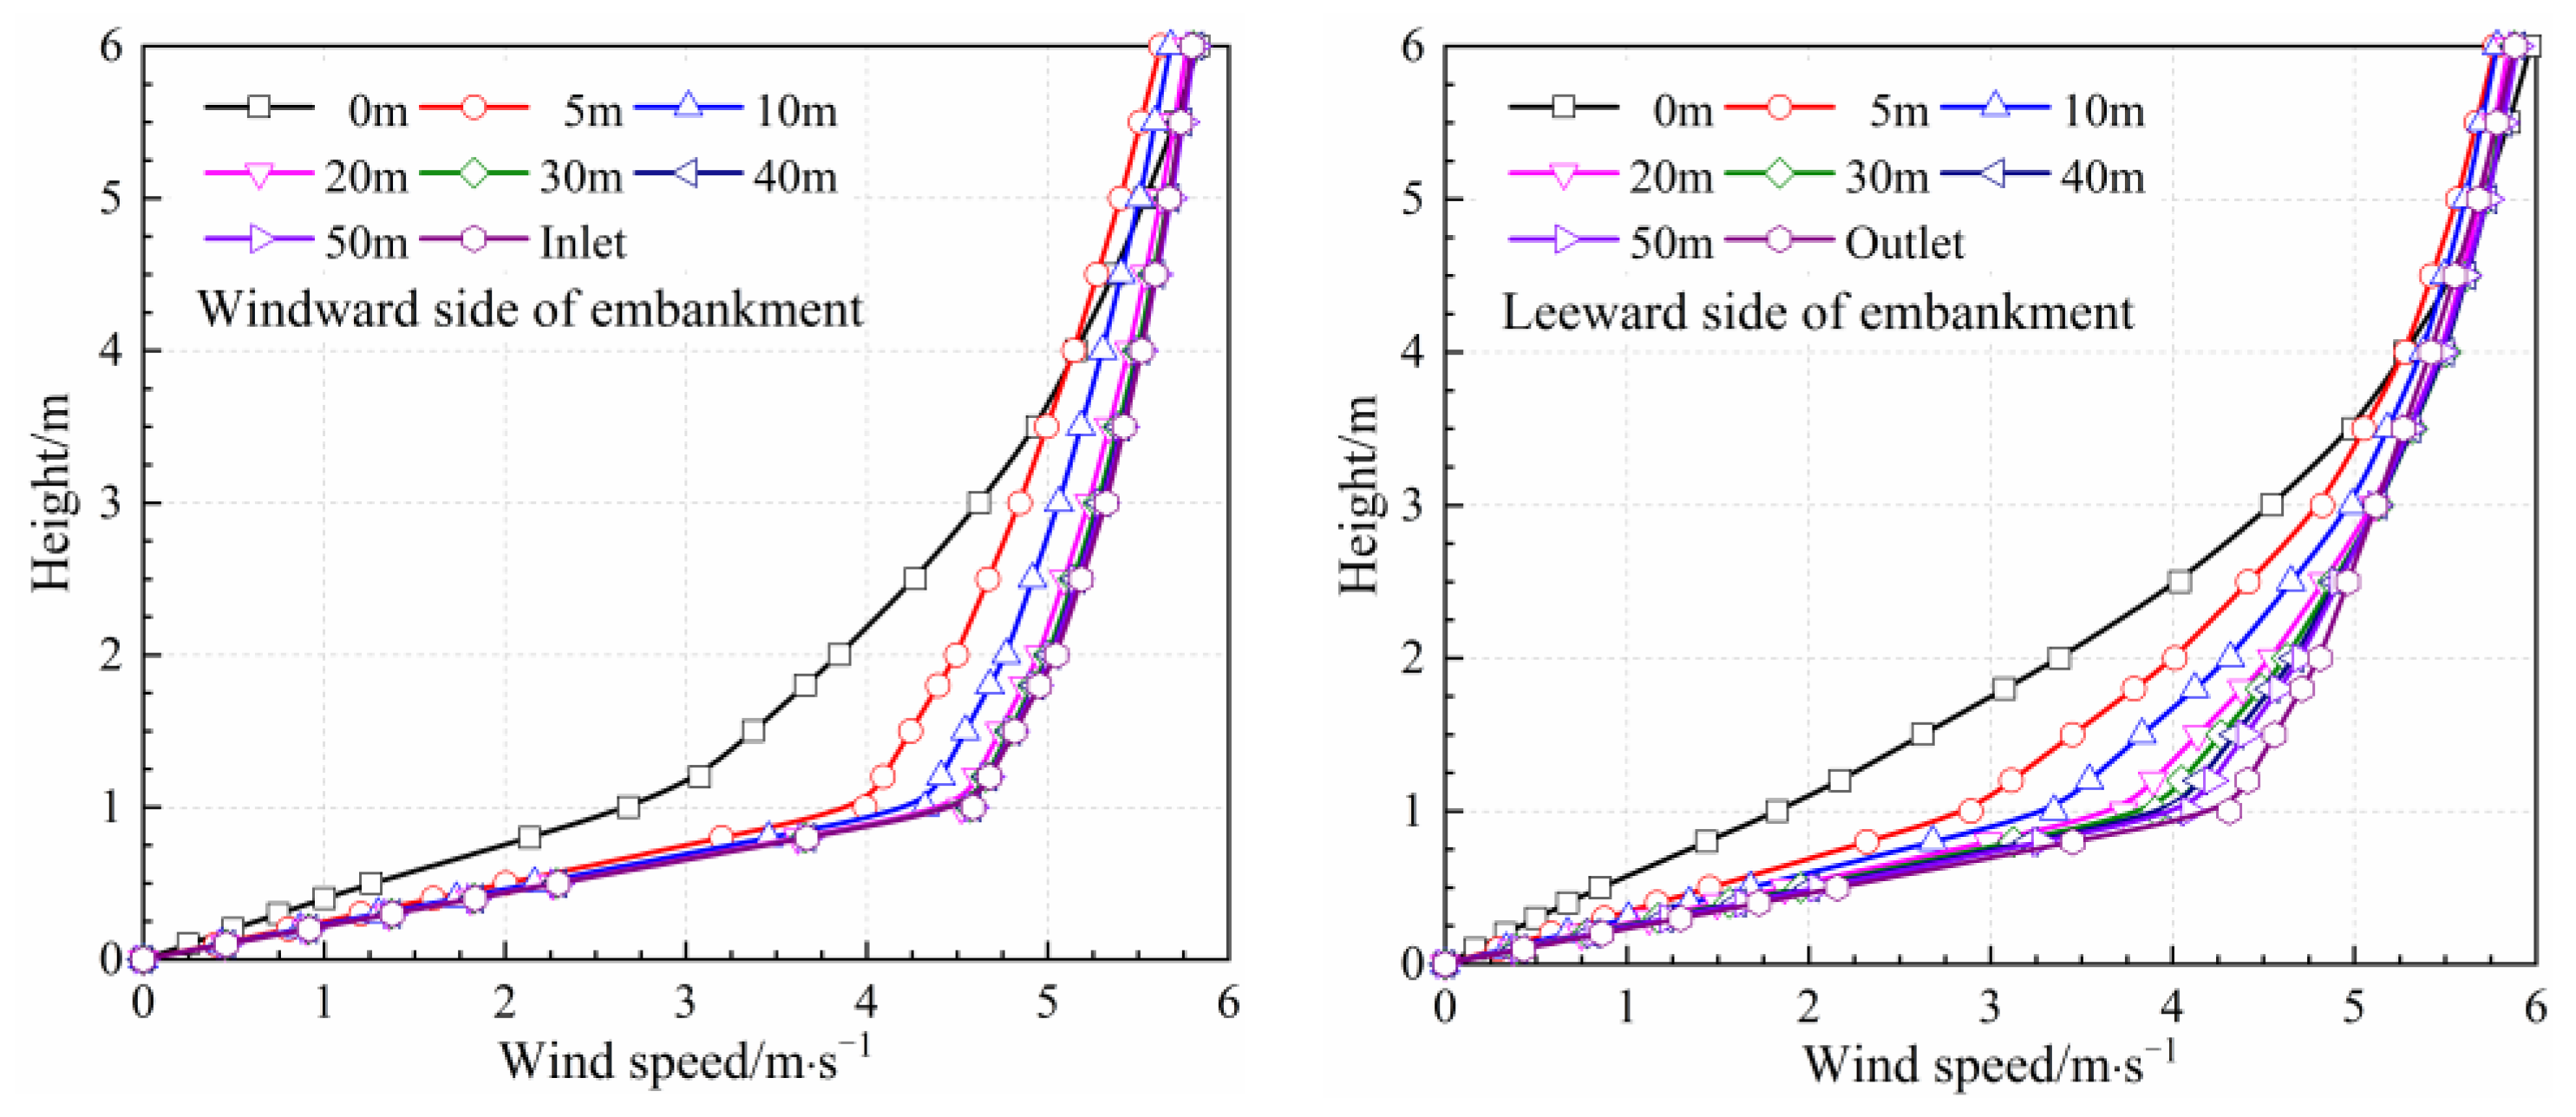
Figure 10 shows the vertical distribution of the wind speed from the ground surface up to the height of 6 m at the locations of 0, 5, 10, 20, 30, 40 and 50 m away from the slope toe of the embankment on both sides. Because of the blocking of the embankment on the wind flow, the wind field around the embankment was redistributed and presented an obvious difference. Compared to the natural conditions, the maximum difference in wind speed at the windward and leeward slopes approximately occurred at the height of 1 m above the ground and reached 1.90 and 2.76 m·s−1, respectively. According to the variations in the wind speed away from the embankment, the disturbance range of embankment on wind speed at the two sides was obvious different. When the decrease in the wind speed was less than 10% of the natural wind speed at the height of 1 m, it can be considered that the wind speed was slightly affected by the embankment. As a result, the disturbance range of embankment on the wind speed was approximately 7 m on the windward side and 54 m on the leeward side in horizontally. Consequently, the disturbance amplitude of the embankment on the wind speed at the leeward side was greater than that at the windward side, and the difference in the wind speed at the two sides of the CRE should be paid more attention. In addition, the cooling mechanism of the CRE is formed by the natural convection, and its cooling effect on the underlying soils is mainly determined by the wind speed within the CRL. Based on the simulated results, it is found that the increase in pavement width causes the decrease in the wind speed within the CRL.
4.2. Cooling Effect of the CRE with Different Pavement Widths
The simulated results of the temperature field are obtained based on the thermal boundary of the Equation (1). Figure 11 shows the distribution of the soil temperatures beneath the WCRE and the NCRE on October 15 in the 50th year after the embankment construction. It can be found that the thermal regime beneath the embankments was considerably affected by the pavement width. The thermal regime beneath the embankments was worse when the pavement width was 26 m. In comparison with the NCRE, the permafrost beneath the WCRE degraded significantly and the soil temperature at the depth of 6 m beneath the center of embankment warm up 0.34 °C. The cooling effect of the CRL on underlying soils could be weakened with the increase in the pavement width, which could not efficiently offset the heat absorption from the asphalt pavement and the slope. In addition, because of the difference in the wind speed at the windward and leeward sides of the embankments, an asymmetric distribution of soil temperatures was the general pattern on both sides below the embankment slope toes. Especially for the WCRE, the cooling effect of the CRL was primarily on the right embankment and poor on the left embankment.
Table 5 shows the variations in the permafrost table and the soil temperatures at the depth of 6 m beneath the WCRE and the NCRE on October 15 in the 50th year after the embankment construction. As the pavement width increased from 13 to 26 m, the soil temperatures beneath the embankments would warm up and the permafrost table would go down. It is concluded that the cooling effect of the CRL on the underlying soils would be gradually weakened along with the increase in pavement width. Meanwhile, because the pavement width of the NCRE is half of the WCRE, the amount of heat absorbed by the asphalt pavement surface on the NCRE is much less than that on the WCRE. The decrease in the pavement width is also helpful to improve the ventilation efficiency of the CRL, as a result, the cooling effect of the NCRE is greatly superior to the WCRE. In addition, the soil temperatures beneath the windward slope toe of embankments were lower than that beneath the leeward slope toe, which can be explained by the strong cooling effect occurring in the CRL annually.
5. Discussions and Conclusions
Through the analysis of the modeled wind field around and temperature field beneath the embankments, it can be concluded that the cooling effect of the CRE is related to the pavement width. The increase in pavement width could considerably enhance the resistance of crushed rock to wind flow within the CRL, which meant that the WCRE could not play a role in cooling down the permafrost below the embankment. Additionally, the asymmetric distribution of the soil temperatures beneath the windward and leeward sides of the embankments existed, which could cause the occurrence of uneven settlements and pavement cracks.
Nowadays, the Qinghai−Tibet expressway is planned to be built in the Qinghai−Tibet Project corridor. The thermal−mechanical stability of the foundation soils is the most important issue for the expressway subgrade constructed in permafrost regions. However, due to the heat gathering effect of the wide asphalt pavement and the ventilation efficiency of the CRL, the cooling effect of the WCRE could not ensure a long-term thermal stability of embankment and underlying soils. With a view to the long-term thermal−mechanical stability of the proposed expressway, the reasonable pavement width and the improvement of ventilation efficiency of the CRL should be taken into consideration to maximize the cooling effect of the CRE.
Based on the field monitoring data and the numerical simulations, the wind characteristics and cooling effects of the CRE with the different pavement widths are comparatively studied under the climate warming. The major conclusions can be drawn:
- The existence of the embankment considerably changes the magnitude and direction of wind flow, and the wind speed close to the windward and leeward sides of the embankment decreases significantly. The disturbance range of the embankment on the wind speed was approximately 7 m on the windward side and 54 m on the leeward side horizontally. Additionally, there is an obvious difference in wind speed within the CRL because of the differential pavement width.
- The thermal regimes beneath the embankments are considerably affected by the pavement width. In comparison with the NCRE, the permafrost beneath the WCRE degraded significantly and the soil temperature at the depth of 6 m beneath the center of the embankment warm up 0.34 °C. Because of the abundant heat absorption by the wide pavement and the strong resistance of crushed rock to wind flow within the CRL, the cooling effect of the WCRE cannot effectively protect the underlying permafrost.
- Due to the differential wind flow around the embankment, the soil temperatures beneath the windward and leeward sides of the embankment show an obvious asymmetric distribution. The increase in the pavement width is beneficial to enhance this asymmetry based on the variations in soil temperatures.
Author Contributions
Methodology, X.L. and H.Z.; software, X.L. and H.Z.; writing—original draft preparation, X.L.; writing—review and editing, H.Z. and X.W.; funding acquisition, H.Z. All authors have read and agreed to the published version of the manuscript.
Funding
This research is supported by the Open Fund of the State Key Laboratory of Frozen Soils Engineering (Grant No. SKLFSE202101).
Institutional Review Board Statement
Not applicable.
Informed Consent Statement
Not applicable.
Data Availability Statement
Not applicable.
Conflicts of Interest
The authors declare no conflict of interest.
References
- Gruber, S. Derivation and analysis of a high-resolution estimate of global permafrost zonation. Cryosphere 2012, 6, 221–233. [Google Scholar] [CrossRef] [Green Version]
- Wu, Q.B.; Hou, Y.D.; Yun, H.B.; Liu, Y.Z. Changes in active-layer thickness and near-surface permafrost between 2002 and 2012 in alpine ecosystems, Qinghai-Xizang (Tibet) Plateau, China. Glob. Planet. Chang. 2015, 124, 149–155. [Google Scholar] [CrossRef]
- Jin, H.J.; Wu, Q.B.; Vladimir, E.R. Degrading permafrost and its impacts. Adv. Clim. Chang. Res. 2021, 12, 1–5. [Google Scholar] [CrossRef]
- Chen, L.; Voss, C.L.; Fortier, D.; Mckenzie, J.M. Surface energy balance of sub-Arctic roads and highway in permafrost regions. Permafr. Periglac. Process. 2021, 32, 681–701. [Google Scholar] [CrossRef]
- Wu, Q.B.; Niu, F.J. Permafrost changes and engineering stability in Qinghai-Xizang Plateau. Chin. Sci. Bull. 2013, 58, 1079–1094. [Google Scholar] [CrossRef] [Green Version]
- Batenipour, H.; Alfaro, M.; Kurz, D.; Graham, J. Deformations and ground temperatures at a road embankment in northern Canada. Can. Geotech. J. 2014, 51, 260–271. [Google Scholar] [CrossRef]
- Dore, G.; Niu, F.J.; Brooks, H. Adaptation methods for transportation infrastructure built on degrading permafrost. Permafr. Periglac. Process. 2016, 27, 352–364. [Google Scholar] [CrossRef]
- Yuan, C.; Yu, Q.H.; You, Y.H.; Guo, L. Deformation mechanism of an expressway embankment in warm and high ice content permafrost regions. Appl. Therm. Eng. 2017, 121, 1032–1039. [Google Scholar] [CrossRef]
- Wu, Q.B.; Zhao, H.T.; Zhang, Z.Q.; Chen, J.; Liu, Y.Z. Long-term role of cooling the underlying permafrost of the crushed rock structure embankment along the Qinghai-Xizang railway. Permafr. Periglac. Proc. 2020, 31, 172–183. [Google Scholar] [CrossRef]
- Mu, Y.H.; Li, G.Y.; Ma, W.; Song, Z.M.; Zhou, Z.W.; Wang, F. Rapid permafrost thaw induced by heat loss from a buried warm-oil pipeline and a new mitigation measure combining seasonal air-cooled embankment and pipe insulation. Energy 2020, 203, 117919. [Google Scholar]
- Chen, L.; Yu, W.B.; Liu, W.B.; Yi, X. Numerical simulation of pile foundations of Qinghai-Tibet power transmission line: Influence of temperature region. Appl. Mech. Mater. 2014, 501, 218–223. [Google Scholar] [CrossRef]
- Chen, L.; Yu, W.B.; Zhang, T.Q.; Yi, X. Asymmetric talik formation beneath the embankment of Qinghai-Tibet Highway triggered by the sunny-shady effect. Energy 2023, 266, 126472. [Google Scholar] [CrossRef]
- Lai, Y.M.; Zhang, M.Y.; Li, S.Y. Theory and Application of Cold Regions Engineering; Science Press: Beijing, China, 2009; pp. 34–124. [Google Scholar]
- Mu, Y.H.; Ma, W.; Sun, Z.Z.; Liu, Y.Z. Comparative analysis of cooling effect of crushed rock embankment along the Qinghai-Tibet Railway. Rock Soil Mech. 2010, 31, 284–292. [Google Scholar]
- Zhang, M.Y.; Zhang, X.Y.; Li, S.Y.; Wu, D.Y.; Pei, W.S.; Lai, Y.M. Evaluating the cooling performance of crushed-rock interlayer embankments with unperforated and perforated ventilation ducts in permafrost regions. Energy 2015, 93, 874–881. [Google Scholar] [CrossRef]
- Chen, L.; Yu, W.B.; Lu, Y.; Wu, P.; Han, F.L. Characteristics of heat fluxes of an oil pipeline armed with thermosyphons in permafrost regions. Appl. Therm. Eng. 2021, 190, 116694. [Google Scholar] [CrossRef]
- Wu, Q.B.; Liu, G.; Liu, Y.Z.; Zhang, T.J. Thermal performance of embankment within crushed rock layer along Qinghai-Tibet Railway. Int. J. Offshore Polar Eng. 2010, 20, 210–217. [Google Scholar]
- Darrow, M.M.; Jensen, D.D. Modeling the permafrost of an air convection embankment (ACE) with thermal berm over ice-rich permafrost, Lost Chicken Creek, Alaska. Cold Reg. Sci. Technol. 2016, 130, 43–58. [Google Scholar] [CrossRef]
- Mu, Y.H.; Ma, W.; Niu, F.J. Long-term thermal effects of air convection embankments in permafrost zones: Case study of the Qinghai-Tibet Railway, China. J. Cold Reg. Eng. 2018, 32, 05018004. [Google Scholar] [CrossRef]
- Chen, L.; Yu, W.B.; Yi, X.; Hu, D.; Liu, W.B. Numerical simulation of heat transfer of the crushed-rock interlayer embankment of Qinghai-Tibet Railway affected by aeolian sand clogging and climate change. Cold Reg. Sci. Technol. 2018, 155, 1–10. [Google Scholar] [CrossRef]
- Moeseke, G.V.; Gratia, E.; Reiter, S.; Herde, A.D. Wind pressure distribution influence on natural ventilation for different incidences and environment densities. Energy Build. 2005, 37, 878–889. [Google Scholar] [CrossRef] [Green Version]
- Cheng, G.D.; Lai, Y.M.; Sun, Z.Z.; Jiang, F. The ‘thermal semi-conductor’ effect of crushed rocks. Permafr. Periglac. Proc. 2007, 18, 151–160. [Google Scholar]
- Wu, Q.B.; Cheng, H.B.; Jiang, G.L.; Ma, W.; Liu, Y.Z. Cooling mechanism of embankments with block stone interlayer in Qinghai-Tibet railway. Sci. China Ser. E Technol. Sci. 2007, 50, 319–328. [Google Scholar] [CrossRef]
- Chen, L.; Lai, Y.M.; Fortier, D.; Harris, S.A. Impacts of snow cover on the pattern and strength of mobile air flow in air convection embankment in sub-Arctic regions. Renew. Energy 2022, 199, 1033–1046. [Google Scholar] [CrossRef]
- Pei, W.S.; Zhang, M.Y.; Li, S.Y.; Lai, Y.M.; Jin, L. Enhancement of convective cooling of the porous crushed-rock layer in cold regions based on experimental investigations. Int. Commun. Heat Mass Transf. 2017, 87, 14–21. [Google Scholar] [CrossRef]
- Liu, M.H.; Ma, W.; Niu, F.J.; Luo, J.; Yin, G.A. Thermal performance of a novel crushed-rock embankment structure for expressway in permafrost regions. Int. J. Heat Mass Transf. 2018, 127, 1178–1188. [Google Scholar] [CrossRef]
- Zhao, H.T.; Wu, Q.B.; Zhang, Z.Q. Long-term cooling effect of the crushed rock structure embankments of the Qinghai-Tibet Railway. Cold Reg. Sci. Technol. 2019, 160, 21–30. [Google Scholar] [CrossRef]
- Qian, J.; Yu, Q.H.; You, Y.H. Analysis on the convection cooling process of crushed-rock embankment of high-grade highway in permafrost regions. Cold Reg. Sci. Technol. 2012, 78, 115–121. [Google Scholar] [CrossRef]
- Liu, M.H.; Niu, F.J.; Ma, W.; Fang, J.H.; Luo, J. Experimental investigation on the enhanced cooling performance of a new crushed-rock revetment embankment in warm permafrost regions. Appl. Therm. Eng. 2017, 120, 121–129. [Google Scholar] [CrossRef]
- Yu, Q.H.; Fan, K.; Qian, J.; Guo, L.; You, Y.H. Key issues of highway construction in permafrost regions in China. China Sci. Sinica Technol. 2014, 44, 425–432. [Google Scholar]
- Yu, Q.H.; Fan, K.; You, Y.H.; Guo, L.; Yuan, C. Comparative analysis of temperature variation characteristics of permafrost roadbeds with different widths. Cold Reg. Sci. Technol. 2015, 117, 12–18. [Google Scholar] [CrossRef]
- Zhao, M.; Miao, M.Q.; Wang, Y.C. Boundary Layer Meteorology; China Meteorological Press: Beijing, China, 1991. [Google Scholar]
- An, W.D.; Wu, Z.W.; Ma, W. Interaction among Temperature, Moisture and Stress Fields in Frozen Soil; Lanzhou University Press: Lanzhou, China, 1990. [Google Scholar]
- Tao, W.Q. Numerical Heat Transfer; Xi’an Jiaotong University Press: Xi’an, China, 2004. [Google Scholar]
- Li, X.L.; Ma, W.; Mu, Y.H.; Dong, J.H.; Chen, L. Wind field and thermal performances of an expressway constructed with two separated crushed-rock embankments in high-altitude permafrost zones. Transp. Geotech. 2021, 26, 100447. [Google Scholar] [CrossRef]
- Zhang, M.Y.; Lai, Y.M.; Li, D.Q.; Chen, W.; Tong, G.Q. Experimental study on ventilation characteristics of a concrete-sphere layer and a crushed-rock layer. Int. J. Heat Mass Transf. 2013, 59, 407–413. [Google Scholar] [CrossRef]
- Zhang, J.M.; Zhang, J.Z.; Liu, Y.Z. Study on the reasonable embankment height of Qinghai-Tibet railway in permafrost regions. China Railw. Sci. 2006, 27, 28–34. [Google Scholar]
- Zhu, L.N. Study of the adherent layer on different types of ground in permafrost regions on the Qinghai-Xizang Plateau. J. Glaciol. Geocryol. 1988, 10, 8–14. [Google Scholar]
- Qin, D.H. The Comprehensive Evaluating Report on the Environment Evolvement in West China; Science Press: Beijing, China, 2002; pp. 16–44. [Google Scholar]
Figure 1.
Diagram of the observation site: (a) distribution of frozen soil on the Qinghai–Tibet Plateau; and (b) location of the experimental embankment on the Qinghai–Tibet Plateau.
Figure 1.
Diagram of the observation site: (a) distribution of frozen soil on the Qinghai–Tibet Plateau; and (b) location of the experimental embankment on the Qinghai–Tibet Plateau.

Figure 2.
Pictures and illustrations of the wind-towers in the field.

Figure 3.
Variations in the wind speed at different heights of the three wind-towers from July 2018 to July 2019: (a) WT1 with the heights of 0.5, 1.5, and 3.0 m above the ground; (b) WT2 with the heights of 0.5, 1.5, and 3.0 m above the ground; and (c) WT3 with the heights of 0.5, 1.5, 3.0, and 4.5 m above the ground.

Figure 4.
Mean annual wind speed at different heights of the three wind-towers.

Figure 5.
Variations in the mean daily wind speed and the mean daily air temperature at the WT1 from July 2018 to July 2019.
Figure 5.
Variations in the mean daily wind speed and the mean daily air temperature at the WT1 from July 2018 to July 2019.

Figure 6.
Physical model of the CRE with the CRL.

Figure 7.
Comparisons between the measured and simulated wind speeds at different heights of the three wind-towers: (a–c) WT1 with the heights of 0.5, 1.5, and 3.0 m above the ground; (d–f) WT2 with the heights of 0.5, 1.5, and 3.0 m above the ground; and (g–j) WT3 with the heights of 0.5, 1.5, 3.0, and 4.5 m above the ground.

Figure 8.
Comparisons between the measured and simulated soil temperatures in January and August.

Figure 9.
Modeled distribution of the wind field around the NACE in February.

Figure 10.
Distribution of the wind speed from the ground surface up to the height of 6 m on the windward and leeward sides of embankment.
Figure 10.
Distribution of the wind speed from the ground surface up to the height of 6 m on the windward and leeward sides of embankment.

Figure 11.
Distribution of the soil temperatures beneath the WCRE and the NCRE on 15 October in the 50th year after the embankment construction.
Figure 11.
Distribution of the soil temperatures beneath the WCRE and the NCRE on 15 October in the 50th year after the embankment construction.


Table 1.
Frequency distribution of the mean daily wind speed at the height of 3.0 m from the three wind-towers (%).
Table 1.
Frequency distribution of the mean daily wind speed at the height of 3.0 m from the three wind-towers (%).
| Wind Speed/m·s−1 | WT1 | WT2 | WT3 |
|---|---|---|---|
| 1–2 | 4.67 | 4.12 | 8.24 |
| 2–3 | 23.35 | 23.63 | 35.16 |
| 3–4 | 28.30 | 28.85 | 26.92 |
| 4–5 | 23.63 | 23.08 | 15.93 |
| 5–6 | 10.44 | 10.44 | 8.79 |
| 6–7 | 5.77 | 5.77 | 2.20 |
| 7–8 | 2.47 | 2.75 | 2.47 |
| 8–9 | 1.10 | 1.10 | 0.27 |
| 9–10 | 0.27 | 0.27 | 0.00 |
Table 2.
Physical parameters of the air.
| Physical Variable | Ca/(J × m−3 × °C−1) | λa/(W × m−1 × °C−1) | ρa/(kg × m−3) | μ/(kg × m−1 × s−1) |
|---|---|---|---|---|
| Air | 0.644 × 10³ | 0.02 | 0.641 | 1.75 × 10⁻⁵ |
Table 3.
Thermal parameters of the soil layers in the embankment model.
| Physical Variables | H/m | ρd/(kg × m−3) | ω/% | λ/(W × m−1 × °C−1) | C/(J × m−3 × °C−1) | ||
|---|---|---|---|---|---|---|---|
| λf | λu | Cf | Cu | ||||
| Embankment filling | 3.0~1.2 | 2060 | 6 | 1.40 | 1.15 | 1.543 × 10⁶ | 1.882 × 10⁶ |
| Crushed-rock | 1.2~0.0 | 2500 | 0 | 0.44 | 0.44 | 1.015 × 10⁶ | 1.015 × 10⁶ |
| Gravel and clayey | 0.0~−0.5 | 1800 | 15 | 1.82 | 1.60 | 2.022 × 10⁶ | 2.621 × 10⁶ |
| Gravel soil | −0.5~−2.0 | 1900 | 10 | 2.62 | 1.92 | 1.693 × 10⁶ | 2.182 × 10⁶ |
| Silty clay | −2.0~−8.0 | 1600 | 30 | 2.12 | 1.42 | 2.542 × 10⁶ | 3.345 × 10⁶ |
| Weathered mudstone | −8.0~−30.0 | 1800 | 15 | 1.82 | 1.60 | 2.032 × 10⁶ | 2.633 × 10⁶ |
Note: the ρd and ω represent the density and water content of soils, respectively; the λ and C represent the volumetric heat capacity and thermal conductivity of soil layers, and the subscripts f and u represent the frozen and unfrozen states of the soils, respectively.
Table 4.
Thermal boundary parameters of different surfaces.
| Parameters | T0 (°C) | A |
|---|---|---|
| Air (PF) | −3.5 | 11.5 |
| Natural ground surfaces (AB and EF) | −1.0 | 12 |
| Side slope surfaces (BC and DE) | 1.2 | 13 |
| Asphalt pavement surface (CD) | 3.0 | 15 |
Table 5.
Variations in the permafrost table and the soil temperature at the depth of 6 m beneath the WCRE and the NCRE on October 15 in the 50th year after the embankment construction.
Table 5.
Variations in the permafrost table and the soil temperature at the depth of 6 m beneath the WCRE and the NCRE on October 15 in the 50th year after the embankment construction.
| Type | Windward Slope Toe | Center | Leeward Slope Toe | |||
|---|---|---|---|---|---|---|
| WCRE | NCRE | WCRE | NCRE | WCRE | NCRE | |
| Permafrost table/m | −2.62 | −2.61 | −0.52 | −0.35 | −2.99 | −2.69 |
| Soil temperatures/°C | −0.61 | −0.63 | −0.60 | −0.94 | −0.40 | −0.56 |
Disclaimer/Publisher’s Note: The statements, opinions and data contained in all publications are solely those of the individual author(s) and contributor(s) and not of MDPI and/or the editor(s). MDPI and/or the editor(s) disclaim responsibility for any injury to people or property resulting from any ideas, methods, instructions or products referred to in the content. |
© 2023 by the authors. Licensee MDPI, Basel, Switzerland. This article is an open access article distributed under the terms and conditions of the Creative Commons Attribution (CC BY) license (https://creativecommons.org/licenses/by/4.0/).
Share and Cite
MDPI and ACS Style
Zhao, H.; Li, X.; Wu, X. Investigation of Wind Characteristics and Cooling Effects of Crushed-Rock Embankment with Different Pavement Widths in Permafrost Region. Atmosphere 2023, 14, 166. https://doi.org/10.3390/atmos14010166
AMA Style
Zhao H, Li X, Wu X. Investigation of Wind Characteristics and Cooling Effects of Crushed-Rock Embankment with Different Pavement Widths in Permafrost Region. Atmosphere. 2023; 14(1):166. https://doi.org/10.3390/atmos14010166
Chicago/Turabian StyleZhao, Hongting, Xiaolin Li, and Xiaopeng Wu. 2023. "Investigation of Wind Characteristics and Cooling Effects of Crushed-Rock Embankment with Different Pavement Widths in Permafrost Region" Atmosphere 14, no. 1: 166. https://doi.org/10.3390/atmos14010166
Note that from the first issue of 2016, this journal uses article numbers instead of page numbers. See further details here.