
Wildland Fires in the Subtropical Hill Forests of Southeastern Bangladesh


1
Department of Environmental Science, Bangladesh Agricultural University, Mymensingh 2202, Bangladesh
2
Arctic Research Center, Hokkaido University, Sapporo 0010021, Japan
*
Author to whom correspondence should be addressed.
Atmosphere 2023, 14(1), 97; https://doi.org/10.3390/atmos14010097
Submission received: 30 November 2022
/
Revised: 23 December 2022
/
Accepted: 30 December 2022
/
Published: 1 January 2023
(This article belongs to the Section Climatology)
Abstract
:The first ever comprehensive study on wildland fires in Bangladesh is carried out to develop a fire prevention and prediction method. The major causes of huge wildland fires (88%) in the subtropical Chittagong Hill forest (43% of total) of southern Bangladesh are reported as shifting cultivation, grazing and unauthorized settlement. We used satellite hotspot (HS) data from 2003 to 2021 (a total of 54,669 HSs) to clarify the spatio-temporal structure of wildland fires. Fire weather conditions were analyzed using various weather data and synoptic-scale weather maps at different air levels. Fires concentrated from March through April or a transitional period from the dry season, caused by the Asian winter monsoon, to the wet season, due to the Asian summer monsoon. Fire occurrence depended on dry conditions and pre-monsoon showers and their timing. The difference in 925 hPa heights of high and low pressure systems may be attributed to the different types of the Asian winter and summer monsoons. The average maximum air temperature and incident shortwave solar energy in April were the highest and strongest, contributing fire-prone weather conditions. Based on the analysis, a fire prevention and prediction method will be developed, and this report may also facilitate the establishment of future CO2 reduction measures for Bangladesh.
1. Introduction
Bangladesh is one of the most vulnerable countries in the world facing the early impact of climate change [1] mostly due to its geographical location, dense population and socio-economic condition, and the situation is becoming more unpredictable every year. Bangladesh’s CO2 emissions in 2016 were estimated at 74 Mega tons, making it the 48th largest CO2 emitting country in the world [2]. The observed and projected impacts of climate change and vulnerability include sea level rise, higher monsoonal rains and reduced dry season precipitation, increasing frequency and intensity of tropical cyclones, rising trend of thunderstorms and wildland fires. Bangladesh is one of the most densely populated countries in the world, current population density is 1265 persons per km2 [3] and it is impacted frequently by various natural hazards including wildland fires. However, climate change is severely affecting the natural environment of Bangladesh including the forest cover [4], whilst the southeastern hilly forest land is transforming to non-forest and degraded land mainly due to human interventions [5,6].
In many tropical forests, wildfires are becoming increasingly frequent and devastating [7]. Wildfires in several regions are expected to become more active due to a complex interplay of climatic and anthropogenic drivers [8,9]. Dry tropical forests, characterized by a distinct dry period, have seen an unprecedented increase in fire occurrence. The increasing occurrence of wildfires in recent decades is particularly alarming due to the lack of understanding of tropical forests’ resilience to fire and the fact that dry tropical and subtropical forests remain largely undermined. Nowadays the incidence of wildland fires is a matter of great concern worldwide; for example, fire weather conditions in Boreal [10] and Polar regions [11,12], wildland fire on the tropical alpine moorlands of Mount Kenya [13], fire weather conditions in Alaska [11] and southern Sakha [14,15], precipitation patterns and peat fire occurrence in Indonesia [16], etc., are well reported. Under ongoing global warming scenarios, increased air temperature may lead to an increase in wildfire frequency and total burned area [17], whereas an impending shift to a temperature driven global fire regime in the 21st century is creating an unprecedentedly fire-prone environment [18]. Relative to the levels in 2000, fire frequencies under expected conditions by 2050 are projected to increase by approximately 27% globally, with changes in future fire meteorology playing the most important role in enhancing global wildfires [11].
In Bangladesh, the significance of forest-related research has promoted current attention due to the recent large amount of forest land degradation in the southeastern hill forest zone. Researchers investigated plant species diversity and forest stand structure [19,20,21,22], but previous and existing research based findings failed to involve hazards such as wildland fires in Bangladesh and the weather conditions behind them, in order to cope with management strategies to save forest resources. To deal with the above issues, the authors decided to take the challenge of producing the first fire report on wildland fires in Bangladesh to assist future fire prevention and prediction methods and to facilitate future CO2 reduction measures. With this view in mind, we focused on fire weather conditions by analyzing satellite daily hotspot data and various weather maps at 500 hPa, 850 hPa and 925 hPa, and fire-prone conditions from a weather database [23].
2. Materials and Methods
2.1. Study Area, Weather and Vegetation (Fuel)
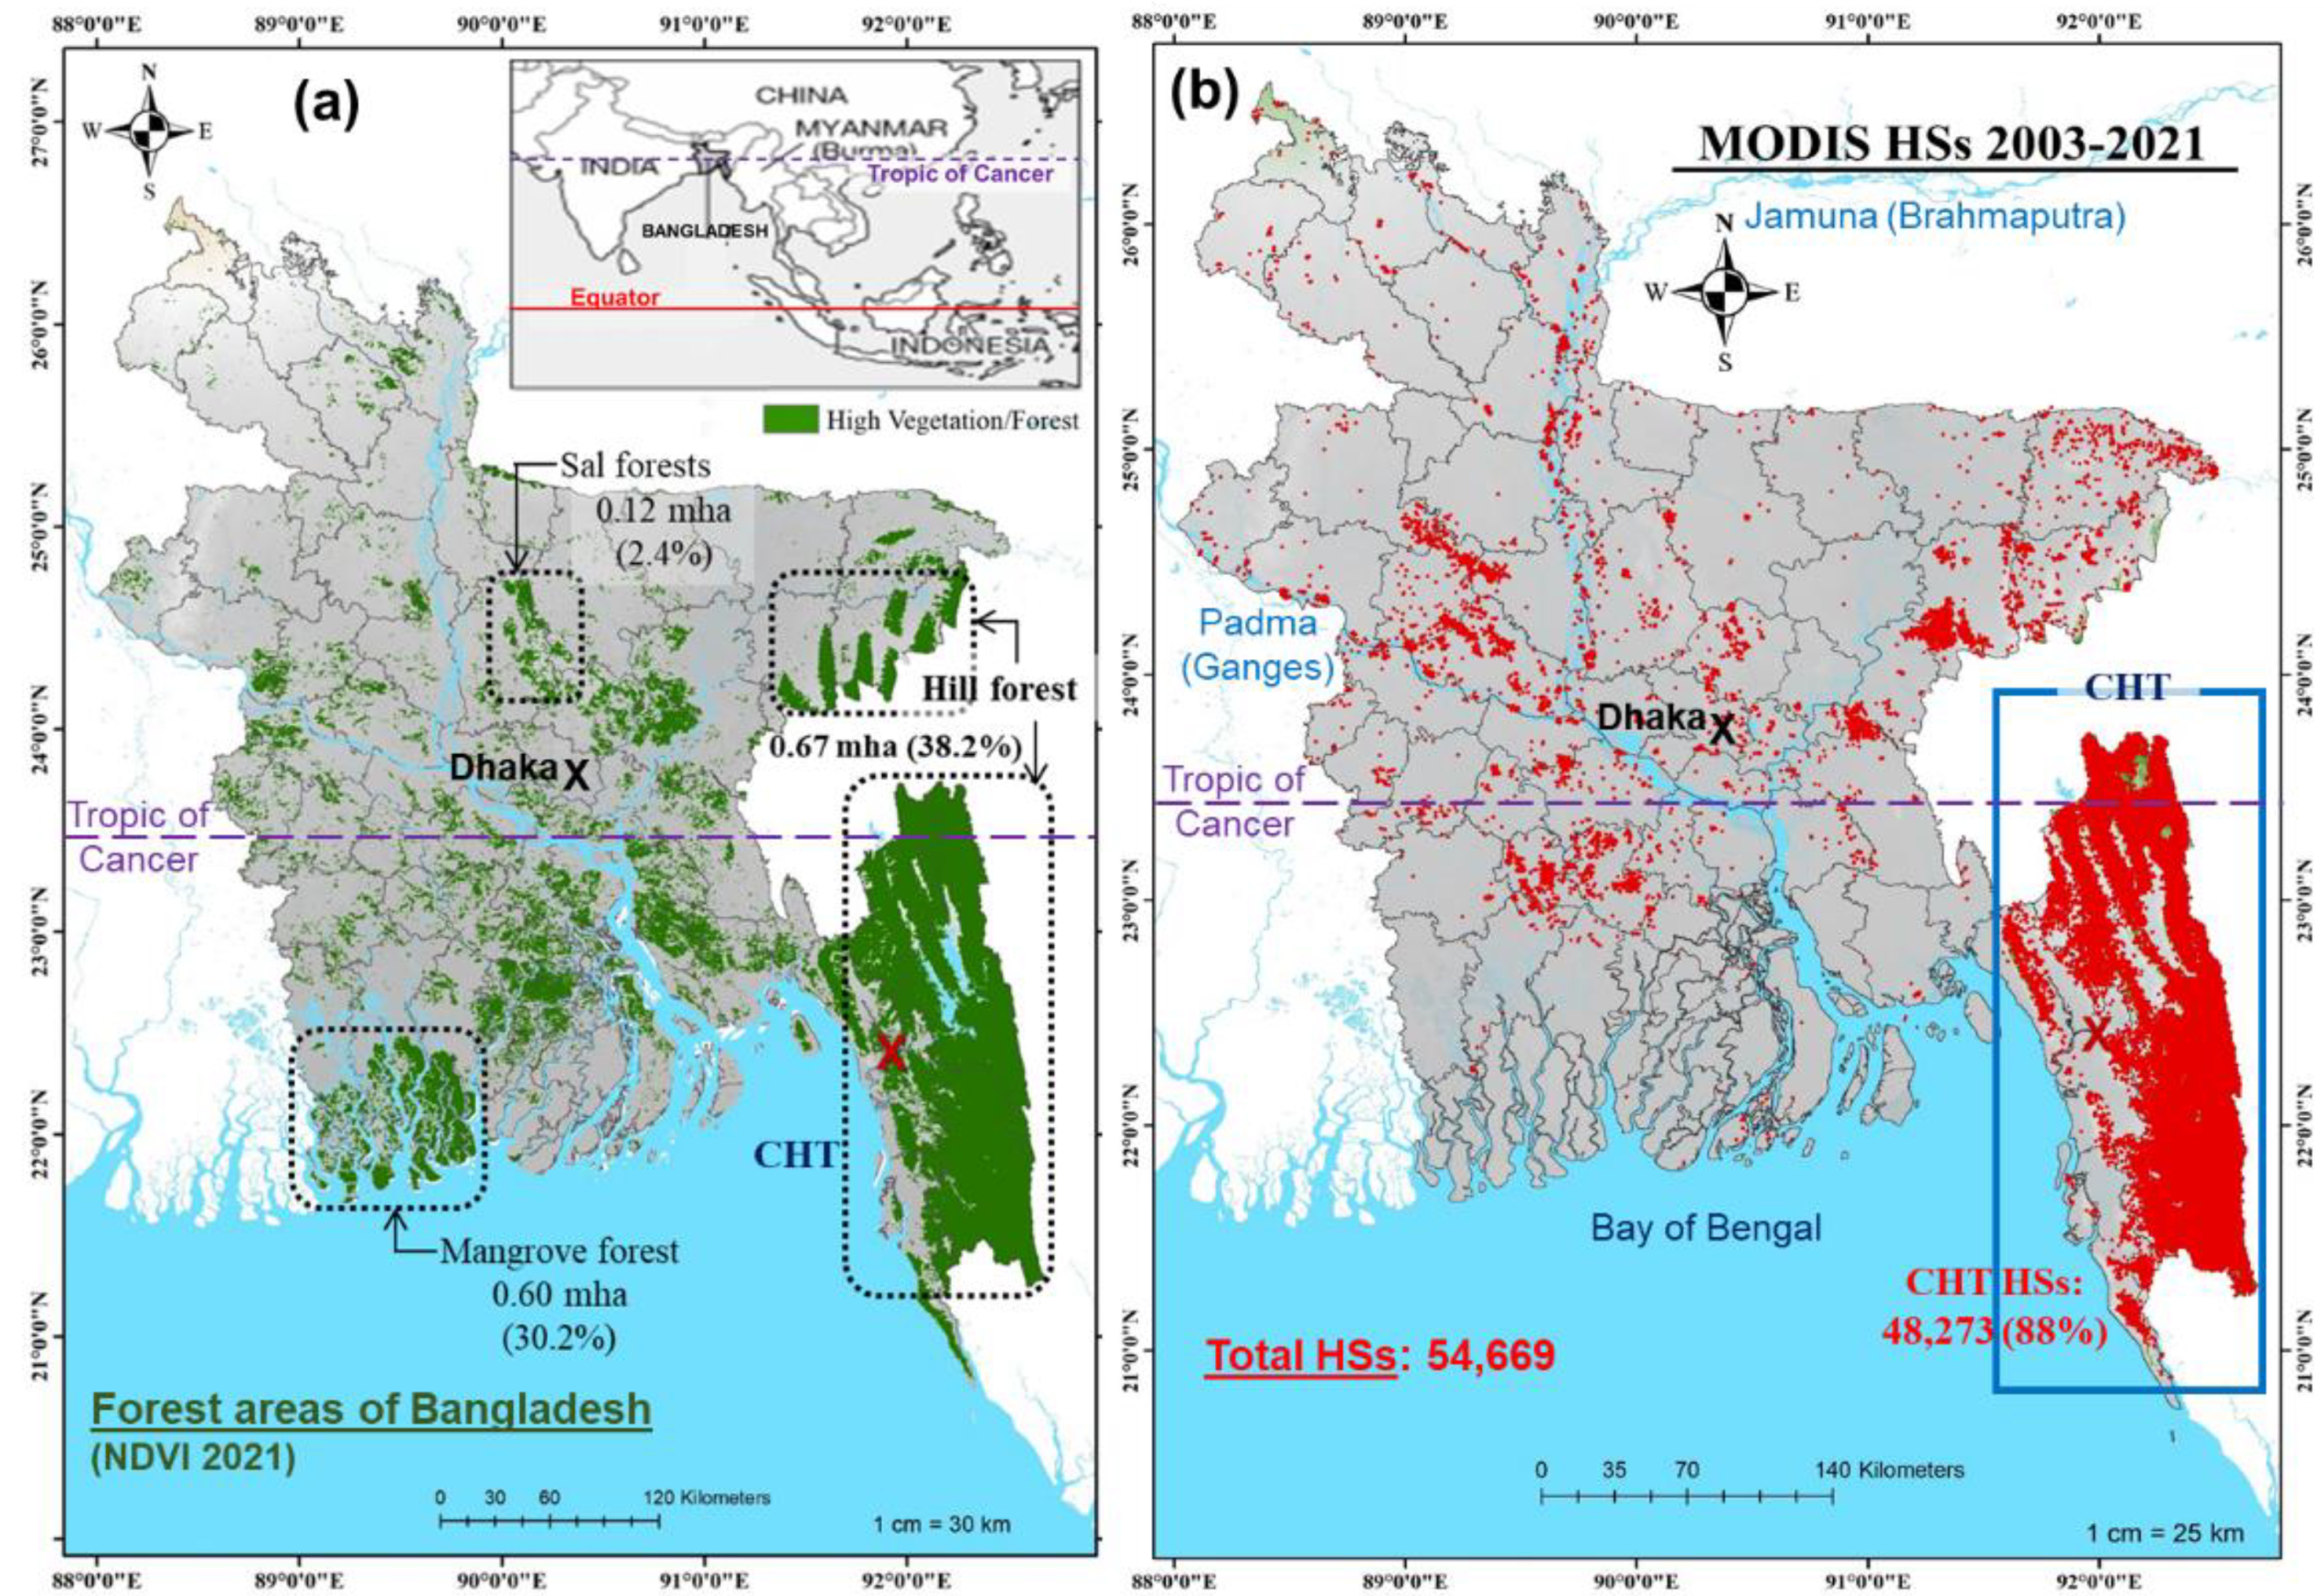
The study area Bangladesh is shown in Figure 1a, lies in South Asia (20°34′ N to 26°38′ N, 88°01′ E to 92°41′ E) and has a total area of 147,570 km2. The Tropic of Cancer is located south of Dhaka (the capital of Bangladesh) and in the northern part of the subtropical Chittagong Hill Tracts (CHT). According to the Koppen-Geiger climate classification [24], the climate of Bangladesh can be classified into three categories, tropical monsoon (Am), tropical savannah (Aw) and temperate-dry winter–hot summer (Cwa). The CHT and Dhaka belong to Am and Aw, respectively. The Asian summer and winter monsoons have major influence on the country’s climate, resulting in marked seasonality in precipitation and temperature. The pre-monsoon from March through May is characterized by strong, incoming solar radiation and a distinct post-monsoon appears from October through November [25].
Distribution of vegetation (fuel) in Bangladesh is shown using the normalized difference vegetation index (NDVI) in Figure 1a. NDVI (500 m spatial resolution, MODIS Terra/Aqua 16-day for 2021) was obtained from the USGS server [26] and is used to evaluate forest and vegetation. The major forest areas are Hill forest in the CHT and its northern area (38.2%, 0.67 Mha), Sal forests (2.4%, 0.12 Mha) mostly in the middle of the country, and Mangrove forest (30.2%, 0.60 Mha) in the southwest [27]. The CHT lies in southeastern Bangladesh (21°25′ N to 23°45′ N, 91°54′ E to 92°50′ E) bordering Myanmar on the southeast, the Indian state of Tripura to the north, Mizoram to the east, Chittagong district to the west and Cox’s Bazar district in the southwest (Figure 1a). The CHT is a distinct region in terms of racial, cultural, and environmental diversity and is located in the southeast with land cover of about 13,295 km2 or about one-tenth of total Bangladesh [28,29] and with a population density of 87–230 persons per km2. The CHT includes pristine countryside full of natural resources, diverse flora, and fauna covering almost 80% of the country’s total biodiversity [30]. Figure 1a also illustrates the major vegetation coverage in the CHT region which is tropical wet evergreen/semi-evergreen and deciduous [31], classified as ‘hill forests’ [32] and covering 43% of the country’s total forest land [33]. Teak (Tectona grandis) is the dominant type of plant in both government and private forestlands. The hills, rivers and cliffs are covered with dense bamboo breaks, tall trees and creeper jungles.
Bangladesh has a forest coverage of about 2.6 Mha, equivalent to approximately 17.4% of the country’s total land area [34]. Contrarily, Global Forest Resources Assessment [35] indicates that the total forest area of Bangladesh is 1.43 Mha, i.e., 11% of the land area of the country [36]. Of the total forest area, 84% has been classified as natural forest and nearly 16% as plantation forest. The per capita forest area in Bangladesh is less than 0.02 ha [37] against the world average of 0.60 ha [38]. The forestry sector accounts for about 3% of the country’s GDP and 2% of the labor force, whereas at least 19 million people are absolutely dependent on forests for their livelihoods [39]. The total forest area managed under the Bangladesh Forest Department in CHT is 483,000 ha with 86,000 ha designated as plantation land [40]. CHT cover more than 85% of land types with medium to steep slopes, so conventional agriculture is limited and instead it is managed for ‘jhum’/’shifting cultivation’/’slash and burn’ agriculture or forest [41], where multiple local varieties of 140–150 days duration, open pollinating, upland rice are cultivated. The extent of jhum is higher in Rangamati and Bandarban than in Khagrachari district [42]. The main feature of jhum is the combination of diverse crops for cultivation in one season from March to May [43], whilst seeds are sown usually after the first rain in April. Thus, most of the southeastern wildland fires in the hilly areas tend to occur mainly due to local people’s activities. At present, about 20,000 ha of land are being brought under jhum every year, decaying 100 to 250 tons of soil per ha−1 of land [44]. Similar observations have also been witnessed in hilly areas of Nagaland, India [45].
2.2. MODIS Hotspot (Fire) and Weather Data
Hotspot (HS) data of 19 years from 2003 to 2021 detected by Moderate Resolution Imaging Spectroradiometer (MODIS) on the Terra and Aqua satellites were used to evaluate wildfires in Bangladesh. MODIS HS data were obtained from the NASA Fire Information for Resource Management System https://firms.modaps.eosdis.nasa.gov/download (accessed on 10 September 2021) [46] with a pixel resolution of 1 km. The number of daily HSs is used to identify fire season, active fire-period and the dates of major HS peaks during the fire periods. Various daily weather maps such as pressure, wind, and temperature at 500 hPa, 850 hPa and 925 hPa were obtained from the NCEP/NCAR 40-year reanalysis data https://psl.noaa.gov/data/gridded/data.ncep.reanalysis.pressure.html (accessed on 4 April 2022) [47]. We analyzed these to find fire–weather conditions during active fire-periods, fire-related synoptic-scale circulation patterns, rainy conditions, etc. Coverage and spatial resolution of the NCEP reanalysis data are geographic longitude and latitude: 0.0°–358.125° E, −88.542° N to 88.542° N; spatial resolution: about 2.5° × 2.5°; period and temporal resolution: 1 January 1948 to now, 6-hourly, daily, and monthly. Daily weather data in CHT for 19 years from 2003 to 2021 were obtained from the Bangladesh Meteorological Department (BMD) of the Government of the People’s Republic of Bangladesh for the BMD station Chittagong (Station ID: 11921; 22°16′ N and 91°49′ E). Weather data for Dhaka station (Station ID: 11111; 23°46′ N and 90°23′ E) were obtained from ‘weatherspark’ https://weatherspark.com/y/111858/Average-Weather-in-Dhaka-Bangladesh-Year-Round (accessed on 1 November 2022) [23] and were used to explain fire-prone weather conditions, mainly maximum air temperature, incident shortwave solar energy and wind speed. Incident shortwave solar energy is selected as one of the fire prone conditions as it could cause dry fuels and warm air near to ground surface. Active-fire occurrences and weather conditions were also confirmed by checking the satellite imagery (corrected reflectance; true color; MODIS on Terra) of Worldview https://worldview.earthdata.nasa.gov (accessed on 6 October 2021) [48]. Worldview provides various fire-related information such as surface conditions, cloud distribution, etc.
2.3. Analysis Methods
MODIS hotspot data from 1 January 2003 to 31 December 2021 were used to identify fire history and daily fire activity in Bangladesh. The annual fire history from 2003 to 2021 were made by accumulating the daily number of HSs of each year. From the number of daily HSs, the active fire-period was defined. Analysis using various composite weather maps at 925 hPa, 850 hPa, and 500 hPa was carried out to confirm fire-weather conditions during the active fire-periods. The composite weather maps were used to identify the presence and location of high pressure, low pressure, troughs, ridges, the movement of air masses, and wind speed and direction. Fire-prone weather conditions were extracted from the above mentioned weather database ‘weatherspark’ [23] to characterize fire weather conditions during the active fire-period.
3. Results
3.1. Fire and Vegetation (Fuel) Distribution
A grand total of 54,669 HSs were detected from 2003 to 2021 in Bangladesh. Figure 1b shows their spatial distribution throughout the whole country. A total of 48,273 (88% of the grand total) HSs were detected in the CHT.
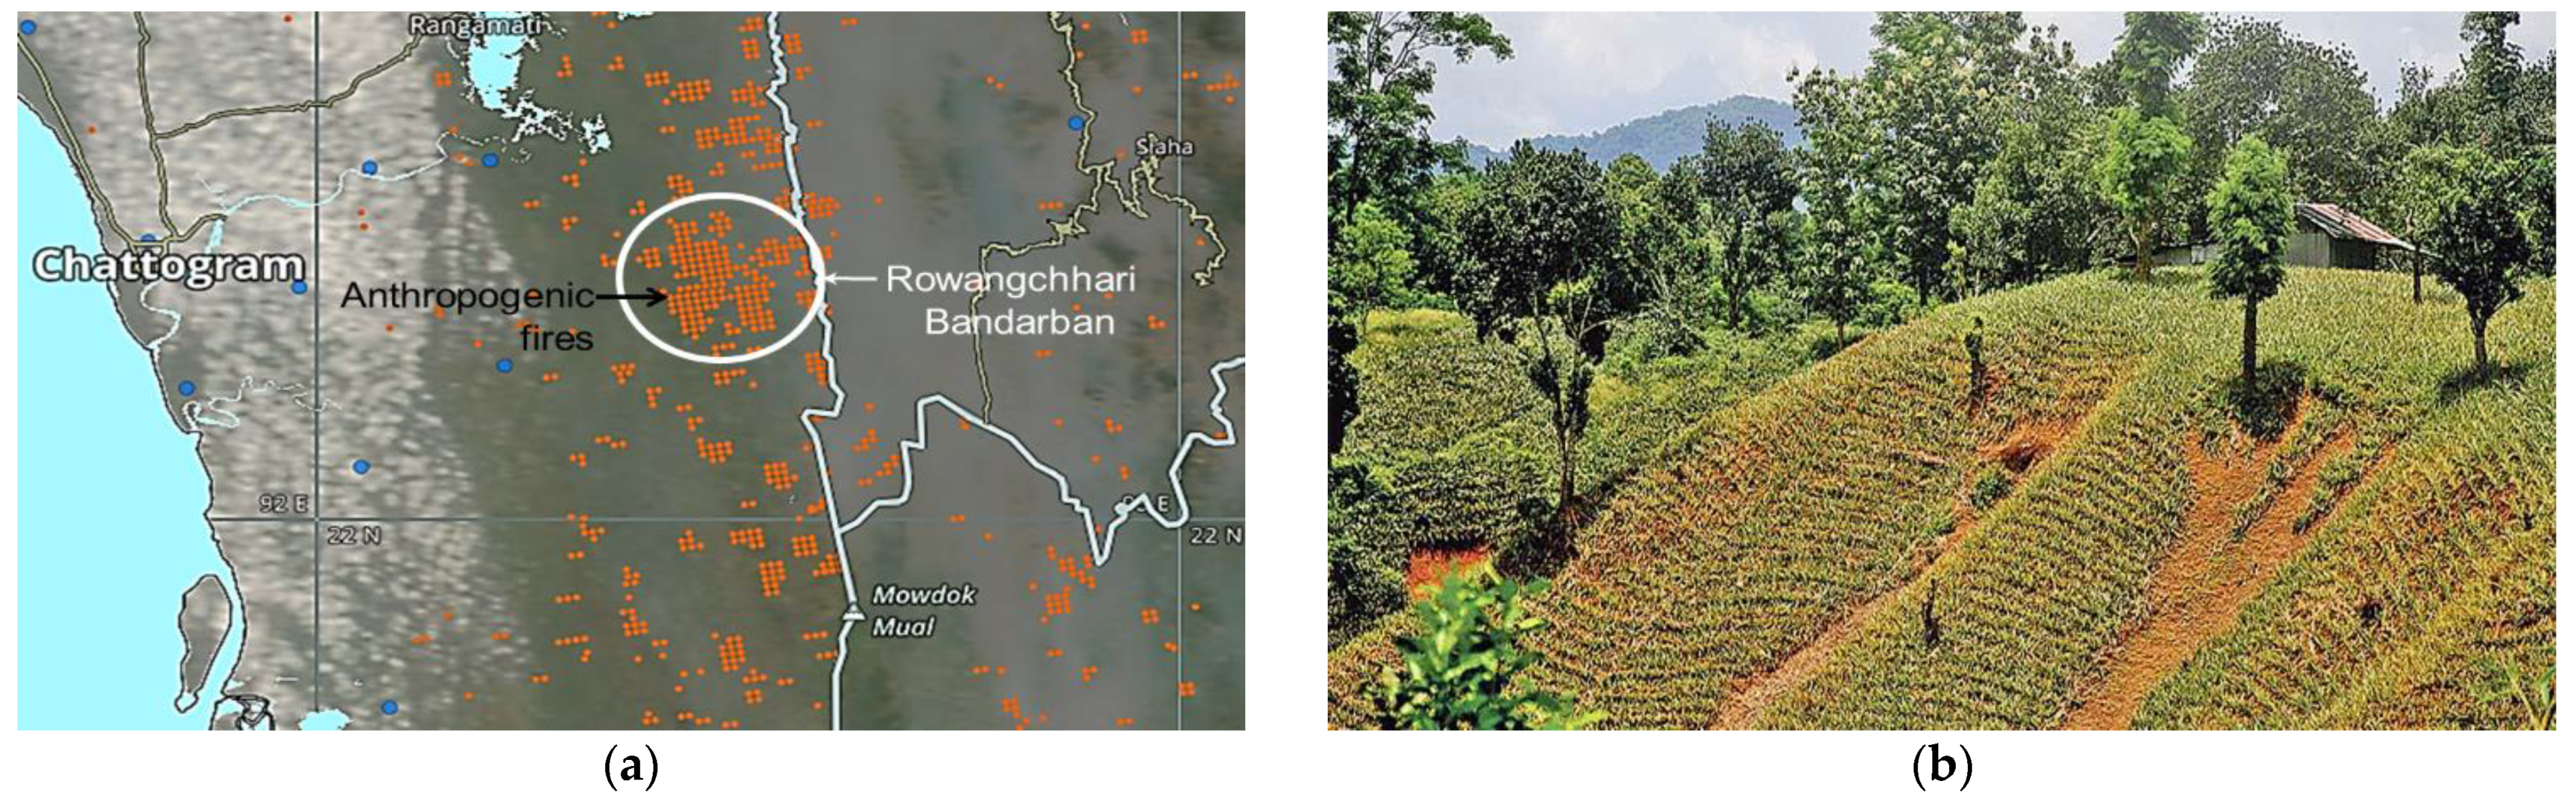
Satellite image in Figure 2a shows a slash and burn cultivation area with red dots (HSs) in the western region of CHT. HSs are mainly scattered over the mountain forest. Dense HS area in Rowangchhari and Bandarban in Figure 2a may be anthropogenic fires related to local people’s activities. Figure 2b shows typical slash and burn agricultural fields in a hilly area characterized by mountainous rugged terrain with steep slopes, unstable geological structure and weak soil. Local people uses fire for various purposes such as slash and burn, shifting (jhum) cultivation, land clearing, treatment of agricultural residue, and so on.
3.2. Fire History
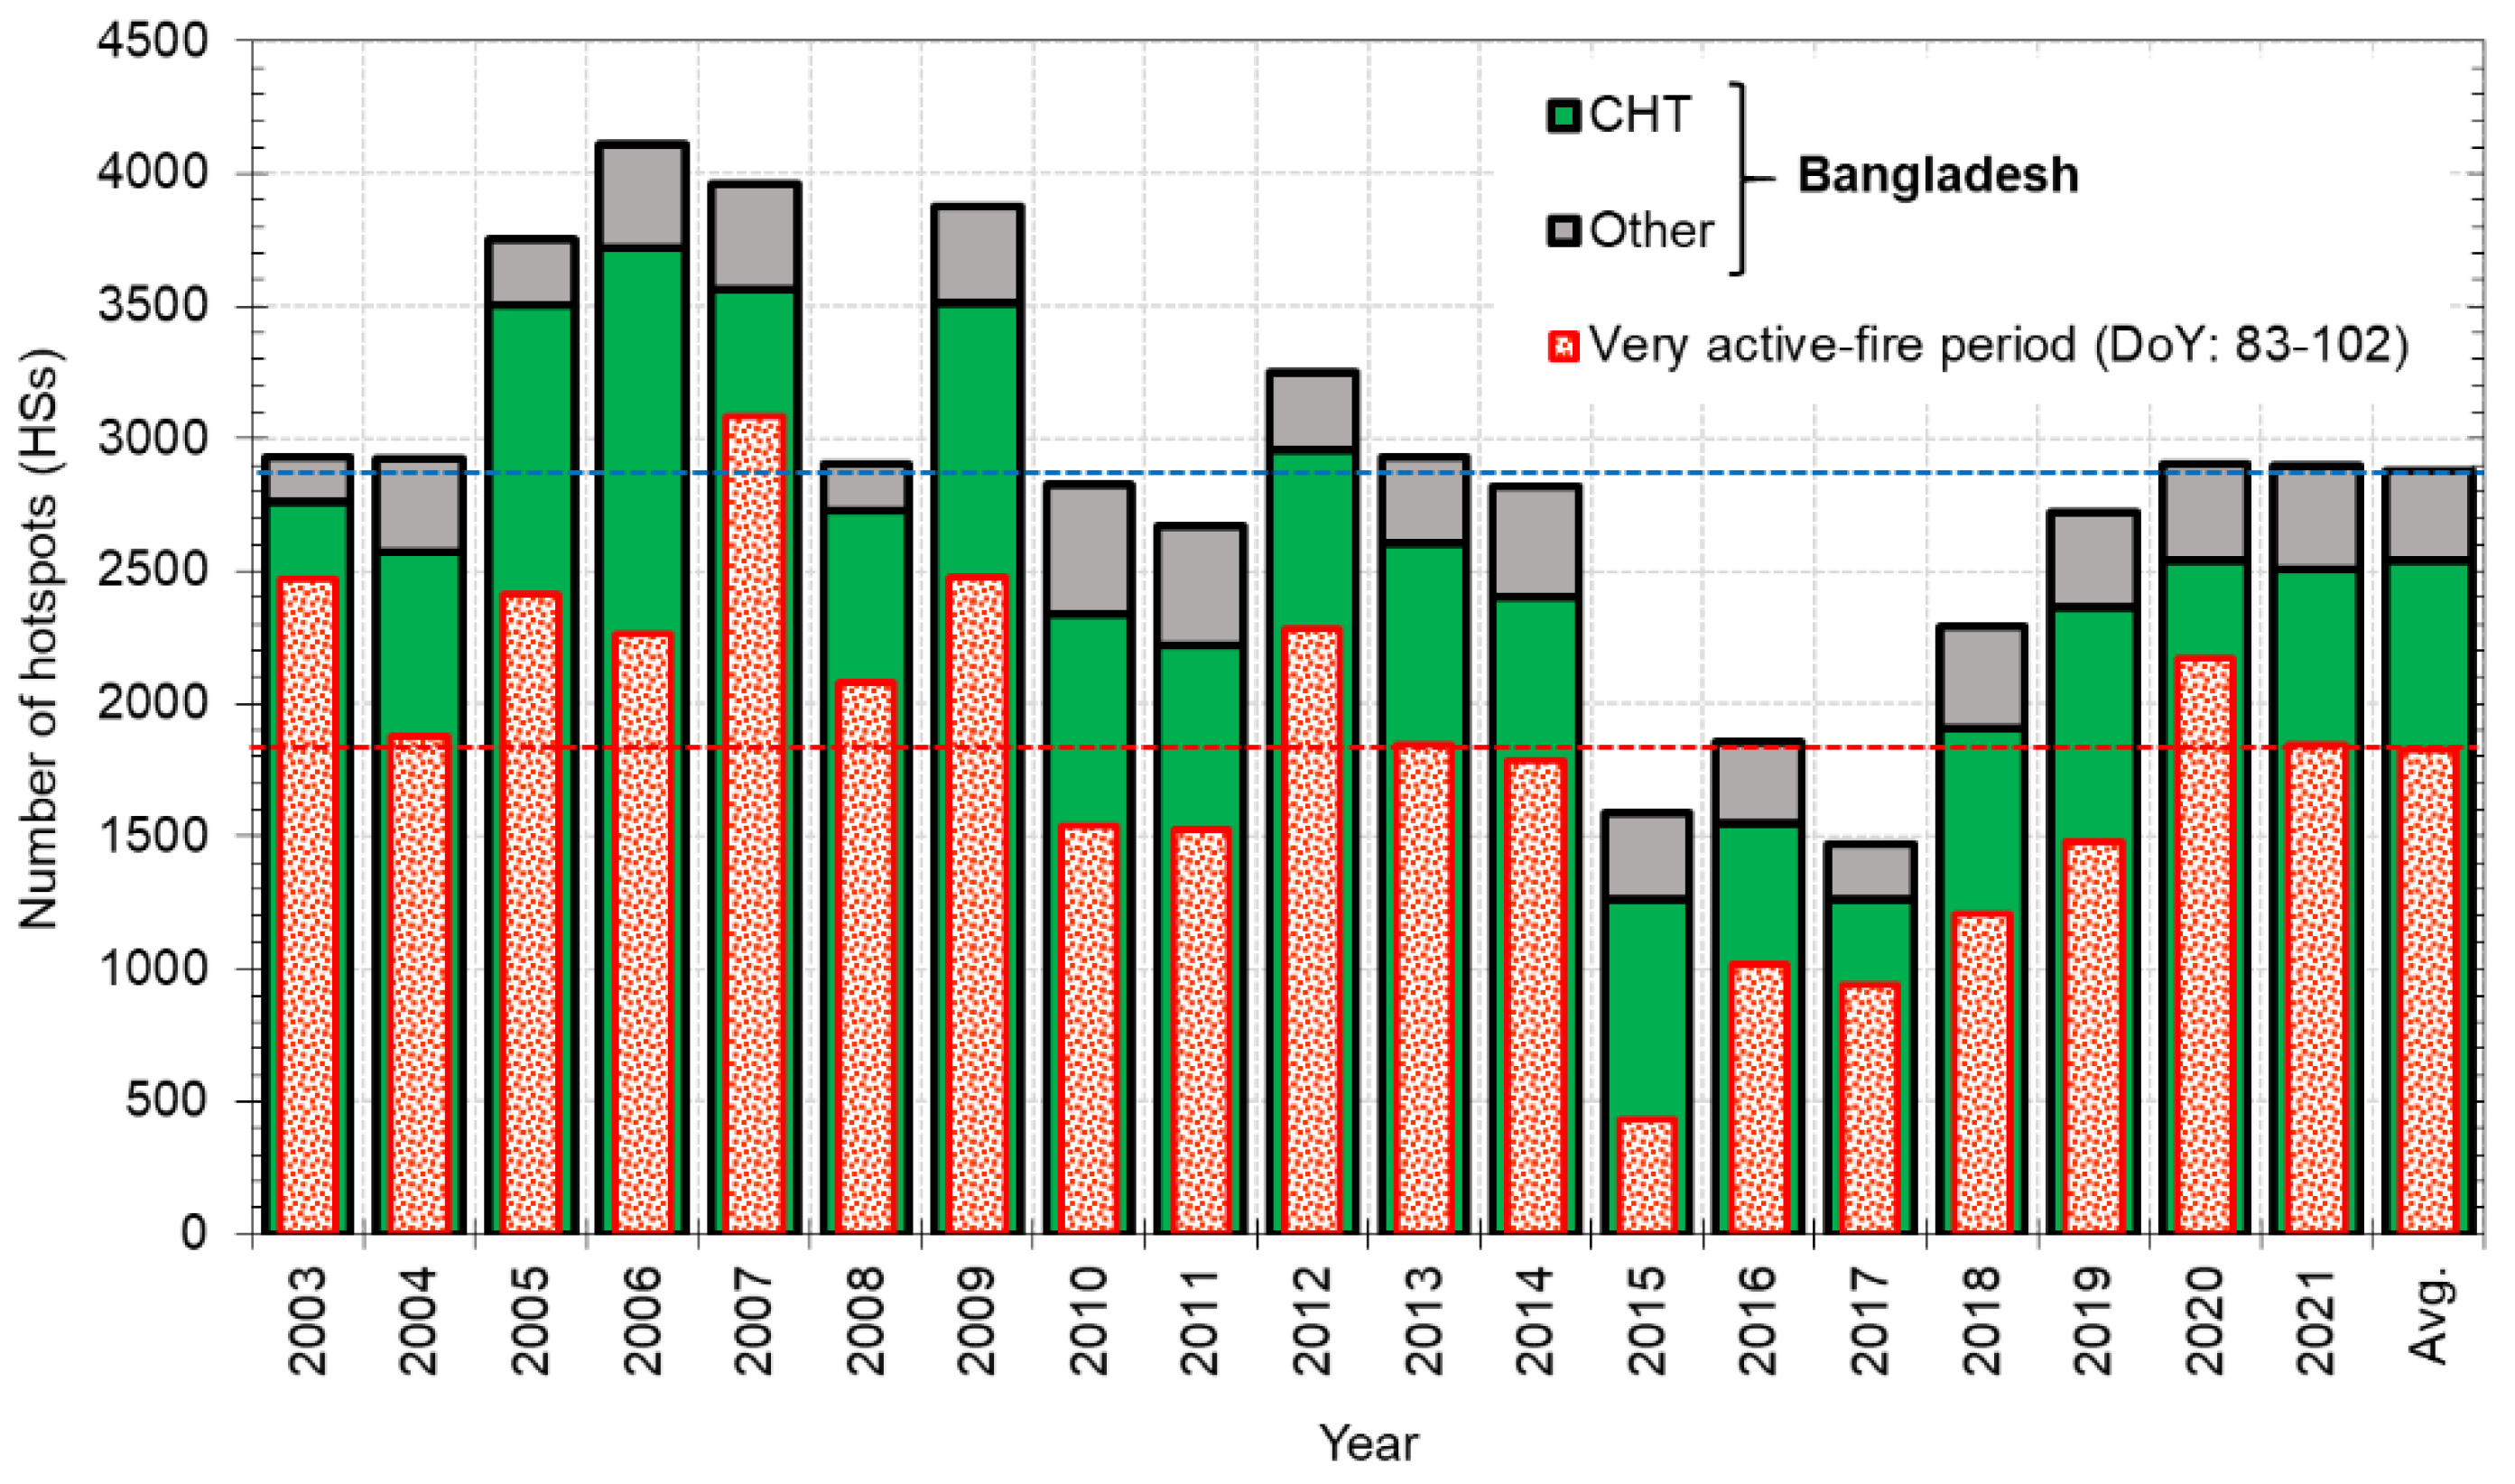
Figure 3 shows recent fire history from 2003 to 2021 in Bangladesh and CHT. The number of HSs in five years (2005, 2006, 2007, 2009 and 2012) exceed the average annual value of 2878 HSs (blue straight line in Figure 3) and will be referred to as ‘high fire year’. Years with lower than average values such as 2015, 2016, and 2017 will be termed as ‘weak fire year’. The green bars in Figure 3 show the annual total number of HSs in the CHT from 2003 to 2021.
The red dotted bars in Figure 3 depict the total number of HSs from March through April specifically from DoY (Day of Year) 83 to DoY 102 (this period is defined in sub-Section 3.3. and will be termed as average ‘active fire-period’). The green bars, however, reveal that the most fires in high-fire years such as 2005, 2006 and 2007 occurred within this active fire-period from March through April. On the contrary, fires in low fire years such as in 2015, 2016 and 2017 occurred in other than the period from March through April.
3.3. Fire-Period and Precipitation
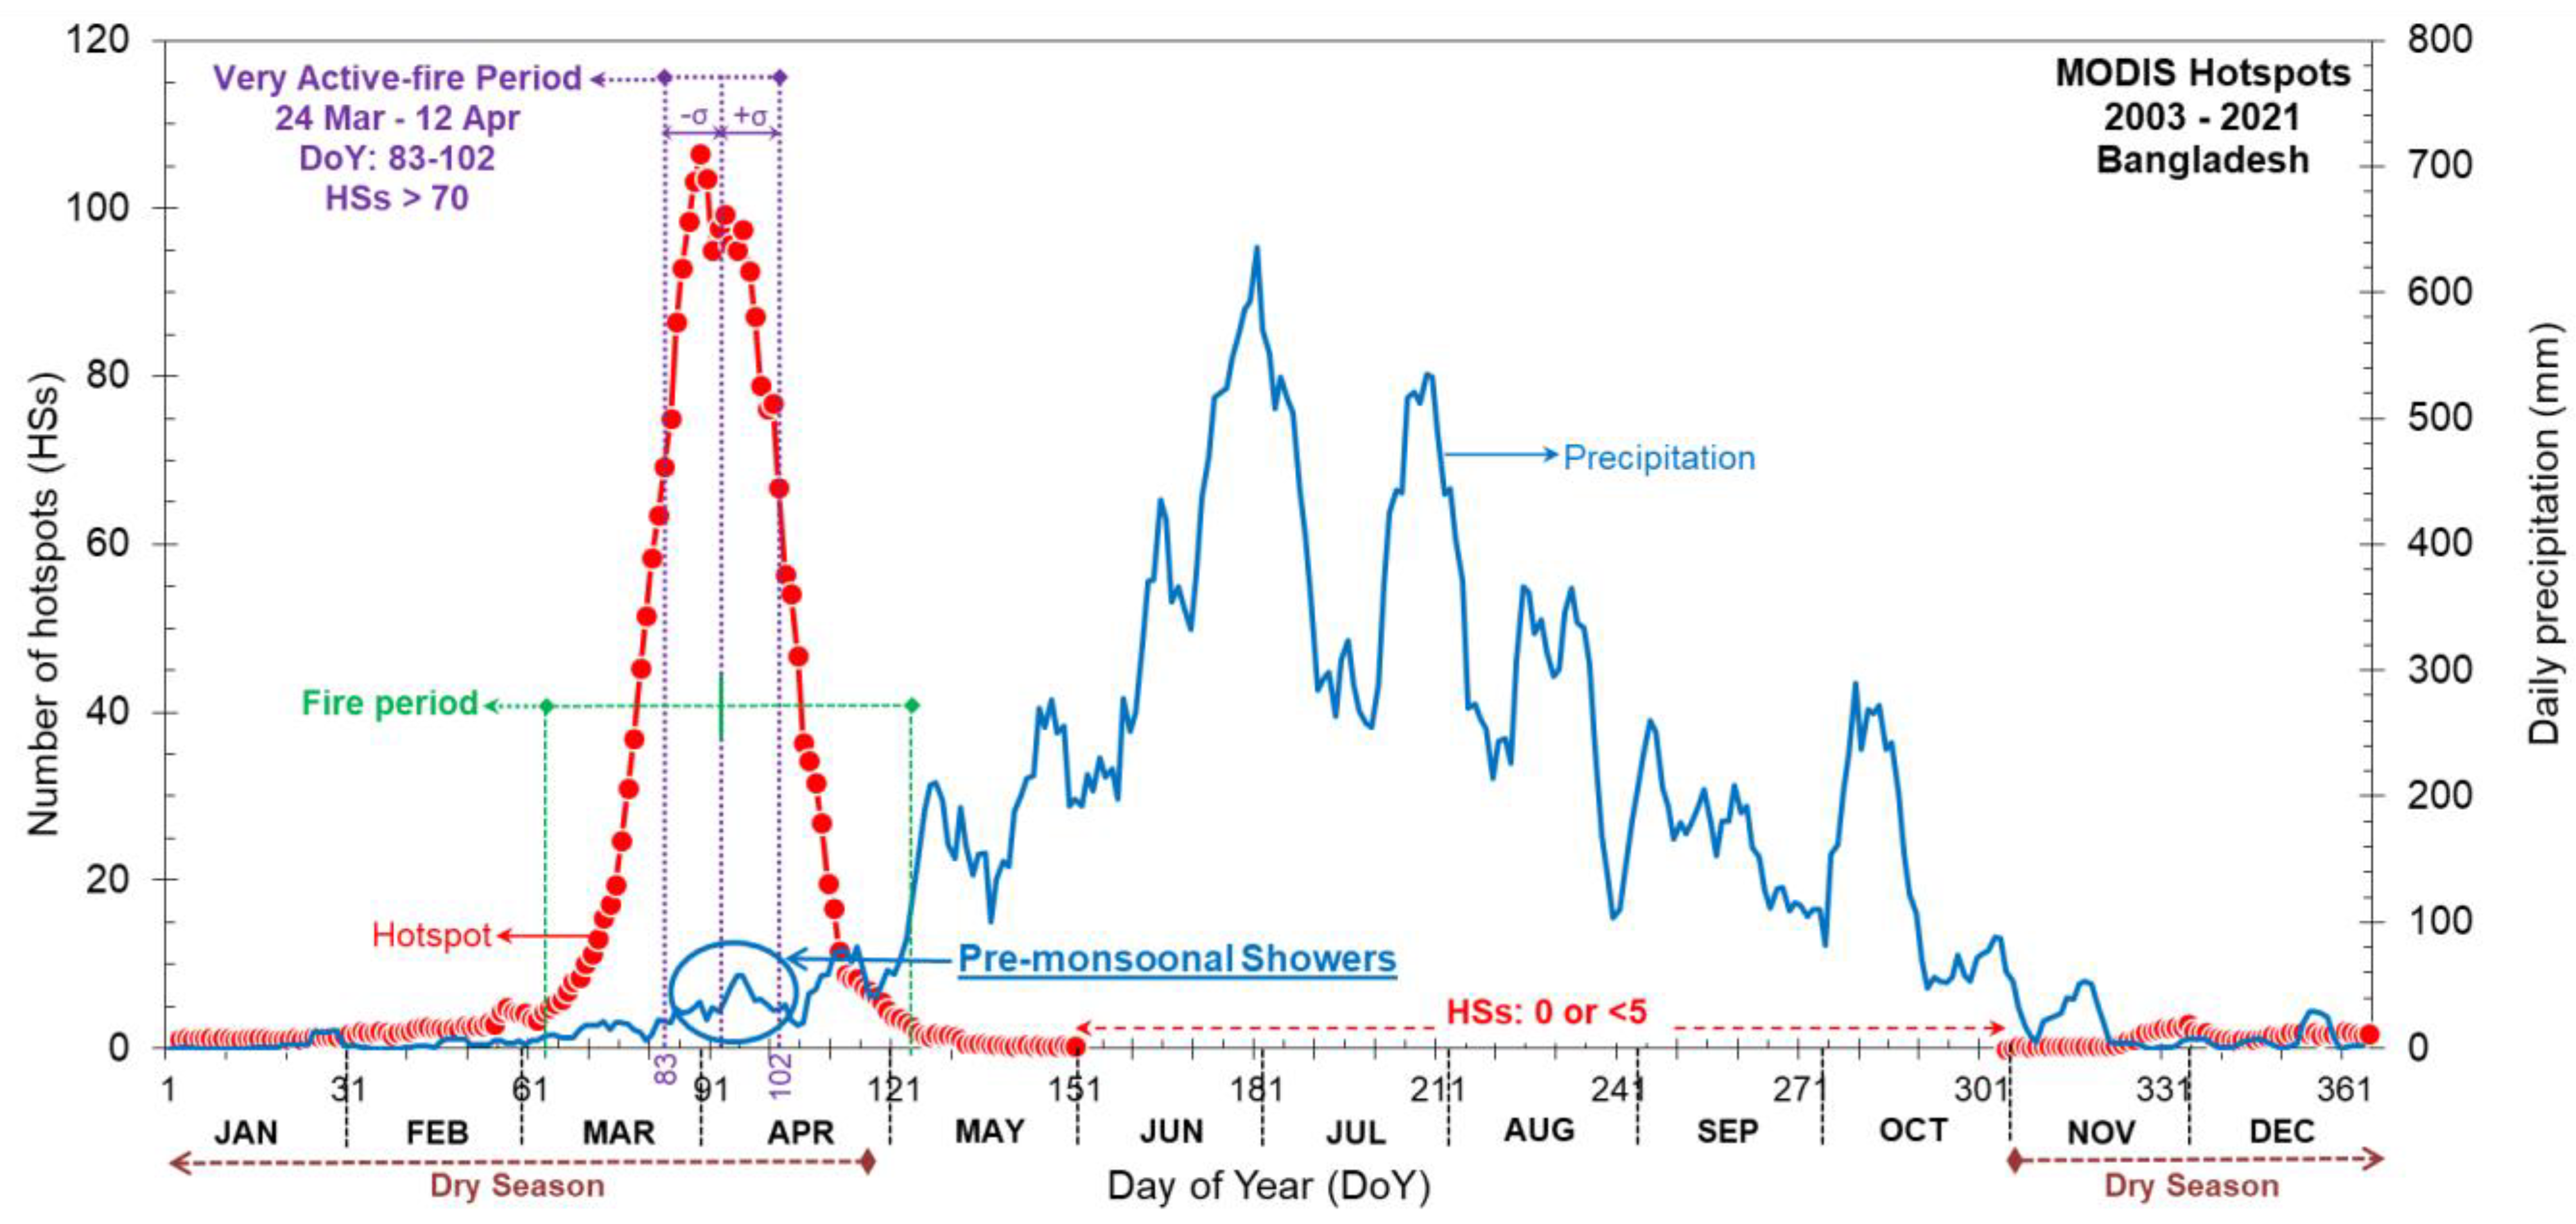
The red curve with circles in Figure 4 shows the average daily number of HSs (fires) for the last 19 years (2003–2021) in Bangladesh. The blue line shows the average daily precipitation for the last 19 years (2003–2021) in CHT. Figure 4 clearly illustrates that the fire-period starts from the beginning of March and ends at the beginning of May (DoY: 63–123). As the fire (HS) curve is bell-shaped, a statistical expression (σ: standard deviation) is applied to explain this fire trend. The ‘dry season’ from November through April corresponded to 98% (53,721 HSs) of total HS occurrence. The very active fire-period (DoY: 83–102) coincides with the end of the Asian winter monsoon or the pre-monsoon season with relatively lower precipitation of about 30 mm (termed as ‘pre-monsoonal showers’).
3.4. Fire Weather Conditions during Fire-Period
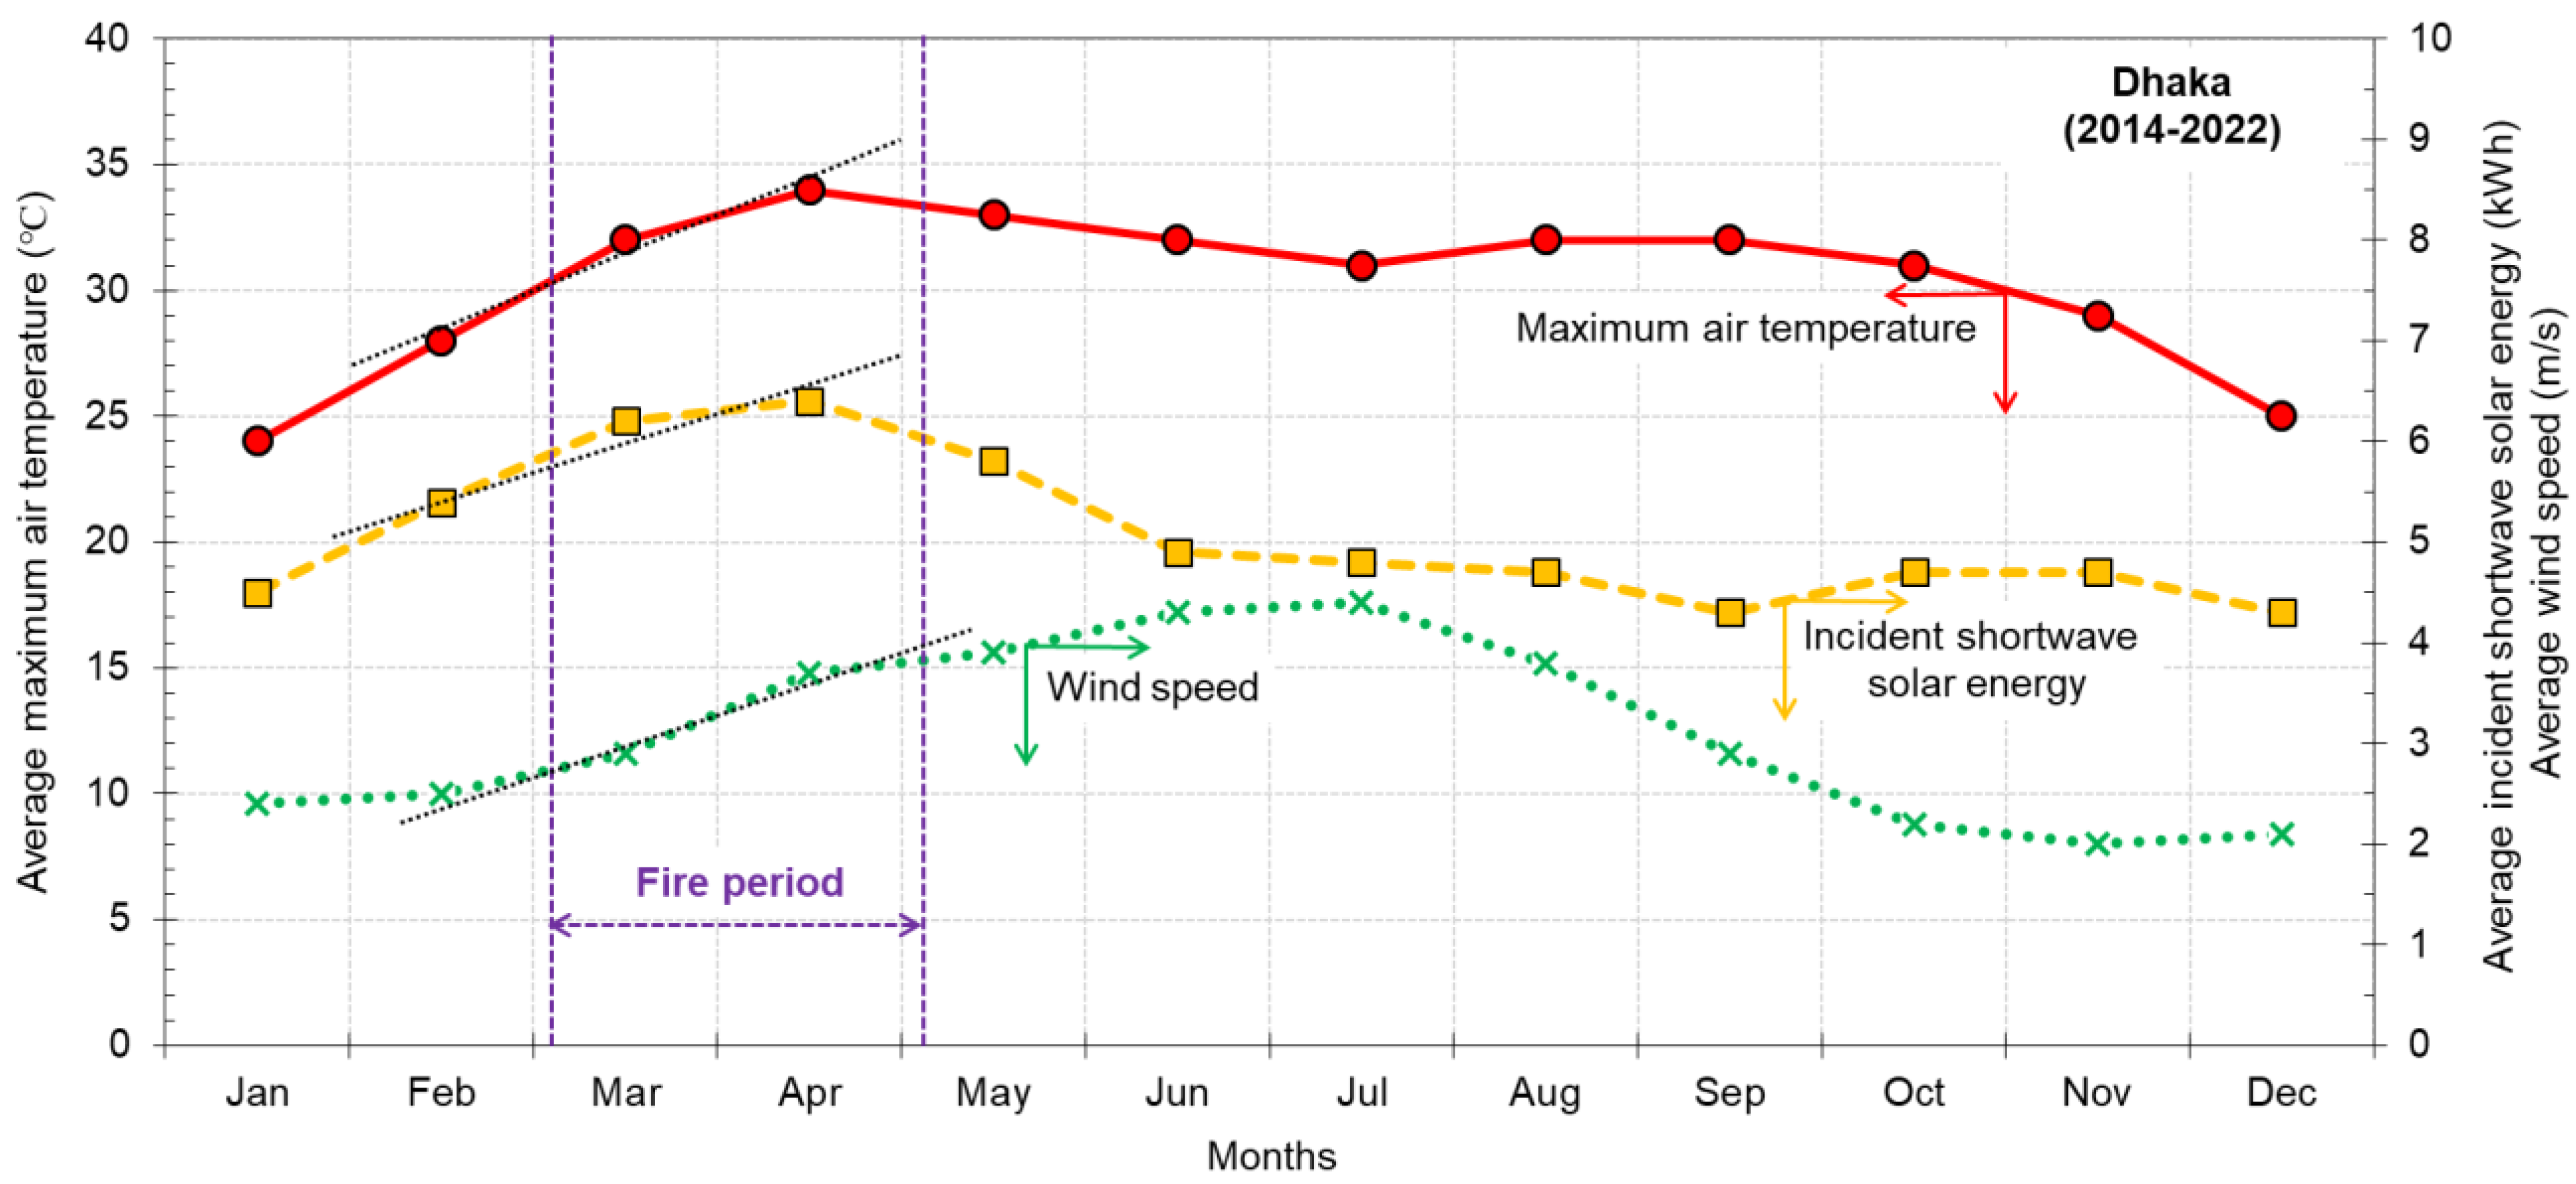
In addition to low precipitation (Figure 4), other fire-prone weather conditions are shown in Figure 5. The conditions are maximum air temperature (Tmax), incident shortwave solar energy (ISSE), # and wind speed (Vw). The mentioned weather parameters were extracted from the weather database of ‘weatherspark’ [23]. Wildland fires tend to become active under conditions of warm and dry (low-humidity) made by Tmax and ISSE, and high Vw.
3.5. Fire and Precipitation in High and Weak Fire Year
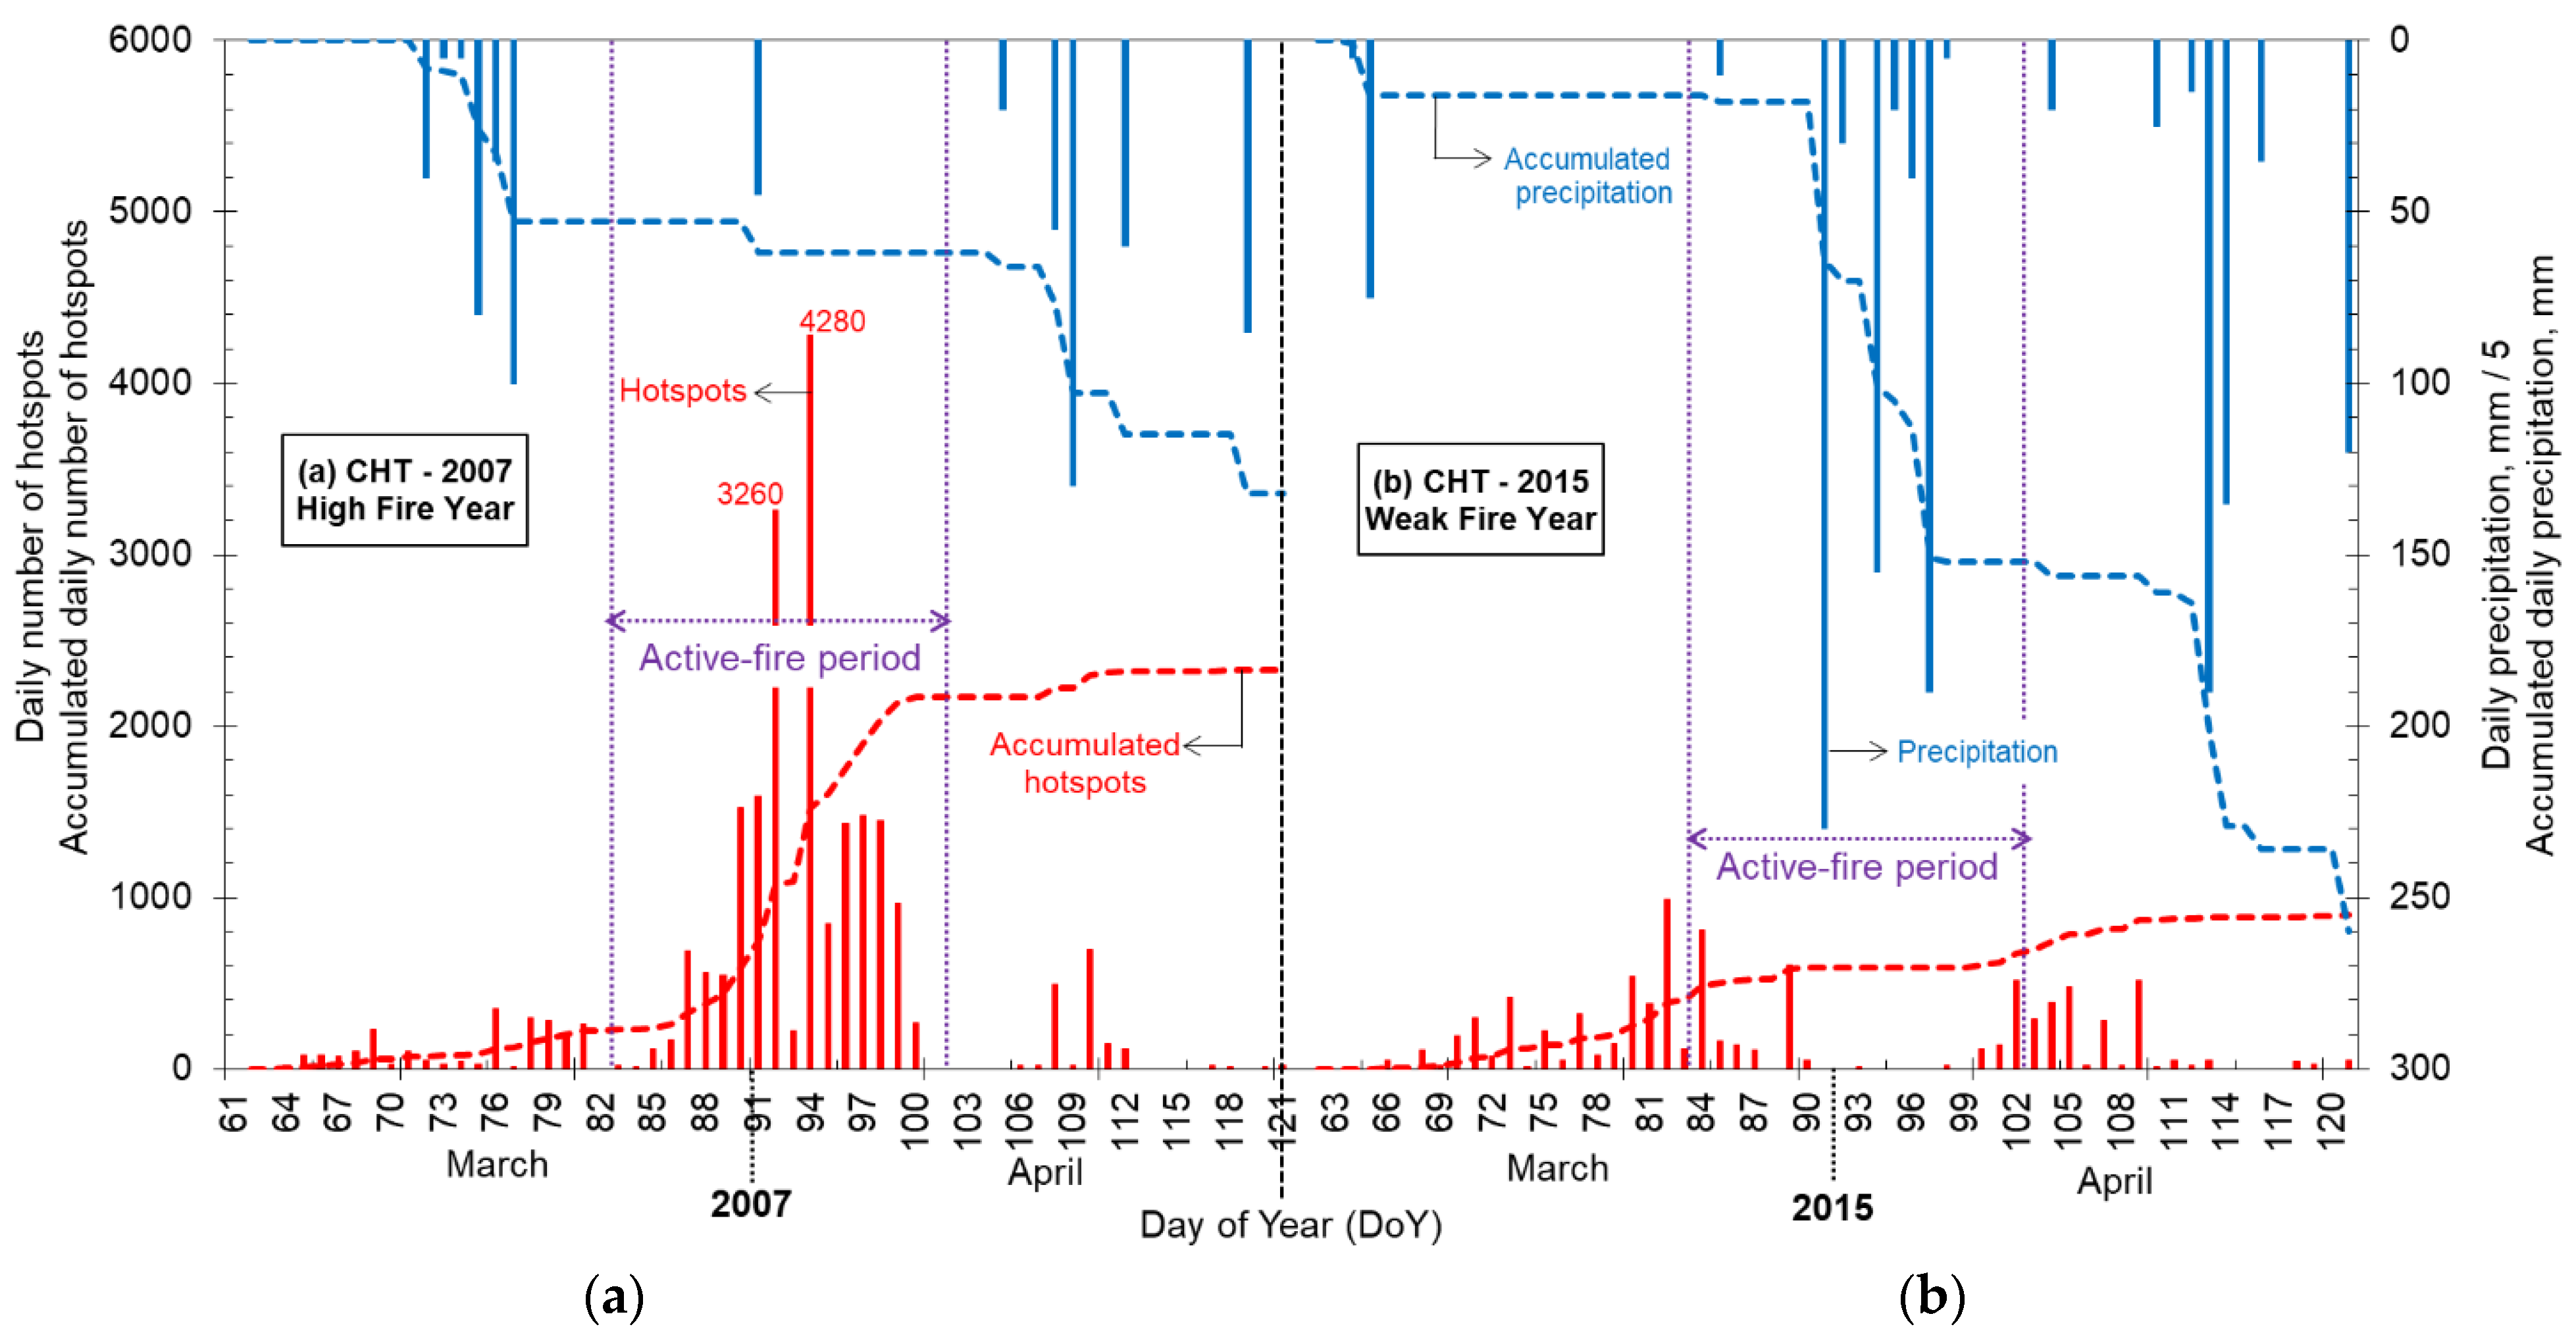
Daily HSs and precipitation in CHT during the fire season in 2007 (high fire year) and 2015 (weak fire year) are shown in Figure 6. Figure 6a for 2007 shows very active fires occurred during the active fire-period (DoY: 83–102) under drought conditions made by the Asian winter monsoon-like conditions.
On the contrary, Figure 6b for 2015 (weak fire year) shows that a small number of fires occurred only in March under drought conditions. Precipitation, i.e., pre-monsoon showers of more than 100 mm during the active fire-period (DoY: 83–102), suppressed fires in 2015. These wet conditions may be due to the Asian summer monsoon.
3.6. Synoptic-Scale Fire Weather in High and Weak Fire Years
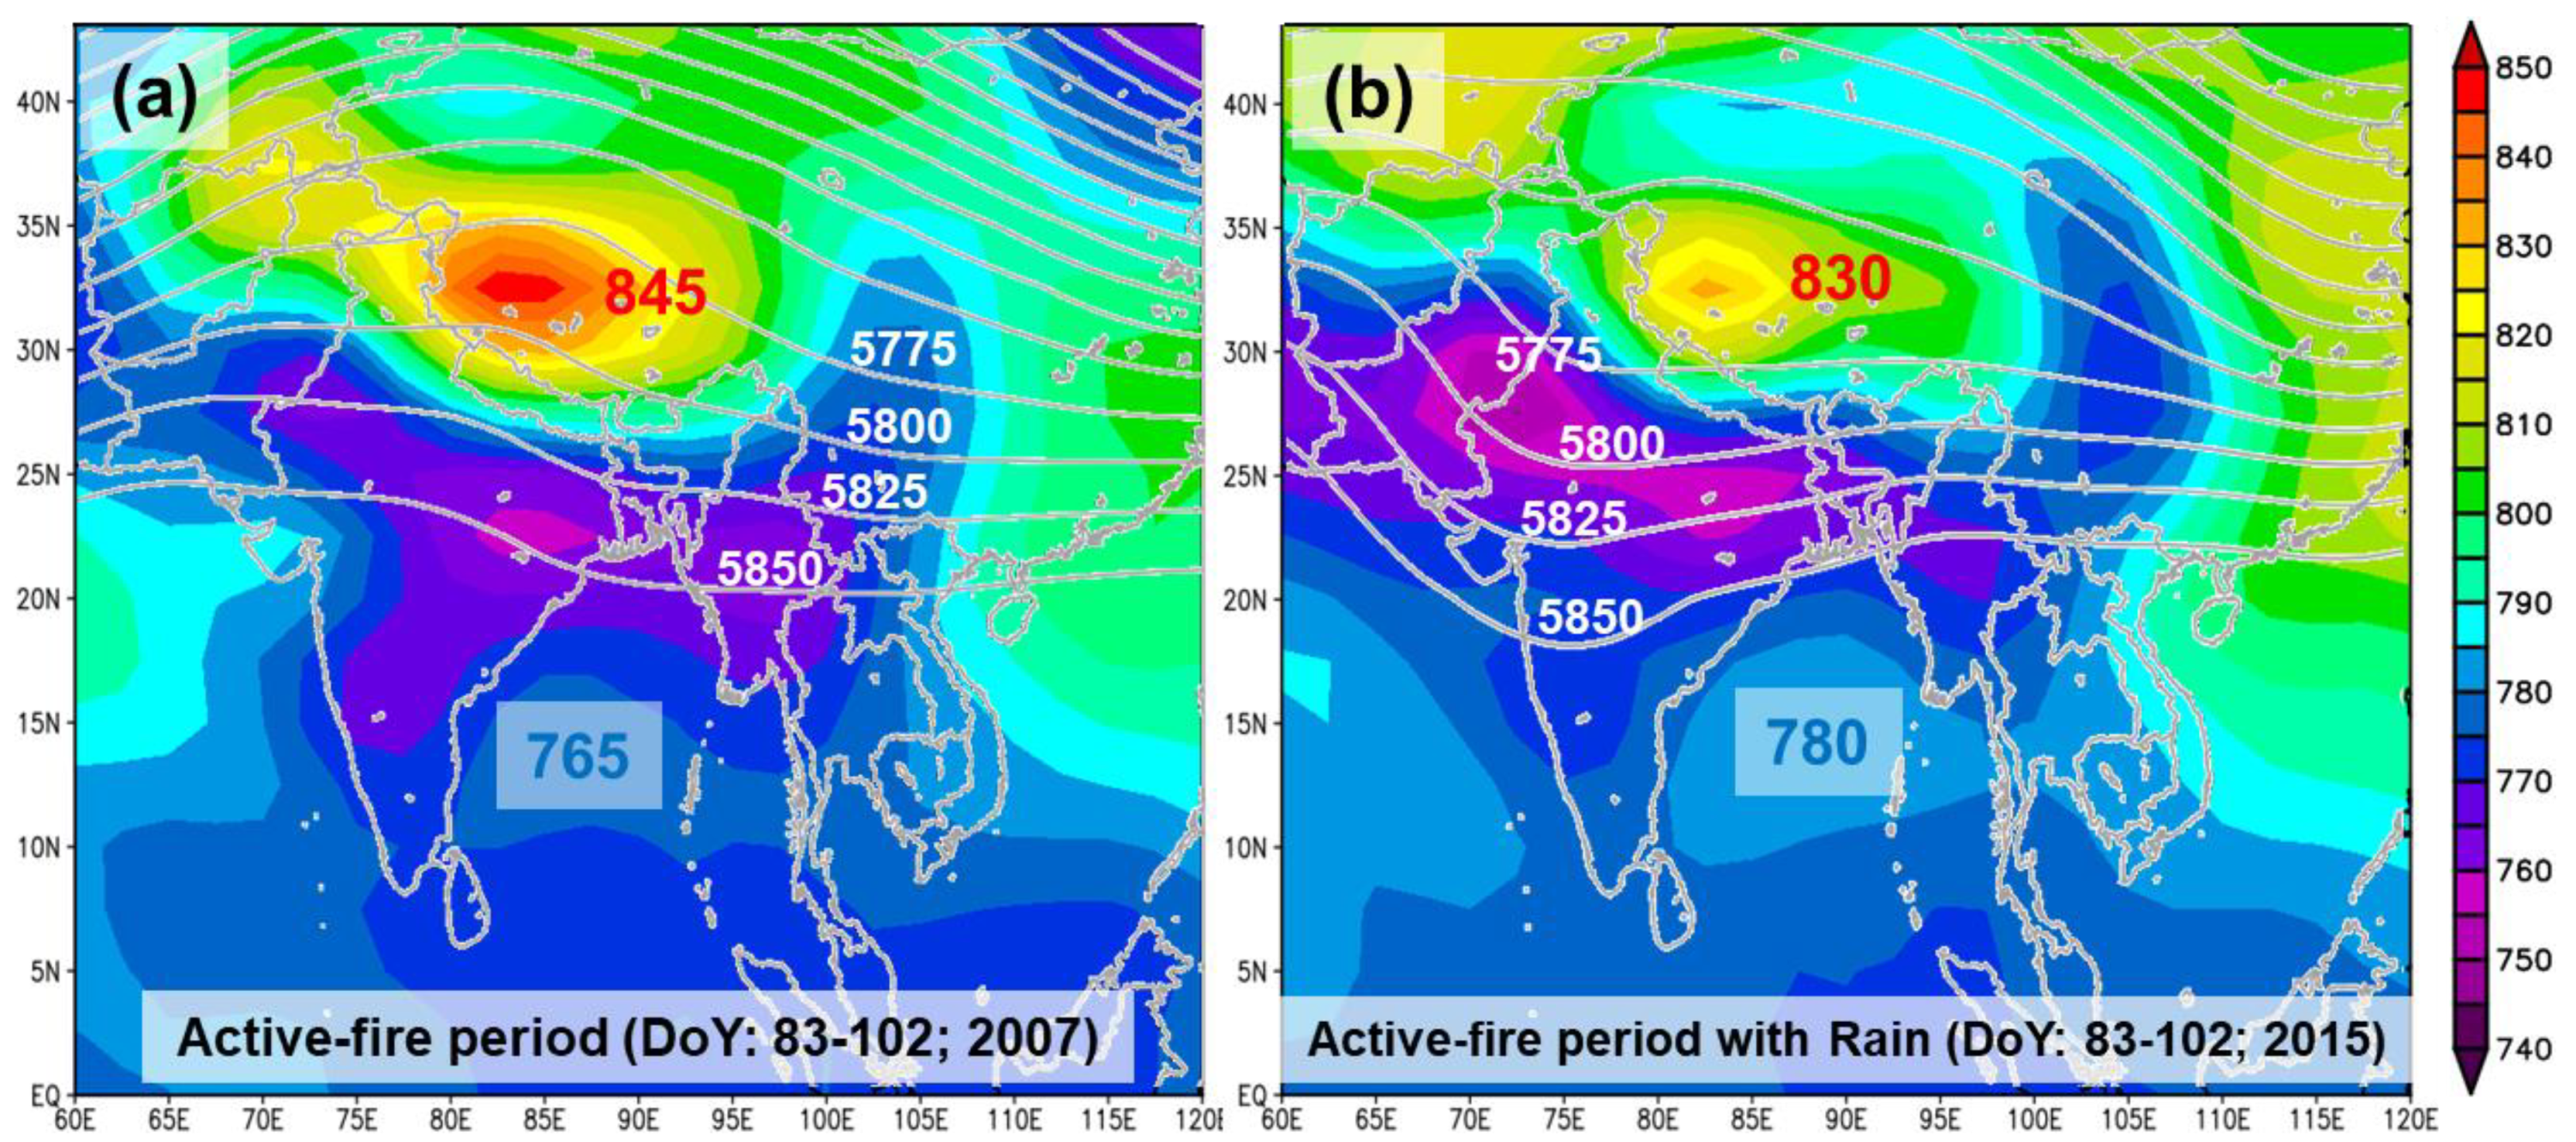
Figure 6 depicts that precipitation was one of the crucial driving factors during active fire-periods of high and weak fire years. To derive the synoptic weather pattern in relation to the precipitation occurrence in 2007 and 2015, we selected four weather maps at 925 hPa (shaded) and at 500 hPa (solid line) during the active fire-periods, shown in Figure 7a,b. The 925 hPa heights of the low-pressure system over Bangladesh are almost the same for 2007 (765 m) and 2015 (765–770 m). Conversely, heights of the high-pressure system over the Tibetan Plateau are 845 m in 2007 and 830 m in 2015.
4. Discussion
4.1. Fire Occurrence
In Bangladesh, the topmost five fire years with the maximum number of HSs were 2006 (4113 HSs), 2007 (3961 HSs), 2009 (3875 HSs), 2005 (3751 HSs and 2012 (3244 HSs). The lowest number of HS was 1407 in 2017. There is about a 2.9-fold difference between the HS occurrences between high and weak fire years (the highest 4113 HSs in 2006 and the lowest 1407 HSs in 2017). The green bar graph in Figure 3 shows that most fires occurred in CHT and their percentage is about 88% of the grand total of HSs in Bangladesh. Most fires tend to occur due to local people’s interventions or ‘slash and burn’ agriculture. Fuels for fire are mostly different types of cut vegetation, fallen trees, branches, twigs and leaves from deciduous forests, dead grass, weeds, agricultural residues, and so on, and anthropogenic disturbances like illegal logging and shifting cultivation are very common [50]. Other dominant sources of fuels are stubble from jhum rice, turmeric, ginger, sesame, chili, maize, pumpkin, okra, cowpea, cucumber, eggplant, leafy vegetables, established banana, papaya, established pineapple, etc., that requires a drying period for clearing, burning, weeding, sowing and so on, followed by a slash and burning period for around 16 man-days [51]. Nevertheless, the human interventions are known often to negatively influence natural regeneration [52], whilst the majority of wildfires in the CHT are caused by inappropriate fire practices in the agricultural and livestock sector.
4.2. Weather Conditions
It is seen from Figure 4 that most of the fires (98%, ±3σ) occur during the fire-period from DoY 63 to 123. The majority of fires (92%; 50,169 HSs) occurred during the fire-period from March through April whilst 69% (average daily HSs > 70; 34,727 HSs; ±σ) were reported within the very active fire-period (DoY: 83–102). This period also coincided with the slash and burn period of shifting or jhum cultivation of around two weeks [51]. This suggests that most fires are human-caused. On the other hand, fires were concentrated at the end of the dry season (Figure 4), whilst the Asian summer monsoon provides most of the total annual precipitation (94%) in CHT roughly from April to October. The weather of CHT is characterized by a tropical monsoon climate (Am) with mean annual precipitation from nearly 2540 mm to 3810 mm. Precipitation peak at the end of June is related to Intertropical Convergence Zone (ITCZ), which moves from the south and is located over Bangladesh from June to August. On the contrary, the Asian winter monsoon moves ITCZ south and dry conditions persist from November through March. Under this dry weather situation, conducive conditions for ignition of fuels are created and stimulate the high fire activity in the area in this period. Additionally, the fire prone weather conditions during the fire-period from March through April (DoY: 63–123) are found in Figure 5. The Tmax in April is 34 °C and the highest average ISSE is 6.4 kWh in April. These two values are the highest throughout the year around Dhaka, the capital of Bangladesh. Their average rate of increase from February are 0.1°C day−1 and 0.02 kWh day−1, respectively. Vw increased from 2.9 m s−1 (10.4 km h−1) in March and 3.7 m s−1 (13.3 km h−1) in April and are classified as ‘Light’ and ‘Gentle’ on the Beaufort scale [53]. The rate of increase of Vw from February is 0.02 m s−1 day−1 (0.07 km h−1), the highest throughout the whole year. Increased temperatures exacerbate heat and water stress as well as fire risk [54,55]. However, the considerable variation in fire risks from year to year in CHT is closely related to the rainfall and length of dry season [56].
Figure 6 shows very active fires during the active fire-period under drought conditions in 2007 made by the Asian winter monsoon-like conditions. Contrarily, pre-monsoon showers of more than 100 mm during the active fire-period suppressed fires in 2015 made by the Asian summer monsoon-like weather conditions. It is predicted that weather and climate are the most important factors influencing fire activity in tropical and subtropical regions [57], whilst the subtropical forest areas of CHT in Bangladesh will undergo changes likely to be triggered by changing moisture, CO2 fertilization and temperature regimes [58]. Though the wildfire in this region is mostly anthropogenic, the extent of fire and its suppression is very much sensitive to weather in the days and weeks following ignition, particularly post-ignition and the timing of precipitation. After analyzing various kinds of weather maps to explain different fire activities which occurred in high and weak fire years (as shown in Figure 6), it is found that different fire activities can be explained by using appropriate weather maps to evaluate dry conditions related to the Asian winter monsoon or high-pressure systems over the Tibetan plateau, along with wet conditions due to the Asian summer monsoon or high-pressure systems over the Indian Ocean which could bring pre-monsoon showers. This difference in height may be attributed to the different types of the Asian winter and summer monsoons. A greater height of 780 m in 2015 than 765 m in 2007 over the Bay of Bengal in Figure 7a,b may also suggest rainy conditions in 2015 occurred under the Asian summer monsoon-like weather conditions. Nevertheless, further research is needed to cope with the effect of the higher frequency and intensity of fires expected in the future due to climate change in this region.
5. Conclusions
The first ever inclusive study on wildland fires in Bangladesh was carried out to clarify the spatio-temporal structure of wildland fires and their fire weather conditions using MODIS hotspot data, various weather data, and synoptic-scale weather maps. The main conclusions from the analysis results for wildland fires in Bangladesh are summarized below.
The fire period in Bangladesh started from March through April (DoY: 63–123) corresponding to 92% of the total fire occurrence. Most fires (69%) during the very active fire-period (from the end of March to the beginning of April, DoY: 83–102) occurred in the subtropical CHT. The ‘dry season’ from November through April corresponded to 98% of total fire occurrence.
We showed that the use of appropriate weather maps to assess the dry and wet conditions associated with the Asian winter and summer monsoons can account for different fire activity. Namely, strong high-pressure systems over the Tibetan Plateau can create dry conditions, while strong high-pressure systems over the Indian Ocean can provide moist air and make pre-monsoon showers.
We found fire-prone weather conditions from the weather database: average maximum air temperature (Tmax), incident shortwave solar energy (ISSE) and wind speed (Vw). Tmax and ISSE in April are the highest and strongest in Dhaka. Vw rate of increase from February is the highest throughout the year.
Lastly, we may prevent future wildfires in Bangladesh by applying the analysis results of this report. Based on our analysis results, fire prevention and prediction methods can be developed. As the protection of the remaining primary forests is essential for biodiversity conservation and for a healthy tropical forest ecosystem, this report may facilitate the development of executable ways to mitigate global warming by reducing CO2 emissions from wildland fires and could suggest a future forest resource management strategy for Bangladesh.
Author Contributions
Conceptualization, M.A.F. and H.H.; methodology, H.H.; software, M.A.I.; validation, M.A.F., H.H. and M.A.I.; formal analysis, M.A.F., H.H. and M.A.I.; data curation, M.A.I.; writing—original draft preparation, M.A.F. and H.H.; writing—review and editing, M.A.F. and H.H.; visualization, M.A.F. and H.H.; supervision, H.H. All authors have read and agreed to the published version of the manuscript.
Funding
This research received no external funding.
Institutional Review Board Statement
Not applicable.
Informed Consent Statement
Not applicable.
Data Availability Statement
This study used MODIS hotspot data obtained from the NASA Fire Information for Resource Management System (FIRMS; MODIS Collection 6, https://firms.modaps.eosdis.nasa.gov/download/, (accessed on 10 September 2021). We used reanalysis data provided by the NOAA/OAR/ESRL PSL, Boulder, CO, USA, from their website at https://psl.noaa.gov/ (accessed on 6 October, 2021). Weather data from “World Weather Online” was used to check ground level weather conditions (https://www worldweatheronline.com, accessed on 6 October 2021).
Acknowledgments
We would like to thank: (i) support for the Twentieth Century Reanalysis Project version 3 dataset is provided by the U.S. Department of Energy, Office of Science Biological and Environmental Research (BER), by the National Oceanic and Atmospheric Administration Climate Program Office, and by the NOAA Physical Sciences Laboratory; and (ii) weather database from Weather Spark, Cedar Lake Ventures, Inc., 2500 Shadywood Rd Ste 510, Excelsior, MN 55331-6203, United States.
Conflicts of Interest
The authors declare no conflict of interest.
References
- MoEF (Ministry of Environment and Forest), Government of the People’s Republic of Bangladesh. Bangladesh Climate Change Strategy and Action Plan; MoEF: Dhaka, Bangladesh, 2008; Volume 68, p. xvi.
- Worldometers. Available online: https://www.worldometers.info/ (accessed on 1 November 2022).
- BBS (Bangladesh Bureau of Statistics). Bangladesh Statistics 2020; Statistics and Informatics Division, Ministry of Planning: Dhaka, Bangladesh, 2020.
- Hossain, M.L.; Hossain, M.K.; Das, S.R. Vulnerability of Bangladesh to Natural and Anthropogenic Disasters; Vision Publication: Dhaka, Bangladesh, 2010; p. 219. [Google Scholar]
- Redowan, M.; Akter, S.; Islam, N. Analysis of forest cover change at Khadimnagar National Park, Sylhet, Bangladesh, using Landsat TM and GIS data. J. For. Res. 2014, 25, 393–400. [Google Scholar] [CrossRef]
- Hu, X.; Naess, J.S.; Iordan, C.M.; Huang, B.; Zhao, W.; Cherubini, F. Recent global land cover dynamics and implications for soil erosion and carbon losses from deforestation. Anthropocene 2021, 34, 100291. [Google Scholar] [CrossRef]
- Hartung, M.; Carreño-Rocabado, G.; Peña-Claros, M.; van der Sande, M.T. Tropical dry forest resilience to fire depends on fire frequency and climate. Front. For. Glob. Chang. 2021, 4, 755104. [Google Scholar] [CrossRef]
- Andela, N.; Morton, D.C.; Giglio, L.; Paugam, R.; Chen, Y.; Hantson, S.; van der Werf, G.R.; Randerson, J.T. The Global Fire Atlas of individual fire size, duration, speed and direction. Earth. Syst. Sci. Data 2019, 11, 529–552. [Google Scholar] [CrossRef] [Green Version]
- Burton, C.; Kelley, D.I.; Jones, C.D.; Betts, R.A.; Cardoso, M.; Anderson, L. South American fires and their impacts on ecosystems increase with continued emissions. Clim. Resil. Sustain. 2022, 1, e8. [Google Scholar] [CrossRef]
- Hayasaka, H.; Yamazaki, K.; Naito, D. Weather conditions and warm air masses during active fire-periods in Boreal forests. Polar Sci. 2019, 22, 100472. [Google Scholar] [CrossRef]
- Hayasaka, H.; Tanaka, H.L.; Bieniek, P.A. Synoptic-scale fire weather conditions in Alaska. Polar Sci. 2016, 10, 217–226. [Google Scholar] [CrossRef]
- Hayasaka, H. Fire weather conditions in Boreal and polar regions in 2002–2021. Atmosphere 2022, 13, 1117. [Google Scholar] [CrossRef]
- Timothy, A.D.; Moses, I.; Johnstone, K.; Abigael, N.O. Effects of wildland fire on the tropical alpine moorlands of Mount Kenya. Catena 2017, 149, 300–308. [Google Scholar] [CrossRef]
- Hayasaka, H.; Yamazaki, K.; Naito, D. Weather conditions and warm air masses in southern Sakha during active forest fire periods. J. Disaster Res. 2019, 14, 641–648. [Google Scholar] [CrossRef]
- Hayasaka, H. Rare and extreme wildland fire in Sakha in 2021. Atmosphere 2021, 12, 1572. [Google Scholar] [CrossRef]
- Erianto, I.P.; Hayasaka, H. The effect of the precipitation pattern of the dry season on peat fire occurrence in the Mega Rice Project area, Central Kalimantan, Indonesia. Tropics 2011, 19, 145–156. [Google Scholar]
- Pechony, O.; Shindell, D.T. Driving forces of global wildfires over the past millennium and the forthcoming century. Proc. Natl. Acad. Sci. USA 2010, 107, 19167–19170. [Google Scholar] [CrossRef] [PubMed] [Green Version]
- Huang, Y.; Wu, S.; Kaplan, J.O. Sensitivity of global wildfire occurrences to various factors in the context of global change. Atmos. Environ. 2014, 121, 86–92. [Google Scholar] [CrossRef] [Green Version]
- Motaleb, M.A.; Hossain, M.K. Assessment of tree species diversity of Tankawati natural forests, Chittagong (South) Forest Division, Bangladesh. Eco-Friendly Agric. J. 2011, 4, 542–545. [Google Scholar]
- Rahman, M.H.; Khan, M.A.S.A.; Roy, B.; Fardusi, J. Assessment of natural regeneration status and diversity of tree species in the biodiversity conservation areas of northeastern. Bangladesh J. For Res. 2011, 22, 551–559. [Google Scholar] [CrossRef]
- Hossain, M.A.; Hossain, M.K.; Salam, M.A.; Rahman, S. Composition and diversity of tree species in Dudhpukuria-Dhopachori wildlife sanctuary of Chittagong (south) forest division, Bangladesh. Res. J. Pharm. Biol. Chem. Sci. 2013, 4, 1447–1457. [Google Scholar]
- Ponomarev, E.I.; Kharuk, V.I.; Ranson, K.J. Wildfires dynamics in Siberian larch forests. Forests 2016, 7, 125. [Google Scholar] [CrossRef] [Green Version]
- Weatherspark. Available online: https://weatherspark.com/y/111858/Average-Weather-in-Dhaka-Bangladesh-Year-Round (accessed on 1 November 2022).
- Kottek, M.; Grieser, J.; Beck, C.; Rudolf, B.; Rubel, F. World map of the Köppen-Geiger climate classification updated. Meteorol. Z. 2006, 15, 259–263. [Google Scholar] [CrossRef]
- Farukh, M.A.; Islam, M.A.; Uddin, M.N. Synoptic climatology of pre-monsoon frequent lightning events in Bangladesh. Nat. Hazards 2022. [Google Scholar] [CrossRef]
- MODIS Vegetation Index Products (NDVI and EVI). Available online: https://modis.gsfc.nasa.gov/data/dataprod/mod13.php (accessed on 4 April 2022).
- Islam, M.T.; People’s Participation in Protected Areas of Bangladesh. First Asia Park Congress, Sendai City, Japan. 13–17 November 2013. Available online: http://www.env.go.jp/nature/asia-parks/ (accessed on 25 July 2016).
- MoCHTA (Ministry of Chittagong Hill Tracts Affairs). Background 2021. Available online: https://mochta.gov.bd/site/page/e26cc3a5-8f9e-427a-9cbd9e614de0c052/MoCHTA-Background (accessed on 6 April 2021).
- Akter, S.; Rich, J.L.; Davies, K.; Inder, K.J. Prevalence and factors associated with antenatal care service access among indigenous women in the Chittagong Hill Tracts, Bangladesh: A cross-sectional study. PLoS ONE 2020, 15, e0244640. [Google Scholar] [CrossRef] [PubMed]
- Ahammad, R.; Stacey, N.; Sunderland, T. Assessing land use changes and livelihood outcomes of rural people in the CHT region, Bangladesh. Land Deg. Dev. 2021, 32, 3626–3638. [Google Scholar] [CrossRef]
- BBS (Bangladesh Bureau of Statistics). Bangladesh Statistics 2015. Available online: http://www.bbs.gov.bd/home.aspx (accessed on 10 June 2022).
- Chowdhury, B.; Hossain, M.K.; Hossain, M.A.; Khan, B.M. Native tree species diversity of Rampahar natural forest reserve in Rangamati South forest division, Bangladesh. Ceylon J. Sci. 2018, 47, 129–136. [Google Scholar] [CrossRef]
- Rahman, M.N.; Rony, M.R.H.; Jannat, F.A.; Chandra Pal, S.; Islam, M.S.; Alam, E.; Islam, A.R.M.T. Impact of urbanization on urban heat island intensity in major districts of Bangladesh using remote sensing and geo-spatial tools. Climate 2022, 10, 3. [Google Scholar] [CrossRef]
- BFD (Bangladesh Forest Department). District Wise Forest Area of Bangladesh 2016. Available online: http://www.bforest.gov.bd (accessed on 16 January 2021).
- Global Forest Resources Assessments. Available online: https://www.fao.org/forest-resources-assessment/en/ (accessed on 28 October 2022).
- NFA. National Forest and Ttree Resources Assessment 2005–2007 Bangladesh; NFA: Chicago, IL, USA, 2007; p. 192. [Google Scholar]
- FAO. Global Forest Resources Assessment 2010. Global Forest Resources Assessment Country Report: Bangladesh; FAO Forestry Paper; Food and Agriculture Organization of the United Nations: Rome, Italy, 2010; Volume 163, p. 340. [Google Scholar]
- Rahman, L.M.; Ahmed, F.U. Forest dependent people in Bangladesh. In Souvenir: National Tree Planting Campaign and Tree Fair 2016; Bhuiyan, Z.H., Thakur, A.B., Uddin, M.S., Hossain, A.A., Eds.; Forest Department, Ministry of Environment and Forests, Government of the People’s Republic of Bangladesh: Dhaka, Bangladesh, 2016; pp. 57–60. [Google Scholar]
- Ronju, A.; Natasha, S. Forest and agrarian change in the Chittagong Hill Tracts region of Bangladesh. In Agrarian Change in Tropical Landscapes; Deakin, E.L., Kshatriya, M., Sunderland, T.C.H., Eds.; Center for International Forestry Research (CIFOR): Bogor Regency, Indonesia, 2016; pp. 190–233. Available online: https://www.cifor.org/knowledge/publication/6367 (accessed on 4 September 2022).
- Emran, A.; Roy, S.; Bagmar, M.S.H.; Mitra, C. Assessing topographic controls on vegetation characteristics in Chittagong Hill Tracts (CHT) from remotely sensed data. Remote Sens. Appl. Soc. Environ. 2018, 11, 198–208. [Google Scholar] [CrossRef]
- Islam, M.S.; Alam, M.; Mantel, S. Land Use Planning and Environmental Control in the Chittagong Hill Tracts; CHARM Project Report No. 3; Bangladesh Centre for Advanced Studies: Dhaka, Bangladesh, 2007. [Google Scholar]
- GoB, Government of Bangladesh and Food and Agriculture Organization of the United Nations. Support to Preparation of an Integrated Project for Environment Friendly Agriculture in the Chittagong Hill Tract; Technical Report; GoB: Dhaka, Bangladesh; FAO: Rome, Italy, 2013.
- Alamgir, M.; Al-Amin, M. Plant diversity and their distribution pattern at strategically selected conserved forests of Banskhali, Chittagong. J. For. Env. 2005, 3, 69–75. [Google Scholar]
- Islam, M.S. Banglapedia—the National Encyclopedia of Bangladesh. 2021. Available online: https://en.banglapedia.org/index.php/Jhum (accessed on 30 August 2022).
- Ritse, V.; Basumatary, H.; Kulnu, A.S.; Dutta, G.; Phukan, M.M.; Hazarika, N. Monitoring land use land cover changes in the eastern Himalayan landscape of Nagaland, northeast India. Environ. Mon. Assess. 2020, 192, 711. [Google Scholar] [CrossRef]
- NASA. Fire Information for Resource Management System (FIRMS). MODIS Collection 6. Available online: https://firms.modaps.eosdis.nasa.gov/download (accessed on 10 September 2021).
- NCEP/NCAR Reanalysis 1: Summary. Available online: https://psl.noaa.gov/data/gridded/data.ncep.reanalysis.pressure.html (accessed on 4 April 2022).
- Worldview. Available online: https://worldview.earthdata.nasa.gov (accessed on 6 October 2021).
- Ekusheysangbad, a Popular Electronic Mass Media. Available online: www.ekusheysangbad.com (accessed on 2 March 2021).
- Harun-Ur-Rashid, M.; Chowdhury, M.A.I. Additions to the angiosperm flora in the Sitapahar reserve forest of Kaptai, Rangamati, Bangladesh. Bangladesh J. Plant Taxon. 2013, 20, 255–257. [Google Scholar] [CrossRef] [Green Version]
- Langford, G. Baseline Study, Agricultural Livelihoods in the Higher Elevation Areas of the Chittagong Hill Tracts. UNWFP & ECHO. 2017. Available online: https://fscluster.org/sites/default/files/documents/cht_report_final_compressed.pdf (accessed on 22 August 2022).
- Crouzeilles, R.; Beyer, H.L.; Monteiro, L.M.; Feltran-Barbieri, R.; Pessôa, A.C.; Barros, F.S.; Lindenmayer, D.B.; Lino, E.D.S.M.; Grelle, C.E.V.; Chazdon, R.L.; et al. Achieving cost-effective landscape-scale forest restoration through targeted natural regeneration. Conserv. Lett. 2020, 13, e12709. [Google Scholar] [CrossRef]
- Beaufort Scale. Available online: https://blog.metservice.com/BeaufortWindScale (accessed on 27 November 2022).
- Littell, J.S.; McKenzie, D.; Peterson, D.L.; Westerling, A.L. Climate and wildfire area burned in western US ecoprovinces, 1916–2003. Ecol. Appl. 2009, 19, 1003–1021. [Google Scholar] [CrossRef]
- Cook, B.I.; Smerdon, J.E.; Seager, R.; Coats, S. Global warming and 21st century drying. Clim. Dyn. 2014, 43, 2607–2627. [Google Scholar] [CrossRef] [Green Version]
- Wosten, J.H.M.; Clymans, E.; Page, S.E.; Rieley, J.O.; Limin, S.H. Peat-water interrelationship in a tropical peatland ecosystem in Southeast Asia. Catena 2008, 73, 212–224. [Google Scholar] [CrossRef]
- Delmotte, M.V.; Zhai, P.; Pirani, A.; Connorsv, S.L.; Péanv, C.; Berger, S.; Caud, N.; Chen, Y.; Goldfarbv, L.; Gomis, M.I.; et al. (Eds.) IPCC. Summary for Policymakers. In Climate Change 2021: The Physical Science Basis, contribution of Working Group I to the Sixth Assessment Report of the Intergovernmental Panel on Climate Change; Cambridge University Press: Cambridge, UK, 2021; in press. [Google Scholar]
- Chaturvedi, R.K. Impact of Climate Change on the Forest of Bangladesh. Paper Delivered at the Workshop on Climate Change Impacts: Enhancing Resilience of Forest Ecosystems and Forest Dependent Communities to Enable Adaptation to Climate Impacts; Climate Resilient Participatory Afforestation and Reforestation Project (CRPARP), Forest Department: Dhaka, Bangladesh, 2016. [Google Scholar]
Figure 1.
(a) Map of the forest areas of Bangladesh, compiled from MODIS Terra/Aqua 16-day normalized difference vegetation index (NDVI) for 2021 [26]. The major vegetation types, i.e., ‘Hill forest’, ‘Mangrove forest’ and ‘Sal forest’, are also shown with their spatial coverage and areas. Other green areas symbolize mainly plantation forests. Black & Red ‘X’ represent the location of Dhaka (23°46′ N and 90°23′ E) & Chittagong (22°16′ N, 91°49′ E) BMD weather stations, respectively. (b) Spatial distribution of MODIS HSs for the whole of Bangladesh (54,669 HSs) from 2003 to 2021. A total of 48,273 HSs were detected within the CHT rectangular area (blue rectangle) that represents 88% of total HSs. The rectangle denotes the study area, Chittagong Hill Tracts (CHT: 21°25′–23°45′ N, 91°54′–92°50′ E).

Figure 2.
(a) Slash and burn (red dot) in agricultural fields scattered over the mountain patches of CHT. All these may be anthropogenic fires. Image taken from Worldview [48] on 3 April 2007. (b) Typical slash and burn agricultural fields in hilly area of CHT. Photo courtesy from ‘ekusheysangbad’ [49] on 2 March 2021.

Figure 3.
Fire history from 2003 to 2021 in Bangladesh.

Figure 4.
Average daily number of hotpots (HSs) during the whole year is shown by the red curve with circles for the last 19 years (2003–2021) in Bangladesh. Daily precipitation in CHT is shown by the blue curve. Most of the fires start from the beginning of March and end at the beginning of May (98% of fires, ±3σ). Very active fire-period (average daily HSs > 70; 69% of fires; ±σ) starts from 24 March and ends on 12 April (DoY: 83–102).

Figure 5.
Fire-prone weather conditions of maximum air temperature (Tmax), incident shortwave solar energy (ISSE), and wind speed (Vw) for Dhaka weather station. Weather data from ‘weatherspark’ [23], accessed on 01 November 2022.
Figure 5.
Fire-prone weather conditions of maximum air temperature (Tmax), incident shortwave solar energy (ISSE), and wind speed (Vw) for Dhaka weather station. Weather data from ‘weatherspark’ [23], accessed on 01 November 2022.

Figure 6.
Fire activity and precipitation during fire season in (a) high fire year (2007) and (b) weak fire year (2015). Red bar shows daily number of HSs and the blue bar shows daily precipitation. Accumulated HSs and precipitation from March through April are shown by the red and blue dashed lines, respectively.

Figure 7.
Weather maps at 925 hPa (in m, shaded) and 500 hPa (in m, solid line) during the active fire-periods (DoY: 83–102) for (a) high fire year (2007), and (b) weak fire year (2015). The red numbers (845 m & 830 m) for the north of Bangladesh show the value of heights over the Tibetan Plateau whilst, the blue numbers (765 m & 780 m) for the south depict value over the Bay of Bengal. The white numbers along the solid lines represent 500 hPa geo-potential heights over Bangladesh.

Disclaimer/Publisher’s Note: The statements, opinions and data contained in all publications are solely those of the individual author(s) and contributor(s) and not of MDPI and/or the editor(s). MDPI and/or the editor(s) disclaim responsibility for any injury to people or property resulting from any ideas, methods, instructions or products referred to in the content. |
© 2023 by the authors. Licensee MDPI, Basel, Switzerland. This article is an open access article distributed under the terms and conditions of the Creative Commons Attribution (CC BY) license (https://creativecommons.org/licenses/by/4.0/).
Share and Cite
MDPI and ACS Style
Farukh, M.A.; Islam, M.A.; Hayasaka, H. Wildland Fires in the Subtropical Hill Forests of Southeastern Bangladesh. Atmosphere 2023, 14, 97. https://doi.org/10.3390/atmos14010097
AMA Style
Farukh MA, Islam MA, Hayasaka H. Wildland Fires in the Subtropical Hill Forests of Southeastern Bangladesh. Atmosphere. 2023; 14(1):97. https://doi.org/10.3390/atmos14010097
Chicago/Turabian StyleFarukh, Murad A., Md. A. Islam, and Hiroshi Hayasaka. 2023. "Wildland Fires in the Subtropical Hill Forests of Southeastern Bangladesh" Atmosphere 14, no. 1: 97. https://doi.org/10.3390/atmos14010097
Note that from the first issue of 2016, this journal uses article numbers instead of page numbers. See further details here.