Article

Air Quality Scenario Analysis Application of Multi-Domain Linkage Development in the Pearl River Delta

Guangdong Provincial Environmental Protection Key Laboratory of Atmospheric Environment Management and Policy Simulation, Guangdong Provincial Academy of Environmental Science, Guangzhou 510045, China
*
Author to whom correspondence should be addressed.
Atmosphere 2023, 14(1), 56; https://doi.org/10.3390/atmos14010056
Submission received: 1 December 2022 / Revised: 23 December 2022 / Accepted: 25 December 2022 / Published: 28 December 2022
(This article belongs to the Section Air Pollution Control)

Abstract

:
In the background of constructing a wold-class Guangdong-Hong Kong-Macao Great Bay Area (GBA), the growing demand for industrial, transportation and energy development in the Pearl River Delta (PRD) will put considerable pressure on improvement of regional air quality. It is important to choose a scientific development path to achieve both economic goal and air quality improvement target. This study uses scenario analysis method to construct three “industry-transport-energy” development scenarios within the region while the improvement level of air quality is simulated and analyzed. The results show that: (1) Considering the mutual constraints and influence relations between industry, transportation and energy in scenario analysis, the “industry-transport-energy” development scenario can be established to meets the same economic goal but has different development paths. (2) Along the historical track and established policy path, concentration of fine particulate matter (PM2.5) in the PRD can be reduced to 16.2 µg/m3 by 2035 as regional gross domestic product (GDP) reaching about 23.5 trillion. (3) Under the same economic goals, raising the proportion of emerging industries, freight by rail, public transport travel and non-fossil power to 95%, 10%, 73%, and 46% respectively leads to 29.6~49.2% reductions in the emissions of sulphur dioxide (SO2), nitrous oxides (NOx), primary PM2.5 and volatile organic compounds (VOCs) compared with those in 2017 that the regional PM2.5 concentration will further drop to 14.1 µg/m3. The results show that, under the constraints of economic development objectives, deepening structural adjustment can improve air quality, which gives advice for the PRD to choose its development path. Furthermore, this study can provide reference for the PRD to promote the transformation of industrial, transportation and energy development modes and structural adjustment under the dual objective of promoting the world-class bay area economic level and high-quality air level.

1. Introduction

Different economies worldwide use resources and fossil fuels to achieve industrialization and urbanization when developing their economies, which increases air pollution in the environment especially in rapid developing regions [1,2,3]. However, there is more than one simple linear relationship between economy and air quality. As early as in the 1990s, some American researchers had put forward the hypothesis that there was an inverted “U”-shaped relationship between economy and air quality. It supposed the air quality would deteriorate rapidly when the economy develops rapidly, while the air quality would gradually improve when the economic development becomes stable and the society begins to pay attention to environmental protection [4,5]. Various countries are adopting effective strategies for better air quality and growing economy [6].
Located in the core area of Guangdong province, the PRD region is one of the most developed regions in China and has accounted for 80% of the province’s total economy for over 10 years [7]. From 1978 to 2018, the total GDP of Guangdong has grown 483 times, and Guangdong has gathered 8% of the total population and created nearly 11% of the total GDP the national territory since the reform and opening-up [8]. In the process of taking the lead in the rapid economic development, the PRD region suffers from the air pollution problem earlier. The concentration of pollutants such as SO2, nitrogen dioxide (NO2) and inhalable particulate matter (PM10) remained high, and the concentration of PM2.5 was worsened during 2000 to 2005 [9,10]. However, the PRD achieves both rapid economic development and effective air pollution control in recent years [11]. From 2010 to 2021, the GDP of PRD has grown about 2.5 times and SO2, NO2 and PM10 concentration have decreasing by 70%, 56% and 37%. After reaching PM2.5 concentration World Health Organization (WHO) phase II target (25 μg/m3) in 2020, the air quality of the PRD is better than that of the Beijing–Tianjin–Hebei and Yangtze River Delta regions in China, but still far from the level of advanced bay areas such as the two major bay areas in the United States and the Tokyo Bay Area in Japan [12]. In February 2019, the outline of the development plan of GBA was released, requiring a developing goal of the GBA into a high-quality life circle suitable for living, working and traveling [13]. Thus, the economic and social activities of the PRD need to maintain stable development, while the air quality needs to continue to improve at a low concentration level.
By setting different development types, scenario analysis can make qualitative or quantitative prediction of future air quality within a region, which has been widely used in the study of air quality improvement. The area scope of the studies covers global [14,15,16], regional [17,18,19], national [20,21,22,23,24], provincial [25,26,27,28], and city scales [29,30,31,32,33]. Some of these studies set scenarios by setting different emission reduction rates, regardless of the specifics of the details of the emissions structure [34,35]. For example, Xue et al. simulated PM2.5 and ozone under nine emission reduction scenarios, and the anthropogenic emissions of each air pollutant were reduced by the same percentage, ranging from 10% to 90% for each scenario [25]. Some studies focus on research from a sectoral perspective (such as mobile source and power industry) or a certain air pollution control policy in scenario analysis [32,35,36,37,38,39,40]. For example, Guo et al. and Zhang et al. use scenario analysis to predict the change of conventional pollutant concentration in the Beijing–Tianjin–Hebei region under different target years of vehicle emission control strategies [35,36]. Hu et al. consider five scenarios of China’s power development in 2030 and predicts spatial distribution of conventional pollutant concentration under different scenarios through model simulation on national scale [37]. Li et al. evaluated the air quality improvement potential and far-reaching influence of scattered coal consumption reduction in rural areas. Some studies mainly adopted the data provided by international widely-used scenario models due to their complete long-term scenario database with insufficient localized data [14,15,16,17]. For example, Reis et al. project the future concentrations of major the air pollutants for five socioeconomic pathways, using a fast transport chemistry emulator and the emission database produced for the sixth assessment report of the Intergovernmental Panel on Climate Change. Shim et al. investigated changes in PM2.5 concentration and air-quality index in Asia using climate model from historical and future scenarios under shared socioeconomic pathways. Other researchers consider development scenarios in various fields with a more specific description of the current situation and the development of the region and predict the improvement of air quality in the future [20,24,26,31,40,41]. For example, Tong et al. measured the potential of emission reduction of major pollutants in the Beijing–Tianjin–Hebei region in 2030 under different energy scenarios and end control scenarios, and further evaluated the air quality improvement under different scenarios through air quality models, pointing out the importance of energy structure adjustment to air quality standard [40]. To study the impact of air pollution control strategies on future air quality, similar to the research ideas of Tong et al., Mo et al. and Ling et al. we set up future scenarios which include energy structure scenarios and end-of-pipe scenarios [26,31]. To explore the potential for further improvement of air quality in the PRD, Hong Kong and Macao after the “13th five year plan”, Zhang et al. set up three sets of local emission control scenarios and one set of inter-regional collaborative control scenarios covering short-term established control measures and some enhanced control measures concentrating on transportation and power to simulate PM2.5 concentration improvement under different scenarios [24].
Most of the studies focus on the adjustment of energy structure, and the future development of industry and transportation were separated and used as the input factors for building energy scenarios, without considering the interdependence and mutual constraint relationship between industrial structure, transportation structure and energy structure in the process of adjustment. The coupling relationship within the three fields is important, as the change of industrial structure will lead to the demand for transportation and further leads to the change of energy demand [42,43,44,45], which will affect the emission of air pollutants. In addition, the main focus of the existing studies are changes in air quality under different policies, with inadequate attention to the impact of economic development. However, currently, stability is the primary goal of China’s economic development. It is particularly important to pay attention to the impact on economic development when developing air quality improvement strategies.
In this paper, scenario analysis is used to study the improvement strategy of air quality in the PRD under certain economic development goals, and the coupling relationship within “industry-transportation-energy” is mainly considered in the scenario analysis. Based on the analysis of factor decomposition of economic target and driving force of air pollutant emission, this case study screens the key parameters to be considered in scenario analysis and the mathematical correlation of their linkage effects. Then, we make an overall forecast of the future industrial development, transportation and energy consumption needs of the PRD and build up three types of “industry–transportation–energy” development scenarios. In each scenario, the PRD can achieve its future economic development goals. The air quality improvements under different scenarios are simulated. Through comparing the results with fixed development mode, we provide development plans for achieving high-speed economic objectives while obtaining better air quality.

2. Materials and Methods

2.1. Scenario Analysis Method

2.1.1. Screening of Scenario Parameters

This study focuses on both the accessibility of economic development goals and changes in air quality under different scenarios. We use the factor decomposition method to decompose the driving force of air pollutant emission changes. Variables with strong correlation with air pollutant emission in industry, transportation and energy activities are selected as the parameters in the construction of the scenario. The linkages among the three fields are also being analyzed.
According to the definition, GDP is the sum of added value of various industries in the national economy covering industry, transportation, energy and other fields. Based on Yu and Liu, Lu et al. and Hou et al. [46,47,48].
The factor decomposition method is important in analyzing the driving force of air pollution emissions. Specifically, the exponential factor decomposition method represented by LDMI (logarithmic average Dirichlet index decomposition method) has been widely used in the study of the driving effect of air pollutant and carbon emissions [49,50]. Air pollutant emissions in the fields of industry, transportation and energy can be decomposed into the following factors:
C i n s = C i j E i j × E i j E i × E i G D P i × G D P i G D P × G D P P × P = E C i × I C × I I × I S × Y P × P
where C i n s is air pollutants emission from industry, E C i   ( or   C i j / E i j ) is emission factor of industry i using energy source j, IC ( E i j / E i ) represents energy consumption structure of industry i, II ( E i / G D P i ) represents energy consumption intensity of industry i, IS ( G D P i / G D P ) represents inner structure of industry, YP (GDP/P) is GDP per capita, P is population.
C t r a = C p j E p j × E p j E p × E p Q p i × Q p i Q i × Q i G D P i × G D P i G D P × G D P P × P = E C p × T C × T I × T S × Q × I S × Y P × P
where C t r a is pollutant emission from transportation, E C p (or C p j / E p j ) is emission factor of transportation mode in p ways using j kinds of energy sources, TC (or E p j / E p ) stands for energy consumption structure of transportation mode in p ways, TI (or E p / Q p i ) represents energy consumption intensity of transportation mode in p ways in industry i, TS (or Q p i / Q i ) stands for transportation structure in industry i, Q (or Q i / G D P i ) stands for transportation demand per unit GDP of industry i.
Emission of air pollutants in the energy field mainly comes from power production. Based on Hou et al. [48], the emission of pollutants from power production can be divided into:
C p o w = C j F j × F j G × G = E C j × F G × G
where C p o w is pollutant emission from power production, E C j (or C j / F j ) is emission factor of power production from j kinds of energy, FS (or F j / G ) stands for proportion of fossil fuel power generation, G is power generation.
According to Equations (1)–(3), we found that emissions of air pollutants are not only related to their own level of activities but also related to two other fields (Figure 1). For example, in Equation (2), pollutant emissions from transportation sector are related to traffic volume (Q), energy consumption structure (TC), energy consumption intensity (TI) and industry structure (IS). In other words, the optimization of industrial structure will lead to changes in emissions in the transportation sector, which is consistent with the results of some previous studies [42,43,44,45]. In Equation (3), we can see that power production needs to meet terminal power consumption demand while terminal power consumption is affected by the power consumption intensity, industrial structure, per capita GDP, population and etc. in industry and transportation sectors [51,52,53]. Variables in Equations (1)–(3) are parameters to be considered in scenario analysis.

2.1.2. Prediction Method of Scenario Parameters

Parameters prediction includes elastic coefficient method, multiple linear regression method, logistic model and the combination. By analyzing the development and change law of economic activities and its relationship with demand parameters, we can accurately understand its law of change [42]. Here, it can be used to predict demand parameters such as industrial output, production, motor vehicle ownership, passenger and freight volume, etc. Multiple linear regression analysis can be used in the prediction of passenger and freight volume in transportation demand. Energy consumption in the energy field is predicted based on activity level and unit energy consumption in the industry and transportation fields. In order to limit the increasing demand in various fields, we have restricted the values of the relevant parameters (industry development growth rate, upper limit of transport mode carrying capacity, upper limit of energy supply capacity, upper limit of energy consumption level, etc.) in the prediction function based on existing policies [54,55,56,57,58,59].

2.2. Scenario Setting and Simulation Method

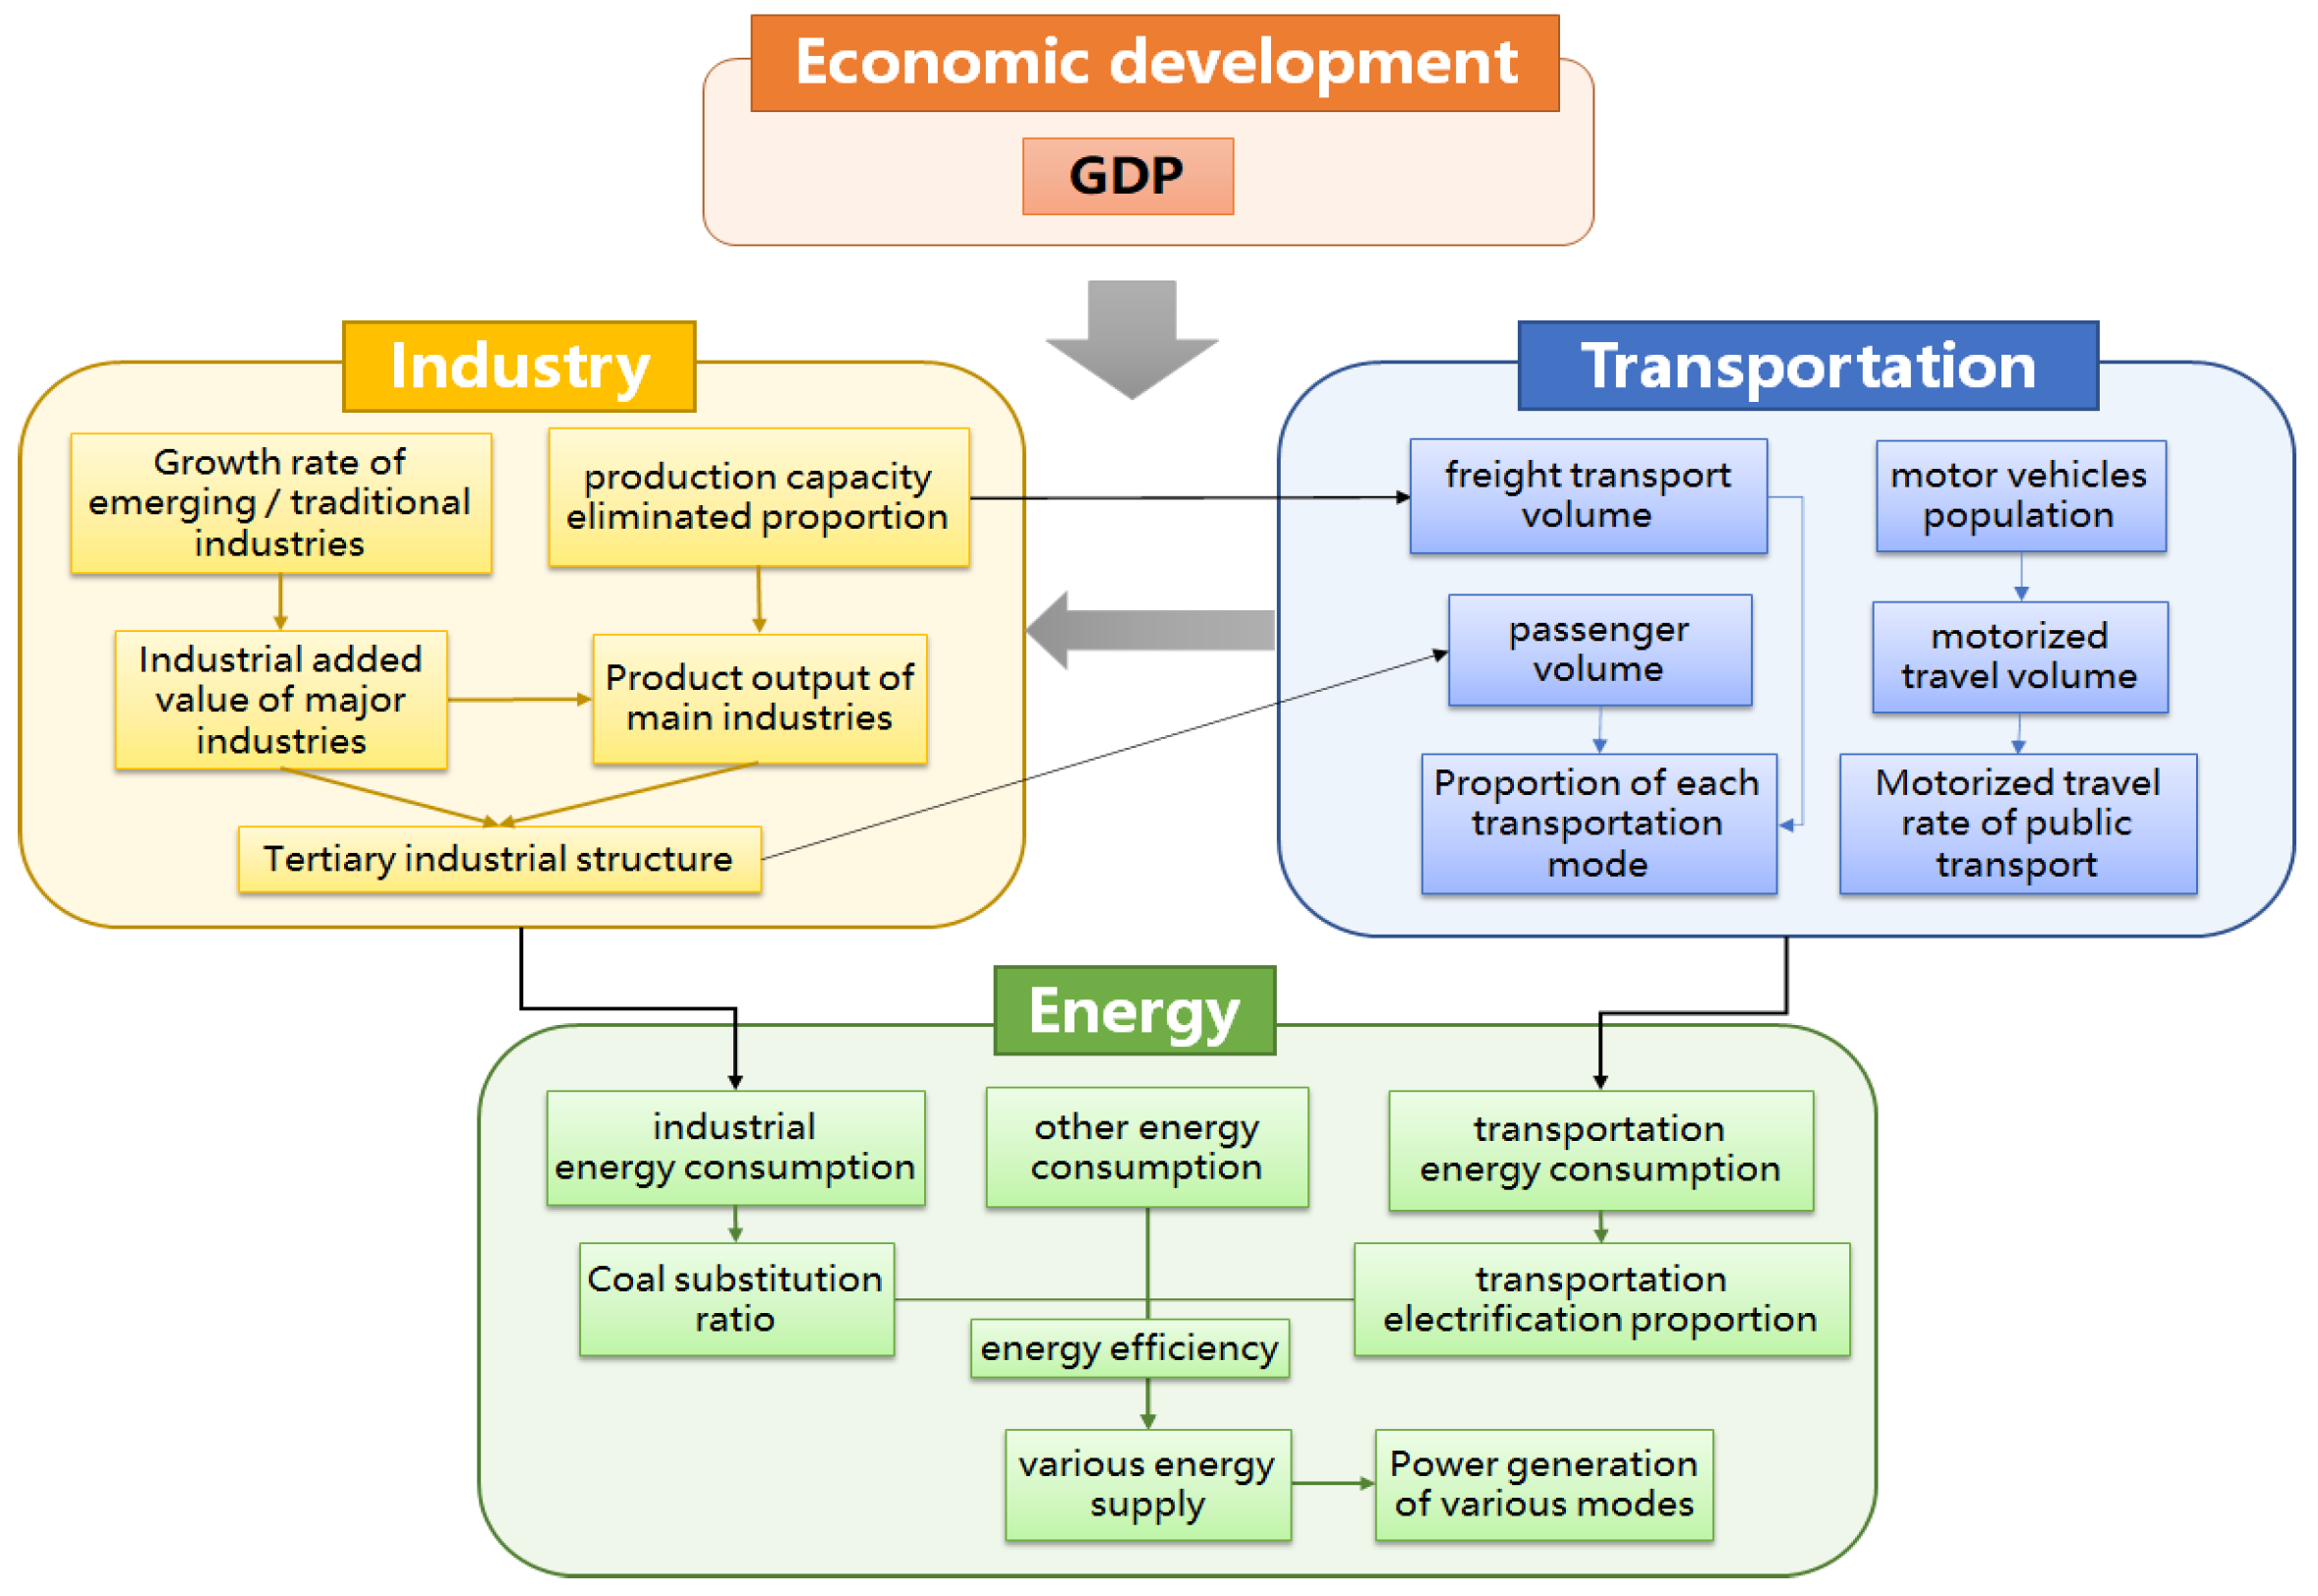
2.2.1. Definition of ‘Industrial-Transportation-Energy’ Linkage Development Scenarios in PRD

Refer to the development objectives of cities within the PRD [54] and research results of Guangdong Academy of Social Sciences [55] that by the end of 2035, PRD’s GDP will reach about CNY 23.5 trillion, GDP per capita will reach CNY 280,000 while the population will increase to 77–80 million, and the urbanization rate will reach above 90%. Government can choose different pathways in industries, transportation and energy sectors to achieve the above development goals. For example, to keep certain economic growth, it can continue to develop its traditional advantageous industries, such as automobile, electrical machinery and building materials manufacturing, or on the other hand, promote green transformation and upgrade traditional industries while developing strategic industries such as semiconductors and integrated circuits, high-end equipment manufacturing, and cutting-edge new materials [56].
In this paper, we set 2017 as base year and 2035 as target year, taking current policies as a guideline. Through selecting different scenario control parameters, we set up one baseline and two control scenarios to represent different development pathways of achieving such development objectives.
The baseline scenario is the Business-as-usual (BAU). The other two scenarios are moderate adjustment scenario (MAS) and enhanced adjustment scenario (EAS). The following is the detailed illustration of the defined scenarios in this paper.
(1)
Business-as-usual Scenario (BAU)
The BAU scenario is the base case in which the growth was assumed to follow the existing projection. The scenario is based on plannings and documents such as “Comprehensive Development Planning of Guangdong Coastal Economic Belt (2017–2030)”, “Opinions on Cultivating and Developing Strategic Pillar Industrial Clusters and Strategic Emerging Industrial Clusters”, “Implementation Plan for Promoting Adjustment of Transportation Structure in Guangdong Province”, “Implementation Plan for Energy Structure Adjustment of Guangdong Province during the ‘13th five year plan’”, etc. [56,57,58,59]. Under this scenario, the structural transformation of various fields in the PRD has been gradually promoted.
(2)
Moderate Adjustment Scenario (MAS)
Moderate adjustment scenario indicates certain changes of economic development mode that structural transformation in various fields has certain promotion, the pace of adjustment has moderately accelerated. More specifically, industries such as cement, flat glass, ceramics and other building materials industries, petrochemical, paper making, textile and clothing, steel and other low-end industries are restricted in most cities [56]. At the same time, production capacity has significantly eliminated more than 50% by the end of 2035. The average annual growth rate of added value of emerging industries such as pharmaceutical manufacturing, general equipment manufacturing, special equipment manufacturing, automobile manufacturing, electrical machinery and equipment manufacturing, railway, shipping, aerospace and other transportation equipment manufacturing, computer, communication and other electronic equipment manufacturing has increased by 1.5% compared with BAU scenario. Transportation structure continues to shift to a low energy consumption and low emission transportation mode. The average annual growth rate of railway passenger and freight traffic is 0.8–1.2% higher than that of BAU scenario. The proportion of public transport in the city continues to increase. Through energy conservation and consumption reduction as well as promotion and application of clean energy, consumption of non-fossil fuels has continuously controlled in the energy sector. Energy consumption efficiency of paper-making, cement ceramics, flat glass and other industries has increased by about 4–11% compared with BAU scenario. The proportion of electric vehicles such as light trucks, intercity buses and private cars has increased by 10% compared with the baseline scenario. Some of the coal-fired power units located in urban areas will be decommissioned in advance.
(3)
Enhanced Adjustment Scenario (EAS)
Enhanced adjustment scenario represents the improvement of international competitiveness and enhancement of social sustainable development intention of the GBA. PRD changes the mode of economic development, production and consumption actively, while the structure of different sectors is significantly optimized. Specifically, under this scenario, a modern industrial structure with advanced manufacturing as main body will be built. Steel, paper, cement, flat glass, ceramics and other low-end industrial products are gradually saturated in domestic demand, and basically withdraw from the region (except for some enterprises with advanced technology and high level of energy conservation and environmental protection high-quality building materials). The average annual growth rate of added value of emerging industries continues to increase by 0.8%. For transportation structure, with acceleration of high-speed railway construction and change of residents’ travel habits, the average annual growth rate of railway passenger and freight traffic continues to increase by 0.7–1.4% compared with the moderate scenario. Furthermore, the proportion of taking public transportation has increased and reached an international advanced level. In the energy sector, advanced energy technology has been widely used. Energy consumption efficiency has further increased by 6–16% compared with the moderate scenario. Non-electric industry has basically realized “coal free”. The electrification level of transportation vehicles has further increased by 10–20%. Except for the ultra-supercritical units built after 2010, other coal-fired power units will be decommissioned.

2.2.2. Air Quality Simulation Model Settings

In this research, we use Community Multi-scale Air Quality model (CMAQ version 5.0.2) to simulate air quality levels under different scenarios. The simulation grid used triple embedding. Grid resolution from outside to inside is 27 km × 27 km, 9 km × 9 km and 3 km × 3 km. The innermost region includes the whole Guangdong Province and some neighboring cities and sea areas. CB-05 is used as the model gas phase chemical mechanism, while AERO6 is used as the aerosol chemistry [60]. The meteorological driving data used in the air quality model is simulated by the Weather Research Forecasting model (WRF version 3.9.0.1) [61]. The micro-physical protocol of WRF model uses the Morrison-2 moment [62]. The boundary layer scheme uses ACM2 [63]. Near ground scheme uses Pleim-Xiu [64]. The input data of the meteorological model WRF is 6-h global meteorological reanalysis data combining assimilation of sounding and ground station observation data in the corresponding period. In the three-layer nested CMAQ model, the outer and middle layers adopt the combined emission inventories, a resolution of 0.25° × 0.25° Chinese mainland anthropogenic emission inventory MEICv1.3 (multi-resolution emission inventory) [65] and a resolution of 0.1° × 0.1° global anthropogenic emission inventory [66]. The inner layer uses the 3 km × 3 km Guangdong Province anthropogenic emission inventory of the research group.
The emission inventory scenario data products of Dynamic Projection model for Emissions in China version 2.0 (DPECv2.0) [67] is collected for future emission estimation of area outside PRD in the simulation domain. Combined with the background of China’s carbon neutrality goal, the “Ambitious-pollution-Neutral-goals” scenario in DPEC data in 2035 is selected as the peripheral emission reduction scenario in the PRD region. The resolution of the gridding emission inventory is 0.25° × 0.25°.

3. Results and Discussion

3.1. Demand Forecast of “Industry-Transportation-Energy” Development of PRD

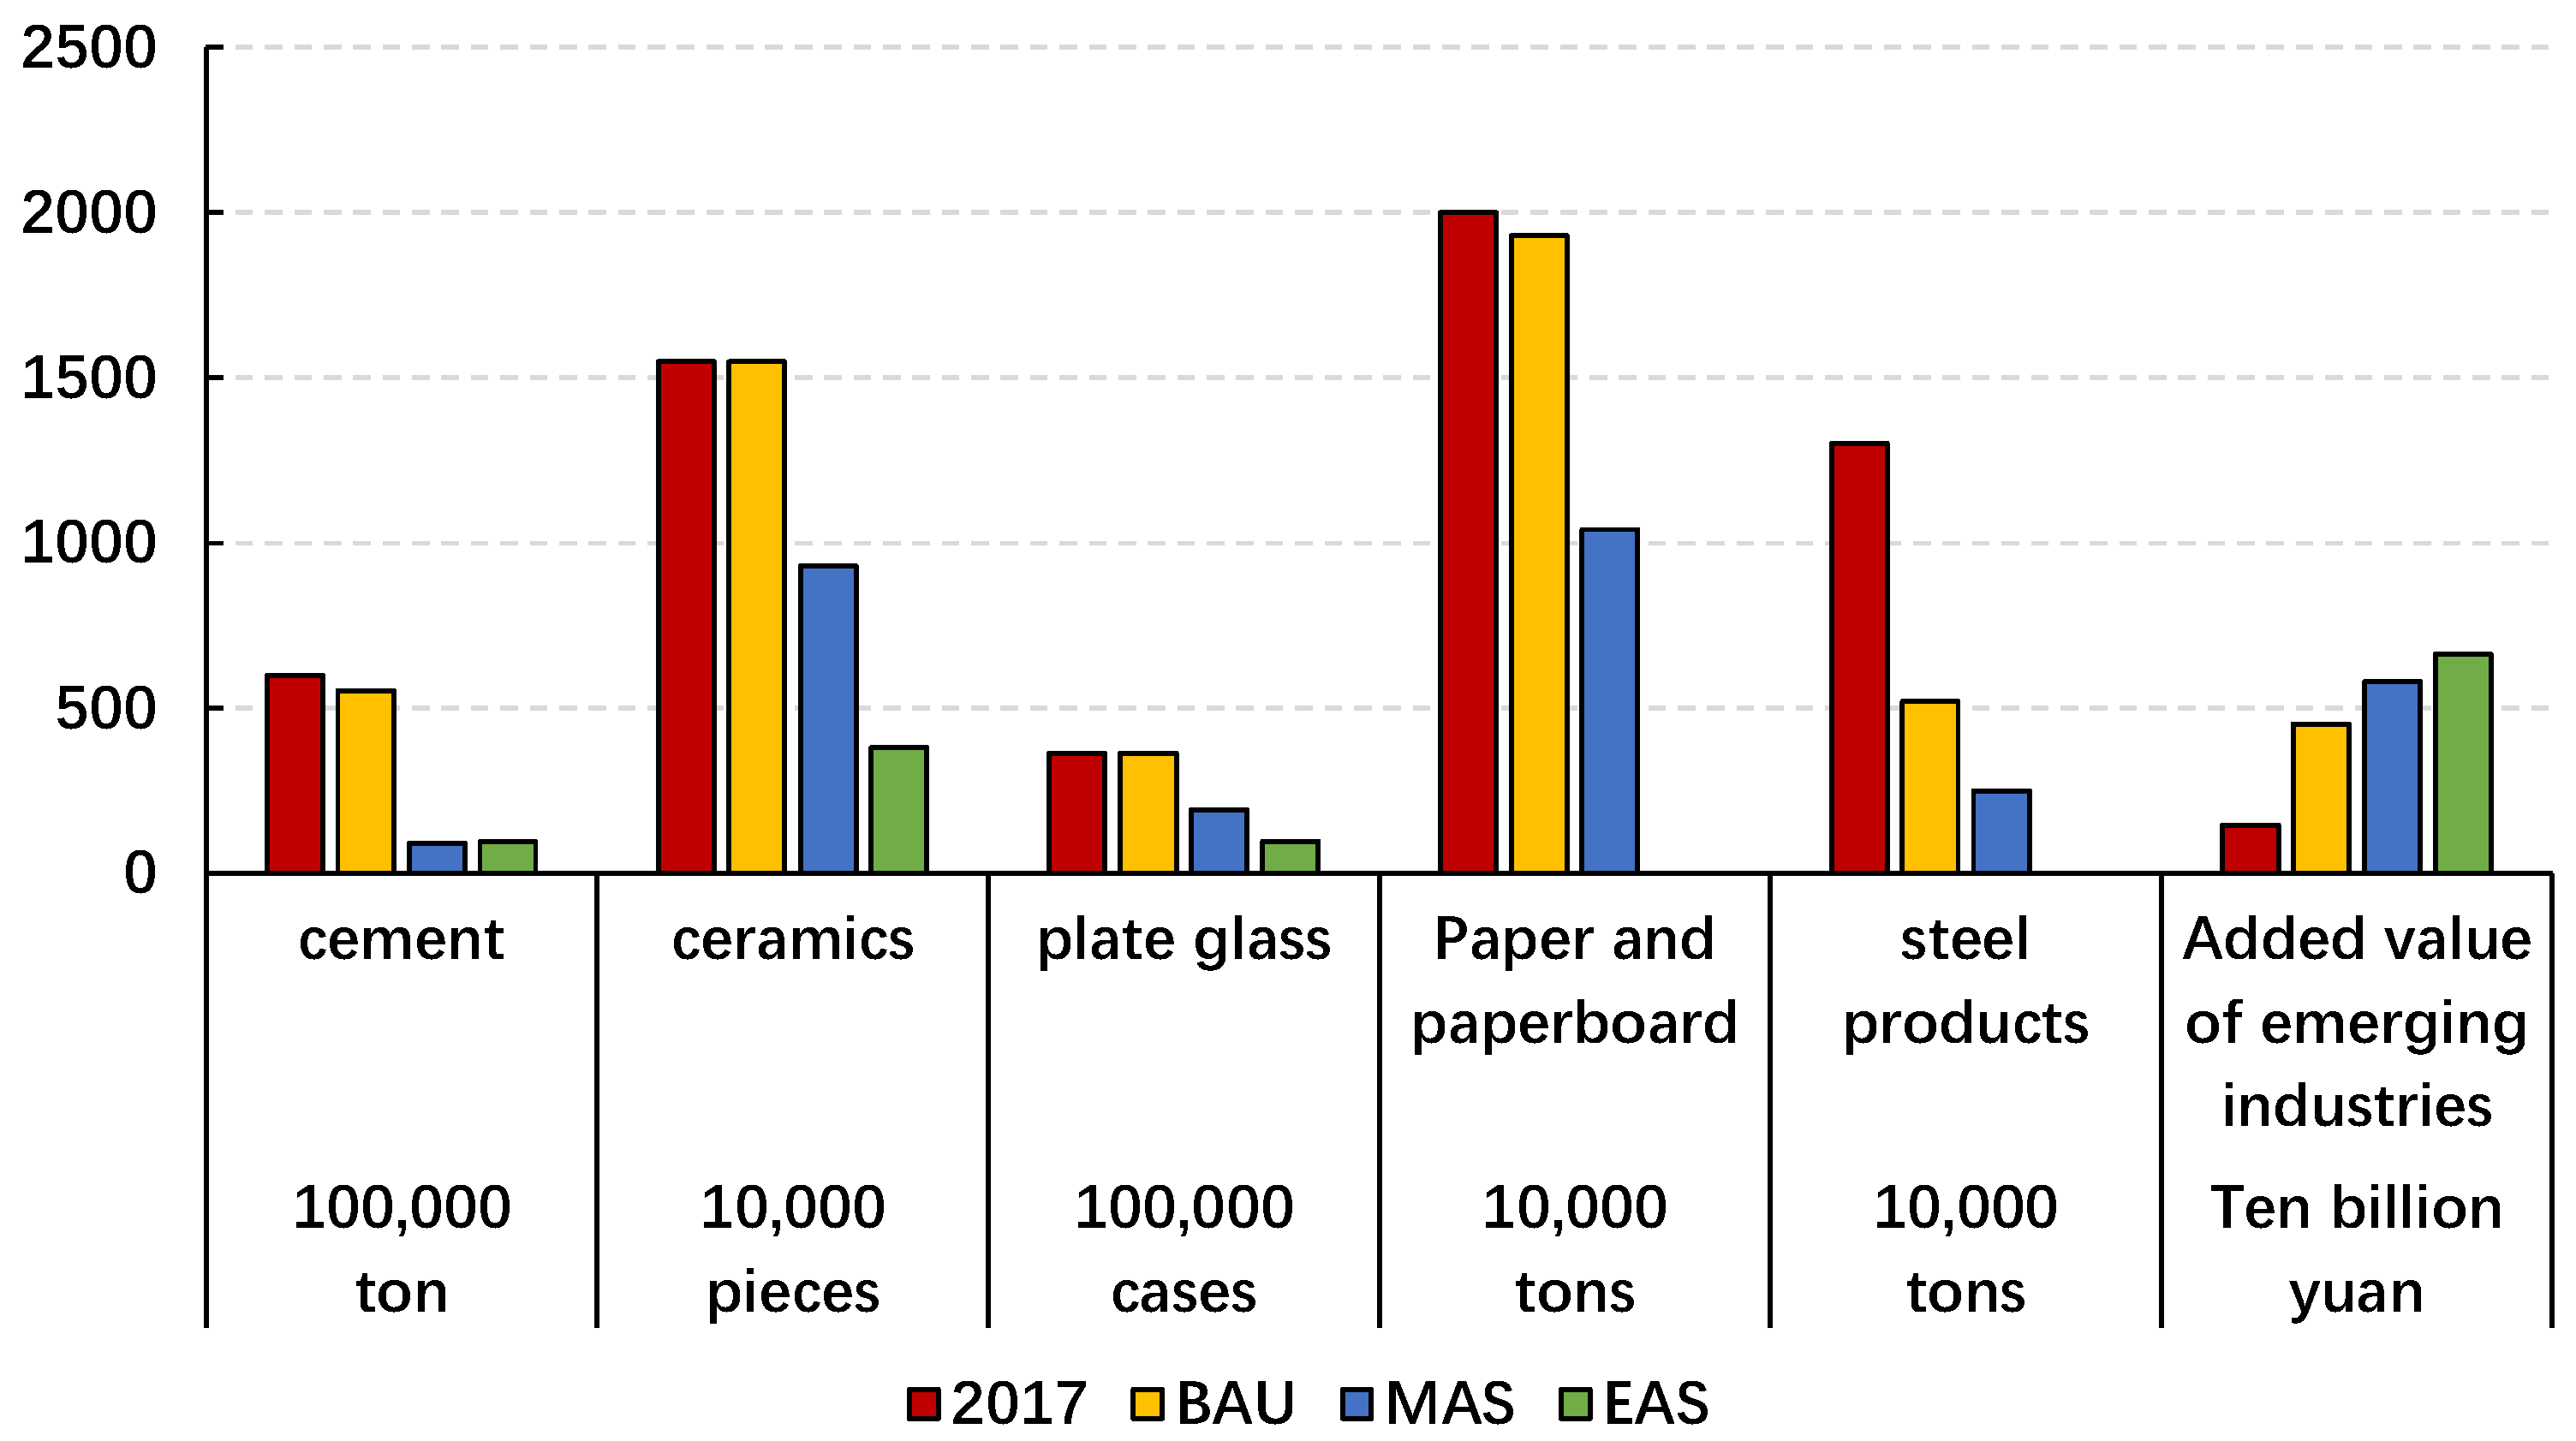
3.1.1. Demand of Industry Development

Under different scenarios, the changes of industrial added value of major emerging industries and production of major medium and low-end products in the PRD are shown in Figure 2. BAU shows that by 2035, the output of medium and low-end products such as cement, ceramics and flat glass will be the same as that of 2017. As elimination of excess steel production capacity continuous to promote [68], steel production has decreased significantly. The added value of emerging industries will increase to CNY 4500 billion, three times compared to 2017. Under MAS and EAS, as traditional industries have eliminated, to maintain the industrial development goal, the added value of emerging industries needs to further increase to about 5600 billion yuan and CNY 6600 billion. The proportion in industry will increase by 20–40% compared to 2017 and reach 81% and 97%, respectively.

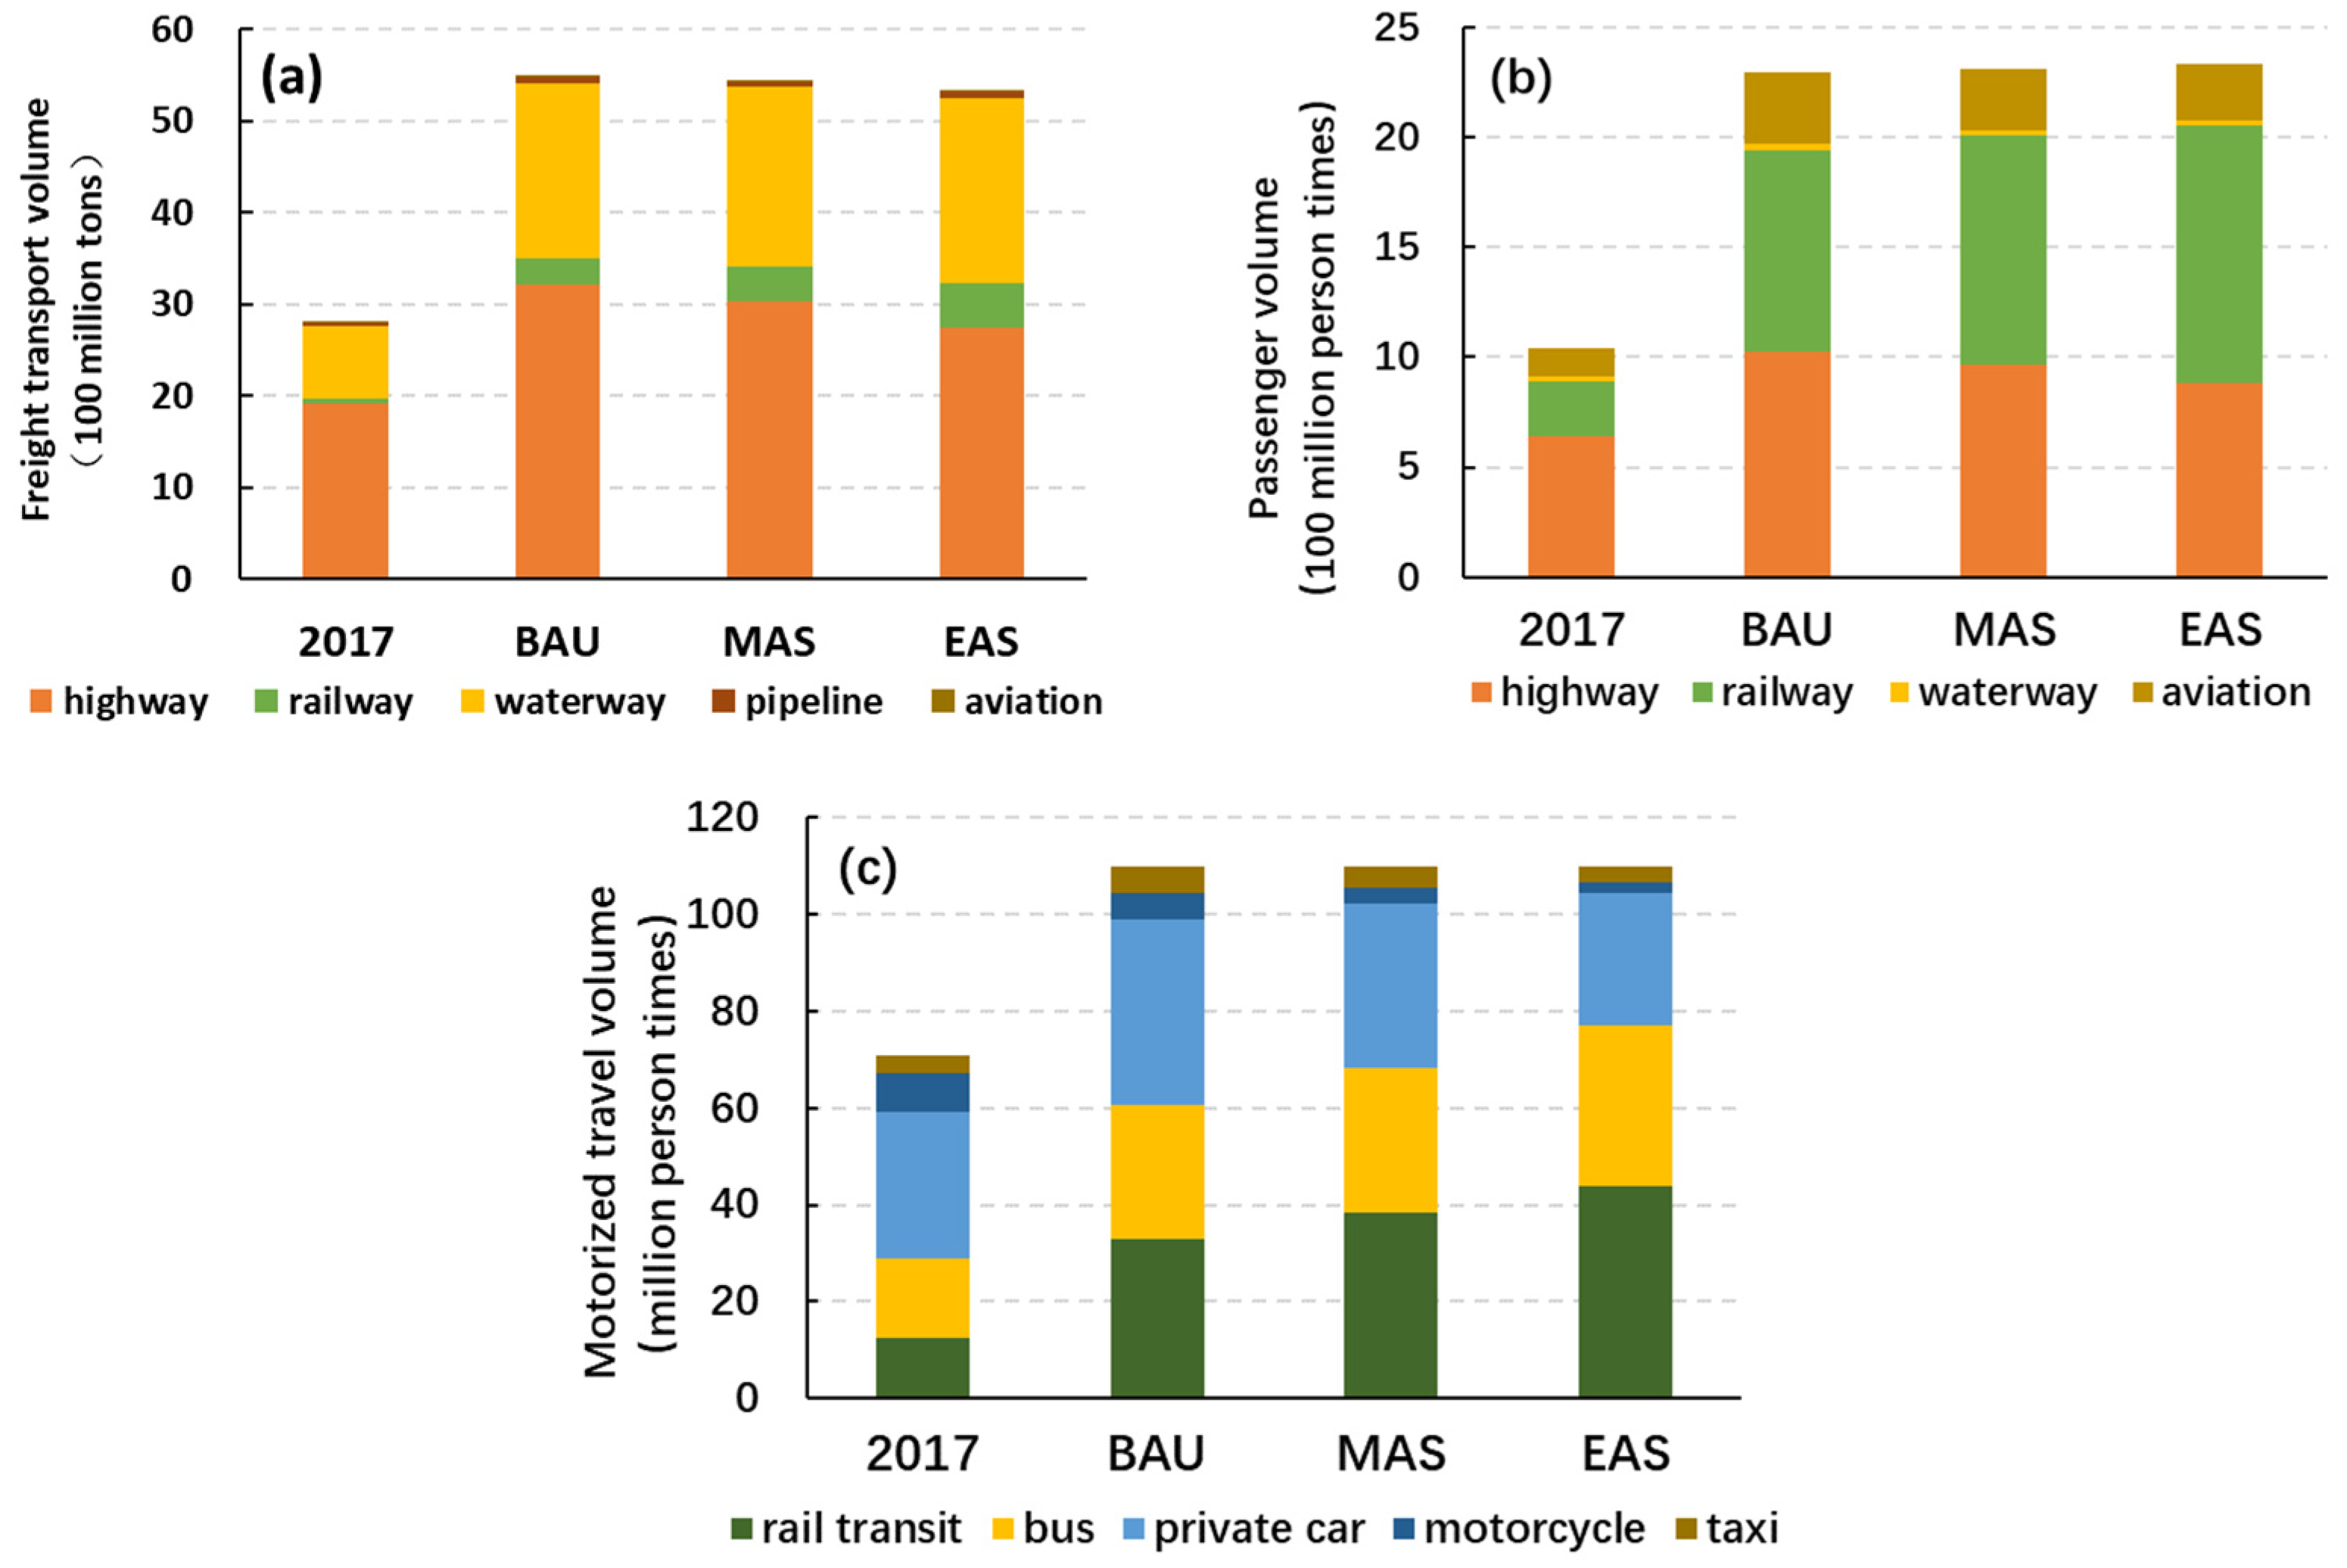
3.1.2. Demand of Transportation Development

Use the method in Section 2.1.2 to forecast demand of transportation under industrial development scenario described above. For freight demand, under BAU, it will be 96.8% higher than 2017, reaching about 5.49 billion tons while under MAS and EAS, with the decreasing demand of cement, steel and other bulk goods, it will drop to 5.44 billion tons and 5.32 billion tons, respectively. Demand of intercity passenger transport is about 2.29 billion under BAU, about 1.2 times higher than 2017. As tertiary industry continuous to develop, demand of intercity passenger transport increased slightly to 2.31 billion person times and 2.33 billion person times under MAS and EAS. Residents’ motorized travel demand will reach to 110 million people times by 2035, remaining the same under three scenarios. Freight demand is mainly met by railway, highway, waterway, aviation and pipeline routes. Demand of intercity passenger transport is mainly met by railway, highway, waterway and aviation. Motorized travel modes of urban residents mainly include bus, taxi, rail transit, private car and motorcycle.
Demand of transportation and travel modes under three scenarios is shown in Figure 3. The demand of road, railway and waterway transportation reveals huge difference in each scenario of freight demand. Under MAS and EAS, as regional multi-modal transport system becomes well-established, rapid railway network and the greater bay area international shipping center are gradually formed, demand of road freight has gradually shifted to the demand of railway and waterway freight. Demand of road freight has reduced to 3.02 billion tons and 2.75 billion tons, respectively, decreased by 6.2% and 14.6% compared with BAU. Railway passenger demand has increased by 28.9% and 77.8% compared with BAU. As a large difference between highway and railway of transportation, with the acceleration of high-speed railway construction, demand for long-distance road passenger transportation has been replaced by railway. Under MAS, road passenger transportation has decreased by 5.8% compared with BAU. At the same time, railway freight demand has increased by 13%. Under EAS, demand of railway passenger transportation continues to increase by 12.5%, reaching 1.17 billion passengers, becoming the main mode of transportation. In different scenarios, the difference in motorized travel demand of urban residents is mainly reflected in public transport travel. As public transportation becomes well-established, travel demand of public transport will increase from 66 million people times under BAU to 72.6 million person times and 80.3 million people times under MAS and EAS.

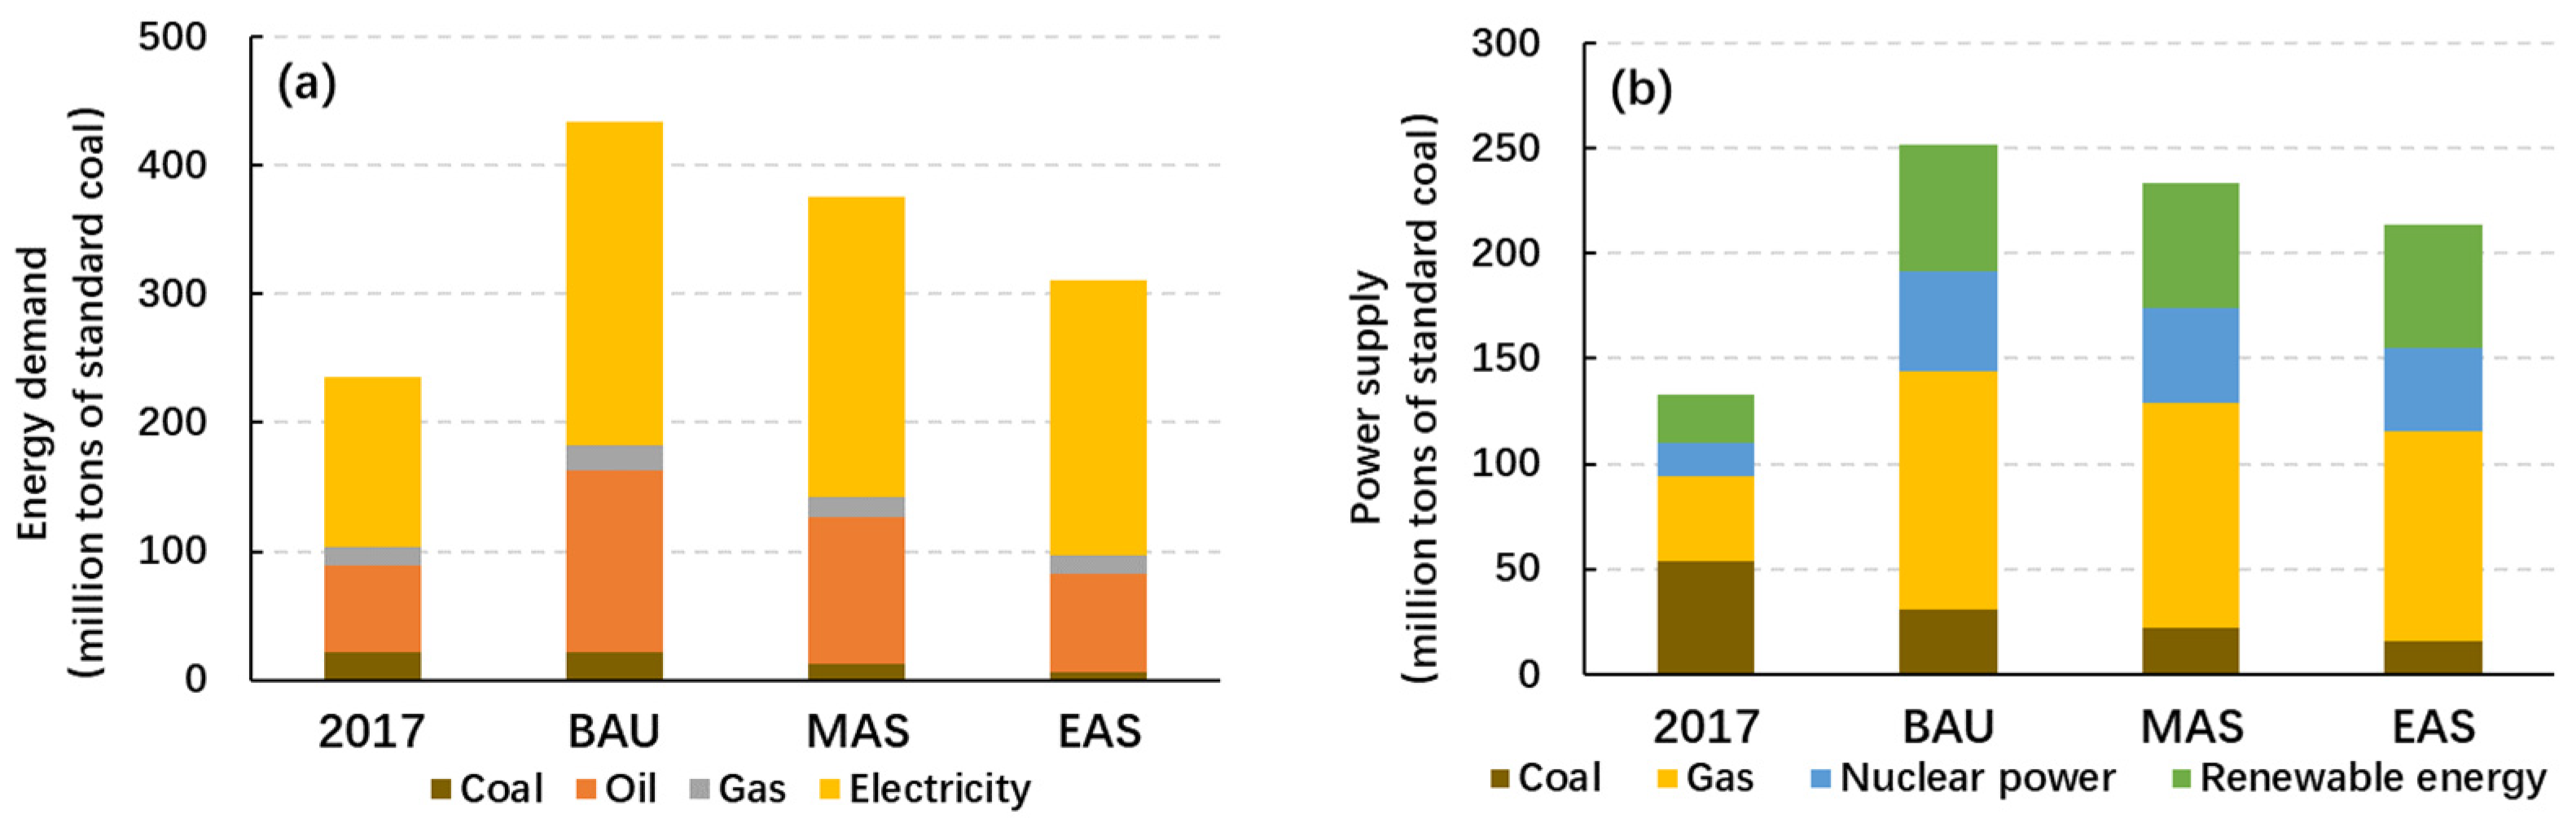
3.1.3. Demand of Energy Development

Based on the method discussed above in Section 2.1.2 to predict energy consumption demand under different scenarios. Results show that under BAU, by 2035, the energy consumption of PRD is expected to reach 430 million tons of standard coal, increased by 83.9% over 2017. Electric power will become the main end-consumption energy species. That consumption will reach 250 million tons of standard coal. At the same time, coal consumption will be strictly limited under “carbon peeking” and “carbon neutralization”. Coal consumption of PRD will decrease by 16.1% compared with that in 2017. To fulfill electric consumption demand, installed power capacity of PRD will reach 103 million kWh, power supply structure will remain basically stable, coal-fired power units will be decommissioned on schedule while new power supply demand will be mainly replaced by gas and electricity. The proportion of coal-fired power installed capacity will decrease from 40.4% to 12.3%. The proportion of gas-fired power installed capacity will increase from 30.1% to 44.8%.
Under MAS and EAS, with the increase of energy consumption, demand of energy consumption is lower than that of BAU, especially coal consumption is decreasing up to 40.1% and 70% while demand of electric consumption declines to 230 million tons and 210 million tons of standard coal. In order to meet the demand of power consumption under MAS, the installed power capacity will reach 114 million kWh in 2035. The proportion of coal-fired power units will decline to 9.6% as early retirement of some coal-fired power units in urban areas, and power supply structure is further optimized. To fulfill the demand of electric consumption, installed power capacity will reach to 119 million kWh. For power supply structure, the proportion of coal-fired power remains at 7.5%. New power supply demand will be replaced by clean energy such as nuclear power, photovoltaic power and wind power. The installed capacity of nuclear energy will rise to 22 million kilowatts, accounting for 18.7%. Installed capacity of renewable power such as offshore wind power and photovoltaic power accounts for 27.4%. Figure 4 shows demand of energy development and electric supply of the base year and three different scenarios with different adjustment intensity.

3.2. Changes of Pollutant Emissions and Air Quality Levels under Different Scenarios

3.2.1. Pollutant Emission Forecast under Linkage Development Scenarios

In 2017, emissions of SO2, NOx, primary PM2.5 and VOCs in PRD are 258 thousand tons, 838 thousand tons, 188 thousand tons and 707 thousand tons, respectively [69]. Under BAU, as the promotion of the established structural adjustment and pollutant control policies, those pollutant emissions have decreased to 152 thousand tons, 511 thousand tons, 88 thousand tons and 382 thousand tons, respectively, decreasing up to 39~53% compared with 2017. Under MAS and EAS, development patterns of industry, transportation and energy are becoming greener, lower-carbon and higher-efficiency than pollutant emissions have further declined. Emissions of SO2, NOx, primary PM2.5 and VOCs emissions have decreased to 114 thousand tons, 436 thousand tons, 73 thousand tons and 325 thousand tons under MAS while 77 thousand tons, 310 thousand tons, 53 thousand tons and 269 thousand tons under EAS. Compared to BAU, pollutant emissions have declined by 14.8~25.4% and 29.6~49.2% under MAS and EAS. In this case, reduction of SO2 emission mainly comes from transformation of energy consumption and supply mode, reduction of NOx emission mainly comes from the transformation of transportation development pattern while transformation of industrial development mostly contributes to the emission reduction of PM2.5 and VOCs. Figure 5 and Figure 6 show emission and reduction benefits of four major pollutants under the three linkage development scenarios.

3.2.2. Simulation Analysis of Air Quality Level of the “Industry-Transportation-Energy” Developing Scenario of PRD

Simulation results of air quality level are shown in Figure 7. Under BAU, the annual concentration level of PM2.5 of cities in PRD will be 13.1 µg/m3~18.2 µg/m3 that concentration level of the region will decline to 16.2 µg/m3. Under MAS, as the acceleration of development pattern, regional concentration level of PM2.5 will decrease to 14.8 µg/m3, improved by 8.9% compared to BAU. Under EAS, with enhanced transformation of development pattern, concentration level will further decline to 14.1 µg/m3, improved by 12.9% compared to BAU. In this case, stronger structural adjustment and development pattern can bring more significant air quality improvement effects.

4. Conclusions

This study screens out the factors that can represent the linkage relationship in the developing process of industry, transportation and energy as the parameters to scenario analysis. Taking 2017 as base year and 2035 as target year, aiming toward the same economic target, we explore future development pathway of PRD by reasonably forecasting the demand of industry, transportation and energy consumption in different developing patterns, constructing three “industry-transport-energy” development scenarios and quantifying their effects on air quality. Below are the main conclusions and recommendations:
(1)
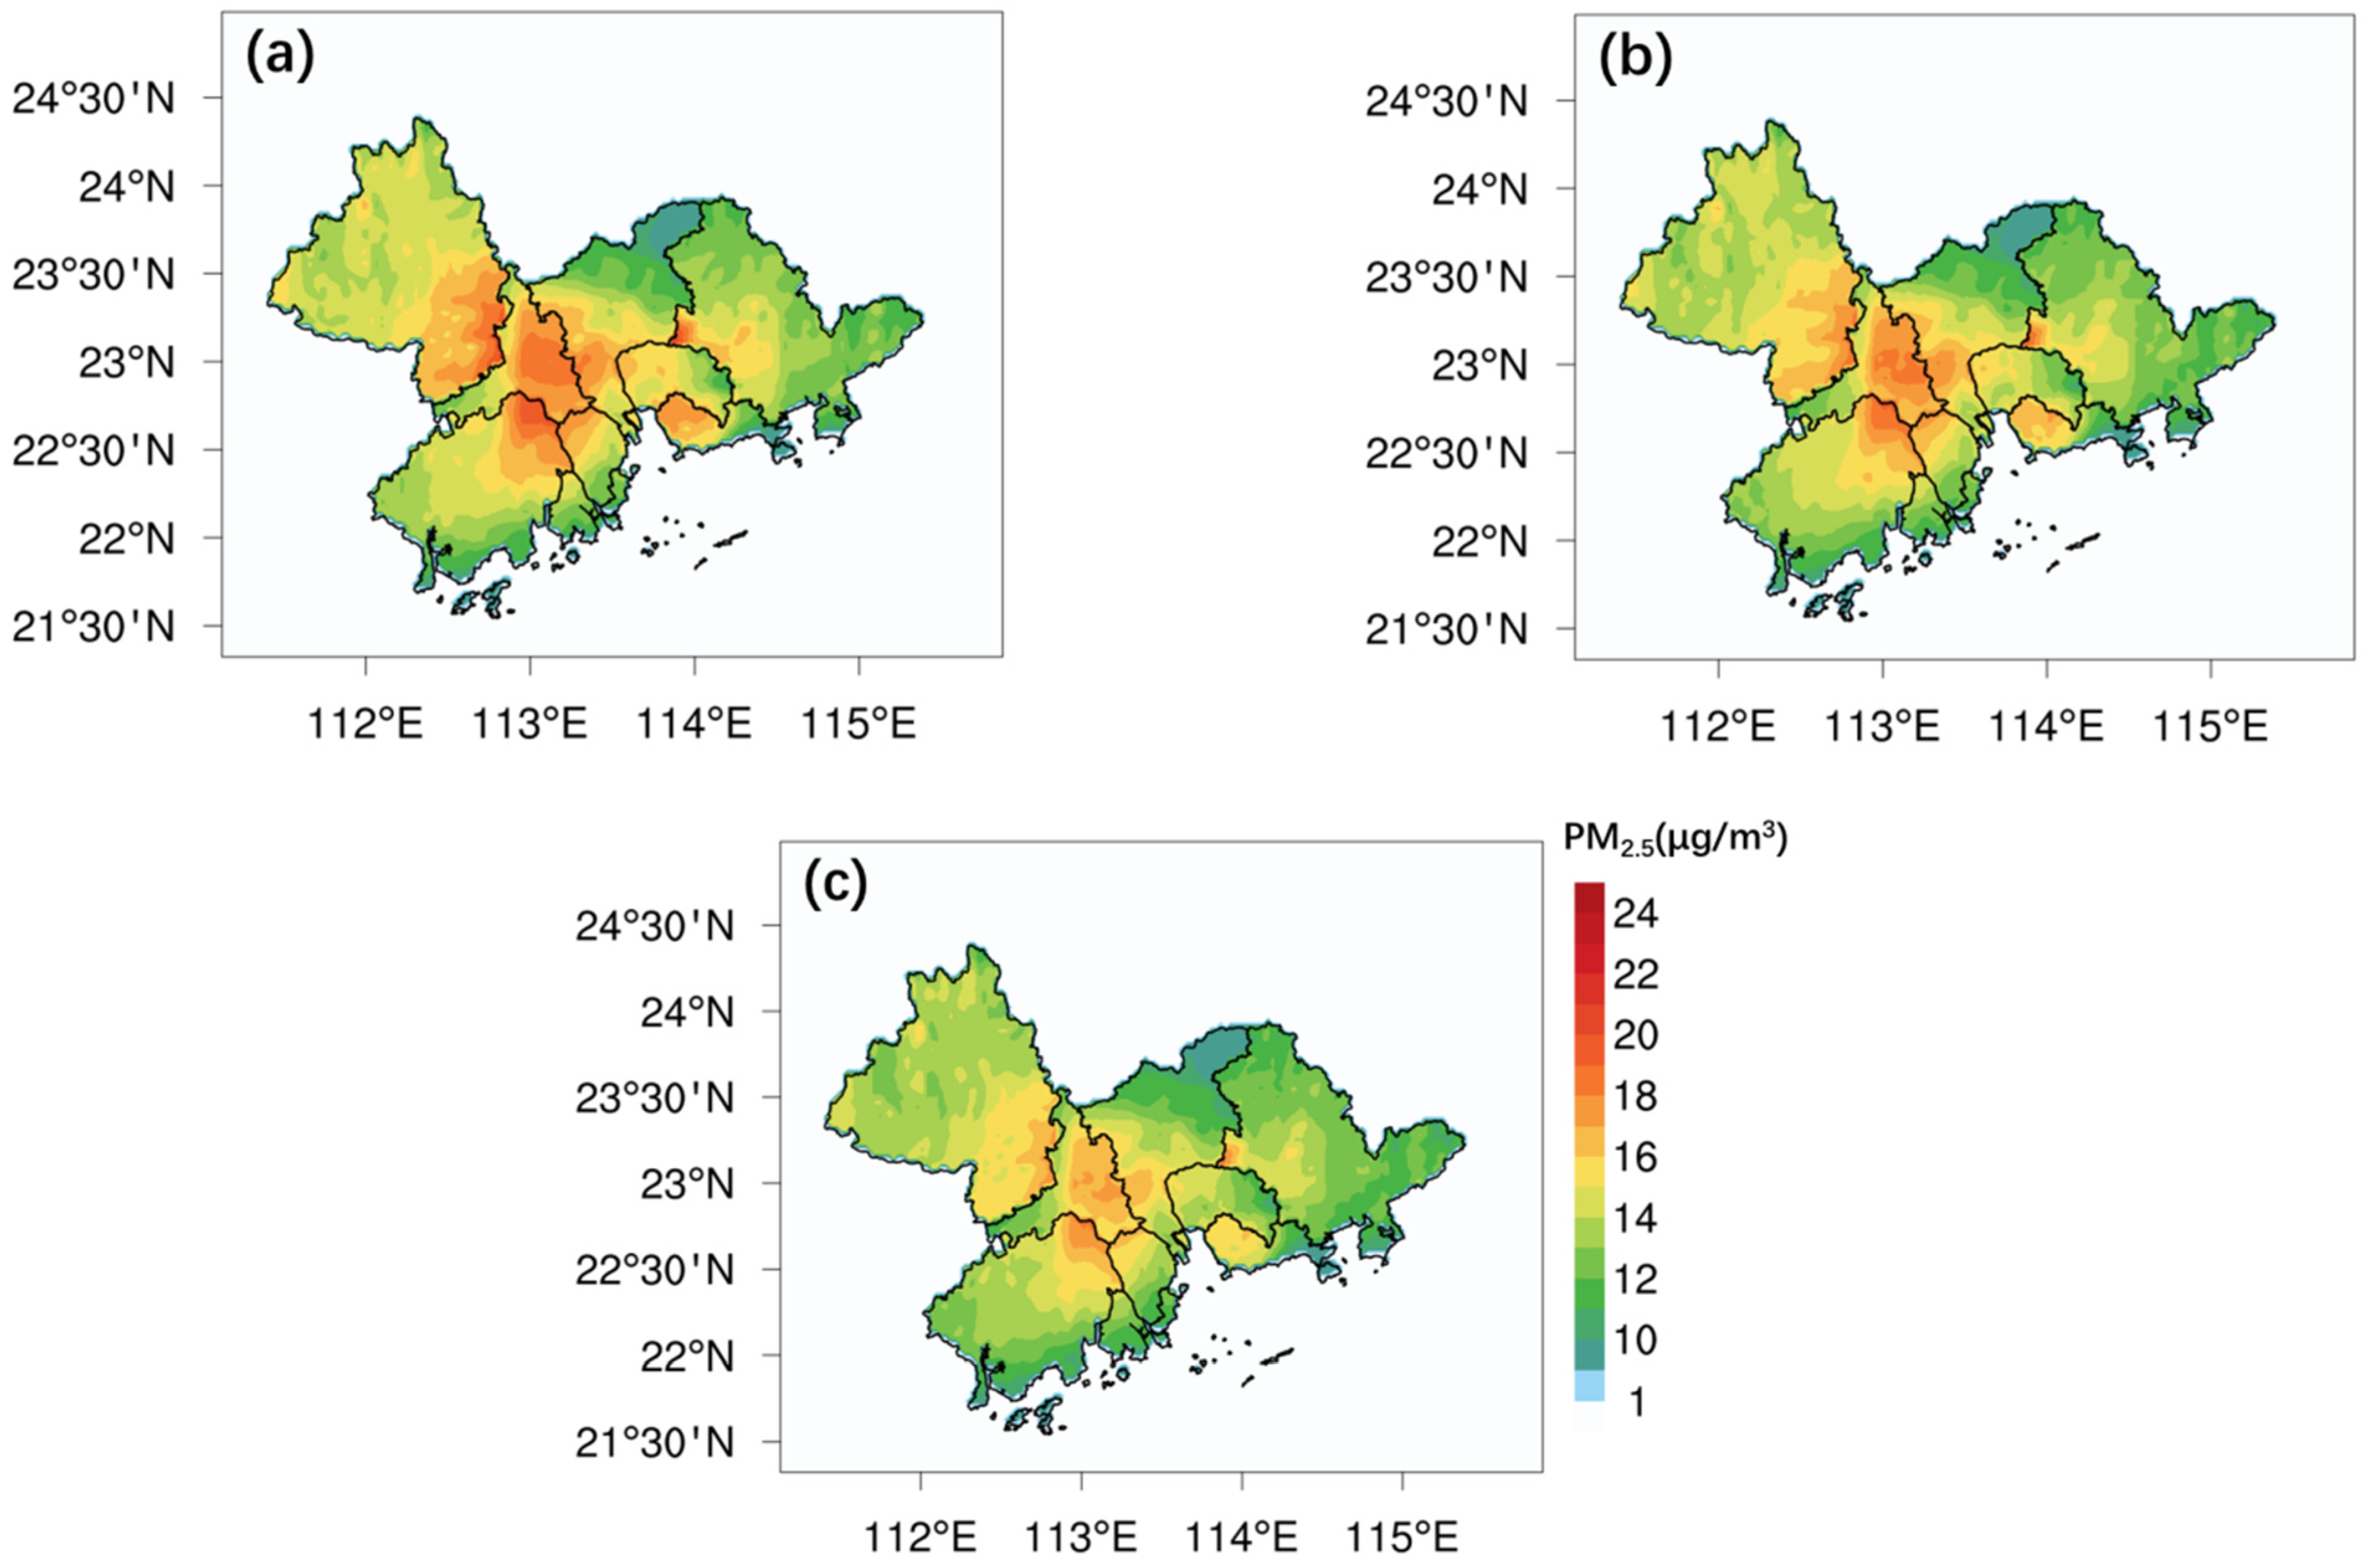
Following historical track and established policy pathways before 2035, the industrial structure remains stable when GDP reaches about CNY 23.5 trillion. In the meantime, freight volume and energy consumption will increase steadily to 5.49 billion tons and 430 million tons of standard coal. Under BAU scenario, the PM2.5 concentration is expected to decline to 16.2 µg/m3.
(2)
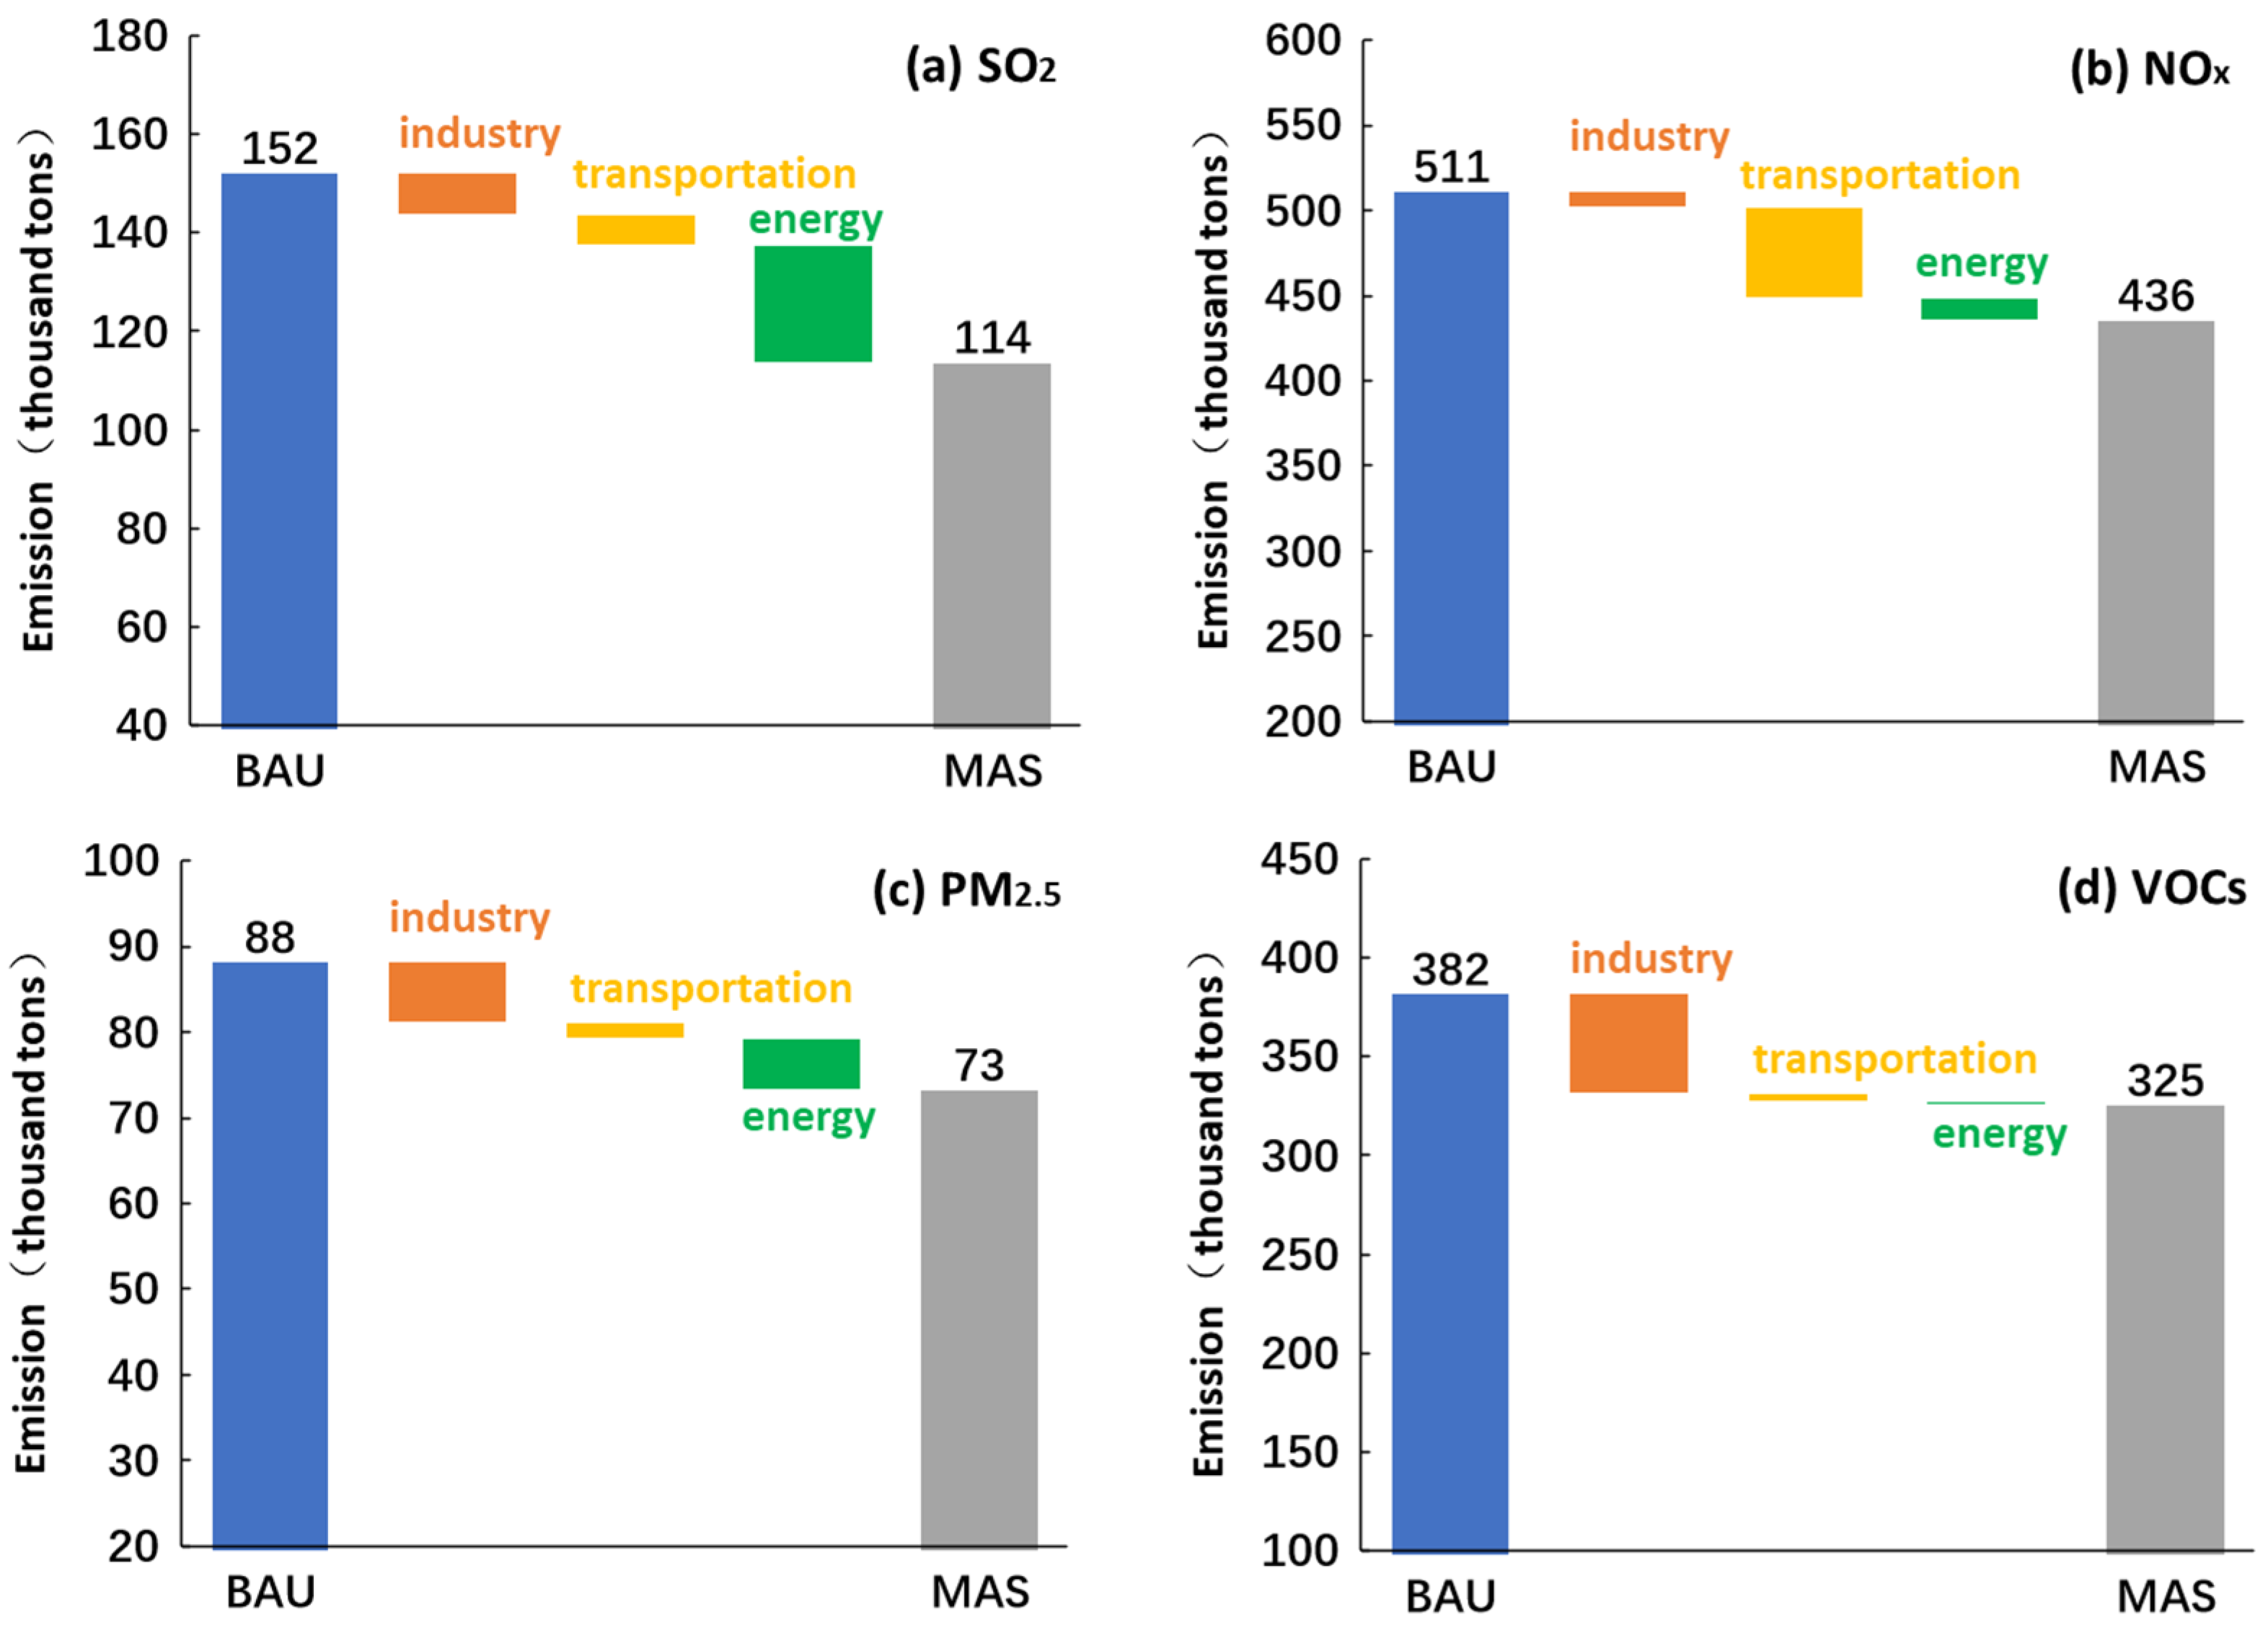
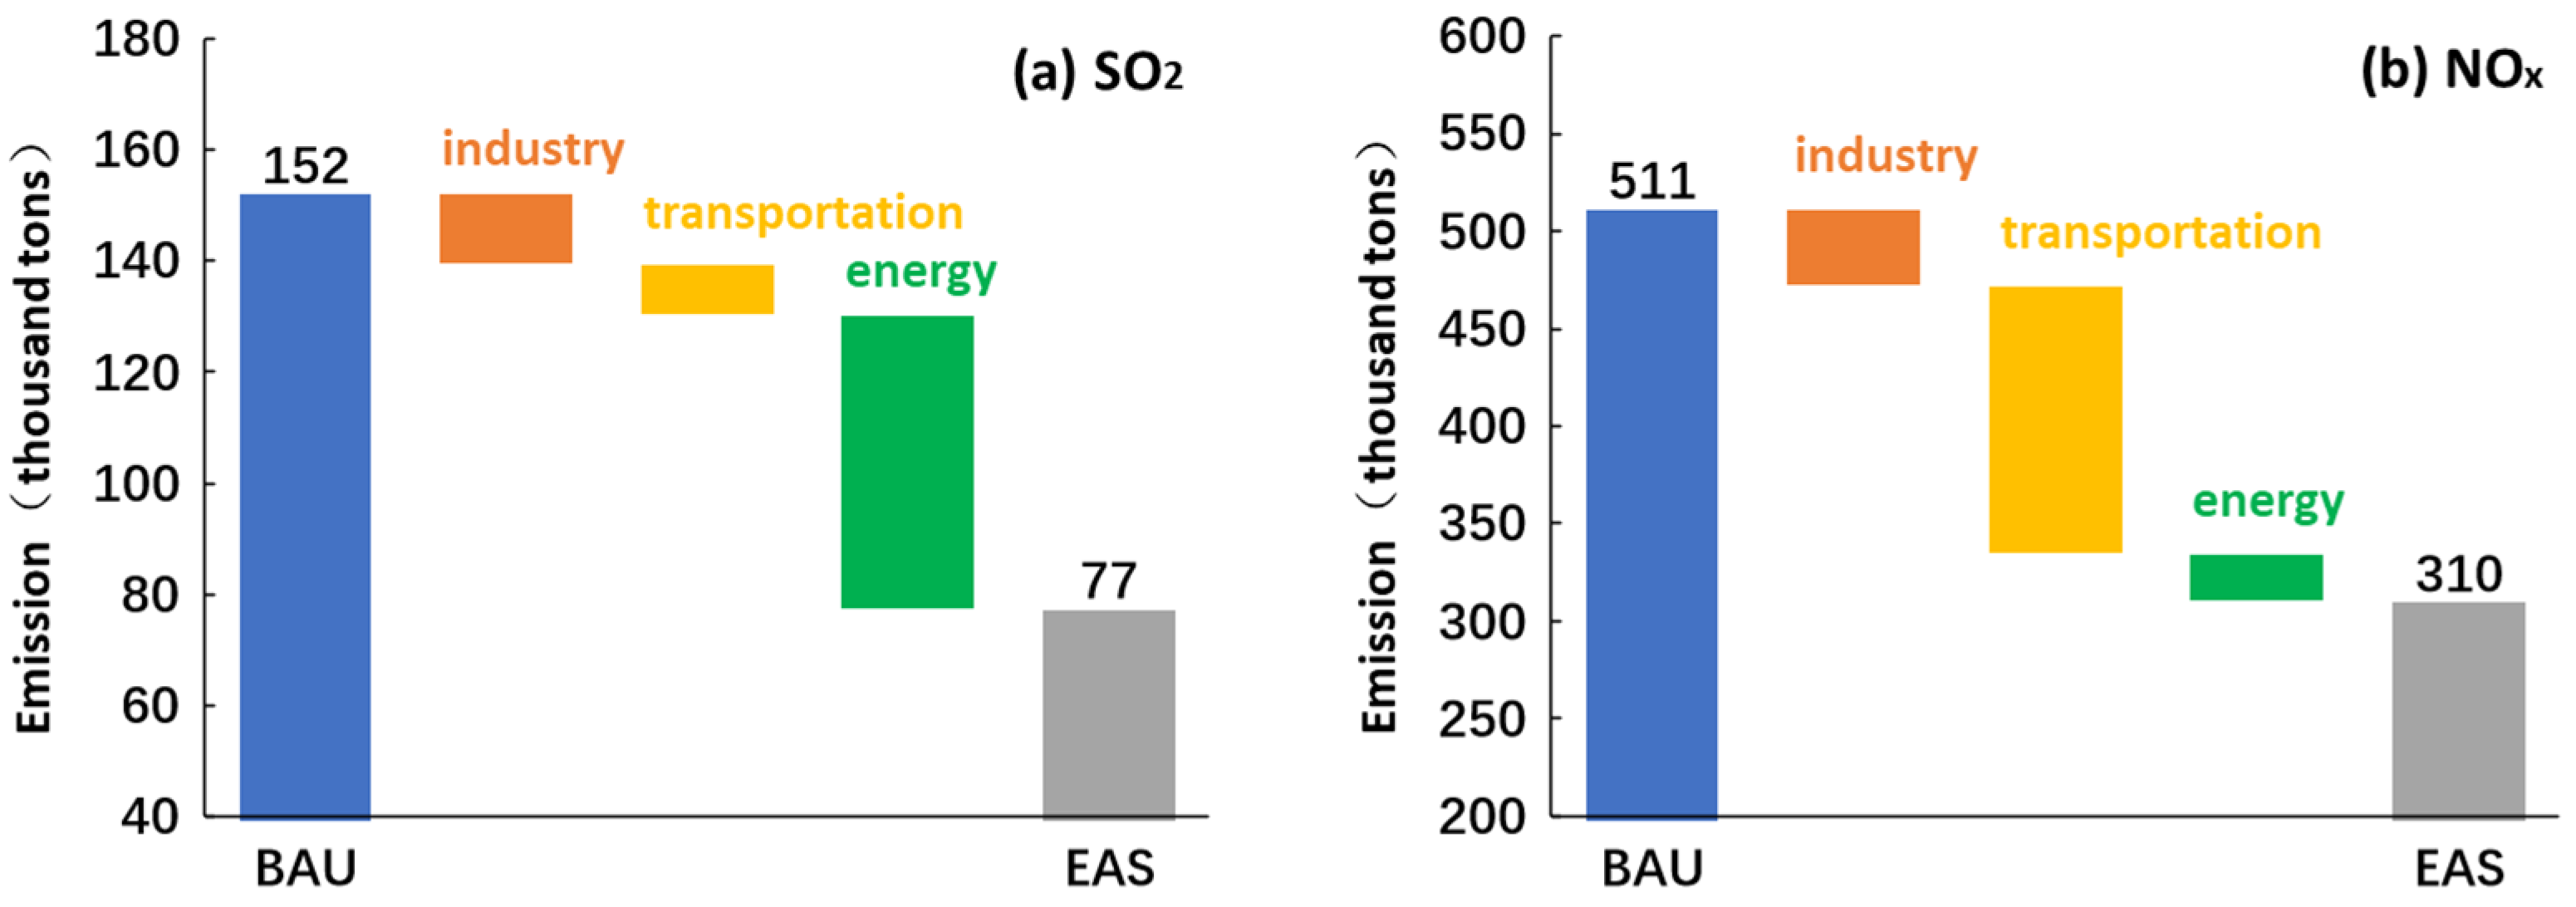
Taking consideration of relationship of mutual restraint and influence in the process of industrial, transportation and energy development, we find that freight volume will drop to 5.44 billion tons with the decreasing demand of cement, steel and other bulk goods under MAS and EAS scenario. Energy consumption has also decreased, especially coal consumption, which will decrease by 40~70% compared with BAU scenario. Reduced demand for transportation and energy due to changes in industrial structure will lead to decrease of air pollutant emissions, which is not considered in previous studies.
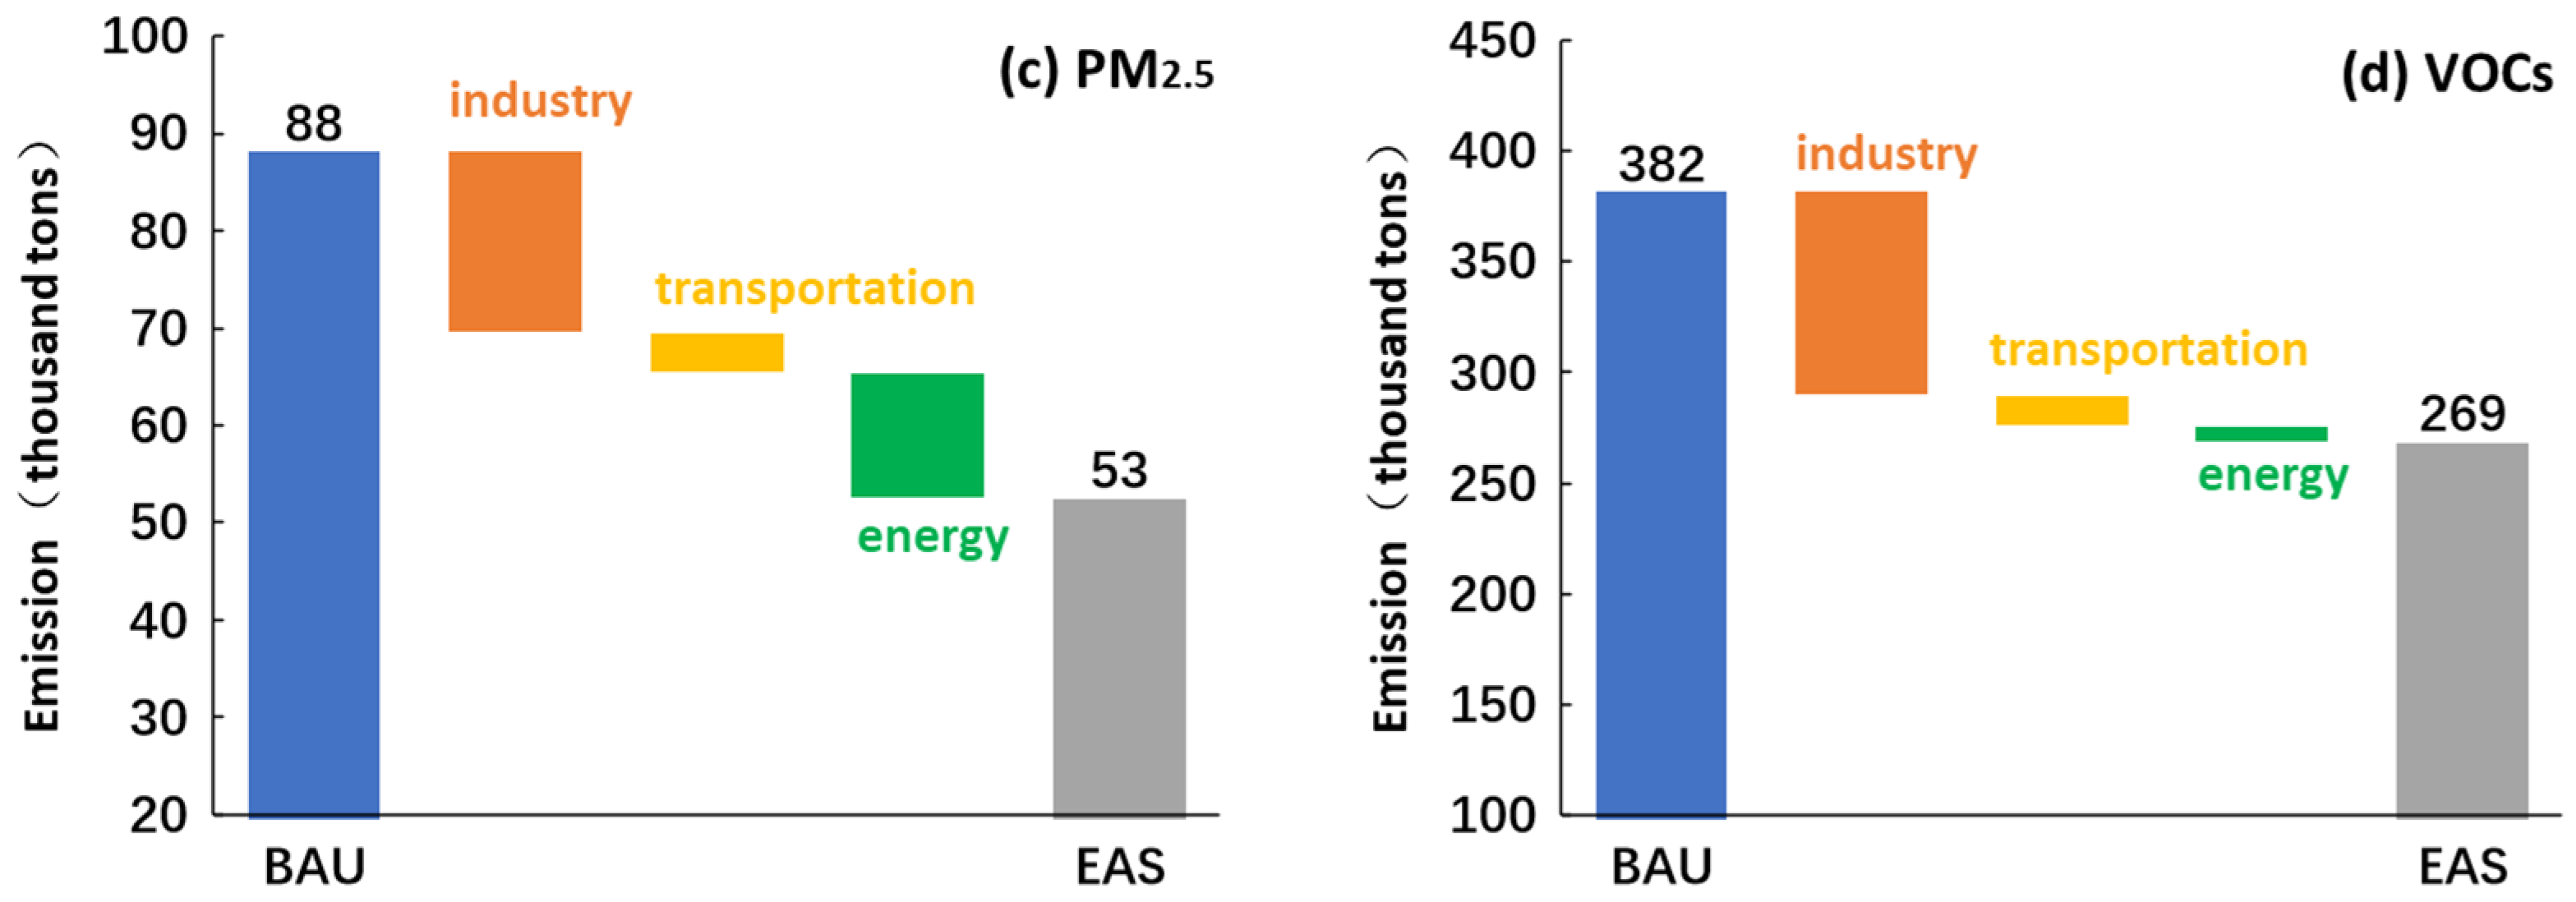
(3)
Compared to BAU, the reduction of SO2 and NOx is mainly driven by energy and transportation sector respectively, while industry sector will contribute 47~52% and 81~89% to PM2.5 and VOCs reduction respectively under MAS and EAS scenario. Contribution of different sectors to air pollutant reduction projected in this research are relatively comparable with Shi et al. [41].
(4)
The comparison of the BAU and other scenarios reveals that transformation of the economic development pattern is an important step toward better air quality. Under the Enhance Adjustment Scenario (EAS), industrial development mainly depends on strategic emerging industries such as new materials and high-end equipment manufacturing; proportion of freight by rail and public transport travel increase by five to seven percentage points, respectively; and proportion of coal power decrease by five percentage points compared with BAU scenario. Then, the average annual concentration level of PM2.5 can decline to 14.1 µg/m3 in 2035. The results are similar with the study of Chang et al. [69], but lower than the study of Ren et al. [70], in which the annual average PM2.5 concentration in Guangdong Province reduced to WHO level II with mainly considering pollution control strategy. The result in our study is also lower than Shi et al. [41], in which the annual average PM2.5 concentration in PRD decreased to 15 µg/m3 under Chinese Academy of Environmental Planning Carbon Pathway (CAEP-CP) scenario (mainly focuses on adjustment of energy structure). This might be due to the consideration the linkage of industrial, transportation and energy development in our study mentioned in point (2).
(5)
It can be seen that further structural adjustment can continue to drive air quality improvement. However, affected by economic strength, national policies and other constraints, the strength of adjustment of a region is limited. Which scenario developed in this study is more suitable for the PRD depends on two factors: the determination of policymakers to promote air quality, and strength of regional cooperation in emission reduction which can reduce transformation pressures within the area [69].

Author Contributions

Conceptualization, Y.Z. (Yijia Zheng) and W.Z.; methodology, Y.Z. (Yijia Zheng) and W.Z.; software, S.C. and L.W.; validation, S.C.; formal analysis, Y.Z. (Yijia Zheng), S.C., L.W. and Y.L.; investigation, Y.Z. (Yijia Zheng), L.W., Y.L., Q.Z. and X.X.; data curation, Y.Z. (Yijia Zheng), L.W. and Y.L.; writing, Y.Z. (Yijia Zheng), W.Z., S.C., L.W., Y.L. and X.X.; visualization, X.X.; supervision, C.L. and Y.Z. (Yongbo Zhang); project administration, C.L.; funding acquisition, Y.Z. (Yongbo Zhang). All authors have read and agreed to the published version of the manuscript.

Funding

This research is funded by the National Key Research and Development Program of China (No. 2018YFC0213906); Strategy Studies of Air Quality in the Pearl River Delta Region Reaching WHO-III Level in Medium and Long Term (G-1809-28516); Special Fund Project for Science and Technology Innovation Strategy of Guangdong Province (No. 2019B121205004).

Institutional Review Board Statement

Not applicable.

Informed Consent Statement

Not applicable.

Data Availability Statement

The data in this study are available on request from the authors.

Conflicts of Interest

The authors declare no conflict of interest.

Abbreviations

GBAGuangdong-Hong Kong-Macao Great Bay Area
PRDPearl River Delta
PM2.5Fine particulate matter
GDPGross domestic product
SO2Sulphur dioxide
NOxNitrous oxides
VOCsVolatile organic compounds
NO2Nitrogen dioxide
PM10Inhalable particulate matter
WHOWorld Health Organization
LDMIlogarithmic average Dirichlet index decomposition method
BAUBusiness as usual
MASModerate adjustment scenario
EASEnhanced adjustment scenario
CMAQCommunity Multi-scale Air Quality model
WRFWeather Research Forecasting model
MEICMulti-resolution Emission Inventory for China
DECPDynamic Projection model for Emissions in China
kWhkilo Watt-hour

References

  1. Mahalik, M.; Mallick, H.; Padhan, H. Do educational levels influence the environmental quality? The role of renewable and non-renewable energy demand in selected BRICS countries with a new policy perspective. Renew. Energy 2021, 164, 419–432. [Google Scholar] [CrossRef]
  2. Mohsin, M.; Rasheed, A.; Sun, H.; Zhang, J.; Iram, R.; Iqbal, N.; Abbas, Q. Developing low carbon economies: An aggregated composite index based on carbon emissions. Sustain. Energy Technol. Assess. 2019, 35, 365–374. [Google Scholar] [CrossRef]
  3. Zeng, Y.; Cao, Y.; Qiao, X.; Seyler, B.; Tang, Y. Air pollution reduction in China: Recent success but great challenge for the future. Sci. Total Environ. 2019, 663, 329–337. [Google Scholar] [CrossRef] [PubMed]
  4. Chen, N.; Xu, L. Relationship between air quality and economic development in the provincial capital cities of China. Environ. Sci. Pollut. Res. 2017, 24, 2928–2935. [Google Scholar] [CrossRef] [PubMed]
  5. Grossman, G.; Krueger, A. Environmental impacts of a North American free trade agreement. Am. Econ. Rev. 1991, 11, 3914. [Google Scholar]
  6. Mohsin, M.; Kamran, H.; Nawaz, M.; Hussaind, M.; Dahri, A. Assessing the impact of transition from nonrenewable to renewable energy consumption on economic growth-environmental nexus from developing Asian economies. J. Environ. Manag. 2021, 284, 111999. [Google Scholar] [CrossRef] [PubMed]
  7. Guangdong Bureau of Statistics. Guangdong Statistical Yearbook of 2021; China Statistics Press: Beijing, China, 2022. (In Chinese) [Google Scholar]
  8. Xu, X.; Huang, G.; Liu, L.; Guan, Y.; Zhai, M.; Li, Y. Revealing dynamic impacts of socioeconomic factors on air pollution changes in Guangdong Province, China. Sci. Total Environ. 2020, 699, 134178. [Google Scholar] [CrossRef]
  9. Zhong, L.; Louie, P.; Zheng, J.; Yuan, Z.; Yue, D.; Ho, J.; Lau, A. Science–policy interplay: Air quality management in the Pearl River Delta region and Hong Kong. Atmos. Environ. 2013, 76, 3–10. [Google Scholar] [CrossRef]
  10. Lin, C.; Li, Y.; Lau, A.; Li, C.; Fung, J. 15-year PM2.5 trends in the Pearl River Delta region and Hong Kong from satellite observation. Aerosol Air Qual. Res. 2018, 18, 2355–2362. [Google Scholar] [CrossRef]
  11. Wang, N.; Lyu, X.; Deng, X.; Guo, H.; Deng, T.; Li, Y.; Yin, C.; Li, F.; Wang, S. Assessment of regional air quality resulted from emission control in the Pearl River Delta region, southern China. Sci. Total Environ. 2016, 573, 1554–1565. [Google Scholar] [CrossRef]
  12. Zhang, Z. Challenges for Improving Air quality in Guangdong-Hong Kong-Macao greater bay area and lessons from foreign bay areas. Environ. Prot. 2019, 47, 61–63. (In Chinese) [Google Scholar]
  13. State Council. Outline Development Plan for the Guangdong-Hong Kong-Macao Greater Bay Area. Available online: http://www.gov.cn/gongbao/content/2019/content_5370836.htm (accessed on 9 September 2022). (In Chinese)
  14. Rao, S.; Klimont, Z.; Smith, S.; Dingenen, R.; Dentener, F.; Bouwman, L.; Riahi, K.; Amann, M.; Bodirsky, B.; Van Vuuren, D. Future air pollution in the Shared Socio-economic Pathways. Glob. Environ. Chang. 2017, 42, 346–358. [Google Scholar] [CrossRef]
  15. Aleluia Reis, L.; Drouet, L.; Van Dingenen, R.; Emmerling, J. Future global air quality indices under different socioeconomic and climate assumptions. Sustainability 2018, 10, 3645. [Google Scholar] [CrossRef] [Green Version]
  16. Sanyal, S.; Wuebbles, D. The potential impact of a clean energy society on air quality. Earth’s Future 2022, 10, e2021EF002558. [Google Scholar] [CrossRef]
  17. Shim, S.; Sung, H.; Kwon, S.; Kim, J.; Lee, J.; Sun, M.; Song, J.; Ha, J.; Byun, Y.; Kim, Y.; et al. Regional features of long-term exposure to PM2.5 air quality over Asia under SSP Scenarios based on CMIP6 Models. Int. J. Environ. Res. Public Health 2021, 18, 6817. [Google Scholar] [CrossRef]
  18. Rafaj, P.; Kiesewetter, G.; Krey, V.; Schoepp, W.; Bertram, C.; Drouet, L.; Fricko, O.; Fujimori, S.; Harmsen, M.; Hilaire, J. Air quality and health implications of 1.5 °C–2 °C climate pathways under considerations of ageing population: A multi-model scenario analysis. Environ. Res. Lett. 2021, 16, 045005. [Google Scholar] [CrossRef]
  19. Wang, S.; Zhao, B.; Cai, S.; Klimont, Z.; Nielsen, C.; McElroy, M.; Morikawa, T.; Woo, J.; Kim, Y.; Fu, X.; et al. Emission trends and mitigation options for air pollutants in East Asia. Atmos. Chem. Phys. 2014, 14, 6571–6603. [Google Scholar] [CrossRef] [Green Version]
  20. Venkataraman, C.; Brauer, M.; Tibrewal, K.; Sadavarte, P.; Wang, S. Source influence on emission pathways and ambient PM2.5 pollution over India (2015–2050). Atmos. Chem. Physic 2018, 18, 8017–8039. [Google Scholar] [CrossRef] [Green Version]
  21. Yuan, R.; Ma, Q.; Zhang, Q.; Yuan, X.; Wang, Q.; Luo, C. Coordinated effects of energy transition on air pollution mitigation and CO2 emission control in China. Sci. Total Environ. 2022, 841, 156482. [Google Scholar] [CrossRef]
  22. Tang, R.; Zhao, J.; Liu, Y.; Huang, X.; Zhang, Y.; Zhou, D.; Ding, A.; Nielsen, C.; Wang, H. Air quality and health co-benefits of China’s carbon dioxide emissions peaking before 2030. Nat. Commun. 2022, 13, 1008. [Google Scholar] [CrossRef]
  23. Cai, S.; Ma, Q.; Wang, S.; Zhao, B.; Brauer, M.; Cohen, A.; Martin, R.; Zhang, Q.; Li, Q.; Wang, Y.; et al. Impact of air pollution control policies on future PM2.5 concentrations and their source contributions in China. J. Environ. Manag. 2018, 227, 124–133. [Google Scholar] [CrossRef] [PubMed]
  24. Zhang, X.; Fung, J.; Zhang, Y.; Lau, A.; Huang, W. Assessing PM2.5 emissions in 2020: The impacts of integrated emission control policies in china. Environ. Pollut. 2020, 263, 114575. [Google Scholar] [CrossRef]
  25. Qiao, X.; Liu, L.; Yang, C.; Yuan, Y.; Zhang, H. Responses of fine particulate matter and ozone to local emission reductions in the Sichuan Basin, southwestern China. Environ. Pollut. 2021, 277, 116793. [Google Scholar] [CrossRef] [PubMed]
  26. Mo, H.; Jiang, K.; Wang, P.; Shao, M.; Wang, X. Co-Benefits of energy structure transformation and pollution control for air quality and public health until 2050 in Guangdong, China. Int. J. Environ. Res. Public Health 2022, 19, 14965. [Google Scholar] [CrossRef] [PubMed]
  27. Luo, R.; He, C.; Yu, Q.; He, L.; Ma, W. Investigating the influence of the implementation of an energy development plan on air quality using WRF-CAMx modeling tools: A case study of Shandong province in China. Atmosphere 2019, 10, 660. [Google Scholar] [CrossRef] [Green Version]
  28. Li, Z.; Yu, S.; Li, M.; Chen, X.; Zhang, Y.; Song, Z.; Li, J.; Jiang, Y.; Liu, W.; Li, P.; et al. The Modeling study about impacts of emission control policies for Chinese 14th Five-Year Plan on PM2.5 and O3 in Yangtze River Delta, China. Atmosphere 2021, 13, 26. [Google Scholar] [CrossRef]
  29. Jiang, J.; Ye, B.; Shao, S.; Zhou, N.; Wang, D.; Zeng, Z.; Liu, J. Two-tier synergic governance of greenhouse gas emissions and air pollution in China’s megacity, Shenzhen: Impact evaluation and policy implication. Environ. Sci. Technol. 2021, 55, 7225–7236. [Google Scholar] [CrossRef]
  30. Wu, P.; Guo, F.; Cai, B.; Wang, C.; Gao, J. Co-benefits of peaking carbon dioxide emissions on air quality and health, a case of Guangzhou, China. J. Environ. Manag. 2021, 282, 111796. [Google Scholar] [CrossRef]
  31. Ling, H.; Qing, L.; Xu, J.; Shi, L.; Li, L.; Wang, Q.; Wang, Y.; Ge, C.; Zhang, H.; Yang, Q.; et al. Strategies towards PM2.5 attainment for non-compliant cities in China: A case study. J. Environ. Manag. 2021, 298, 113529. [Google Scholar] [CrossRef]
  32. Shao, J.; Xiang, N.; Zhang, Y.; Li, X.; Liang, G. Dynamic simulation of integrated cleaner production strategies towards high quality development in a heavily air-polluted city in China. Sustainability 2021, 13, 8951. [Google Scholar] [CrossRef]
  33. Chen, W.; Li, H.; Zhu, Y.; Jang, J.; Lin, C.; Chiang, P.; Wang, S.; Xing, J.; Fang, T.; Li, J.; et al. Impact assessment of energy transition policy on air quality over a typical district of the Pearl River Delta Region, China. Aerosol Air Qual. Res. 2022, 22, 220071. [Google Scholar] [CrossRef]
  34. Ding, D.; Xing, J.; Wang, S.; Dong, Z.; Zhang, F.; Liu, S.; Hao, J. Optimization of a NOx and VOC cooperative control strategy Based on Clean Air Benefits. Environ. Sci. Technol. 2021, 56, 739–749. [Google Scholar] [CrossRef] [PubMed]
  35. Guo, X.; Fu, L.; Ji, M.; Lang, J.; Chen, D.; Cheng, S. Scenario analysis to vehicular emission reduction in Beijing-Tianjin-Hebei (BTH) region, China. Environ. Pollut. 2016, 216, 470–479. [Google Scholar] [CrossRef] [PubMed]
  36. Zhang, Q.; Tong, P.; Liu, M.; Lin, H.; Wang, X. A WRF-Chem model-based future vehicle emission control policy simulation and assessment for the Beijing-Tianjin-Hebei region, China. J. Environ. Manag. 2020, 253, 109751. [Google Scholar] [CrossRef] [PubMed]
  37. Hu, J.; Huang, L.; Chen, M.; He, G.; Zhang, H. Impacts of power generation on air quality in China—Part II: Future scenarios. Resour. Conserv. Recycl. 2017, 121, 115–127. [Google Scholar] [CrossRef]
  38. Li, B.; Sun, Y.; Zheng, W.; Zhang, H.; Wang, Y. Evaluating the role of clean heating technologies in rural areas in improving the air quality. Appl. Energy 2021, 289, 116693. [Google Scholar] [CrossRef]
  39. Li, X. Design of energy-conservation and emission-reduction plans of China’s industry: Evidence from three typical industries. Energy 2020, 209, 118358. [Google Scholar] [CrossRef]
  40. Tong, D.; Geng, G.; Jiang, K.; Cheng, J.; He, K. Energy and emission pathways towards PM2.5 air quality attainment in the Beijing-Tianjin-Hebei region by 2030. Sci. Total Environ. 2019, 692, 361–370. [Google Scholar] [CrossRef]
  41. Shi, X.; Zheng, Y.; Lei, Y.; Xue, W.; Yan, G.; Liu, X.; Cai, B.; Tong, D.; Wang, J. Air quality benefits of achieving carbon neutrality in China. Sci. Total Environ. 2021, 795, 148784. [Google Scholar] [CrossRef]
  42. Liu, Y.; Liao, W.; Lin, X.; Li, L.; Zeng, X. Assessment of Co-benefits of vehicle emission reduction measures for 2015–2020 in the Pearl River Delta region, China. Environ. Pollut. 2017, 223, 62–72. [Google Scholar] [CrossRef] [PubMed]
  43. Feng, X.; Sun, Q.; Qian, K.; Liu, M. Cointegration Relationship of Regional Integrated Transport Demand and Industrial Structure. J. Transp. Syst. Eng. Inf. Technol. 2012, 12, 10–16. [Google Scholar] [CrossRef]
  44. Wang, W.; Guo, X. Relationship between urban transportation and industry structures: Case study of Nanjing, China. In Proceedings of the Transportation Research Board 95th Annual Meeting, Washington, DC, USA, 10–14 January 2016. [Google Scholar]
  45. Zhai, Y. Research on the Relationship between Traffic and Economic Growth in China; Wuhan University: Wuhan, China, 2014. (In Chinese) [Google Scholar]
  46. Yu, Y.; Liu, H. Economic growth, industrial structure and nitrogen oxide emissions reduction and prediction in China. Atmospheric Pollut. Res. 2020, 11, 1042–1050. [Google Scholar] [CrossRef]
  47. Lu, J.; Han, S.; Kang, J. Driving factor decomposition analysis of carbon emissions for regional transportation. J. Transp. Eng. 2016, 14, 56–62. (In Chinese) [Google Scholar]
  48. Hou, J.; Shi, D. Study on driving factors of carbon emission change in China’s power industry. China Ind. Econ. 2014, 315, 44–56. (In Chinese) [Google Scholar]
  49. Wang, X.; Gao, X.; Shao, Q.; Wei, Y. Factor decomposition and decoupling analysis of air pollutant emissions in China’s iron and steel industry. Environ. Sci. Pollut. Res. 2020, 27, 15267–15277. [Google Scholar] [CrossRef]
  50. Qian, Y.; Cao, H.; Huang, S. Decoupling and decomposition analysis of industrial sulfur dioxide emissions from the industrial economy in 30 Chinese provinces. J. Environ. Manag. 2020, 260, 110142. [Google Scholar] [CrossRef]
  51. Klein, D. CO2 emission trends for the US and electric power sector. Electr. J. 2016, 29, 33–47. [Google Scholar] [CrossRef]
  52. Liao, C.; Wang, S.; Fang, J.; Zheng, H.; Liu, J.; Zhang, Y. Driving forces of provincial-level CO2 emissions in China’s power sector based on LMDI method. Energy Procedia 2019, 158, 3859–3864. [Google Scholar] [CrossRef]
  53. Ma, J. Analysis on the Evolution of American Transportation Industry Association in the Transformation of Economic Structure; Dalian University of Technology: Dalian, China, 2020. (In Chinese) [Google Scholar]
  54. Guangdong Provincial People’s Government. The Fourteenth Five Year Plan for National Economic and Social Development of Guangdong Province and the Outline of Long-Term Goals for 2035. Available online: http://www.gd.gov.cn/zwgk/wjk/qbwj/yf/content/post_3268751.html (accessed on 9 September 2022). (In Chinese)
  55. Jiang, B.; Wang, J. Economic Growth Forecast of Guangdong in Guangdong 2035: Development Trends and Strategy; Social Science Literature Press: Beijing, China, 2018. (In Chinese) [Google Scholar]
  56. Guangdong Provincial People’s Government. Opinions on Cultivating and Developing Strategic Pillar Industrial Clusters and Strategic Emerging Industrial Clusters. Available online: http://www.gd.gov.cn/zwgk/wjk/qbwj/yfh/content/post_2997541.html (accessed on 9 September 2022). (In Chinese)
  57. Guangdong Provincial People’s Government. Comprehensive Development Planning of Guangdong Coastal Economic Belt (2017–2030). Available online: http://www.gd.gov.cn/gkmlpt/content/0/146/mmpost_146463.html#7 (accessed on 9 September 2022). (In Chinese)
  58. General Office of Guangdong Provincial People’s Government. Implementation Plan for Promoting Adjustment of Transportation Structure in Guangdong Province. Available online: http://www.gd.gov.cn/zwgk/wjk/qbwj/yfb/content/post_2266767.html (accessed on 9 September 2022). (In Chinese)
  59. Development and Reform Commission of Guangdong Province. Implementation Plan for Energy Structure Adjustment of Guangdong Province during the ‘13th Five Year Plan’. Available online: http://drc.gd.gov.cn/fzgh5637/content/post_845097.html (accessed on 9 September 2022). (In Chinese)
  60. Yarwood, G.; Rao, S.; Yocke, M.; Whitten, G. Updates to the Carbon Bond Chemical Mechanism: CB05; Technical Report, Final Report to US EPA RT-0400675; US EPA: Washington, DC, USA, 2005. [Google Scholar]
  61. Skamarock, W.; Klemp, J. A time-split nonhydrostatic atmospheric model for weather research and forecasting applications. J. Comput. Phys. 2008, 227, 3465–3485. [Google Scholar] [CrossRef]
  62. Morrison, H.; Gettelman, A. A new two-moment bulk stratiform cloud microphysics scheme in the community atmosphere model, version 3 (CAM3). Part I: Description and numerical tests. J. Clim. 2008, 21, 3642–3659. [Google Scholar] [CrossRef]
  63. Pleim, J. A combined local and nonlocal closure model for the atmospheric boundary layer. Part I: Model description and testing. J. Appl. Meteorol. Climatol. 2007, 46, 1383–1395. [Google Scholar] [CrossRef]
  64. Xiu, A.; Pleim, J. Development of a land surface model. Part I: Application in a mesoscale meteorological model. J. Appl. Meteorol. 2001, 40, 192–209. [Google Scholar] [CrossRef]
  65. Zheng, B.; Zhang, Q.; Zhang, Y.; He, K.; Wang, K.; Zheng, G.; Duan, F.; Ma, Y.; Kimoto, T. Heterogeneous chemistry: A mechanism missing in current models to explain secondary inorganic aerosol formation during the January 2013 haze episode in North China. Atmos. Chem. Phys. 2015, 14, 2031–2049. [Google Scholar] [CrossRef] [Green Version]
  66. Sala, S.; Benini, L.; Mancini, L.; Pant, R. Integrated assessment of environmental impact of Europe in 2010: Data sources and extrapolation strategies for calculating normalisation factors. Int. J. Life Cycle Assess. 2015, 20, 1568–1585. [Google Scholar] [CrossRef]
  67. Cheng, J.; Tong, D.; Zhang, Q.; Liu, Y.; Lei, Y.; Yan, G.; Yan, L.; Yu, S.; Cui, R.; Leon, C. Pathways of China’s PM2.5 air quality 2015-2060 in the context of carbon neutrality. Natl. Sci. Rev. 2021, 12, 12. [Google Scholar] [CrossRef] [PubMed]
  68. Development and Reform Commission of Guangdong Province. Implementation Plan of Guangdong Province to Resolutely Curb the Blind Development of ‘Two Highs’ Projects. Available online: http://drc.gd.gov.cn/ywtz/content/post_3551808.html (accessed on 9 September 2022). (In Chinese)
  69. Chang, S.; Zeng, W.; Zheng, Y.; Wang, L.; Song, Y.; Zhu, Q.; Luo, Y.; Li, P.; Li, Y.; Liao, C.; et al. Emission mitigation pathways to achieve PM2.5 interim target III of the world health organization in the Pearl River Delta in 2035. Atmos. Res. 2022, 269, 106050. [Google Scholar] [CrossRef]
  70. Ren, S.; Wang, P.; Dai, H.; Zhao, D.; Masui, T. Health and Economic Impact Assessment of Transport and Industry PM2.5 Control Policy in Guangdong Province. Sustainability 2021, 13, 13049. [Google Scholar] [CrossRef]
Figure 1. Schematic diagram of construction parameters and constraint relationship of “industry– transportation–energy” linkage development scenario.
Atmosphere 14 00056 g001
Figure 2. Demand of industrial development of PRD under the base year and three scenarios in 2035.
Atmosphere 14 00056 g002
Figure 3. Demand of transportation development of PRD under the base year and three scenarios in 2035: (a) freight transport, (b) passenger transport, (c) urban travel.
Atmosphere 14 00056 g003
Figure 4. Demand of energy development and electric supply of base year and three scenarios in 2035 of PRD: (a) energy consumption structure, (b) power structure.
Atmosphere 14 00056 g004
Figure 5. Contributions of different sector to pollutants’ emission reduction compared between BAU and MAS scenarios.
Atmosphere 14 00056 g005
Figure 6. Contributions of different sector to pollutants’ emission reduction compared between BAU and EAS scenarios.
Atmosphere 14 00056 g006aAtmosphere 14 00056 g006b
Figure 7. Air quality levels under three scenarios in 2035: (a) BAU, (b) MAS, (c) EAS.
Atmosphere 14 00056 g007
Disclaimer/Publisher’s Note: The statements, opinions and data contained in all publications are solely those of the individual author(s) and contributor(s) and not of MDPI and/or the editor(s). MDPI and/or the editor(s) disclaim responsibility for any injury to people or property resulting from any ideas, methods, instructions or products referred to in the content.

