
High Spatial and Temporal Resolution Methane Emissions Inventory from Terrestrial Ecosystems in China, 2010–2020

1
State Environmental Protection Key Laboratory of Satellite Remote Sensing, Aerospace Information Research Institute, Chinese Academy of Sciences, Beijing 100101, China
2
College of Resources and Environment, University of Chinese Academy of Sciences, Beijing 101408, China
*
Author to whom correspondence should be addressed.
Atmosphere 2022, 13(12), 1966; https://doi.org/10.3390/atmos13121966
Submission received: 29 October 2022
/
Revised: 16 November 2022
/
Accepted: 22 November 2022
/
Published: 25 November 2022
(This article belongs to the Special Issue Remote Sensing Observation of Greenhouse Gases Emission)
Abstract
:Methane (CH4) is not only an important greenhouse gas next to carbon dioxide (CO2), but also an important chemically active gas. Under the background of climate warming, the measurement of CH4 emissions from terrestrial ecosystems in China is not only very important for exploring the impact of climate change on the ecological environment, but also of great significance for the in-depth study of ecosystem carbon cycling. In this study, we used the Emission-Factor Approach to estimate CH4 emissions from terrestrial ecosystems in China from 2010–2020 and explored the spatial distribution characteristics of CH4 emissions. The estimated CH4 emission inventory of terrestrial ecosystems with 0.05 spatial resolution on monthly time scale is in good agreement with the results of the latest emission inventory. It is estimated that CH4 emissions from terrestrial ecosystems in China are 19.955 Tg yr−1, including 18.61% (3.713 Tg yr−1) from vegetation, 21.47% (4.285 Tg yr−1) from wetlands and 59.92% (11.957 Tg yr−1) from paddy fields, with the largest contribution from paddy fields. The regions with high CH4 emissions from terrestrial ecosystems in China are mainly located in the central, eastern and southeastern regions of China, and show a decreasing trend from southeast to northwest. The CH4 emission from terrestrial ecosystems in China has obvious seasonal variation characteristics, with the lowest emission in January (0.248 Tg month−1) and the highest emission in August (3.602 Tg month−1). The emissions are high in summer and autumn and low in spring and winter. CH4 emissions from terrestrial ecosystems in China showed an overall upward trend from 2010–2020.
1. Introduction
Methane (CH4) is the second most important greenhouse gas (GHG) in the atmosphere after carbon dioxide (CO2), accounting for more than 20% of the total greenhouse gases [1]. According to the Intergovernmental Panel on Climate Change (IPCC) Fifth Assessment Report, the global warming potential of CH4 is 28 times that of CO2 over a 100-year period, and its residence time in the atmosphere is about 9.1 years [2]. The latest findings from the World Meteorological Organization’s Global Atmosphere Watch Program point out that as of 2019, the average global atmospheric concentration of CH4 is 1877 ± 2 ppb, reaching 260% of pre-industrial levels, and is still rising at an average rate of 7.3 ppb per year over the last decade. Its radiative forcing contribution to the growth of global radiative forcing of greenhouse gases reaches 16% [3]. Compared with CO2, CH4 has higher global warming potential and shorter retention time in the atmosphere. Compared with controlling CO2, quickly and effectively controlling the increase of CH4 content in the atmosphere can quickly slow down the recent global warming so as to improve the global ecosystem and reduce global economic losses. In addition to climate benefits, reducing CH4 emissions will also reduce surface ozone generation, which can improve human health and crop production [4,5].
China is located in the high value area of atmospheric CH4 concentration, so it is of great significance to study and estimate the main sources of atmospheric CH4 [6,7]. The ecosystem of China is complex and diverse, and it is a key region where Eurasia has a great impact on global climate change. Under the background of climate warming, the measurement of CH4 emissions from typical terrestrial ecosystems in China is not only very important to explore the impact of climate change on the ecological environment, but also of great significance to the in-depth study of ecosystem carbon cycles. The latest data on the global CH4 budget from 2000–2017 show that about 40% of global CH4 emissions to the atmosphere come from natural sources (mainly vegetation and wetlands) and about 60% from anthropogenic sources (mainly paddy fields, livestock, coal mining, municipal solid waste (MSW) treatment and biomass burning) [1]. Among them, vegetation and wetlands in natural sources and paddy fields in anthropogenic sources together constitute terrestrial ecosystems, which are strongly correlated with the environment and have obvious spatial differentiation characteristics and seasonal variation trends. Therefore, a systematic and comprehensive estimation of CH4 emissions from terrestrial ecosystems in China and the establishment of a CH4 emission inventory with high spatial and temporal resolution are important for understanding the changes in atmospheric CH4 concentrations and providing data support for China’s emission reduction strategy.
Extensive research has been conducted by domestic and international scholars in estimating emissions from major sources of CH4 from terrestrial ecosystems in China, such as vegetation [8,9], wetlands [10,11,12], and paddy fields [13,14]. At the same time, a number of scholars have estimated a comprehensive CH4 emission inventory in China that includes multiple emission sources [15,16,17,18,19]. Although there have been a large number of studies on the estimation of CH4 emissions, there are few studies on the estimation of CH4 emissions from long-term terrestrial ecosystems based on pixel scale and monthly scale in China. Most existing inventories of CH4 emissions from terrestrial ecosystems in China are estimated based on data from the China Statistical Yearbook, mostly on an annual and provincial basis, which cannot truly reflect the spatially divergent characteristics and seasonal trends of CH4 emissions [20]. Therefore, based on the published research literature, remote sensing data and existing statistical data, we estimated the monthly CH4 emissions of China’s terrestrial ecosystem from 2010–2020. We also developed a map of CH4 emissions from terrestrial ecosystems at high spatial resolution (0.05° × 0.05°) monthly time scales in China, which can be used to further explore the spatially divergent characteristics and seasonal trends of CH4 emissions from terrestrial ecosystems in different regions of China. This high spatiotemporal resolution CH4 emission inventory can help us to better understand the CH4 budget of regional terrestrial ecosystems and provide reliable input data for atmospheric transport and chemical models.
2. Materials and Methods
The data used in this study are mainly MODIS remote sensing data, meteorological data, and data from others’ studies. The data used to estimate CH4 emissions in this study and their detailed descriptions are shown in Table 1. Since some data have different spatial resolutions, we resampled some data to 0.05° × 0.05° spatial resolution by bilinear interpolation in order to maintain consistency.
The method used to estimate CH4 emissions from terrestrial ecosystems in China in this study is the emission-factor approach, which is a method proposed by the IPCC to estimate GHG emissions and is widely used today. The basic idea is to construct activity density data and emission factor for each emission source according to the emission inventory list, and use the product of activity density data and emission factor as the emission estimation value of the emission item. The calculation formula is as follows:
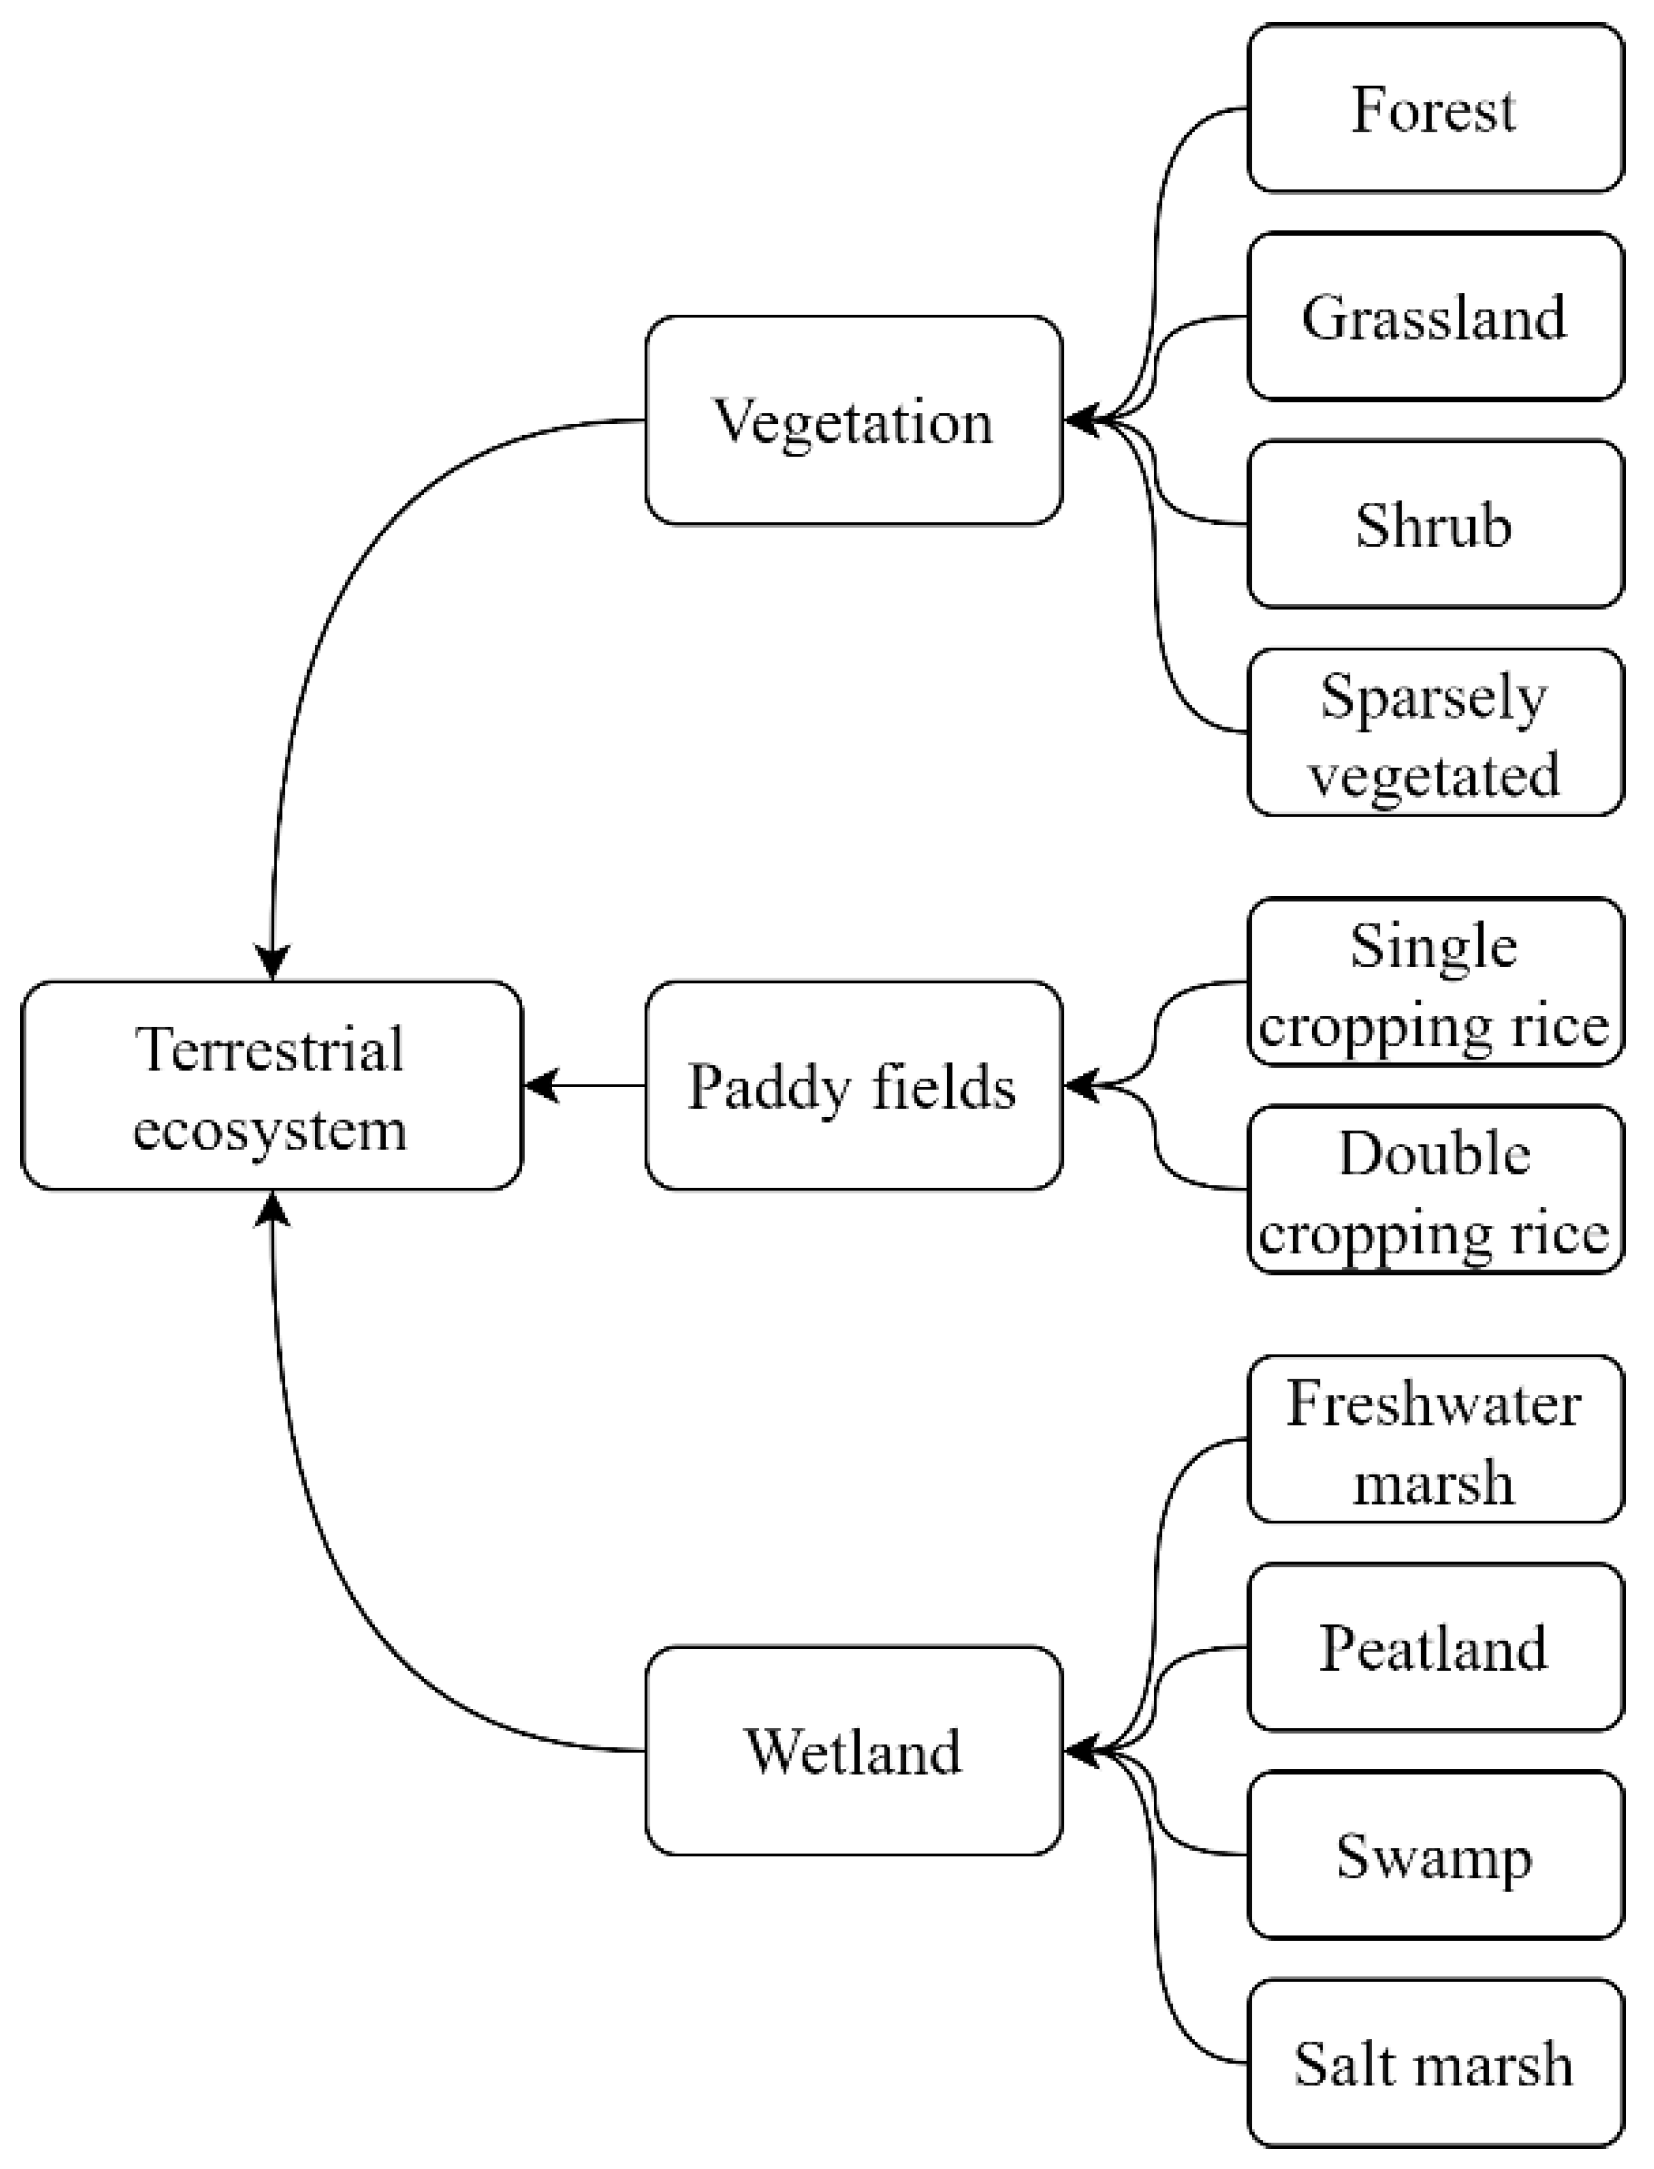
where is the total CH4 emission from the current emission source; i and j are pixel positions; AD is activity density data (Specific uses and inputs of individual sources directly related to CH4 emissions); EF is emission factor (the amount of CH4 gas released per unit of a given emission source, also known as the emission rate). CH4 emissions from terrestrial ecosystems are the sum of CH4 emissions from each source. The main sources of CH4 emissions from terrestrial ecosystems are shown in Figure 1.
2.1. Vegetation
CH4 has been found to be produced by plants in an aerobic environment, and it is estimated that this contributes 10–30% of the total global emissions [9]. CH4 is released from normally growing vegetation, as well as from deciduous or dying vegetation, and CH4 release from vegetation is very sensitive to temperature. Between 30–70 °C, the release of CH4 approximately doubles for every 10 °C increase in temperature. In addition, the rate of CH4 emission from both normally growing and decayed phytomasses increased significantly under insolation conditions [22]. The results of the study by Keppler et al. [22] pointed out that the CH4 emission rates of different plant bodies (normally growing and withered plant bodies) under different light conditions have an exponential relationship with temperature and presented the first equation for estimating vegetation CH4 emissions. Afterward, Parsons et al. [23] found that replacing net primary productivity (NPP) in Keppler’s model with leaf biomass could improve the estimation accuracy of CH4 emission from vegetation. In addition, Zhang et al. [8] proposed the conversion relationship between NPP and leaf biomass. Based on the existing research results, Gong et al. [19] integrated the results of Keppler, Parsons and Zhang and improved the estimation method of vegetation CH4 emissions, which made the estimation results of vegetation CH4 emissions more accurate. In this study, we use the improved estimation method of Gong et al. The formula is as follows: [19].
where i and j represent pixel horizontal and vertical coordinates and t represents month; and represent CH4 emission rates (ng CH4 g−1 dry weight month−1) of normal growing plants and litter plants, respectively; stands for surface temperature (°C); represents sunshine hours (h month−1); denotes the number of days in month t; denotes the leaf biomass of vegetation (g m−2); and denote the conversion factors between NPP and biomass and between leaf biomass and biomass, respectively, as shown in Table 2; denotes the CH4 emission flux from vegetation (mg CH4 m−2 month−1).
2.2. Wetland
CH4 emission from natural wetlands has obvious seasonal variation, even in places with similar climate, vegetation and topography [24]. Natural wetlands in China can be divided into peatlands, freshwater marshes, swamps and salt marshes, and the CH4 emission factors vary among different types of wetlands. According to the research results of Ding et al. [10], the relationship between CH4 emission rate and temperature and precipitation in different types of natural wetlands is shown in Table 3. Based on the research results of Ding, the equation for CH4 emissions from wetlands is as follows: [19].
where i and j represent pixel horizontal and vertical coordinates and t represents month; indicates wetland CH4 emission flux; indicates whether the pixel is a wetland (represented by 0 and 1); denotes the number of days in month t; is the area of wetland type k, and S is the total area of all wetland types (obtained by summing the area of four types of wetlands); is the CH4 emission factor of the wetland (Table 3).
2.3. Paddy Fields
The rate of CH4 emission from paddy fields is related to numerous factors, such as rice irrigation level, soil type, fertilizer application, temperature and tillage practices. Fu et al. [14] estimated rice CH4 emission factors (Table 4) for each province in China based on rice irrigation level, soil type, fertilizer application and tillage practices. Based on the method provided by IPCC (2006), Gong et al. [19] constructed a model for paddy field CH4 emissions using vegetation indices to represent rice growth conditions. In this study, we used the model of Gong et al. to estimate CH4 emissions from paddy fields. We also used the CH4 emission factors from the paddy fields of Ding et al. The formula is as follows: [19].
where i and j represent pixel horizontal and vertical coordinates and t represents month; k represents the type of paddy field; is the CH4 emission flux from paddy field; is the CH4 emission factor of paddy field; is the mean NDVI value of the current paddy field; indicates the type of paddy field.
3. Results
3.1. Spatial Patterns of CH4 Emissions
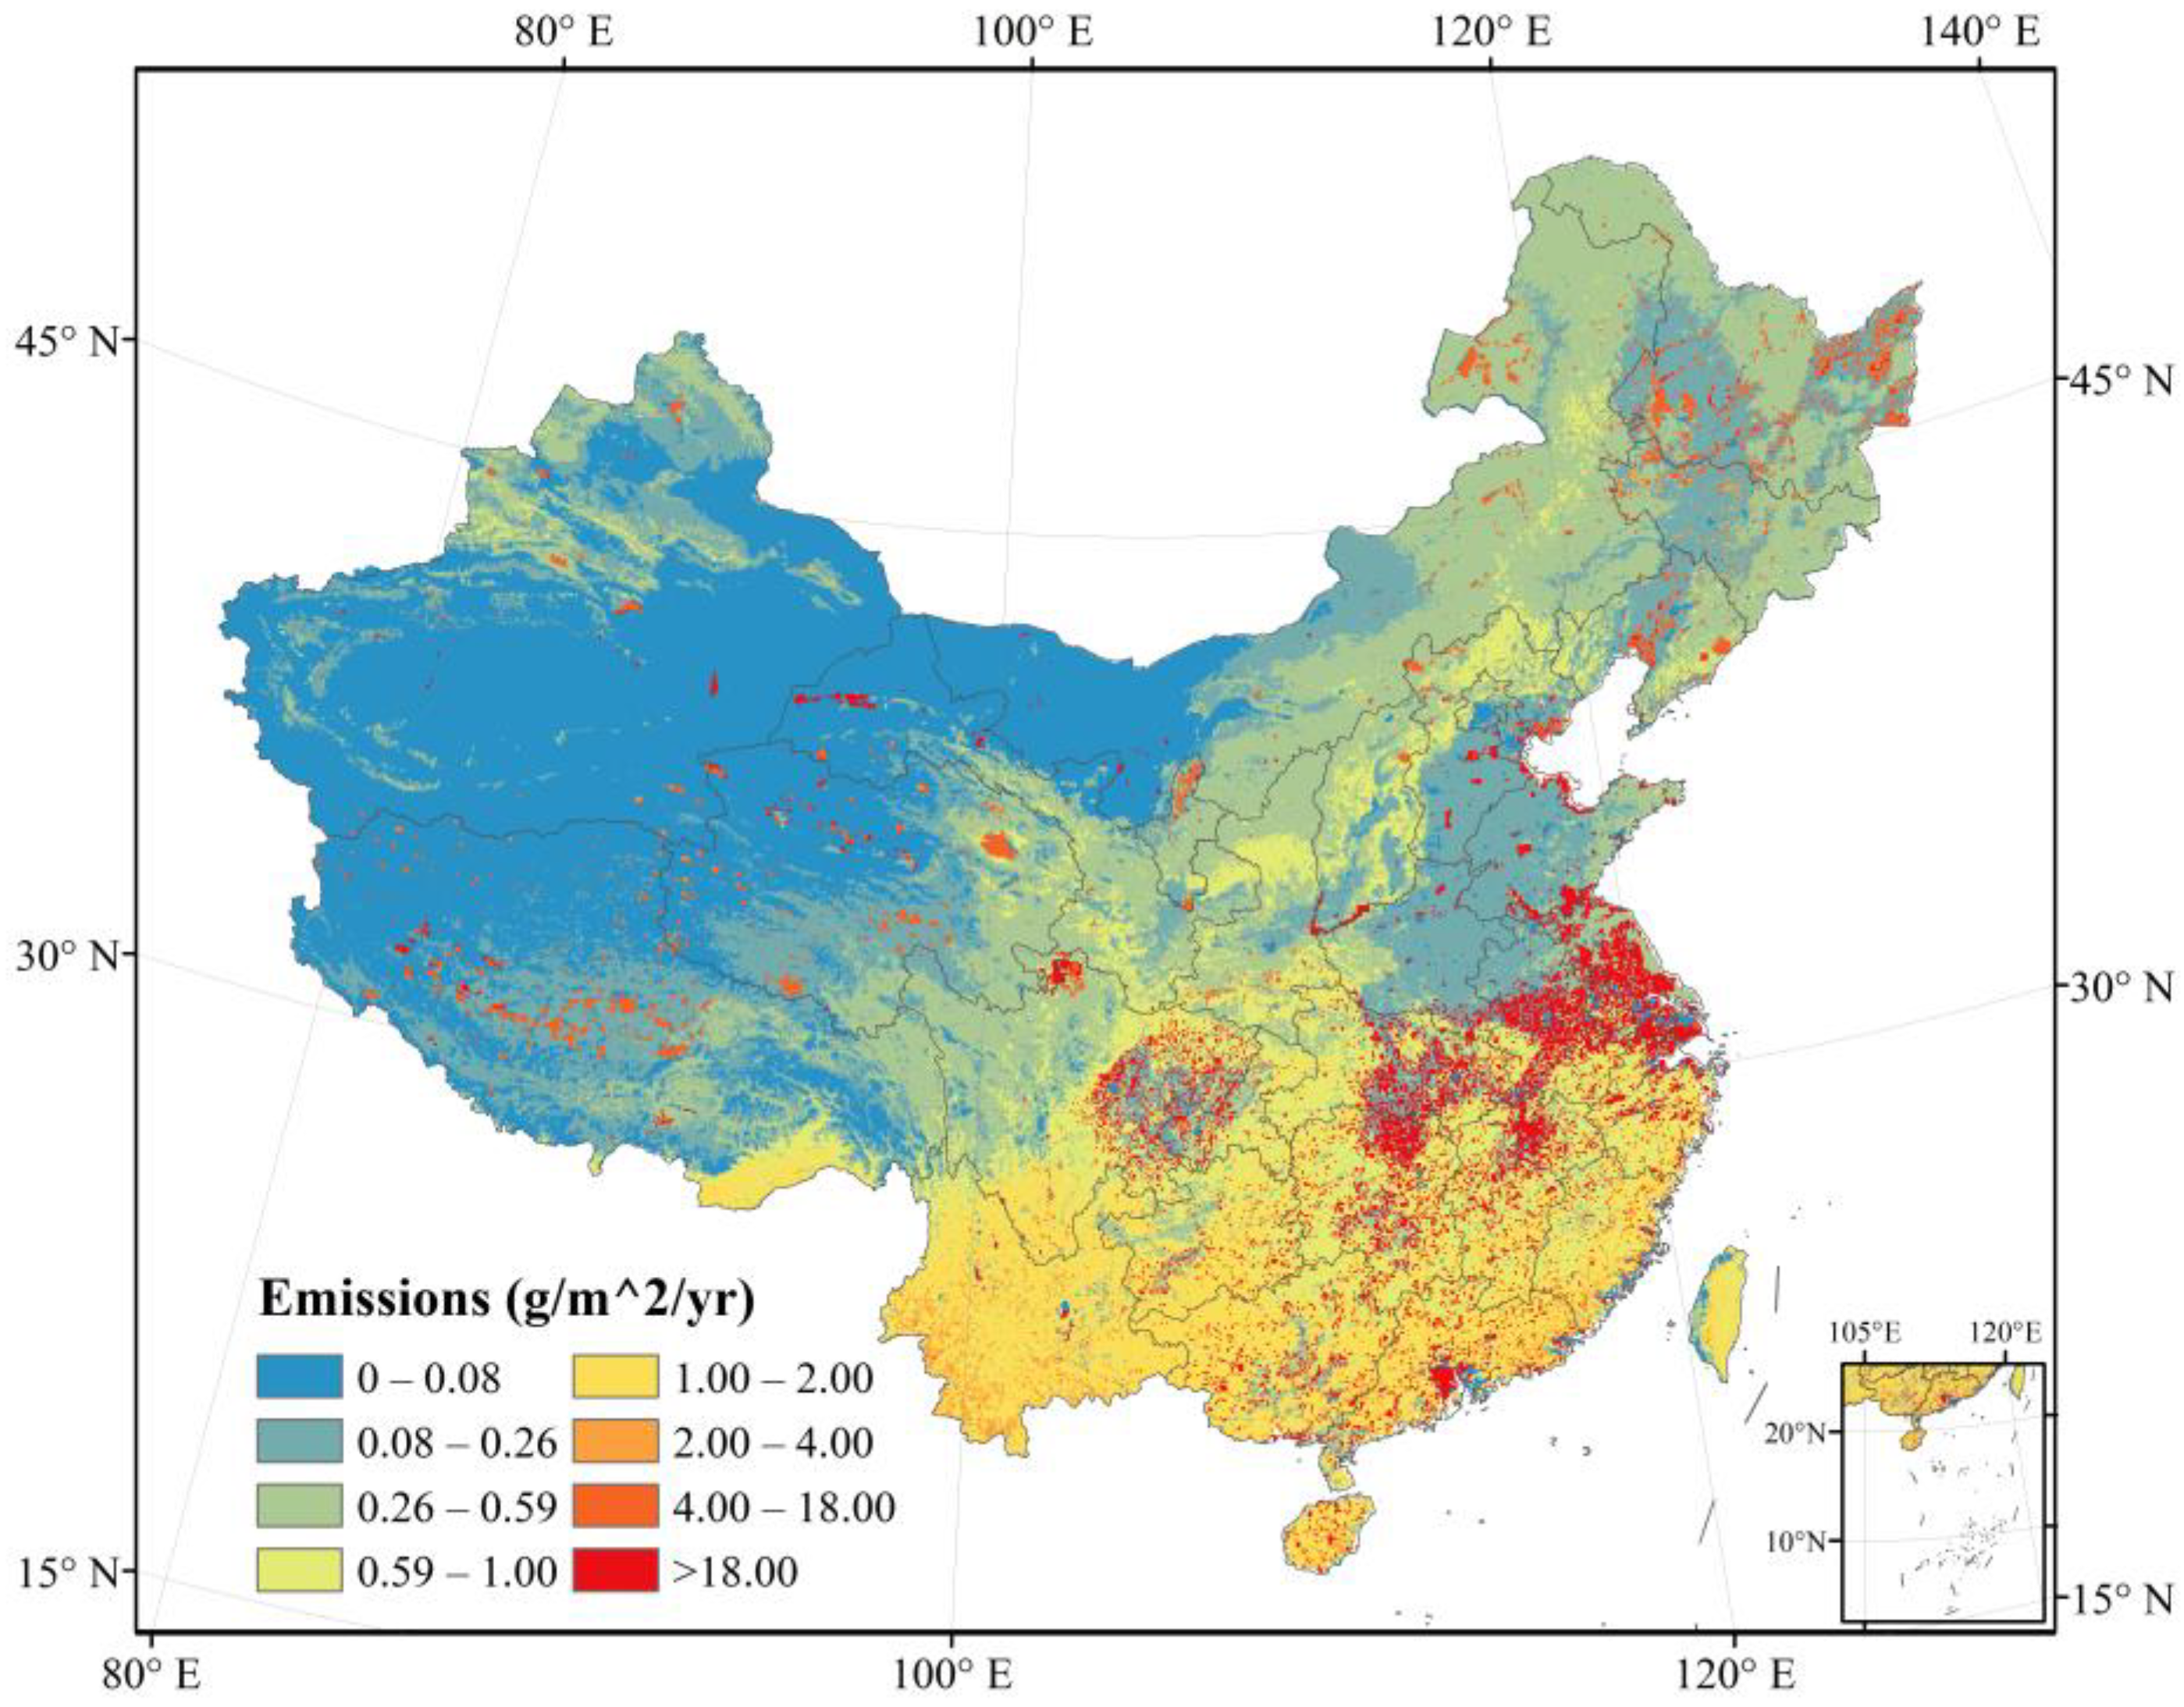
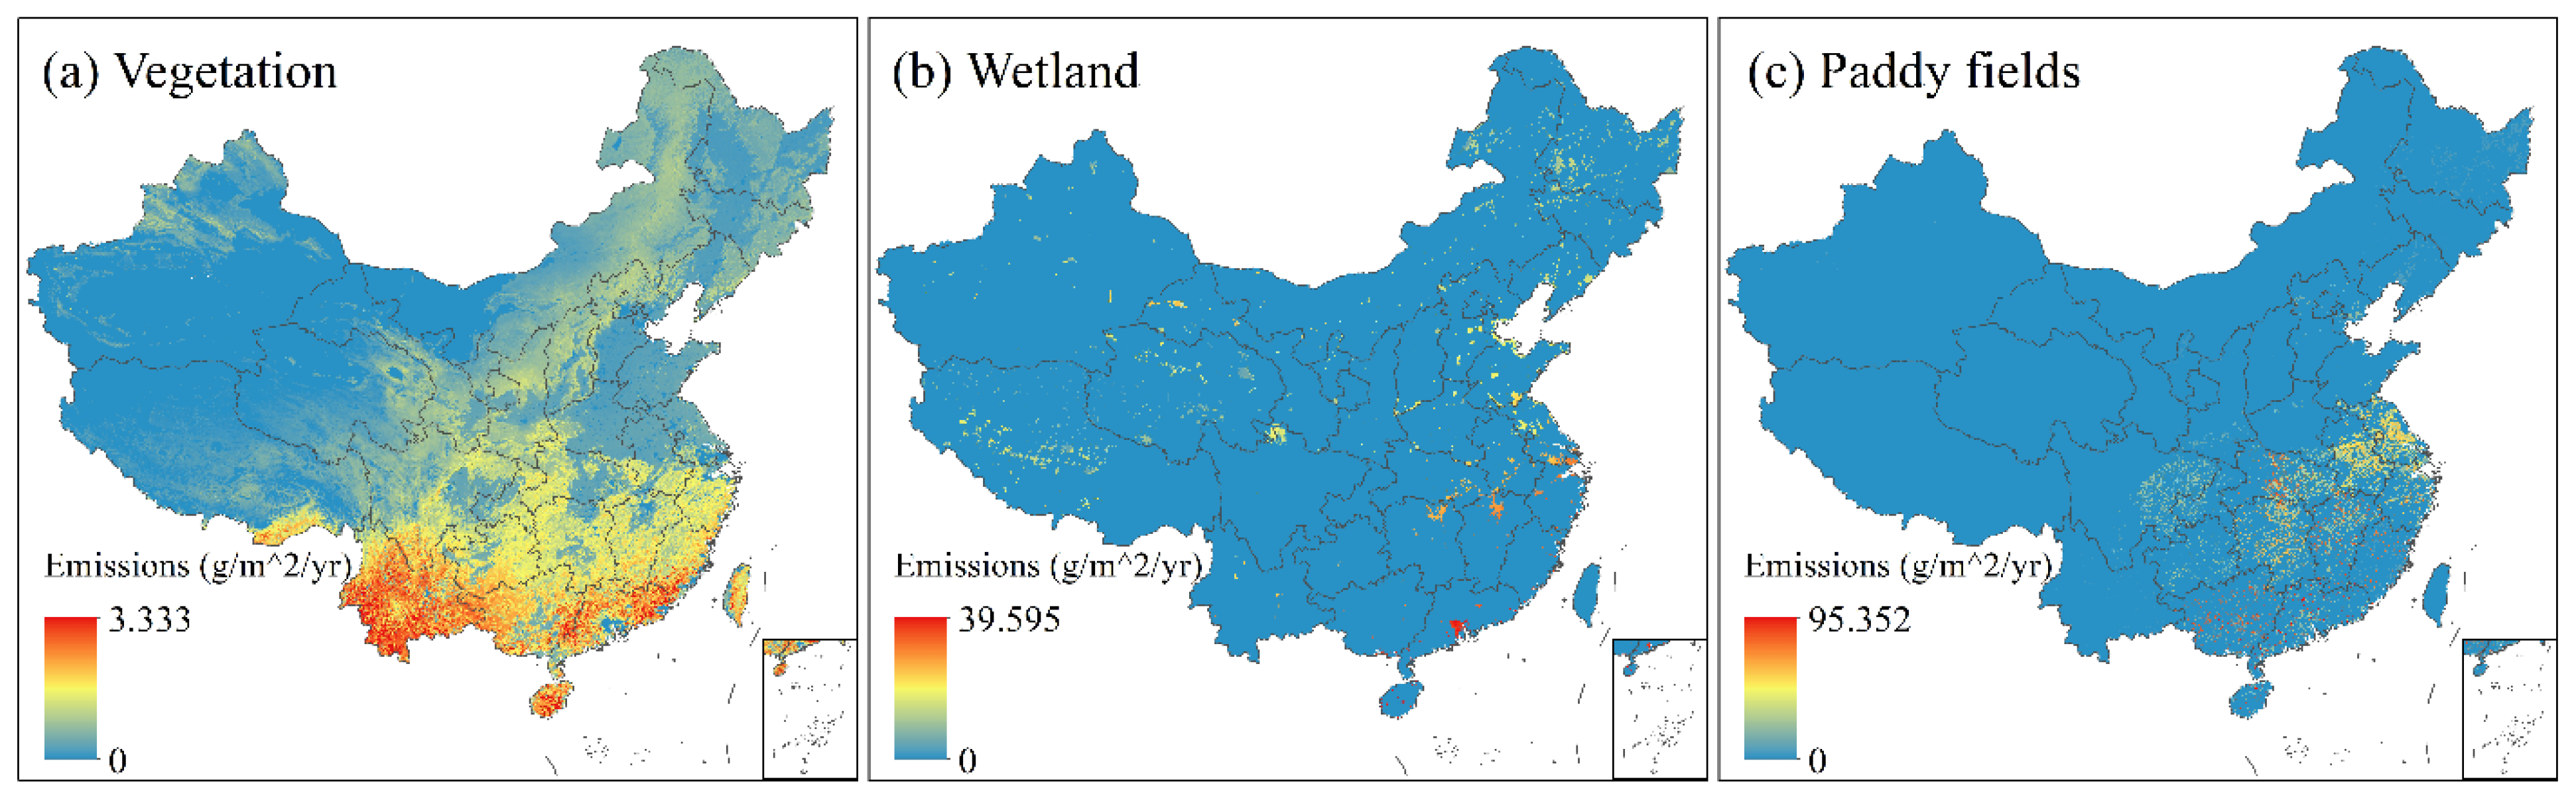
The spatial distribution of CH4 emissions from terrestrial ecosystems in China is shown in Figure 2. The high-value (>18.0 g CH4 m−2 yr−1) areas of CH4 emissions from terrestrial ecosystems are mainly located in East and Central China. Combined with Figure 3, it can be seen that the spatial distribution of CH4 emissions from terrestrial ecosystems in East and Central China are similar to those from paddy fields, indicating that the main source of CH4 emissions from terrestrial ecosystems in this region is paddy fields. CH4 emissions from terrestrial ecosystems in Qinghai-Tibet Plateau in China mainly show a point distribution, which is similar to the spatial distribution of CH4 emissions from wetlands, indicating that wetlands are the main contributors to CH4 emissions from terrestrial ecosystems in the Qinghai-Tibet Plateau. The regions with low CH4 emissions (<2.0 g CH4 m−2 yr−1) in Figure 2 cover almost the whole map, and their spatial distribution is similar to that of vegetation CH4 emissions in Figure 3, which shows that vegetation CH4 emissions cover almost the whole region of China, and the CH4 emissions are high in the southeast region and low in the northwest region. Overall, the regions with high CH4 emissions (>1.0 g CH4 m−2 yr−1) from terrestrial ecosystems in China are mainly located in northeastern, central, eastern and southeastern China, with a decreasing trend from southeast to northwest. This trend is similar to that of vegetation coverage, precipitation and temperature from the southeast to the northwest of China.
3.2. Temporal Patterns of CH4 Emissions
The estimated results show that the average annual CH4 emission of terrestrial ecosystem in China is 19.955 Tg, in which vegetation, wetland and paddy fields are 3.713 Tg, 4.285 Tg and 11.957 Tg, respectively. The CH4 contribution of the three major emission sources is 18.61% (vegetation), 21.47% (wetland) and 59.92% (paddy field), respectively. Monthly CH4 emissions from China’s terrestrial ecosystem from 2010–2020 are shown in Table 5.
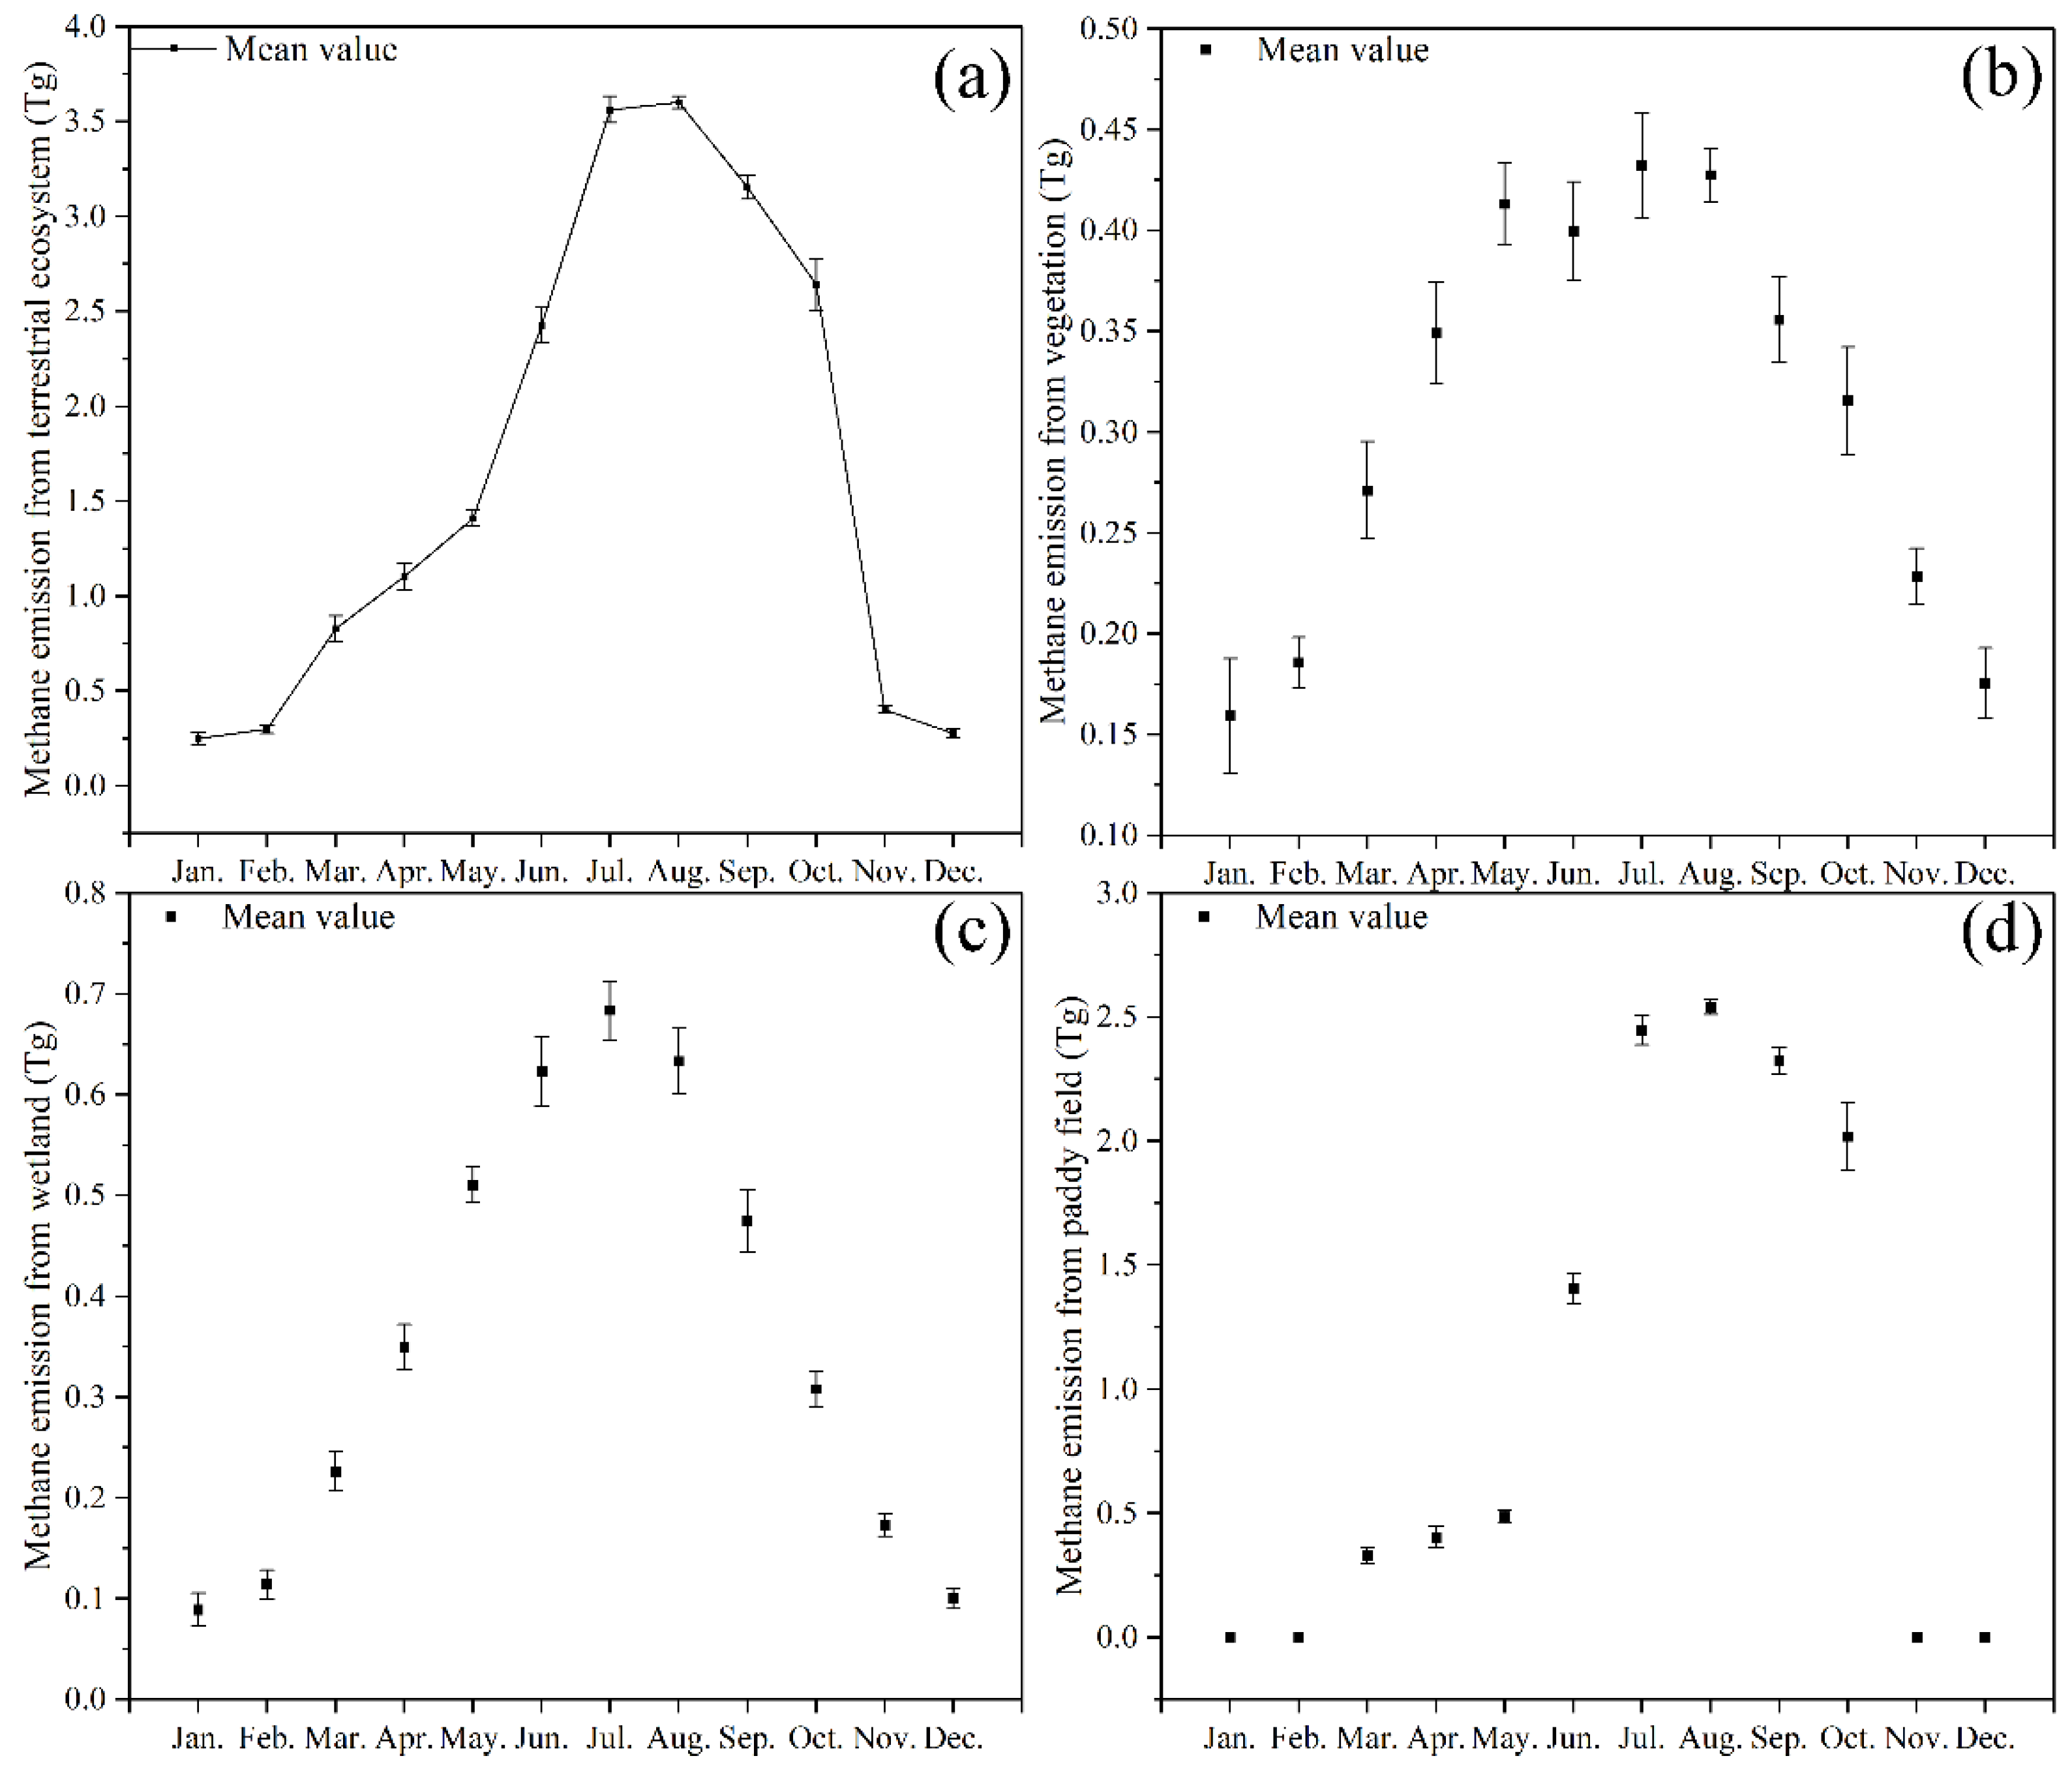
The temporal resolution of this study was on a monthly time scale, and the resulting CH4 emission inventory (Table 5) can be used to explore intra-annual trends in CH4 emissions from terrestrial ecosystems. CH4 emissions from terrestrial ecosystems in China have obvious seasonal variation characteristics, with low emissions in spring and winter and high emissions in summer and autumn. As shown in Figure 4, emissions were lowest in January (average 0.248 Tg month−1), then gradually increased to a maximum in August (average 3.602 Tg month−1) and then gradually decreased to December (average 0.276 Tg month−1). The main reason is that CH4 emission factors from vegetation, wetland and rice emission sources are related to natural factors with seasonal variations, such as temperature, precipitation, sunshine hours, and NPP.
The intra-annual trends of CH4 emissions from each emission source in terrestrial ecosystems are shown in Figure 4, with significant seasonal variation in CH4 emissions from vegetation, wetlands and paddy fields. Vegetation CH4 emissions are related to temperature, biomass, and sunshine hours. The higher the temperature, the longer the sunshine hours, and the greater the vegetation NPP, the higher the CH4 emissions from vegetation. Emissions are high in July and August because of lush vegetation growth, high temperatures and long sunshine hours, with average emissions reaching 0.430 Tg month−1, about 2.7 times higher than emissions in January (0.159 Tg month−1). CH4 emissions from wetlands are mainly affected by temperature and precipitation. The higher the temperature and precipitation, the higher the CH4 emissions from wetlands. CH4 emissions from wetlands peaked in July, at an average of 0.684 Tg month−1, which was 7.7 times that of January’s (average 0.089 Tg month−1) because most parts of China had the highest temperatures and precipitation in June, July and August. The paddy field mainly emits CH4 in the rice growing season, and the CH4 emission factors of different types of rice are different. The better the rice growth condition, the higher the CH4 emission. The CH4 emission factor of late rice (growing mainly from July to October) was higher than that of early rice (growing mainly from March to June) and double cropping rice mainly emits CH4 from June to October, so July to October is the peak of CH4 emission from paddy fields. There is no rice cultivation from November to February, so there is no CH4 emission from paddy fields during these months.
3.3. Intra-Annual Spatial and Temporal Distribution of CH4 Emissions
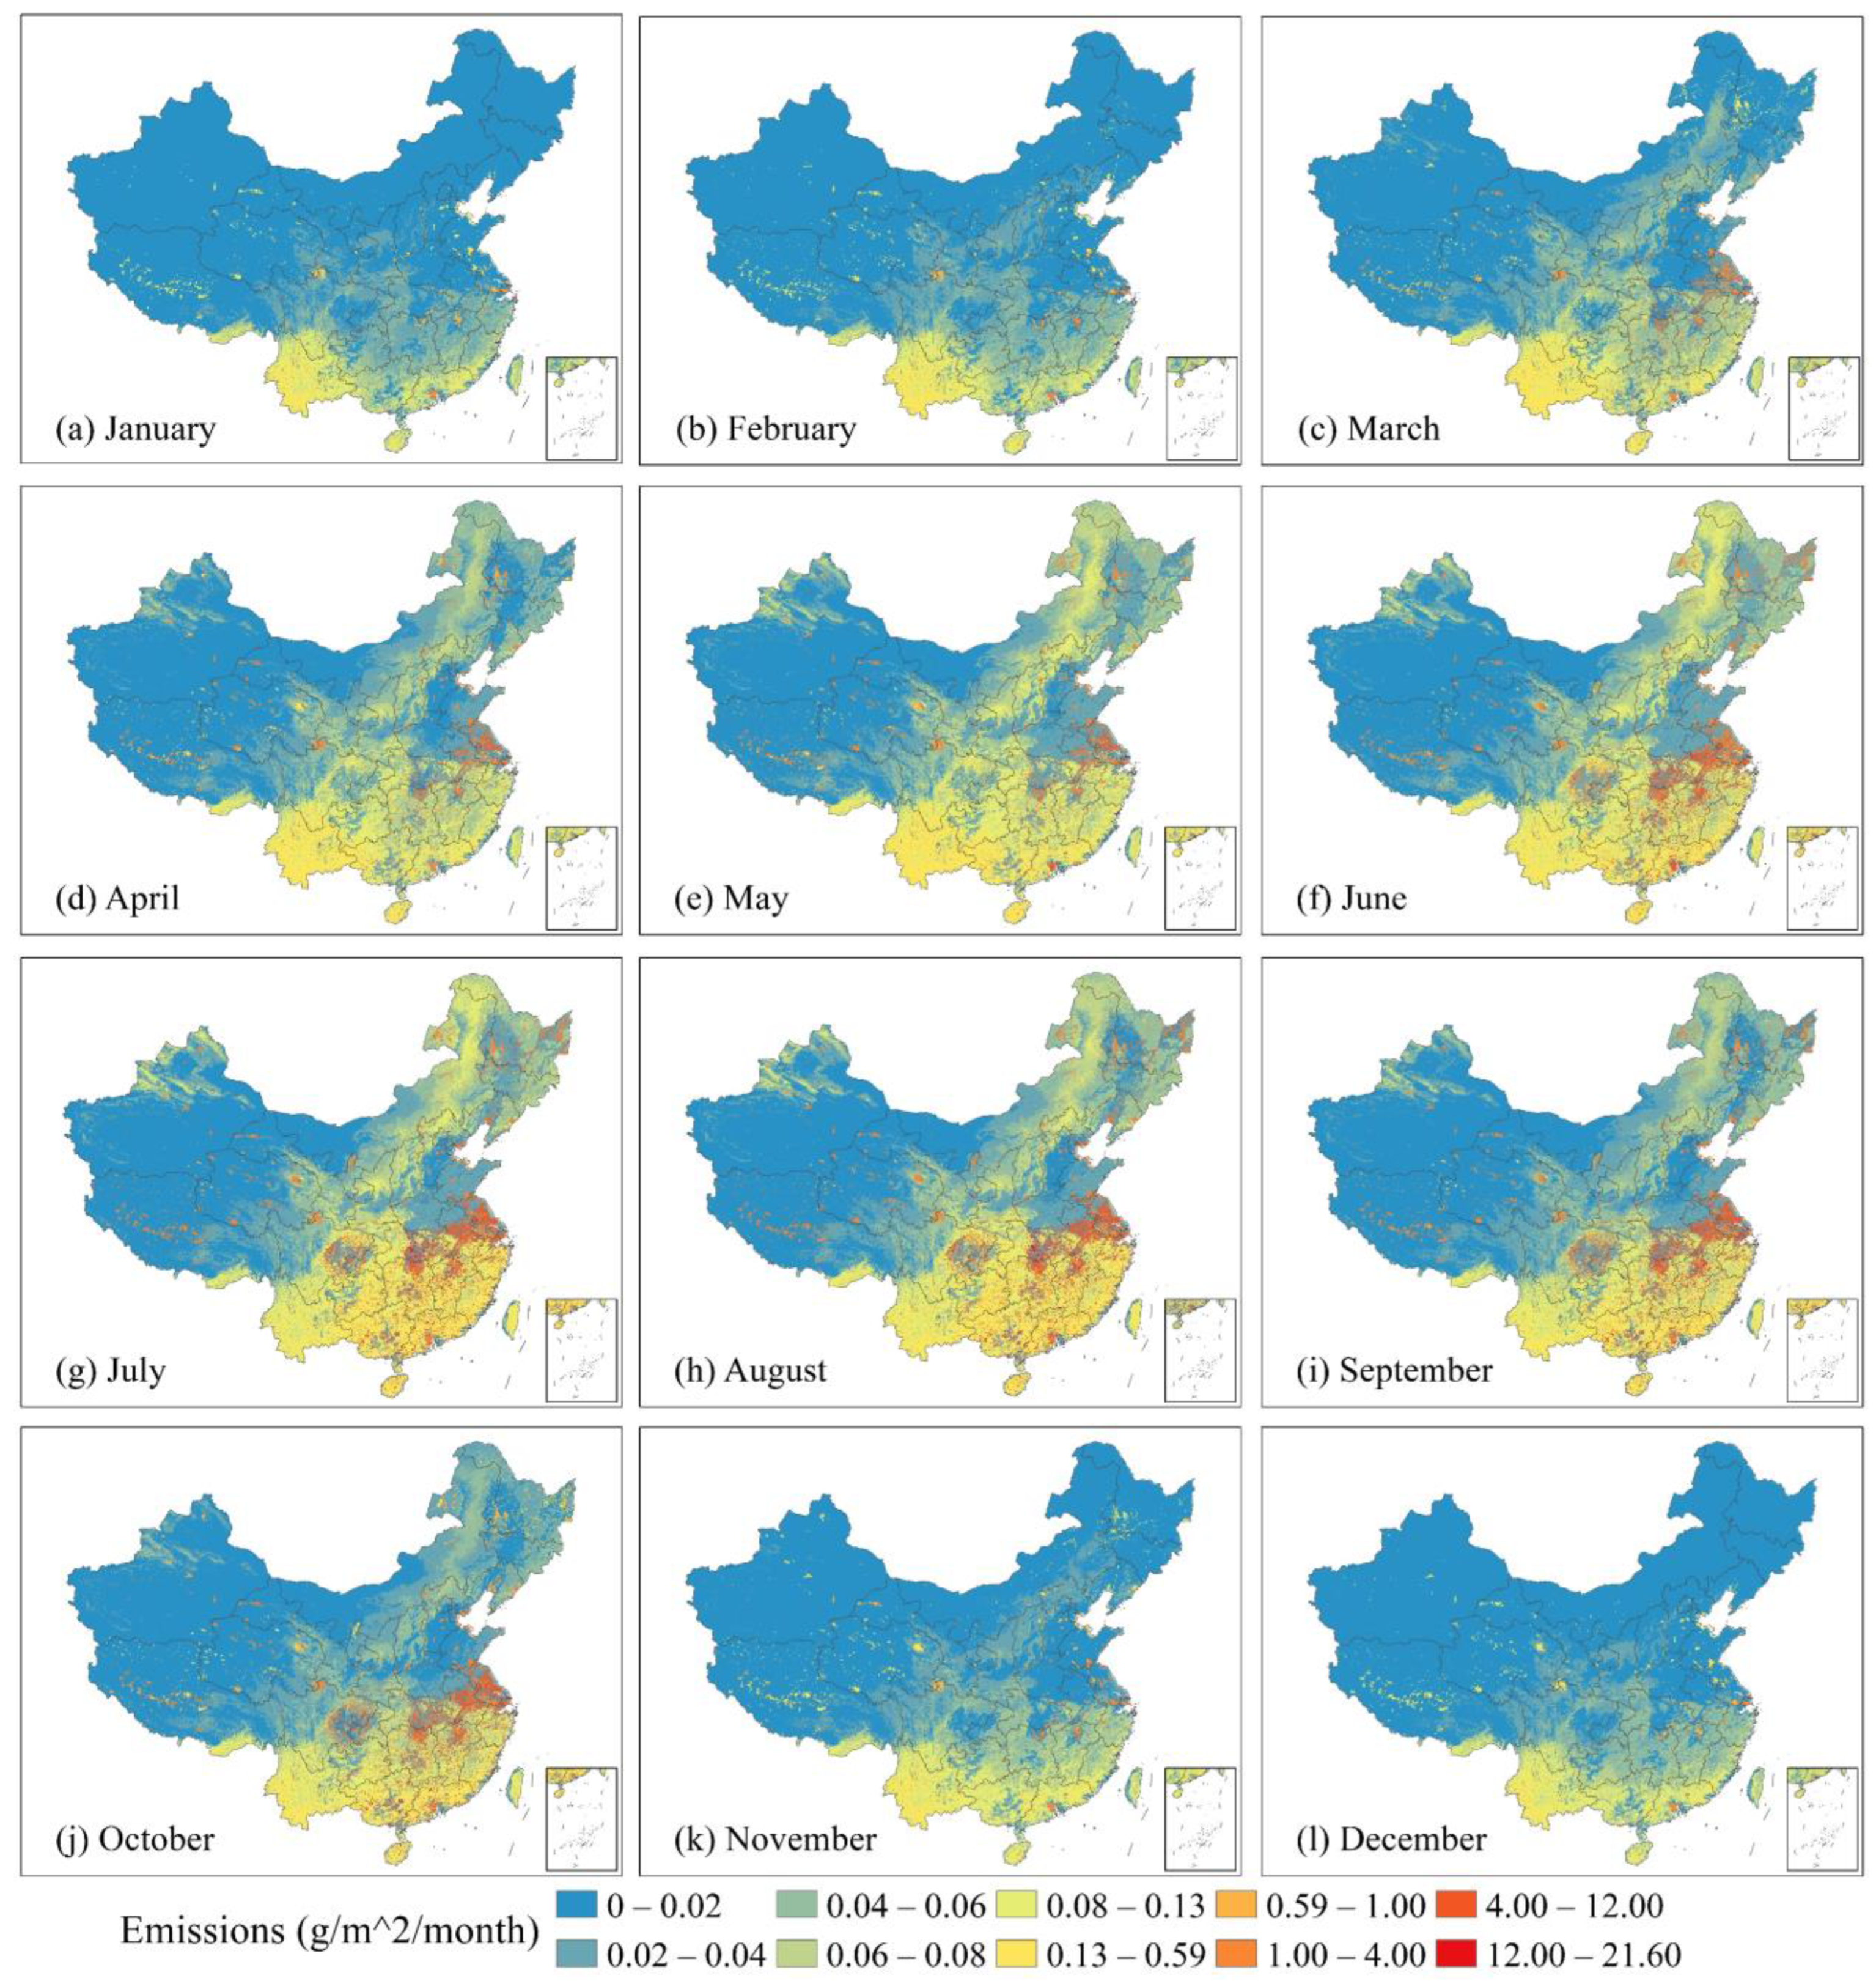
The CH4 emissions of terrestrial ecosystems not only have obvious seasonal variation characteristics in time, but also have different spatial distribution in different seasons. Figure 5 shows the spatial distribution characteristics of monthly CH4 emissions from China’s terrestrial ecosystem. It can be seen that in January, CH4 emissions were only slightly distributed in China’s southern border provinces, and from January to July, CH4 emissions gradually extended from south to north, covering most areas of the country in July, and CH4 emissions per unit area reached the highest. Since then, it began to fade from north to south from July and August to December, and only a small amount was distributed in the southern border areas, such as the Yunnan and Hainan provinces in December. The main reason for this spatial distribution change is that the temperature, precipitation and vegetation growth in China have similar spatial distribution characteristics in different seasons. CH4 emissions from terrestrial ecosystems in China have seasonal spatial distribution characteristics during the year. From spring to winter, CH4 emissions show periodic spatial variation characteristics of “from south to north, from north to south”.
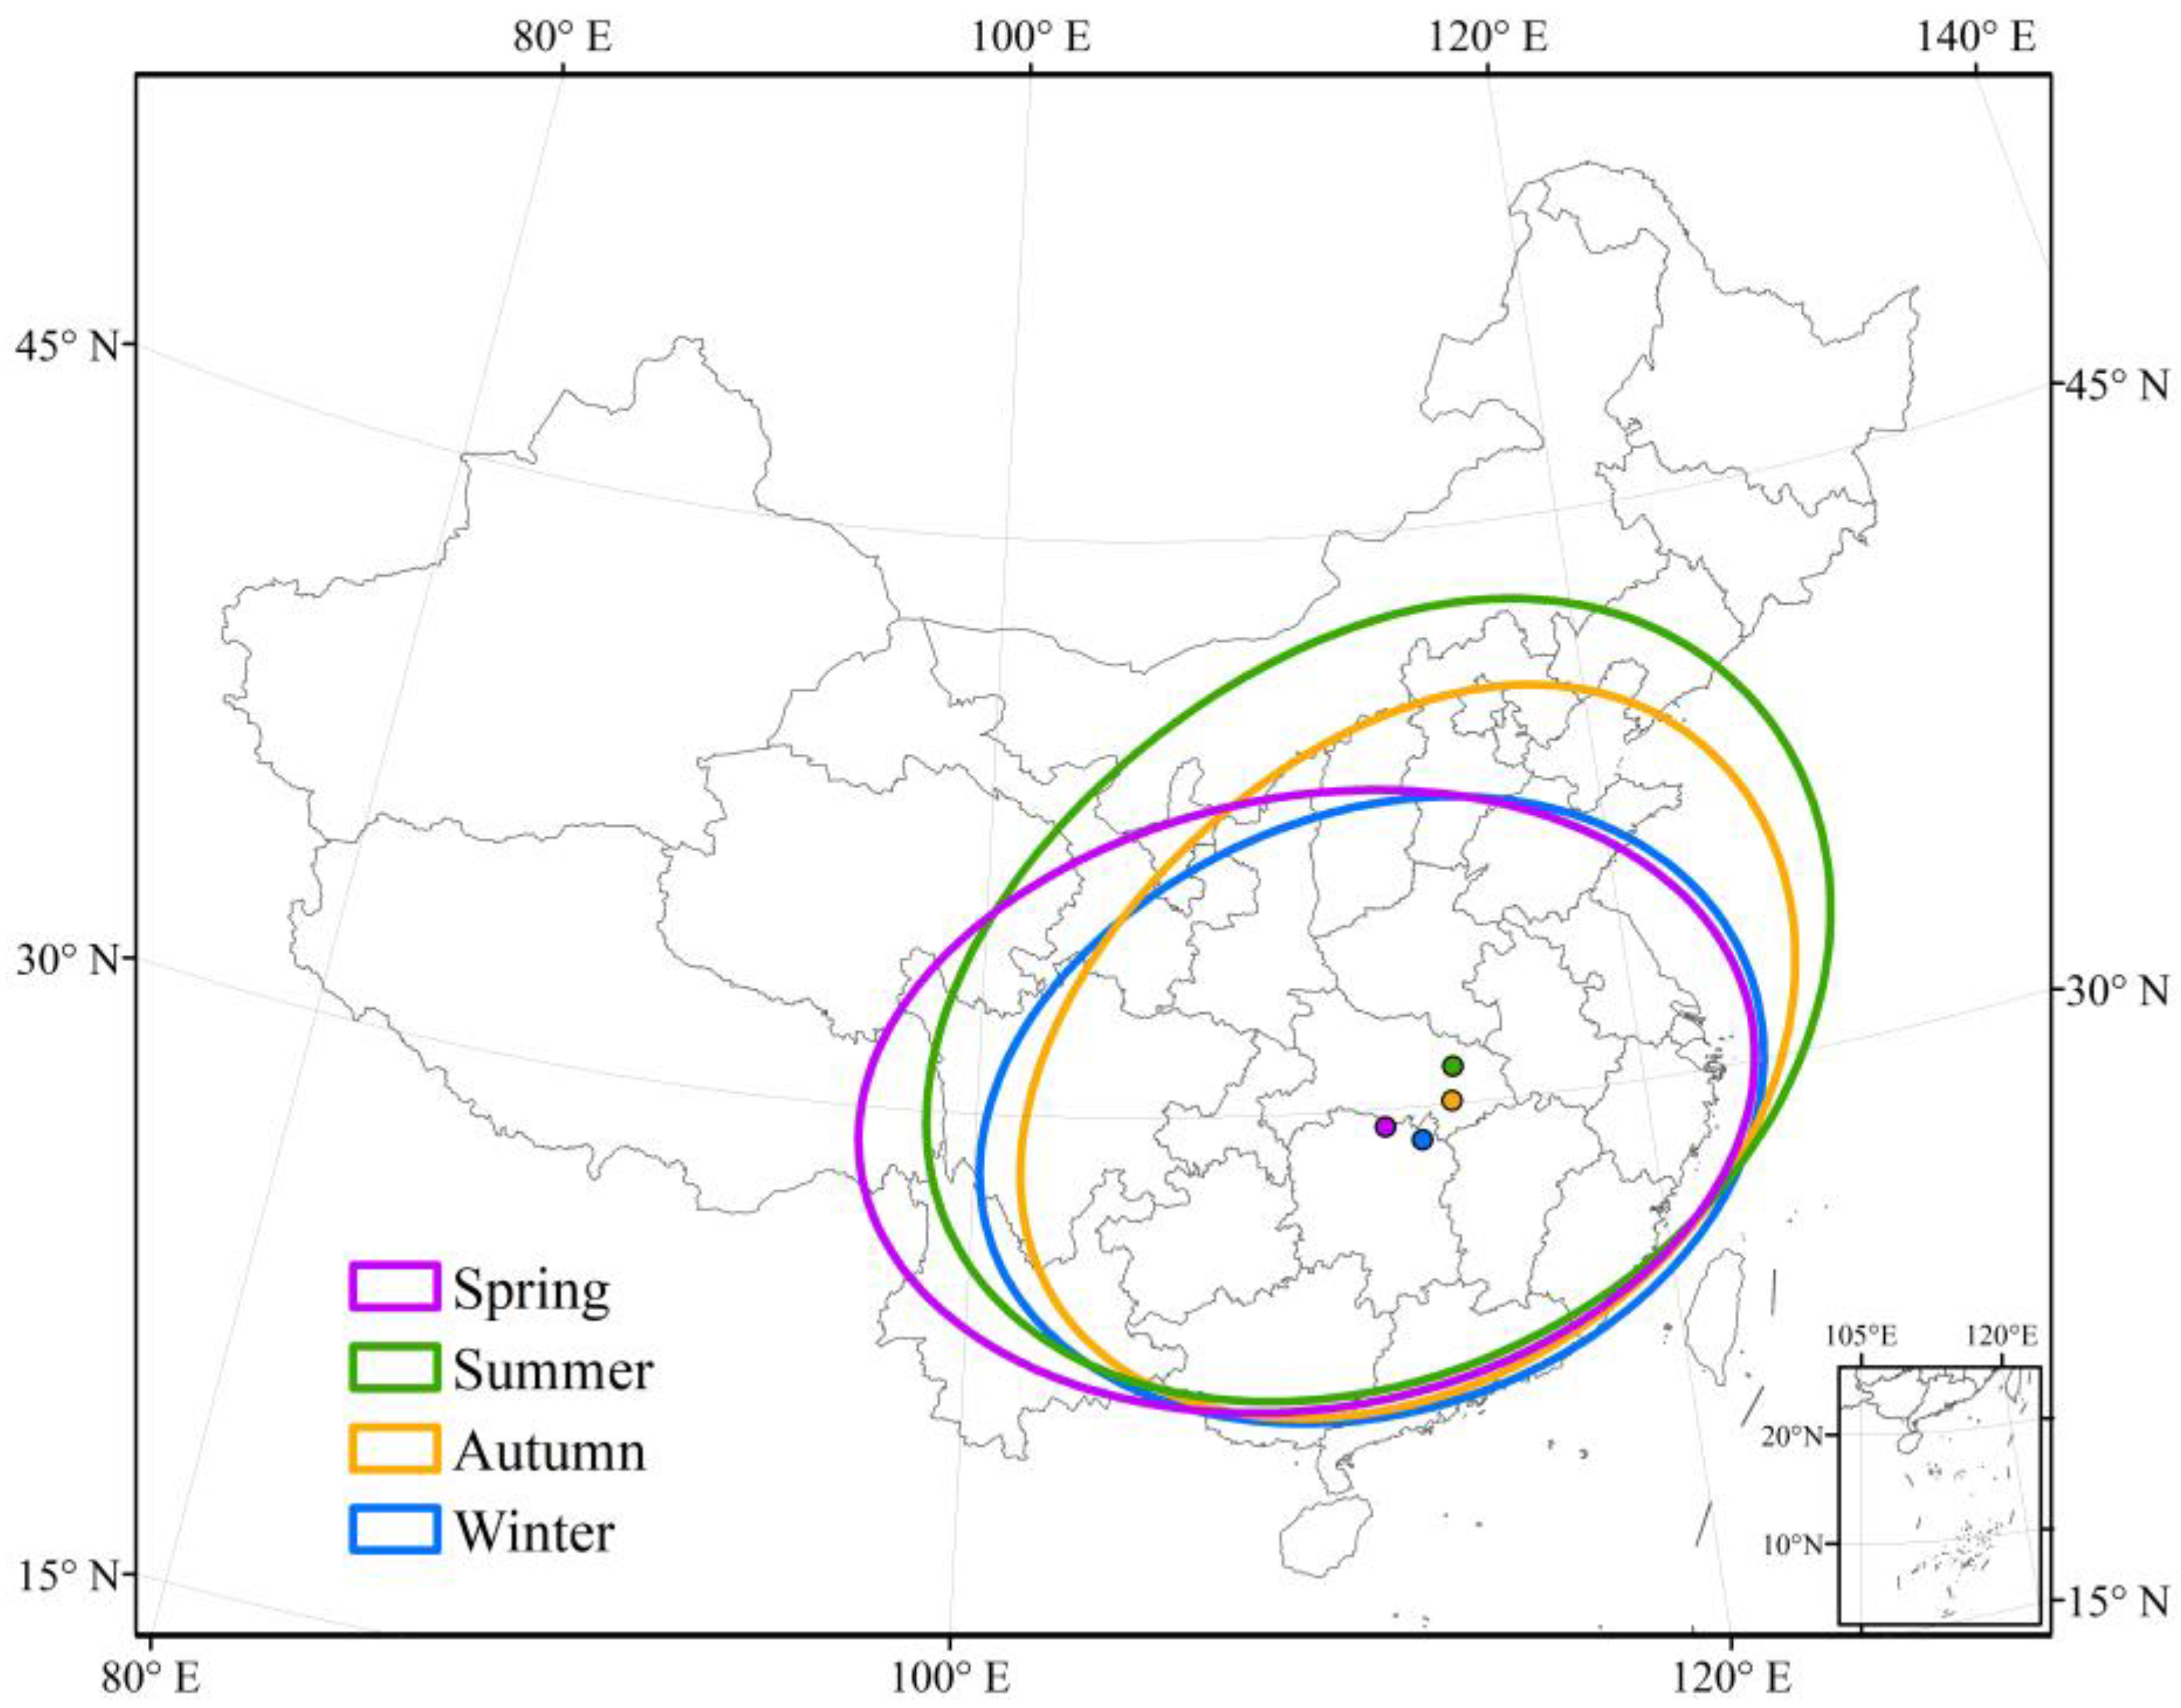
We plotted standard deviational ellipses of CH4 emissions from terrestrial ecosystems in China for each season as shown in Figure 6. From spring to summer, the center of the ellipse moves to the northeast, and the azimuth of the long axis of the ellipse decreases from 84.8–71.4°. This indicates that CH4 emissions from northern terrestrial ecosystems are increasing in summer and lead to a spatial distribution of CH4 emissions close to the “southwest-northeast” direction. At the same time, both the long and short axes of the ellipse are increasing, indicating that the distribution range of CH4 emissions is gradually becoming larger from spring to summer. From summer to autumn, the center of the ellipse began to move southward, and both the major axis and the minor axis of the ellipse began to decrease, indicating that the center of gravity of CH4 emissions from terrestrial ecosystems began to move southward, and the distribution range of CH4 emissions began to narrow. From autumn to winter, the center of the ellipse continues to move southward, and the long and short axes of the ellipse continue to decrease. This indicates that the range of terrestrial ecosystem CH4 emissions continues to shrink, and the center of gravity of terrestrial ecosystem CH4 emissions continues to shift southward.
4. Discussion
4.1. Relationship between Interannual Variation Trend of CH4 Emissions and Air Temperature
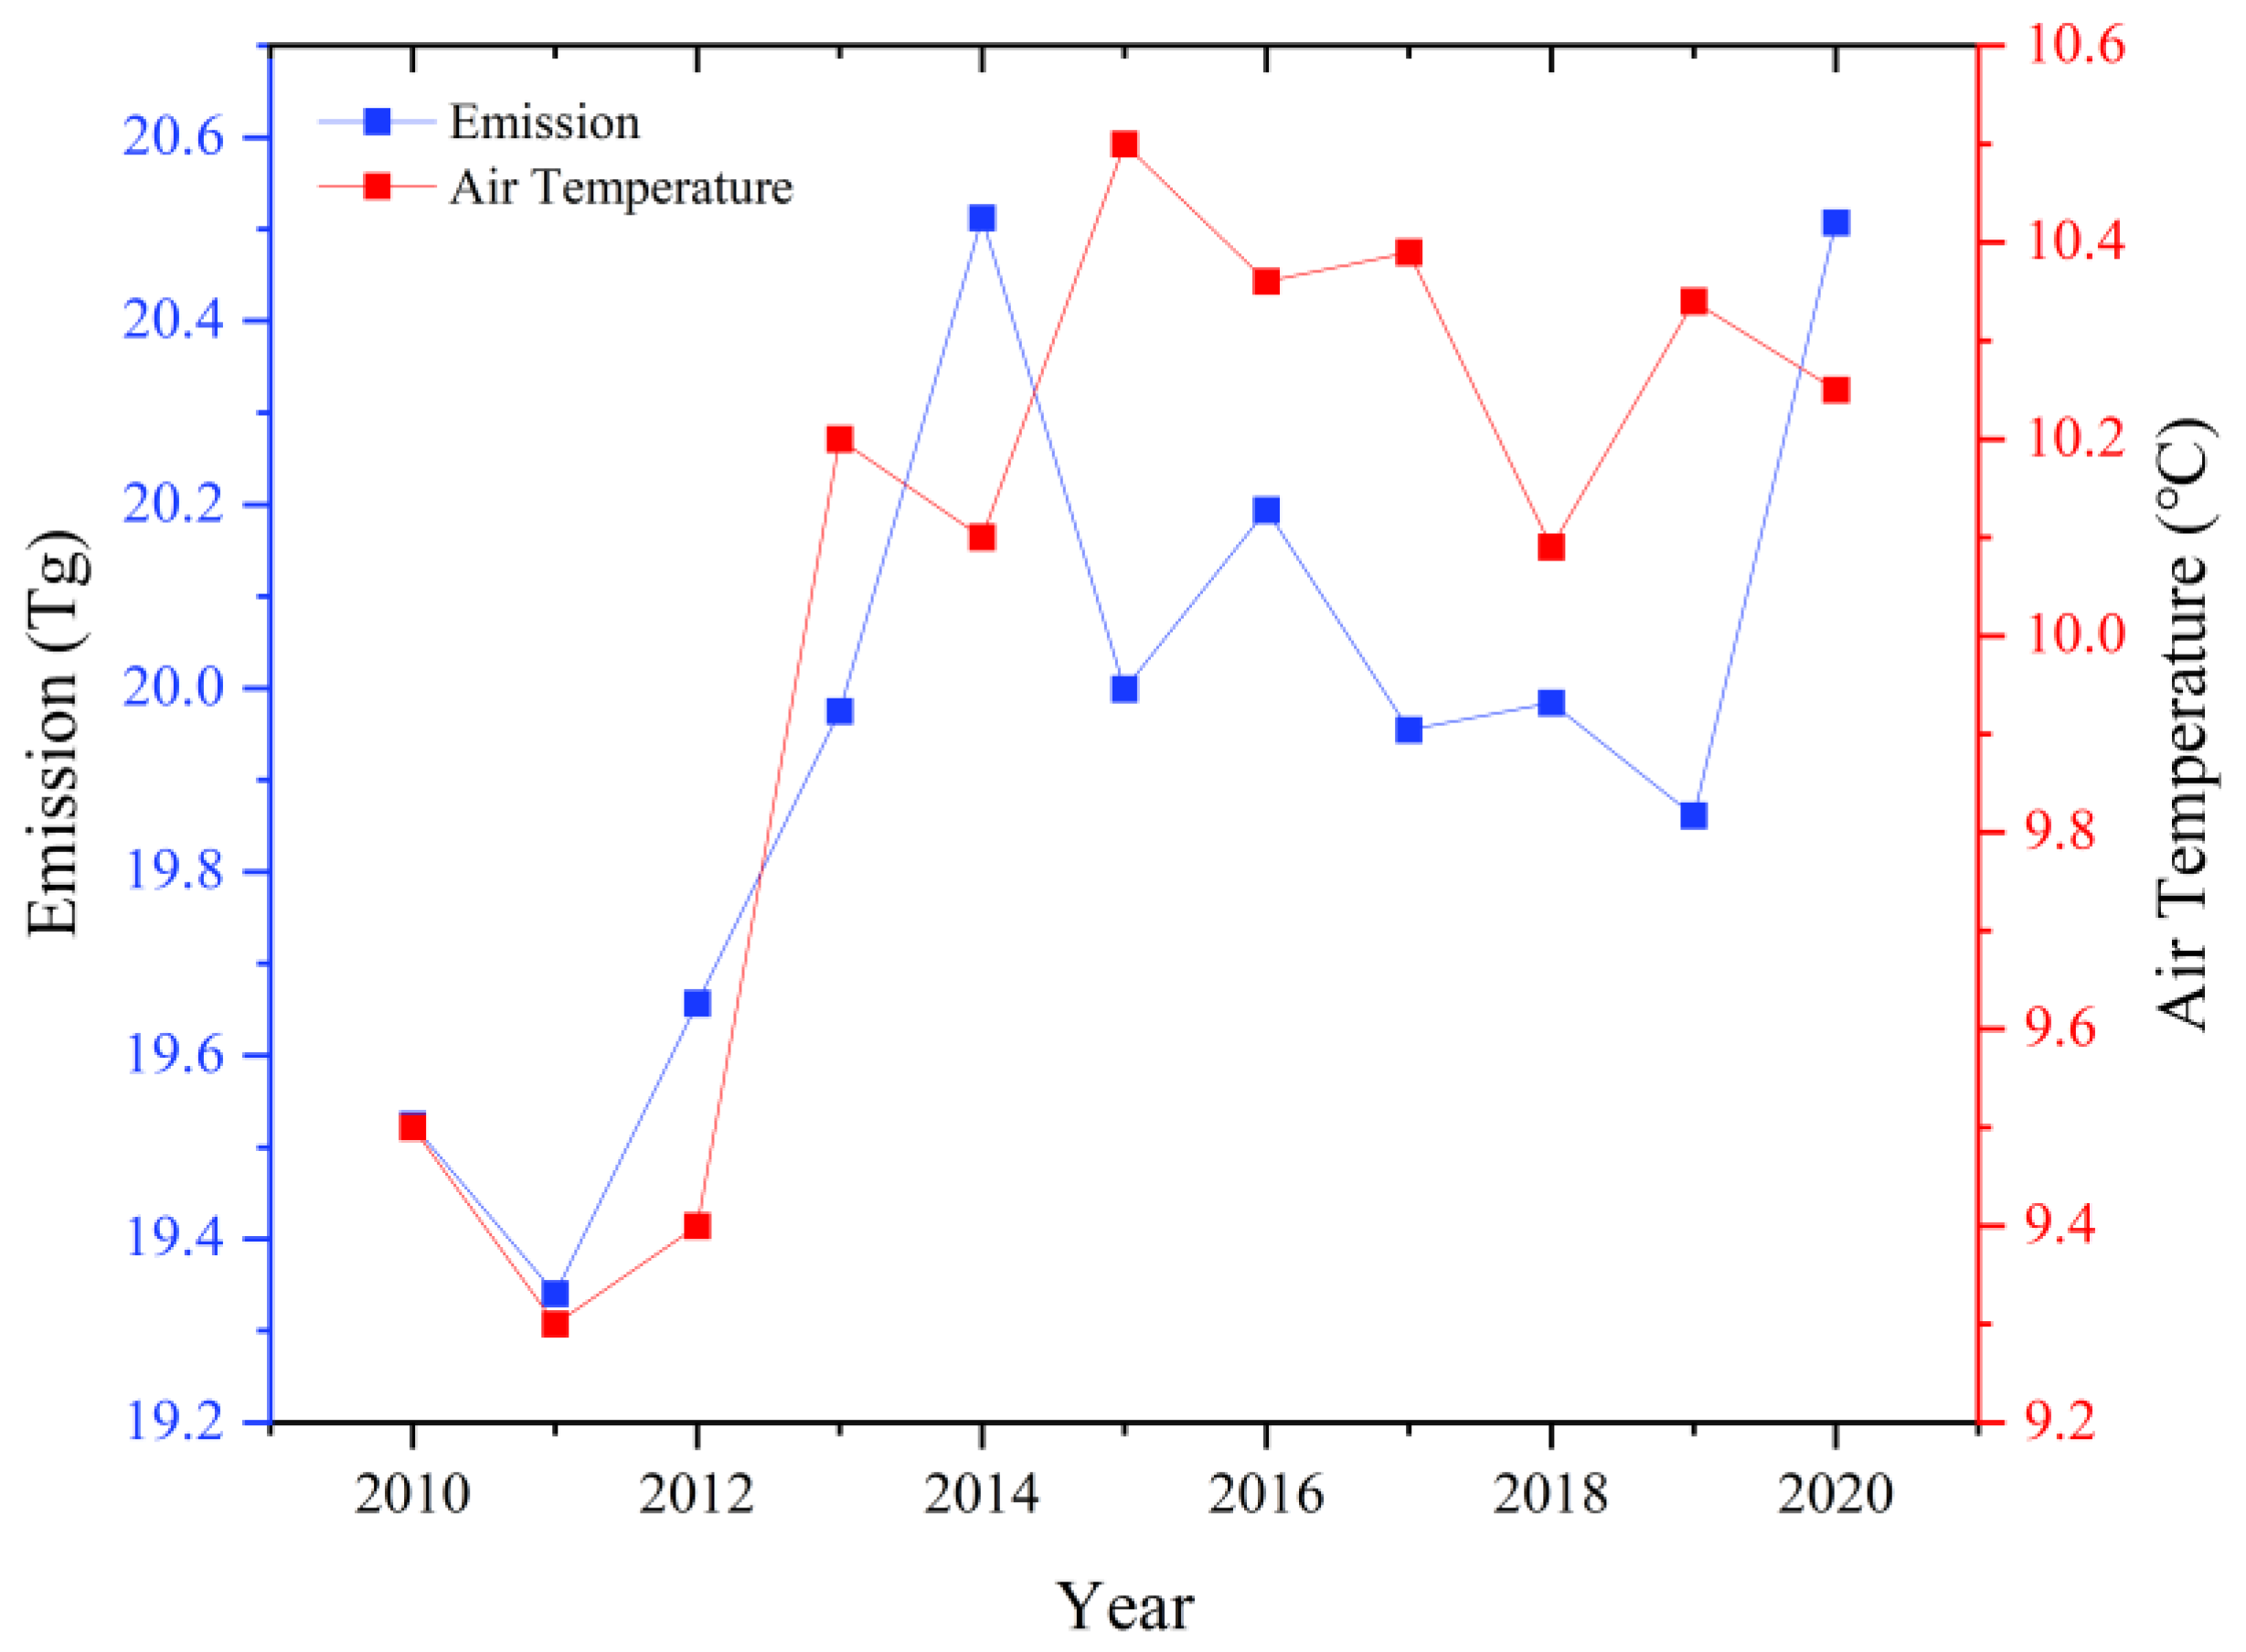
In this study, CH4 emissions from terrestrial ecosystems in China were estimated from 2010–2020, and the interannual trends are shown in Figure 7. It can be seen that the overall CH4 emissions from terrestrial ecosystems in China are increasing from 2010–2020, with CH4 emissions peaking in 2014 and 2020. CH4 emissions grew the fastest between 2011 and 2014, which is consistent with the trend of sustained and rapid increase in average air temperature in China from 2011–2014. The trends in annual mean air temperature in China from 2010–2020 are more consistent with the trends in CH4 emissions from terrestrial ecosystems in China. Overall, the higher the temperature, the higher the CH4 emissions from terrestrial ecosystems. The Pearson correlation coefficient r was calculated for these two sets of data, and an r of 0.70 was obtained, indicating that the CH4 emissions from terrestrial ecosystems in China from 2010–2020 were highly linearly correlated with the annual mean air temperature.
4.2. Comparison with the Results of Other Studies
The results of CH4 emissions from the three major sources of terrestrial ecosystems (vegetation, wetlands and rice) estimated in this study are compared with the results of The People’s Republic of China Second Biennial Update Report on Climate Change (CSBUR), Emissions Database for Global Atmospheric Research (EDGAR v5.0, EDGAR v6.0, EDGAR v7.0), The People’s Republic of China Third National Communication on Climate Change (CTNC) and other available studies.
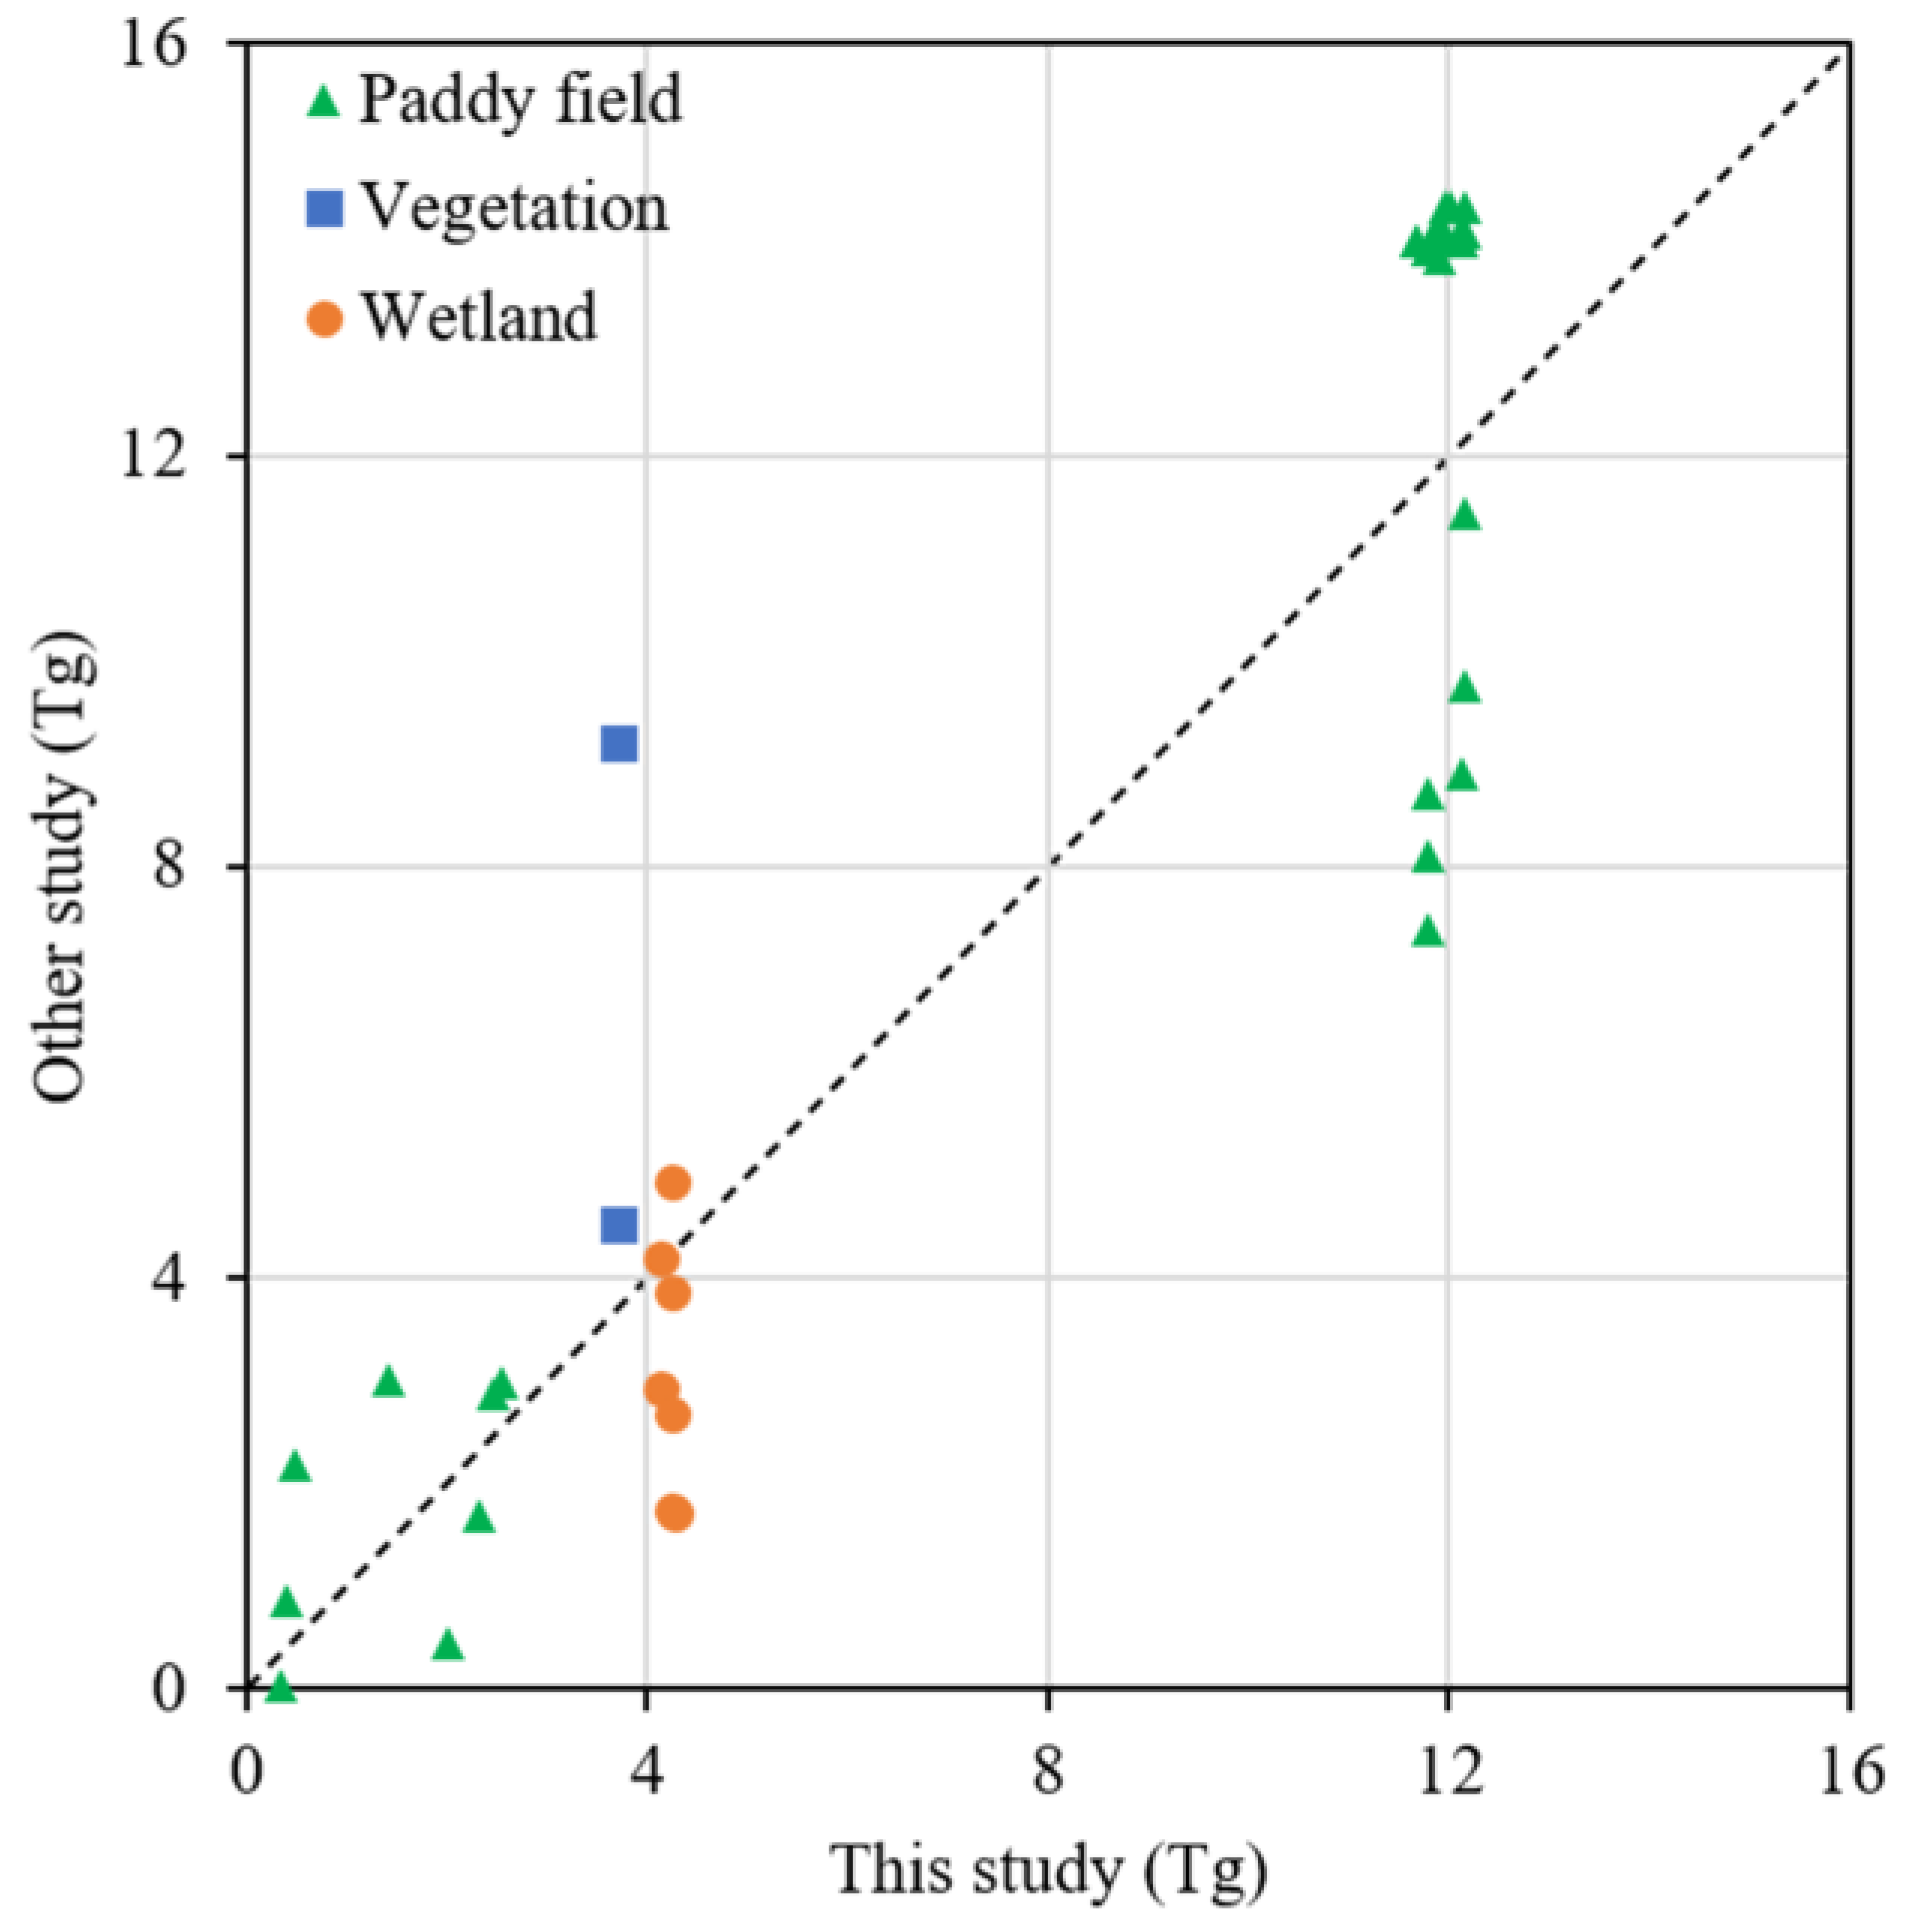
On the whole, the estimated results of this study are in good agreement with the research results of the Gong S and Shi Y (2021), EDGARv5.0, EDGARv6.0 and EDGARv7.0 data sets. The vegetation CH4 emissions in the 2015 results of this study were about 0.82 Tg lower than the vegetation CH4 emissions in the results of the study by Gong S and Shi Y (2021), and the rice CH4 emissions were about 0.71 Tg higher than the results of the study by Gong S, Shi Y (2021). The average annual CH4 emissions from paddy fields in the EDGAR data were about 14 Tg, which was about 2 Tg higher than the results of this study. The estimated CH4 emissions from wetlands by Huang et al. (2019) and Zhang et al. (2016) were 2.92 Tg (lower than 1.21 Tg in this study) and 4.90 Tg (0.65 Tg higher than in this study). The CH4 emissions of paddy fields from Huang et al. (2019) and EDGAR dataset were 9.77 Tg (lower than 2.38 Tg in this study) and 14.16 Tg (higher than 2.01 Tg in this study). Gong S and Shi Y (2021) conducted 20,000 Monte Carlo simulations to quantify the uncertainty of CH4 emission estimates for each emission source with 95% confidence intervals, and calculated emission ranges of 5.67–18.26, 1.98–7.31, and 2.34–6.29 for paddy fields, vegetation, and wetlands [19]. In this study, the method improved by Gong S and Shi Y (2021) is used to estimate CH4 emissions from vegetation, wetland and paddy fields. The results have higher temporal and spatial resolution, and the estimated results are also within the range of high reliability. As shown in Table 6, this study has comprehensive advantages over other existing studies in terms of spatiotemporal resolution and time series. A total of 40 validation data from other studies had an overall Pearson correlation coefficient of 0.91 with this study (Figure 8). In addition, this study is an emission estimation model based on pixel scale and monthly time scale, and the estimation results of this study are closer to the real situation than the traditional annual emission estimation models.
5. Conclusions
In this study, CH4 emissions from terrestrial ecosystems in China were estimated, and an inventory of CH4 emissions from gridded 0.05° spatial resolution monthly time scale terrestrial ecosystems was obtained. The inventory is in good agreement with the results of the latest emission inventory, and can be used to partly explain the temporal and spatial variation of atmospheric CH4 concentration in China. The average annual CH4 emissions from terrestrial ecosystems in China are estimated to be 19.955 Tg, of which 3.713 Tg, 4.285 Tg and 11.957 Tg are from vegetation, wetlands and paddy fields, respectively. The CH4 contribution of the three major emission sources is 18.61% (vegetation), 21.47% (wetlands) and 59.92% (paddy fields) respectively, and the paddy fields is the main emission source.
The regions with high CH4 emissions from terrestrial ecosystems in China are mainly located in the central, eastern and southeastern regions of China and show a decreasing trend from southeast to northwest. CH4 emission from vegetation is widely distributed, but the emission per unit area is relatively low. High value areas of vegetation CH4 emissions are mainly located in the southern part of China. The regions with high CH4 emissions from wetlands are mainly located in the Tibet, Heilongjiang and Qinghai provinces. CH4 emissions from rice are widely distributed in the south and northeast of China, in which the middle and lower reaches of the Yangtze River, Pearl River Delta and Chengdu Plain are the main emission areas in the south.
The interannual trends in CH4 emissions from terrestrial ecosystems in China are very similar to the trends in mean annual air temperature. The correlation coefficient between the two reaches 0.7, and CH4 emissions are high in years with high average annual temperatures. CH4 emissions from terrestrial ecosystems in China as a whole continue to increase over the period 2010–2020. CH4 emissions from terrestrial ecosystems in China have obvious seasonal variation characteristics. Emissions were the lowest in January, with an average of 0.248 Tg, and the highest in August, with an average of 3.602 Tg, about 14.5 times that of January. The overall emissions showed the seasonal characteristics of high in summer and autumn and low in spring and winter. Spatially, CH4 emissions extend northward from the south, covering almost the entire region of China by July, and then gradually fade from north to south. This is the spatial variation of CH4 emissions from terrestrial ecosystems in China during the year.
Our estimated CH4 emission inventory of Chinese terrestrial ecosystem with high temporal and spatial resolution is of great significance to the study of global CH4 budget, CH4 traceability, global temperature change, ecosystem carbon cycle in the context of global warming. The inclusion of termite emissions, soil uptake, and permafrost emissions could be considered in subsequent studies to further improve this emission inventory.
Author Contributions
Conceptualization, Y.Y. and Y.S.; formal analysis, Y.Y.; methodology, Y.S.; validation, Y.S.; writing—original draft, Y.Y.; writing—review and editing, Y.S. All authors have read and agreed to the published version of the manuscript.
Funding
This research was supported by National Key R&D Program of China (2021YFB3901000), the Pioneer Hundred Talents Program of the Chinese Academy of Sciences (Y8YR2200QM), National Natural Science Foundation of China (42071398) and NIES GOSAT-2 Project, Japan.
Institutional Review Board Statement
Not applicable.
Informed Consent Statement
Not applicable.
Data Availability Statement
The sources of data used in this article are detailed in the notes to Table 1. Annual average temperature data for China from China Greenhouse Gas Bulletin https://www.gov.cn/ (accessed on 25 June 2022).
Conflicts of Interest
The authors declare no conflict of interest.
References
- Saunois, M.; Stavert, A.R.; Poulter, B.; Bousquet, P.; Canadell, J.G.; Jackson, R.B.; Raymond, P.A.; Dlugokencky, E.J.; Houweling, S.; Patra, P.K.; et al. The Global Methane Budget 2000–2017. Earth Syst. Sci. Data 2020, 12, 1561–1623. [Google Scholar] [CrossRef]
- IPCC. IPCC Climate Change 2013: The Physical Science Basis. Contribution of Working Group I to the Fifth Assessment Report of the Intergovernmental Panel on Climate Change; Cambridge University Press: Cambridge, UK, 2013. [Google Scholar]
- WMO Greenhouse Gas Bulletin (GHG Bulletin). No.16: The State of Greenhouse Gases in the Atmosphere Based on Global Observations through 2019; World Meteorological Organization: Geneva, Switzerland, 2020; Volume 16, p. 6. [Google Scholar]
- Shindell, D.T. Crop Yield Changes Induced by Emissions of Individual Climate-Altering Pollutants. Earth’s Future 2016, 4, 373–380. [Google Scholar] [CrossRef] [Green Version]
- West, J.J.; Smith, S.J.; Silva, R.A.; Naik, V.; Zhang, Y.; Adelman, Z.; Fry, M.M.; Anenberg, S.; Horowitz, L.W.; Lamarque, J.-F. Co-Benefits of Mitigating Global Greenhouse Gas Emissions for Future Air Quality and Human Health. Nat. Clim. Chang. 2013, 3, 885–889. [Google Scholar] [CrossRef] [Green Version]
- Wu, X.; Zhang, X.; Chuai, X.; Huang, X.; Wang, Z. Long-Term Trends of Atmospheric CH4 Concentration across China from 2002 to 2016. Remote Sens. 2019, 11, 538. [Google Scholar] [CrossRef] [Green Version]
- Zhang, G.; Xiao, X.; Dong, J.; Xin, F.; Zhang, Y.; Qin, Y.; Doughty, R.B.; Moore, B. Fingerprint of Rice Paddies in Spatial–Temporal Dynamics of Atmospheric Methane Concentration in Monsoon Asia. Nat. Commun. 2020, 11, 554. [Google Scholar] [CrossRef] [PubMed] [Green Version]
- Zhang, X.; Zhang, X.; Zhu, Q.; Jiang, H.; Li, X.; Cheng, M. Spatial distribution simulation and the climate effects of aerobic methane emissions from terrestrial plants in China. Acta Ecol. Sin. 2016, 36, 580–591. [Google Scholar]
- Xie, M.; Li, S.; Jiang, F.; Wang, T. Methane emissions from terrestrial plants over China and their effects on methane concentrations in lower troposphere. Chin. Sci. Bull. 2008, 54, 2365–2370. [Google Scholar] [CrossRef] [Green Version]
- Ding, W.; Cai, Z.; Wang, D. Preliminary Budget of Methane Emissions from Natural Wetlands in China. Atmos. Environ. 2004, 38, 751–759. [Google Scholar] [CrossRef]
- Ding, W.-X.; Cai, Z.-C. Methane Emission from Natural Wetlands in China: Summary of Years 1995–2004 Studies. Pedosphere 2007, 17, 475–486. [Google Scholar] [CrossRef]
- Zhang, X.; Jiang, H. Spatial Variations in Methane Emissions from Natural Wetlands in China. Int. J. Environ. Sci. Technol. 2014, 11, 77–86. [Google Scholar] [CrossRef] [Green Version]
- Zhang, G.; Xiao, X.; Biradar, C.M.; Dong, J.; Qin, Y.; Menarguez, M.A.; Zhou, Y.; Zhang, Y.; Jin, C.; Wang, J.; et al. Spatiotemporal Patterns of Paddy Rice Croplands in China and India from 2000 to 2015. Sci. Total Environ. 2017, 579, 82–92. [Google Scholar] [CrossRef]
- Fu, C.; Yu, G. Estimation and Spatiotemporal Analysis of Methane Emissions from Agriculture in China. Environ. Manag. 2010, 46, 618–632. [Google Scholar] [CrossRef] [PubMed]
- Zhang, B.; Chen, G.Q. Methane Emissions in China 2007. Renew. Sustain. Energy Rev. 2014, 30, 886–902. [Google Scholar] [CrossRef]
- Peng, S.; Piao, S.; Bousquet, P.; Ciais, P.; Li, B.; Lin, X.; Tao, S.; Wang, Z.; Zhang, Y.; Zhou, F. Inventory of Anthropogenic Methane Emissions in Mainland China from 1980 to 2010. Atmos. Chem. Phys. 2016, 16, 14545–14562. [Google Scholar] [CrossRef] [Green Version]
- Ito, A.; Tohjima, Y.; Saito, T.; Umezawa, T.; Hajima, T.; Hirata, R.; Saito, M.; Terao, Y. Methane Budget of East Asia, 1990–2015: A Bottom-up Evaluation. Sci. Total Environ. 2019, 676, 40–52. [Google Scholar] [CrossRef]
- Huang, M.; Wang, T.; Zhao, X.; Xie, X.; Wang, D. Estimation of atmospheric methane emissions and its spatial distribution in China during 2015. Acta Sci. Circumst. 2019, 39, 1371–1380. [Google Scholar]
- Gong, S.; Shi, Y. Evaluation of Comprehensive Monthly-Gridded Methane Emissions from Natural and Anthropogenic Sources in China. Sci. Total Environ. 2021, 784, 147116. [Google Scholar] [CrossRef]
- Crippa, M.; Solazzo, E.; Huang, G.; Guizzardi, D.; Koffi, E.; Muntean, M.; Schieberle, C.; Friedrich, R.; Janssens-Maenhout, G. High Resolution Temporal Profiles in the Emissions Database for Global Atmospheric Research. Sci. Data 2020, 7, 121. [Google Scholar] [CrossRef] [Green Version]
- Ma, K.; You, L.; Liu, J.; Zhang, M. A Hybrid Wetland Map for China: A Synergistic Approach Using Census and Spatially Explicit Datasets. PLoS ONE 2012, 7, e47814. [Google Scholar] [CrossRef] [Green Version]
- Keppler, F.; Hamilton, J.T.G.; Braß, M.; Röckmann, T. Methane Emissions from Terrestrial Plants under Aerobic Conditions. Nature 2006, 439, 187–191. [Google Scholar] [CrossRef]
- Parsons, A.J.; Newton, P.C.D.; Clark, H.; Kelliher, F.M. Scaling Methane Emissions from Vegetation. Trends Ecol. Evol. 2006, 21, 423–424. [Google Scholar] [CrossRef]
- Yan, X.; Ohara, T.; Akimoto, H. Development of Region-Specific Emission Factors and Estimation of Methane Emission from Rice Fields in the East, Southeast and South Asian Countries. Glob. Chang. Biol. 2003, 9, 237–254. [Google Scholar] [CrossRef]
- European Commission, Joint Research Centre (EC-JRC)/Netherlands Environmental Assessment Agency (PBL). Emissions Database for Global Atmospheric Research (EDGAR), Release EDGAR v6.0_GHG (1970–2018) of May 2021. Available online: https://edgar.jrc.ec.europa.eu/dataset_ghg60 (accessed on 25 October 2022).
- European Commission, Joint Research Centre (EC-JRC)/Netherlands Environmental Assessment Agency (PBL). Emissions Database for Global Atmospheric Research (EDGAR), Release EDGAR v5.0 (1970–2015) of November 2019. Available online: https://edgar.jrc.ec.europa.eu/overview.php?v=50_GHG (accessed on 25 October 2022).
- The People’s Republic of China Second Biennial Update Report on Climate Change. Available online: mee.gov.cn (accessed on 25 October 2022).
- Chen, H.; Zhu, Q.; Peng, C.; Wu, N.; Wang, Y.; Fang, X.; Jiang, H.; Xiang, W.; Chang, J.; Deng, X.; et al. Methane Emissions from Rice Paddies Natural Wetlands, and Lakes in China: Synthesis and New Estimate. Glob. Chang. Biol. 2013, 19, 19–32. [Google Scholar] [CrossRef]
- The People’s Republic of China Third National Communication on Climate Change. Available online: mee.gov.cn (accessed on 25 October 2022).
- Wei, D.; Wang, X. CH4 Exchanges of the Natural Ecosystems in China during the Past Three Decades: The Role of Wetland Extent and Its Dynamics. J. Geophys. Res. Biogeosci. 2016, 121, 2445–2463. [Google Scholar] [CrossRef]
- European Commission, Joint Research Centre (EC-JRC)/Netherlands Environmental Assessment Agency (PBL). Emissions Database for Global Atmospheric Research (EDGAR), Release EDGAR v7.0_FT2021_GHG (1970–2021) of September 2022. Available online: https://edgar.jrc.ec.europa.eu/dataset_ghg70 (accessed on 25 October 2022).
Figure 1.
Main sources of CH4 emission from terrestrial ecosystem in China.

Figure 2.
Spatial distribution of terrestrial ecosystem CH4 emission in China.

Figure 3.
(a) Map of CH4 emissions from vegetation; (b) Map of CH4 emissions from wetland; (c) Map of CH4 emissions from paddy fields.
Figure 3.
(a) Map of CH4 emissions from vegetation; (b) Map of CH4 emissions from wetland; (c) Map of CH4 emissions from paddy fields.

Figure 4.
(a) Monthly CH4 emissions from terrestrial ecosystems; (b) Monthly CH4 emissions from vegetation; (c) Monthly CH4 emissions from wetland; (d) Monthly CH4 emissions from paddy fields.
Figure 4.
(a) Monthly CH4 emissions from terrestrial ecosystems; (b) Monthly CH4 emissions from vegetation; (c) Monthly CH4 emissions from wetland; (d) Monthly CH4 emissions from paddy fields.

Figure 5.
(a–l) Monthly CH4 emission distribution map of terrestrial ecosystem in China.

Figure 6.
Standard deviational ellipse of seasonal variation of CH4 emission from terrestrial ecosystem in China.
Figure 6.
Standard deviational ellipse of seasonal variation of CH4 emission from terrestrial ecosystem in China.

Figure 7.
Annual methane emission from terrestrial ecosystem and average Air Temperature in China. (China’s average Air Temperature data come from China Climate Bulletin from 2010–2020).
Figure 7.
Annual methane emission from terrestrial ecosystem and average Air Temperature in China. (China’s average Air Temperature data come from China Climate Bulletin from 2010–2020).

Figure 8.
The comparison with other studies. Other research data in the figure come from: EDGAR v6.0 [25]; EDGAR v5.0 [26]; Gong et al. (2021) [19]; Huang et al. (2019) [18]; CSBUR [27]; Chen et al. (2013) [28]; Peng et al. (2016) [16]; CTNC [29]; Zhang et al. (2014) [12]; Wei et al. (2016) [30]; EDGAR v7.0 [31].


Table 1.
Data used to estimate CH4 emissions in this study.
| Data Set | Required Data | Information |
|---|---|---|
| MODIS/Terra Land-Surface Temperature/Emissivity | Surface temperature 1 | 0.05° × 0.05°, 2010–2020, monthly |
| MODIS/Terra + Aqua Land Cover Type L3 | Land cover type 2 | 0.05° × 0.05°, 2010–2020, yearly |
| MODIS/Terra Vegetation Indices L3 | NDVI 3 | 0.05° × 0.05°, 2010–2020, monthly |
| GPCP (Global Precipitation Climatology Project) | Rainfall 4 | 2.5° × 2.5°, 2010–2020, monthly |
| MODIS/Terra Net Primary Production Gap-Filled L4 | Net Primary Production 5 | 500 m × 500 m, 2010–2020, yearly |
| Spatial distribution map of wetlands in China | Wetland map 6 | 1 km × 1 km, 2000 |
| Sunshine hours data in China | Sunshine hours 7 | 0.05° × 0.05°, 2010–2020, monthly |
| Remote sensing monitoring data set of land use status and farmland ripening system in China | Crop type 8 | 1 km × 1 km, 2015 |
1 From MOD11C3 https://ladsweb.modaps.eosdis.nasa.gov/ (accessed on 20 December 2021); 2 From MCD12C1 https://ladsweb.modaps.eosdis.nasa.gov/ (accessed on 21 December 2021); 3 From MOD13C2 https://ladsweb.modaps.eosdis.nasa.gov/ (accessed on 20 December 2021); 4 From Global Precipitation Climatology Project https://www.ncei.noaa.gov/data/ (accessed on 21 December 2021); 5 From MOD17A3HGF v061 https://ladsweb.modaps.eosdis.nasa.gov/ (accessed on 15 March 2022); 6 From [21]; 7 This data is generated by spatial interpolation from the sunshine hours data of surface meteorological stations. Sunshine hours data come from China Meteorological Science data Center https://data.cma.cn/ (accessed on 22 March 2022); 8 From Resource and Environmental Science and data Center of the Chinese Academy of Sciences http://www.resdc.cn/Default.aspx (accessed on 25 March 2022).
Table 2.
Conversion factors between leaf biomass and biomass and biomass and NPP for different vegetation types in China.
Table 2.
Conversion factors between leaf biomass and biomass and biomass and NPP for different vegetation types in China.
| Vegetation Type | ||
|---|---|---|
| Coniferous forest | 0.069 | 9.478 |
| Broadleaf forests | 0.055 | 7.5 |
| Mixed forest | 0.063 | 8.06 |
| Shrubs | 0.142 | 2.633 |
| Grassland | 0.341 | 2.017 |
| Sparse vegetation | 0.112 | 2.0 |
The data in the table are from the literature [8].
Table 3.
CH4 Emission factors and area of different types of wetlands in China.
| Wetland Type | Area (km2) | ER (mg CH4 m−2 h−1) |
|---|---|---|
| Freshwater marsh | 24,977 | 0.663 × T + 2.227 × P − 7.342 |
| Peatland | 42,349 | 2.96 |
| Swamp | 2561 | 0.05 |
| Salt marsh | 24,086 | 0 |
In the table T is the surface temperature and P is the rainfall. The data in the table were obtained from the literature [10].
Table 4.
CH4 emission factor (ER) of different ripening rice in different provinces of China.
| Province | Paddy Field ER (kg CH4 hm−2 d−1) | Province | Paddy Field ER (kg CH4 hm−2 d−1) | ||||
|---|---|---|---|---|---|---|---|
| Early Rice | Late Rice | Double Season Rice | Early Rice | Late Rice | Double Season Rice | ||
| Beijing | -- | -- | 1.26 | Hubei | 2.06 | 3.9 | 2.06 |
| Tianjin | -- | -- | 1.08 | Hunan | 1.73 | 3.41 | 1.73 |
| Hebei | -- | -- | 1.46 | Guangdong | 1.77 | 5.16 | 1.77 |
| Shanxi | -- | -- | 0.63 | Guangxi | 1.46 | 4.91 | 1.46 |
| Inner Mongolia | -- | -- | 0.85 | Hainan | 1.58 | 4.94 | 1.58 |
| Liaoning | -- | -- | 0.88 | Chongqing | 0.77 | 1.85 | 0.77 |
| Jilin | -- | -- | 0.53 | Sichuan | 0.77 | 1.85 | 0.77 |
| Heilongjiang | -- | -- | 0.79 | Guizhou | 0.6 | 2.1 | 0.6 |
| Shanghai | 1.46 | 2.75 | 1.46 | Yunnan | 0.28 | 0.76 | 0.28 |
| Jiangsu | 1.89 | 2.76 | 1.89 | Tibet | -- | -- | 0.65 |
| Zhejiang | 1.69 | 3.45 | 1.69 | Shaanxi | -- | -- | 1.19 |
| Anhui | 1.97 | 2.76 | 1.97 | Gansu | -- | -- | 0.65 |
| Fujian | 0.91 | 5.26 | 0.91 | Qinghai | -- | -- | -- |
| Jiangxi | 1.82 | 4.58 | 1.82 | Ningxia | -- | -- | 0.7 |
| Shandong | -- | -- | 2.0 | Xinjiang | -- | -- | 1 |
| Henan | -- | -- | 1.7 | ||||
Table 5.
Monthly and total CH4 emissions from terrestrial ecosystems in China, 2010–2020.
| Jan. | Feb. | Mar. | Apr. | May. | Jun. | Jul. | Aug. | Sep. | Oct. | Nov. | Dec. | Total | |
|---|---|---|---|---|---|---|---|---|---|---|---|---|---|
| 2010 | 0.262 | 0.320 | 0.760 | 0.968 | 1.367 | 2.293 | 3.535 | 3.585 | 3.182 | 2.575 | 0.381 | 0.300 | 19.530 |
| 2011 | 0.177 | 0.293 | 0.675 | 1.013 | 1.334 | 2.375 | 3.527 | 3.599 | 3.125 | 2.559 | 0.409 | 0.249 | 19.335 |
| 2012 | 0.197 | 0.252 | 0.774 | 1.105 | 1.415 | 2.397 | 3.562 | 3.599 | 3.118 | 2.597 | 0.375 | 0.262 | 19.653 |
| 2013 | 0.242 | 0.301 | 0.872 | 1.070 | 1.450 | 2.509 | 3.612 | 3.556 | 3.091 | 2.573 | 0.409 | 0.290 | 19.977 |
| 2014 | 0.310 | 0.304 | 0.911 | 1.202 | 1.452 | 2.468 | 3.662 | 3.640 | 3.229 | 2.632 | 0.426 | 0.273 | 20.510 |
| 2015 | 0.259 | 0.302 | 0.838 | 1.140 | 1.418 | 2.442 | 3.527 | 3.603 | 3.144 | 2.681 | 0.387 | 0.255 | 19.996 |
| 2016 | 0.255 | 0.302 | 0.845 | 1.166 | 1.443 | 2.507 | 3.595 | 3.558 | 3.117 | 2.700 | 0.393 | 0.314 | 20.194 |
| 2017 | 0.271 | 0.314 | 0.768 | 1.027 | 1.356 | 2.245 | 3.388 | 3.571 | 3.303 | 3.037 | 0.387 | 0.286 | 19.955 |
| 2018 | 0.252 | 0.272 | 0.872 | 1.154 | 1.463 | 2.464 | 3.585 | 3.628 | 3.083 | 2.545 | 0.403 | 0.262 | 19.984 |
| 2019 | 0.236 | 0.294 | 0.853 | 1.156 | 1.364 | 2.444 | 3.565 | 3.609 | 3.103 | 2.534 | 0.406 | 0.297 | 19.861 |
| 2020 | 0.271 | 0.340 | 0.919 | 1.135 | 1.441 | 2.566 | 3.641 | 3.670 | 3.207 | 2.631 | 0.440 | 0.245 | 20.507 |
Table 6.
Comparison with other research results in spatiotemporal resolution and time series.
| Spatial Resolution | Time Resolution | Time Series | |
|---|---|---|---|
| This study | 0.05° × 0.05° | Month | 2010–2020 |
| EDGAR v7.0 [31] | 0.1° × 0.1° | Month | 1970–2021 |
| EDGAR v6.0 [25] | 0.1° × 0.1° | Month | 1970–2018 |
| EDGAR v5.0 [26] | 0.1° × 0.1° | Month | 1970–2015 |
| Gong et al. (2021) [19] | 0.05° × 0.05° | Month | 2015 |
| Huang et al. (2019) [18] | Province | Year | 2015 |
| Chen et al. (2013) [28] | Province | Year | 2008 |
| Peng et al. (2016) [16] | 0.1° × 0.1° | Year | 1980–2010 |
| Zhang et al. (2014) [12] | Province | Year | 2007 |
In Table 6, Province means that the research results are presented in provincial units.
Publisher’s Note: MDPI stays neutral with regard to jurisdictional claims in published maps and institutional affiliations. |
© 2022 by the authors. Licensee MDPI, Basel, Switzerland. This article is an open access article distributed under the terms and conditions of the Creative Commons Attribution (CC BY) license (https://creativecommons.org/licenses/by/4.0/).
Share and Cite
MDPI and ACS Style
Yang, Y.; Shi, Y. High Spatial and Temporal Resolution Methane Emissions Inventory from Terrestrial Ecosystems in China, 2010–2020. Atmosphere 2022, 13, 1966. https://doi.org/10.3390/atmos13121966
AMA Style
Yang Y, Shi Y. High Spatial and Temporal Resolution Methane Emissions Inventory from Terrestrial Ecosystems in China, 2010–2020. Atmosphere. 2022; 13(12):1966. https://doi.org/10.3390/atmos13121966
Chicago/Turabian StyleYang, Yongliang, and Yusheng Shi. 2022. "High Spatial and Temporal Resolution Methane Emissions Inventory from Terrestrial Ecosystems in China, 2010–2020" Atmosphere 13, no. 12: 1966. https://doi.org/10.3390/atmos13121966
Note that from the first issue of 2016, this journal uses article numbers instead of page numbers. See further details here.