Article

Compact Non-Dispersive Infrared Multi-Gas Sensing Platform for Large Scale Deployment with Sub-ppm Resolution

Senseair AB, Research Department, Färögatan 33, Kista, 16451 Stockholm, Sweden
*
Author to whom correspondence should be addressed.
Atmosphere 2022, 13(11), 1789; https://doi.org/10.3390/atmos13111789
Submission received: 31 August 2022 / Revised: 10 October 2022 / Accepted: 19 October 2022 / Published: 29 October 2022

Abstract

:
We report on a novel, cost-effective non-dispersive infrared (NDIR) multi-gas sensor aimed at environmental air pollution monitoring. The rugged design of the K96 sensor core combines highest compactness and low-power consumption with our unique multi-channel cell design, featuring the detection of up to three different gases simultaneously, including CO2, CH4, N2O, and H2O. Our sensing platform allows the selection of the target gases as well as the concentration ranges, thus providing highly customizable gas sensor systems targeting application-specific gas monitoring settings. The sensor core comes with an implemented calibration model, and can address in real time any cross-sensitivity between the NDIR gas-sensing channels. We provide an immensely versatile sensing system while ensuring high sensing stability combined with high precision (<0.1 ppm for both CO2 and N2O, <0.5 ppm for CH4). The K96 multi-gas sensor core offers a resilient sensor solution for the increasing demand of compact monitoring systems in the field of environmental monitoring at reasonable costs for medium-to-high volumes.

1. Introduction

Non-dispersive infrared (NDIR) gas sensing is a mature and well-proven technology achieving resolutions down to sub-ppm levels that has been utilized for several decades [1,2,3,4,5]. Today, this technique is implemented in numerous fields of application; however, real-time and precise detection of gaseous substances at reasonable costs is crucial. NDIR sensors have been used, for example, in the chemical and processing industry to monitor produced and/or emitted volatile by-products and in conventional heating ventilation and air condition (HVAC) systems to improve indoor air quality (AQ) while reducing energy consumption, as well as in manifold safety applications, such as in the mining industry [3,6,7,8]. New emerging markets have been explored by NDIR sensors, such as the automotive market to improve cabin air quality in vehicles and on-board alcohol screening to prevent alcohol-intoxicated persons from driving [7,9,10]. Recent advances in NDIR technology are attracting more and more attention in the environmental pollution monitoring domain, as its cost-effective, state-of-the-art sensors can facilitate the development of distributed gas-sensing networks to monitor greenhouse gases (GHG) fluxes, allowing to quantify the impact of natural but also anthropogenic emissions and verify the effect of implemented mitigation measures [11,12,13]. Published results indicate that a “dense” low-cost CO2 sensor network in urban settings can help to better quantify urban CO2 fluxes and verify mitigation strategies, as cities accounts for more than 70% of global anthropogenic CO2 emissions [14,15,16]. Beside the major contributor CO2, CH4 accounts for about 18% of the global net greenhouse gas emissions and has a global warming potential of 28 within a century, with a worrying increasing tendency [17,18]. Emitters are diverse and associated with agriculture and livestock farming, whereas other fugitive sources originate substantially from the oil & natural gas industry, as well as from landfills, wastewater treatment, and natural sources such as the permafrost melting [19,20,21,22,23,24]. Recent studies tend to show that anthropogenic CH4 emissions related to specific sectors are often underestimated, whereas current emission monitoring methodologies often rely on local and punctual studies with costly high precision instruments [25,26,27,28]. In this regard, cost-efficient, low maintenance, and ready-to-use NDIR sensor systems can facilitate a comprehensive assessment, identifying local hot spots such as “super emitters” and enhancing temporal and spatial resolution towards large-scale deployment in all aforementioned methane emitting scenarios [4,29,30,31,32]. Similar findings exist for N2O, which is the 3rd largest GHG emitted by human activities with a 100-year global warming potential 265 times higher than CO2 and whose anthropogenic emissions are mainly related to the waste and agricultural sectors [17,22].
In this paper we report on a novel NDIR sensor to bridge the gap between traditional and bulky but high-performance equipment with extensive acquisition and maintenance costs, and low-resolution sensors targeting only alarm concentration levels and known to suffer from drift, poor stability, cross-sensitivity, and limited lifetime sensors [33]. The advanced NDIR sensor design offers multi-gas sensing capabilities in a single optical cell, enhancing greatly available NDIR gas-sensing solutions. We present a novel, ready-to-market and compact, multi-spectral gas sensor system with sub-ppm resolution targeting a significant cost reduction of one order of magnitude lower than currently available commercial sensing systems with comparable specifications. Thus, we address the needs for low-cost monitoring of the major greenhouse gases.

2. Materials and Methods

2.1. NDIR Sensing Principle

The infrared (IR) spectral region, specifically the 2–20 µm region, corresponds to the presence of strong and distinct fundamental rotational-vibrational energy transitions of molecular gases and is, therefore, often referred to the ‘fingerprint’ region suitable for the identification and quantification of components in gas mixtures. As shown in Figure 1, the IR absorption spectrum of a gas species is thus usually characterized with several closely spaced absorption lines corresponding to each vibrational level associated with a set of rotational levels [4].
The strength of these absorption lines allows for the quantification of the concentration of a gas species. The relationship between optical absorption and gas concentration at a specific wavelength follows the Lambert–Beer law [34],
A bs ( λ ) = ε ( λ ) × c × L
where A bs ( λ ) is the absorption, ε is the molar attenuation coefficient of the gas species for the incoming wavelength λ, c is the molar concentration of the gas to be sensed, and L is the length of the optical pass.
Conventional NDIR gas-sensing systems exploit the absorption of electromagnetic radiation in the infrared wavelength region, i.e., absorption spectroscopy, as introduced above. A simplified version of a conventional NDIR sensor system consists of a light source, an incandescent lamp or light-emitting diode (LED), to expose the gas to IR light. Typically, this is performed within a sample cavity often referred as an optical cell, where the IR radiation is interacting with the analyte. Multiple configurations are realized, including the White Cell or Herriot Cell, utilizing mirrors at both ends of the sample cavity. In doing so, the IR radiation is propagating back and forth between both ends and enabling an extended optical pass length, while maintaining relatively confined physical dimensions. At the end of the optical pass, a wavelength selective bandpass filter in front of the detector allows only the fraction of IR radiation that interacts with the gas of interest to pass the filter, and thus, the signal intensity of the detector correlates with the concentration of the analyte within the sample cavity. The IR source is a crucial component in the sensor system. Typically, a cost-effective broadband IR source is utilized in conventional NDIR sensor systems, such as an incandescent light bulb. However, this approach suffers from optical inefficiency as the major fraction of generated optical power remains unexploited. To address this drawback, we utilized a larger fraction of generated broadband spectrum for detecting more than a single gas.

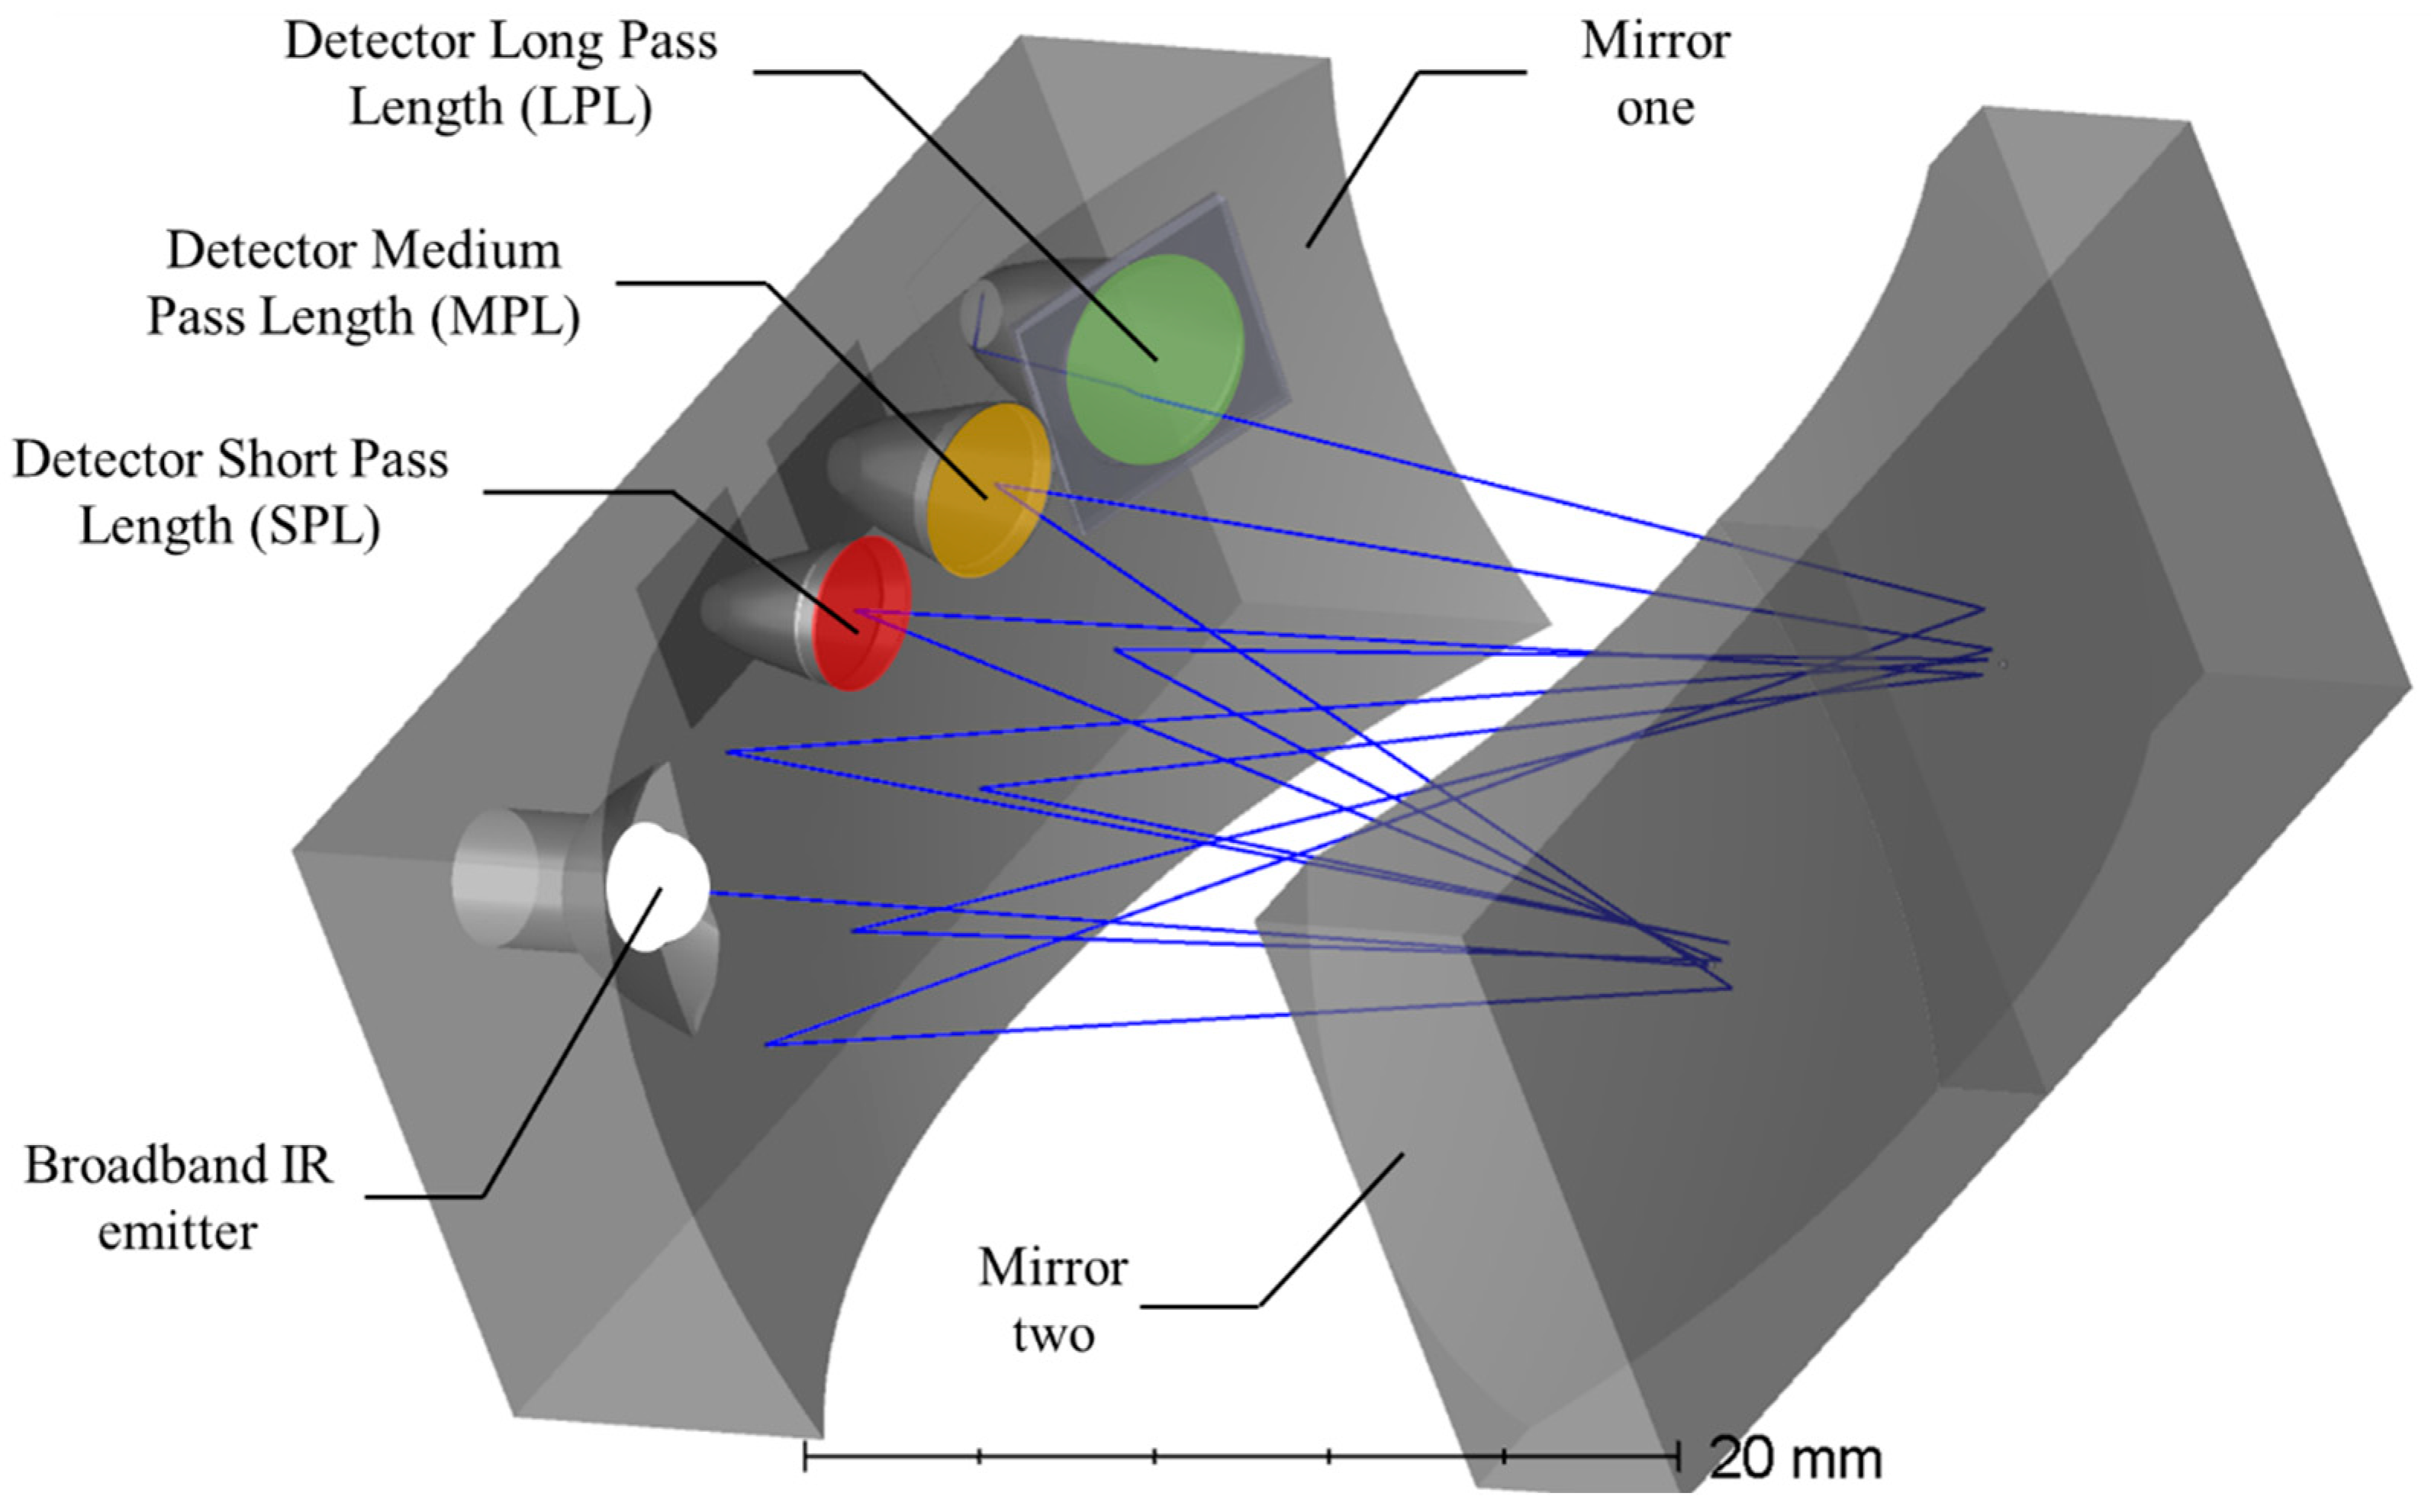
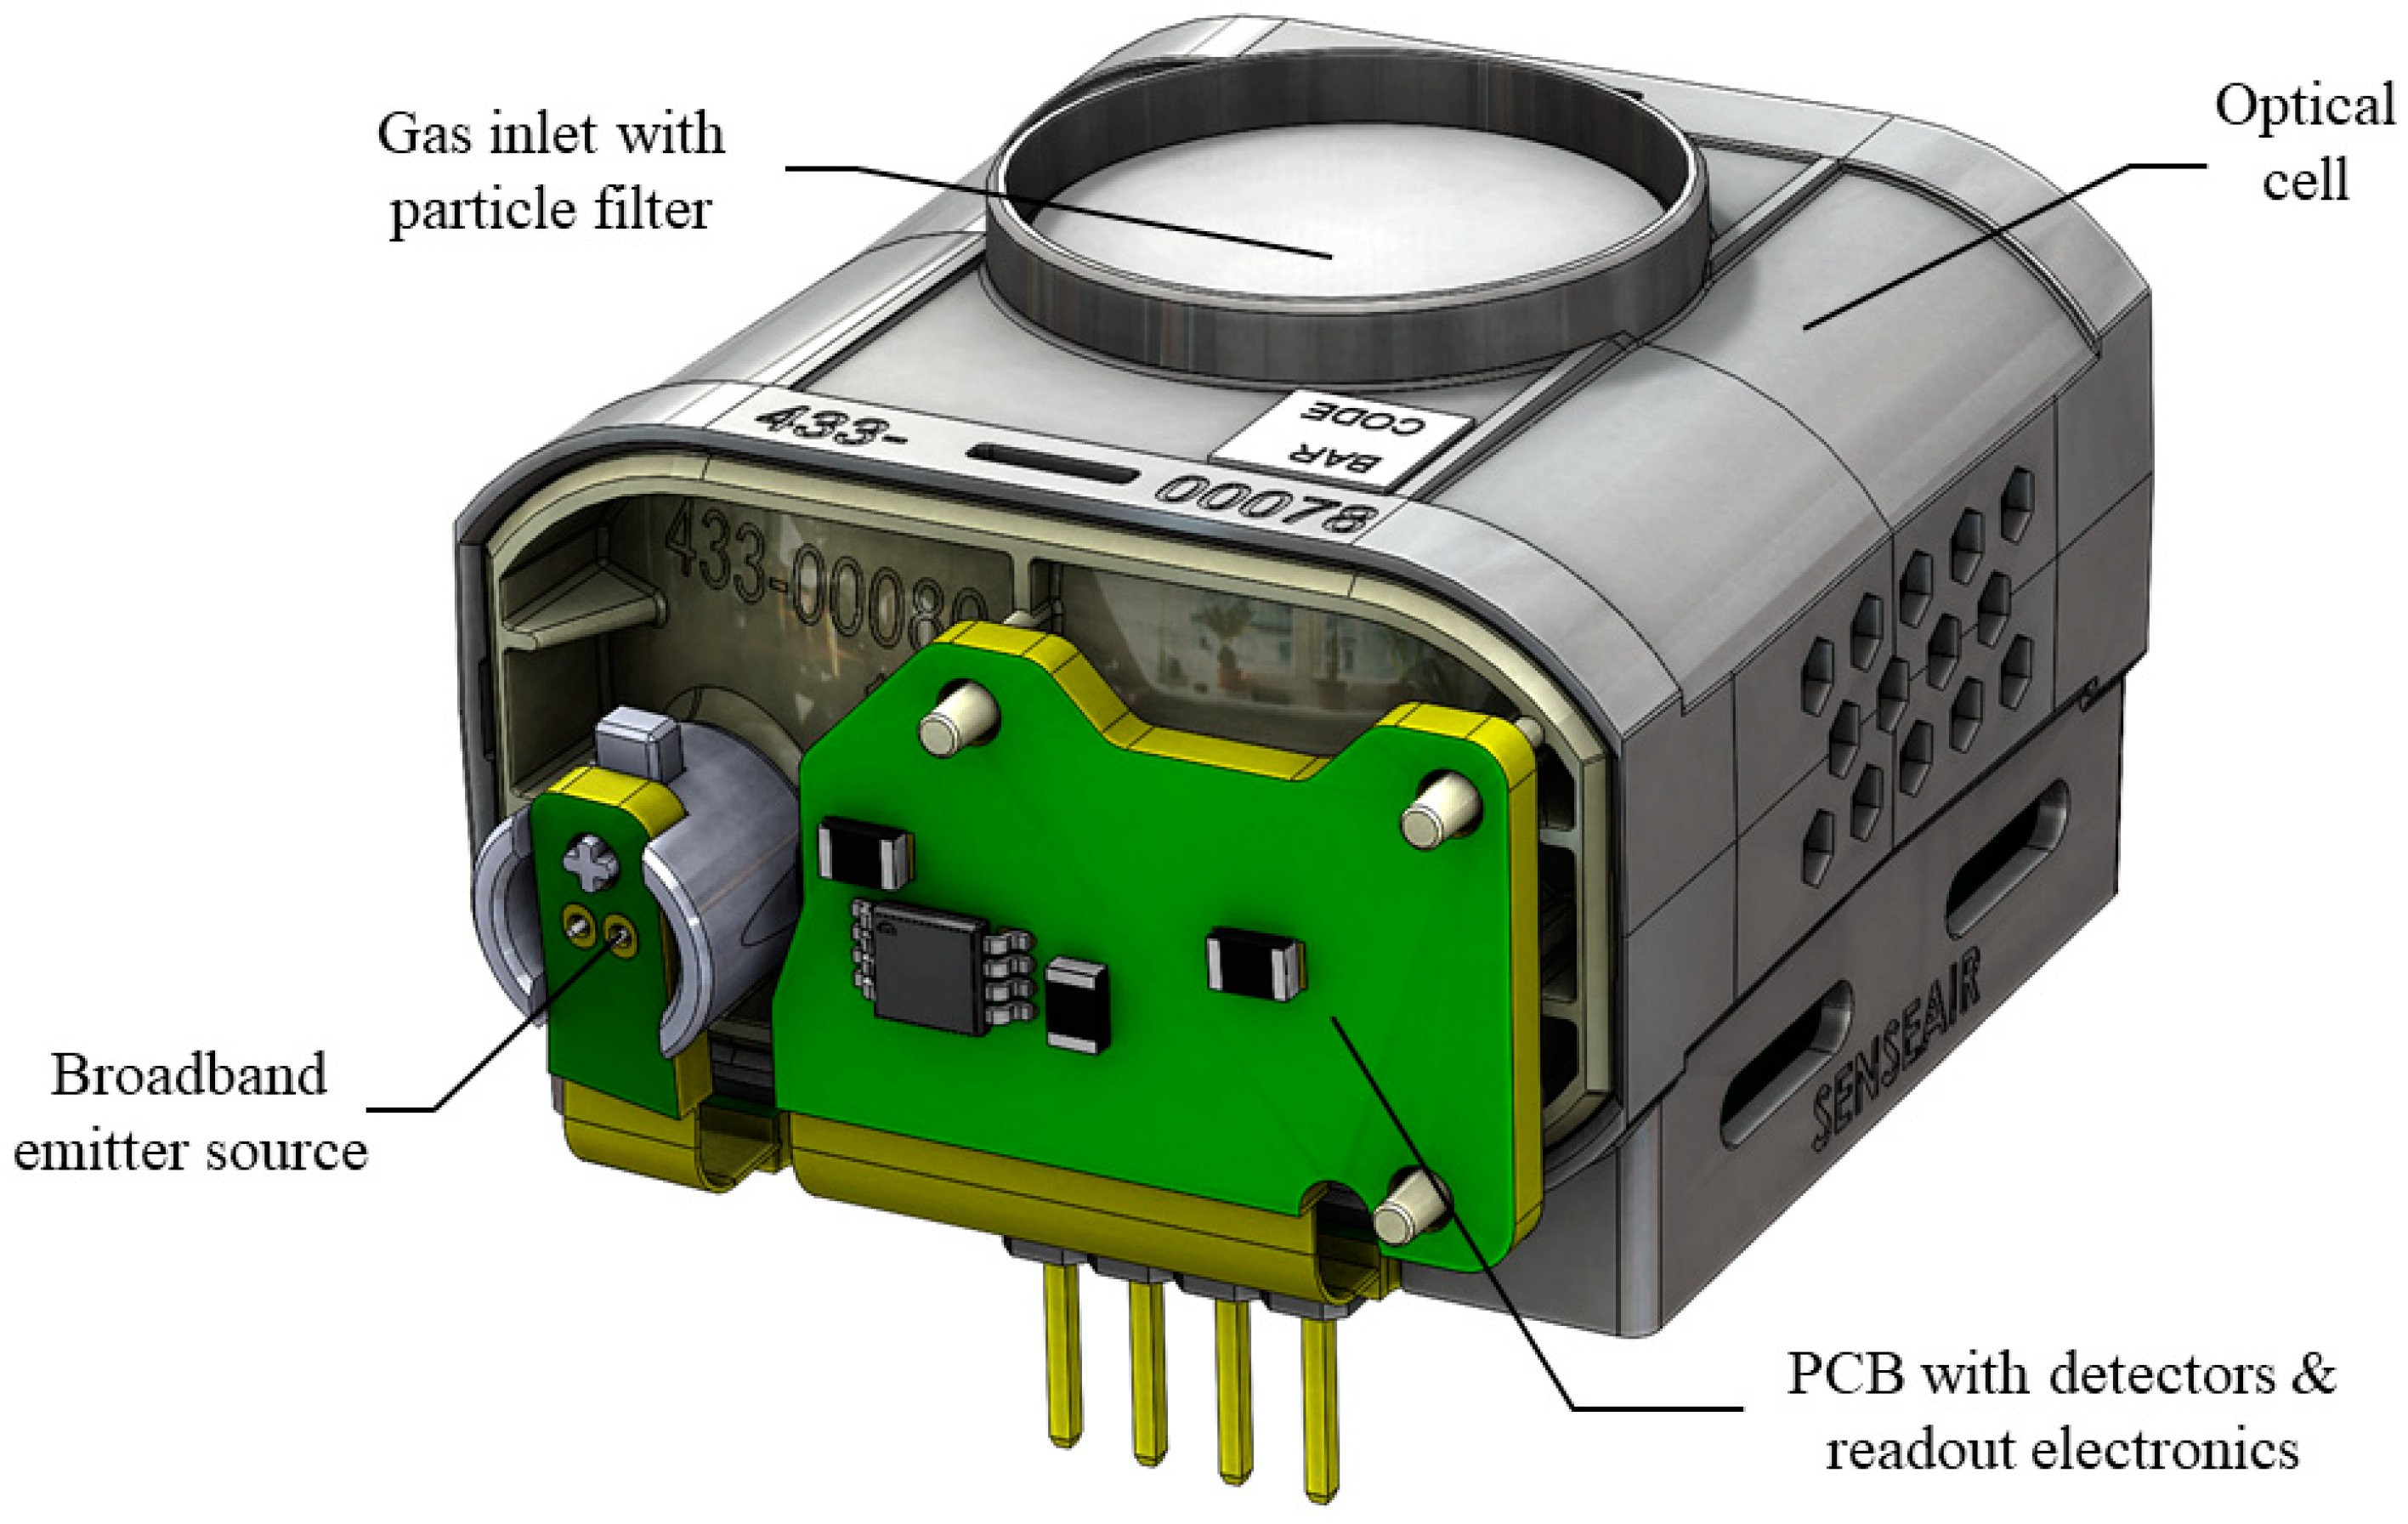
2.2. K96 NDIR Sensor Core

The K96 Sensor (Senseair, Sweden) relies on a novel patented optical concept, combining a multi-spectral and multi-optical path design in a single NDIR White-cell configuration [35,36]. The Sensor Core, referred to the combined optical cell and readout electronics, houses a conventional incandescent emitter source featuring a broadband emission spectrum, an essential prerequisite for the multi-gas sensing capabilities. Furthermore, three individual wavelength selective detectors are mounted to the optical cell, separated by a complete propagation cycle between the spherical mirrors. Consequently, each of the wavelength-selective detectors is associated with a dedicated propagation path length within the White cell configuration. Figure 2 illustrates the concept of the multi-pass NDIR sensor. The broadband IR emitter injects the IR radiation into the multi-pass cell, where the IR spectrum is propagating between the opposing mirrors until reaching the detector of the Short Pass Length (SPL). The wavelength-specific optical filter in front of the detector allows the transmission of only the gas-specific IR wavelength range, whereas the remaining IR spectrum is reflected and propagates further within the Medium Path Length (MPL) and Long Path Length (LPL), respectively. In doing so, three separated NDIR gas-sensing channels are realized with varying optical pathlengths i.e., the Short Path Length with 24 cm, the Medium Path Length with 36cm, and the Long Path Length with 48 cm, whereas the latter offers sub-ppm resolution.
The K96 sensor core is a highly compact (4 cm × 3 cm × 3 cm) but flexible and versatile sensing solution platform providing tailor-made sensing capabilities, either featuring the simultaneous detection of multiple gases or covering a single gas with varying resolution and concentration ranges. Table 1 summarizes the currently available K96 configurations for monitoring gases that are showing a specific absorption band within the 1 µm to 6 µm wavelength range. At present, the K96 sensor core is exploitable for measuring either CO2, CH4, or N2O with sub-ppm resolution in combination with H2O and CO2 for monitoring with a 1 ppm resolution.
The CAD drawing of the K96 Sensor Core in Figure 3 shows the realized version with a top opening and a particle filter on top. Gas inlets are sized to allow the analyte to enter the optical cell through diffusion, i.e., referred to as passive mode. The small volume of optical cell of about 25 mL facilitates a seamless diffusion-based operation; however, for an active mode operation, the Sensor core can be equipped with a pump to flush the cell. The optical cell is composed of an application-specific optimized polymer to achieve good mechanical stability over a wide temperature range. Sensitive surfaces, such as the mirrors, are protected for increased operational robustness.
Electronics, including emitters, detectors, and readout electronics are merged to the optical cell forming the Sensor Core of the K96, as shown in Figure 3. The flex-rigid PCB comprises multiple function blocks, a microcontroller, an emitter driver, amplifiers of the multiple IR gas-detection channels, 16MBit low-power FLASH memory, NTC temperature sensors located next to the detectors, as well as a combined pressure, temperature, and humidity sensor (BME280, Bosch, Gerlingen. Germany). The BME280 sensor is used for optional pressure compensation of concentration readings and allows for additional measurements of temperature and water vapor (derived from relative humidity, temperature, and pressure readings). The 16Mbit FLASH memory enables the storage of sensor readings and makes the sensor applicable for autonomous operation and field deployment; for example, storing sensor readings with a 10s interval and data logging over 7.5 days can be realized. The sensor is designed for supply voltages between 6 V and 8.5 V and can be equipped with a 7.6 V lithium battery.
Furthermore, a separate voltage input from 1.8 V to 5.5 V. allows the interfacing to a host system to create a transmitter or a monitor. Onboard communication interface allows TTL-level serial line over UART. The communication with the sensor is achieved using Modbus commands. The average power consumption is below 0.5 W and mainly limited by the joule heated broadband emitter source using a default current of 50 mA.

2.3. Experimental Sensor Characterization

The characterization of the K96 Sensor Core was performed using industrial standard methods and equipment from Senseair AB, Delsbo, Sweden. To expose the sensor to monitored environmental conditions, climate chambers (CTS GmbH, Hechingen, Germany) were utilized, controlling temperature and relative humidity. Reference cylinders bought from Air Liquide, Paris, France, and consisting of dry mixtures of one specific target gas with Nitrogen (maximum deviation of the composition within ±5% of the target value) were used to fill the climate chamber with either known mole fractions of CO2 (between 100 to 180,000 ppm), CH4 (between 20 to 30,000 ppm), or N2O (between 25 to 1000 ppm). Humidity levels were controlled by the climate chamber in a range of 5% RH to 95% RH for simulating a large panel of field conditions. A chilled mirror hygrometer (Model S8000, Michell Instruments, Ely, Cambridgeshire, UK) served as reference measurements of the water vapor mole fraction inside the climate chamber.
The characterization of the K96 sensor includes multiple steps. It is initiated by generating the individual transmission curves of the sensor at a constant temperature of 25 °C. The signal intensity at the detectors is measured as the function of the concentration of the target gases and normalized against the values obtained for a ‘zero’ gas (Nitrogen). This allows to describe the sensor behavior with respect to varying gas concentrations. Next, an additional calibration step was performed to take into account the inherent temperature influence in NDIR systems (e.g., through effects on the optical bandpass filter, on the detector, on emission strength of the IR source, or on intensity of the absorption lines). The sensors were exposed to different target gas concentrations for different temperature conditions in the 0–40 C range. In the current configuration, the K96 sensor was factory calibrated in the following concentration ranges:
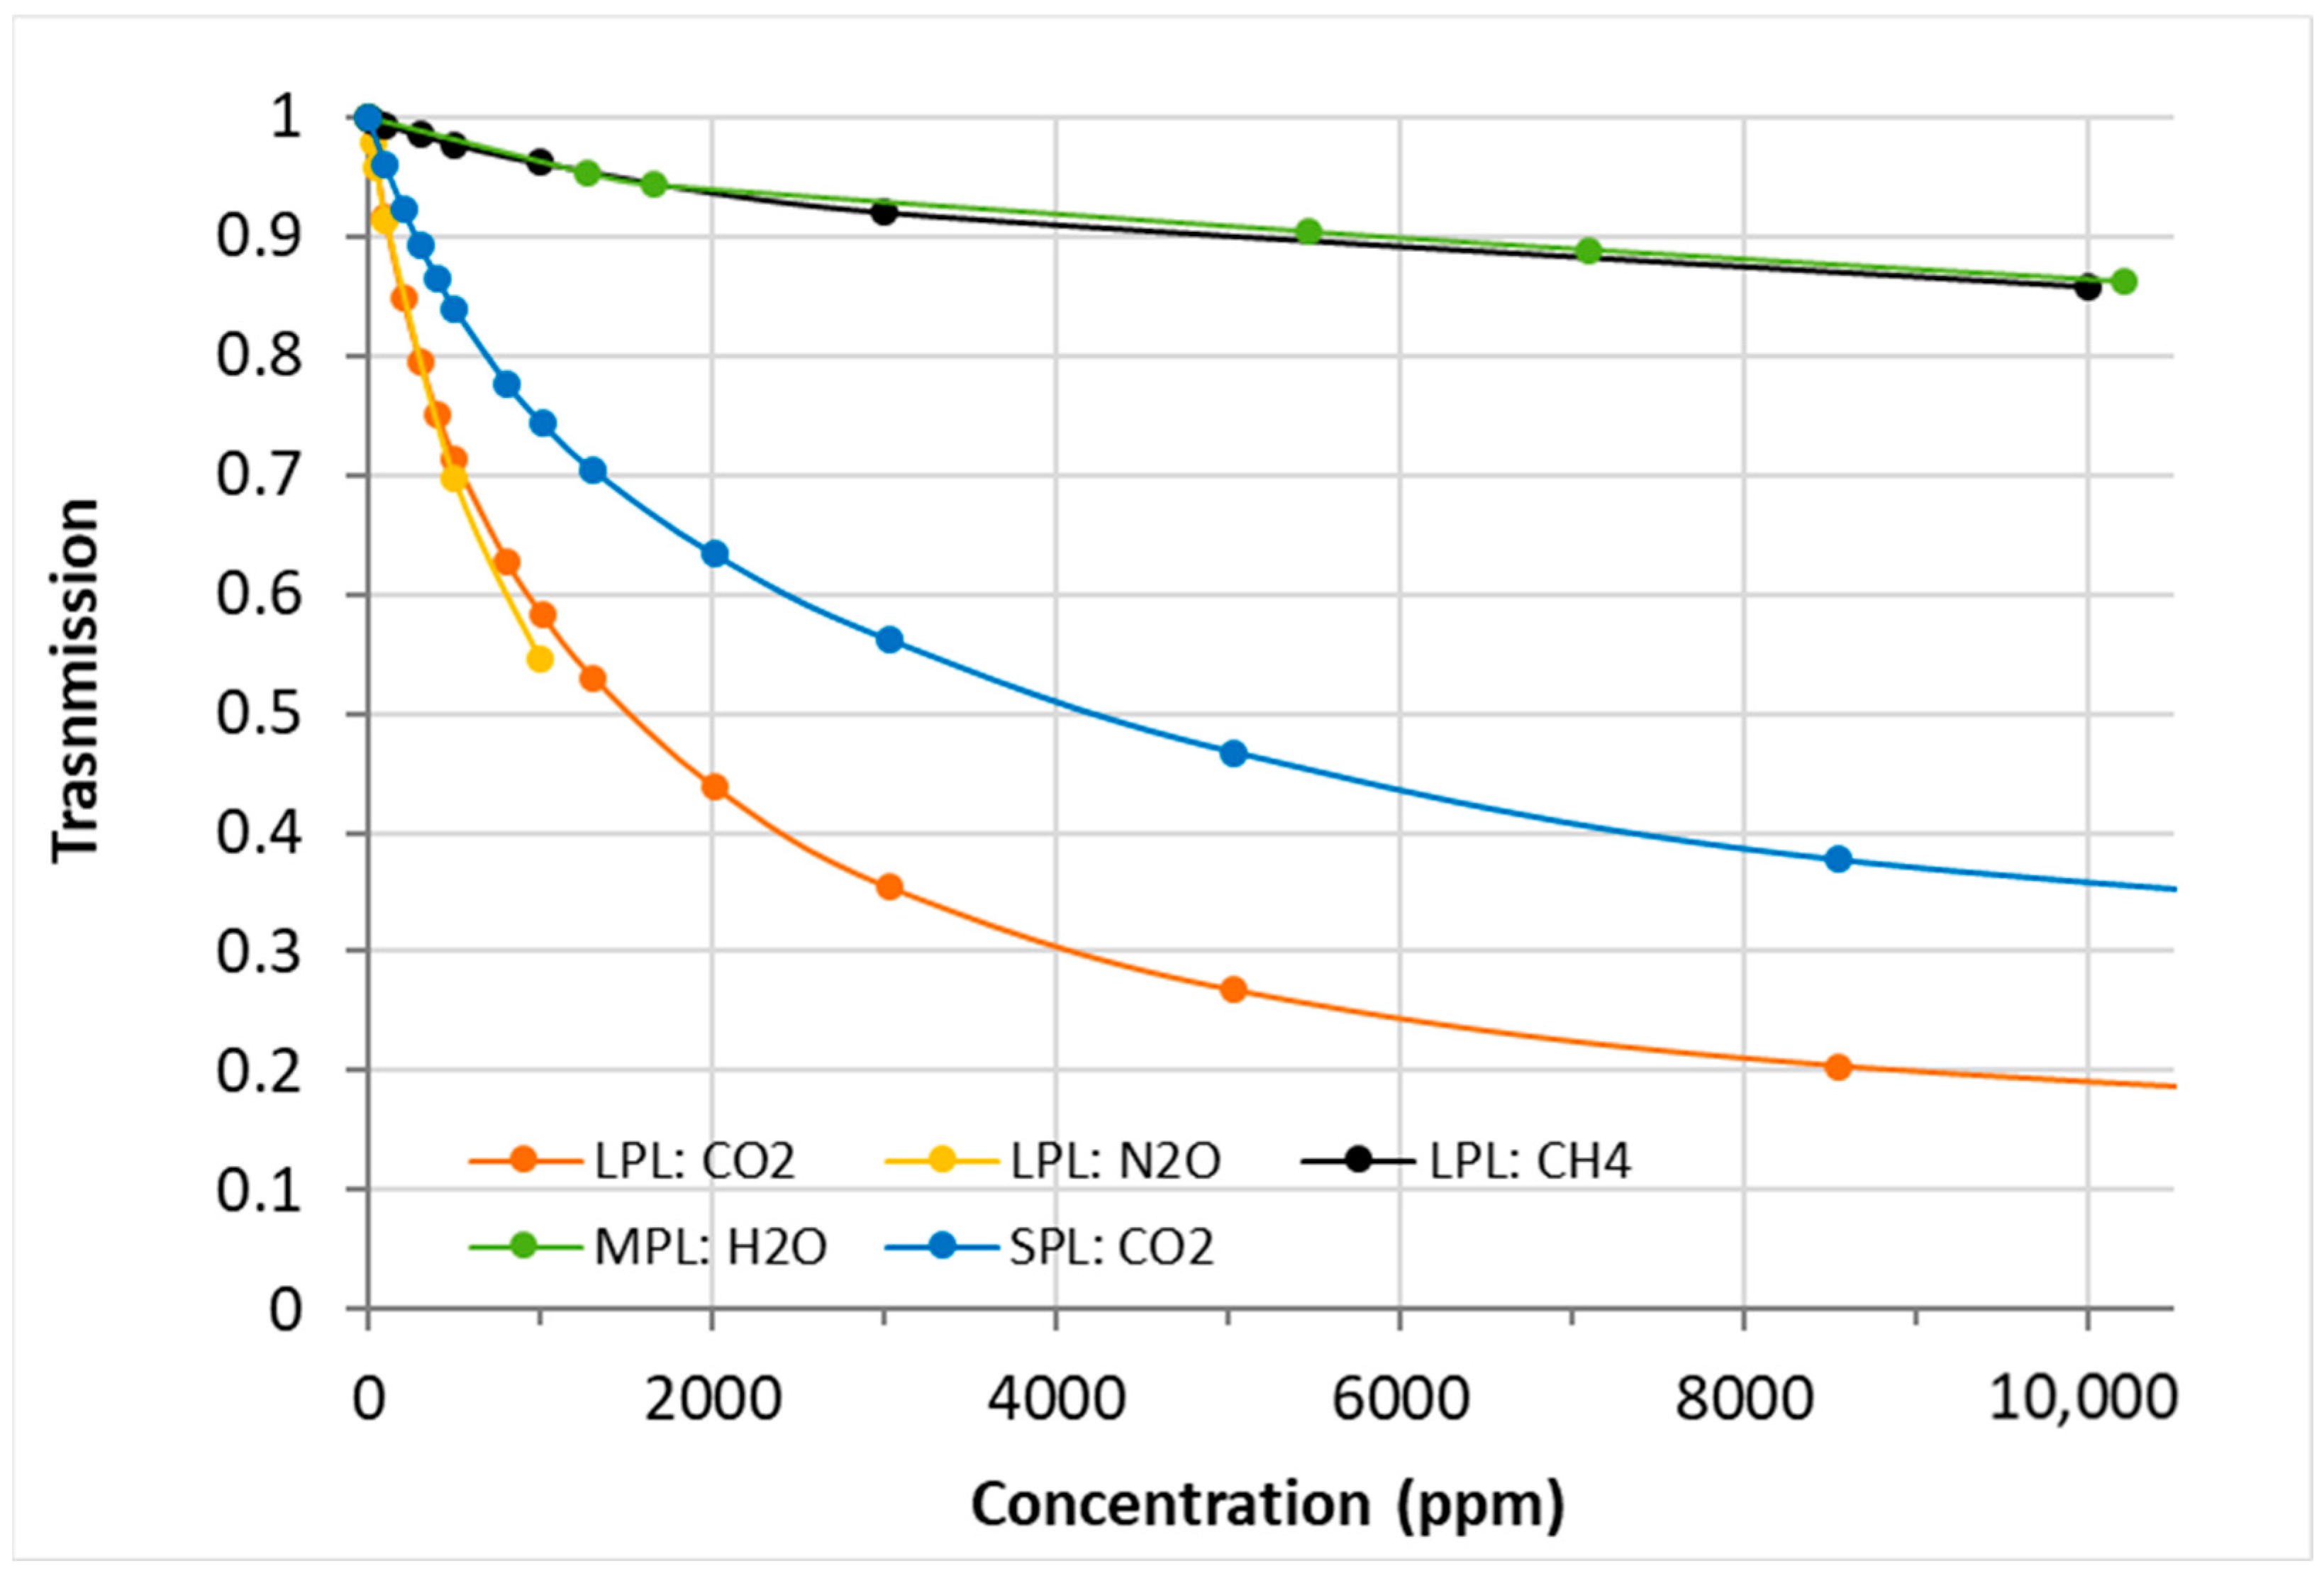
  • CO2: LPL channel     400–3000 ppm,
  • CO2: SPL channel     400–8500 ppm,
  • CH4: LPL channel     0–2500 ppm,
  • N2O: LPL channel     0–1000 ppm
  • H2O: MPL channel    0.2–3 vol%.
The climate chambers were also used to characterize the cross-sensitivities between the different NDIR channels, i.e., the detectors signal dependency on other gases than the target one. This is usually done by varying one gas concentration while keeping the concentration of other gases constant (e.g., we varied the H2O concentration, whereas the CH4 concentration was kept constant).

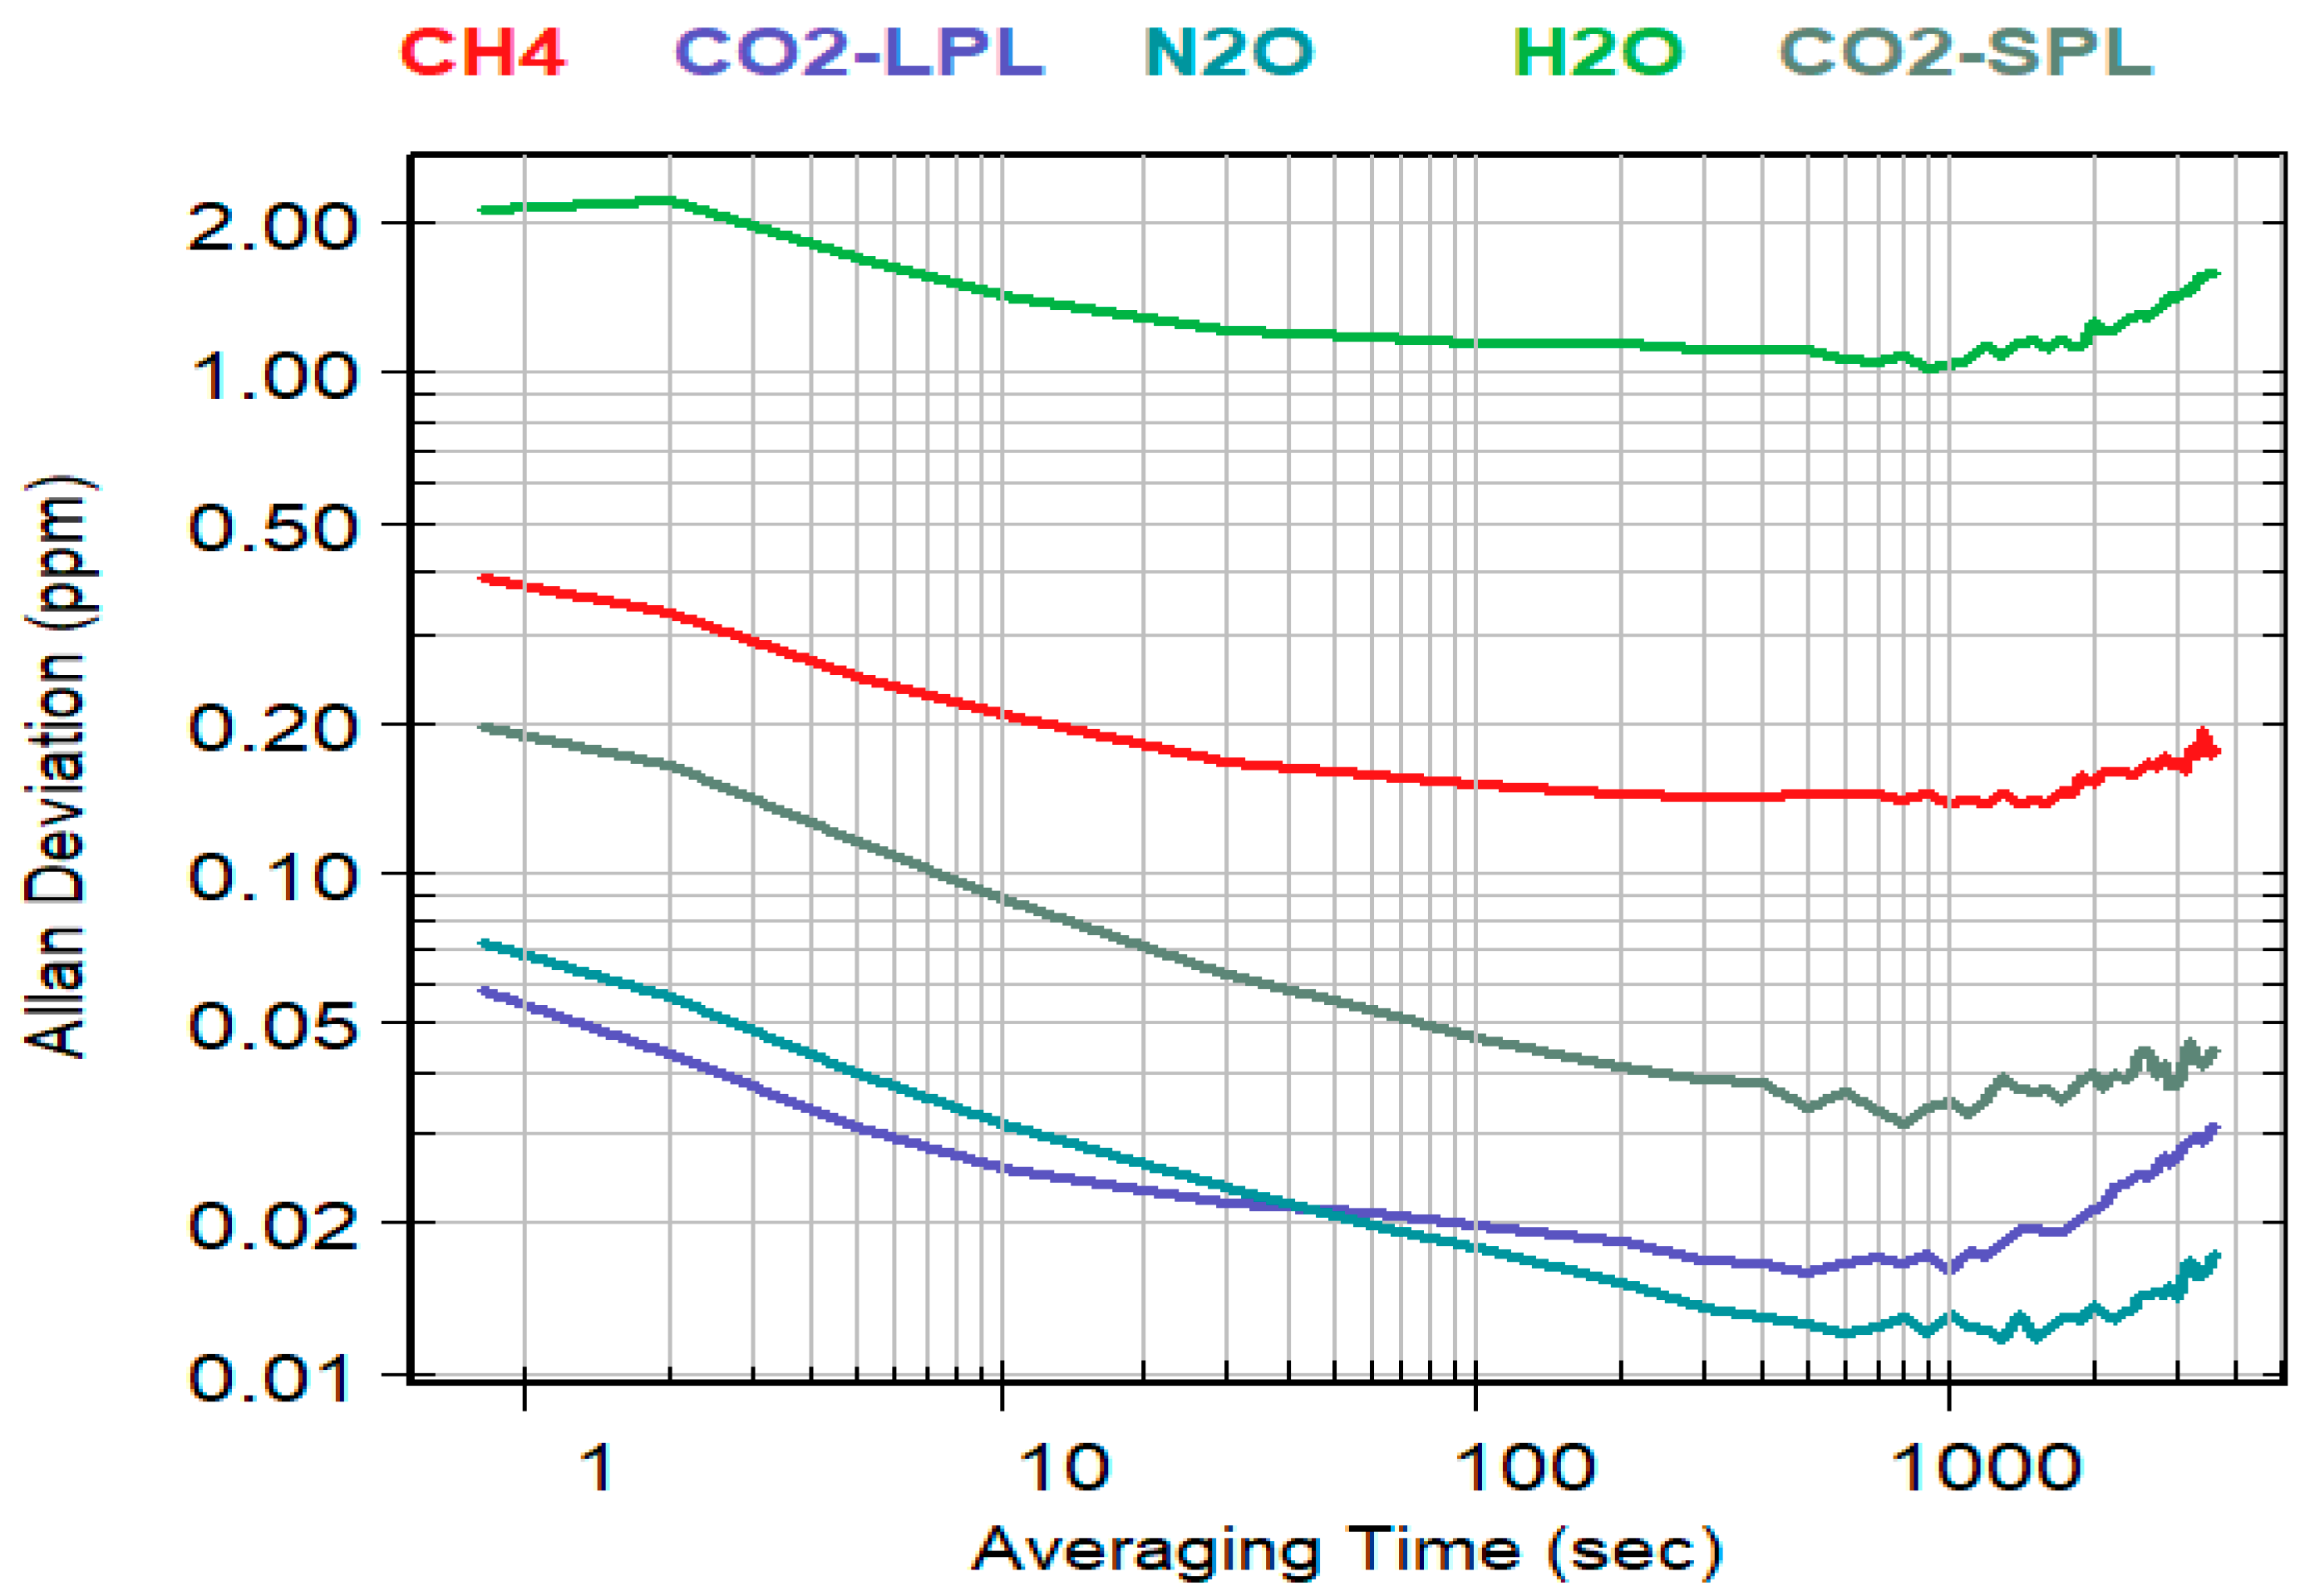
2.3.1. Sensor Stability Using Allan Deviation

Allan deviation is frequently utilized to characterize noise in consecutive measurements [37]. By definition, it is the square root of the Allan variance, i.e., the two-sample variance formed by the average of the squared differences between successive values of a regularly measured quantity taken during multiple sampling periods [38]. For N measurements of the y variable with sampling period τ , the Allan deviation is defined as follows [38]:
σ y ( τ ) = i = 1 N 1 ( y i + 1 y i ) 2 2 ( N 1 )
We utilized this statistical parameter to distinguish between the dominating noise type and determine the optimum averaging interval for a measured quantity as a trade-off between noise reduction and required time resolution to capture the signal changes [39]. Experiments to determine the Allan deviation of the individual sensor channels are conducted by exposing the K96 sensor to constant conditions over a long period. Therefore, the climate chamber was filled with inert dry Nitrogen atmosphere (‘zero’ gas) over a 60-hour period, and the temperature was kept constant to 20 °C. Next, the experiment’s time-series were split into intervals between 0.8 s and 3600 s. Finally, the mean value of the individual intervals was utilized to determine the Allan deviation with respect to integration time.

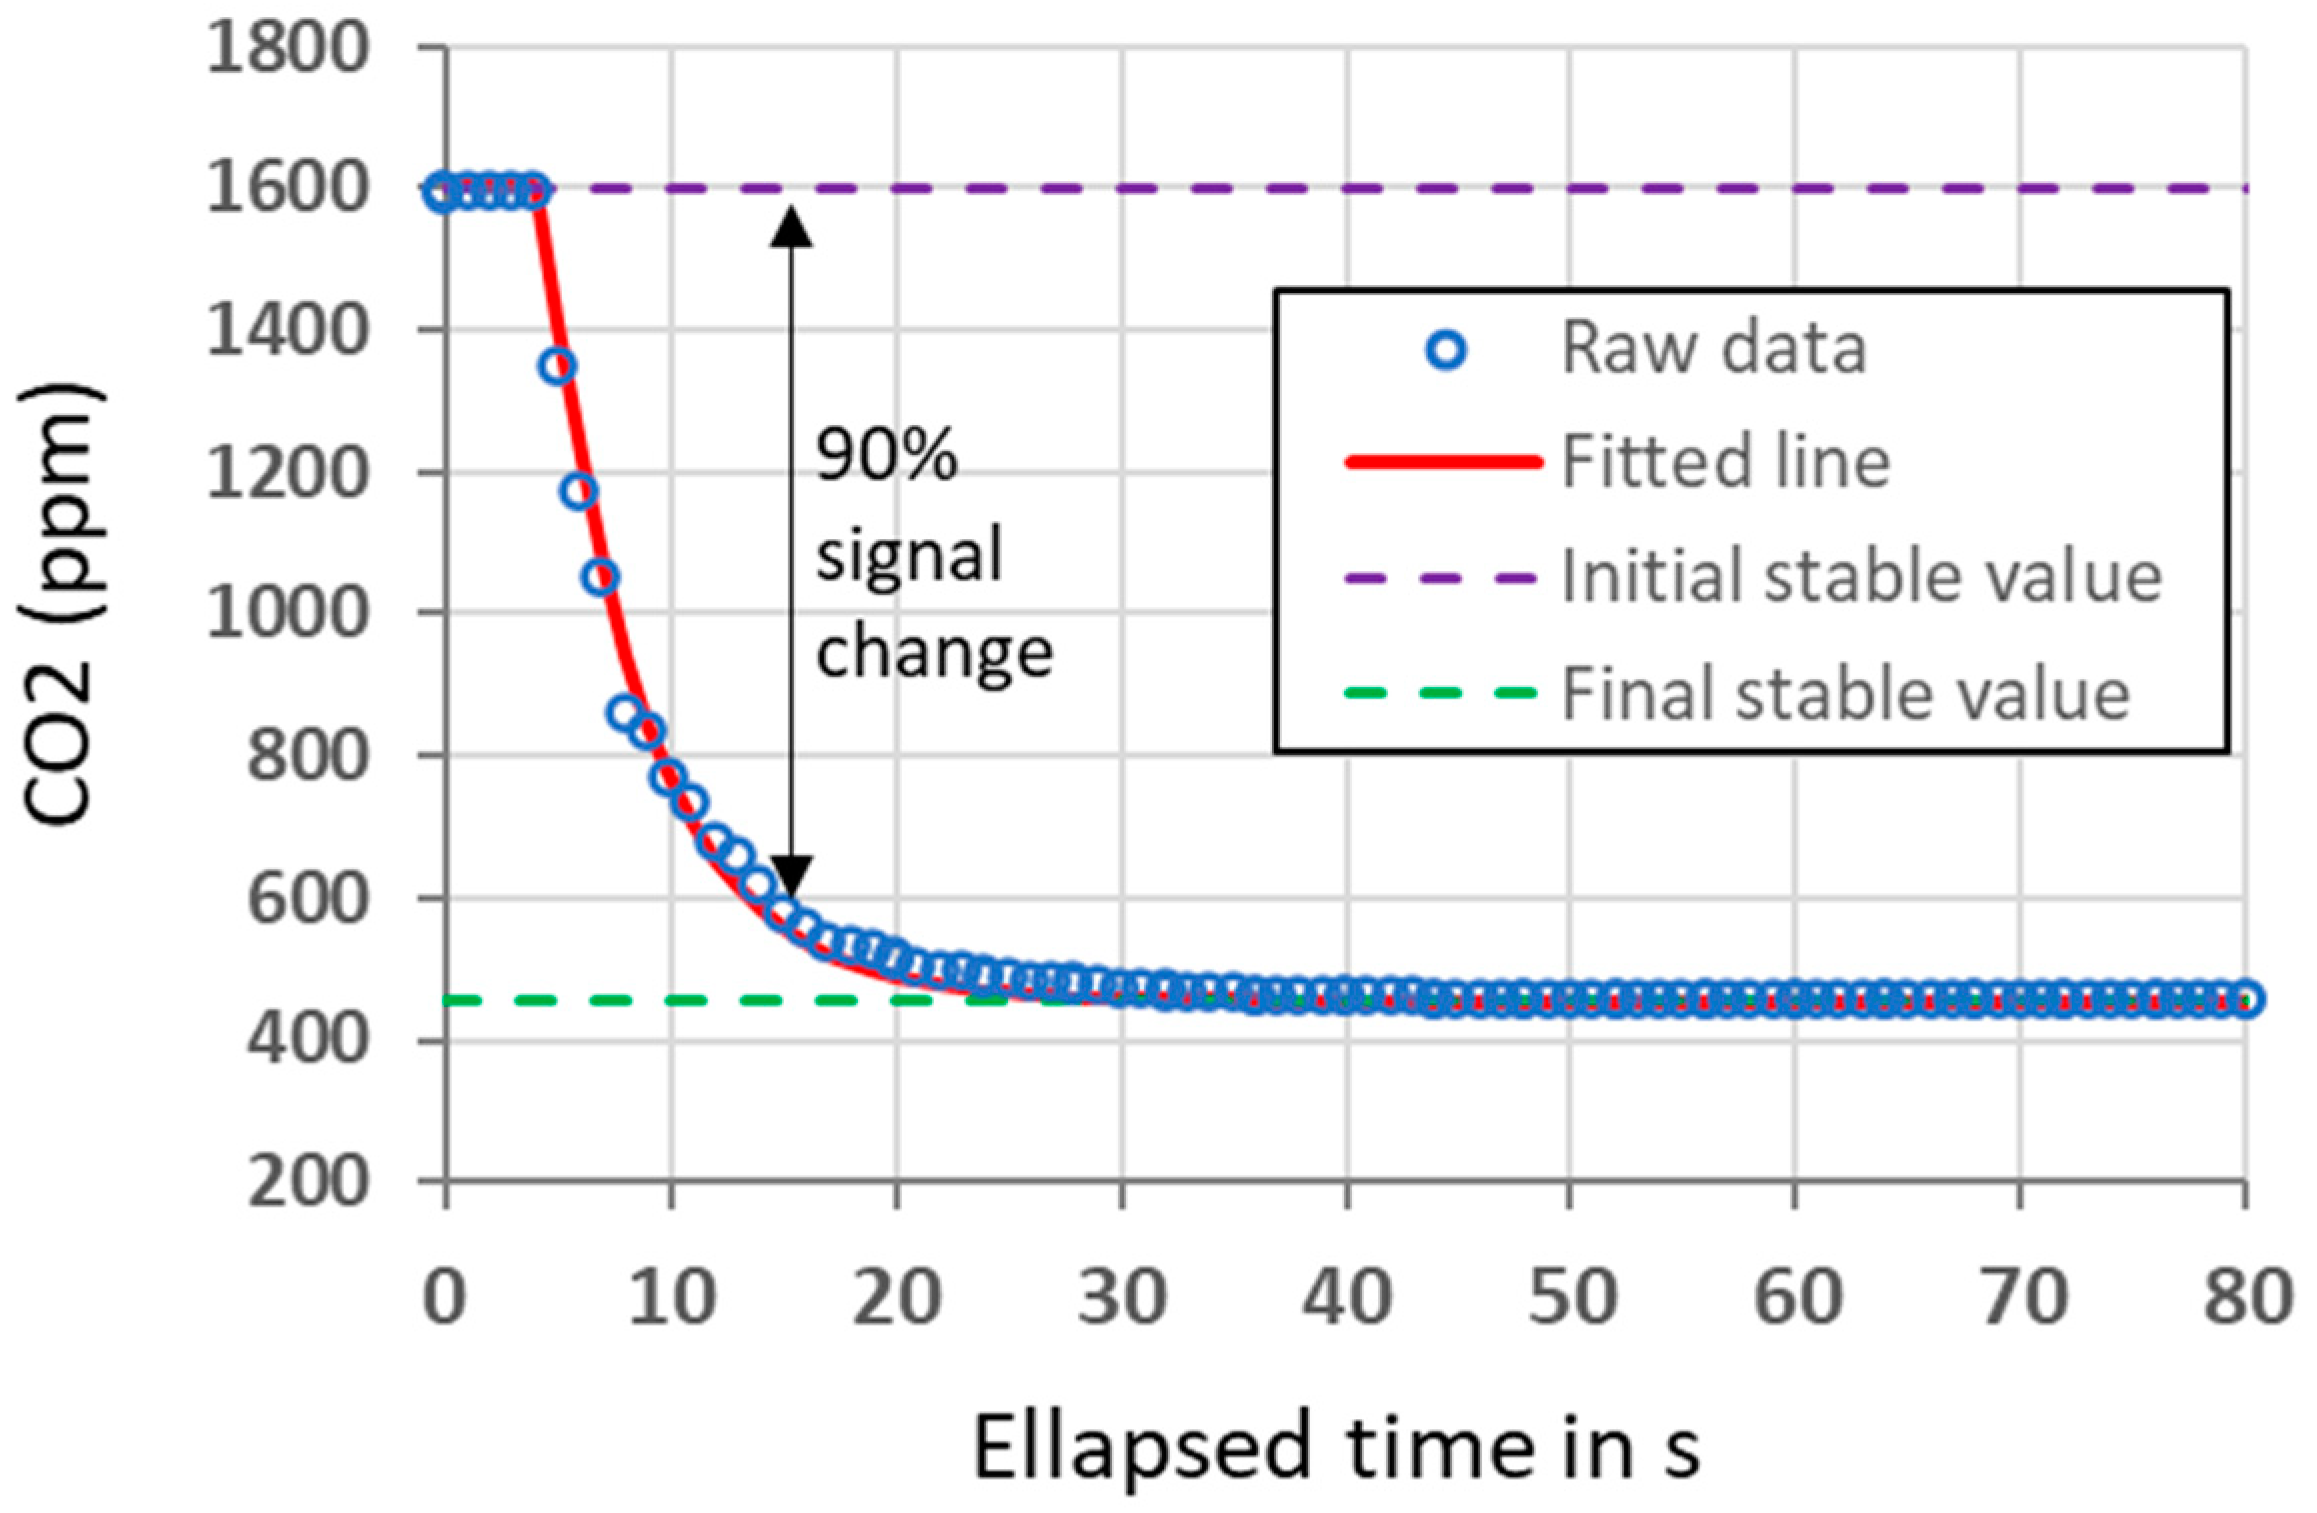
2.3.2. Response Time of the Sensor

To evaluate the sensor’s response time to varying gas concentrations, a tailor-made experimental setup was designed. A small gas chamber with a volume of about 250 mL allows to house and expose the K96 sensor to a defined gas concentration, being filled with either the test gas concentration or nitrogen. Once the measured gas concentration inside the test chamber reached a stable level, the chamber was remotely lifted. The gas sensor was then exposed by diffusion (passive sampling) to the indoor air, and we determined the time needed to measure a stable concentration in this new environment. This method allowed us to assess either the ‘rise’ response time (transition from ‘zero’ concentration inside the chamber to ambient concentration of the target gas, for instance around 450 ppm for CO2) or the ‘fall’ response time (transition from ‘high’ to ambient concentration levels).

3. Results

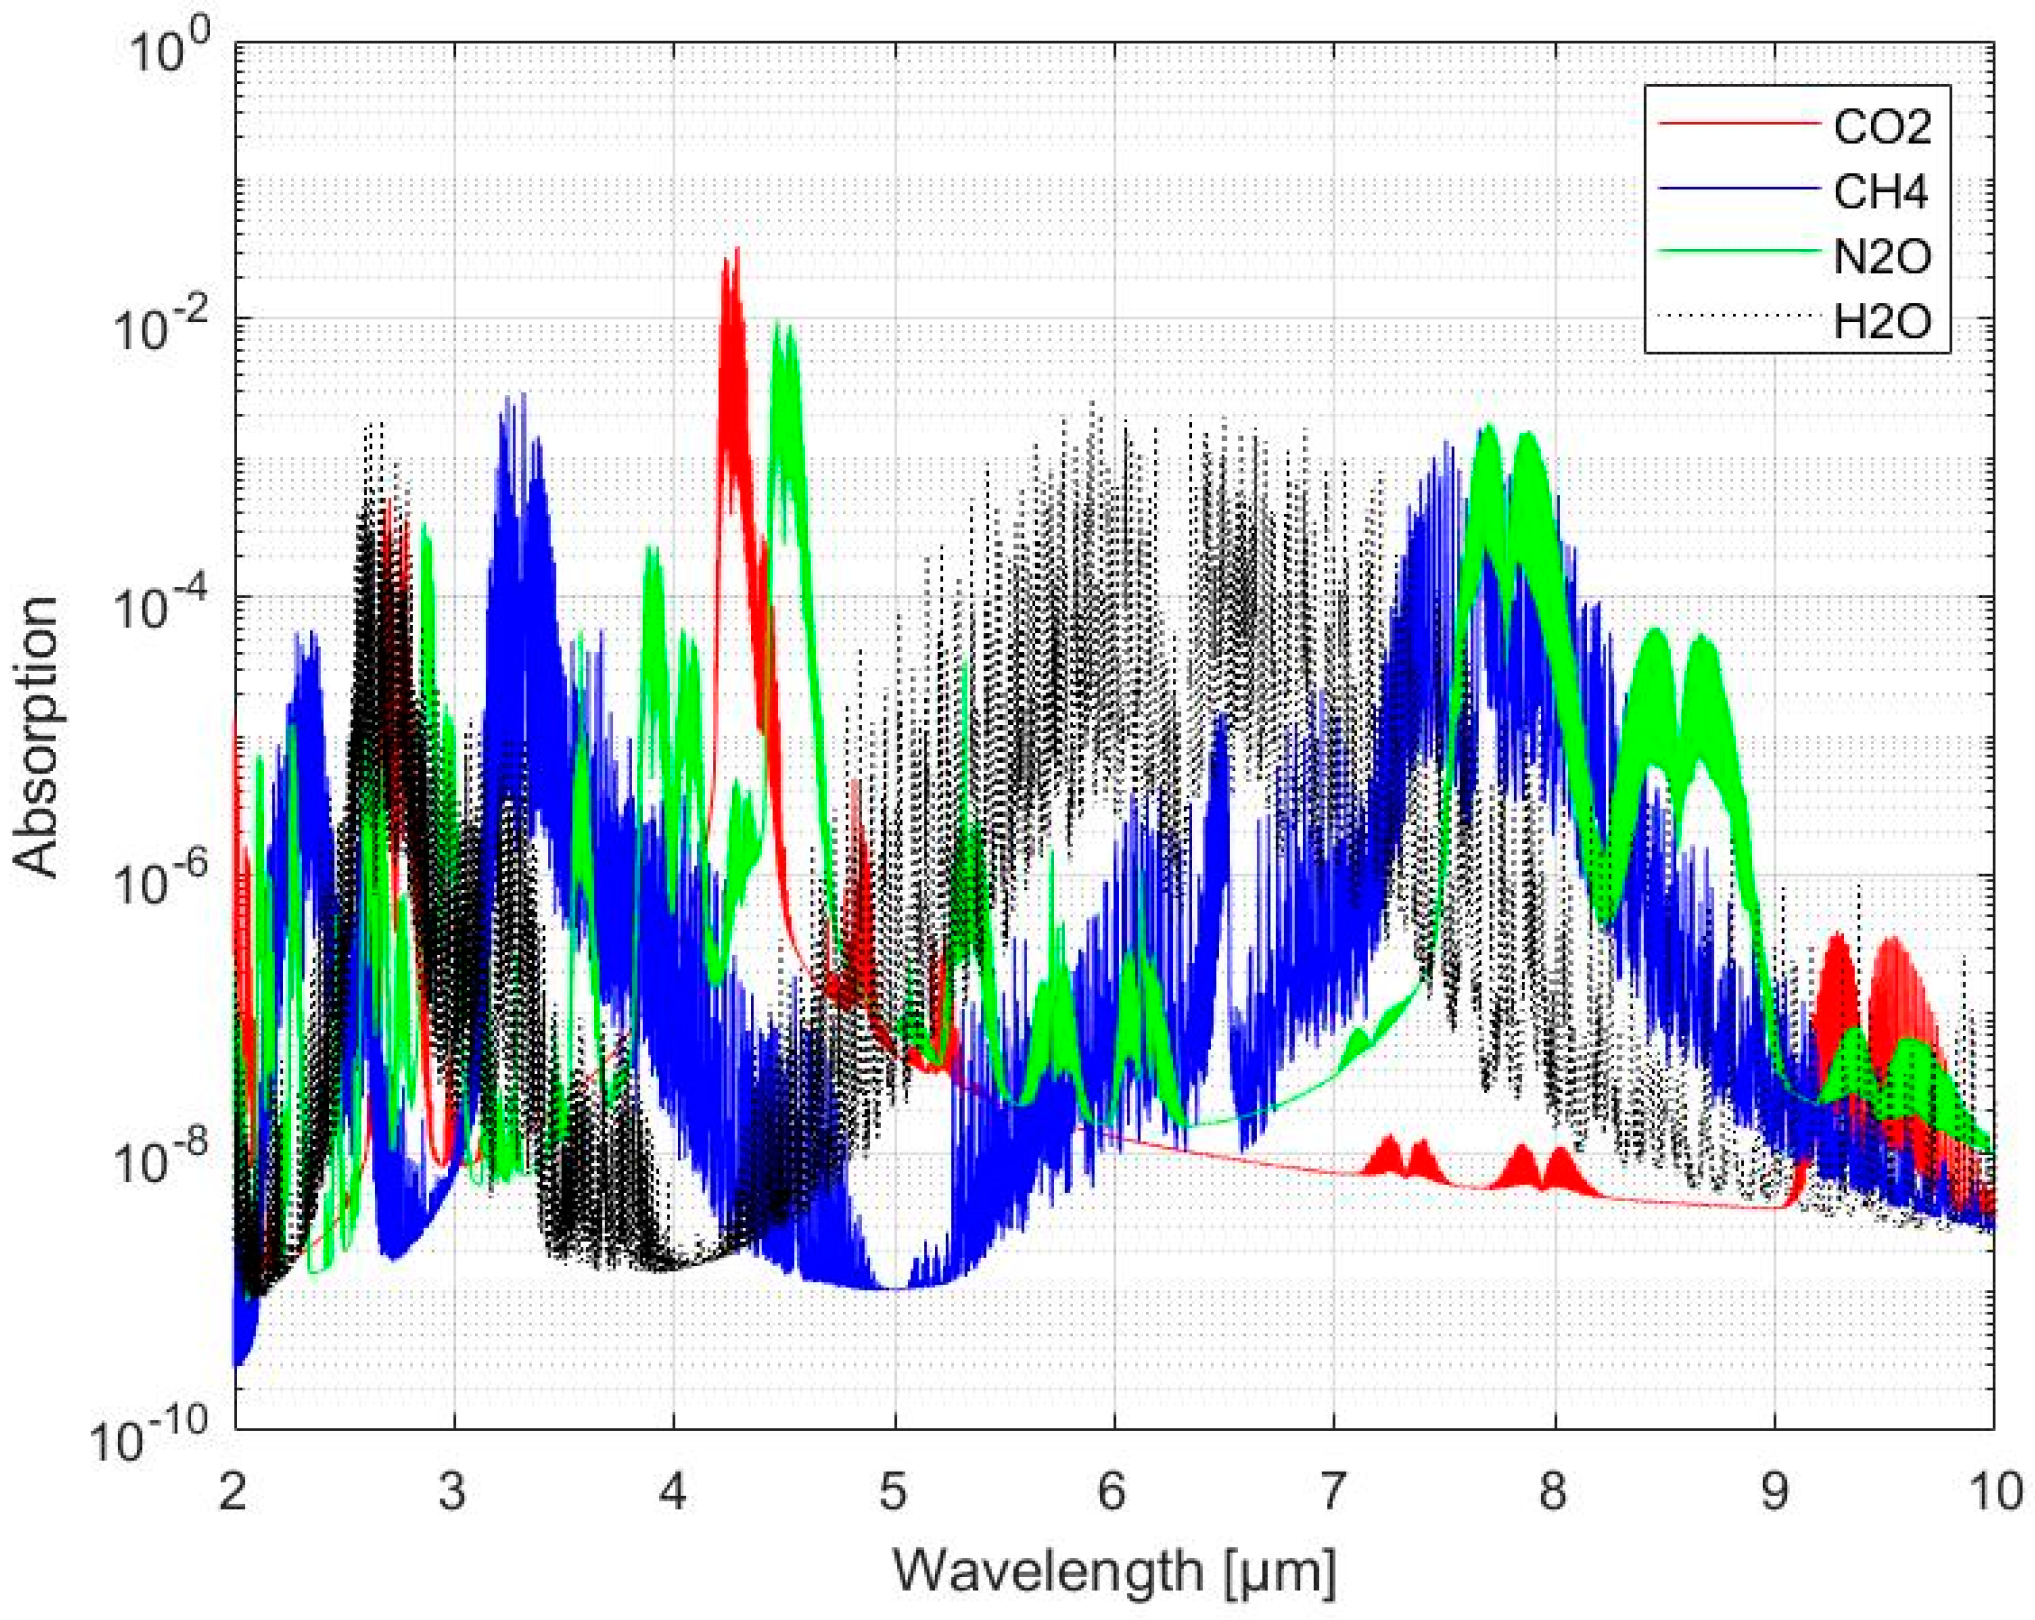
3.1. Multi-Gas Absorption Spectra

The results of exposing the sensor to different CO2, CH4, N2O, and H2O levels are summarized in Figure 4, where the transmission is plotted against the concentration in ppm. N2O and CH4 concentrations were measured on the LPL channel (48 cm optical path length),H2O on the MPL channel (36 cm optical path length), and CO2 was measured in multiple configurations on both LPL and SPL (24 cm optical path length) channels. All transmission curves can be modelled using the Lambert–Beer law and are sensor-specific based on the utilized optical path length, the wavelength-specific absorption coefficient of the gases, the bandwidth of the utilized filter, the wavelength-specific intensity of the emitter, and the specific sensitivity of the detector itself. Consequently, the transmission curve of CO2 measured on the LPL channel, which enables a longer propagation path length, shows a stronger signal decrease compared to the one measured on the SPL channel, whereas both use the same sensing wavelength band at about 4.3 µm. N2O and CO2 measured on the LPL channel show similar shape of the transmission curve in the 0-1000 ppm range. CH4, measured around 3.3 µm, and H2O, measured around 2.6 µm, reveal also a rather comparable transmission curve, but with a slighter signal decrease at increasing concentration. These results give a first indication of the expected relative sensitivity of the K96 for the different gas species measured with the three NDIR channels.

3.2. Noise-Level Using Allan Deviation

The experimental results of evaluating the noise-level for the different K96 NDIR channels are summarized in Figure 5. It shows, for each target gas measured on a specific NDIR channel, the Allan deviation in ppm (vertical axis) calculated as function of the integration time, in seconds, of the detector signal (horizontal axis). The shortest integration time is 0.8 s and was increased until 3600 s. Plotted are the results obtained for CO2 measured on both SPL and LPL channels, for CH4 and N2O (LPL channel), and for H2O (MPL channel). The noise measured on the LPL channel with the 0.8 s default measurement interval is below 0.1 ppm for both CO2 and N2O and about 0.4 ppm for CH4. The noise is higher, about 0.2 ppm, when CO2 is measured on the SPL channel and around 2 ppm for H2O. For all measurements, the Allan deviation decreases with the integration time until it reaches a minimum between 700 s to 1000 s. The noise is reduced to below 0.02 ppm for both CO2 and N2O measured on the LPL channel, and to about 0.03 ppm for CO2 measured on the SPL channel. The noise reduction is less significant for CH4 (down to 0.15 ppm) and H2O (down to 1 ppm). Beyond 1000 s of integration time, the Allan deviation increases for all gas species, which suggests that the detector noise (white noise) becomes less dominant in comparison with a higher contribution of low frequency noise (drift). As summarized in Table 2, a 60 s integration time can be a good trade-off between noise reduction and time resolution to track temporal variability of the measured concentrations.

3.3. Response Time

The response time was evaluated for CO2 by determining the time required to measure 90% of a concentration step change. Figure 6 shows the results obtained during a ‘fall’ response time experiment. A K96 sensor initially located in a small exposition chamber was exposed to a CO2 concentration of 1600 ppm. At t = 0 s, the chamber was lifted, and the sensor got exposed to ambient air with a CO2 concentration of about 450 ppm. In this case, the response time was determined to be 15 s, including a 4 s delay period (dead time). A similar result was obtained for the ‘rise’ response time, when the sensor was alternatively exposed to a ‘zero CO2’ gas (Nitrogen) and room air. The response time values confirm that the K96 sensor, without using an external pump to flush the measurement cell (passive mode with natural diffusion only), fulfills the IEC 60079-29-1:2016 standard for utilization as detector for flammable gases [40] and even the 17660-1:2021 CEN Technical Specification for air quality measurements [41], which set a response time inferior to 60 s and inferior to 600 s, respectively, if considering the 1h averaging period of the signal.

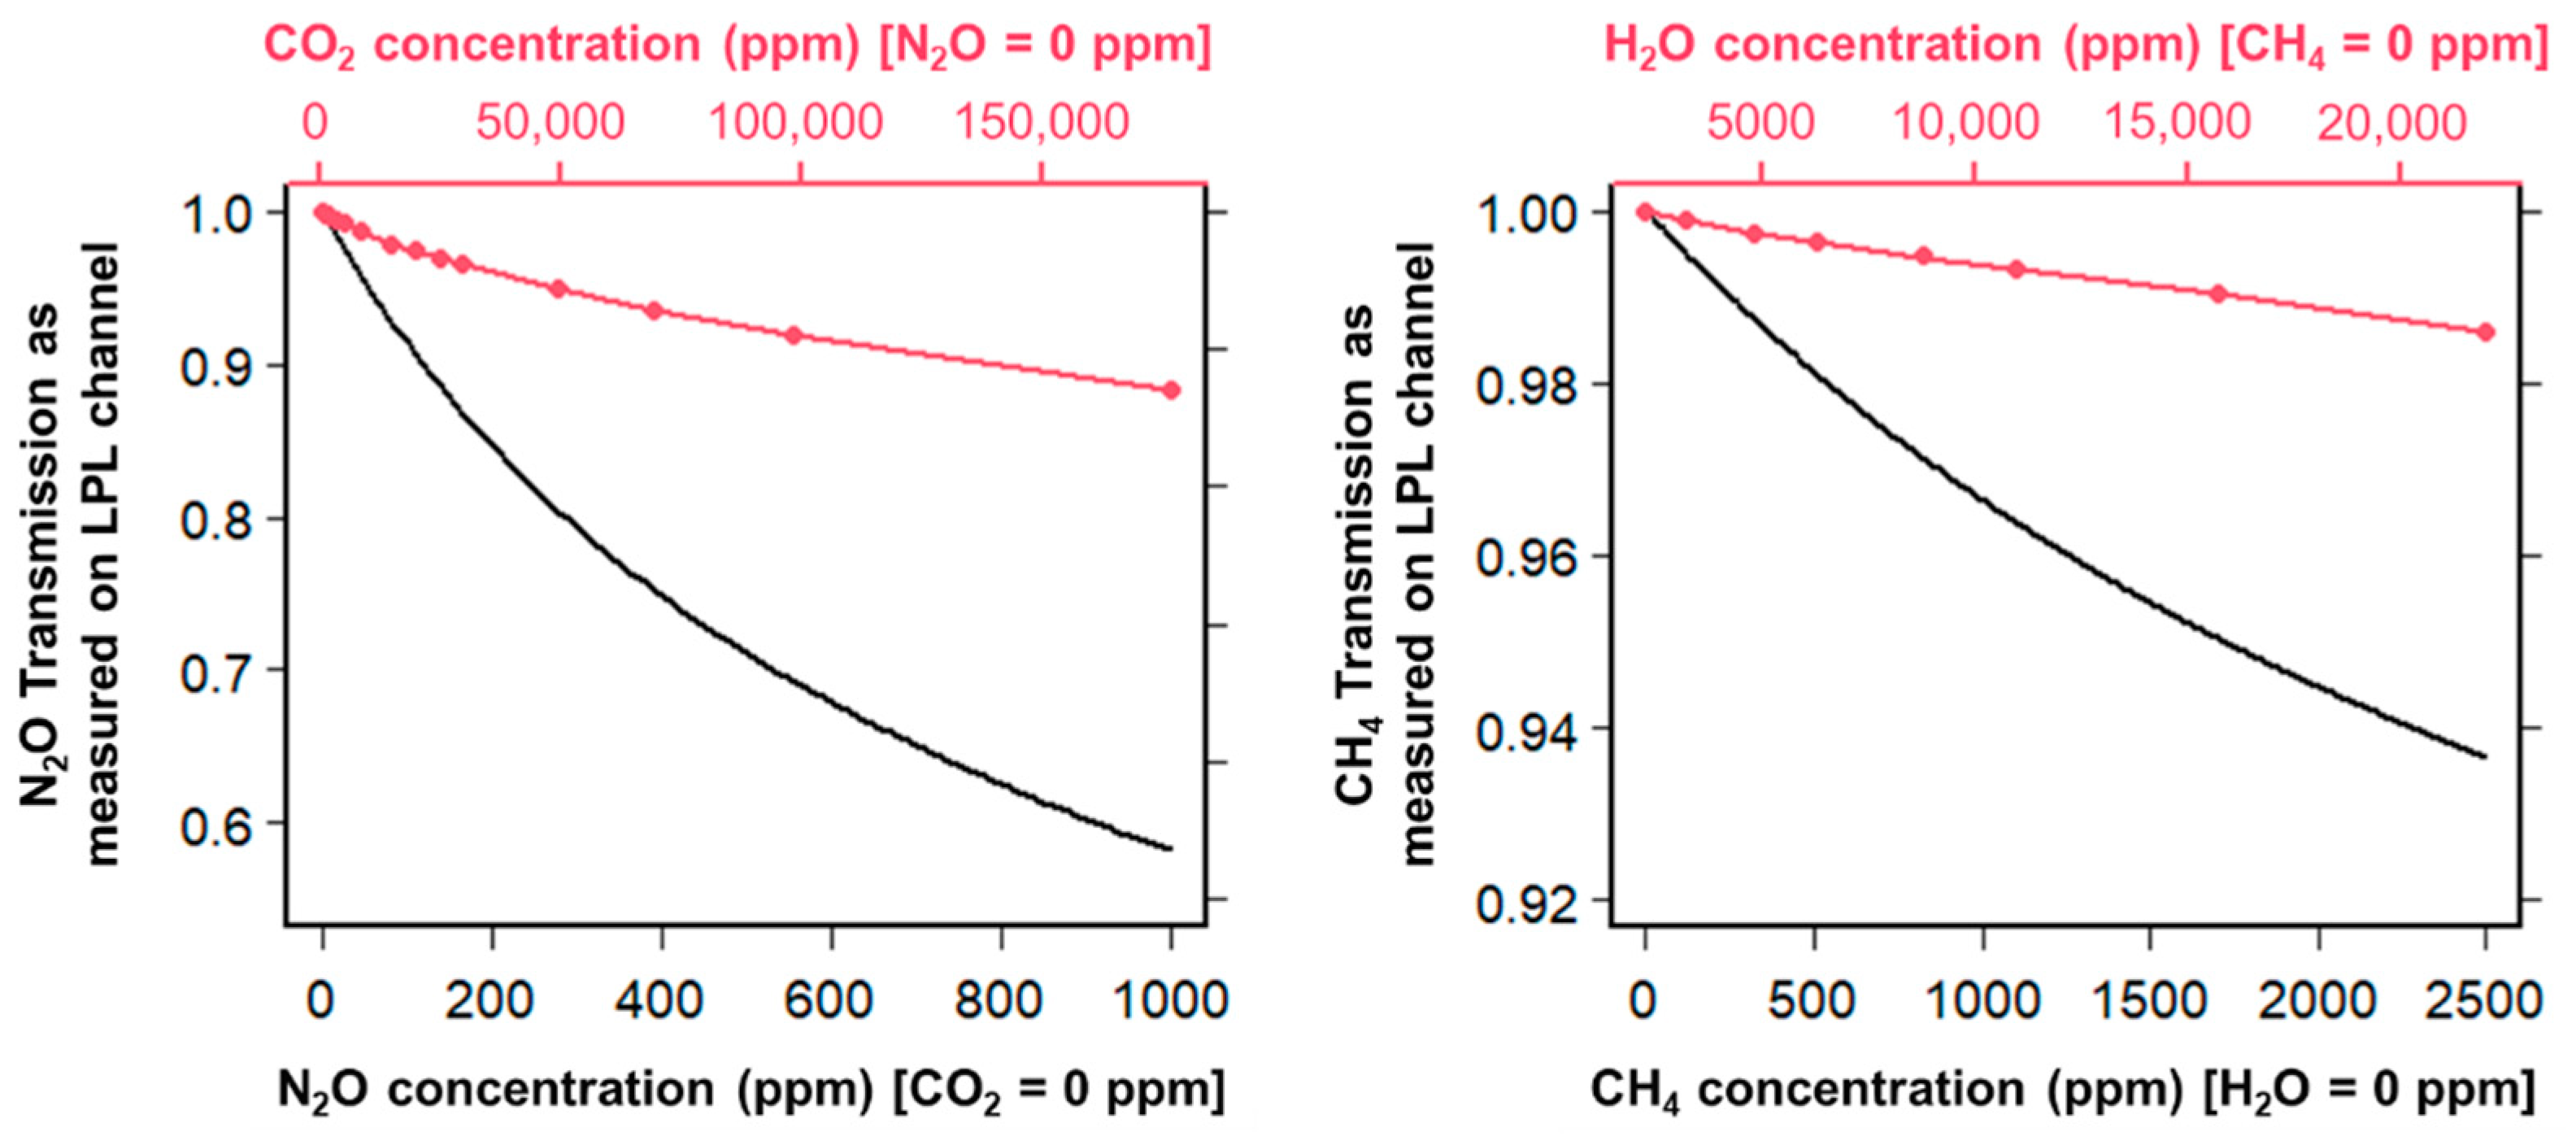
3.4. Cross-Sensitivity

During our experiments, we identified two cross-sensitivity dependencies between the target gases, firstly between CO2 and N2O and secondly between H2O and CH4. Figure 7 shows on the left panel the N2O transmission signal measured on the LPL channel as the function of varying N2O concentrations in a Nitrogen mixture (black curve), and as the function of varying CO2 concentrations in a Nitrogen mixture (red curve). The CO2 influence on the measured N2O signal is clearly visible and not negligible for environments with very high CO2 levels. Indeed, a 15%v CO2 concentration will cause a N2O transmission loss of about 10%, which will correspond roughly to a +120 ppm N2O bias in a N2O free sample. The cross-sensitivity between H2O and CH4 is of higher magnitude, considering the overall low CH4 transmission signal measured on the LPL channel in the 0–2500 ppm CH4 range. As shown in Figure 7 (right panel), a 2.2%v H2O concentration (which corresponds to, for instance, 70% RH at 25 °C) in a CH4 free sample will cause a bias of about +300 ppm in the reported CH4 value.

4. Discussion

Our presented K96 Sensor Core is a highly compact and mass-manufacturable multi-gas sensor combining up to three NDIR White Cell designs fused to one single compact optical cell that, thus, facilitates the monitoring of three gases simultaneously. The sensor combines three NDIR propagation channels, the SPL of 24 cm, the MPL of 36 cm, and the LPL offering 48 cm. The flexibility of the sensing platform can be application-specific and configured to monitor a variety of gases with specific absorption spectrum in the IR wavelength range. The concept is based on the wavelength selective filter that reflects the IR radiation for further propagation, while only allowing the transmission of the gas-specific IR wavelength band to the detector. We have proven this adaptability for four gases, CO2, CH4, N2O, and H2O. Furthermore, we integrated all required readout electronics to the optical cell in a very compact manner, allowing it to remain as a small-sized gas-sensing device. This enables an easy deployment, and the integrated memory and low-power consumption of the device facilitate autonomous field operation. At this stage, no advanced thermal stabilization has been added to the sensor. However, the small-sized sensor core facilitates its implementation into a thermally stabilized compartment. All gas measurements performed in this study confirm the functionality of the gas sensor and allow to benchmark the different gas channels. This has been shown by measuring CO2 utilizing the LPL and SPL channels. The LPL channel offers a higher sensitivity due to the longer interaction length of the gas and IR radiation. CH4 and H2O show very similar transmission curves, related to the specific absorption band and propagation path, and lower transmission signals than N2O and CO2.. Implementing the calibration curves to the device allowed us to monitor the gases on the LPL channel with a resolution of 0.1 ppm and 1 ppm for the SPL and MPL channels [42]. One advantage offered by the K96 multi-species feature is the capability to evaluate and compensate the cross-sensitivities (due to spectral overlap and absorption line broadening effect) between the gas species measured along the three NDIR channels. Interferences between CO2 and N2O measurements and from H2O on the CH4 measurement have been addressed. When the sensor is subjected to real conditions, any occurring cross-sensitivities between the target gases and other potential trace gases need to be application-specifically assessed. These preliminary specifications address the needs and requirements for greenhouse gas emission monitoring. The gas sensor targets low-cost but medium precision gas monitoring, which makes it suitable for facilitating the assembly of dense CO2 urban gas-monitoring networks, and thus, helps cities to monitor their emissions. The rugged mechanical design manages even demanding environmental conditions, supported by an embedded temperature calibration model for temperature compensation. The multi-gas sensing feature provides an integrated humidity channel for the reliable determination of dry molar fractions in real-time. Aiming for a more complete characterization and classification of our sensor prototype, our future work will align with the technical specification from CEN, TS 17660-1:2021 “Air quality—Performance evaluation of air quality sensor systems—Part 1: Gaseous pollutants in ambient air”. This provides a general framework for AQ gas sensor classification, and within this reference, the K96 Sensor Core meets the repeatability criteria of 14 ppm CO2 for “Class 1” sensors, which are sensors compliant with more stringent specifications for AQ studies.
Furthermore, the gas-sensing platform can be a viable solution to monitor, at a lower cost, CH4 and N2O concentrations in the vicinity of point or diffuse sources. The CH4 leaking detection in the Oil and Gas industry is becoming crucial to reduce the sector’s emissions. The multi-channel sensing option with its in-built cross-sensitivity management and remote deployment capability allows for an effective monitoring with low maintenance and operating costs, in compliance with the US EPA-proposed new emission reduction practices [43]. Beyond that, there are also needs for better monitoring of the CH4 and N2O emissions in space and time from landfill sites and wastewater treatment plants. This requires medium-precision, low-cost solutions with easy deployment capabilities, as offered by the K96 Sensor Core.

5. Conclusions

We presented a highly compact NDIR multi-gas sensor prototype. Designed for low-cost mass production, the K96 Sensor Core features a new optical design to measure, from the same IR broadband light source, up to three gases simultaneously, with three different optical pathlengths (24, 36, and 48 cm). In the current development state, we verified the operation of the sensor system in three configurations to measure CO2, CH4, or N2O with sub-ppm resolution in combination with H2O and CO2 for monitoring with a 1 ppm resolution. We showed that, at 1Hz measurement frequency, the precision assessed in stable conditions of Allan Deviation experiments is better than 0.1 ppm for both CO2 and N2O, about 0.4 ppm for CH4, and 2 ppm for H2O. The multi-channel gas sensor features the unique capability of managing potential cross-sensitivities between the different NDIR channels, as reported for CO2 with N2O and for H2O with CH4. With integrated readout electronics, an internal memory, an embedded temperature compensation in the firmware, and a rugged mechanical design, the K96 is a complete platform. It offers medium-to-high precision at low power consumption (<0.5 W) in a very compact design and provides enhanced stability, as shown by the Allan deviation experiment. Thus, the sensor system is highly suitable for a wide range of applications aiming to identify, monitor, and better assess GHG emissions. We are targeting markets with a clear need for ‘good enough’ and low-cost solutions, such as for the detection of localized, elevated gas concentration levels released by point sources. Currently able to measure CO2, CH4, N2O, and H2O, the versatile K96 Sensor Core can be adapted to measure other IR-absorbing gases like CO, for instance.

Author Contributions

Conceptualization, B.W., C.H., M.B., H.R., H.M. and S.S.; methodology, B.W., C.H., M.B., H.R., H.M. and S.S.; writing—original draft, B.W., C.H., M.B. and S.S.; writing—review & editing, B.W., C.H. and S.S. All authors have read and agreed to the published version of the manuscript.

Funding

This research has received funding from the ECSEL Joint Undertaking (JU) under grant agreement No 661796. This JU receives support from the European Union’s Horizon 2020 research and innovation programme and Germany, Finland, Sweden, Italy, Austria, Hungary.

Institutional Review Board Statement

Not applicable.

Informed Consent Statement

Not applicable.

Data Availability Statement

Data from the experiments described here are available from the corresponding authors upon request.

Acknowledgments

Authors want to acknowledge Viktoriia Ufimtsev for their valuable contribution with the K96 characterization and Johan Jason for their support with data visualization.

Conflicts of Interest

The authors declare no conflict of interest.

References

  1. Hodgkinson, J.; Tatam, R.P. Optical gas sensing: A review. Meas. Sci. Technol. 2012, 24, 012004. [Google Scholar] [CrossRef] [Green Version]
  2. Jha, R.K. Non-dispersive infrared gas sensing technology: A review. IEEE Sens. J. 2022, 22, 6–15. [Google Scholar] [CrossRef]
  3. Liu, X.; Cheng, S.; Liu, H.; Hu, S.; Zhang, D.; Ning, H. A survey on gas sensing technology. Sensors 2012, 12, 9635. [Google Scholar] [CrossRef] [PubMed] [Green Version]
  4. Hummelgård, C.; Bryntse, I.; Bryzgalov, M.; Henning, J.-Å.; Martin, H.; Norén, M.; Rödjegård, H. Low-cost NDIR based sensor platform for sub-ppm gas detection. Urban Clim. 2015, 14, 342–350. [Google Scholar] [CrossRef]
  5. Dinh, T.-V.; Choi, I.-Y.; Son, Y.-S.; Kim, J.-C. A review on non-dispersive infrared gas sensors: Improvement of sensor detection limit and interference correction. Sens. Actuators B Chem. 2016, 231, 529–538. [Google Scholar] [CrossRef]
  6. Bernard, P.; Labranche, B. Modified NDIR technique for HF monitoring in an industrial environment. In Proceedings of the Lasers and Materials in Industry and Opto-Contact Workshop, Quebec, Canada, 13–16 July 1998. [Google Scholar] [CrossRef]
  7. Frodl, R.; Tille, T. A high-precision NDIR CO2 gas sensor for automotive applications. IEEE Sens. J. 2006, 6, 1697–1705. [Google Scholar] [CrossRef]
  8. Russi, L.; Guidorzi, P.; Pulvirenti, B.; Semprini, G.; Aguiari, D.; Pau, G. Air quality and comfort characterisation within an electric vehicle cabin. In Proceedings of the 2021 IEEE International Workshop on Metrology for Automotive (MetroAutomotive), Bologna, Italy, 1–2 July 2021. [Google Scholar] [CrossRef]
  9. Hok, B.; Pettersson, H.; Andersson, A.K.; Haasl, S.; Akerlund, P. Breath analyzer for alcolocks and screening devices. IEEE Sens. J. 2010, 10, 10–15. [Google Scholar] [CrossRef]
  10. Schröder, S.; Briano, F.O.; Rödjegård, H.; Bryzgalov, M.; Orelund, J.; Gylfason, K.B.; Stemme, G.; Niklaus, F. A large-area single-filament infrared emitter and its application in a spectroscopic ethanol gas sensing system. Microsyst. Nanoeng. 2021, 7, 87. [Google Scholar] [CrossRef]
  11. Turner, A.J.; Shusterman, A.A.; McDonald, B.C.; Teige, V.; Harley, R.A.; Cohen, R.C. Network design for quantifying urban CO2 emissions: Assessing trade-offs between precision and network density. Atmos. Chem. Phys. 2016, 16, 13465–13475. [Google Scholar] [CrossRef] [Green Version]
  12. Arzoumanian, E.; Vogel, F.R.; Bastos, A.; Gaynullin, B.; Laurent, O.; Ramonet, M.; Ciais, P. Characterization of a commercial lower-cost medium-precision non-dispersive infrared sensor for atmospheric CO2 monitoring in urban areas. Atmos. Meas. Tech. 2019, 12, 2665–2677. [Google Scholar] [CrossRef] [Green Version]
  13. Müller, M.; Graf, P.; Meyer, J.; Pentina, A.; Brunner, D.; Pérez-Cruz, F.; Hüglin, C.; Emmenegger, L. Integration and calibration of non-dispersive infrared (NDIR) CO2 low-cost sensors and their operation in a sensor network covering Switzerland. Atmos. Meas. Tech. 2020, 13, 3815–3834. [Google Scholar] [CrossRef]
  14. Shusterman, A.A.; Kim, J.; Lieschke, K.J.; Newman, C.; Wooldridge, P.J.; Cohen, R.C. Observing local CO2 sources using low-cost, near-surface urban monitors. Atmos. Chem. Phys. 2018, 18, 13773–13785. [Google Scholar] [CrossRef] [Green Version]
  15. Delaria, E.R.; Kim, J.; Fitzmaurice, H.L.; Newman, C.; Wooldridge, P.J.; Worthington, K.; Cohen, R.C. The Berkeley environmental air-quality and CO2 network: Field calibrations of sensor temperature dependence and assessment of network scale CO2 accuracy. Atmos. Meas. Tech. 2021, 14, 5487–5500. [Google Scholar] [CrossRef]
  16. Shusterman, A.A.; Teige, V.E.; Turner, A.J.; Newman, C.; Kim, J.; Cohen, R.C. The Berkeley Atmospheric CO2 Observation Network: Initial evaluation. Atmos. Chem. Phys. 2016, 16, 13449–13463. [Google Scholar] [CrossRef] [Green Version]
  17. Skea, J.; Shuklaand, P.R.; Reisinger, A.; Slade, R.; Pathak, M.; Khourdajie, A.A.; Abdulla, K.A.R.v.D.A. IPCC: Summary for Policymakers, In: Climate Change 2022, Mitigation of Climate Change. Contribution of Working Group III to the IPCC Sixth Assessment Report. 2022. Available online: https://www.ipcc.ch/report/ar6/wg2/downloads/report/IPCC_AR6_WGII_SummaryForPolicymakers.pdf (accessed on 22 August 2022).
  18. Saunois, M.; Stavert, A.R.; Poulter, B.; Bousquet, P.; Canadell, J.G.; Jackson, R.B.; Raymond, P.A.; Dlugokencky, E.J.; Houweling, S.; Patra, P.K.; et al. The global methane budget 2000–2017. Earth Syst. Sci. Data 2020, 12, 1561–1623. [Google Scholar] [CrossRef]
  19. Karakurt, I.; Aydin, G.; Aydiner, K. Sources and mitigation of methane emissions by sectors: A critical review. Renew. Energy 2012, 39, 40–48. [Google Scholar] [CrossRef]
  20. Dangal, S.; Tian, H.; Zhang, B.; Pan, S.; Lu, C.; Yang, J. Methane emission from global livestock sector during 1890–2014: Magnitude, trends and spatiotemporal patterns. Glob. Change Biol. 2017, 23, 4147–4161. [Google Scholar] [CrossRef]
  21. Pétron, G.; Karion, A.; Sweeney, C.; Miller, B.; Montzka, S.; Frost, G.J.; Trainer, M.; Tans, P.; Andrews, A.; Kofler, J.; et al. A new look at methane and nonmethane hydrocarbon emissions from oil and natural gas operations in the Colorado Denver-Julesburg Basin. J. Geophys. Res. Atmos. 2014, 119, 6836–6852. [Google Scholar] [CrossRef]
  22. Gaalfalk, M.; Nilsson Påledal, S.; Sehlen, R.; Bastviken, D. Ground-based remote sensing of CH4 and N2O fluxes from a wastewater treatment plant and nearby biogas production with discoveries of unexpected sources. Environ. Res. 2021, 204, 111978. [Google Scholar] [CrossRef]
  23. Sonderfeld, H.; Bösch, H.; Jeanjean, A.; Riddick, S.; Allen, G.; Ars, S.; Davies, S.; Harris, N.; Humpage, N.; Leigh, R.; et al. CH4 emission estimates from an active landfill site inferred from a combined approach of CFD modelling and in situ FTIR measurements. Atmos. Meas. Tech. 2017, 10, 3931–3946. [Google Scholar] [CrossRef] [Green Version]
  24. Schuur, E.A.G.; McGuire, A.D.; Schädel, C.; Grosse, G.; Harden, J.W.; Hayes, D.J.; Hugelius, G.; Koven, C.D.; Kuhry, P.; Lawrence, D.M.; et al. Climate change and the permafrost carbon feedback. Nature 2015, 520, 171–179. [Google Scholar] [CrossRef] [PubMed]
  25. Fox, T.; Barchyn, T.; Risk, D.; Ravikumar, A.; Hugenholtz, C. A review of close-range and screening technologies for measuring fugitive methane emissions in upstream oil and gas. Environ. Res. Lett. 2019, 14, 053002. [Google Scholar] [CrossRef]
  26. Ravikumar, A.P.; Brandt, A.R. Designing better methane mitigation policies: The challenge of distributed small sources in the natural gas sector. Environ. Res. Lett. 2017, 12, 044023. [Google Scholar] [CrossRef] [Green Version]
  27. Nisbet, E.G.; Fisher, R.E.; Lowry, D.; France, J.L.; Allen, G.; Bakkaloglu, S.; Broderick, T.J.; Cain, M.; Coleman, M.; Fernandez, J.; et al. Methane mitigation: Methods to reduce emissions, on the path to the Paris Agreement. Rev. Geophys. 2020, 58, e2019RG000675. [Google Scholar] [CrossRef]
  28. Mønster, J.; Kjeldsen, P.; Scheutz, C. Methodologies for measuring fugitive methane emissions from landfills—A review. Waste Manag. 2019, 87, 835–859. [Google Scholar] [CrossRef]
  29. Bastviken, D.; Nygren, J.; Schenk, J.; Massana, R.P.; Duc, N.T. Technical note: Facilitating the use of low-cost methane (ch4) sensors in flux chambers-calibration, data processing, and an open-source make-it-yourself loggerTechnical note: Facilitating the use of low-cost methane (ch4) sensors in flux chambers-calibration, data processing, and an open-source make-it-yourself logger. Biogeosciences 2020, 17, 3659–3667. [Google Scholar] [CrossRef]
  30. Collier-Oxandale, A.; Casey, J.G.; Piedrahita, R.; Ortega, J.; Halliday, H.; Johnston, J.; Hannigan, M.P. Assessing a low-cost methane sensor quantification system for use in complex rural and urban environments. Atmos. Meas. Tech. 2018, 11, 3569–3594. [Google Scholar] [CrossRef] [Green Version]
  31. Mahbub, P.; Noori, A.; Parry, J.; Davis, J.; Lucieer, A.; Macka, M. Continuous and real-time indoor and outdoor methane sensing with portable optical sensor using rapidly pulsed IR LEDs. Talanta 2020, 218, 121144. [Google Scholar] [CrossRef]
  32. Zhu, Z.; Xu, Y.; Jiang, B. A one ppm NDIR methane gas sensor with single frequency filter denoising algorithm. Sensors 2012, 12, 12729–12740. [Google Scholar] [CrossRef] [Green Version]
  33. Schröder, S.; Wastine, B.; Bryzgalov, M.; Hummelgård, C.; Rödjegård, H.; Martin, H. Highly compact multi-spectral non-dispersive infrared gas sensor for large-scale deployment. Presented at the IEEE Sensors 2022 conference, Dallas, TX, USA, 30 October–2 November 2022. Paper 2402. [Google Scholar]
  34. Beer. Bestimmung der Absorption des rothen Lichts in farbigen Flüssigkeiten. Ann. Der Phys. Und Chem. 1852, 162, 78–88. [Google Scholar] [CrossRef] [Green Version]
  35. Martin, H.; Rödjegård, H. Multi-Channel Gas Sensor. Patent No. WO2020263155A1, 2020. [Google Scholar]
  36. White, J.U. Long Optical Paths of Large Aperture. J. Opt. Soc. Am. 1942, 32, 285. [Google Scholar] [CrossRef]
  37. Werle, P.; Muecke, R.; Slemr, F. The limits of signal averaging in atmospheric trace-gas monitoring by tunable diode-laser absorption spectroscopy (TDLAS). Appl. Phys. B Photophys. Laser Chem. 1993, 57, 131–139. [Google Scholar] [CrossRef]
  38. Land, D.V.; Levick, A.P.; Hand, J.W. The use of the Allan deviation for the measurement of the noise and drift performance of microwave radiometers. Meas. Sci. Technol. 2007, 18, 1917–1928. [Google Scholar] [CrossRef] [Green Version]
  39. Martin, C.R.; Zeng, N.; Karion, A.; Dickerson, R.R.; Ren, X.; Turpie, B.N.; Weber, K.J. Evaluation and environmental correction of ambient CO2 measurements from a low-cost NDIR sensor. Atmos. Meas. Tech. 2017, 10, 2383–2395. [Google Scholar] [CrossRef] [PubMed]
  40. IEC 60079-29-1:2016; TC 31—Equipment for Explosive Atmospheres—Part 29-1: Gas Detectors—Performance Requirements of Detectors for Flammable Gases. IEC: Geneva, Switzerland, 2016.
  41. TS 17660-1:2021; Air Quality—Performance Evaluation of Air Quality Sensor Systems—Part 1: Gaseous Pollutants in Ambient Air. CEN: Brussels, Belgium, 2022.
  42. Senseair, A.B. Unpublished datasheet of K96. Senseair, 2022.
  43. US EPA. Standards of Performance for New, Reconstructed, and Modified Sources and Emissions Guidelines for Existing Sources: Oil and Natural Gas Sector Climate Review. Available online: https://www.federalregister.gov/documents/2021/11/15/2021-24202/standards-of-performance-for-new-reconstructed-and-modified-sources-and-emissions-guidelines-for (accessed on 23 August 2022).
Figure 1. Absorption bands of carbon dioxide (CO2), methane (CH4), nitrous oxide (N2O) and water vapor (H2O). Spectra are simulated using data from HITRAN (http://hitran.iao.ru/ accessed on 13 March 2022) for an optical length of 1 m and gas species mole fractions set to 1 ppm.
Atmosphere 13 01789 g001
Figure 2. Schematic illustration of the K96 sensor multi-gas sensing principle. The patented multi-spectral sensor fuses three individual NDIR White Cell configurations. The two opposing spherical mirrors define the length of the individual optical propagation paths. One of the mirrors houses the IR emitter and the three wavelength selective detectors.
Atmosphere 13 01789 g002
Figure 3. CAD drawing of the Sensor Core containing the optical cell and the complete readout electronics to digitize the reading of the three detectors from the Long-, Medium- and Short-Pass Length. To avoid contamination from dust or particles, a filter is installed on top of the optical cell.
Atmosphere 13 01789 g003
Figure 4. Transmission curves, as established experimentally at a temperature of 25 °C, for multiple K96 sensing channels against the target gas concentration in ppm.
Atmosphere 13 01789 g004
Figure 5. Allan deviation log plots as derived experimentally for CO2 (measured in both LPL and SPL channels), H2O (MPL channel), and for CH4 and N2O (LPL channel) by measuring a dry ‘zero gas’ (Nitrogen) over a 60 h period in stable lab conditions (temperature kept constant at 20 °C).
Atmosphere 13 01789 g005
Figure 6. CO2 measured by one K96 sensor during the ‘fall’ response time experiment. At t = 0 s, the exposition chamber was lifted and the sensor, previously flushed with a high CO2 concentration from a cylinder, became exposed to room air.
Atmosphere 13 01789 g006
Figure 7. Left: N2O transmission signal as measured in function of the N2O concentration in the sample (with no CO2) and in function of the CO2 concentration (with no N2O). Right: CH4 transmission signal as measured in function of the CH4 concentration in the sample (with no H2O) and in function of the H2O concentration (with no CH4).
Atmosphere 13 01789 g007
Table 1. List of the available gas-sensing configurations of the K96 sensor with respect to the different gas-sensing channels and resolutions.
LPL Channel
0.1 ppm Resolution
MPL Channel
1 ppm Resolution
SPL Channel
1 ppm Resolution
CO2H2O-
CH4H2OCO2
N2OH2OCO2
Table 2. Summary of the Allan deviation measurements of all measured gases, listing application-relevant integration times and the associated ppm levels, separated to the utilized propagation channels.
Integration Time
[s]
Allan Deviation
[ppm]
CO2-LPLN2O-LPLCH4-LPLH2O-MPLCO2-SPL
0.80.060.070.392.120.20
100.030.030.211.420.09
600.020.020.161.170.05
9000.020.010.141.020.03
Publisher’s Note: MDPI stays neutral with regard to jurisdictional claims in published maps and institutional affiliations.

