Article

Sounding Data from Ground-Based Microwave Radiometers for a Hailstorm Case: Analyzing Spatiotemporal Differences and Initializing an Idealized Model for Prediction

1
Shaanxi Key Laboratory of Earth Surface System and Environmental Carrying Capacity, College of Urban and Environmental Sciences, Northwest University, Xi’an 710127, China
2
Xi’an Institute of Meteorological Science and Technology, Northwest University, Xi’an 710127, China
*
Author to whom correspondence should be addressed.
Atmosphere 2022, 13(10), 1535; https://doi.org/10.3390/atmos13101535
Submission received: 25 July 2022 / Revised: 13 September 2022 / Accepted: 16 September 2022 / Published: 20 September 2022
(This article belongs to the Special Issue Characteristics and Attribution of Extreme Rainfall Events)

Abstract

:
Atmospheric physical sounding data from three ground-based microwave radiometers located in Xi’an were analyzed to explore the temporal and spatial differences of a hailstorm event and were initialized into an idealized Weather Research and Forecasting (WRF) model to predict the total evolution of the event, which occurred on 29 July 2019. Liquid water and relative humidity profiles revealed a consistent sequence of hailstorm intensity among observations from surface meteorological stations and the FY-4A satellite, where the precipitation and cloud top temperature intensified from north to south, corresponding to the locations of the ground-based microwave radiometers in Gaoling, Weiyang, and Chang’an. Compared with those of a similar storm without hail that occurred on 9 August 2018, the humidity profiles and heights at 0 °C and −20 °C exhibited more dramatic changes. The heights at 0 °C and −20 °C obviously increased with a low-value zone in the relative humidity profiles during the strongest stage of the hailstorm in Chang’an and Weiyang. Later, the heights sharply dropped in Chang’an when strong, downward ice-phased hydrometers occurred with hail production in the storm. A time-saving, idealized WRF simulation, initialized with pre-3-h sounding data from ground-based microwave radiometers, was designed to qualitatively predict this hailstorm. The simulations consistently showed a strong-to-weak intensity of storms from Chang’an to Weiyang to Gaoling. Although the first attempt at this model has uncertainties in both the observations and the model, it provides a potential new method for single-point fine hailstorm prediction.

1. Introduction

Hailstorms, one of the most severe convection events, often produce hail, which greatly threatens urban traffic, electricity, industry, and personal safety, mostly during the spring and summer months in China [1,2,3]. However, the accuracy of hail forecasting is relatively low and has a large uncertainty [4,5,6], because both observations of hailstorms and forecasting models for hailstorms currently face great difficulties [7]. The main reason for the difficulty in observing hailstorms is their fast evolution at a small spatial scale, with time scales of hours to minutes and spatial scales of 100 km to 1 km [8]. Many of the physical processes that run through the life cycle of strong convection events rapidly evolve at small spatial scales. Therefore, observations with equally high spatial and temporal resolutions are urgently needed for both analyzing hailstorms and predicting hailstorms [9,10,11]. However, ground-based and high-altitude observations with high spatial and temporal resolutions are scarce in most regions [12].
Ground-based microwave radiometers can continuously monitor vertical profiles of temperature, humidity, water vapor, etc. from the near-ground surface to a height of approximately 10 km using microwave signals from natural atmospheric radiation. In addition, these radiometers have the advantages of being able to be unattended for long periods, high spatial and temporal resolutions and high accuracy [13,14]. A comparison of the quality of the temperature, relative humidity, and water vapor data that are detected by ground-based microwave radiometers with air-sounding profiles shows a good correlation with traditional observations [15,16,17,18]. Ground-based microwave radiometer meteorological data have been tested for water vapor and liquid water-related observations. The results indicated that ground-based microwave radiometers are a stable reference for reducing the errors that arise from other sounding data, including ground-based data and satellite-based data [19,20].
Ground-based microwave radiometry is also a better method than radio sounding for thunderstorm cases because of the higher quality of the convection data it detects [21]. Using higher resolution, atmospheric vertical profile data from ground-based microwave radiometers helps determine that positive cloud–ground lightning flashes and precipitation are more strongly correlated in time and space than are negative cloud–ground lightning flashes in three intense lightning convective events in central China [22]. These applications of ground-based microwave radiometer data demonstrate the suitability of ground-based microwave radiometers for cloud observations and their great potential in strong convective storm observations. However, the application of ground-based microwave radiometers in observing the internal structural differences of hailstones and in predicting hail weather is still rare.
One of the most popular methods for predicting hailstorms at such small temporal and spatial scales is to obtain initial fields for the predictions by assimilating data into numerical models, which has super high computing costs [23,24,25,26,27,28]. Presently, although the application of ground-based microwave radiometer data in this method has been tested in some studies, it is still limited to a few sporadic attempts [29]. The assimilation of ground-based microwave radiometer data into Weather Research and Forecasting (WRF) models has a positive impact on the analysis and prediction of temperature and humidity, and the impact on the prediction of cumulative precipitation is more obvious [30,31]. However, these predictions used more than ten ground-based microwave radiometers or added Raman lidar, atmospheric emitted radiance interferometer and other data, which requires considerable computational power and funds. The assimilation of two ground-based microwave radiometer datasets during a 20 July 2016, Beijing rainstorm showed that the assimilation of ground-based microwave radiometer data improved early precipitation intensity and distribution predictions; however, as the storm system developed, the assimilation of two ground-based microwave radiometers had minimal impact on predicting intense precipitation systems in a large area [32]. Data assimilation has a positive impact on weather prediction. In contrast, high costs are required to provide the amount of data and computational power needed for this work. In particular, hailstorms are more sensitive to small-scale spatial and temporal differences, and their requirements for data assimilation are high. Data assimilation requires multiple data points, and using a single data point to initialize an idealized model for hailstorm prediction has not been attempted. The idealized WRF model is commonly applied to mechanistic analyses of weather processes. For example, idealized WRF models have been applied in large eddy simulations in previous studies [33,34]. In numerical weather prediction, idealized simulations are also employed to determine key microphysical effects on hail and other hydrometeor particles (cloud droplets, raindrops, ice crystals, snow, and gravel) at the cloud and ground levels [35,36]. WRF models have advanced numerical schemes, which are also essential for simulating hail storm processes. The idealized model has the advantage of reducing computational costs, using less than 5% of the computing time compared with that of a real numerical weather prediction case that assimilates polarimetric radar data under the same central processing unit (CPU) to complete the same simulation [37]. Due to the small amount of data needed for its domain design and the high flexibility in its storm triggers, the idealized model maximizes the accuracy of ground-based microwave radiometer data, which makes it possible to initialize an idealized model based on a single ground-based microwave radiometer dataset. Even though this prediction method has uncertainties, it attempts to make predictions with limited computational power and observations.
This paper analyzes the data observed by three ground-based microwave radiometers located in the Chang’an, Weiyang, and Gaoling districts in Xi’an during a hailstorm on 28 July 2019. We discuss the spatial and temporal disparities in the soundings of this hailstorm by comparing them with those of a similar convection event on 9 August 2018, whose main difference was that no hail was produced. Next, an application of an idealized WRF model that is initialized by pre-3-h, ground-based microwave radiometer data is tested for its hailstorm prediction performance. In Section 2, the sources of various types of data and the analysis methods are described. In Section 3, the hail process is systematically observed and analyzed by ground-based microwave radiometer data and simulated by the idealized WRF model. In Section 4, the conclusion and discussion are presented.

2. Methodology

2.1. Data Description

Three MWP967KV ground-based multichannel microwave radiometer observations, located in the Chang’an district (Chang’an station, N 34°5′28″ E 108°53′24″), Weiyang district (Xi’an station, N 34°18′22″ E 108°56′24″), and Gaoling district (Jinghe station, N 34°26′46″ E 108°58′19″) in Xi’an City, Shaanxi Province, China, were utilized. The data of the ground-based microwave radiometer were divided into three levels: Level 0 data comprised the signal voltage values received by each channel; Level 1 data were obtained by Level 0 data conversion and consisted of the bright temperature values observed by each channel; and Level 2 data were generated by Level 1 data and the inversion software that is installed in the ground-based microwave radiometer and that constituted the temperature, humidity, water vapor and liquid water profiles. In this paper, Level 2 data were applied for analysis, which had a very high resolution and good data quality. The specific performance is shown in Table 1. The same data quality of the same Level 2 data has also been demonstrated by numerous previous studies in convective weather monitoring [21,22,38,39,40]. To ensure the validity of the data, observations without missing omissions were selected for the study area and study period. The data record of the profiles contained temperature, water vapor concentration, relative humidity, and liquid water data at the observation point every two minutes, starting from an altitude of 358 m with a top height of 10,000 m and a minimum vertical interval of 50 m. All the data from the ground-based microwave radiometer employed in this paper have been proofread by the Xi’an Meteorological Bureau and North Sky-Dome Information Technology Company in Xi’an, China.
To analyze the evolution of the hailstorm and to compare it with another measurement, a satellite data product of real-time Fengyun-4A (FY-4A) cloud top temperature was selected http://satellite.nsmc.org.cn/ (accessed on 28-29 July 2019). The selected time ranged from 8:00 a.m. UTC on 28 July 2019 to 1:00 p.m. UTC on 29 July 2019, with a data resolution of 4000 m, and 165 sets of data files were generated daily over the study time range. To reveal the large-scale circulation and to provide a horizontal wind profile for an idealized simulation, the 0-h analysis data from the National Centers for Environmental Prediction (NCEP) Global Forecast System (GFS) Grids Historical Archive, with a 0.25 by 0.25 global latitude-longitude grid resolution, were employed https://rda.ucar.edu/datasets/ds084.1 (accessed on 28 July 2019 and 9 August 2018). Hourly rainfall data were selected from two surface weather stations, namely the Chang’an station (57039, N 34.08, E 108.88) and the Jinghe station (57131, N 34°25′48″, E 108°58′12″), located in Xi’an, Shaanxi Province, China. The selected periods ranged from 5:00 p.m. to 12:00 a.m. on 28 July 2019, and from 9:00 a.m. to 4:00 p.m. on 9 August 2018. The data were used to compare the difference in precipitation amounts between rainfall events and hail events over different areas.
A hailstorm case, which was accompanied by surface precipitation from 6:00 p.m. to 11:00 p.m. UTC on 28 July 2019 was selected for analysis and prediction, and the hail phenomenon was observed from 9:00 p.m. to 11:00 p.m. at the Lintong Observatory (hereafter referred to as the hail process). To highlight the differences between the hailstorm process and a similar convective process without hail, a precipitation process that occurred from 10:00 p.m. to 12:00 a.m. UTC on 9 August 2018 (hereafter referred to as the rainfall process), was selected for comparison. According to the records of the surface weather stations, both precipitation processes occurred in summer, with similar highest surface air temperatures greater than 30 °C and similar rainfall locations mainly in the Chang’an district, with approximately 30 mm of rainfall measured for both events and almost no rainfall at Jinghe station (Gaoling district). To obtain the complete duration of the storms, the time range was measured from the day before the precipitation occurrence to the day after the precipitation occurrence.

2.2. Circulation Characterization

The expressions for the potential temperature (θd) and pseudoequivalent (θse) potential temperature are:
θ s e = θ d e x p r s L v C p d T
θ d = T 1000 p k d
The gradient of the potential temperature and pseudoequivalent potential temperature with altitude is related to the degree of air mass stability as follows:
θ d z < 0   Absolutely   unstable θ d z 0 ,   θ s e z < 0   Unstable   conditions θ s e z 0   Absolute   stability
The water vapor mixing ratio in the idealized WRF model was calculated from the water vapor concentration data as follows:
P = P 0 1 H 44300 5.256
V = R T / P
M 1 = 1 M 0 V N 0 N 1
W = M 0 / M 1
where T is the atmospheric temperature in °C, Lv is the constant for latent heat of condensation of 2501 J/g, Cp is the constant-pressure specific heat of 1004.07 J/kg·K, R is the specific gas constant of 8.314, P is the air pressure in hPa, P0 is the sea level pressure of 1013.25 hPa, H is the altitude, V is the ideal gas volume per unit of substance in m3, M0 and M1 are the mass of water vapor and dry air per unit volume of wet air, respectively, in g, and N0 and N1 are the molar mass of water vapor and dry air, respectively, in g/mol [41].

2.3. Design of the Idealized WRF Model

The 3D idealized thunderstorm, which is a preset option in version 4.0.1 of the WRF model, was used to predict hailstorms. The flow of the model run is described as follows: the acquired observations are processed into the form required by the model. The processed data are imported into the corresponding WRF idealized model. The trigger mechanism of the model atmospheric process is set, and basic information such as the physical parameterization scheme, number and size of the model grid, model integration step and output time step are set. The model is run to obtain the simulation results.
To initialize this idealized model, four crucial sounding data types, including temperature, the water vapor mixing ratio, and radial and zonal wind were needed. Vertical temperature and water vapor mixing ratios were extracted at various heights from the three ground-based microwave radiometers in the Chang’an district, Weiyang district, and Gaoling district at a given preset 3-h time at 2:00 a.m. UTC on July 2019. Horizontal wind field data were extracted from the NCEP GFS data at the same point in time, as previously mentioned, from the nearest grid points to the locations of the three ground-based microwave radiometers and then interpolated onto the same vertical height of the ground-based microwave radiometer data. Next, these vertical single-point data were constructed into 3D homogeneous initial fields before running the idealized WRF model. At the beginning of the idealized model, ellipsoidal thermal bubbles (potential temperature perturbations) were released at the center of the domain. The horizontal radius and vertical radius of the thermal bubble were 10 km and 1.5 km, respectively. The potential temperature at the center of the bubble was 3 K higher than that in the ambient environment and radiated progressively closer to the ambient potential temperature. Perturbation of the thermal bubble was the trigger condition for convection in the idealized model.
The simulation was performed in an area of 60 km × 60 km with a grid spacing of 500 m in the horizontal direction and a total of 70 layers in the vertical direction. The lower ground layer was flat and had no surface flux. The time step of the model calculation was 3 s. The simulations were performed for 60 min, and the results were outputted every 10 min. The simulations did not consider the effect of Coriolis acceleration, radiation, boundary layer processes, and surface and ground processes. The cumulus cloud parameterization process was not utilized because of the relatively high spatial resolution in the simulation. The microphysical processes were parameterized using the double-moment microphysics scheme of the National Severe Convective Storm Laboratory (NSSL) [42,43,44]. The NSSL scheme predicts the mass and number mixing ratios of six water condensates, including cloud droplets, rain droplets, cloud ice, snow, graupel, and hail, which play a key role in radar reflectivity factor diagnosis.

3. Results

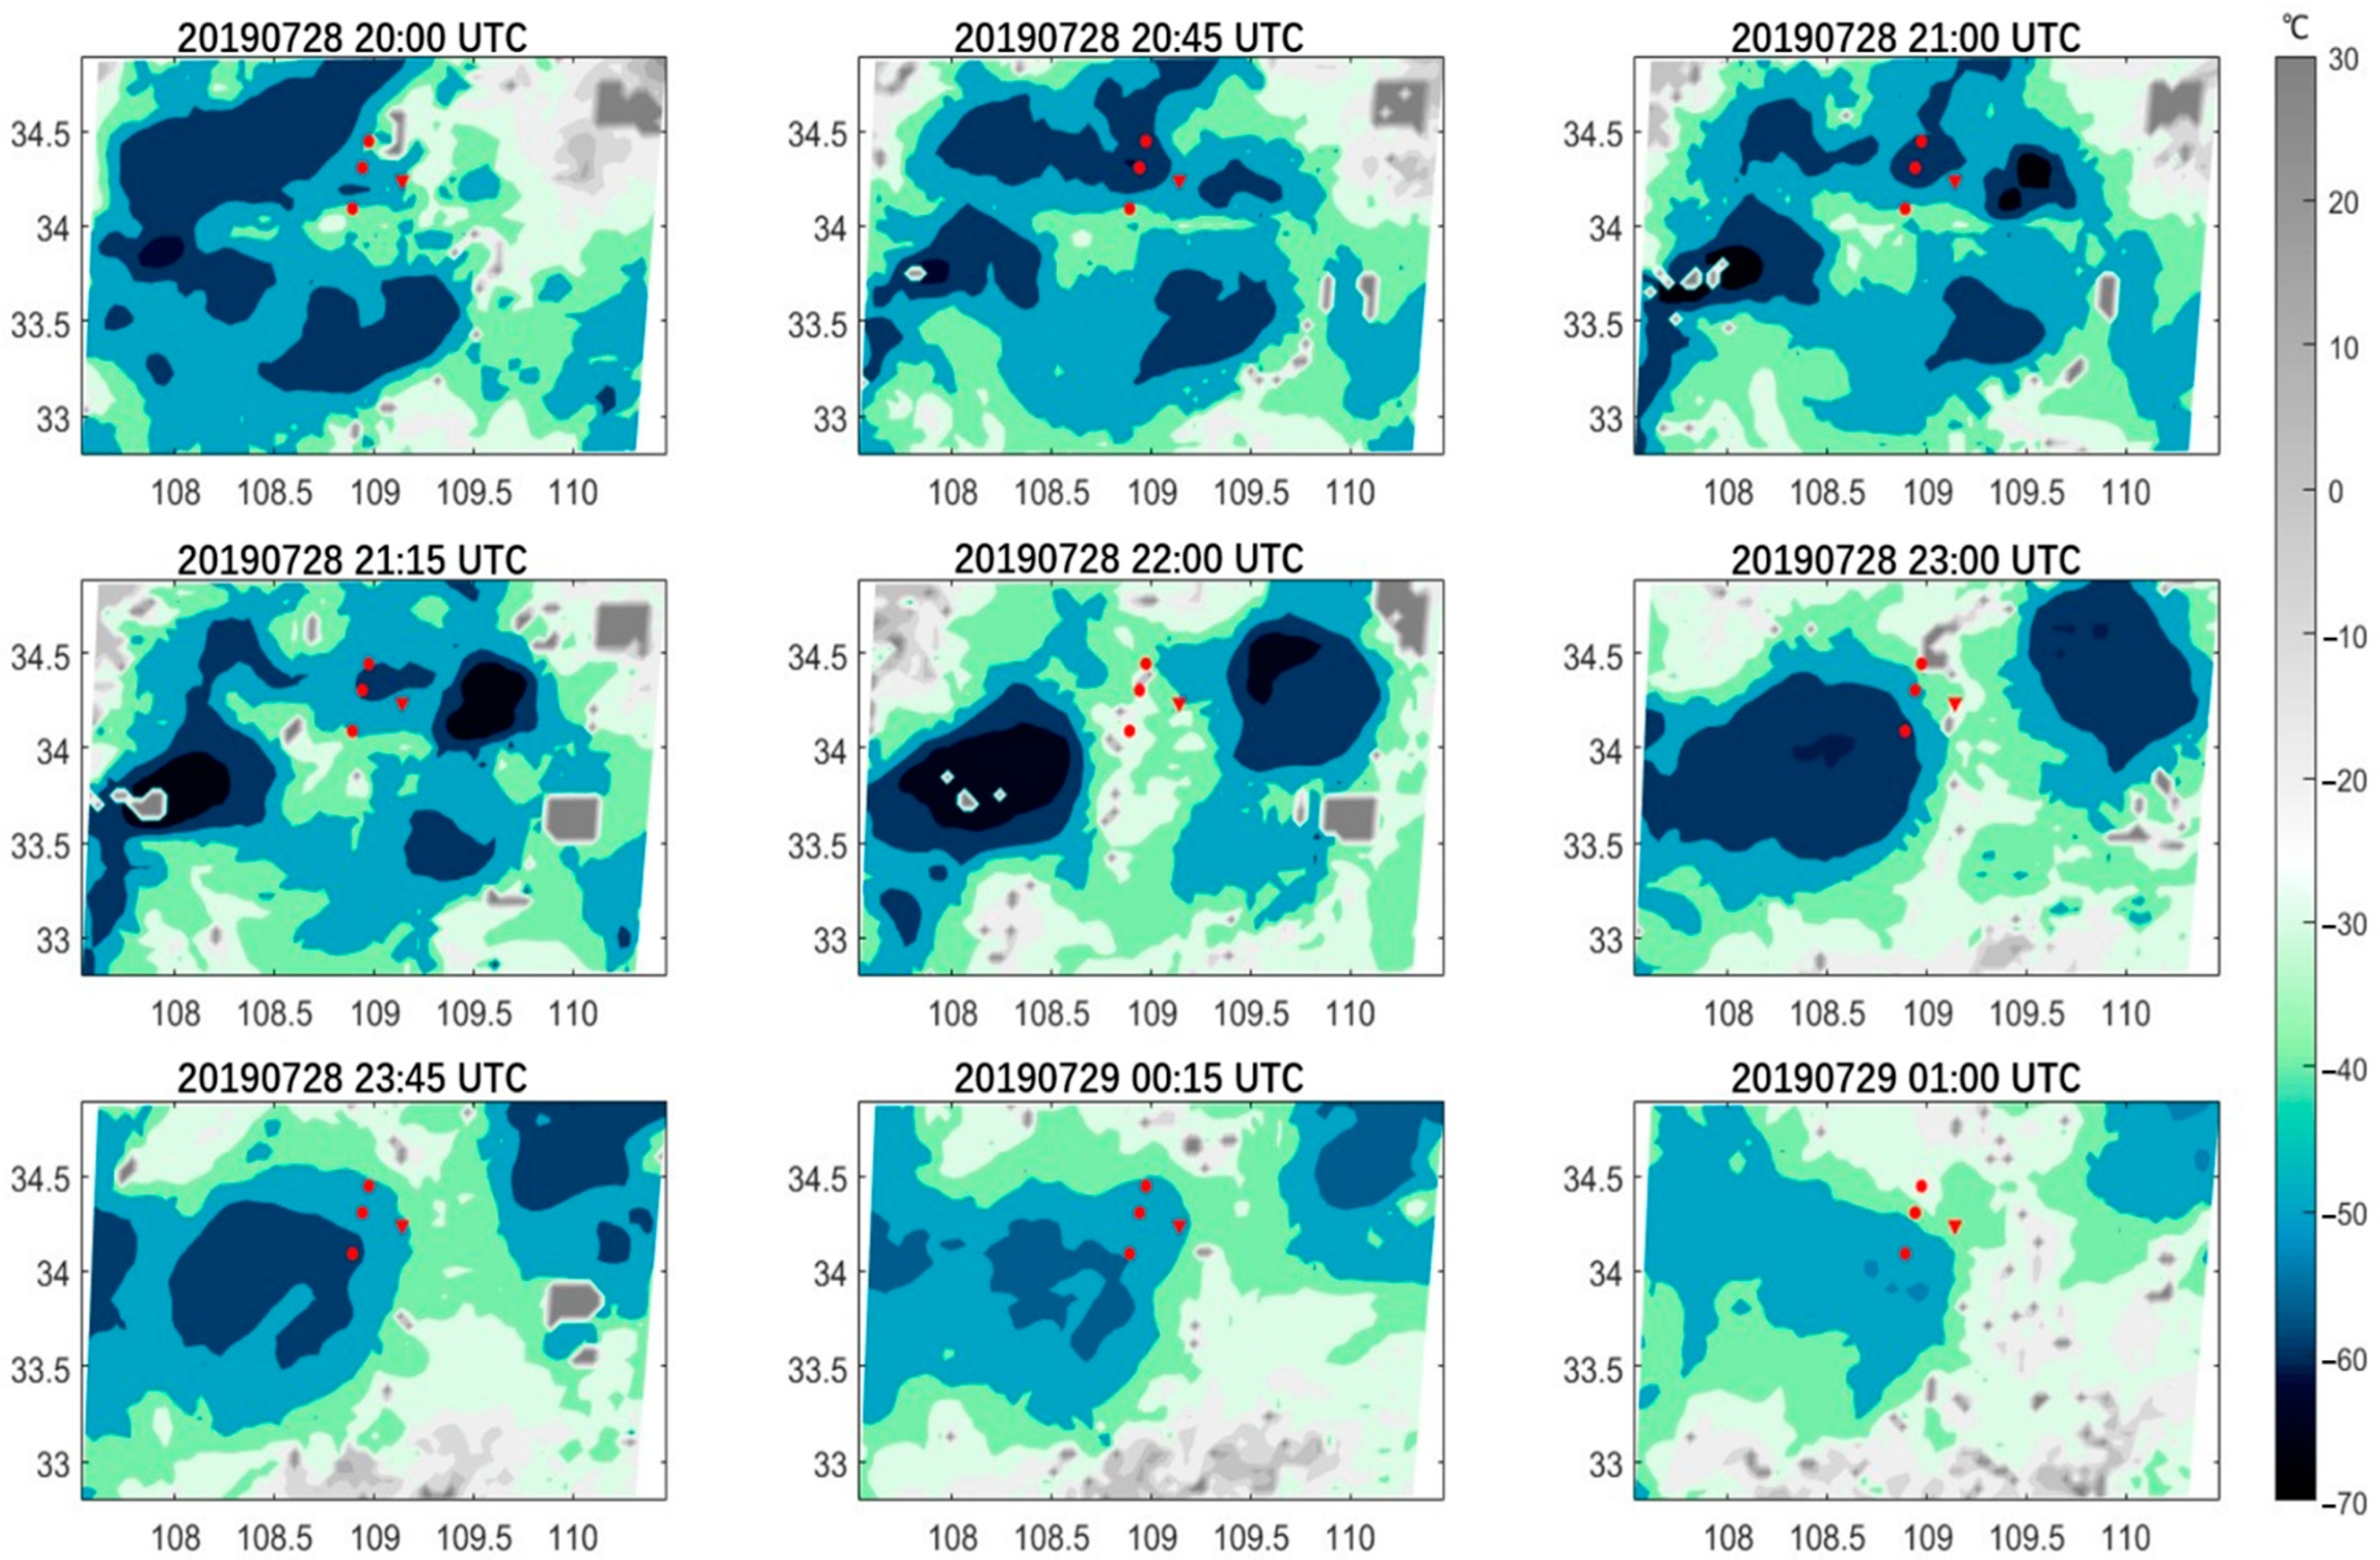
3.1. Satellite Data Analysis

Satellite observations allowed for a general analysis of the cloud top data change process during this intense convective storm. Cloud top temperature (CTT) contour maps before and after the hailing process in the vicinity of the study area were plotted from FY-4A satellite remote sensing data. Figure 1 shows that the cumulus field in the air formed before hail was observed and covered the study area at 8:00 p.m. UTC on 28 July, after which the cumulus field shifted to the east. At 9:00 p.m. UTC, hail was recorded at the Lintong station, which was located at the center of the cumulus field, and the cumulus field started to show a tendency to gather. At 10:00 p.m. UTC, the cumulus field gathered into two cells located in the southwestern and northeastern parts of the study area. The northeastern unit was not discussed during the follow-up, whereas the southwestern unit continued to move eastward and moved over the observatory in the Chang’an district at 23:00 UTC. At this point, the cloud top temperatures in the vicinity of the three ground-based microwave radiometers showed a decrease from north to south, which also occurred at the end of the hailfall at the Lintong station. Thereafter, the two cumulus monoliths gradually weakened and disappeared, signifying the end of this strong convective process.
Although the cloud top temperature revealed the process of cloud top change during this strong convective storm process, there was a lack of intracloud information. During this hailstorm process, the Lintong station where hail was observed was not at the center of the cumulus field during the cumulus process, which indicates that it is difficult to determine the location of this hail occurrence based on cloud top data alone. Cloud top atmospheric parameters are related to the vertical height of the convective cloud top, while they are not related to the formation of hail directly due to complex cloud processes in convection. Information on temperature, humidity, and wind at different heights within the clouds has a significant effect on hail formation. Additionally, it is difficult to determine whether the hailing process occurred using satellite cloud top data analysis, and a comparative analysis of the rainfall process and the strong convective storm should be performed to highlight the differences in the strong convective storm process.

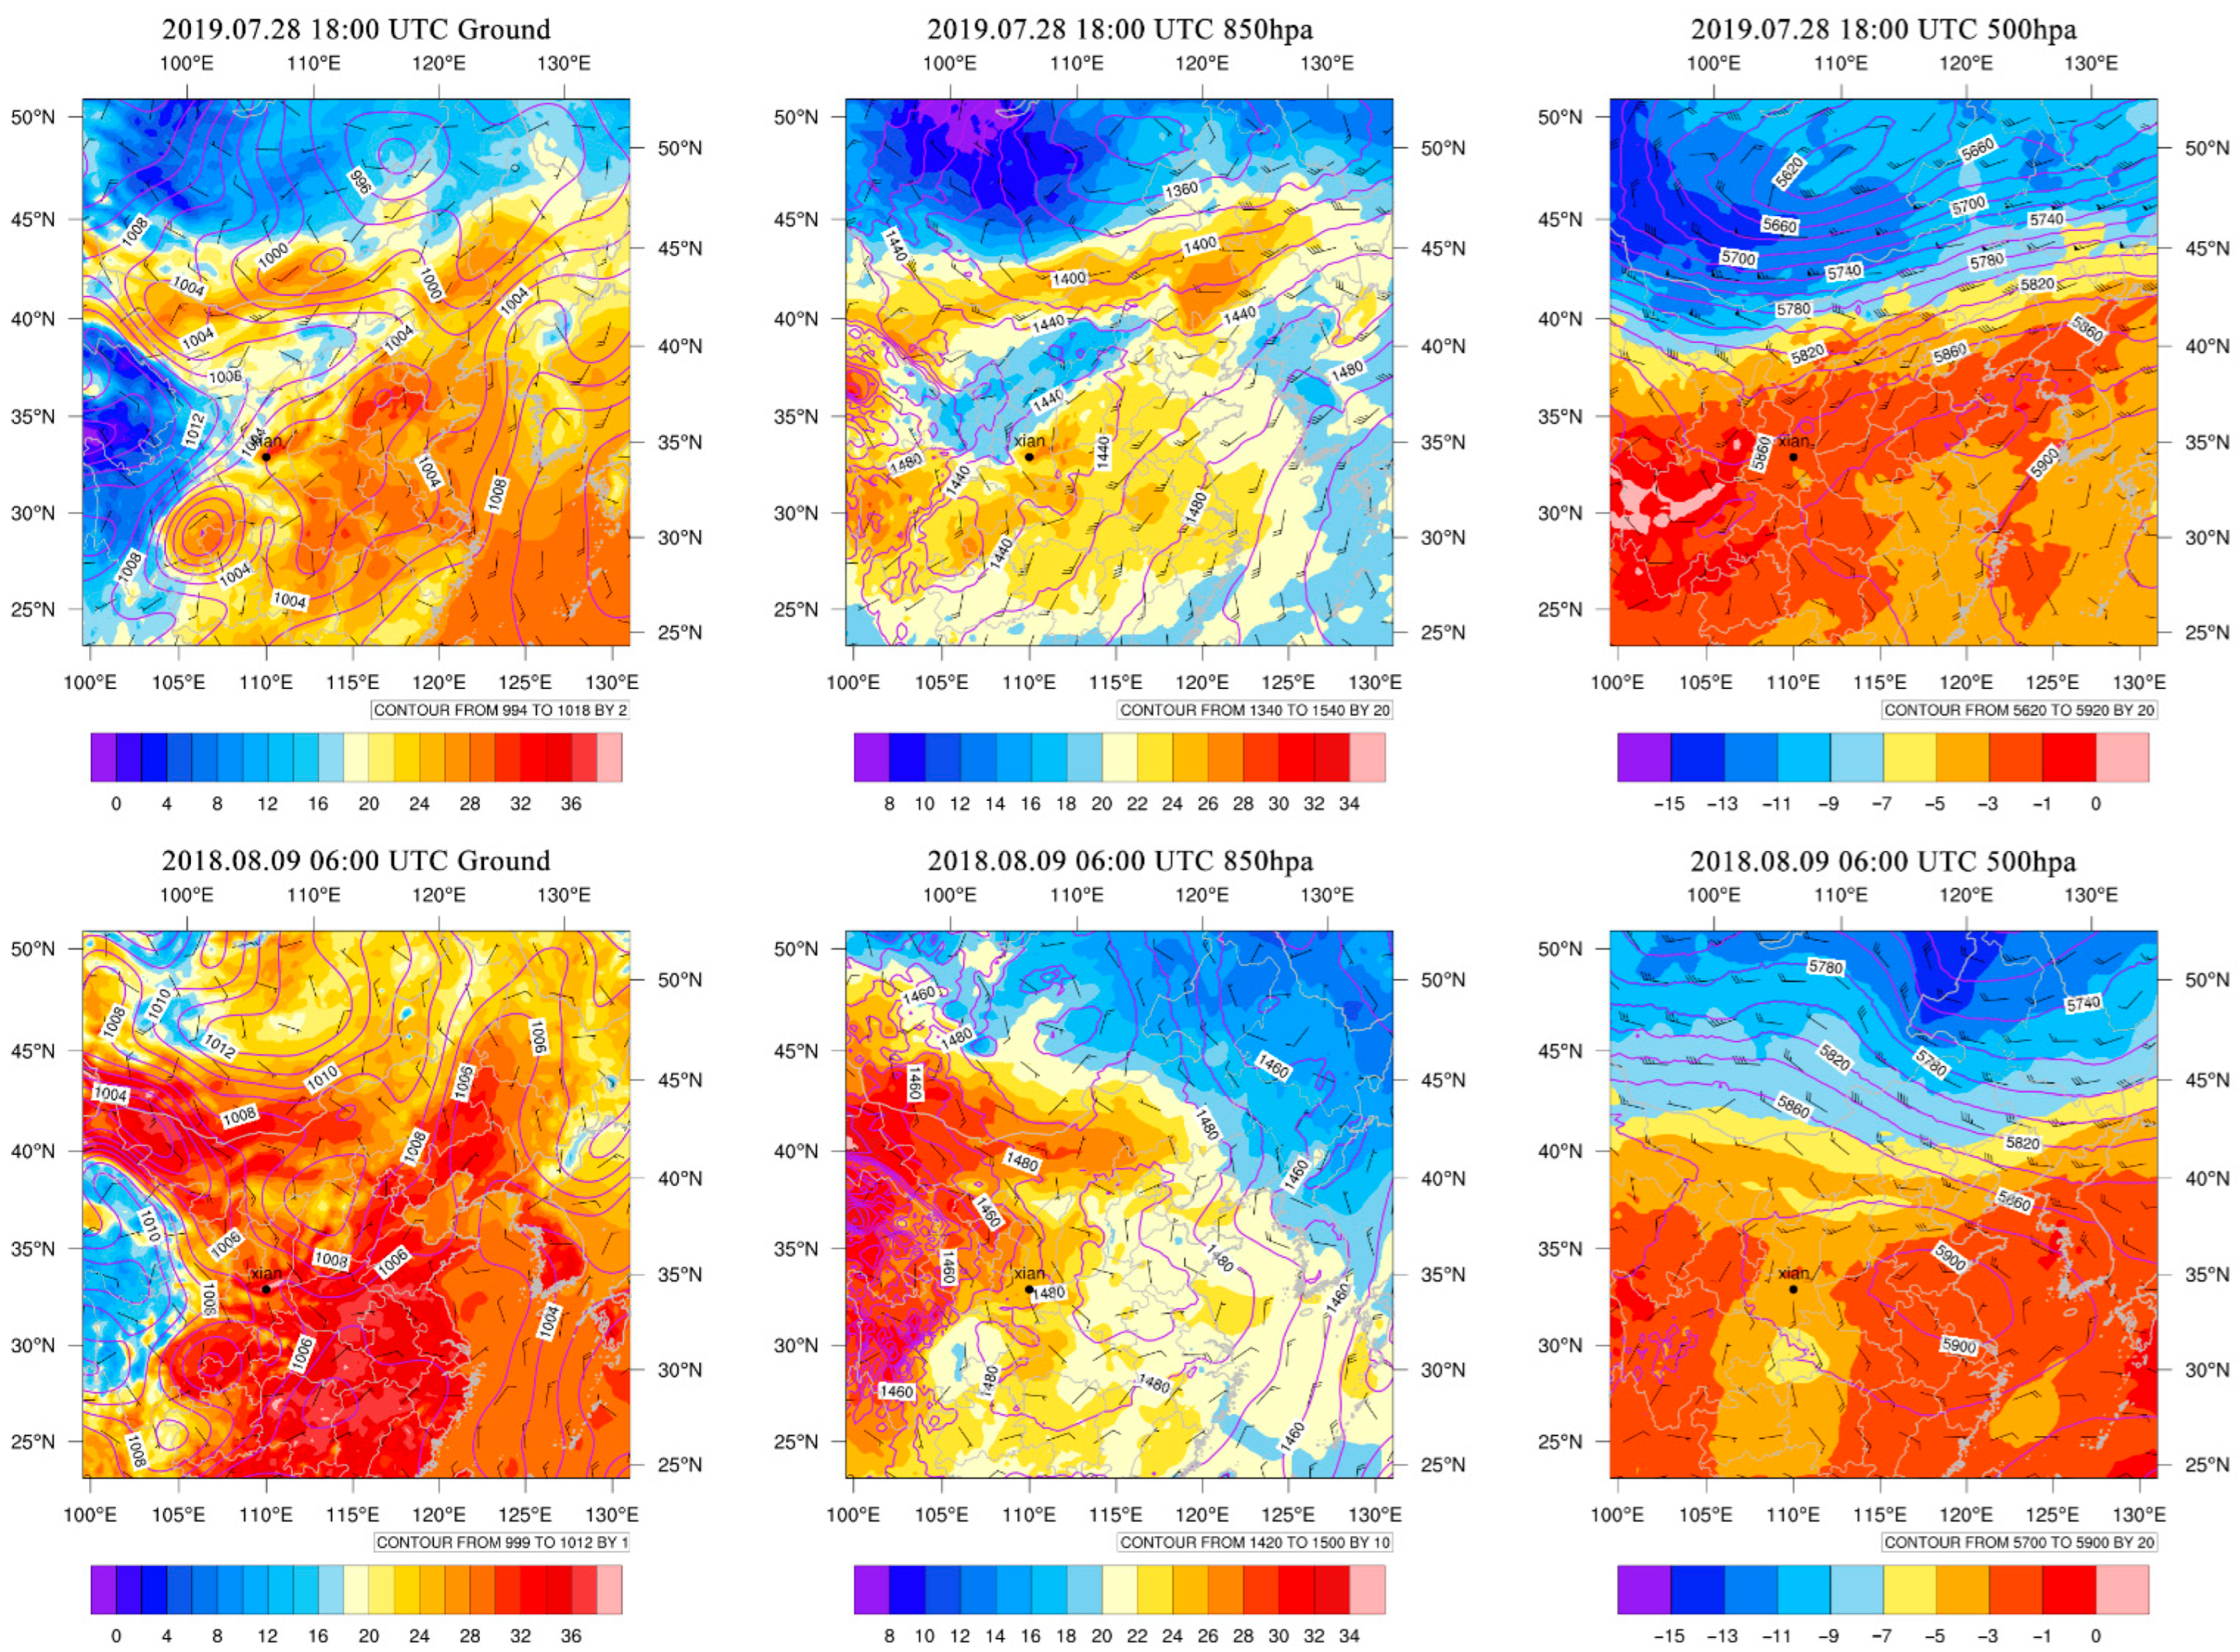
3.2. Circulation Characterization

A rainfall event with a similar convective background, which occurred on 9 August 2018, was selected for comparison with the abovementioned hailstorm case. The time duration of the data from the ground-based microwave radiometer was from one day before the beginning of the single rainfall process started to the day it ended, which was coherent without interference from other rainfall processes. In the process of rainfall and hailfall, the precipitation observed by the Chang’an and Jinghe (in Gaoling) meteorological stations is shown in Figure 2. The intensities of the two precipitations were relatively similar—both exceeded 20 mm in the most intense two-hour period in Changan, whereas Jinghe produced much less or even no precipitation in the same period. Both of these cases presented strong local and convective properties.
The initial field data corresponding to two precipitation times were selected from NCEP GFS data. The 500 hPa, 850 hPa and sea level data were analyzed with temperature, potential height (sea level barometric field) and wind fields (Figure 3). Before the hailfall process, the temperature of the surface hot center where Xi’an was located exceeded 30 degrees Celsius, which was very favorable for the formation of unstable laminations. The eastern part of Xi’an was dominated by southeasterly winds, and the western part was dominated by northwesterly winds. Xi’an was located at the ground cyclonic convergence center, which extended from the ground to 850 hPa and was favorable for triggering power updrafts. At 500 hPa, Xi’an was located on the southeast side of the high-altitude, low-pressure trough. The large-scale circulation characteristics were very favorable for triggering strong convective weather, which was dominated by southwest winds and warm advection carrying sufficient water vapor. Before the rainfall process, Xi’an was also in the center of a high-temperature center, where the ground center temperature had exceeded 30 degrees Celsius, dominated by southeasterly winds, and the high altitude was located on the southwest side of the continental high-pressure center. The wind direction gradually changed to be dominated by southerly winds, accompanied by warm advection and carrying sufficient water vapor, which was also favorable for triggering strong convective weather. Although the two precipitation processes differed in large-scale circulation background, both had obvious features that triggered strong convective weather. Prior efforts toward addressing the large-scale circulation related characteristics, potentially giving the information on convective storms. However, the accuracy of the data is relatively low and not sufficient at convection-permitting scales for hail producing. To analyze the different precipitation phase differences between the two processes, it is necessary to analyze more detailed cloud structure features of these two processes using high-spatial and temporal resolution and ground-based microwave radiometer observations.

3.3. Hail Weather Analysis Based on a Ground-Based Microwave Radiometer

The data of the liquid water profile, relative humidity profile, and temperature profile before and after hail was observed were analyzed by a ground-based microwave radiometer, and the two precipitation processes were compared in terms of water vapor, temperature, and unstable energy, focusing on the differences between the hailfall and rainfall processes.

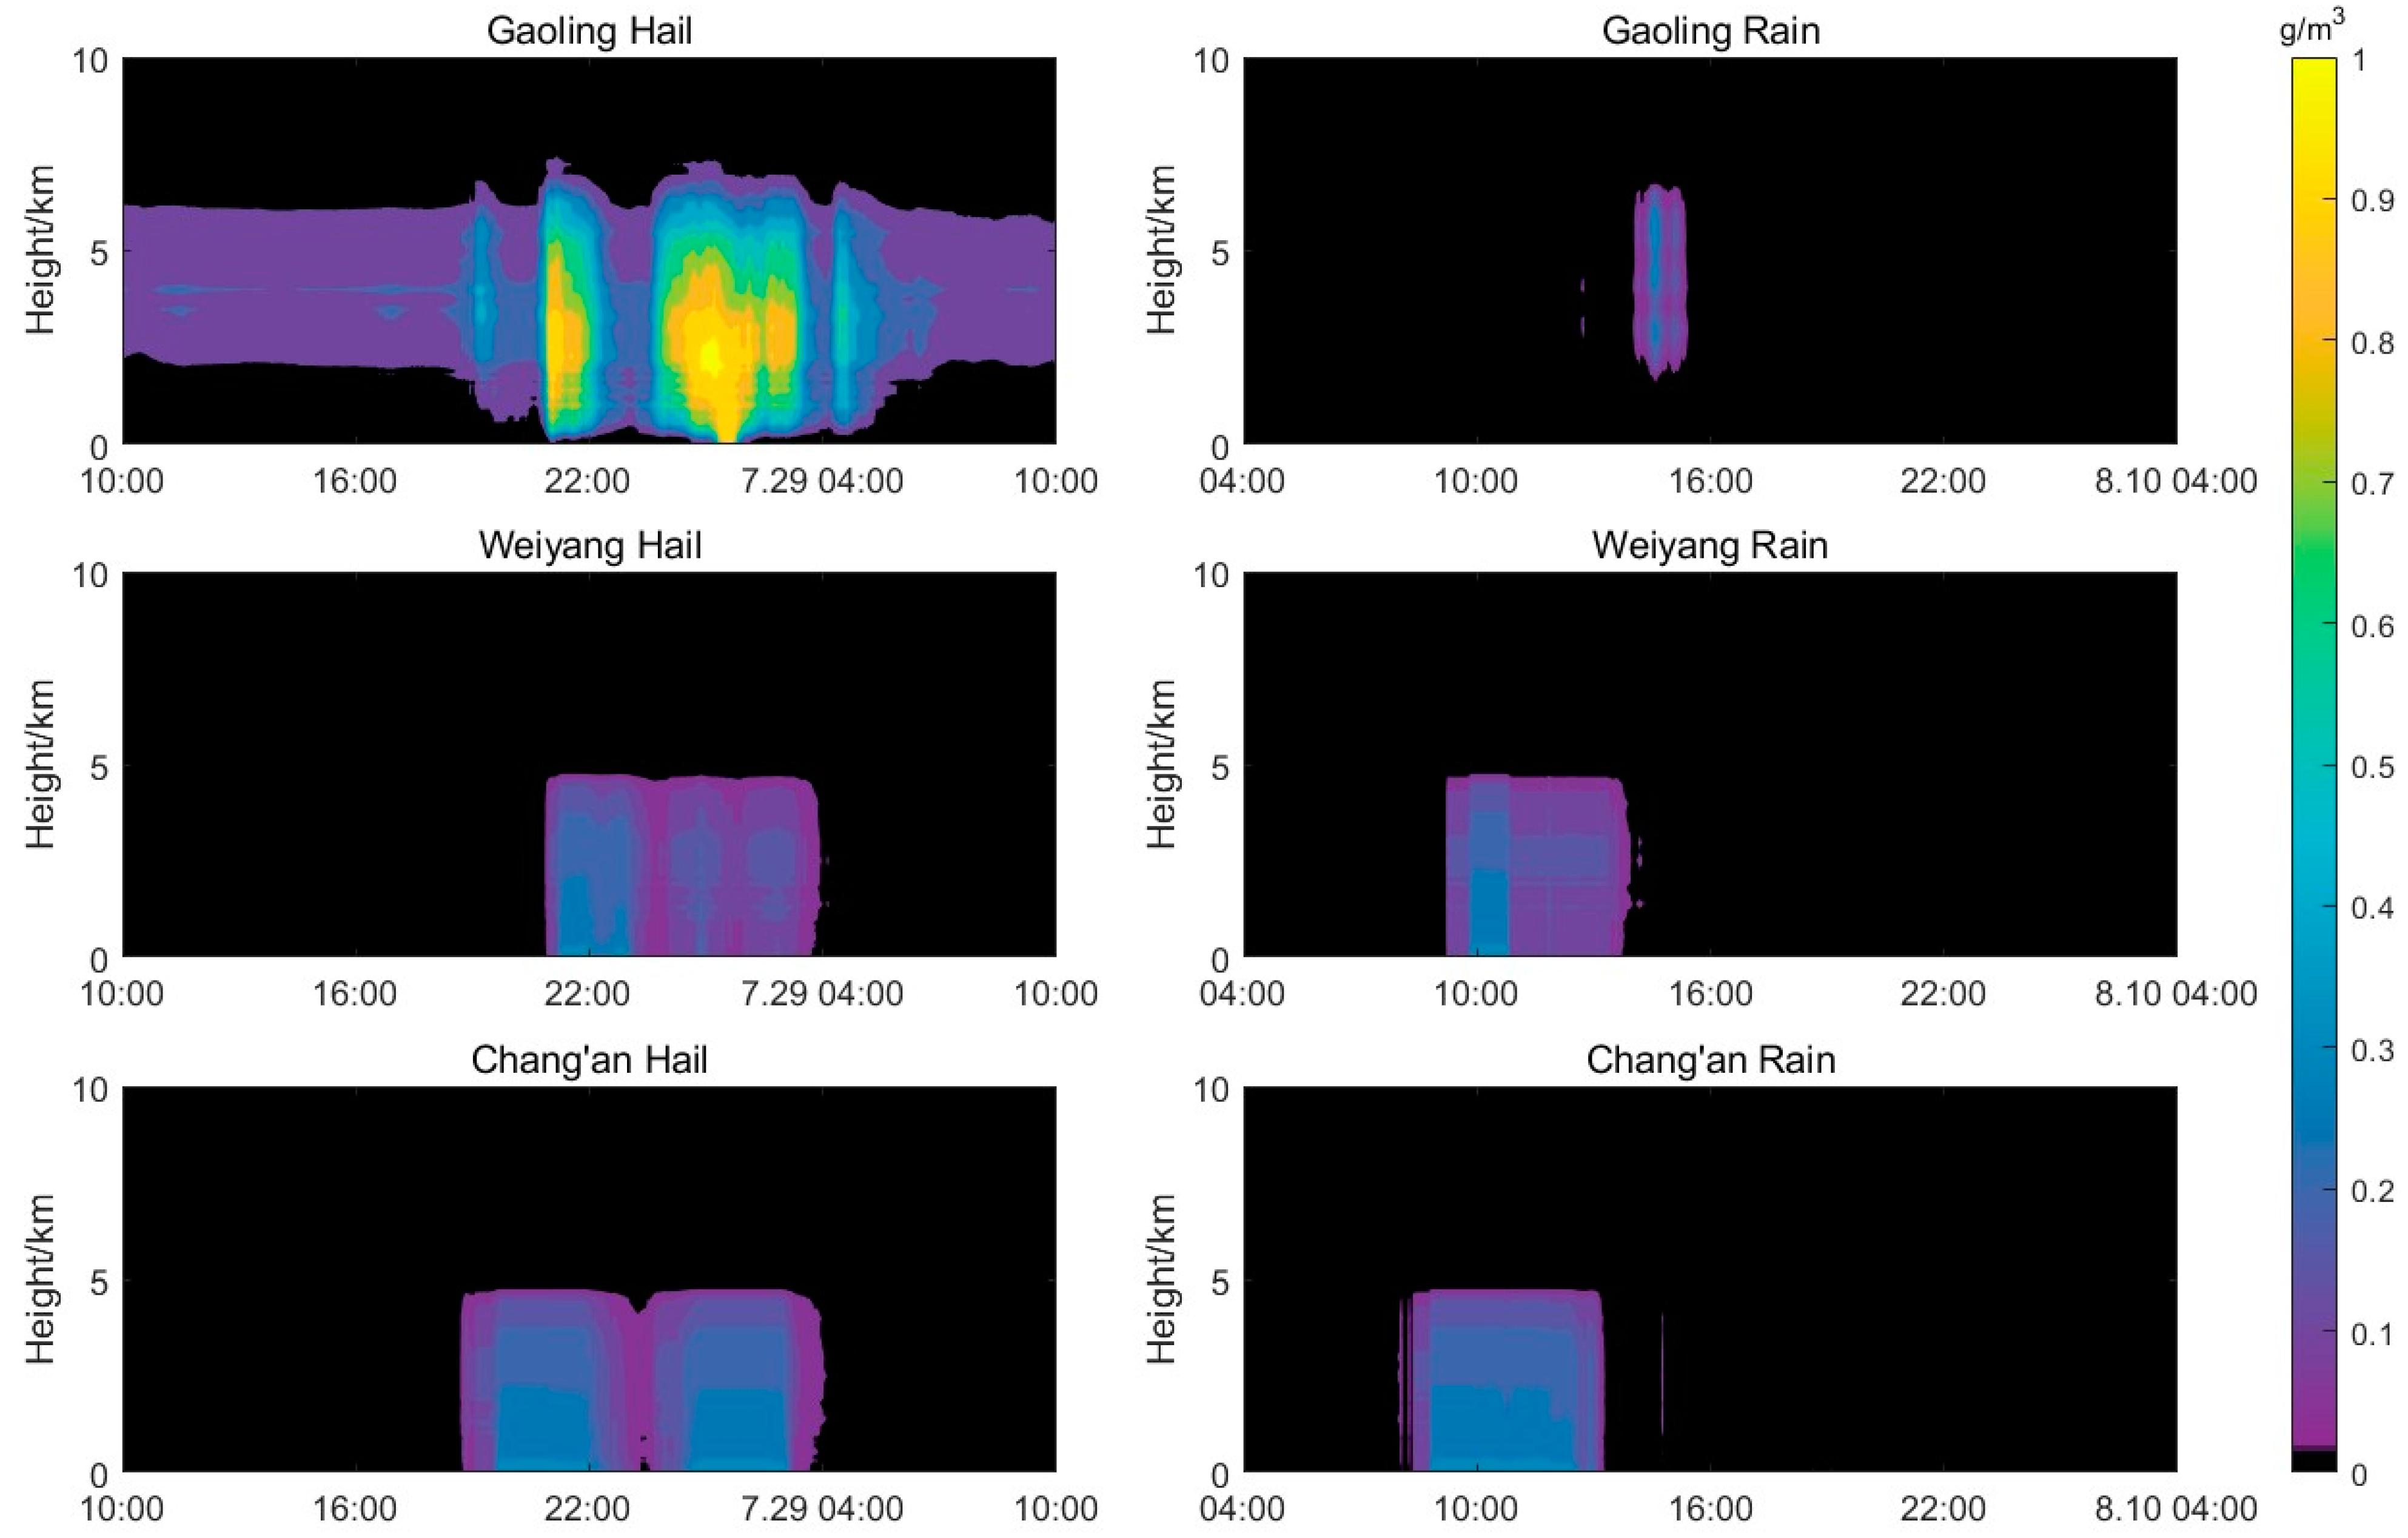
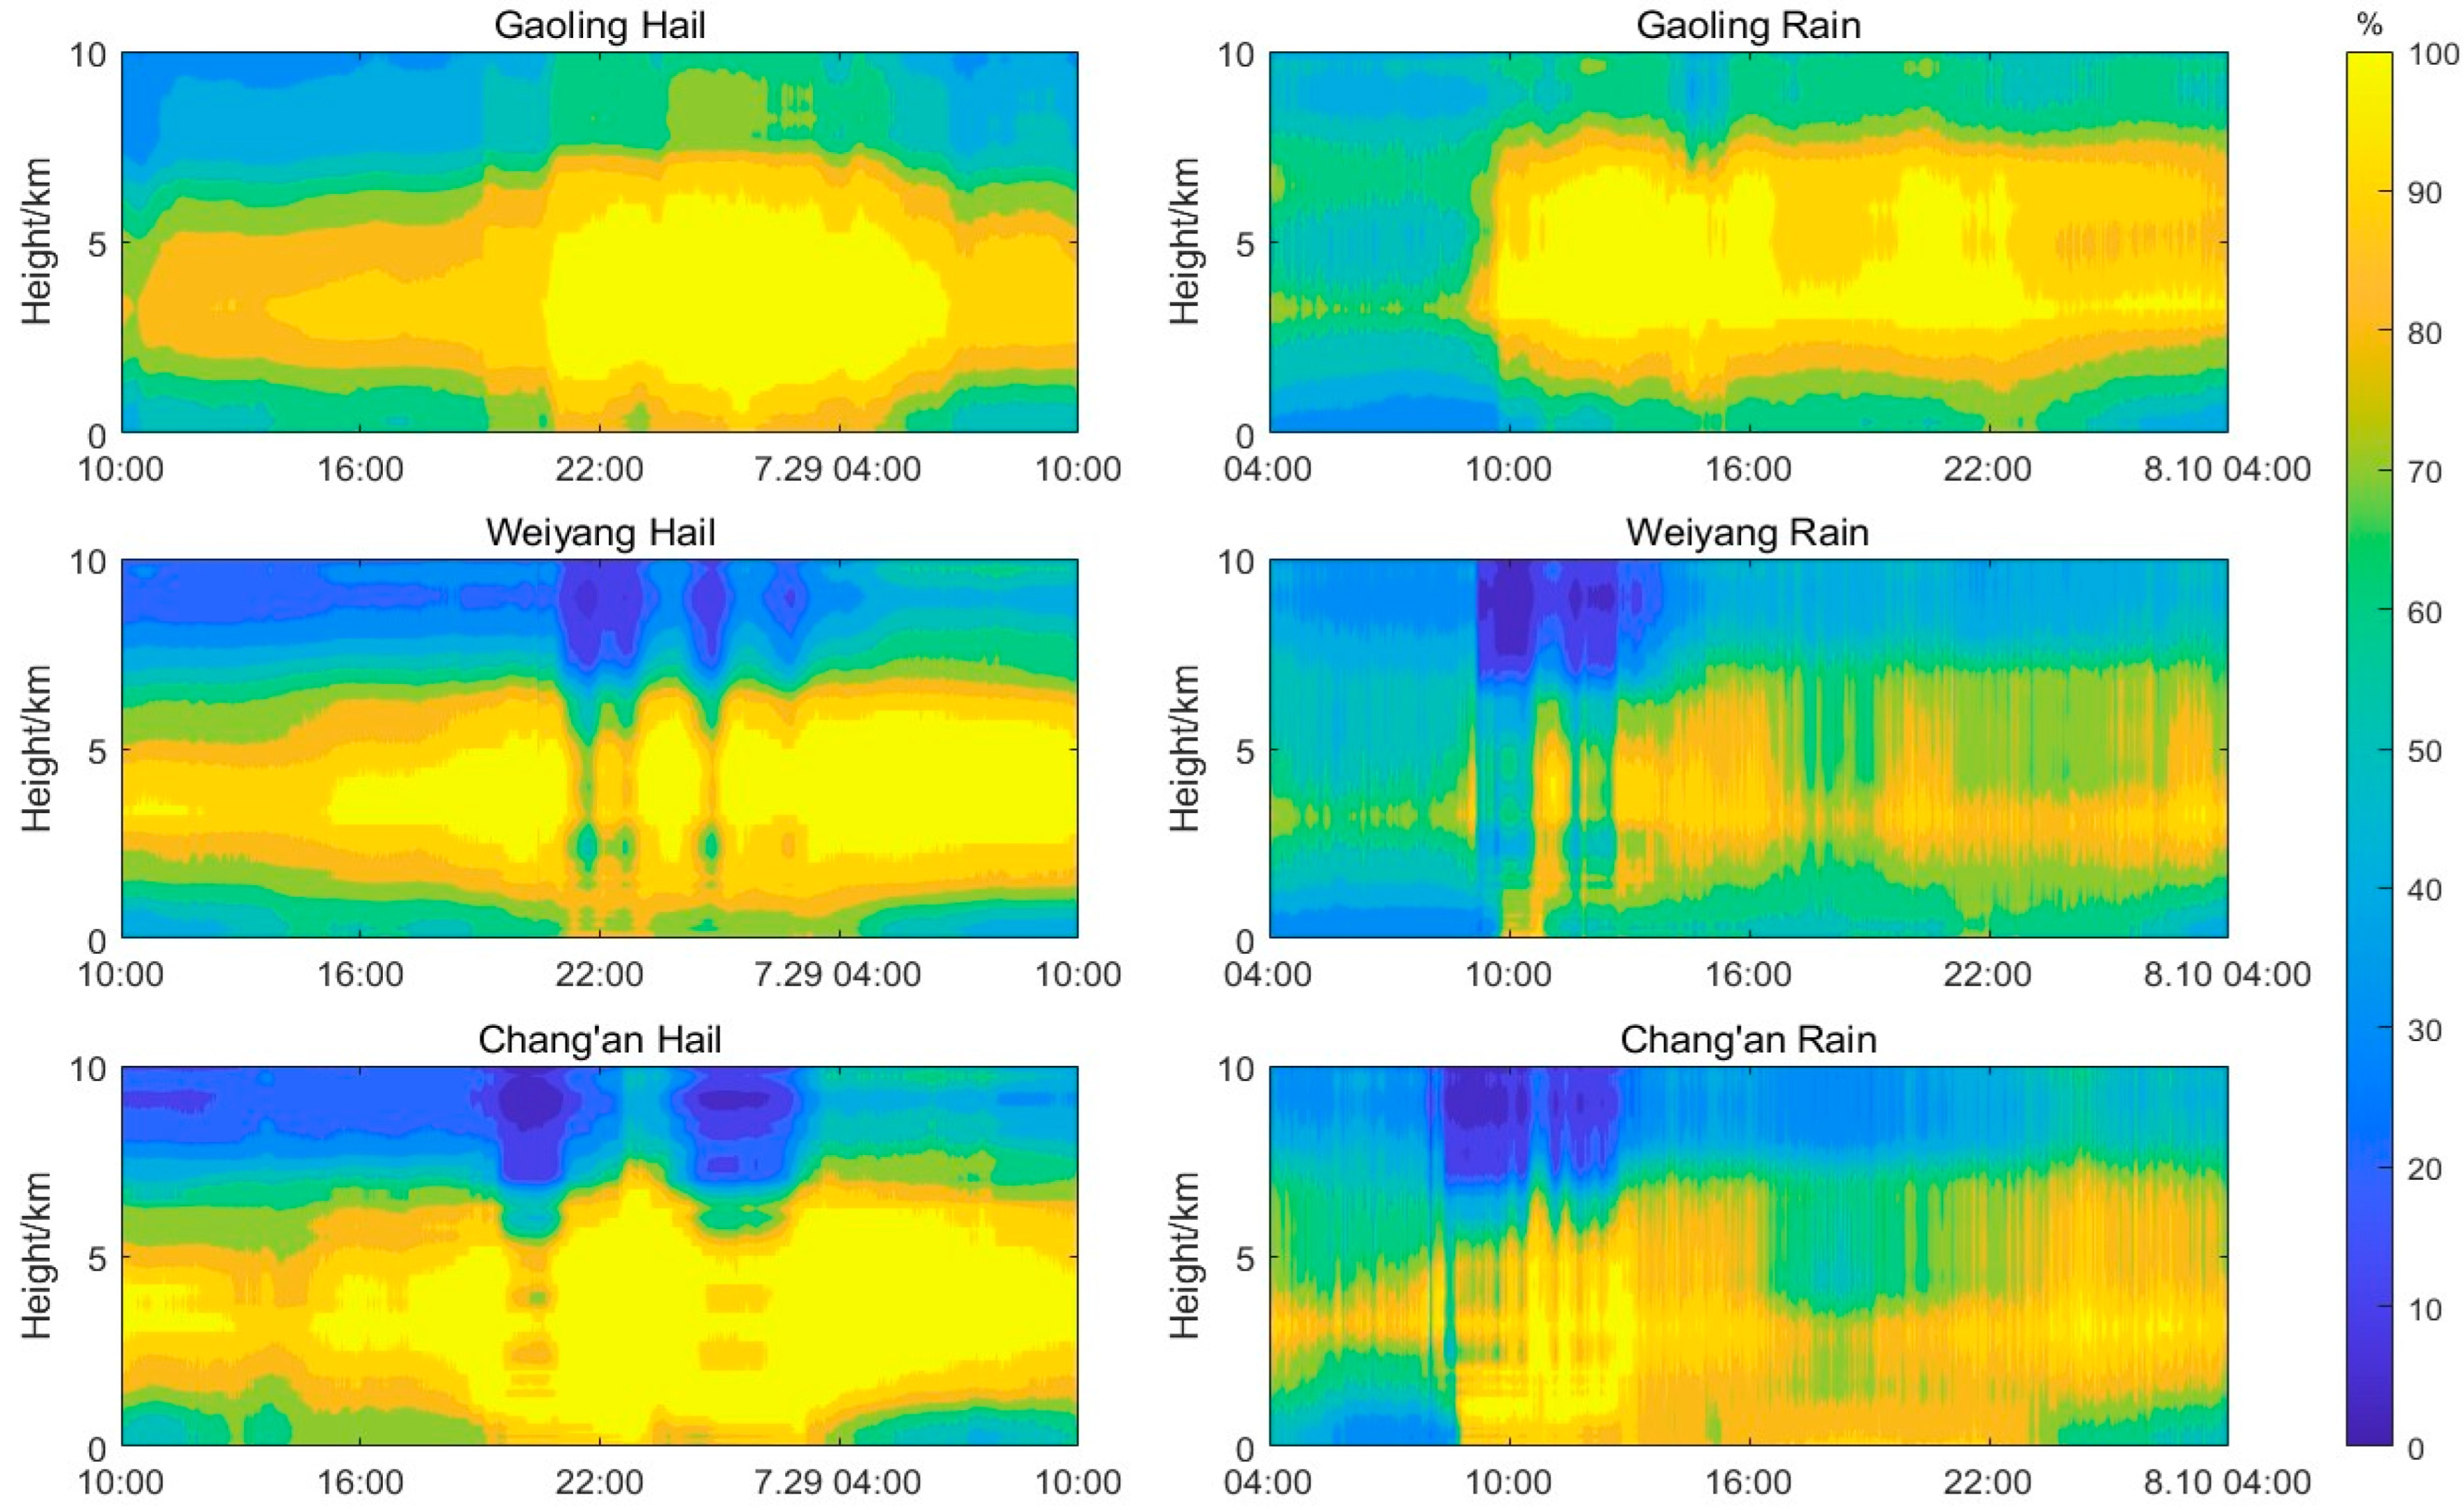
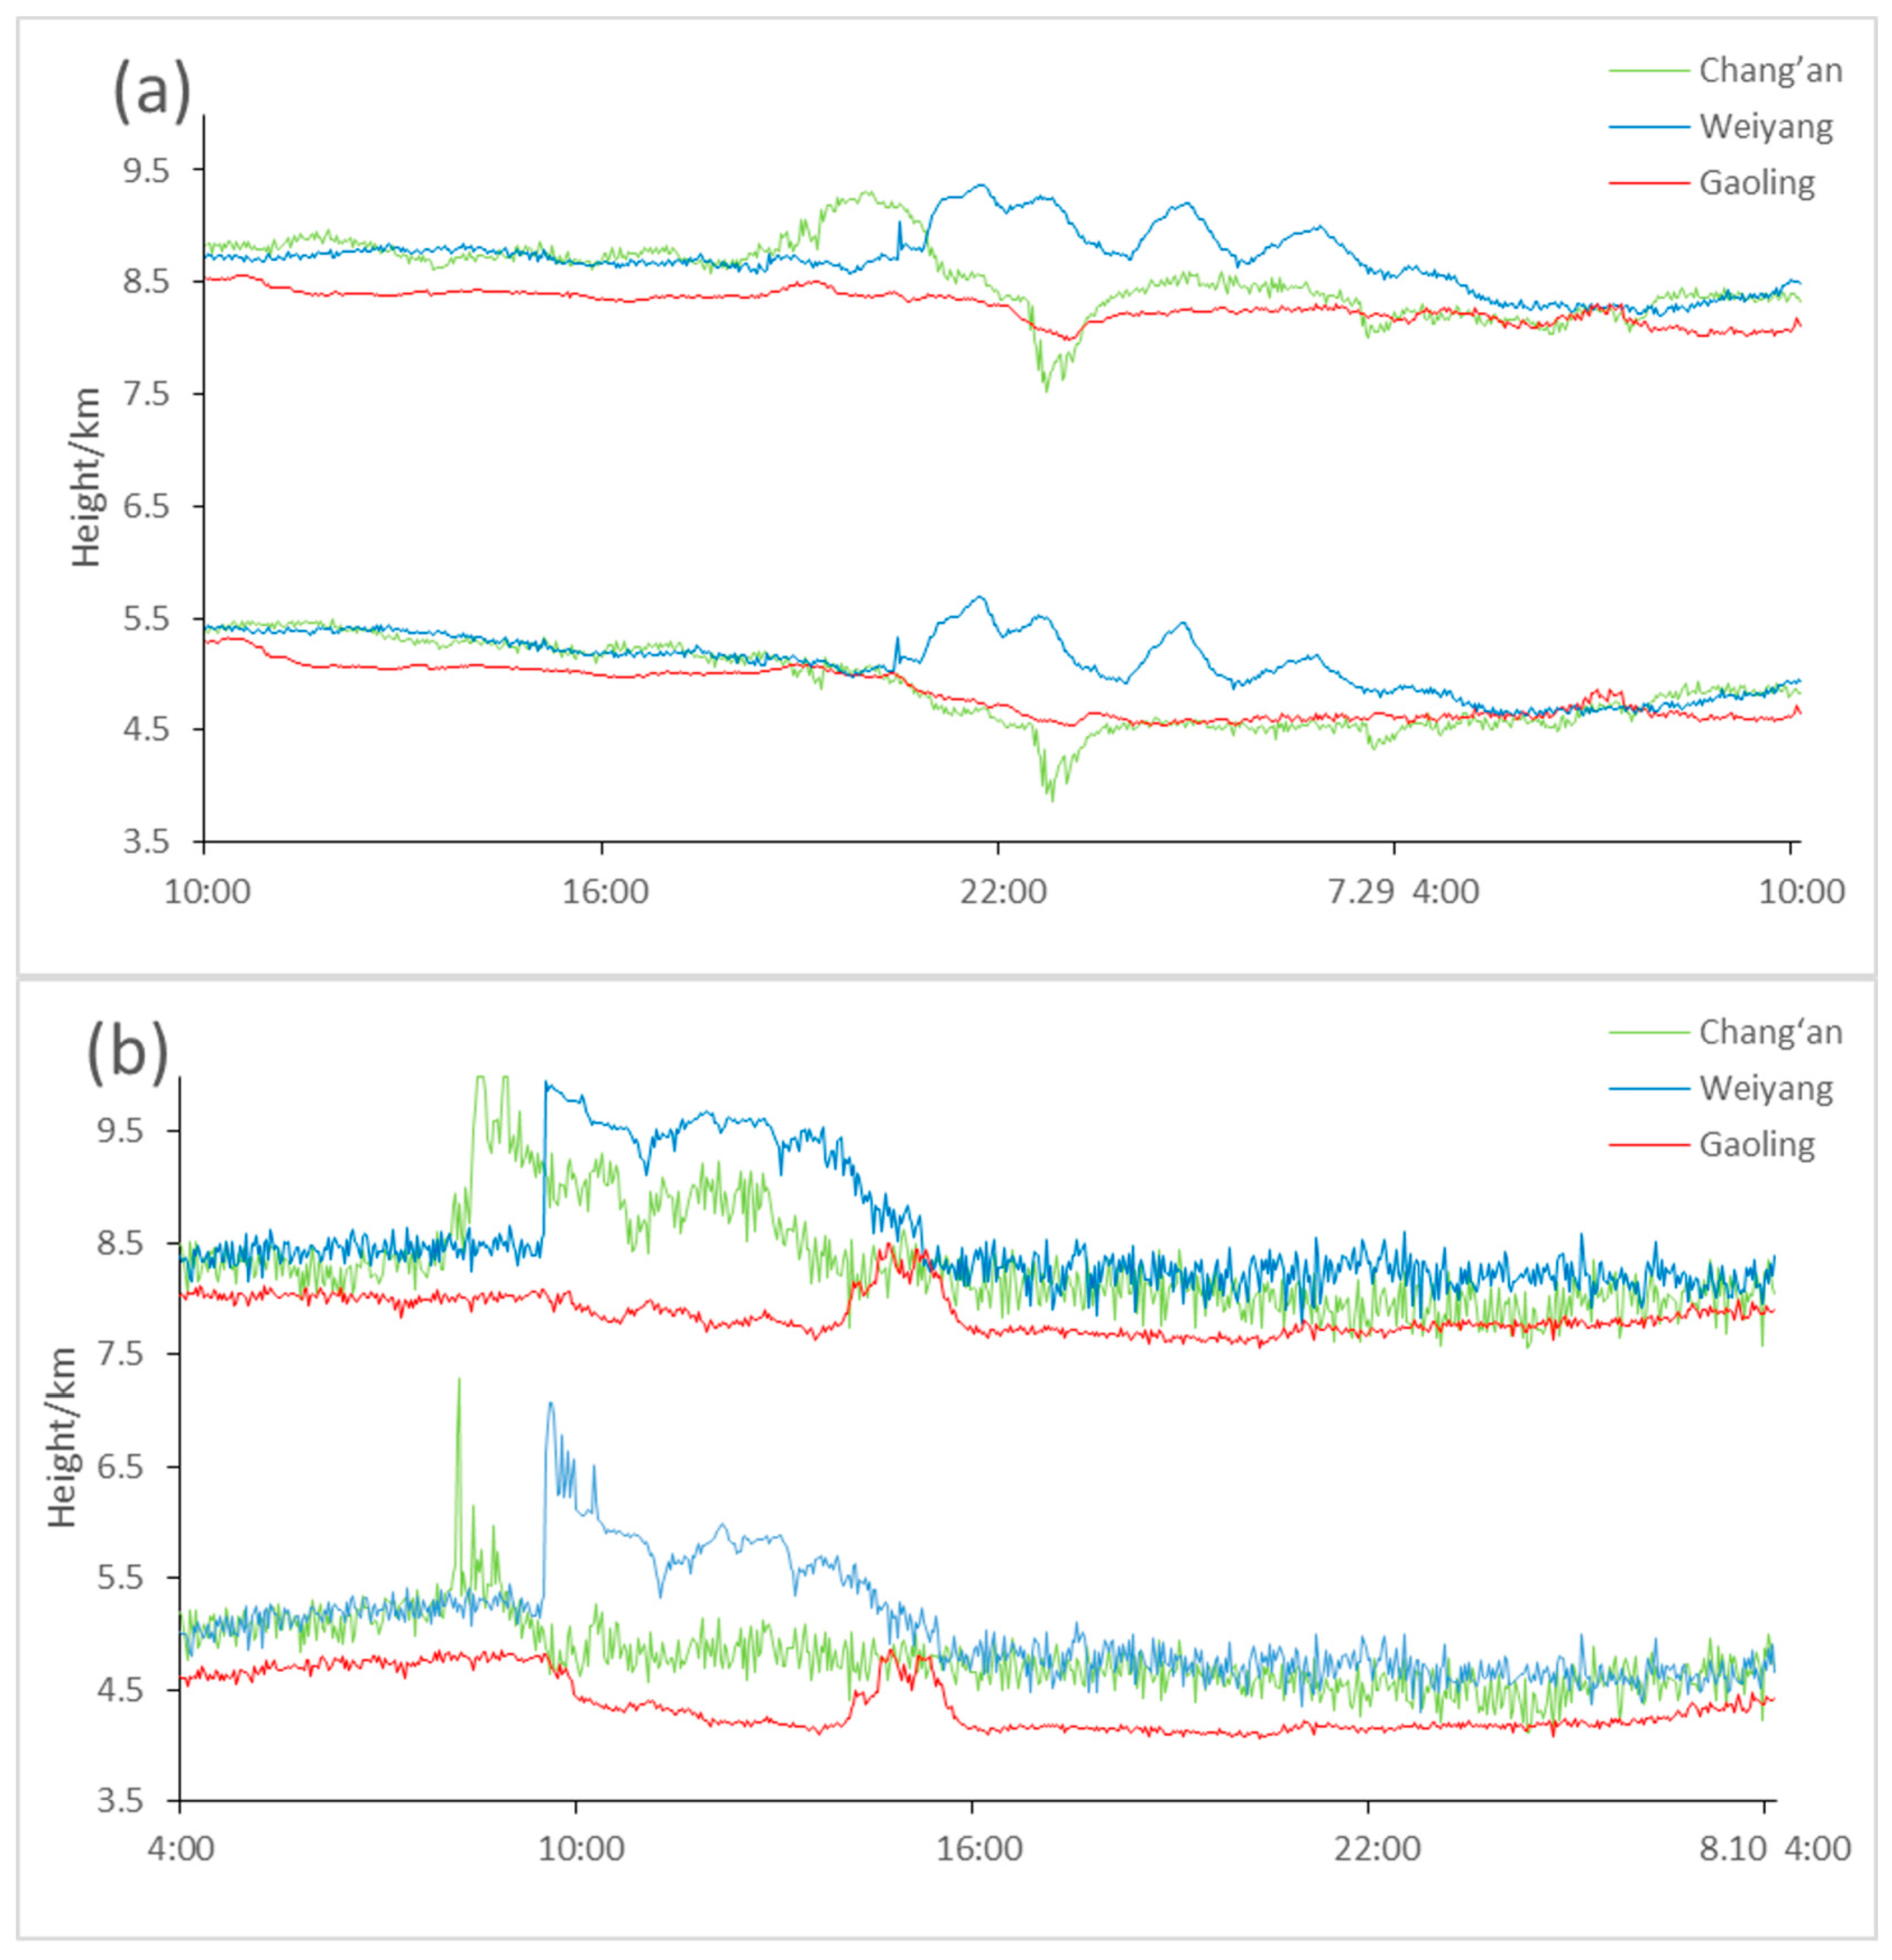
3.3.1. Water Vapor and Liquid Water Change Characteristics

In the individual case of hailfall and according to the liquid water profile information, the ground surface concentration of liquid water was greater than zero at the Chang’an station at 18:00 and exceeded the maximum value from 20:00 p.m. to 10:00 p.m. This finding is consistent with the hail process precipitation period shown by the hourly rainfall recorded at the Chang’an ground weather station, which was concentrated from 6:00 p.m. to 11:00 p.m. Similarly, in the precipitation-only case, the liquid water information of the Chang’an station showed similar characteristics at approximately 10:00 a.m., indicating that the liquid water profile of the ground-based microwave radiometer can show consistency with the ground-based meteorological station data (Figure 4). In both processes, Weiyang’s liquid ground water exceeded zero for a period, although the precipitation start time was later than that at the Chang’an station. Meanwhile, the time range in which the liquid water concentration exceeded 0.3 g/m3 was shorter than that at Chang’an. At the Gaoling station, although the maximum value of liquid water content at high altitude during the hail exceeded 1 g/m3, the ground water did not exceed zero in either process, which was consistent with the ground weather station data. The hourly precipitation records were also consistent (Figure 4). This finding indicates that these two precipitation processes reflect similar ground precipitation characteristics, i.e., Chang’an > Weiyang > Gaoling, although different microphysical cloud processes may have occurred within the clouds such that one produced hail while the other only produced precipitation.
Further analysis of the water vapor relative humidity vertical profile shows that during the two precipitation events, the relative humidity profiles in both the Chang’an district and Weiyang district produced sudden “hole” changes during the precipitation period. Specifically, the hailstorm process from 8:00 p.m. to 9:00 p.m. in the Chang’an district mainly produced a “hole” at heights above 5 km, where the relative humidity dropped from 30% to near 0; from 9:00 p.m. to 11:00 p.m., a low-value zone was produced at 1 km–10 km in the Weiyang district, where the relative humidity dropped from near 100% to 60% at heights below 5 km and from 40% to near 0 at heights above 5 km (Figure 5). The rainfall process in the Chang’an district mainly produced a low-value zone at heights above 5 km from 8:00 a.m. to 10:00 a.m., with the relative humidity dropping from 40% to near 0. The Weiyang district produced a low-value zone at 1 km–10 km from 9:30 a.m. to 10:30 a.m., with the relative humidity dropping from near 100% to 60% at heights below 5 km and from 40% to near 0 at heights above 5 km. The relative humidity dropped from nearly 80% to 60% at altitudes below 5 km and from 40% to nearly 0 at altitudes above 5 km. The relative humidity dropped from nearly 80% to 60% at altitudes below 5 km and from 40% to nearly 0 at altitudes above 5 km. These “hole” changes at altitudes below 5 km indicated a rapid change from gas to liquid within the cloud, and it can be inferred that the condensation and growth of cloud droplets rapidly occurred, further accelerating the spread and growth of cloud droplets and the formation of raindrops, which simultaneously corresponded to the increase in the concentration of the liquid water profile. This change in the relative humidity of the water vapor above a 5 km altitude may have included not only the transformation of the gaseous state to the liquid state but also the transformation of the gaseous state to the solid-state and the generation of ice-phase particles. It is difficult to further separate the processes of cold clouds using only the relative humidity changes. Regardless of the precipitation process, the relative humidity characteristics over Gaoling did not show obvious “hole” changes, which means that there was no rapid transformation of precipitable water particles over Gaoling, which is consistent with the results of the previous analyses of liquid water and ground precipitation.

3.3.2. Temperature Change Characteristics

To further distinguish the differences in intracloud features between the two precipitation processes and among the three sites, we further compared the height changes at the 0 °C and −20 °C layers. The height layer between the 0 °C layer and the −20 °C layer represents the key height range of both warm hydrometers and ice-phased hydrometers, which can well reflect the characteristics within strong convective clouds. Comparatively large fluctuations in the heights of the 0 °C layer and −20 °C layer occurred in both the Chang’an district and Weiyang district during the two precipitation processes (Figure 6). In the individual cases of hailfall, the −20 °C layer in the Chang’an district began to rise at 6:00 p.m., which was earlier than the rise of the −20 °C layer in the Weiyang district. This finding is verified with the results of the previous analysis that indicate that the moment the liquid water rises, the relative humidity begins to suddenly drop, and precipitation occurs on the ground. At the moment when the hail was collected on the ground at the Lintong station, the 0 °C height at the Weiyang district exhibited a similarly rising and falling fluctuation at −20 °C beginning at 9:00 p.m., which indicated that a very strong latent heat release occurred over the Chang’an district, especially at the −20 °C height at 18:00. In addition, this result indicated that the latent heat release process was so strongly dominated by ice-phased hydrometers that large, relatively fast-falling ice particles such as shrapnel or hail were produced, and their fall caused a rapid decrease at −20 °C after 10:00 p.m. However, during the fall, there was a possibility that these particles completely melted and that no hail or shrapnel was observed on the ground (Figure 6a). The altitude changes at the 0 °C layer were dominated by the latent heat release from the warm cloud process, whereas the altitude changes at the −20 °C layer were dominated by the latent heat release from the ice-phased hydrometers. The alternating changes in their ascent or descent were also caused by the reciprocal cycle of water condensation particles; however, no large hail or shrapnel particles were produced to cause the steep drops at these two altitudes. In contrast, the heights of both the 0 °C layer and −20 °C layer in the Gaoling area remained fairly stable, indicating that neither significantly warm nor cold cloud precipitation processes occurred over Gaoling (Figure 6a). In the rainfall-only cases, the 0 °C and −20 °C layer heights in the Chang’an district and Weiyang district started to rapidly rise at 9:00 a.m. and 10:00 a.m., respectively, and then slowly decreased to a stable state, indicating that strong warm and cold cloud formation processes occurred in the clouds over both locations in this precipitation case, although no large, fast-falling ice particle hail or graupel was produced. Thus, there was no steep drop in the height of the 0 °C and −20 °C layers (Figure 6b).

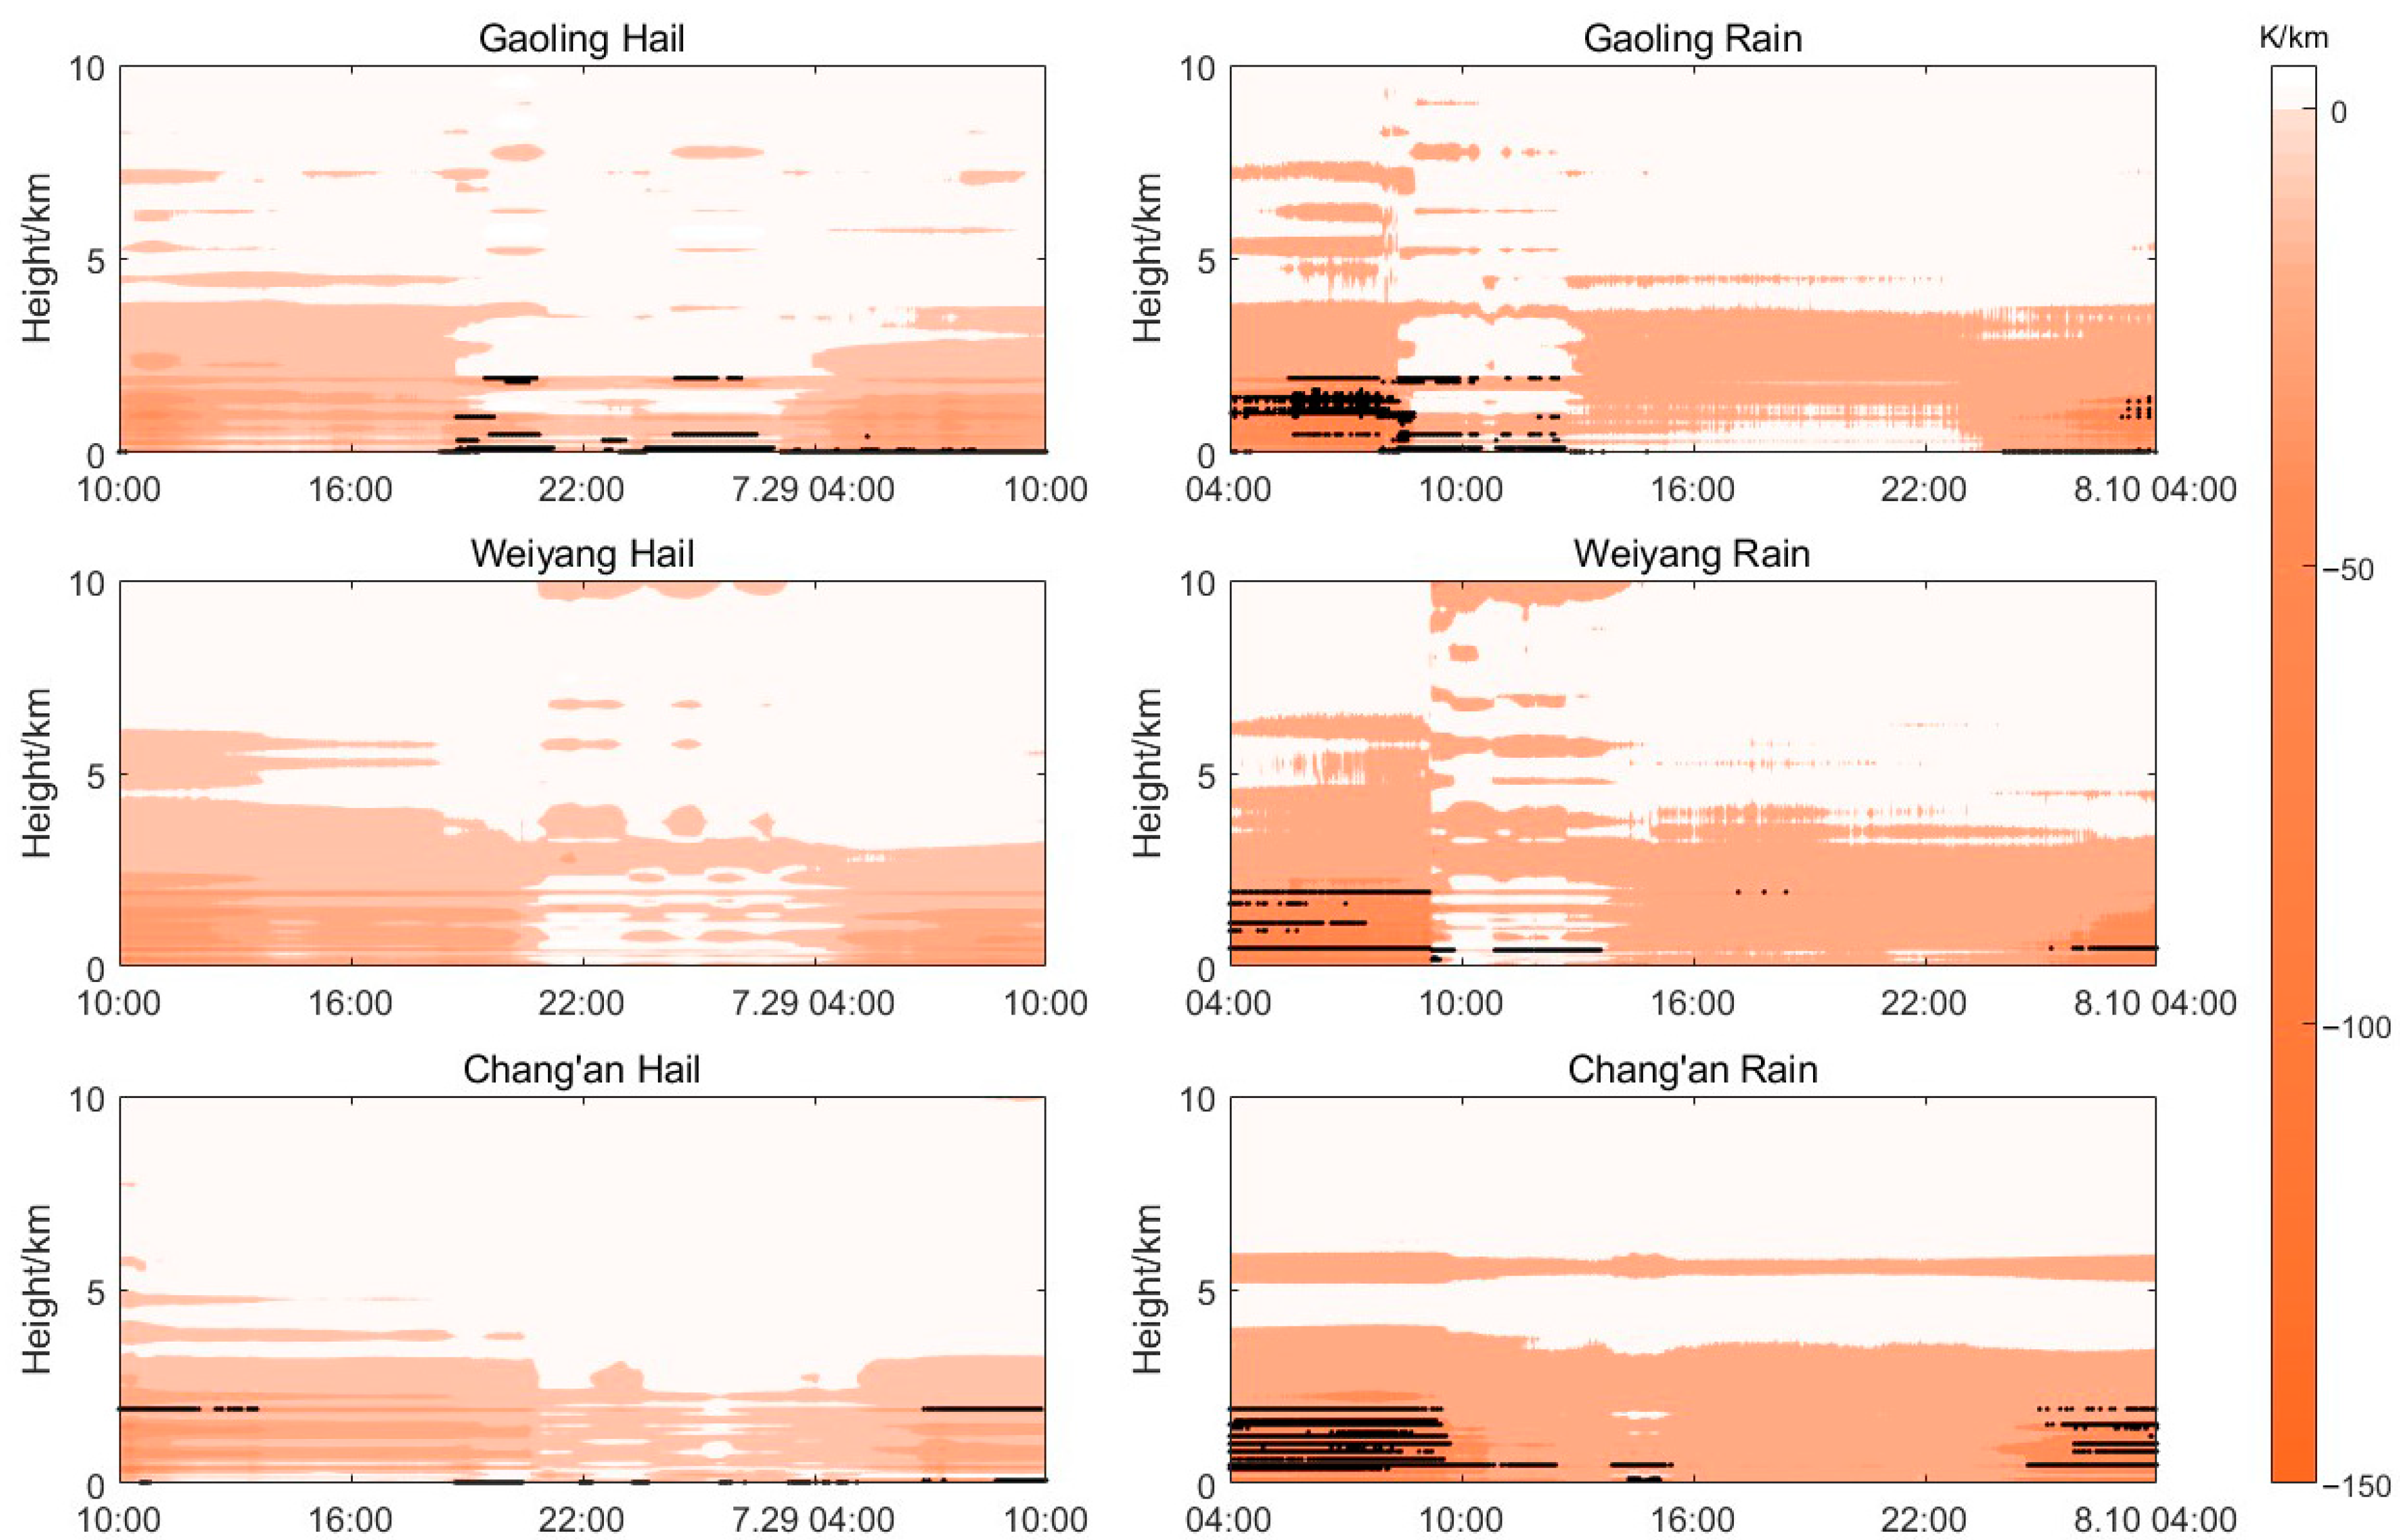
3.3.3. Displacement Temperature (Pseudoequivalent Displacement Temperature) Gradient Characteristics

The actual weather prediction works because the potential temperature gradient and pseudoequivalent potential temperature gradient can show the degree of atmospheric instability, and are often applied in predicting strong convection events. As shown in Figure 7, the atmospheric state in each region shows strong instability before the occurrence of hail and rainfall-only processes, and the pseudoequivalent potential temperature gradient in the rainfall case shows stronger instability, resulting in higher 6-h cumulative rainfall than the rainfall case with similar strong convective circulation background characteristics. However, the variation characteristics of the potential temperature gradient and pseudoequivalent potential temperature gradient in these two cases alone were insufficient to predict whether strong convection events would produce hail. This suggests that even though the strength of atmospheric instability has a significant correlation with hail, and this correlation is highly dependent on both thermodynamic and microphysics conditions [6,45]. Analyzing the potential temperature alone, even one of the most important thermodynamic conditions, is not sufficient to determine the occurrence of a hailstorm, when the microphysics process is not well observed.

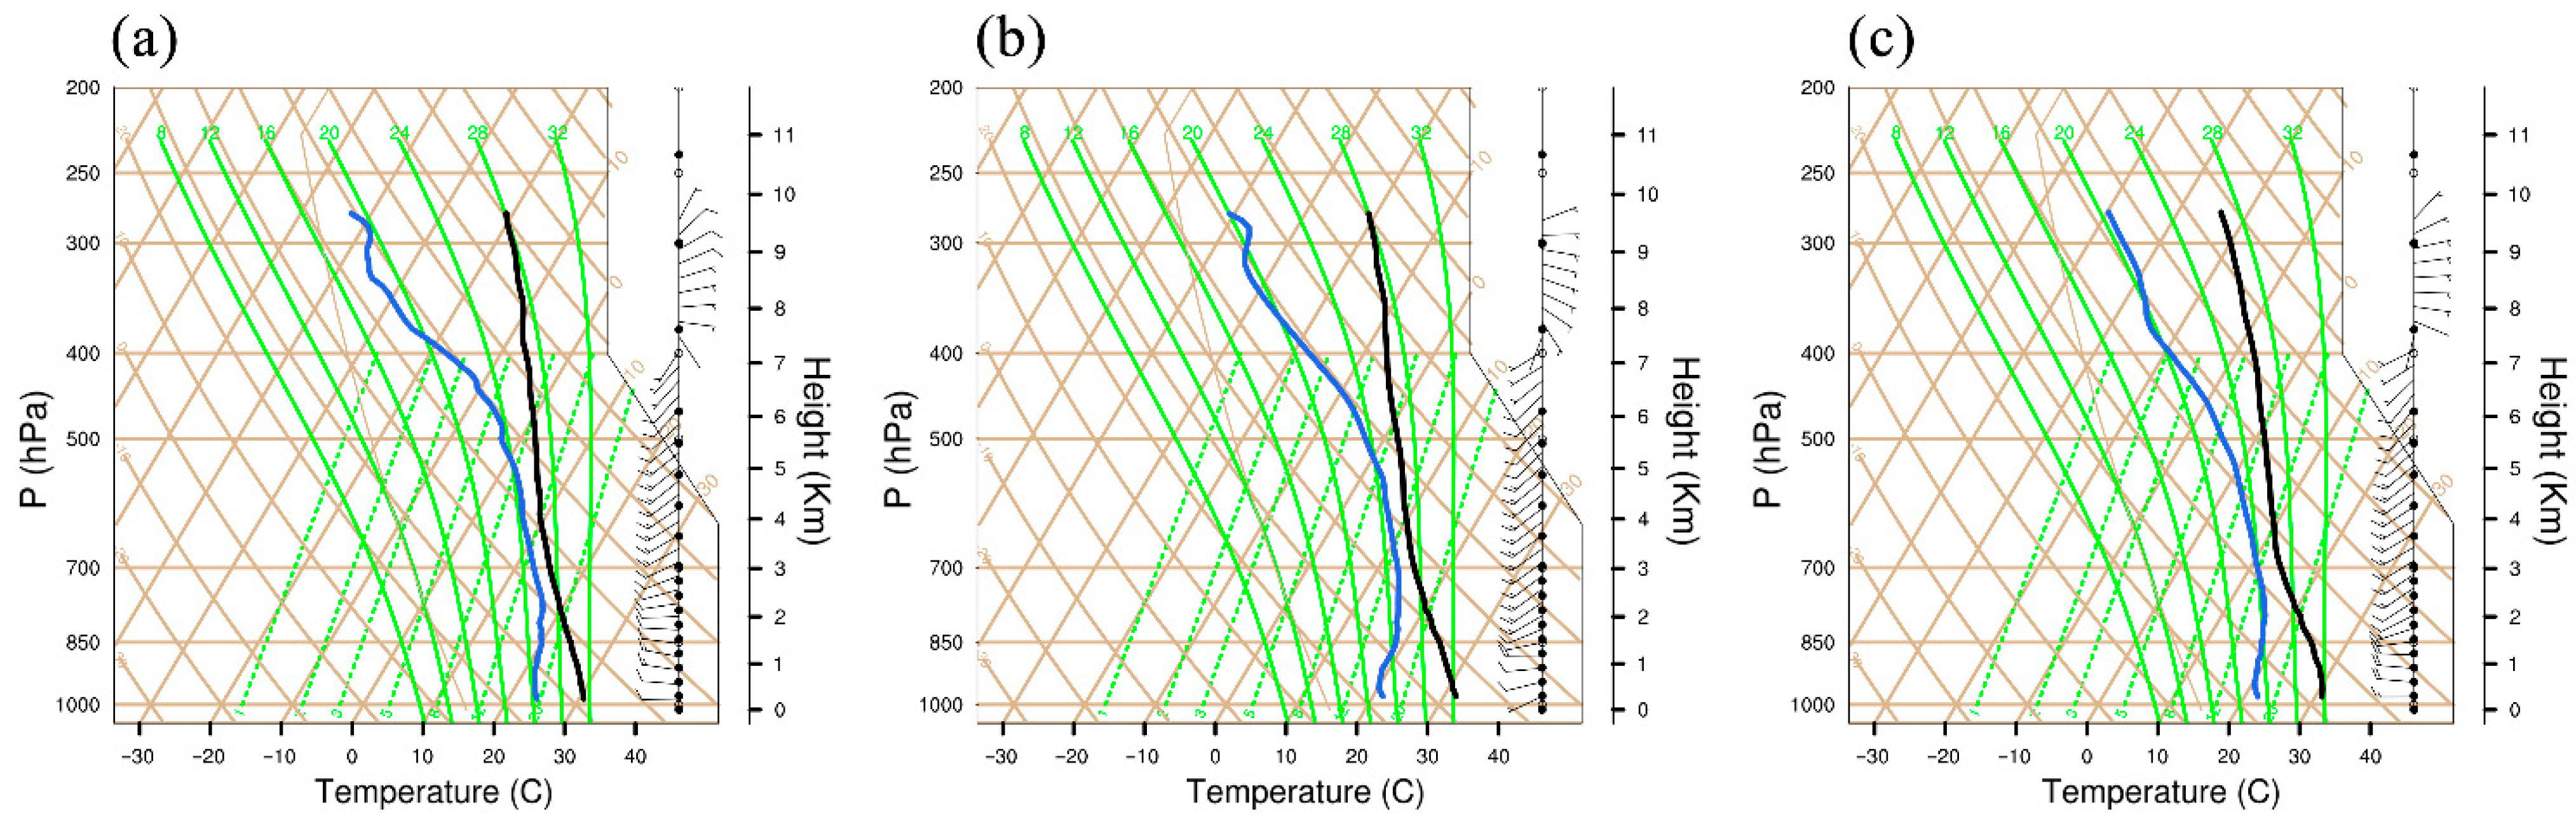
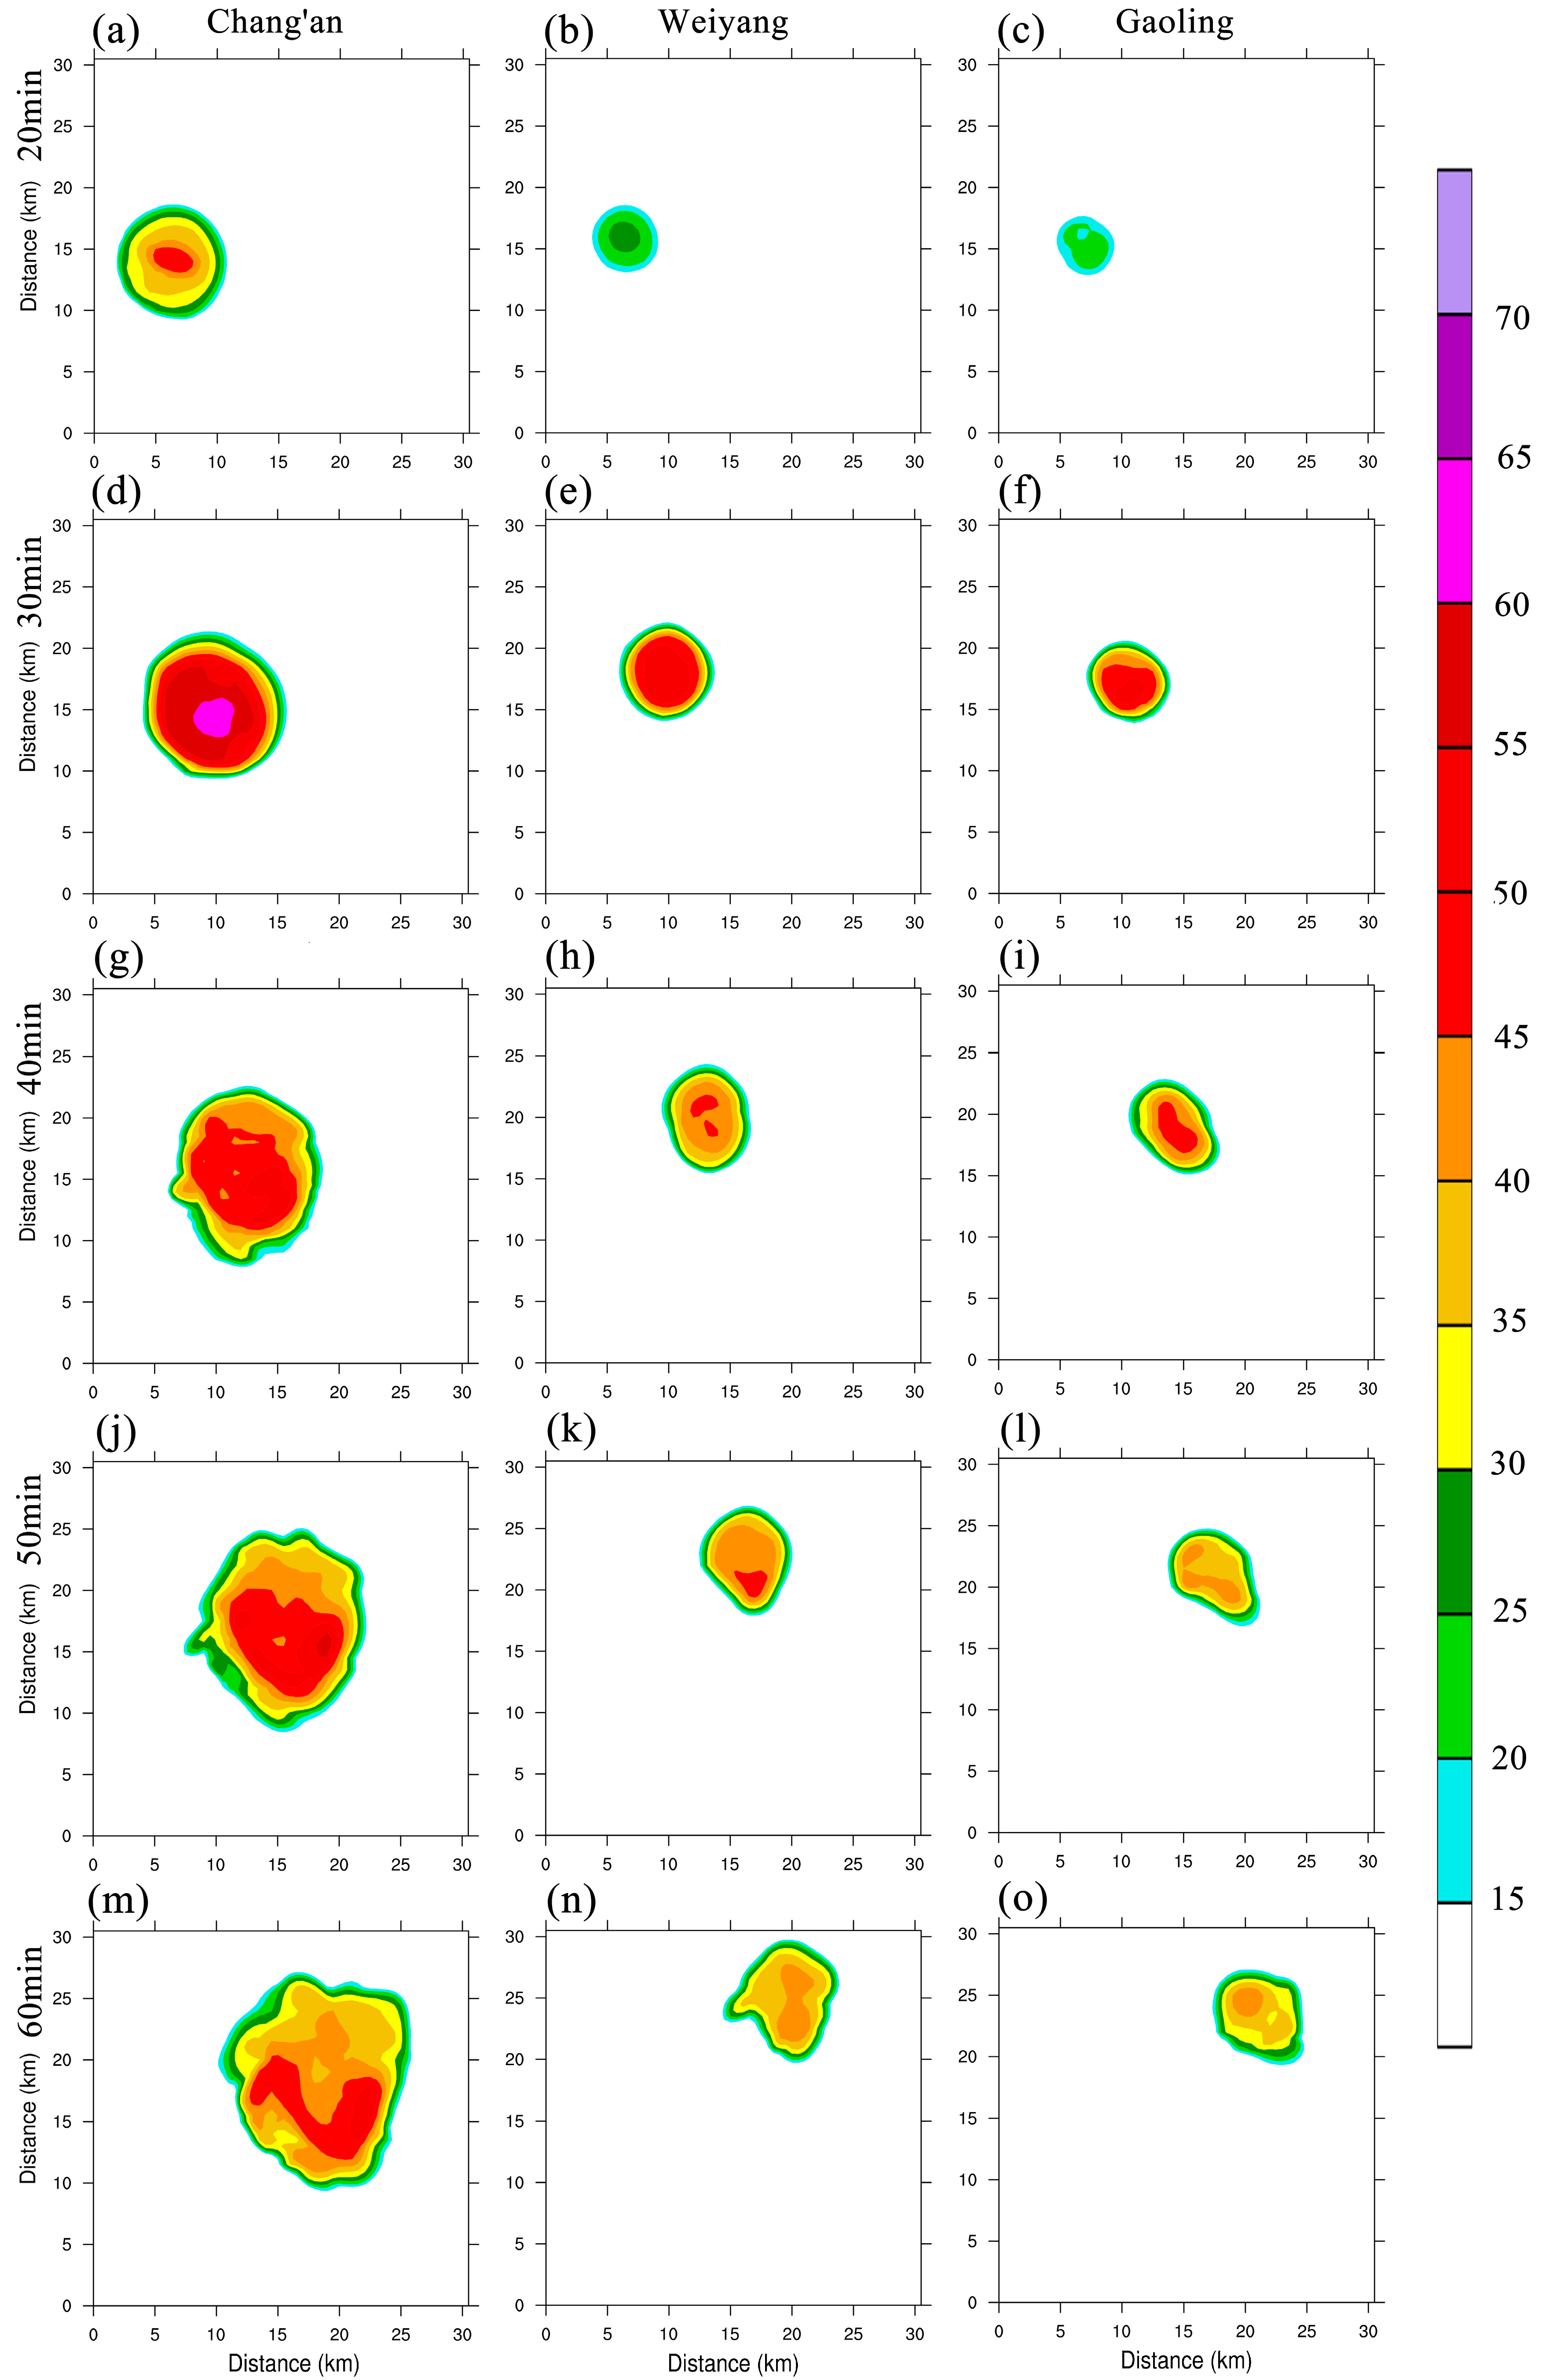
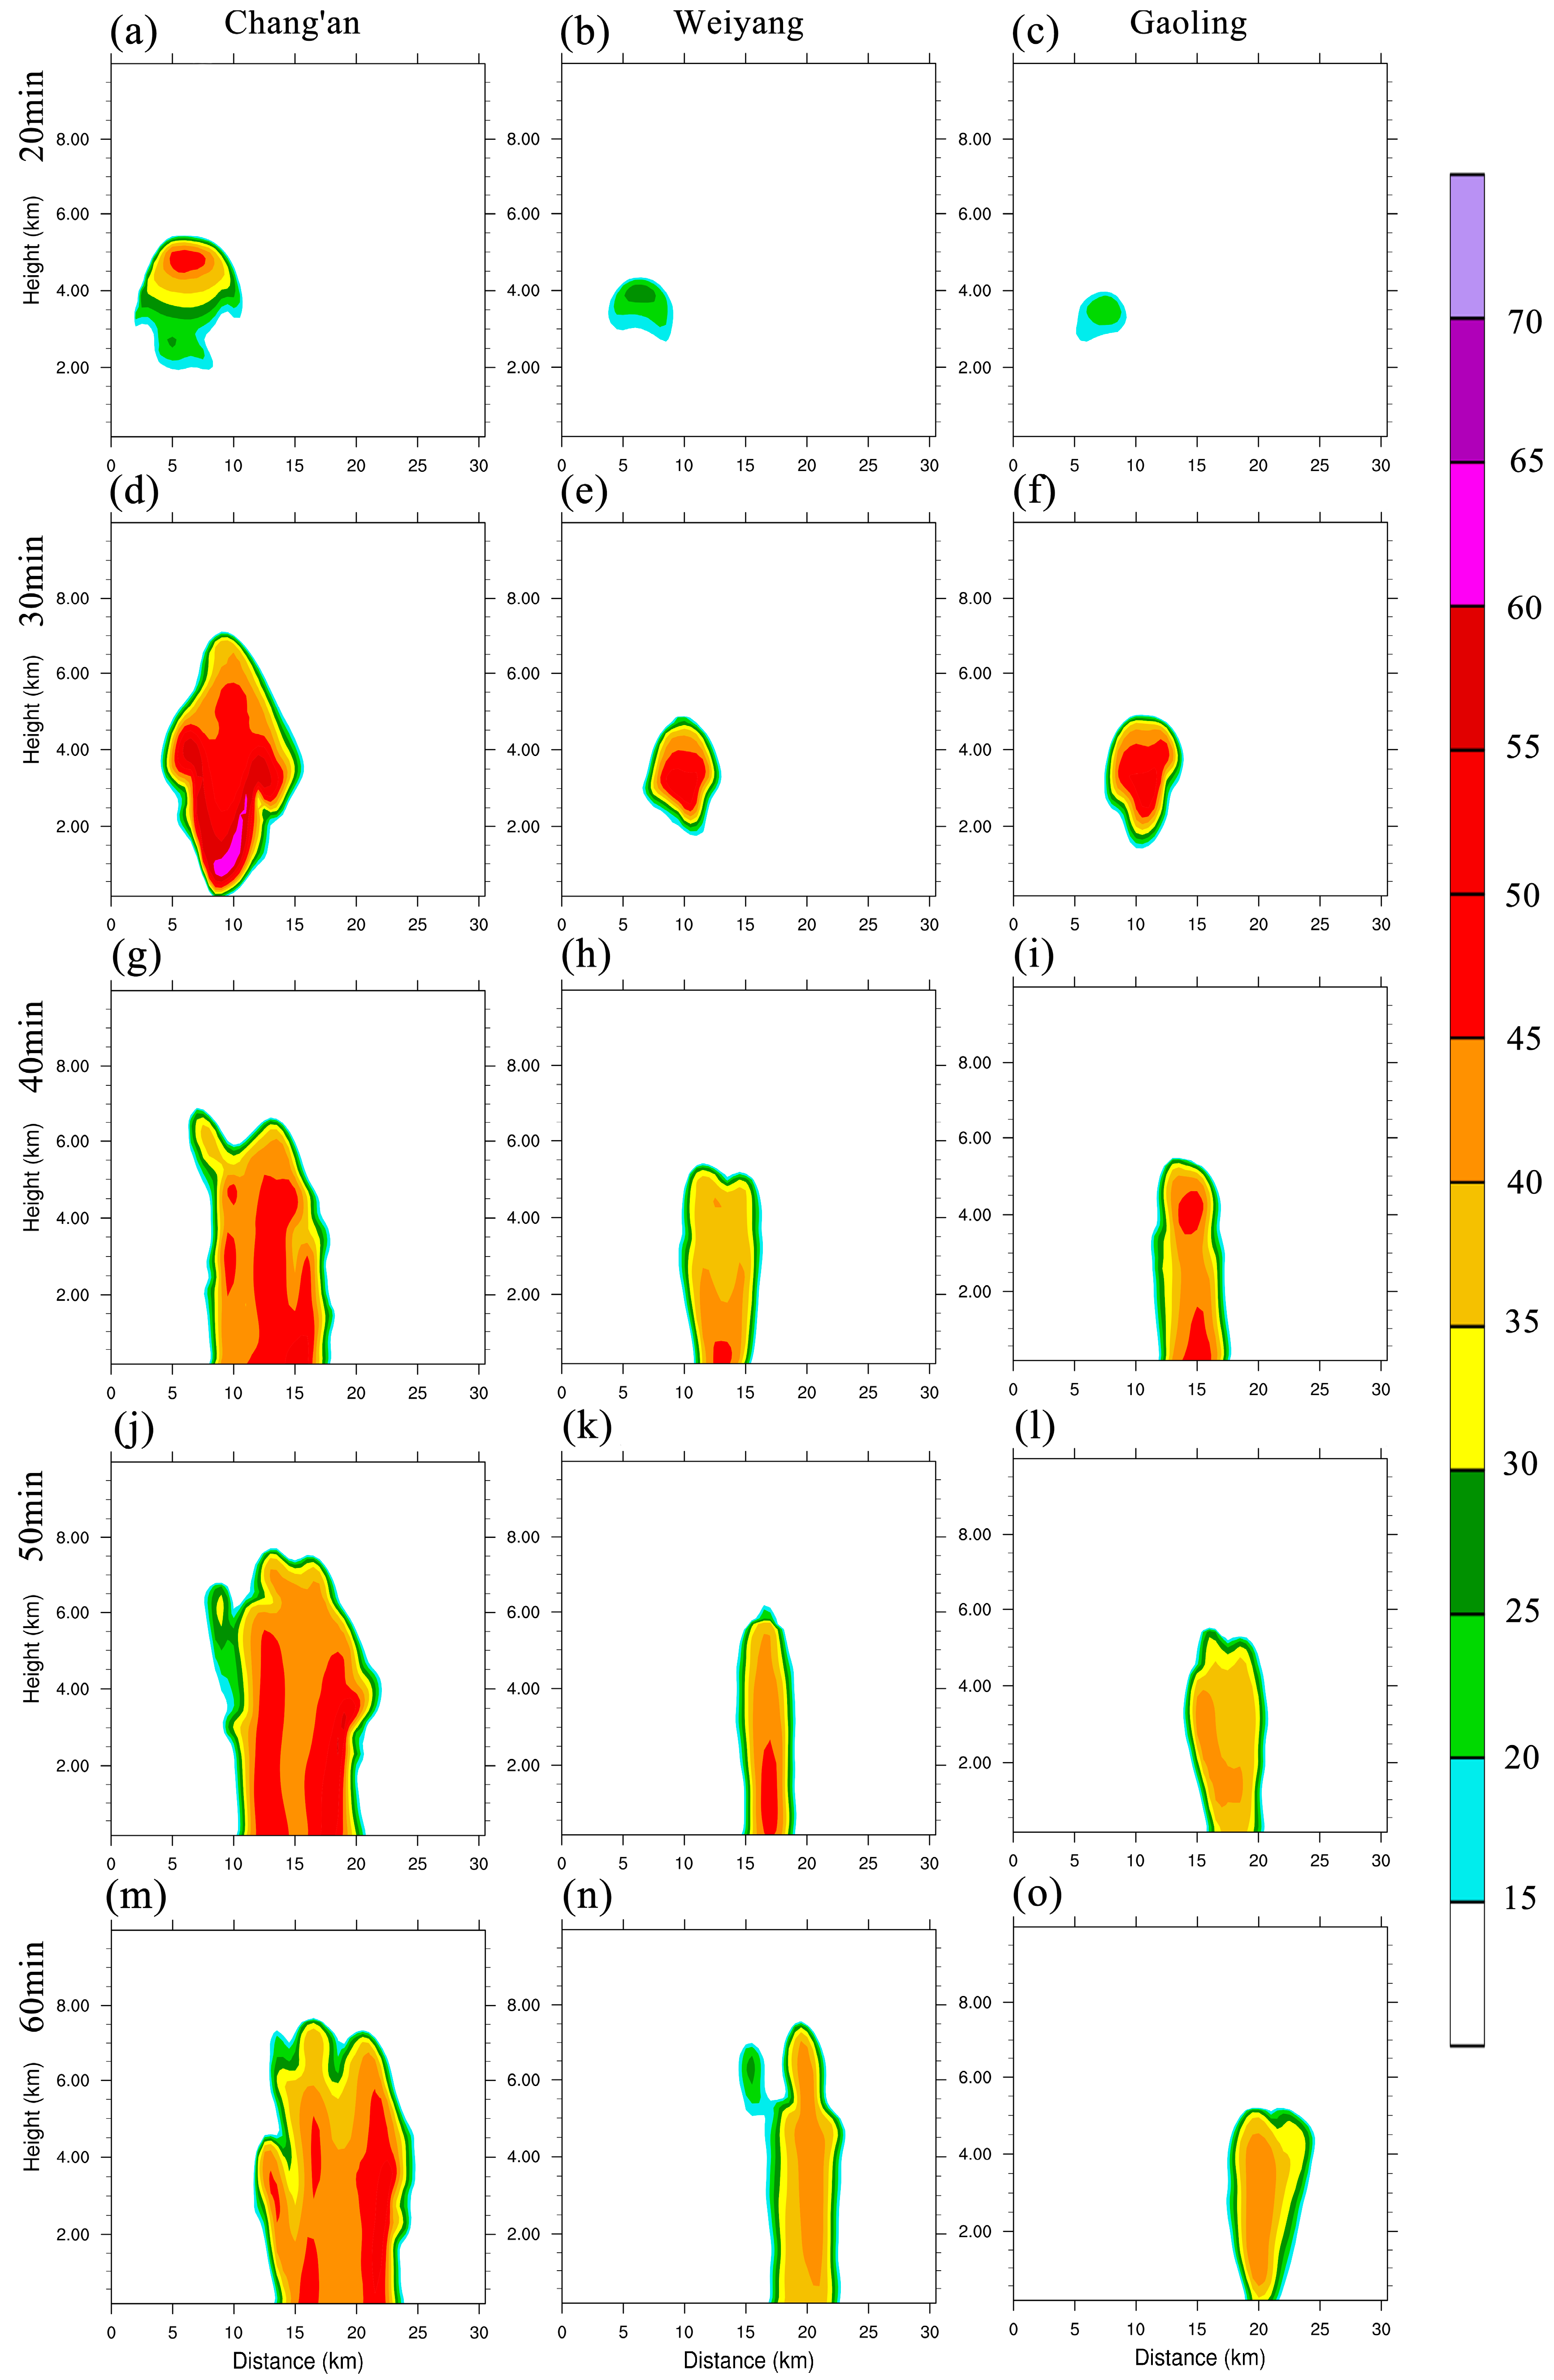
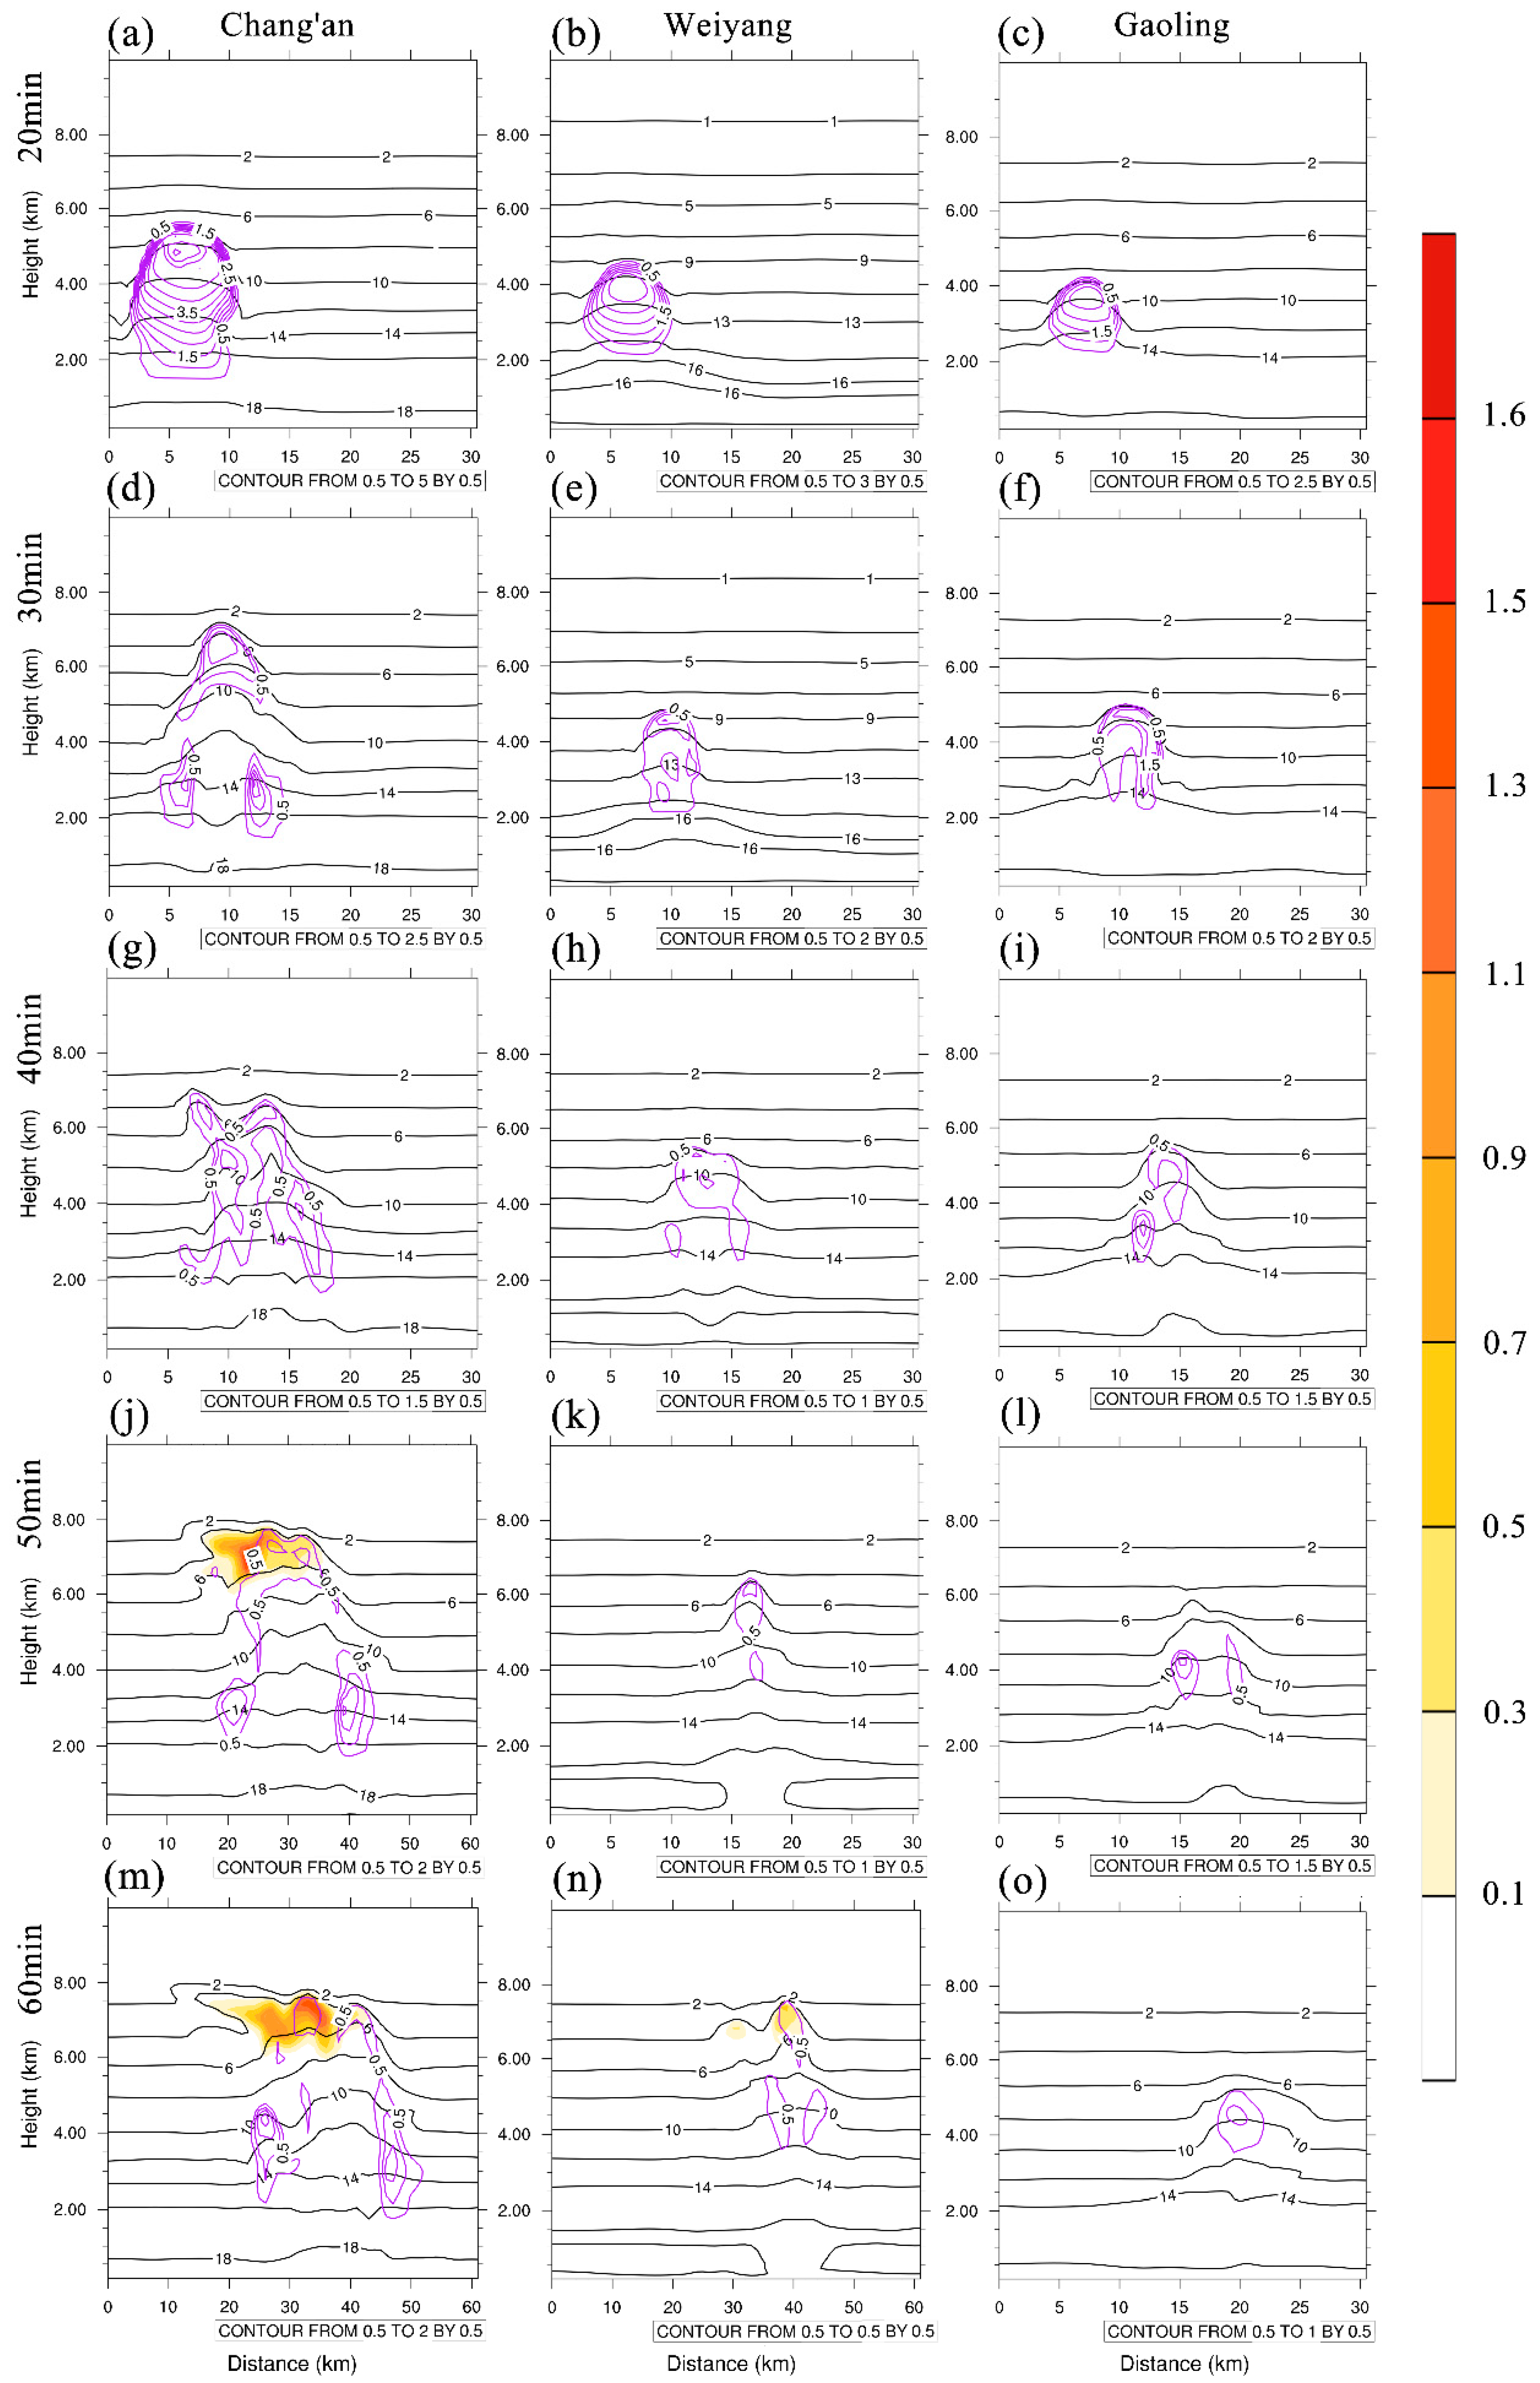
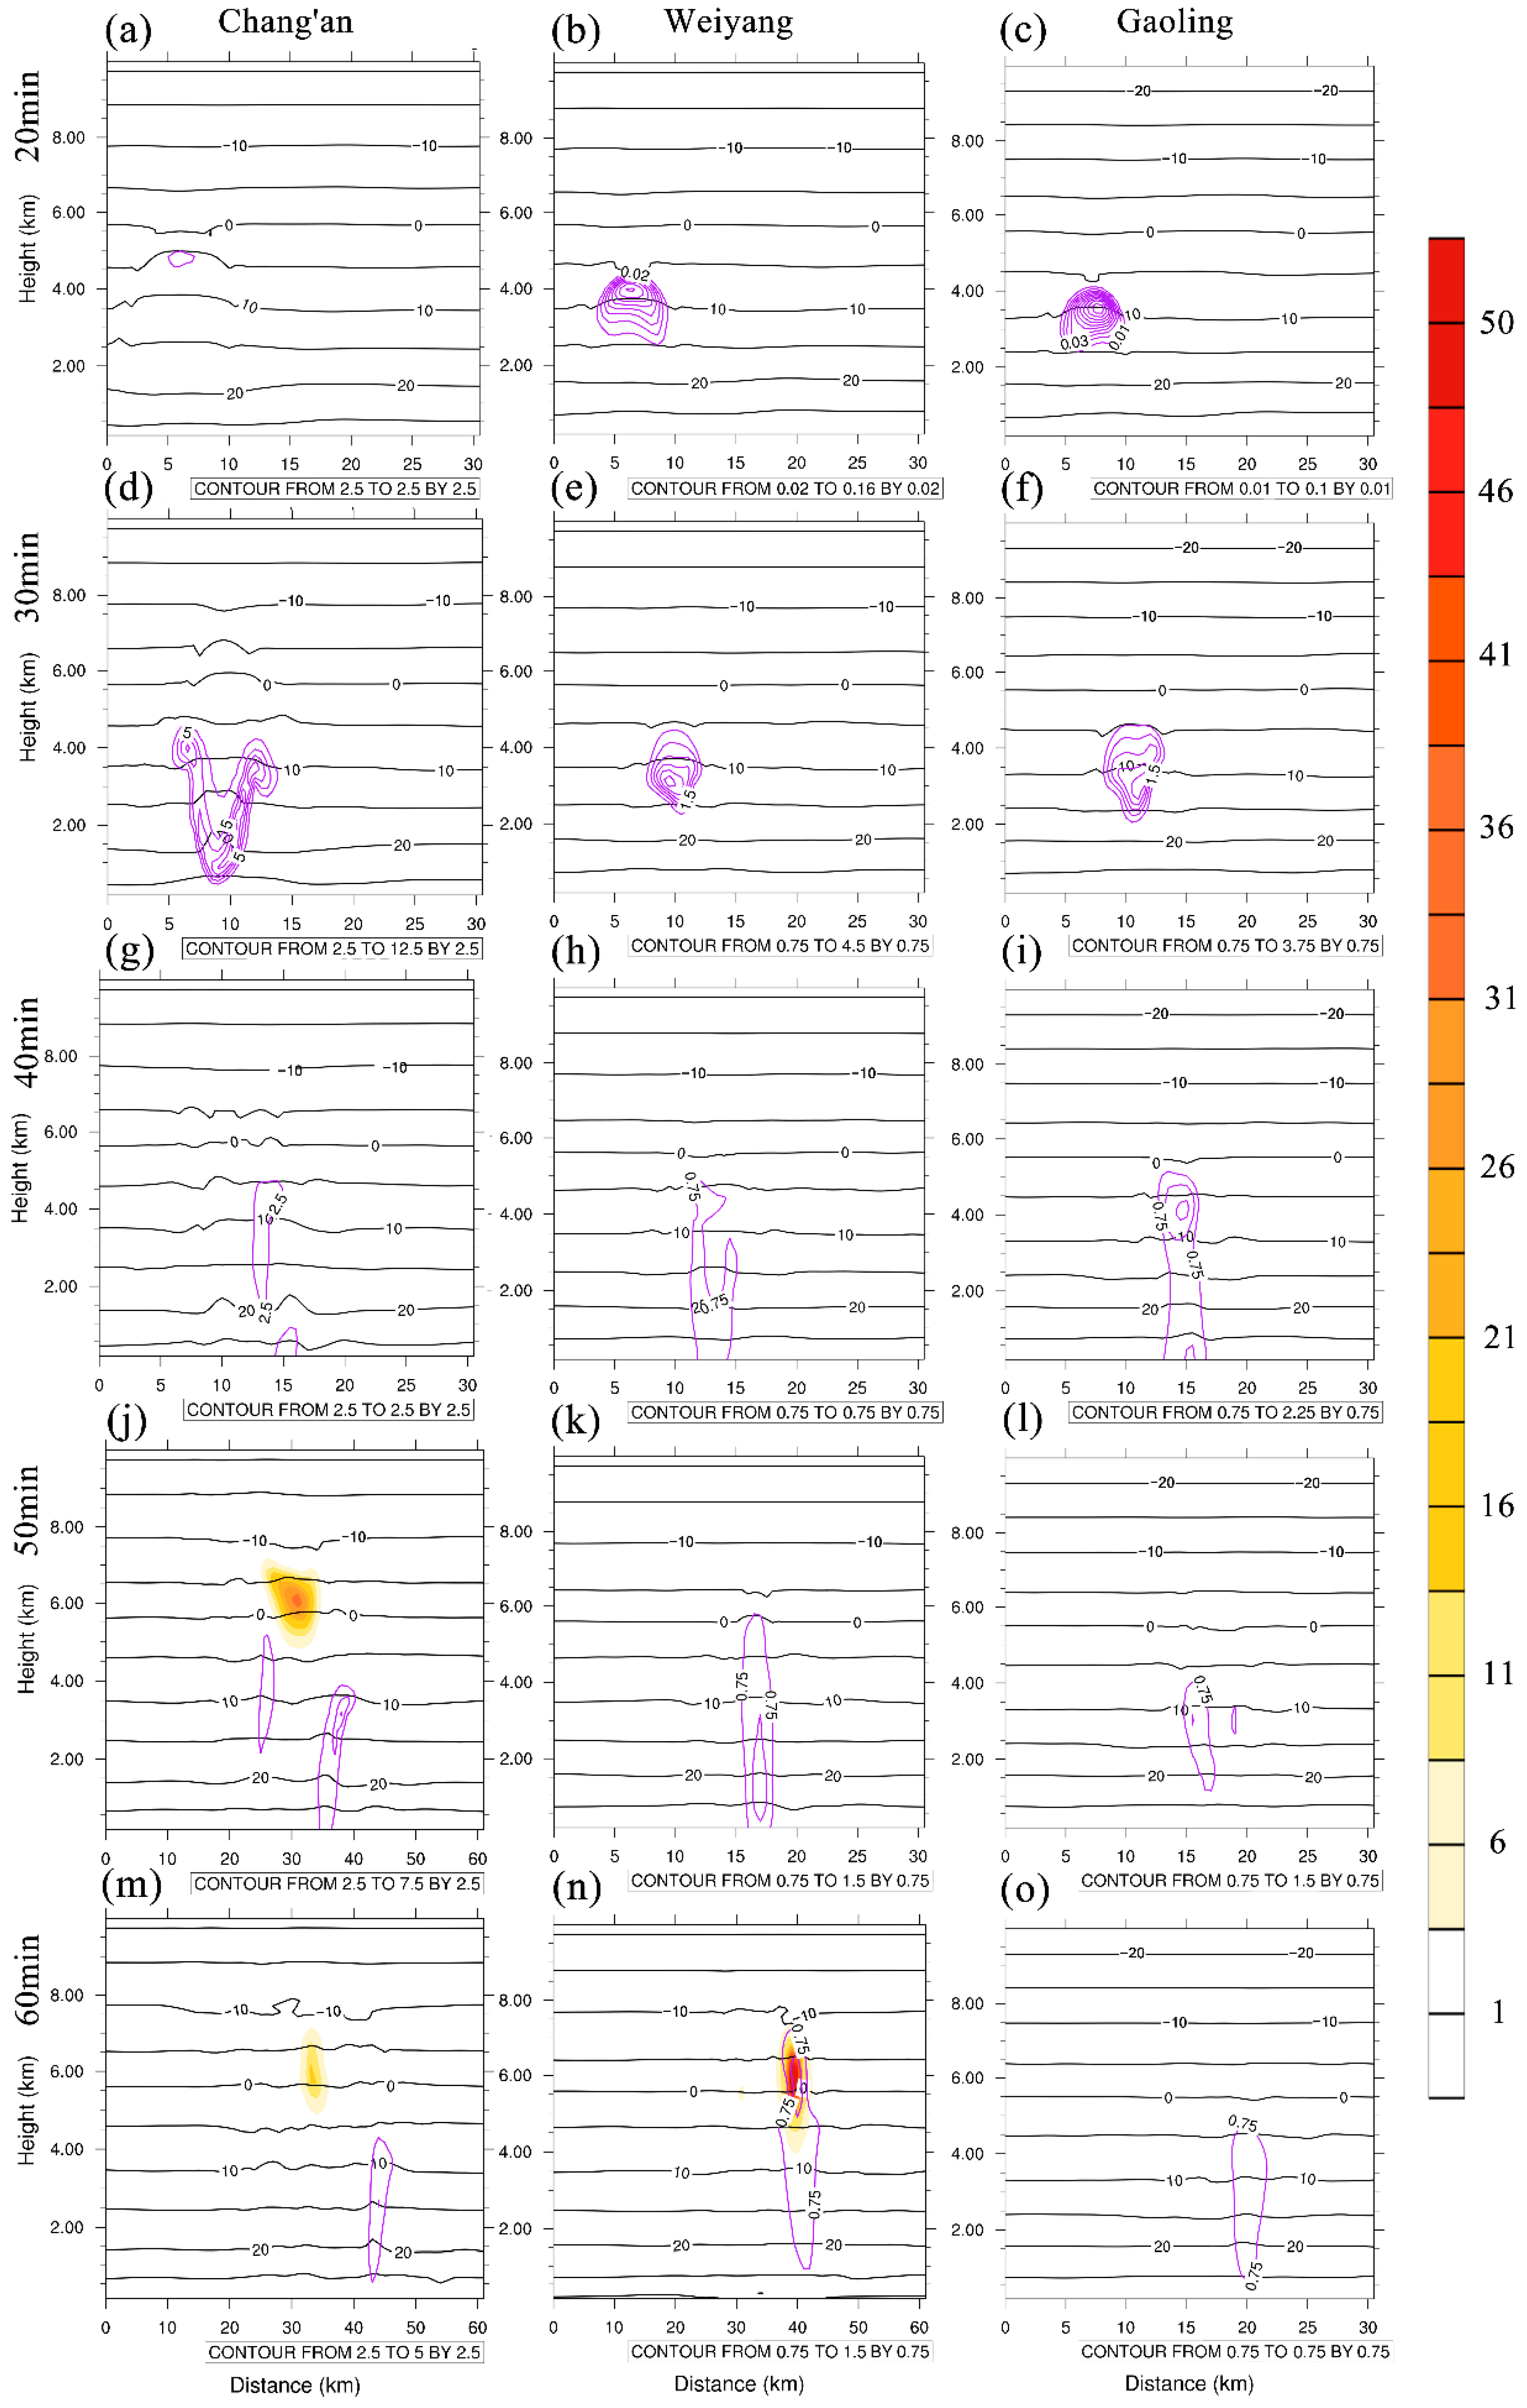
3.4. Idealized Model

The single-point skew-T diagram is often applied to qualitatively determine strong convection events. In the hail case, the skew-T diagrams of the Chang’an, Weiyang, and Gaoling districts showed similar, typical, strong convective characteristics of the pre-3 h of hail occurrence (Figure 8). The ground temperature exceeded 30 °C in each district, the bottom of the troposphere was slightly dry, the middle of the troposphere was high in humidity, and the upper part of the troposphere was dry. Additionally, the three districts had similar wind shear characteristics and similar precipitation amounts of 6 cm, and it was difficult to accurately predict whether hail would be produced in the clouds of the three locations and the specific location of hail occurrence from these three diagrams. This suggests that small differences in atmospheric parameters have a significant impact on hail formation. These effects could be perturbed at a very small magnitude from thermodynamics but could be magnified to larger magnitude from the perspective of microphysics [5,6,35]. With the help of an idealized model, the difference from initial sounding and its subsequent effect on thermodynamics and microphysics could be investigated. We attempted to use such sounding data to initialize an idealized convective monolithic experiment, which differs from previous downscaling simulation efforts and has the advantages of producing a sounding simulation from a single point and of reducing machine time.
The idealized WRF model was initialized from the data of three ground-based microwave radiometers at 2:00 a.m. UTC (pre-3 h of hail occurrence) in the Chang’an, Weiyang, and Gaoling districts. The specific configuration of the model is described in detail in Section 2.
The radar reflectivity of the top plane of the model and the horizontal profile at the location of the strongest radar reflectivity and the distribution of the water vapor mixing ratio, temperature, cloud droplets, rain droplets, ice, and hail (hail and graupel are considered hailfall in the model analysis) were observed in this profile.
When the model was run for 20 min, all simulation cases produced radar reflectivity above 15 dBZ; the Chang’an district produced radar reflectivity at 2–5 km above sea level, with a diameter of 10 km and a maximum value of 45 dBZ, indicating that clouds and rain started to form at these locations. The Weiyang and Gaoling districts produced strong radar reflectivity only at 3–4 km, with a diameter of approximately 4 km and a maximum of 25 dBZ (Figure 9 and Figure 10). Numerous clouds and a small amount of rain formation were observed in the model at this time, with the highest cloud content and rain content of 5 g/kg and 2.5 g/kg, respectively, in the Chang’an district, which is much higher than the 3 g/kg and 0.16 g/kg, respectively, observed in the Weiyang district and much higher than the 2.5 g/kg and 0.1 g/kg, respectively, observed in the Gaoling district (Figure 11 and Figure 12). At 30 min, the peak radar reflectivity and influence range of each station reached the maximum value, the radar reflectivity of the Chang’an district was generated at an altitude of 0–7 km, and the diameter reached 15 km, which is much higher than those of the Weiyang and Gaoling districts at an altitude of 2–5 km and a diameter of 5 km. Afterward, the influence range of the radar reflectivity of each station remained stable, and the peak gradually weakened (Figure 9 and Figure 10). The maximum radar reflectivity in the Chang’an district exceeded 60 dBZ at 30 min, which was very favorable for the formation of shrapnel and hail; the maximum radar reflectivity in the Weiyang district was near 55 dBZ; and the maximum radar reflectivity in the Gaoling district was 50 dBZ (Figure 9). At this time, a significant decrease in clouds and a large amount of rain generation were observed, most obviously in the Chang’an district, where the cloud volume decreased to 2.5 g/kg and the rain volume increased to 12.5 g/kg, which indicated a large amount of cloud conversion to rain in liquid water. The same process occurred in the Weiyang region and Gaoling region, where the cloud amount decreased to 2 g/kg and the rain amount increased to 4.5 g/kg and 3.75 g/kg, respectively (Figure 11 and Figure 12). The location of rain production in the Chang’an region coincided with the location of the maximum radar reflectivity, which was located 2 km below the elevation on the west side of the model, where a small decrease in temperature at a 5.5–6.5 km altitude indicated that rainfall was produced, with descending airflow and evaporation of raindrops. The temperature decrease was caused by the evaporation and heat absorption of the raindrops. However, the water vapor mixing ratio in the vicinity of this area significantly increased at a 5–7 km altitude, and the temperature here also slightly increased (Figure 11 and Figure 12). A small number of clouds was produced here, the cloud amount reached a maximum of 2.5 g/kg, and the clouds produced at high altitudes were more likely to be transformed into ice (Figure 11).
At 40 min, the radar reflectivity, cloud, and rain content decreased at each station, and the maximum radar reflectivity at Chang’an, Weiyang, and Gaoling dropped to 50 dBZ, 45 dBZ, and 45 dBZ, respectively, and remained stable at 50 to 60 min (Figure 9, Figure 11 and Figure 12). These results meant that the duration of the rainfall process in the Chang’an and Weiyang districts exceeded 30 min, and ice formation and hail formation were observed at 5–7 km in the Chang’an district within 50 min at levels of 1.6 mg/kg and 30 mg/kg, respectively, whereas the cloud amount indicated that the formation originated from the clouds formed at this location at 30 min (Figure 11 and Figure 12). The water vapor concentration increased at 5–6 km in the Weiyang area, clouds of 1 g/kg were produced at 6 km, and ice of 0.3 mg/kg and hail of up to 50 mg/kg were produced at 60 min (Figure 11 and Figure 12). At this time, the −10 °C layer in the Weiyang district significantly dropped, the water vapor mixing ratio at 6.5–7.5 km substantially increased, and hail was observed at all 4–7 km height ranges, indicating that hailfall was produced (Figure 11 and Figure 12). The Chang’an area produced 1 mg/kg ice and 10 mg/kg hail at 60 min (Figure 11 and Figure 12). However, no significant reduction in the temperature layer was produced at either 50 or 60 min (Figure 12). Therefore, no significant hailfall process was produced. The rainfall and cloud amount in the Gaoling district gradually decreased starting at 30 min, with the rainfall amount decreasing from 3.75 g/kg to 0.75 g/kg and the cloud amount decreasing from 2 g/kg to 1 g/kg, indicating that a small amount of rainfall was produced (Figure 11 and Figure 12).
The results of the idealized model prediction showed that the radar reflectivity intensity, rainfall intensity, and ice-phase material production were highest in Chang’an, followed by Weiyang and Gaoling, which was consistent with the performance of the ground-based microwave radiometer observations. The model revealed the production of ice-phase particles in the Chang’an and Weiyang districts, and the ground-based microwave radiometer data were analyzed by the changes in water vapor and temperature layers and reached the same conclusion. The model revealed a more intense rainfall process in the Chang’an and Weiyang districts, and ice-phased hydrometers in the Weiyang district directly observed hailfall at a height of 4 km, whereas the ground-based microwave radiometer analyzed this process in Chang’an. The model simulated the initial data three hours before hailfall and discovered hail generation and descent in the Weiyang district and hail formation in the air in the Chang’an district. This result indicates that the high-resolution sounding data at convection-permitting scales can help a lot for predicting hail, and this method may be applied to qualitatively determine the characteristics of spatial and temporal differences in hail clouds and even to predict the occurrence of hail clouds in artificially influenced weather.

4. Discussion

Hail production is associated with strong updrafts, and the atmosphere during its formation usually has a strong instability, and has a suitable 0 °C layer height to ensure a suitable height for freezing of hail embryos [41]. Furthermore, the generation of hailstones is extremely sensitive to perturbations in the initial meteorological conditions, like thermodynamic and dynamic conditions [5,6]. This leads to the fact that small meteorological differences can affect the occurrence of hail, although the difference is at a tiny magnitude. Hail forecasting should be based on high precision data with sufficiently accurate simulation of atmospheric processes [9,10,11]. The WRF idealized model applies high-precision temperature and humidity data from ground-based microwave radiometers, which can accurately describe these atmospheric parameters with a glimpse into the cloud microphysics process, which is not visible for ground-based microwave radiometers.
Because hailstorms are usually characterized by rapid development and small spatial scales, they require a very high spatiotemporal response for observation and model prediction [9,10,11]. Although the results of this study have important implications for hail simulations and forecasting since single point predictions are generally disregarded, there are still some uncertainties in this hail prediction method. From the perspective of observation, uncertainties might derive from the substituted wind information (ground-based microwave radiometers currently do not have a capability for wind) and the location setting of ground-based microwave radiometers (more soundings are needed at the center of the storm). Only a period of pre-3 h of hail occurrence for hail prediction was selected. Further sensitive experiments with extended periods could be attempted to explore the predictability of this method. From the perspective of this idealized model, uncertainties might derive from the initial heating bubble (an important trigger for this hailstorm), microphysical scheme (key parameterization scheme for hail production), and so forth. To reduce these uncertainties, ensemble simulations could be considered. For example, statistical work for historical hailstorms can be performed to explore the mechanism for the convective trigger in this target area and to set a reasonable ensemble heating bubble with great probability in the initial stage. Actual topographic data of the target region can be added to the ideal model, and more physical parameterization schemes can be considered to construct multiple sets of sensitivity tests in ensembles, which might yield better hailstorm prediction results. Combined with more abundant observation data and model settings, this single simulation could be extended to an ensemble experiment for probability forecasting in the future.

5. Conclusions

In this paper, spatiotemporal differences in a hail process are analyzed by three ground-based microwave radiometers located in the Chang’an, Weiyang, and Gaoling districts of Xi’an, and the process is initialized using the idealized WRF model for prediction. A hailfall process that occurred from 5:00 a.m. to 7:00 a.m. UTC on 29 July 2019, in the Lintong district in the city of Xi’an, is explored. In this paper, a rainfall event with similar seasonal and surface temperatures and a similar precipitation total and distribution to this hail event, which occurred from 10:00 a.m. to 12:00 p.m. UTC on 9 August 2018, is selected for comparative analysis.
The liquid water and relative humidity profiles show that the precipitation intensity during the two precipitation events is highest at Chang’an, followed by Weiyang and Gaoling. This conclusion is consistent with the observations from the ground stations and the FY-4A satellite. The low-value zone generated by the drop in relative humidity above a 5 km height in the Chang’an district during the hailing process from 8:00 p.m. to 9:00 p.m. and during the rainfall process from 8:00 a.m. to 10:00 a.m. and at a 1–10 km height range in the Weiyang district during the hailing process from 9:00 p.m. to 11:00 p.m. and during the rainfall process from 9:30 a.m. to 10:30 a.m. correspond to the same simultaneous rise in liquid water content and temperature stratification. Both processes produce warm cloud processes here, where water vapor condenses into a liquid or solid-state, which corresponds to the generation of ice-phase particles at high altitudes. The 0 °C and −20 °C layers in the Chang’an district during hailfall significantly decrease after 10:00 p.m., while those in the Weiyang district alternately fluctuate between rising and falling, and the 0 °C and −20 °C layers in the Chang’an and Weiyang districts during rainfall slowly decrease to a steady state. The hailfall process produces obvious ice-phased hydrometers in the Chang’an district, producing a hailfall of shrapnel particles that melt near the ground. The hailfall process in the Weiyang district and the rainfall process in the Chang’an and Weiyang districts produce a cold cloud formation process. However, no large hailfall of shrapnel or other lendable particles is formed.
The idealized WRF model is initialized by ground-based microwave radiometer data before 3 h of hail occurrence, and radar reflectivity and water vapor in different forms are analyzed in the Chang’an and Weiyang districts by similar initial data in each district. The precipitation intensity and radar reflectivity intensity in the model are shown in the following order: Chang’an > Weiyang > Gaoling. The process of increasing water vapor at high altitudes produces clouds, and then ice and hail are observed in the Chang’an and Weiyang districts. An ice-phased hydrometer with a falling −10 °C layer in the Weiyang district and hailfall are simultaneously produced, and no significant hailfall process is produced in the Chang’an district. These findings show agreement with the discrepancy in the hailfall process observed by the ground-based microwave radiometer. This finding indicates that the idealized model achieves accurate results in hail prediction.
Predicting strong convective weather, such as hail, is highly dependent on accurate, high-temporal resolution observations and high-precision numerical models, which often implies very high computing costs [46]. Ground-based microwave radiometers can observe atmospheric sounding data with a high temporal resolution, which in previous studies have been used only for the qualitative determination of strong convection events similar to skew-T diagrams or numerical prediction by data assimilation methods [47]. The former method has a role similar to that of traditional-sounding data, which can only qualitatively identify strong convection events and cannot determine microphysical processes within clouds, with the latter method requiring a very high level of data assimilation, i.e., generalization of multiple ground-based microwave radiometer data or even multiple observations such as those from ground-based meteorological stations, satellites, and radars, as well as super high computing costs to meet the operational needs of prediction. However, the method proposed in this paper, i.e., using single-point, ground-based microwave radiometer data to initialize the idealized model to predict hail, has never been practically applied. It not only realizes the numerical prediction of single-point, ground-based microwave radiometer data but also greatly reduces computational costs and can provide new ideas for future ground-based microwave radiometer data applications and hail prediction efforts.

Author Contributions

Conceptualization, R.M. and X.L.; methodology, R.M. and X.L.; software, R.M.; validation, R.M. and X.L.; formal analysis, R.M. and X.L.; investigation, R.M.; resources, R.M. and X.L.; data curation, R.M.; writing—original draft preparation, R.M.; writing—review and editing, X.L.; visualization, R.M.; supervision, X.L.; project administration, X.L.; funding acquisition, X.L. All authors have read and agreed to the published version of the manuscript.

Funding

This research was funded by the National Natural Science Foundation of China (Grant Nos. 42005005 and 42030607), Education Department of Shaanxi Province (20JK0925), and Young Talent fund of University Association for Science and Technology in Shaanxi (20210706).

Data Availability Statement

The initial data for the WRF simulated wind field information and circulation analysis presented in this study are publicly available from the National Centers for Environmental Prediction/National Weather Service/NOAA/U.S. Department of Commerce (2015), NCEP GFS 0.25 Degree Global Forecast Grid Historical Archive, https://rda.ucar.edu/datasets/ds084.1/#description (accessed on 9 June 2022).

Acknowledgments

We thank the North Sky-Dome Information Technology (Xi’an, China) Company for their guidance on ground-based microwave radiometer data. We thank the Xi’an Meteorological Bureau for providing the surface meteorological station data and for proofreading the ground-based microwave radiometer data. The WRF simulations were carried out at the high-performance computing platform of the College of Urban and Environmental Sciences, Northwest University in Xi’an in China. We thank Daijun Yao and Yanlin Mao for their contributions to the analysis and programming.

Conflicts of Interest

The authors declare that they have no conflict of interest.

References

  1. Brown, T.M.; Pogorzelski, W.H.; Giammanco, I.M. Evaluating Hail Damage Using Property Insurance Claims Data. Weather Clim. Soc. 2015, 7, 197–210. [Google Scholar] [CrossRef]
  2. Phillips, V.T.J.; Khain, A.; Benmoshe, N.; Ilotoviz, E. Theory of Time-Dependent Freezing. Part I: Description of Scheme for Wet Growth of Hail. J. Atmos. Sci. 2014, 71, 4527–4557. [Google Scholar] [CrossRef]
  3. Li, X.; Zhang, Q.; Zou, T.; Lin, J.; Kong, H.; Ren, Z. Climatology of Hail Frequency and Size in China, 1980–2015. J. Appl. Meteorol. Climatol. 2018, 57, 875–887. [Google Scholar] [CrossRef]
  4. Brimelow, J.C.; Reuter, G.W.; Goodson, R.; Krauss, T.W. Spatial Forecasts of Maximum Hail Size Using Prognostic Model Soundings and HAILCAST. Weather Forecast. 2006, 21, 206–219. [Google Scholar] [CrossRef]
  5. Li, X.; Zhang, Q.; Fan, J.; Zhang, F. Notable Contributions of Aerosols to the Predictability of Hail Precipitation. Geophys. Res. Lett. 2021, 48, e2020GL091712. [Google Scholar] [CrossRef]
  6. Li, X.; Zhang, F.; Zhang, Q.; Kumjian, M.R. Sensitivity of Hail Precipitation to Ensembles of Uncertainties of Representative Initial Environmental Conditions From ECMWF. J. Geophys. Res. Atmos. 2019, 124, 6929–6948. [Google Scholar] [CrossRef]
  7. Adams-Selin, R.D.; Ziegler, C.L. Forecasting Hail Using a One-Dimensional Hail Growth Model within WRF. Mon. Weather Rev. 2016, 144, 4919–4939. [Google Scholar] [CrossRef]
  8. Knupp, K.R.; Coleman, T.; Phillips, D.; Ware, R.; Cimini, D.; Vandenberghe, F.; Vivekanandan, J.; Westwater, E. Ground-Based Passive Microwave Profiling during Dynamic Weather Conditions. J. Atmos. Ocean. Technol. 2009, 26, 1057–1073. [Google Scholar] [CrossRef]
  9. Bedka, K.M.; Wang, C.; Rogers, R.; Carey, L.D.; Feltz, W.; Kanak, J. Examining Deep Convective Cloud Evolution Using Total Lightning, WSR-88D, and GOES-14 Super Rapid Scan Datasets. Weather Forecast. 2015, 30, 571–590. [Google Scholar] [CrossRef]
  10. Dworak, R.; Bedka, K.; Brunner, J.; Feltz, W. Comparison between GOES-12 Overshooting-Top Detections, WSR-88D Radar Reflectivity, and Severe Storm Reports. Weather Forecast. 2012, 27, 684–699. [Google Scholar] [CrossRef] [Green Version]
  11. Mecikalski, J.R.; Jewett, C.P.; Apke, J.M.; Carey, L.D. Analysis of Cumulus Cloud Updrafts as Observed with 1-Min Resolution Super Rapid Scan GOES Imagery. Mon. Weather Rev. 2016, 144, 811–830. [Google Scholar] [CrossRef]
  12. Borque, P.; Vidal, L.; Rugna, M.; Lang, T.J.; Nicora, M.G.; Nesbitt, S.W. Distinctive Signals in 1-min Observations of Overshooting Tops and Lightning Activity in a Severe Supercell Thunderstorm. J. Geophys. Res. Atmos. 2020, 125, e2020JD032856. [Google Scholar] [CrossRef]
  13. Qi, Y.; Fan, S.; Mao, J.; Li, B.; Guo, C.; Zhang, S. Impact of Assimilating Ground-Based Microwave Radiometer Data on the Precipitation Bifurcation Forecast: A Case Study in Beijing. Atmosphere 2021, 12, 551. [Google Scholar] [CrossRef]
  14. Cimini, D.; Nelson, M.; Güldner, J.; Ware, R. Forecast Indices from a Ground-Based Microwave Radiometer for Operational Meteorology. Atmos. Meas. Tech. 2015, 8, 315–333. [Google Scholar] [CrossRef]
  15. Gerber, D.; Balin, I.; Feist, D.G.; Kampfer, N.; Simeonov, V.; Calpini, B. Ground-Based Water Vapour Soundings by Microwave Radiometry and Raman Lidar on Jungfraujoch (Swiss Alps). Atmos. Chem. Phys. 2004, 4, 2171–2179. [Google Scholar] [CrossRef]
  16. Hocke, K.; Kampfer, N.; Ruffieux, D.; Froidevaux, L.; Parrish, A.; Boyd, I.; Timofeyev, Y.M.; Polyakov, A.V.; Kyrola, E. Comparison and Synergy of Stratospheric Ozone Measurements by Satellite Limb Sounders and the Ground-Based Microwave Radiometer SOMORA. Atmos. Chem. Phys. 2007, 7, 4117–4131. [Google Scholar] [CrossRef]
  17. John, V.O.; Buehler, S.A. Comparison of Microwave Satellite Humidity Data and Radiosonde Profiles: A Survey of European Stations. Atmos. Chem. Phys. 2005, 5, 1843–1853. [Google Scholar] [CrossRef]
  18. Müller, S.C.; Kämpfer, N.; Feist, D.G. Validation of Stratospheric Water Vapour Measurements from the Airborne Microwave Radiometer AMSOS. Atmos. Chem. Phys. 2008, 8, 3169–3183. [Google Scholar] [CrossRef]
  19. Revercomb, H.E.; Turner, D.D.; Tobin, D.C.; Knuteson, R.O.; Feltz, W.F.; Barnard, J.; Bösenberg, J.; Clough, S.; Cook, D.; Ferrare, R.; et al. The Arm Program’s Water Vapor Intensive Observation Periods: Overview, Initial Accomplishments, and Future Challenges. Bull. Am. Meteorol. Soc. 2003, 84, 217–236. [Google Scholar] [CrossRef]
  20. Liu, S.; Heygster, G.; Zhang, S. Comparison of CloudSat Cloud Liquid Water Paths in Arctic Summer Using Ground-Based Microwave Radiometer. J. Ocean Univ. China 2010, 9, 333–342. [Google Scholar] [CrossRef]
  21. Kulikov, M.Y.; Belikovich, M.V.; Skalyga, N.K.; Shatalina, M.V.; Dementyeva, S.O.; Ryskin, V.G.; Shvetsov, A.A.; Krasil’nikov, A.A.; Serov, E.A.; Feigin, A.M. Skills of Thunderstorm Prediction by Convective Indices over a Metropolitan Area: Comparison of Microwave and Radiosonde Data. Remote Sens. 2020, 12, 604. [Google Scholar] [CrossRef]
  22. Sun, J.; Chai, J.; Leng, L.; Xu, G. Analysis of Lightning and Precipitation Activities in Three Severe Convective Events Based on Doppler Radar and Microwave Radiometer over the Central China Region. Atmosphere 2019, 10, 298. [Google Scholar] [CrossRef]
  23. Labriola, J.; Snook, N.; Jung, Y.; Putnam, B.; Xue, M. Ensemble Hail Prediction for the Storms of 10 May 2010 in South-Central Oklahoma Using Single- and Double-Moment Microphysical Schemes. Mon. Weather Rev. 2017, 145, 4911–4936. [Google Scholar] [CrossRef]
  24. Snook, N.; Xue, M.; Jung, Y. Analysis of a Tornadic Mesoscale Convective Vortex Based on Ensemble Kalman Filter Assimilation of CASA X-Band and WSR-88D Radar Data. Mon. Weather Rev. 2011, 139, 3446–3468. [Google Scholar] [CrossRef]
  25. Snook, N.; Xue, M.; Jung, Y. Multiscale EnKF Assimilation of Radar and Conventional Observations and Ensemble Forecasting for a Tornadic Mesoscale Convective System. Mon. Weather Rev. 2015, 143, 1035–1057. [Google Scholar] [CrossRef]
  26. Yussouf, N.; Kain, J.S.; Clark, A.J. Short-Term Probabilistic Forecasts of the 31 May 2013 Oklahoma Tornado and Flash Flood Event Using a Continuous-Update-Cycle Storm-Scale Ensemble System. Weather Forecast. 2016, 31, 957–983. [Google Scholar] [CrossRef]
  27. Yussouf, N.; Mansell, E.R.; Wicker, L.J.; Wheatley, D.M.; Stensrud, D.J. The Ensemble Kalman Filter Analyses and Forecasts of the 8 May 2003 Oklahoma City Tornadic Supercell Storm Using Single- and Double-Moment Microphysics Schemes. Mon. Weather Rev. 2013, 141, 3388–3412. [Google Scholar] [CrossRef]
  28. Dawson II, D.T.; Wicker, L.J.; Mansell, E.R.; Tanamachi, R.L. Impact of the Environmental Low-Level Wind Profile on Ensemble Forecasts of the 4 May 2007 Greensburg, Kansas, Tornadic Storm and Associated Mesocyclones. Mon. Weather Rev. 2012, 140, 696–716. [Google Scholar] [CrossRef]
  29. Hartung, D.C.; Otkin, J.A.; Petersen, R.A.; Turner, D.D.; Feltz, W.F. Assimilation of Surface-Based Boundary Layer Profiler Observations during a Cool-Season Weather Event Using an Observing System Simulation Experiment. Part II: Forecast Assessment. Mon. Weather Rev. 2011, 139, 2327–2346. [Google Scholar] [CrossRef]
  30. Caumont, O.; Cimini, D.; Löhnert, U.; Alados-Arboledas, L.; Bleisch, R.; Buffa, F.; Ferrario, M.E.; Haefele, A.; Huet, T.; Madonna, F.; et al. Assimilation of Humidity and Temperature Observations Retrieved from Ground-based Microwave Radiometers into a Convective-scale NWP Model. Q. J. R. Meteorol. Soc. 2016, 142, 2692–2704. [Google Scholar] [CrossRef] [Green Version]
  31. Otkin, J.A.; Hartung, D.C.; Turner, D.D.; Petersen, R.A.; Feltz, W.F.; Janzon, E. Assimilation of Surface-Based Boundary Layer Profiler Observations during a Cool-Season Weather Event Using an Observing System Simulation Experiment. Part I: Analysis Impact. Mon. Weather Rev. 2011, 139, 2309–2326. [Google Scholar] [CrossRef]
  32. He, W.; Chen, H.; Li, J. Influence of Assimilating Ground-Based Microwave Radiometer Data into the WRF Model on Precipitation. Atmos. Ocean. Sci. Lett. 2020, 13, 107–112. [Google Scholar] [CrossRef]
  33. Moeng, C.-H.; Dudhia, J.; Klemp, J.; Sullivan, P. Examining Two-Way Grid Nesting for Large Eddy Simulation of the PBL Using the WRF Model. Mon. Weather Rev. 2007, 135, 2295–2311. [Google Scholar] [CrossRef]
  34. Mirocha, J.D.; Lundquist, J.K.; Kosović, B. Implementation of a Nonlinear Subfilter Turbulence Stress Model for Large-Eddy Simulation in the Advanced Research WRF Model. Mon. Weather Rev. 2010, 138, 4212–4228. [Google Scholar] [CrossRef]
  35. Li, X.; Zhang, Q.; Xue, H. The Role of Initial Cloud Condensation Nuclei Concentration in Hail Using the WRF NSSL 2-Moment Microphysics Scheme. Adv. Atmos. Sci. 2017, 34, 1106–1120. [Google Scholar] [CrossRef]
  36. Khain, A.; Rosenfeld, D.; Pokrovsky, A.; Blahak, U.; Ryzhkov, A. The Role of CCN in Precipitation and Hail in a Mid-Latitude Storm as Seen in Simulations Using a Spectral (Bin) Microphysics Model in a 2D Dynamic Frame. Atmos. Res. 2011, 99, 129–146. [Google Scholar] [CrossRef]
  37. Zhang, G.; Gao, J.; Du, M. Parameterized Forward Operators for Simulation and Assimilation of Polarimetric Radar Data with Numerical Weather Predictions. Adv. Atmos. Sci. 2021, 38, 737–754. [Google Scholar] [CrossRef]
  38. Madhulatha, A.; Rajeevan, M.; Venkat Ratnam, M.; Bhate, J.; Naidu, C.V. Nowcasting Severe Convective Activity over Southeast India Using Ground-Based Microwave Radiometer Observations: Thunderstorm Nowcasting Using Radiometer. J. Geophys. Res. Atmos. 2013, 118, 1–13. [Google Scholar] [CrossRef]
  39. Al-Hemoud, A.; Al-Sudairawi, M.; Al-Rashidi, M.; Behbehani, W.; Al-Khayat, A. Temperature Inversion and Mixing Height: Critical Indicators for Air Pollution in Hot Arid Climate. Nat. Hazards 2019, 97, 139–155. [Google Scholar] [CrossRef]
  40. Güldner, J.; Spänkuch, D. Remote Sensing of the Thermodynamic State of the Atmospheric Boundary Layer by Ground-Based Microwave Radiometry. J. Atmos. Ocean. Technol. 2001, 18, 925–933. [Google Scholar] [CrossRef]
  41. Sheng, P.; Mao, J.; Li, J.; Zhang, A.; Sang, J.; Pan, N. Atmospheric Physics, 1st ed.; Peking University Press: Beijing, China, 2003; pp. 138–154. [Google Scholar]
  42. Mansell, E.R. On Sedimentation and Advection in Multimoment Bulk Microphysics. J. Atmos. Sci. 2010, 67, 3084–3094. [Google Scholar] [CrossRef]
  43. Mansell, E.R.; Ziegler, C.L. Aerosol Effects on Simulated Storm Electrification and Precipitation in a Two-Moment Bulk Microphysics Model. J. Atmos. Sci. 2013, 70, 2032–2050. [Google Scholar] [CrossRef]
  44. Mansell, E.R.; Ziegler, C.L.; Bruning, E.C. Simulated Electrification of a Small Thunderstorm with Two-Moment Bulk Microphysics. J. Atmos. Sci. 2010, 67, 171–194. [Google Scholar] [CrossRef]
  45. Ryzhkov, A.V.; Snyder, J.; Carlin, J.T.; Khain, A.; Pinsky, M. What Polarimetric Weather Radars Offer to Cloud Modelers: Forward Radar Operators and Microphysical/Thermodynamic Retrievals. Atmosphere 2020, 11, 362. [Google Scholar] [CrossRef]
  46. Mulena, G.C.; Puliafito, S.E.; Lakkis, S.G. Application of Tropospheric Sulfate Aerosol Emissions to Mitigate Meteorological Phenomena with Extremely High Daily Temperatures. Environ. Clim. Technol. 2019, 23, 14–40. [Google Scholar] [CrossRef]
  47. Gascón, E.; Sánchez, J.L.; Fernández-González, S.; Hermida, L.; López, L.; García-Ortega, E.; Merino, A. Monitoring a Convective Winter Episode of the Iberian Peninsula Using a Multichannel Microwave Radiometer. J. Geophys. Res. Atmos. 2015, 120, 1565–1581. [Google Scholar] [CrossRef]
Figure 1. Variation characteristics of cloud top temperature with time from FY-4A satellite observations of hail processes. The red triangle marks the location of the hailfall (Lintong station), and the red dots mark the location of the ground-based microwave radiometer, corresponding from north to south to the Gaoling, Weiyang, and Chang’an districts.
Atmosphere 13 01535 g001
Figure 2. Hourly rainfall data of the Chang’an (blue) and Jinghe (red) meteorological stations during the hailfall process (a) and rainfall process (b).
Atmosphere 13 01535 g002
Figure 3. Weather map of the initial field of ground, 850 hPa, and 500 hPa isobaric pressure surfaces during the two precipitation events. The black line represents the horizontal wind field, the purple contour line represents the potential height (m), the ground plot is the sea level pressure field (hpa), and the color indicates the temperature (°C).
Atmosphere 13 01535 g003
Figure 4. Changes in the liquid water profile during a hailstorm in the Gaoling, Weiyang, and Chang’an districts (left, starting at 4:00 p.m. UTC on 27 July 2019) and rainfall (right, rainfall process, starting at 4:00 p.m. UTC on 8 August 2018).
Atmosphere 13 01535 g004
Figure 5. Changes in relative humidity profiles during hailstorms (left, starting at 4:00 p.m. UTC on 27 July 2019, as shown in Figure 4) and rainfall (right, rainfall process, starting at 4:00 p.m. UTC on 8 August 2018, as shown in Figure 4) in the Gaoling, Weiyang, and Chang’an districts.
Atmosphere 13 01535 g005
Figure 6. Hailstorms (a) and rainfall (b) processes at the 0 °C layer (lower curve) and −20 °C layer (upper curve) in the Gaoling, Weiyang, and Chang’an districts.
Atmosphere 13 01535 g006
Figure 7. Hailstorms (left, starting at 4:00 p.m. UTC on 27 July 2019, as shown in Figure 4) and rainfall (right, rainfall process, starting at 4:00 p.m. UTC on 8 August 2018, as shown in Figure 4) potential temperature (when <0, represented by black dots) gradient and pseudoequivalent potential temperature gradient (filled color) in the Gaoling, Weiyang, and Chang’an districts.
Atmosphere 13 01535 g007
Figure 8. Skew−T diagrams of the initial temperature (black line), dew point temperature (blue line), and wind field (right-hand line) profiles used in this study: (a) Chang’an district, (b) Weiyang district, and (c) Gaoling district.
Atmosphere 13 01535 g008
Figure 9. Radar reflectance (dBZ) over the model at 10-min intervals (where (ac) are 20 min, (df) are 30 min, (gi) are 40 min, (jl) are 50 min, (mo) are 60 min. (a,d,g,j,m) are Chang’an District; (b,e,h,k,n) are Weiyang District; (c,f,i,l,o) are Gaoling District).
Atmosphere 13 01535 g009
Figure 10. As shown in Figure 9, but for the horizontal profile, which is plotted at the location of the strongest combined radar reflectivity. (where (ac) are 20 min, (df) are 30 min, (gi) are 40 min, (jl) are 50 min, (mo) are 60 min. (a,d,g,j,m) are Chang’an District; (b,e,h,k,n) are Weiyang District; (c,f,i,l,o) are Gaoling District).
Atmosphere 13 01535 g010
Figure 11. As shown in Figure 10, but for the profiles of water vapor mixing ratio (black line), clouds (purple line), and ice (filled color). Units are g/kg (mg/kg for ice). (where (ac) are 20 min, (df) are 30 min, (gi) are 40 min, (jl) are 50 min, (mo) are 60 min. (a,d,g,j,m) are Chang’an District; (b,e,h,k,n) are Weiyang District; (c,f,i,l,o) are Gaoling District).
Atmosphere 13 01535 g011
Figure 12. As shown in Figure 10, but for profiles of temperature (black line), rain (purple line), and hail (filled color). Units are g/kg (mg/kg for hail). (where (ac) are 20 min, (df) are 30 min, (gi) are 40 min, (jl) are 50 min, (mo) are 60 min. (a,d,g,j,m) are Chang’an District; (b,e,h,k,n) are Weiyang District; (c,f,i,l,o) are Gaoling District).
Atmosphere 13 01535 g012
Table 1. Overall detection performance indicators of the MWP967KV ground-based microwave radiometer (RMSE refers to the root mean square error).
ProjectPerformance Metrics
Profile sampling rate≤2 min
Detection height≥10 km
Observation performanceTemperature profile≤25 m (0 m–500 m)RMSE ≤ 1 K
≤50 m (500 m–2 km)RMSE ≤ 1 K
≤250 m (2 km~10 km)RMSE ≤ 1.8 K
Relative humidity profiles≤50 m (0 m~500 m)RMSE ≤ 15% RH
≤100 m (500 m~2 km)RMSE ≤ 15% RH
≤250 m (2 km~10 km)RMSE ≤ 15% RH
Data formatTemperature profileRetain 3 decimal places°C
Relative humidity profilesRetain 3 decimal places% RH
Liquid water profilesRetain 3 decimal placesg/m3
Publisher’s Note: MDPI stays neutral with regard to jurisdictional claims in published maps and institutional affiliations.

