
Characteristics of Propagation of Meteorological to Hydrological Drought for Lake Baiyangdian in a Changing Environment

1
Changjiang River Scientific Research Institute, Changjiang Water Resources Commission, Wuhan 430010, China
2
State Key Laboratory of Hydro-Science and Engineering, Department of Hydraulic Engineering, Tsinghua University, Beijing 100084, China
3
Hubei Key Laboratory of Water Resources and Eco-Environmental Sciences, Wuhan 430010, China
4
Faculty of Architecture, Civil and Transportation Engineering, Beijing University of Technology, Beijing 100124, China
*
Author to whom correspondence should be addressed.
Atmosphere 2022, 13(9), 1531; https://doi.org/10.3390/atmos13091531
Submission received: 12 August 2022
/
Revised: 14 September 2022
/
Accepted: 15 September 2022
/
Published: 19 September 2022
(This article belongs to the Special Issue Hydrological Responses under Climate Changes)
Abstract
:The analysis of drought propagation has garnered mounting attention in the changing global environment. The current studies tend to focus on the propagation characteristics from meteorological to hydrological drought in rivers. Lakes, despite being a key component of watershed ecosystems, have received little attention to their response to meteorological and hydrological droughts. To this end, here, we investigated the characteristics of propagation from meteorological to hydrological drought for a lake in a changing environment. To determine the drought propagation time from meteorological to hydrological drought, we analyzed correlations between the standardized precipitation index (SPI), standardized runoff index (SRI), and standardized water level index (SWI). Lake Baiyangdian in China served as the case study. The results showed that meteorological droughts occur at high frequency but are short in duration, indicating that not every meteorological drought will necessarily lead to a hydrological drought. By contrast, lake hydrological droughts have low frequency and long duration and feature more severe consequences. Comparing drought characteristics before and after a changing environment, we found a reduced frequency of the SPI, SRI, and SWI, yet their duration was prolonged. For the SWI especially, these results were even more pronounced, which suggests the changing environment enabled further intensification of the lake hydrological drought. In addition, more time was needed for a meteorological drought to transition into a lake hydrological drought after a changing environment.
1. Introduction
Droughts are among the most common and severe natural disasters worldwide because of its high frequency, wide impact area, and long duration [1,2]. Under the combined influence of human activities and ongoing climate change, widespread drought events can frequently happen, causing tremendous losses to social well-being, the economy, ecosystems, and water resources [3,4,5,6]. Further, droughts result in considerable water shortages, which exacerbate the lack of water for human subsistence and societies’ functioning. The severe impact of droughts leads to the need to track and characterize various kinds of drought. Traditionally, droughts can be subdivided into meteorological, hydrological, agricultural, and socioeconomic drought events, which indicate a water shortage caused by the imbalance between the supply of and demand for water for meteorology, crops, runoff, and the economy, respectively [7,8,9,10,11]. These four types of droughts all entail an association of water loss to energy dynamics, and the transmission of the water loss signal between drought types is called drought transmission [12]. Meteorological droughts caused by precipitation deficit over an extended period of time are the drivers of other types of droughts. For example, long-term precipitation loss leads to the insufficient replenishment of runoff and groundwater. Then, evaporation, human activities, and other large-scale water losses lead to water shortages in rivers, lakes, and reservoirs, resulting in hydrological droughts [13].
Drought indices are effective tools for monitoring and characterizing various types of droughts. A lot of research on droughts has mainly focused on the establishment of a robust and reliable drought index. For instance, the standardized precipitation index (SPI) and the standardized runoff index (SRI) are widely used for tracking and characterizing meteorological and hydrological droughts [14,15,16,17]. Research over the last decade has focused on the propagation of meteorological drought to hydrological drought at regional and global scales [18]. For example, Lorenzo-Lacruz et al. [19] correlated the SPI with the SRI to determine the most robust timescale for monitoring hydrological drought events. Later, Sun et al. [20] examined the transition relationship from meteorological to hydrological drought by using two-dimensional drought state variables of the meteorological drought’s SPI and the hydrological drought’s SRI. Work by Huang et al. [21] showed that meteorological and hydrological droughts are positively correlated, and propagation time changes markedly on a seasonal basis. By analyzing the correlation between the SPI and the SRI over different regions of the Luanhe River Basin, Xu et al. [22] investigated the propagation of meteorological to hydrological drought under the influence of human activities. Most recently, Zhang et al. [23] reviewed the major characteristics (e.g., response timescale, lag time), approaches (including statistical analysis and hydrological modeling), key processes, and controlling factors (including climate, catchment properties, and human activities) of drought propagation under global warming.
Understanding how meteorological drought propagates to hydrological drought is extremely pertinent to hydrological drought management. The previous studies concentrated on aspects of meteorological-to-hydrological drought propagation in river basins, leaving far less attention to how droughts can impact lake hydrology or the characterizing hydrological drought events in lakes. This is somewhat surprising since lakes are a pivotal part of a watershed’s hydrological cycle. Large amounts of precious freshwater resources are stored in lakes, which are of great value and function to both terrestrial and aquatic ecosystems [24,25,26]. Regional drought events can also severely impact lakes which are significantly driven by water, and drought is a critical factor affecting the ecological security of lakes [27]. Chronic severe droughts incurred by lakes would lead to many aquatic plants dying, plant diversity decreasing substantially, water purification capacity decreasing, and water quality deteriorating considerably [28]. Some studies have analyzed the response of water levels, wetland birds, or aquatic organisms (e.g., zooplankton) to drought events in lakes or monitored droughts in lakes via remote sensing methods [29,30,31,32,33]. Despite that body of research, the characteristics associated with the propagation of meteorological to hydrological drought have yet to be explicitly parsed for lakes. The likely interrelations between lake hydrological droughts, hydrological droughts in river basins, and meteorological droughts are also largely ignored in those studies. Moreover, meteorological drought propagates to hydrological drought in river basins, and then to lake hydrological drought. The responses of water levels in lakes and runoffs in river basins to droughts are different. Therefore, it is necessary to compare hydrological droughts in river basins and in lakes. This comparative analysis is helpful to study the drought propagation process and lays the foundation for the study of the drought transmission mechanism.
To fill that knowledge gap, this paper focused on the phenomenon of lake hydrological drought and investigated the meteorological-to-hydrological drought propagation characteristics of a lake. Lake Baiyangdian, the largest shallow macrophytic lake in the North China Plain, often plagued by droughts, served as the study area. We used the standardized water level index (SWI) to quantify lake hydrological drought. In general, this study had three objectives: (1) to characterize the propagation of meteorological to hydrological drought in Lake Baiyangdian; (2) to compare the drought characteristics of Lake Baiyangdian before and after a changed environment; and (3) to evaluate the effect of a changing environment upon drought propagation time. This study is of great significance for better understanding the drought propagation characteristics of Lake Baiyangdian, providing a timely valuable reference for its drought prevention and warning strategies under a changing environment.
2. Materials and Methods
2.1. Study Area and Data
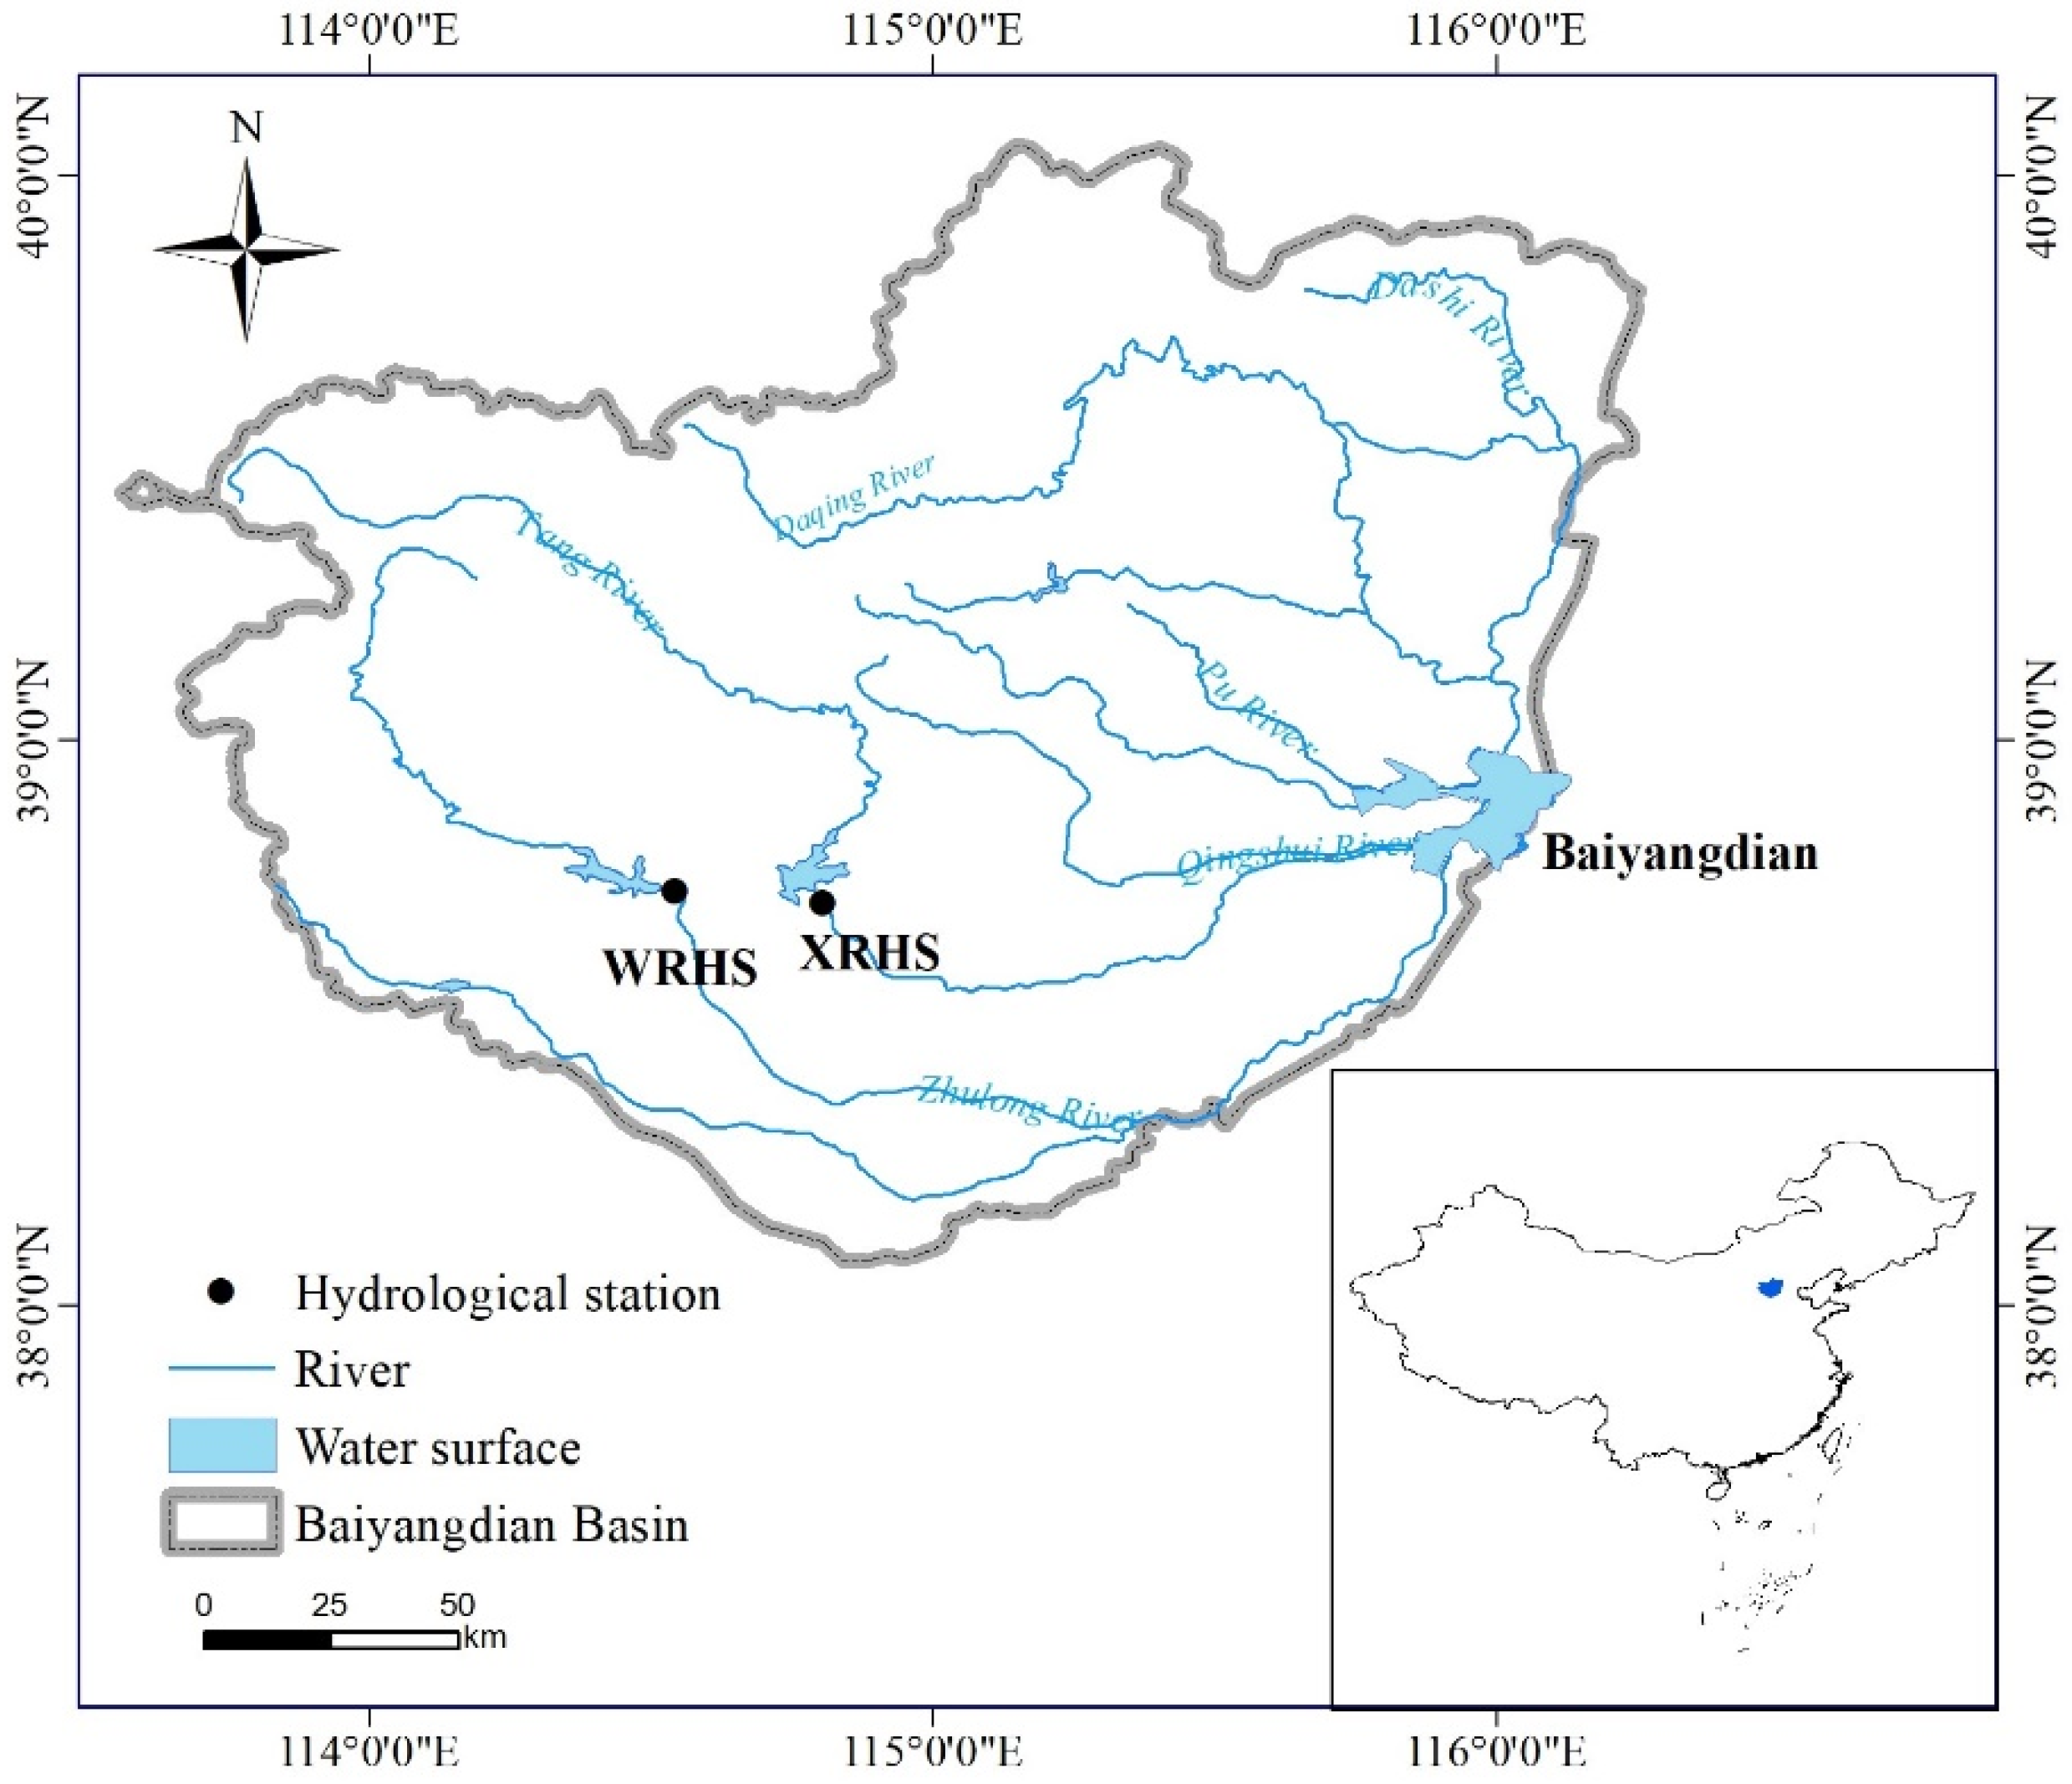
Lake Baiyangdian (113°39′ E~116°12′ E, 38°3′ N~40°4′ N) is located in the hinterland of Beijing, Tianjin, and Baoding, being one of the largest freshwater lakes in the North China Plain (Figure 1).
The basic data included the daily precipitation, runoff, and water levels from 1956 to 2010. Although the last year was 2010 (not extending to the present), the length of the basic data exceeded 55 years. The precipitation data were sourced from the China Meteorological Data Service Centre (http://data.cma.cn/ (accessed on 15 October 2021)). Lake Baiyangdian changed from a natural lake to an artificially regulated lake in 1960s. The Xidayang and Wangkuai Reservoirs have carried out most of the ecological water replenishment for Lake Baiyangdian. Considering the Xidayang Reservoir and Wangkuai Reservoir hydrological stations, which are respectively located on the Tang River and the Sha River in the upper reaches of the Baiyangdian Basin (Figure 1), have high representativeness, we adopted the runoff data of these two hydrological stations. The water level data for Lake Baiyangdian were provided by the Daqinghe Management Office.
Based on the precipitation, runoff, and water level data, the standardized precipitation index (SPI) for the Baiyangdian Basin, the standardized runoff index for the Xidayang Reservoir and Wangkuai Reservoir hydrological stations (SRIXi and SRIWang, respectively), and the standardized water level index (SWI) for Lake Baiyangdian at different timescales (1–12 months) were calculated.
2.2. Evaluation of Drought
The SPI, SRI, and SWI were used here to quantify meteorological droughts and hydrological droughts for the river basin and the lake. The SPI, proposed by McKee et al. [17], is a commonly used meteorological drought index, for which gamma distribution is generally adopted to fit its precipitation time series. The SRI and SWI were proposed by referring to the concept of SPI, and their calculation processes are similar to that of SPI: the precipitation time series is simply replaced by the runoff and water level time series, respectively. Due to climate change, human activities, and other factors, the distribution functions of flow and water level time series inevitably tend to vary from region to region [34]. In this paper, six widely used probability distributions in drought analysis—normal (Gaussian) distribution, log-normal distribution, exponential distribution, Poisson distribution, gamma distribution, and Weibull distribution—were used to model the distribution functions of the above three indices. The maximum likelihood function and the linear moment method were used for parameter estimation.
The Kolmogorov–Smirnov (KS) test was applied to examine whether the sample data conformed to a given theoretical distribution function based on the cumulative probability distribution function. The KS test is a sensitive and widely used mathematical method to test the goodness-of-fit of distributions.
Drought index values were assigned to one of five grades, as shown in Table 1. When a given drought index (SPI, SRI, or SWI) has a value less than −0.5, drought is considered to have occurred, and the smaller the value, the greater the drought intensity is. Here, we focused on the slight and higher grades of drought (i.e., SPI/SRI/SWI < −0.5).
2.3. Recognition of Drought Events and Analysis of Drought Characteristics
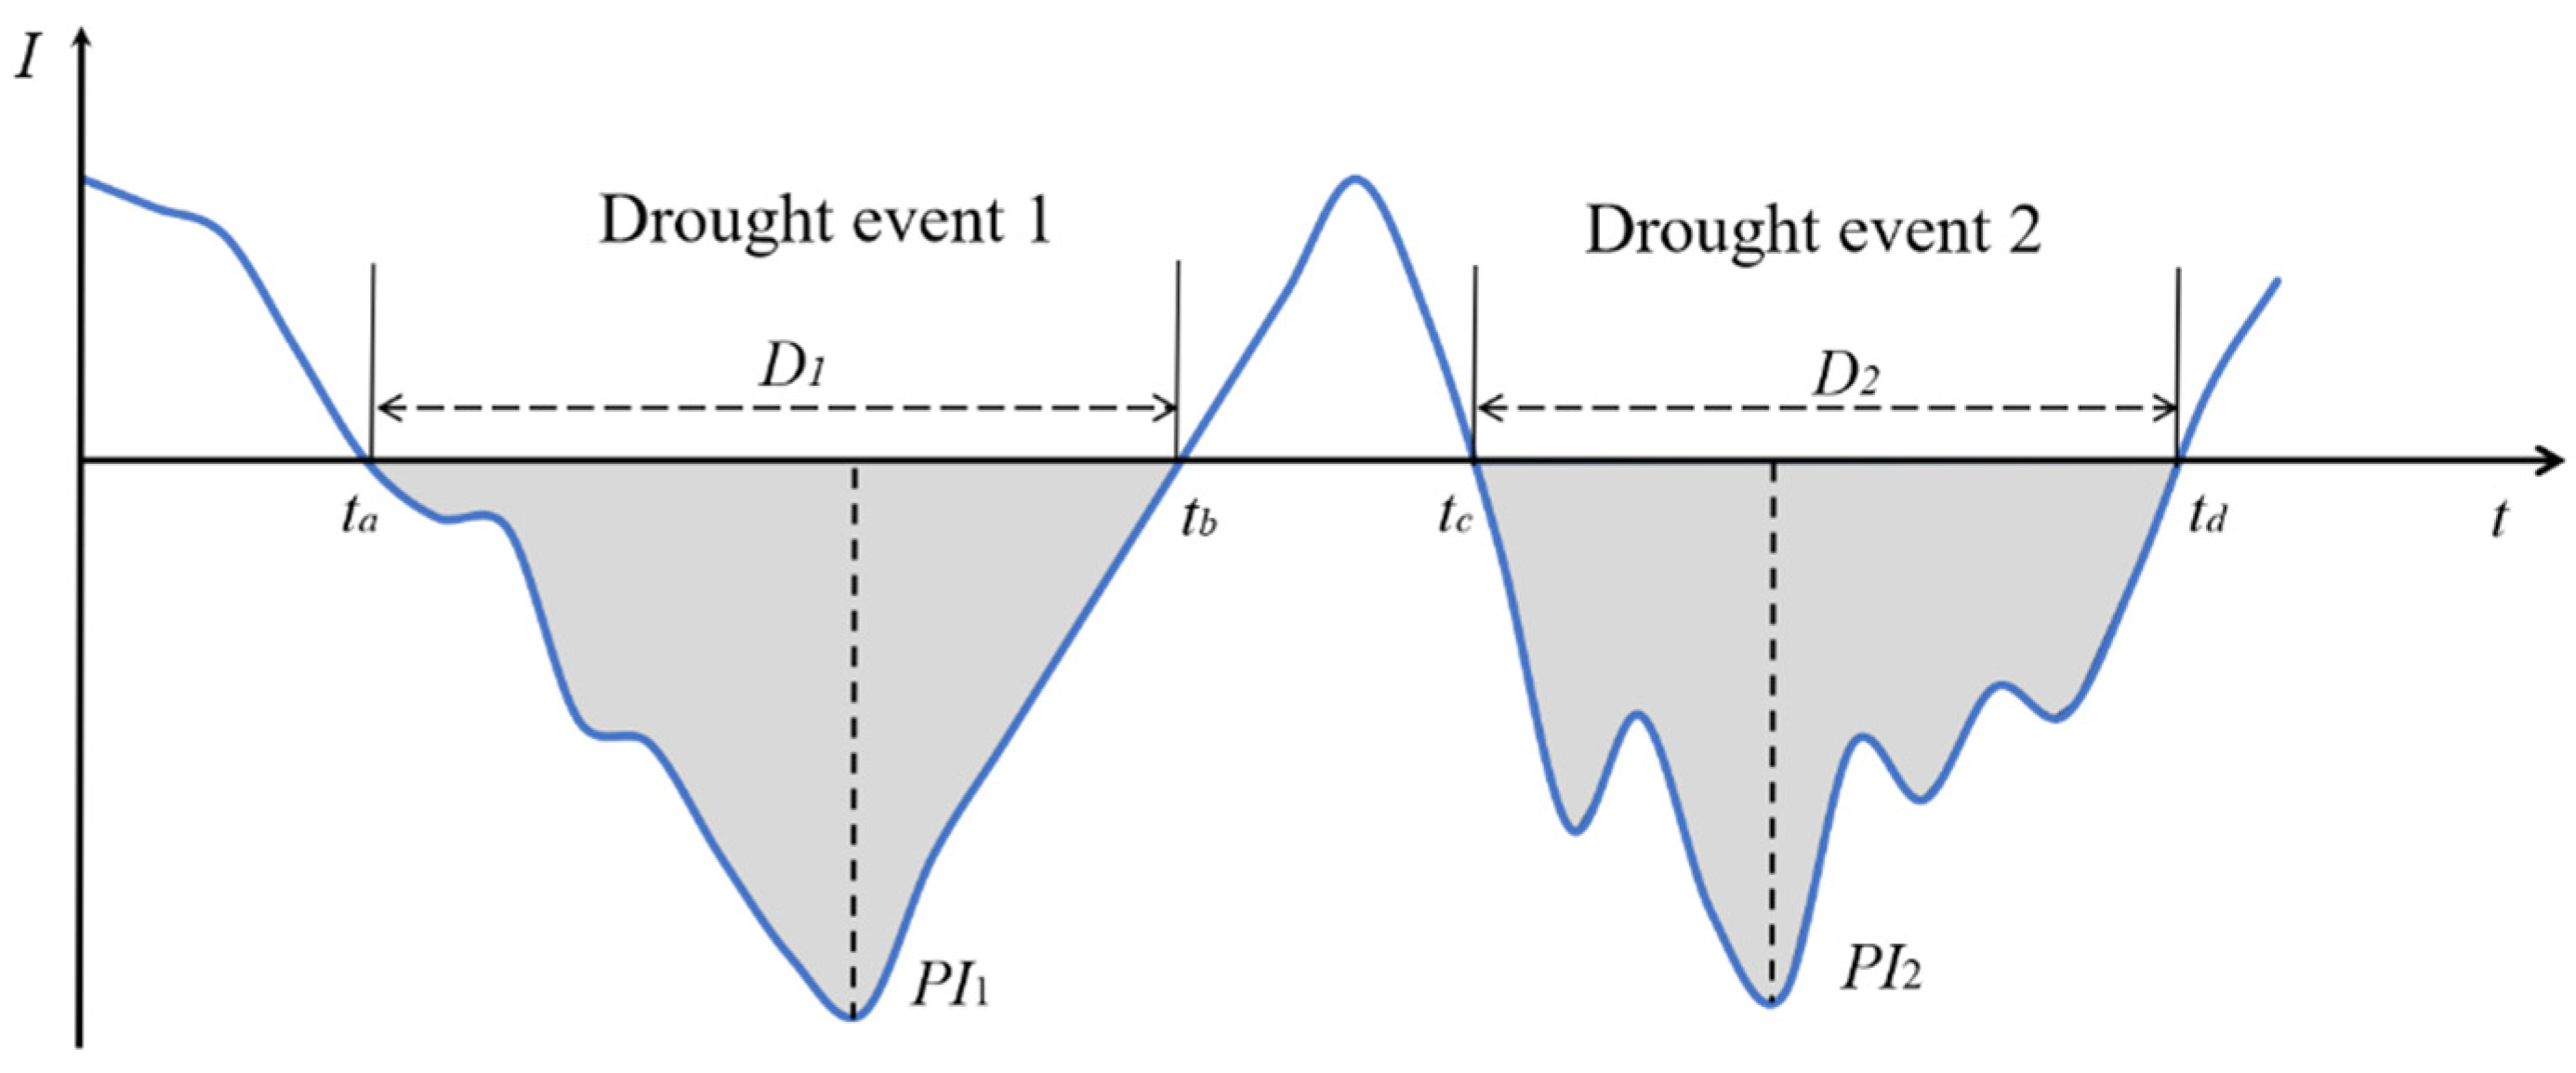
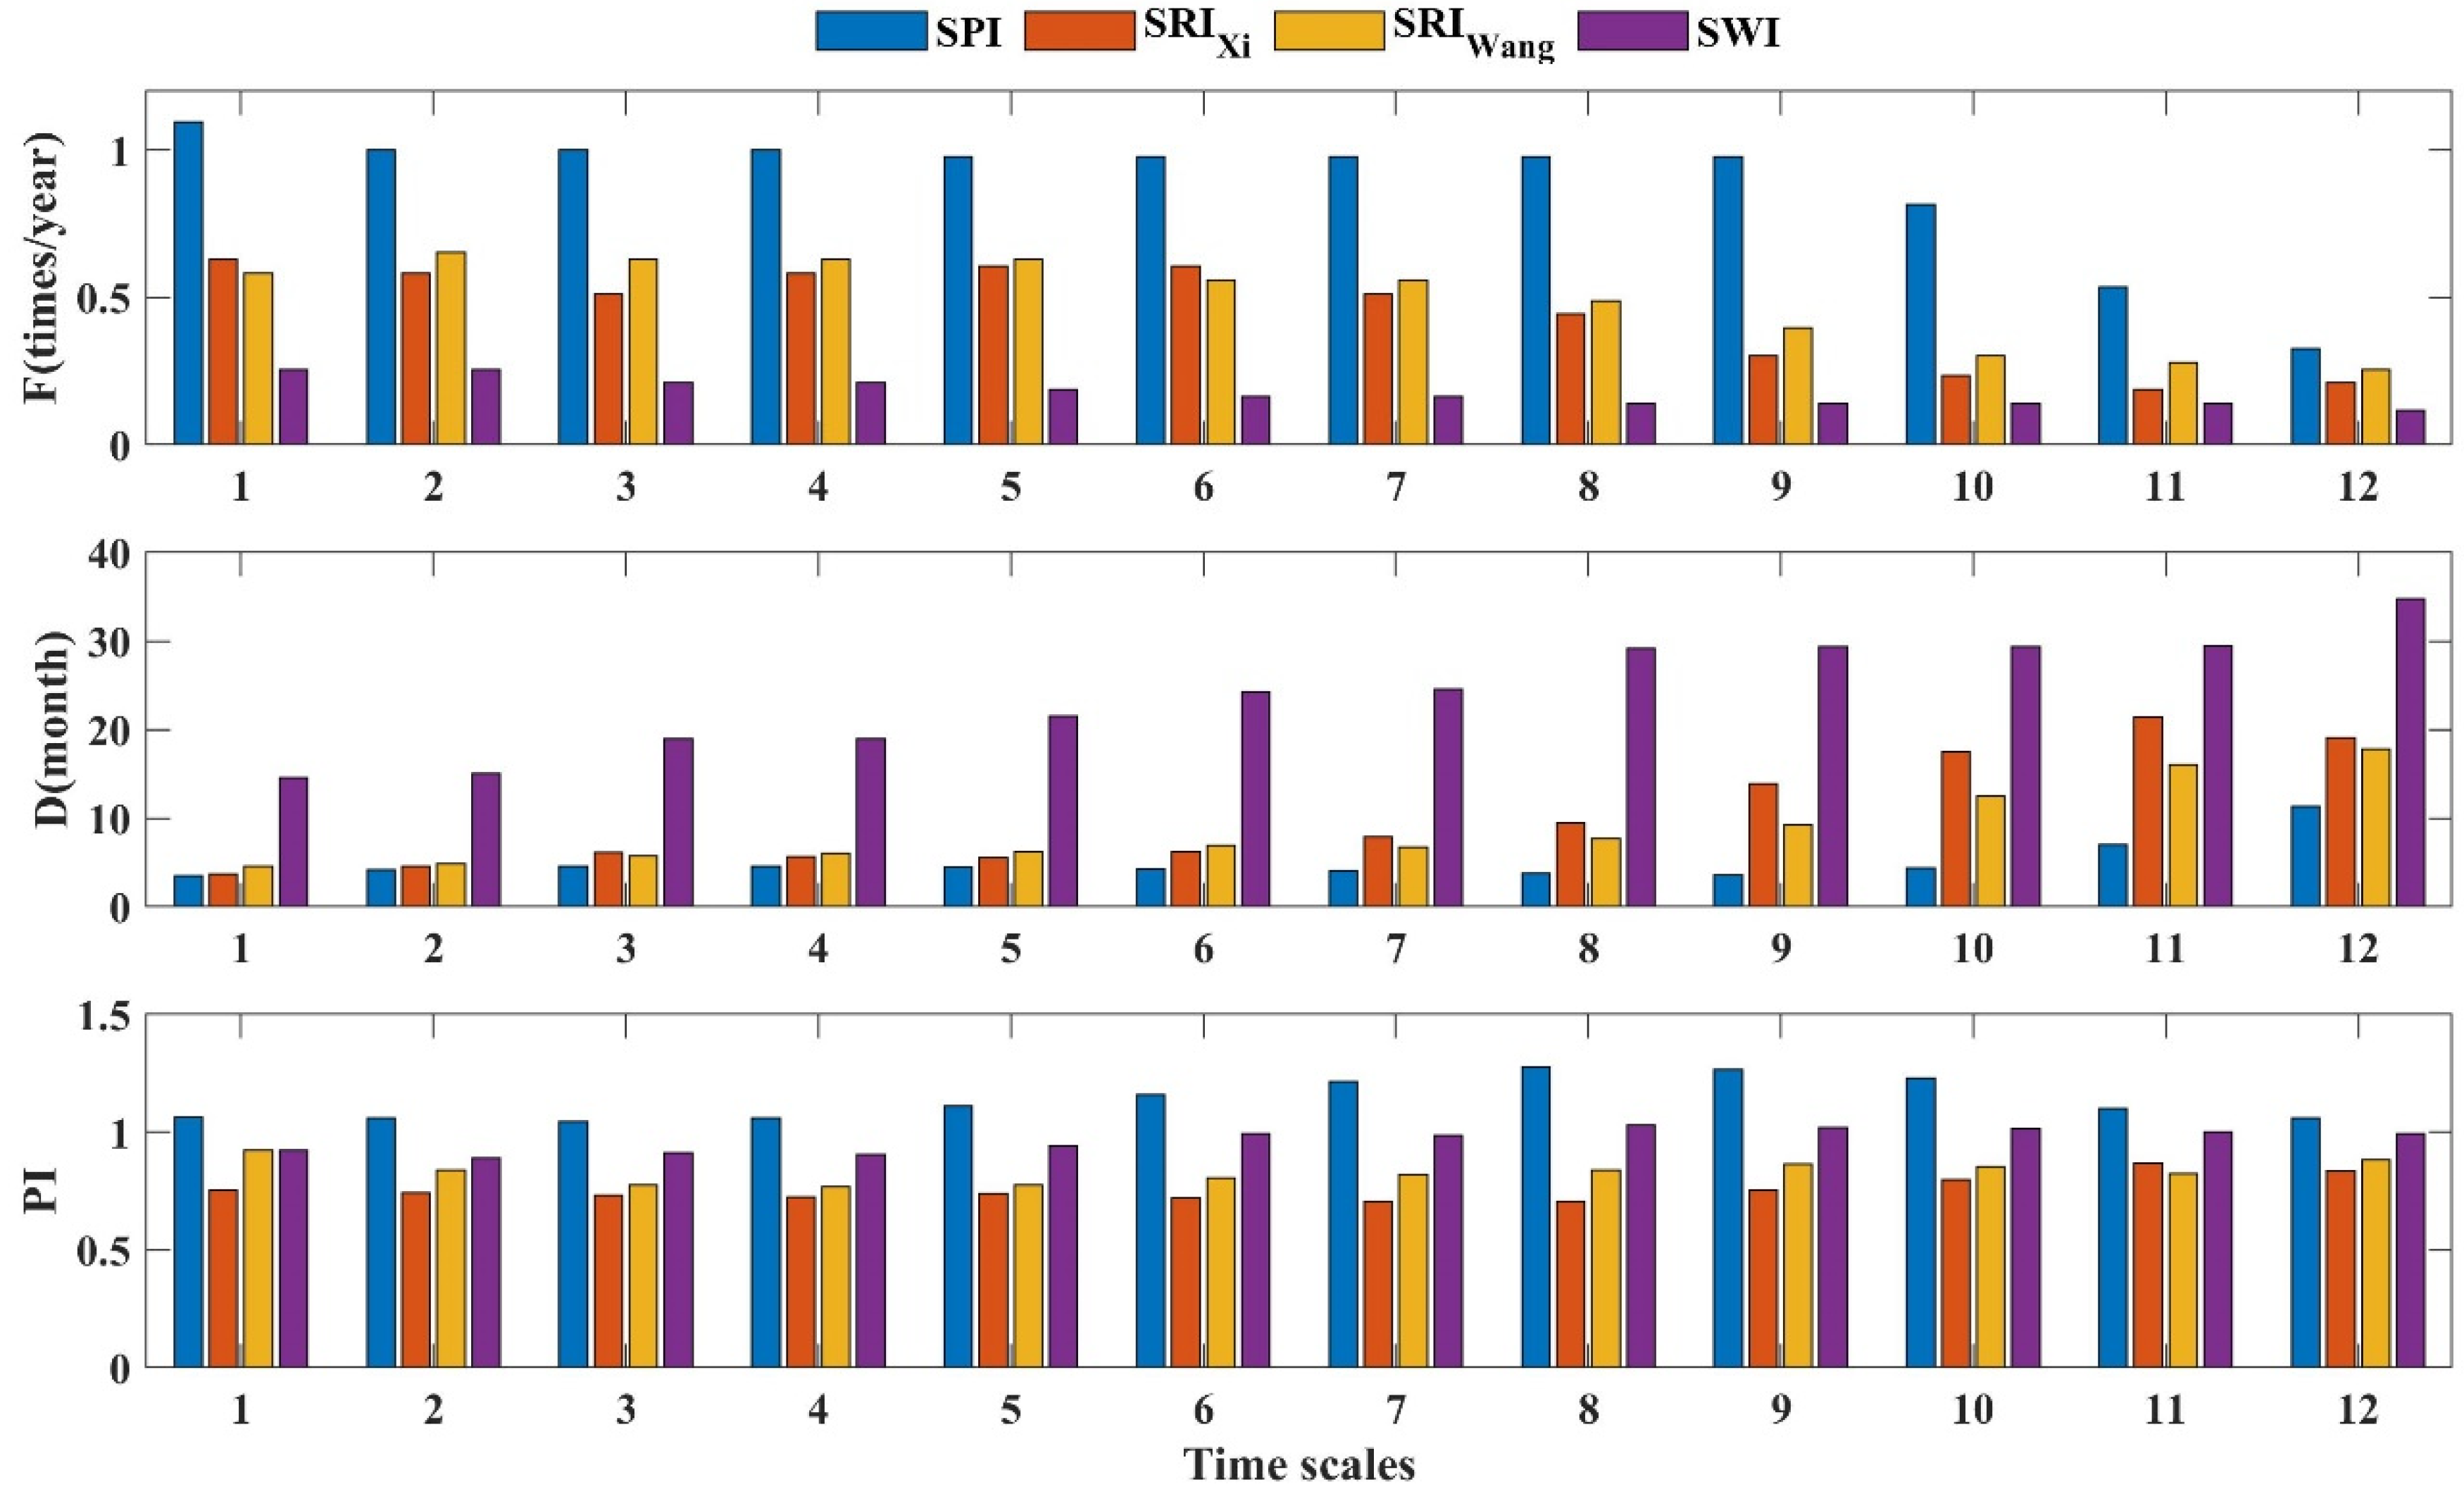
According to the SPI, SRI, and SWI, drought events can be identified by the run theory, a widely used method to analyze time series and capture drought events [35]. Three parameters are used to convey drought characteristics: (1) duration (D), defined as the length of time from the beginning to the end of a drought event; (2) peak intensity (PI), defined as the maximum absolute value of the drought index during one drought event; and (3) frequency (F), corresponding to the average number of drought events over a defined temporal period [36,37]. Figure 2 shows the illustration of drought events and their characteristics.
2.4. Drought Propagation Time Based on Time-Lag Cross-Correlation Analysis
Hydrological drought is hysteretic to meteorological drought and arises from the temporal accumulation of meteorological drought effects. Accordingly, drought propagation time from meteorological to hydrological drought can be assessed using linkages between the SPI, SRI, and SWI. The timescale of SPI-n (or SRI-n) has the highest correlation with SRI-1 (SWI-1); hence, it may be regarded as the most suitable for inferring drought propagation time [18,19,22]. For this, temporal correlations between the multi-timescale SPI-n (or SRI-n) and SRI-1 (or SWI-1) were evaluated using the Pearson r coefficient.
2.5. Mann–Kendall Test Method
The Mann–Kendall (MK) test is a widely used method to conduct trend analyses and identify the change point in sequences of hydrological data. It is a nonparametric statistical technique which can effectively detect the variation in trends of meteorological and hydrological time series [38,39]. It has the advantage of strong anti-interference ability vis-à-vis outliers. For a given time sequence xi (i = 1, 2, …, n), the statistical variable S is defined as follows:
where xj, xk are the respective sample values for years i and j and j > k.
To detect the change points of a time sequence xi (i = 1, 2, …, n), we first constructed column mi that represents the sample cumulative number of xi > xj (1 ≤ j ≤ i):
The mean value and variance of dk are given as follows:
The statistic UF can then be estimated as follows:
The MK test uses a bilateral trend test to statistically analyze the sequence curve. For a given significance level, when |UF| > UF1−α/2, the variable x has a significant trend at the significance level of α; conversely, when |UF| ≤ UF1−α/2, the trend of the variable x is not significant. When UF > 0, the variable x displays an upward trend, and, accordingly, when UF < 0, the variable x, instead, has a downward trend. If the sequence curve features an intersection point with the critical line, the year of that intersection point corresponds to the start of change time. The significance level (alpha, α) was set to 0.05 in this study.
3. Results
3.1. Simulation and Validation of Probability Distributions for the SRI and SWI
We examined the most appropriate runoff and water level distribution functions for each month (1–12) by comparing them to the empirically measured data. Six distribution patterns of runoff and water level were obtained from the KS tests. Table 2 shows these results for nonparametric hypothesis testing at the significance level α = 0.05. The ‘+’ indicates acceptance of the hypothesis, that is, the sample conforms to the corresponding model, and vice versa for the “−” symbol. Evidently, all of the gamma and Weibull distributions had the “+” results, which indicates these two distributions passed the test. At the same time, the normal (Gaussian), exponential, and Poisson distributions did not pass the test.
Table 3 represents all the goodness-of-fit values for the Xidayang Reservoir runoff data, the Wangkuai Reservoir runoff data, and the water level of Lake Baiyangdian. Because the Xidayang Reservoir runoff in March and April could only be described by the Weibull distribution, this was applied to that reservoir’s entire dataset.
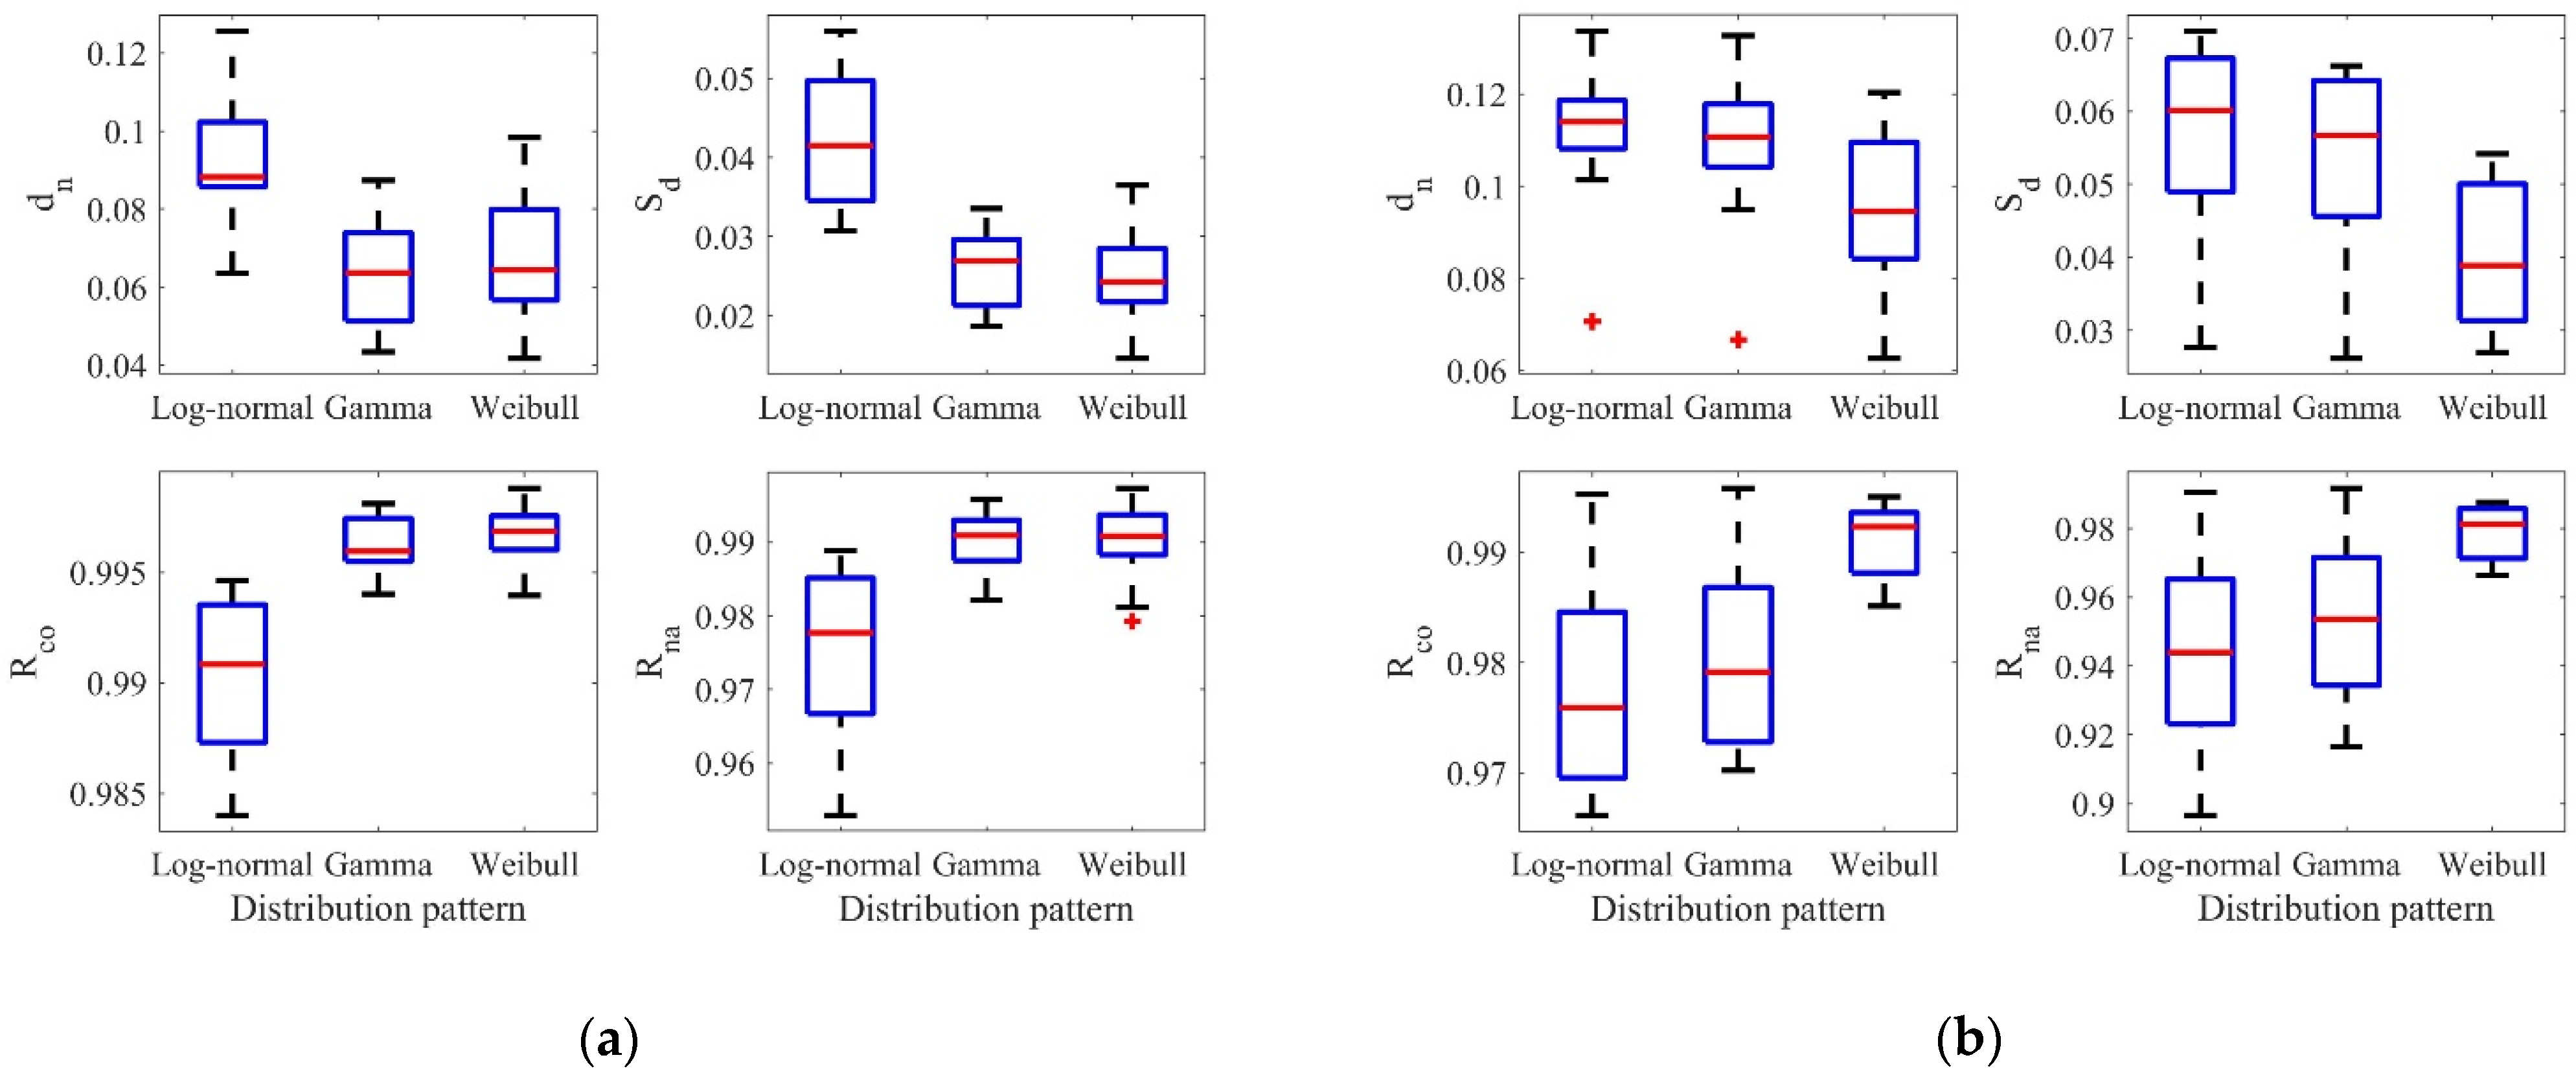
Figure 3 shows the goodness-of-fit for the log-normal, gamma, and Weibull distributions, which passed the KS testing. dn denotes the maximum distance between the cumulative empirical and theoretical distributions of the sample data (i.e., runoff amounts and water levels). dna denotes the acceptance threshold under significance level a = 0.05; hence, it can be written as , where N is the number of samples. If the obtained dn value is < dna, the distribution pattern is deemed acceptable; otherwise, the distribution pattern is not acceptable. In this paper, dna was 0.2027. The standard deviation, Pearson correlation coefficient, and Nash coefficient were used here to assess the fit between the actual cumulative frequency and the theoretical cumulative frequency of a given sample. In comparing these fitting results (Figure 3), we found that both the Wangkuai Reservoir runoff and the water level of Lake Baiyangdian were best described by the Weibull distribution.
3.2. Analysis of Drought Indices and Drought Characteristics
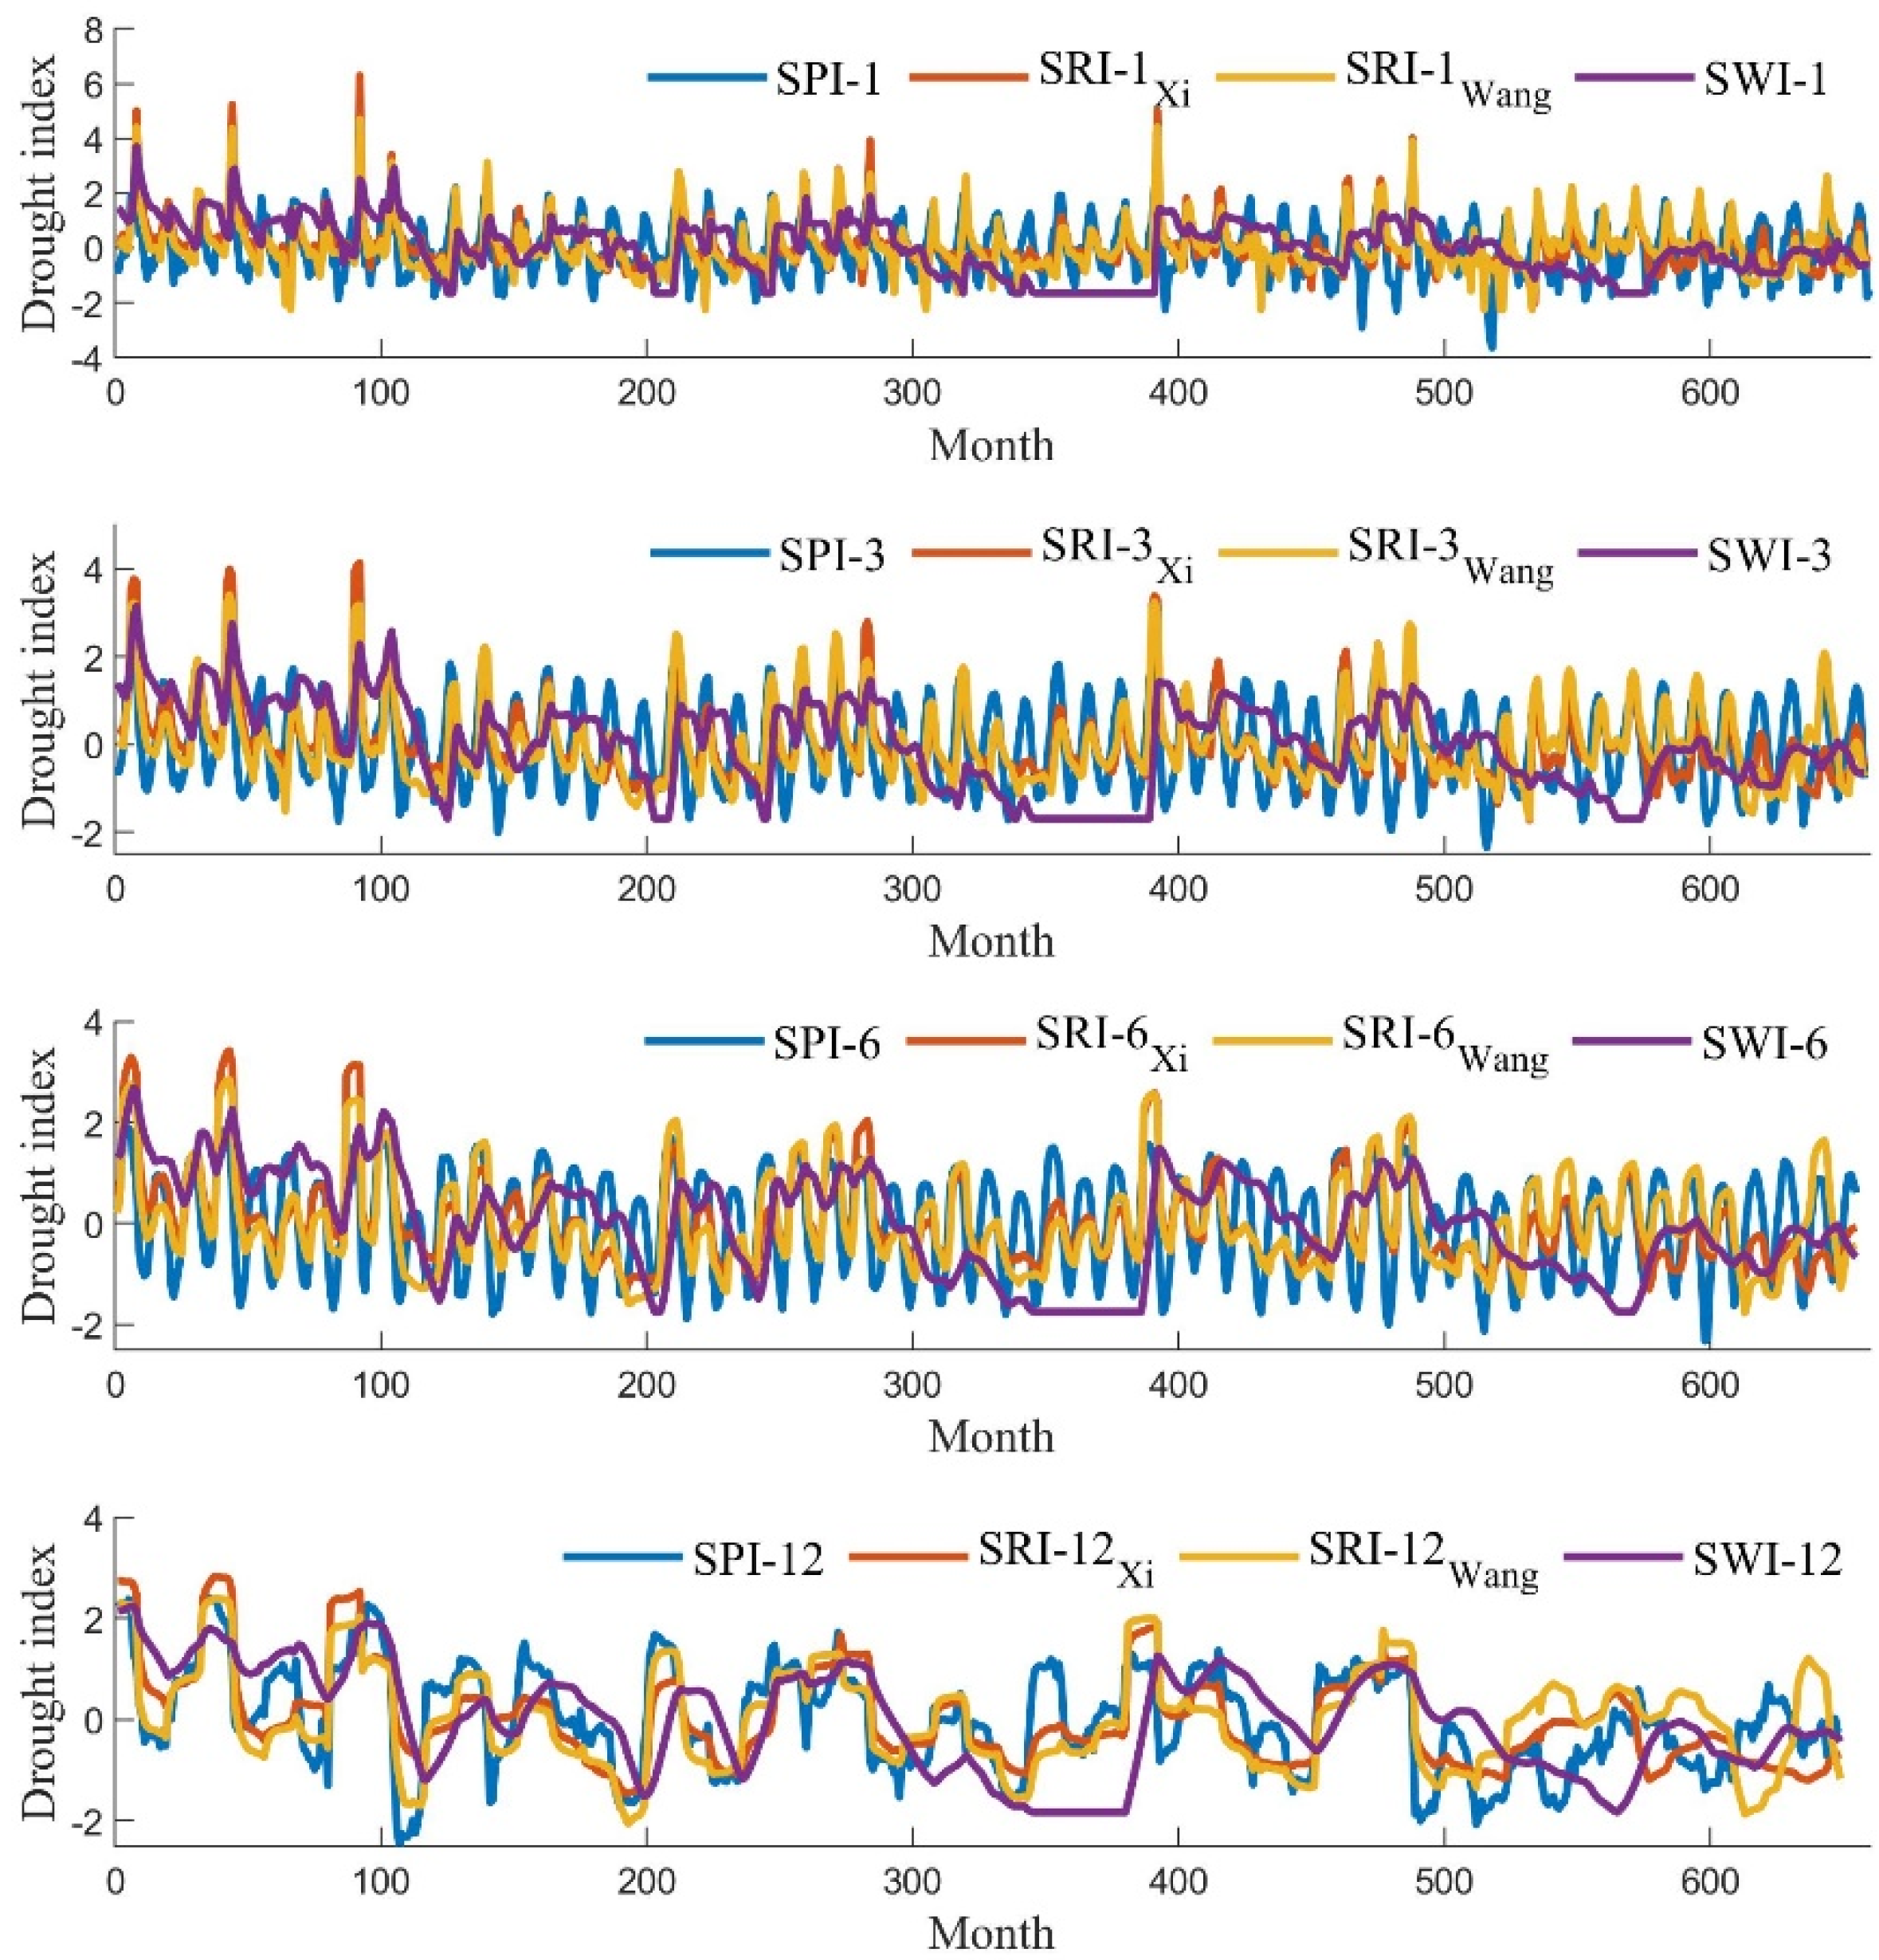
According to the best-fitting distribution functions for the precipitation, runoff, and water levels, the SPI, SRIXi, SRIWang, and SWI at different timescales (taking 1, 3, 6, and 12 months as examples) could be derived for 1956 through 2010, as shown in Figure 4. The two hydrological drought indices, SRIXi and SRIWang, had nearly the same trajectory despite differing timescales. The SPI, SRI, and SWI in general have different trajectories. Nevertheless, the longer the timescale, the smoother the drought index curve.
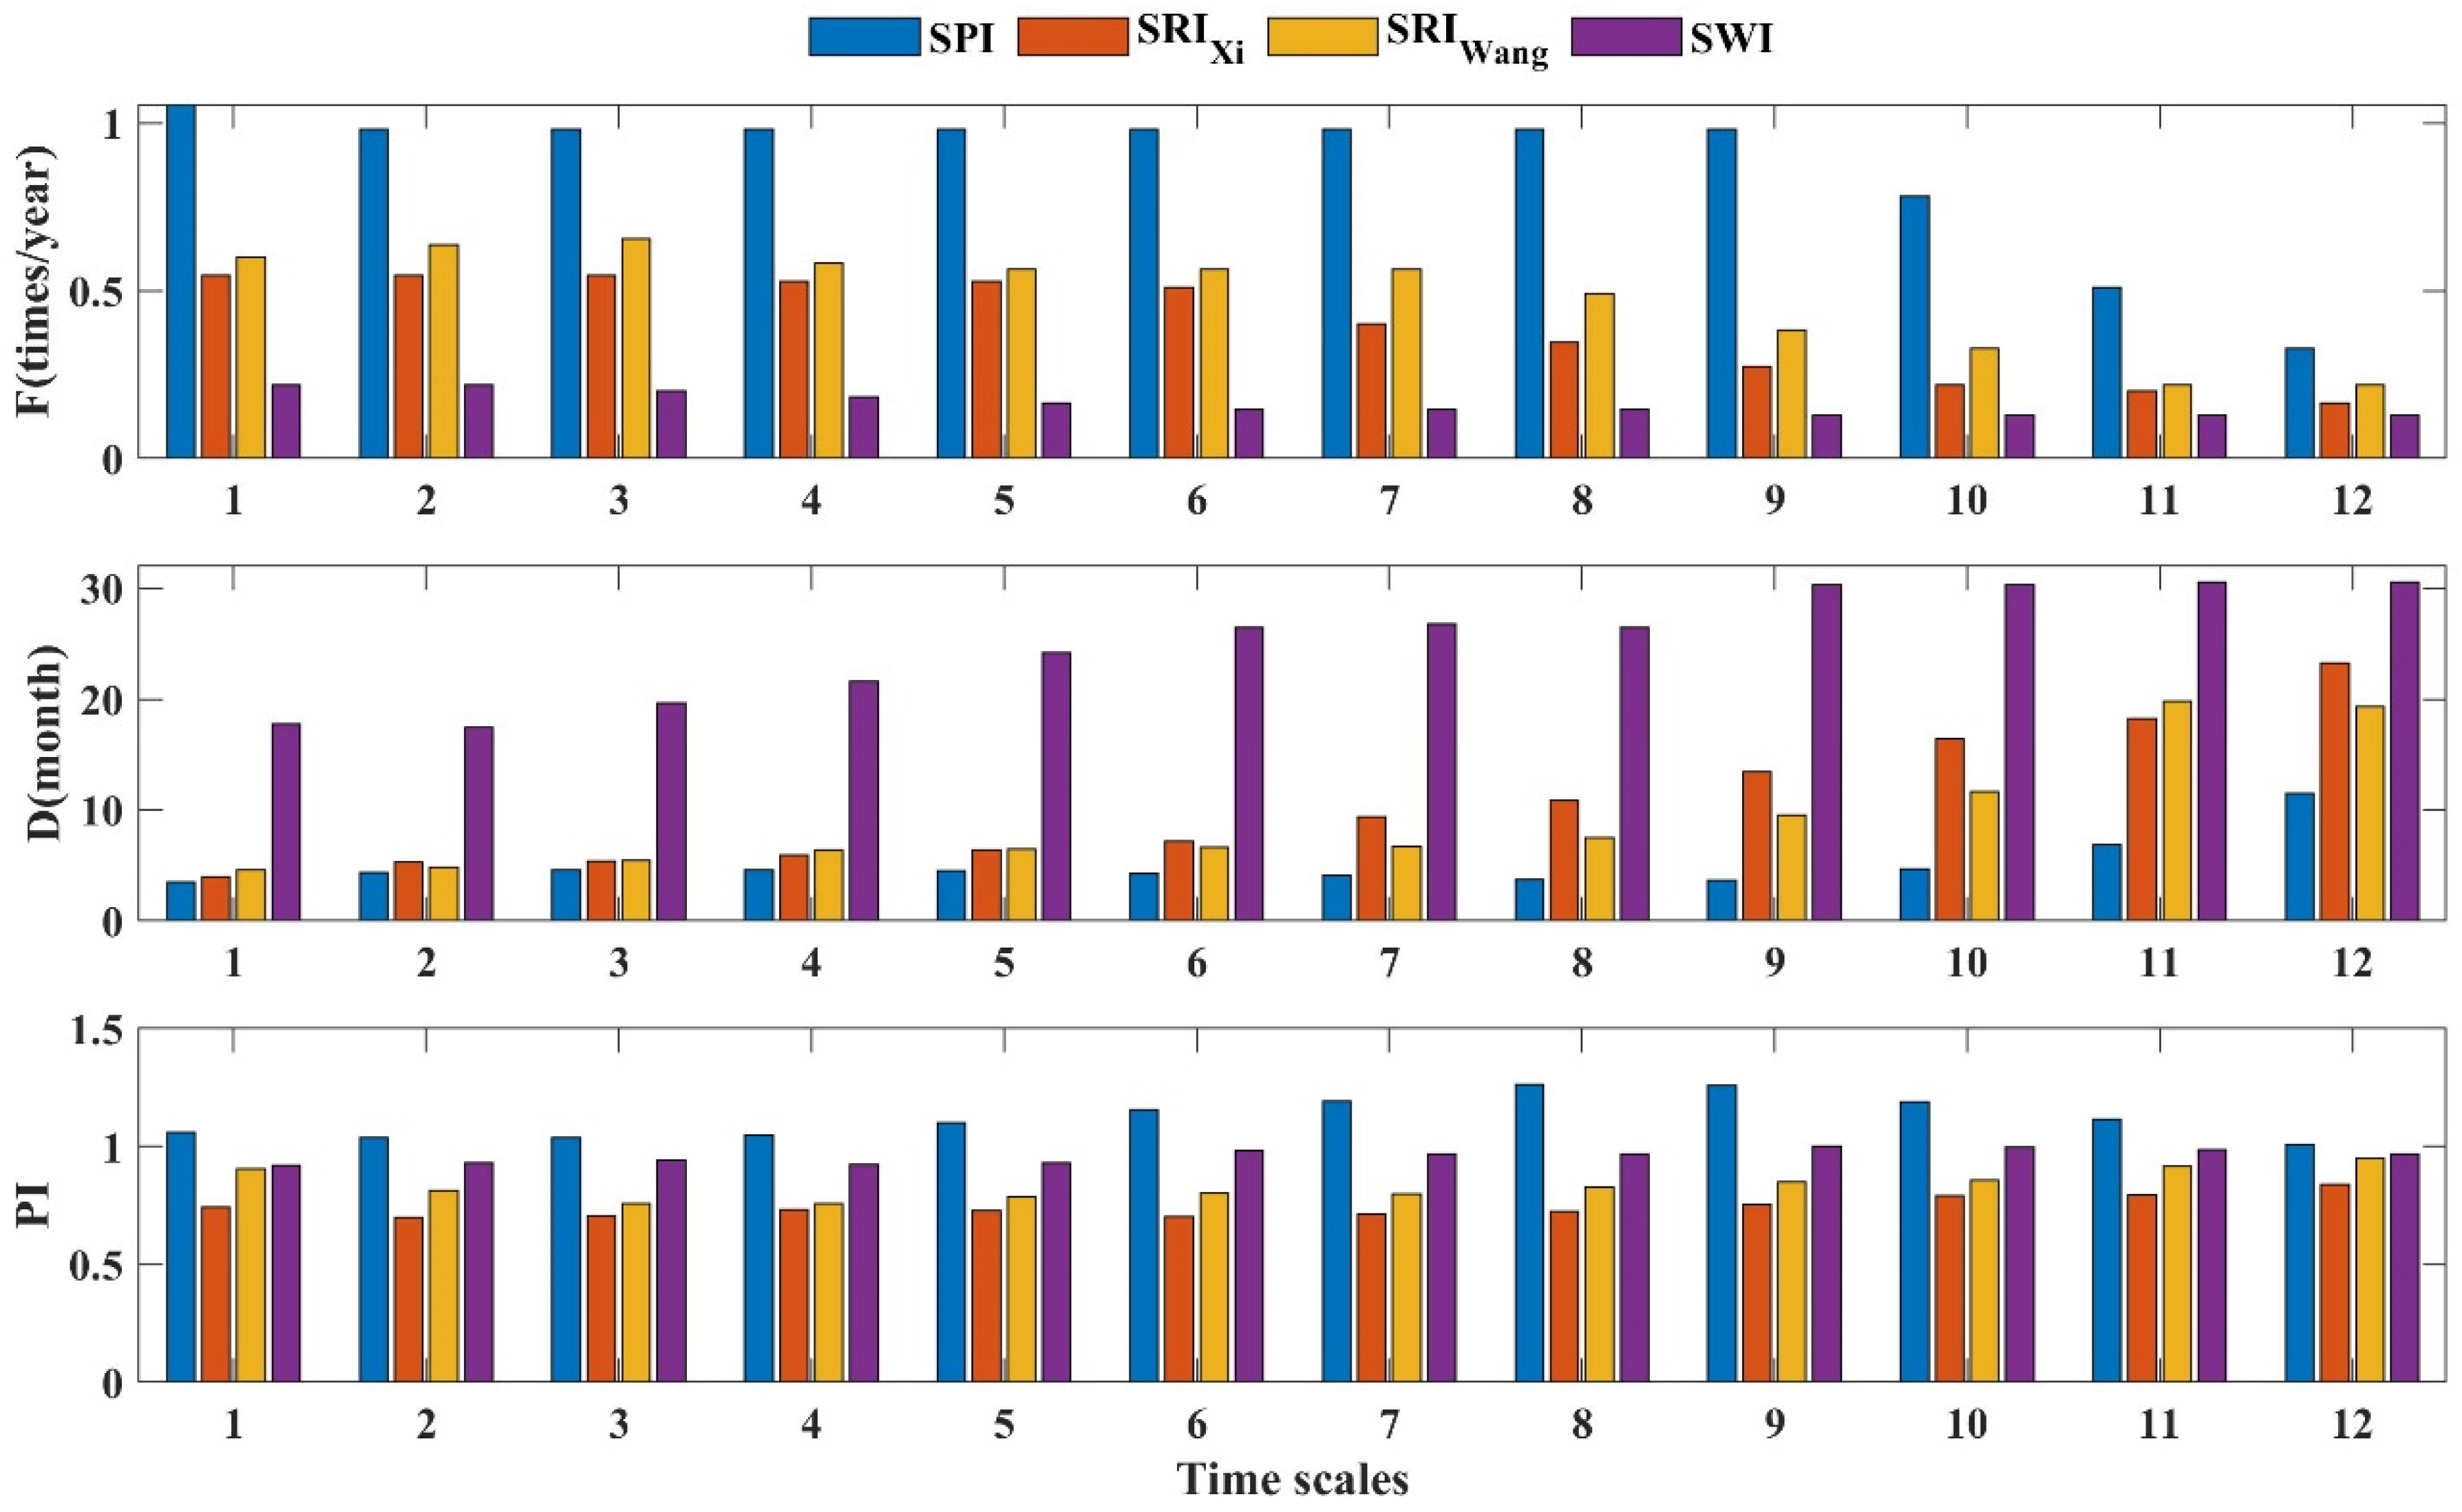
Next, the drought characteristics SPI, SRIXi, SRIWang, and SWI calculated for different timescales were analyzed and plotted (Figure 5).
On a 1-month timescale, the frequency of meteorological droughts from 1956 to 2010 in the Baiyangdian Basin was 1.05 times per year, with an average duration of 3.47 months and an average intensity of 1.06. A total of 58 meteorological droughts occurred in the basin, the most severe of which occurred from November 1998 to March 1999, lasting 5 months. At that time, the SPI-1 was −2.14, corresponding to an extreme drought event (as per Table 1).
The frequency of hydrological droughts for the Xidayang Reservoir hydrological station was 0.55 times per year, with an average duration of 4.00 months and an average intensity of 0.74. There was a total of 30 hydrological droughts in the historical period studied, and the most severe of them occurred from April to July in 1999. The duration of the most severe drought was 4 months, and the SRI-1 was −1.13, thus corresponding to a moderate drought event (Table 1).
The frequency of hydrological droughts for the Wangkuai Reservoir hydrological station was 0.60 times per year, with the duration and intensity of 4.61 months and 0.90 on average, respectively. A total of 33 hydrological droughts were distinguishable, of which the most pronounced lasted 3 months (from April to June) in 1961. The SRI-1 was −1.71, indicating a severe drought event (Table 1).
The frequency of lake hydrological drought was 0.22 times per year, averaging 17.75 months in duration, with an average intensity of 0.92. A total of 12 water-level droughts occurred in the historical period, the strongest of which lasted 70 months, from October 1982 to July 1988. The SWI-1 was −1.46, equivalent to a moderate drought (Table 1).
When compared across differing timescales, the frequency of the SPI, SRI, and SWI decreased with an increasing timescale, but the duration of all four drought indices lengthened.
Comparing the different drought indices, the frequency of the SPI was the greatest among them, being 1.5–3.5 times that of the SRI and 2.5–8 times that of the SWI. The frequency of the SWI (lake hydrological drought) was the lowest. However, the average duration of the SPI was the shortest whereas that of the SWI was the longest (SPI < SRIWang < SRIXi < SWI). The PI values of the SPI were the largest, and the PI values of the SPI and SWI were larger than those of the SRI. In addition, the frequency and PI values of the SRIXi were smaller than those of the SRIWang, but the duration values of the SRIXi exceeded those of the SRIWang.
Further comparing the hydrological droughts in the river basin and the lake, the frequency of the SRI was larger than that of the SWI, and the PI of the SWI was larger than that of the SRI. The duration of hydrological droughts in Lake Baiyangdian was much larger than that in the basin. Hydrological droughts in Lake Baiyangdian were more severe than that in the river basin. This demonstrates that the responses of water levels in the lake and runoffs in the river basin to droughts are different.
In general, meteorological droughts are characterized by high frequency and short duration, which indicates that not all meteorological drought events lead to a hydrological drought event. In stark contrast to that, lake hydrological drought is much less frequent but longer in duration and produces more grave consequences. On a different timescale, the degree of droughts affecting the area of the Wangkuai Reservoir hydrological station surpasses that of the Xidayang Reservoir hydrological station.
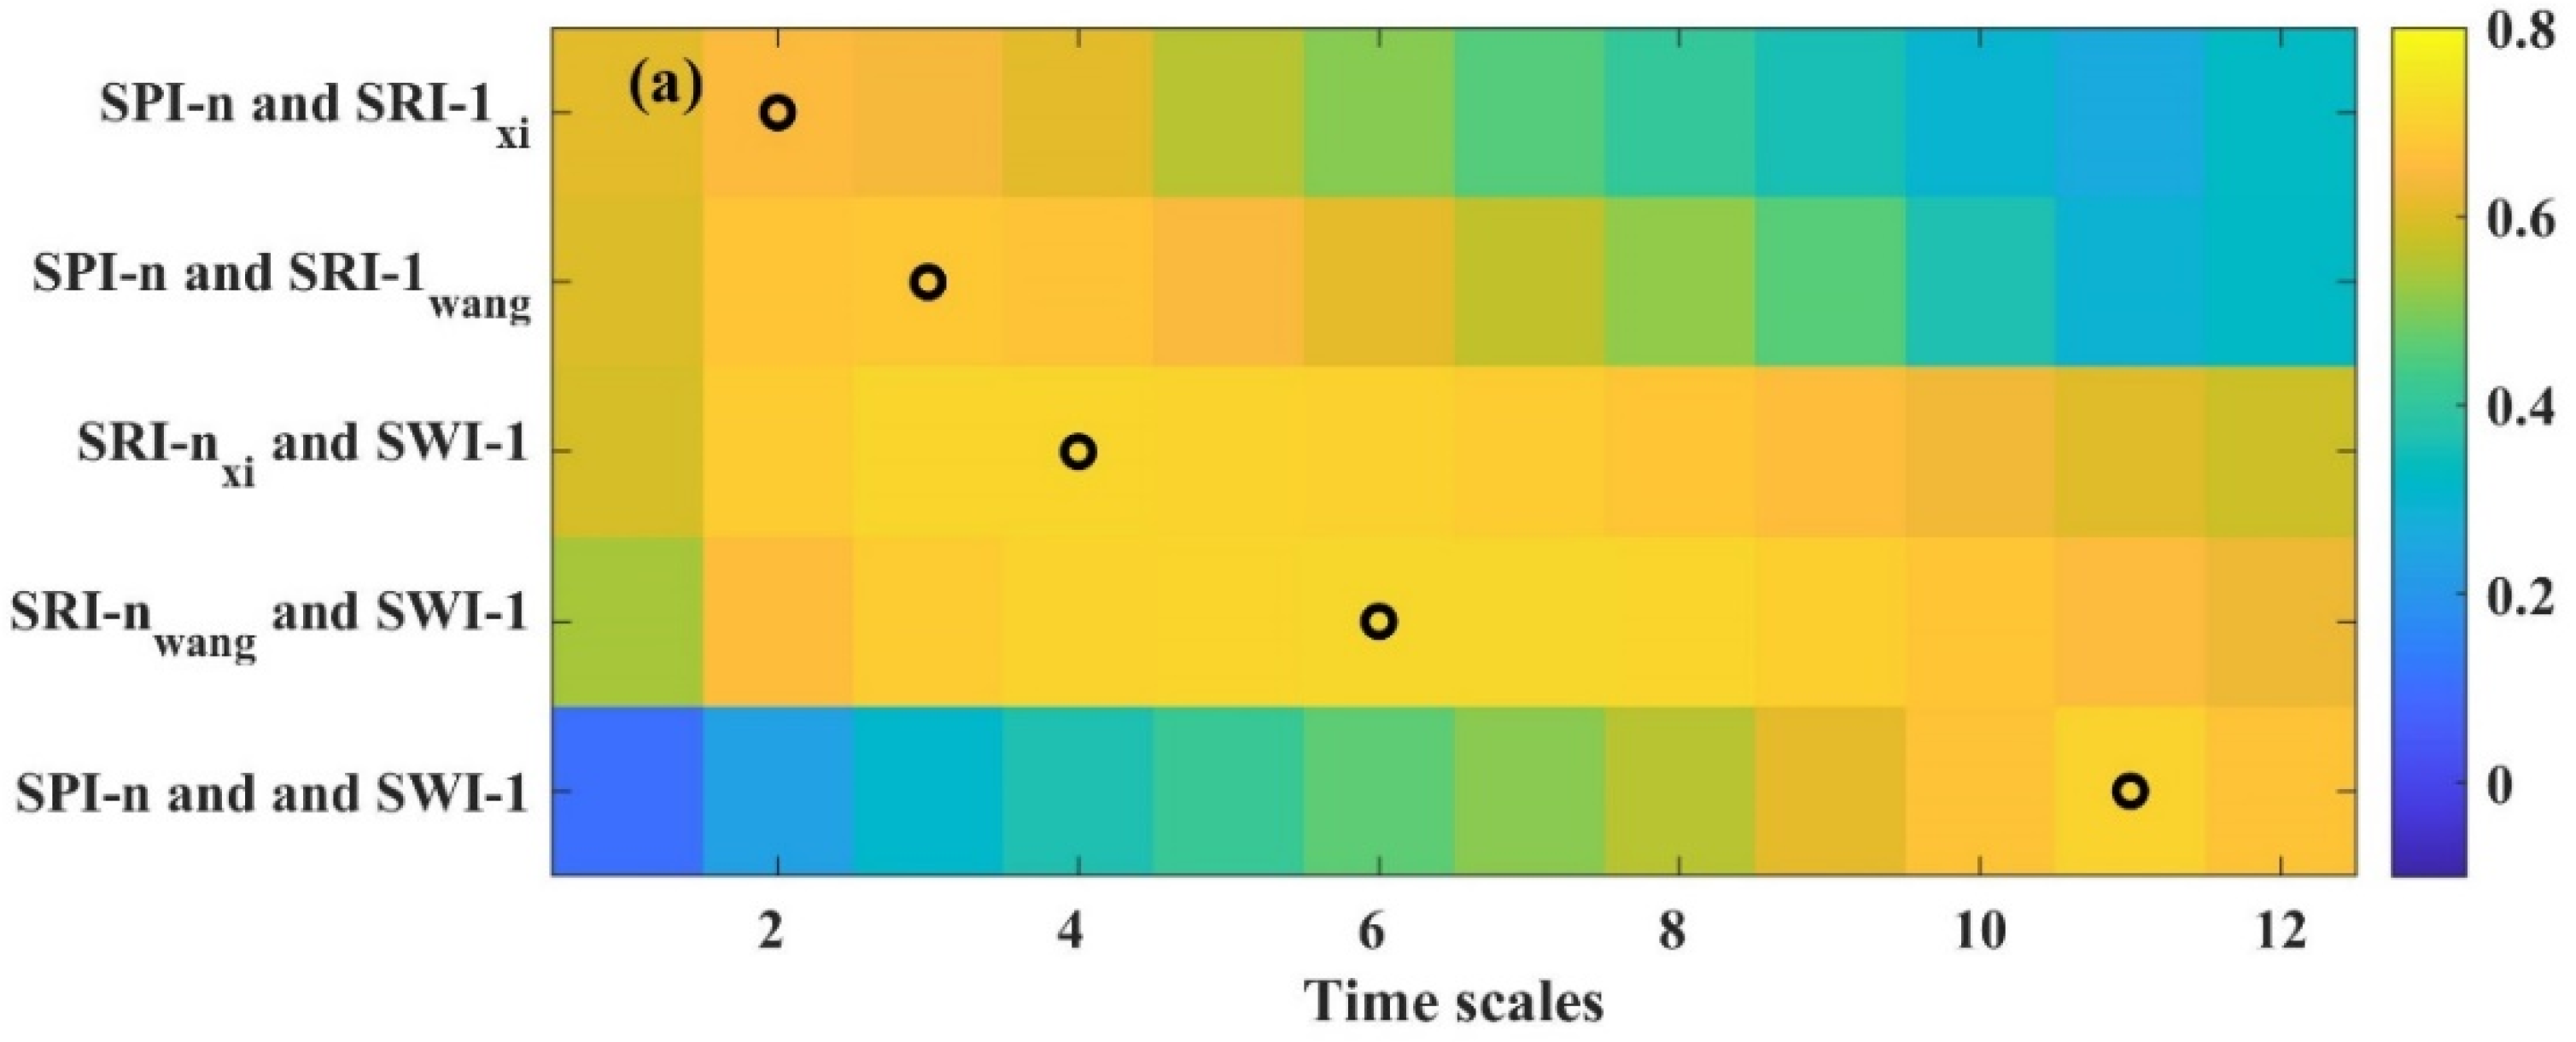
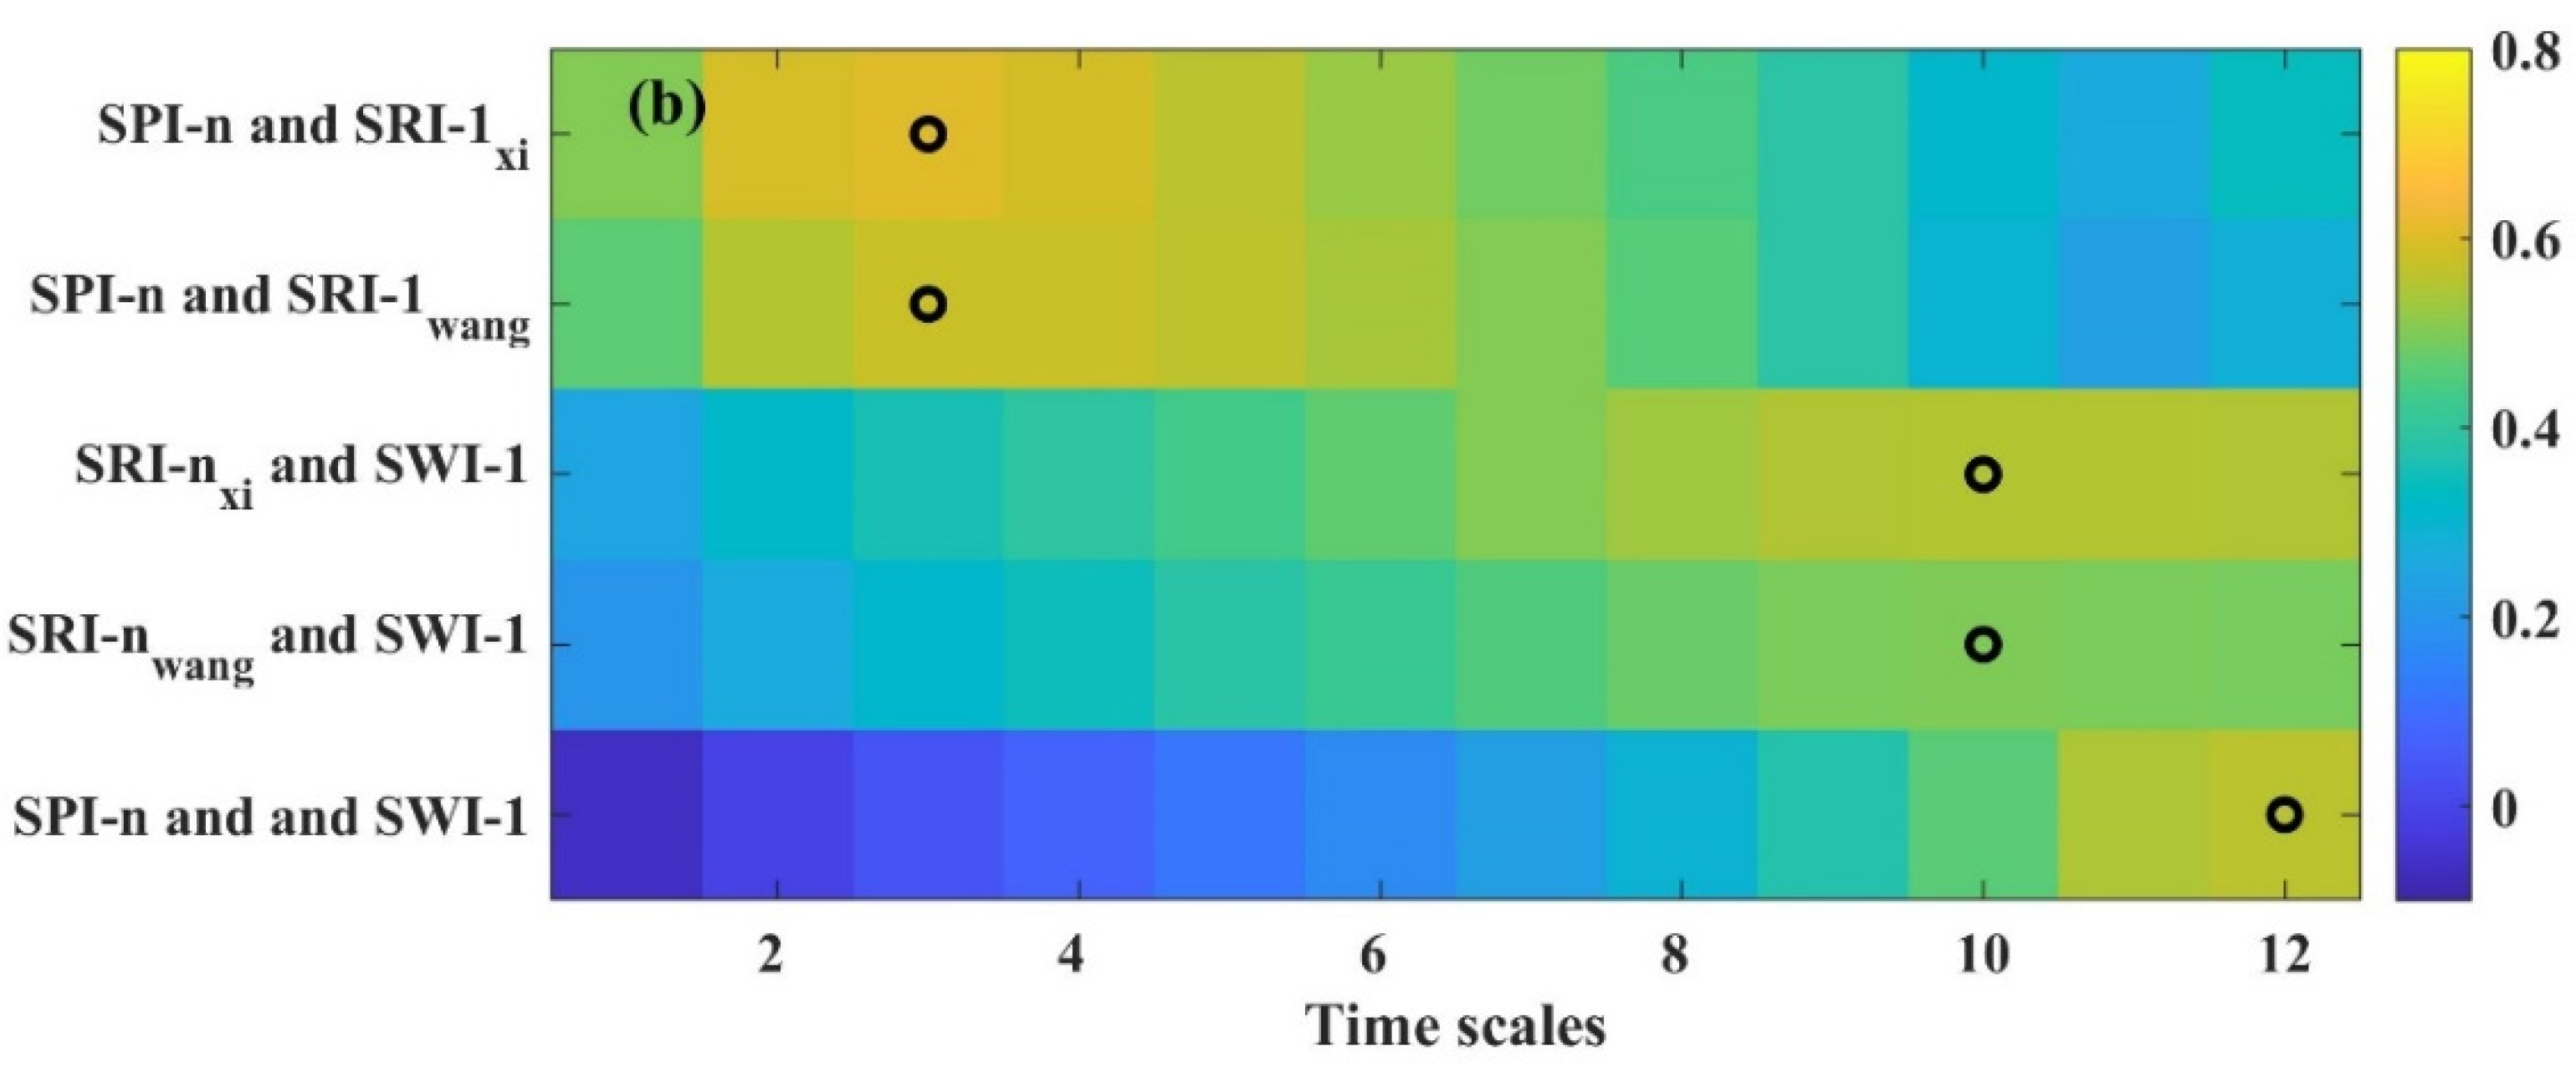
3.3. Drought Propagation: Going from Meteorological to Hydrological Drought
Table 4 presents the Pearson correlations between the multi-timescale SPI-n and SRI-1xi, SPI-n and SRI-1wang, SRI-nxi and SWI-1, SRI-nwang and SWI-1, and SPI-n and SWI-1. As mentioned above, the largest correlation coefficients can be used to infer the most suitable propagation time from meteorological drought to hydrological drought. The propagation time was 3 months for a meteorological drought (SPI) to become a hydrological drought for the basin (SRIxi and SRIwang), but the latter took much longer, from 9 to 10 months, to propagate into Lake Baiyangdian (SWI). The propagation time from meteorological drought (SPI) to hydrological drought for Lake Baiyangdian (SWI) was 12 months. Altogether, these results indicated that it takes more time for meteorological drought’s propagation to the lake than basin hydrological drought events.
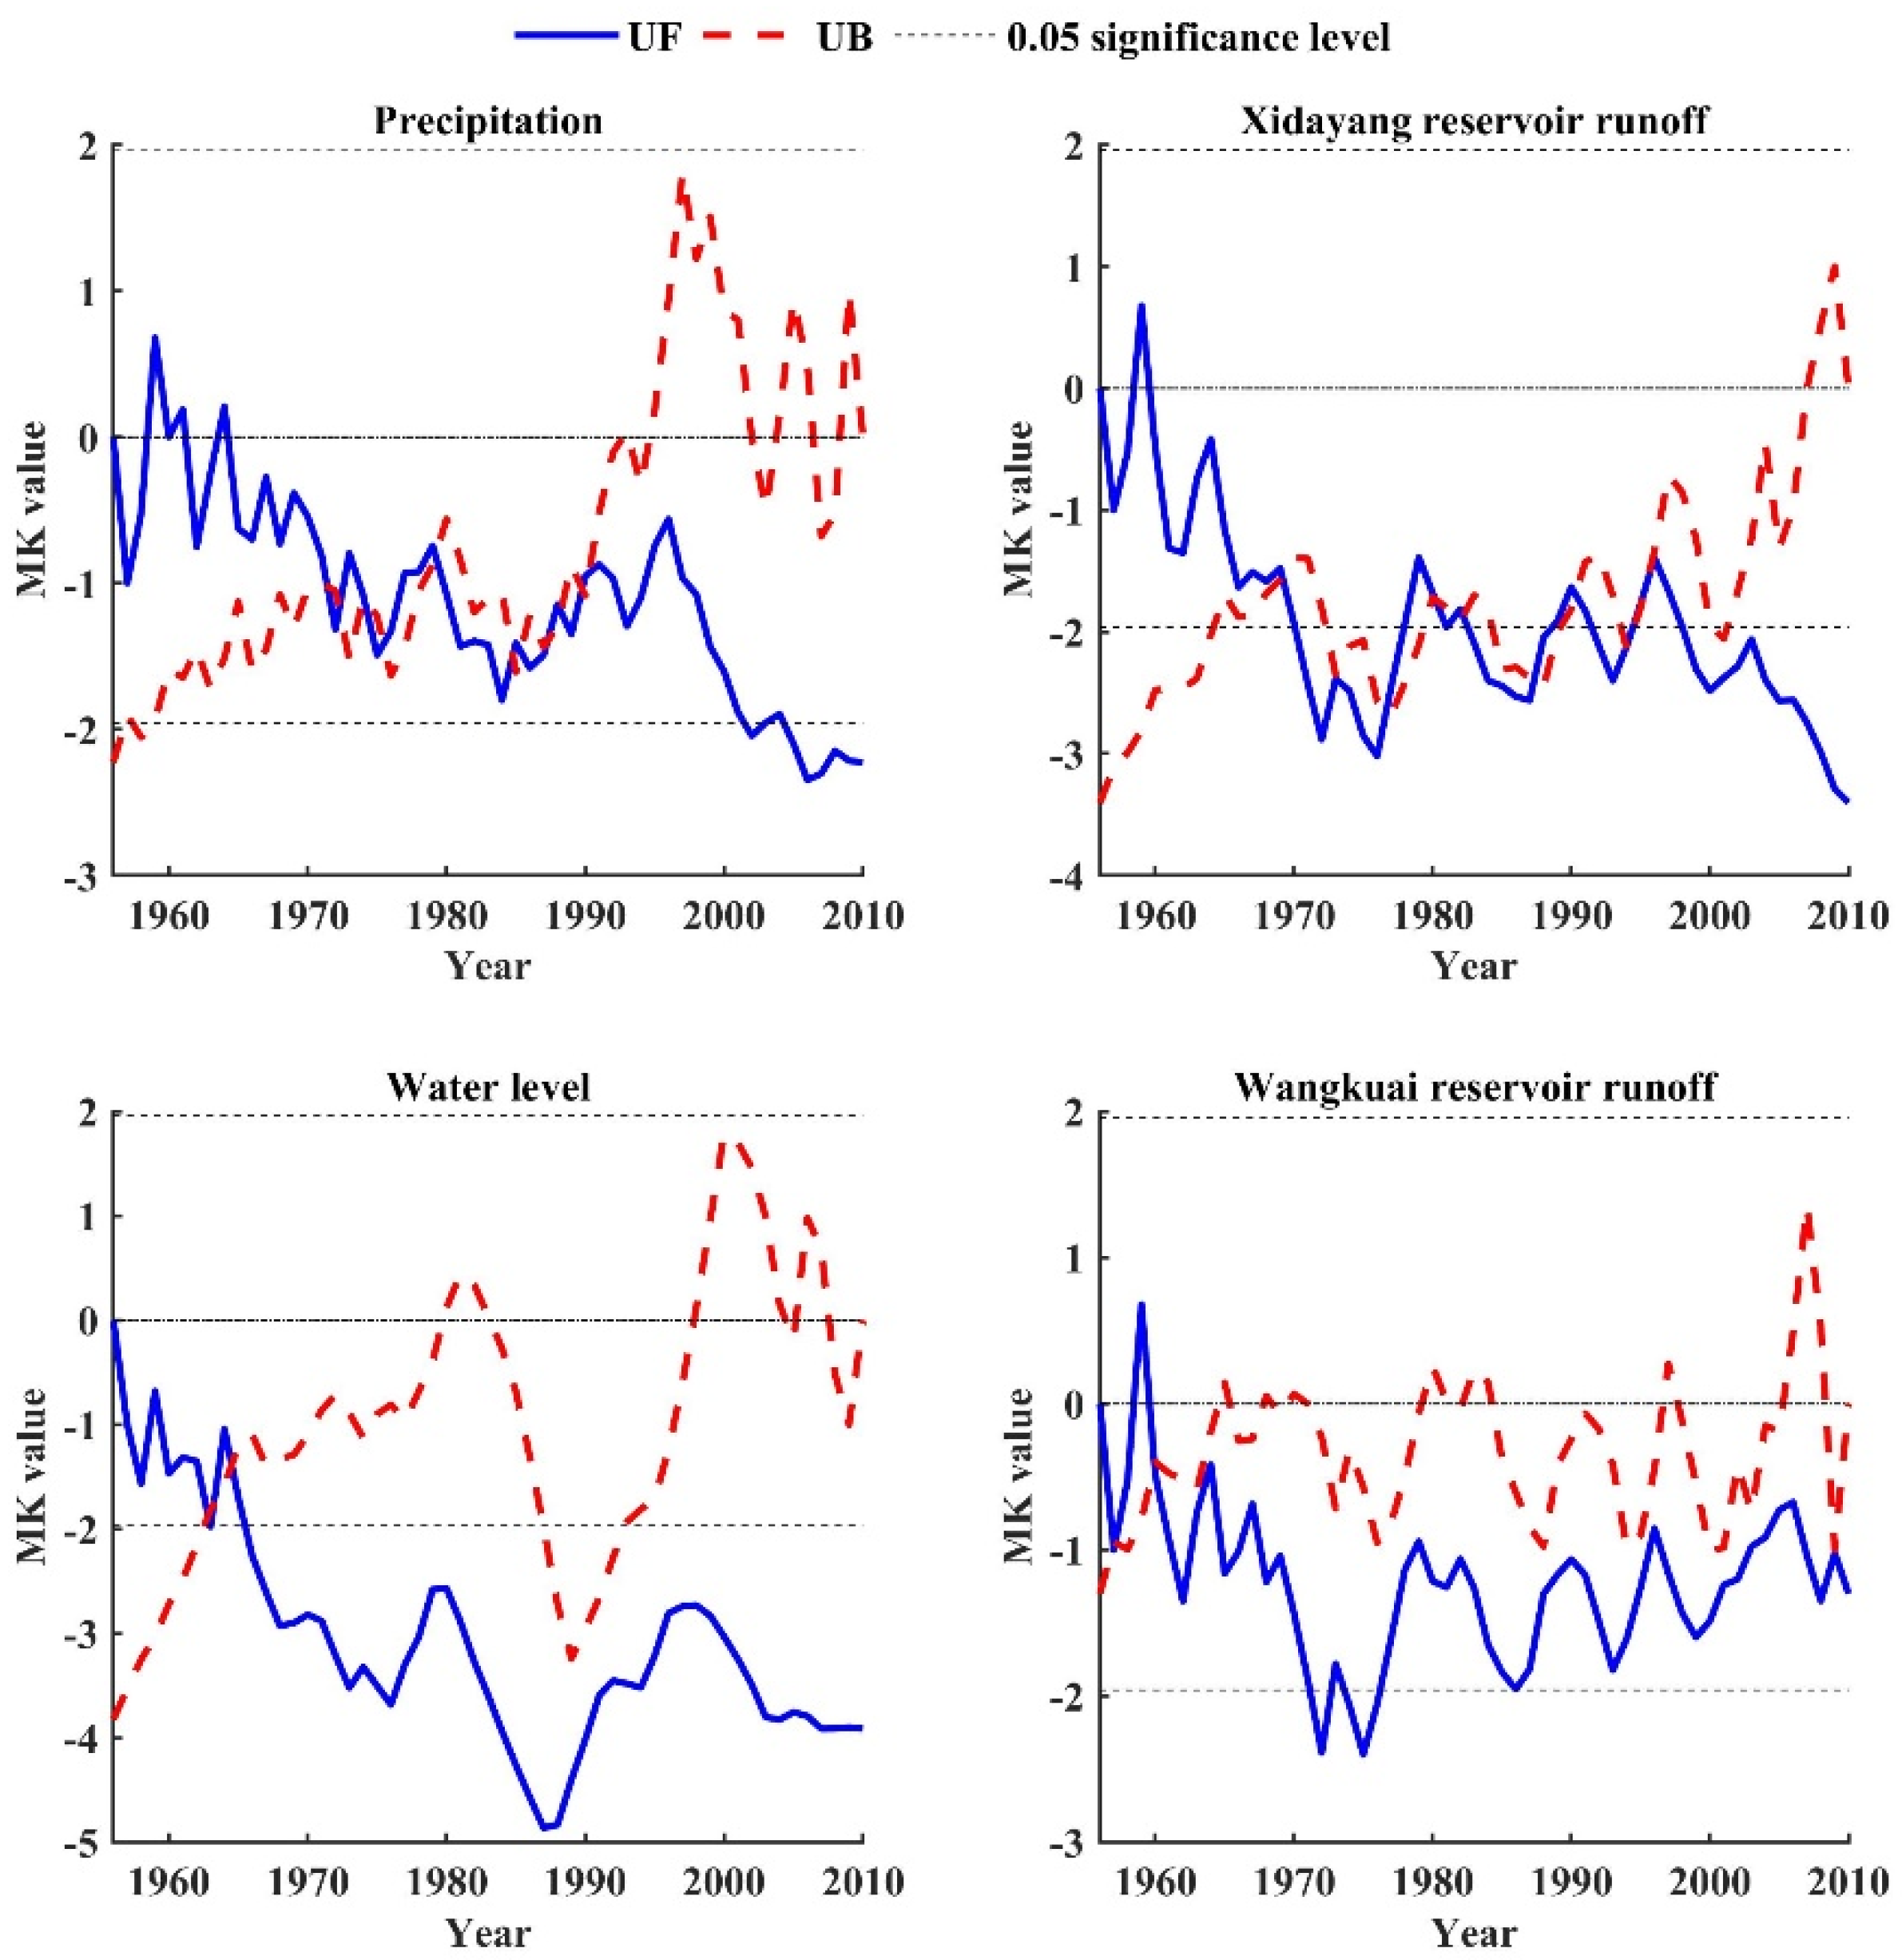
3.4. Mann–Kendall Test for Drought Indices
The MK test was used here to detect the variation in trends of the meteorological and hydrological time series. The time step was 1 year. Figure 6 shows the MK test results of the precipitation, the runoff for the Xidayang Reservoir and Wangkuai Reservoir hydrological stations, and the water level for Lake Baiyangdian from 1956 to 2010. They all passed significant testing at the level of 0.05, and in general featured a trend of significant decline. The change points of precipitation, runoff for the Xidayang and Wangkuai Reservoir hydrological stations, and the water level, respectively, occurred in the years 1971, 1969, 1960, and 1963. The average values for the precipitation, runoff for the Xidayang Reservoir and Wangkuai Reservoir hydrological stations, and water levels before and after the change points decreased by 12.93%, 39.60%, 27.53%, and 14.49%, respectively.
4. Discussion
4.1. The Change Point of a Changing Environment
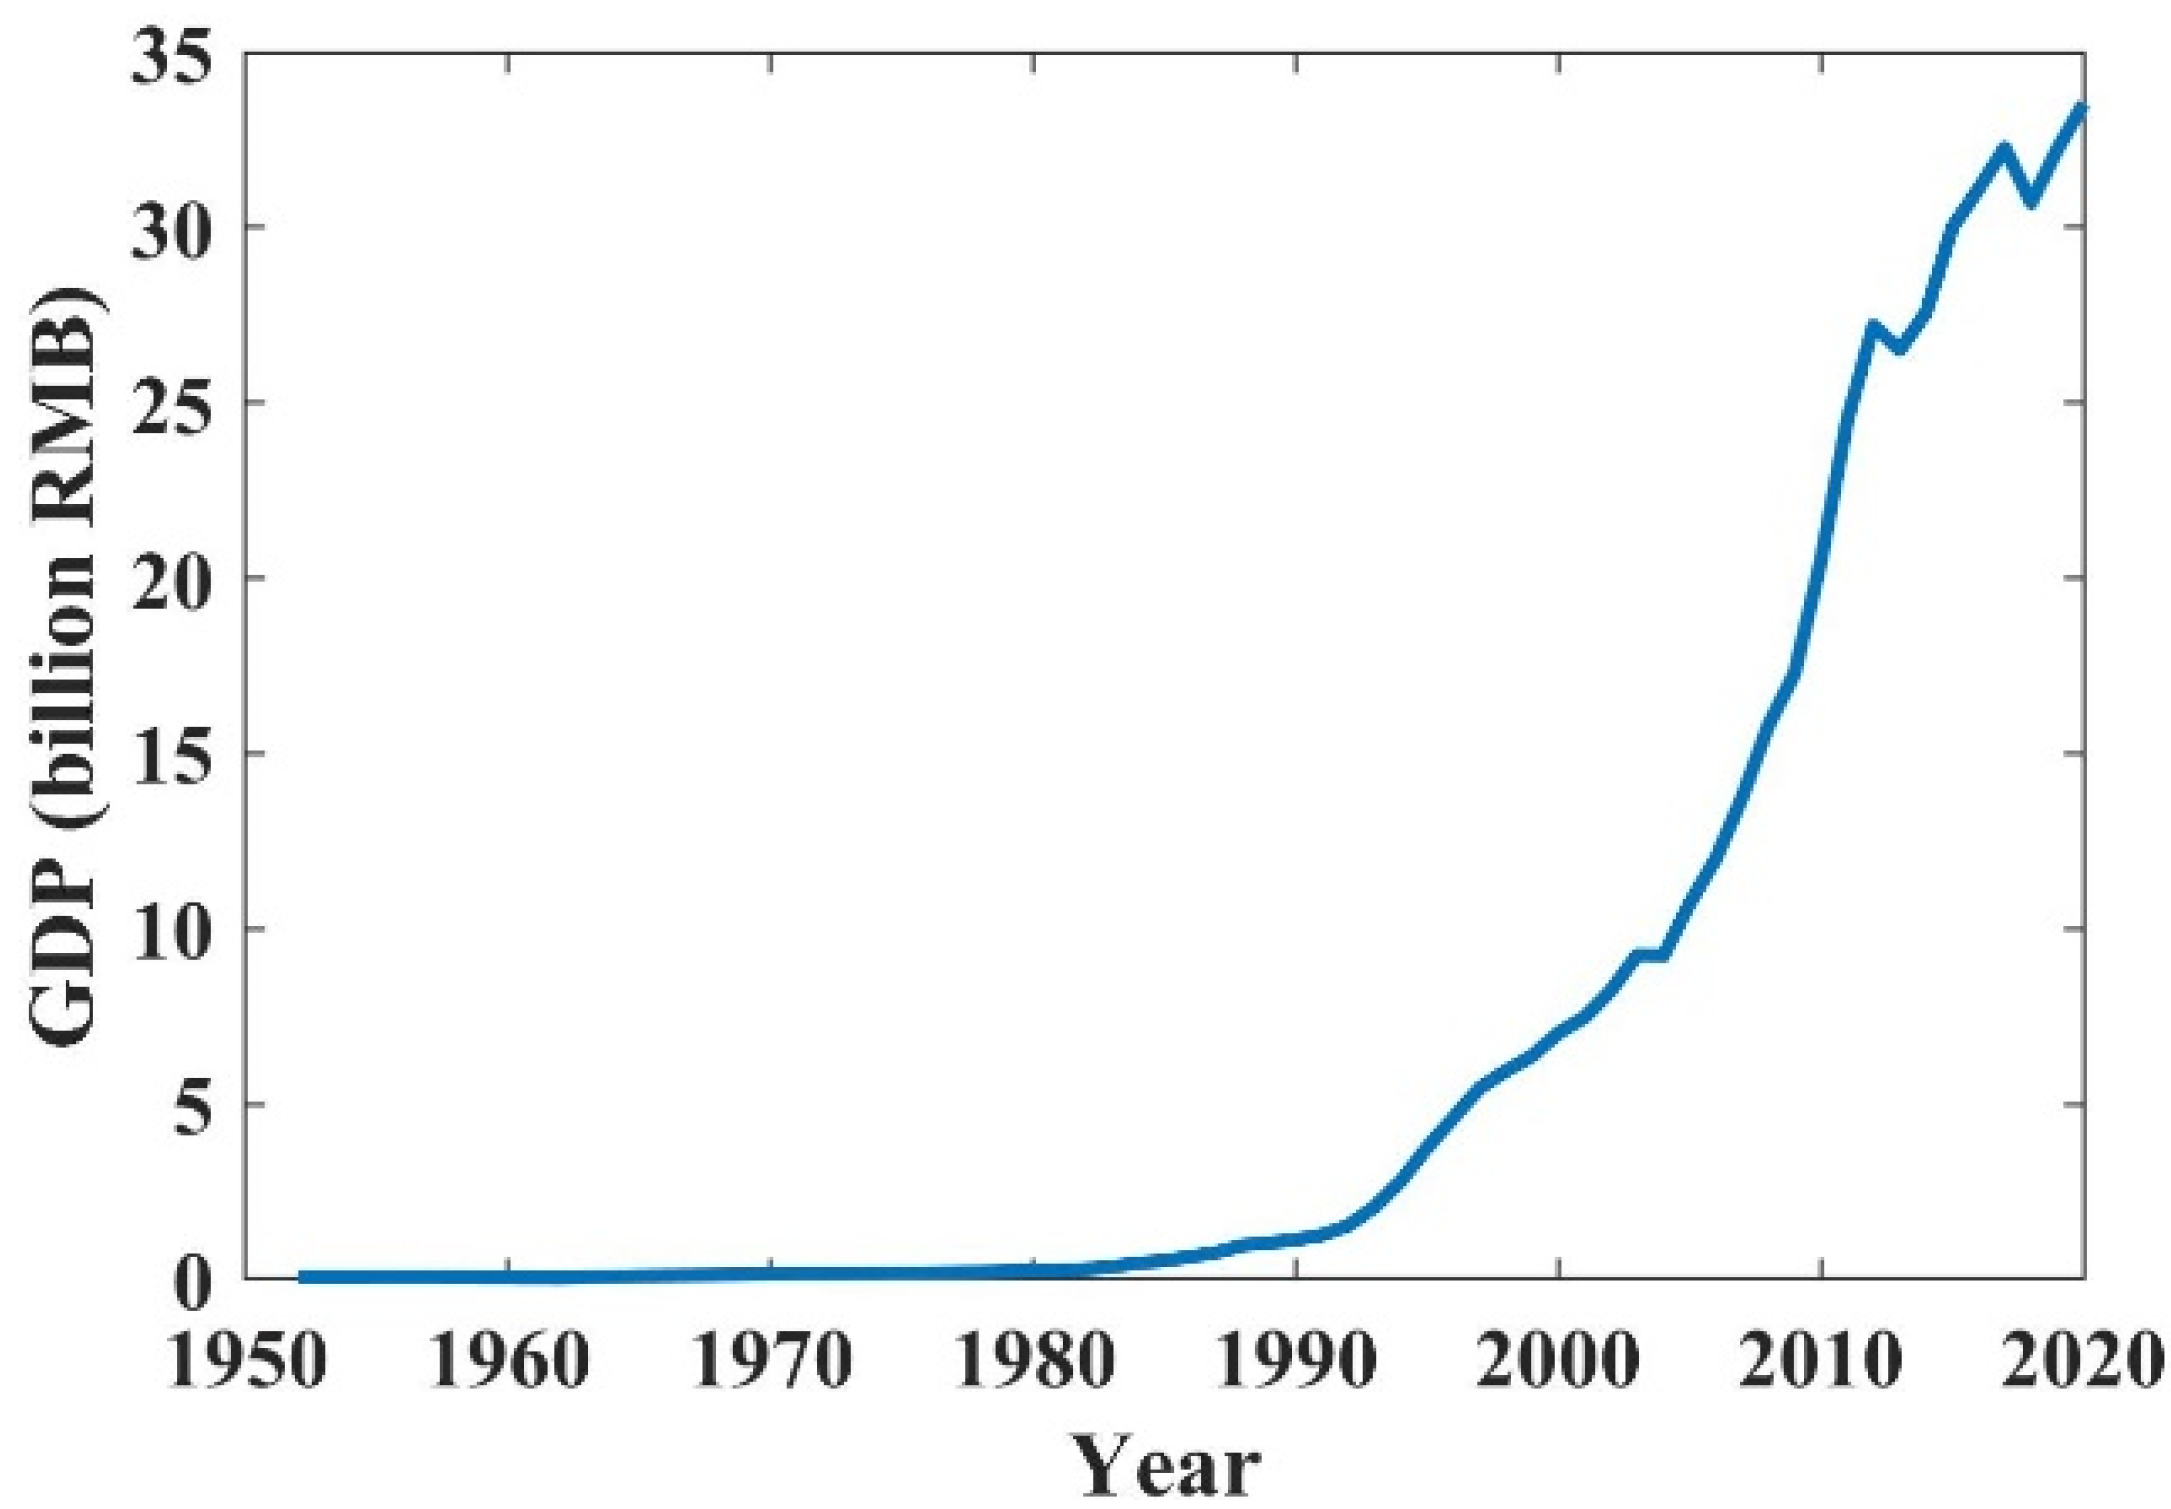
Before 1960s, the rivers in the upper reaches of the Baiyangdian Basin were basically undisturbed by human activities. After the catastrophic flooding there in 1963, a series of reservoirs were built in the upper reaches of this basin. According to Section 3.4 above, the precipitation has declined significantly since 1971. Hence, we reasonably inferred the change point of climate variability to be 1971. The water level showed a significant trend of decreasing after 1963. In addition, as depicted in Figure 7, the gross domestic product (GDP) in Baoding prior to 1980 was much smaller than that since 1970. This also corroborates the view that human activities caused little disturbance to the Baiyangdian Basin’s environment until 1970s. Furthermore, Han et al. [40] used the MK test and continuous wavelet analysis to evaluate the water levels of Lake Baiyangdian, finding evidence for a marked downward trend post-1967. After an overall consideration of these results, we designated 1971 as when the environment changed.
4.2. Drought Characteristics before and after a Changed Environment
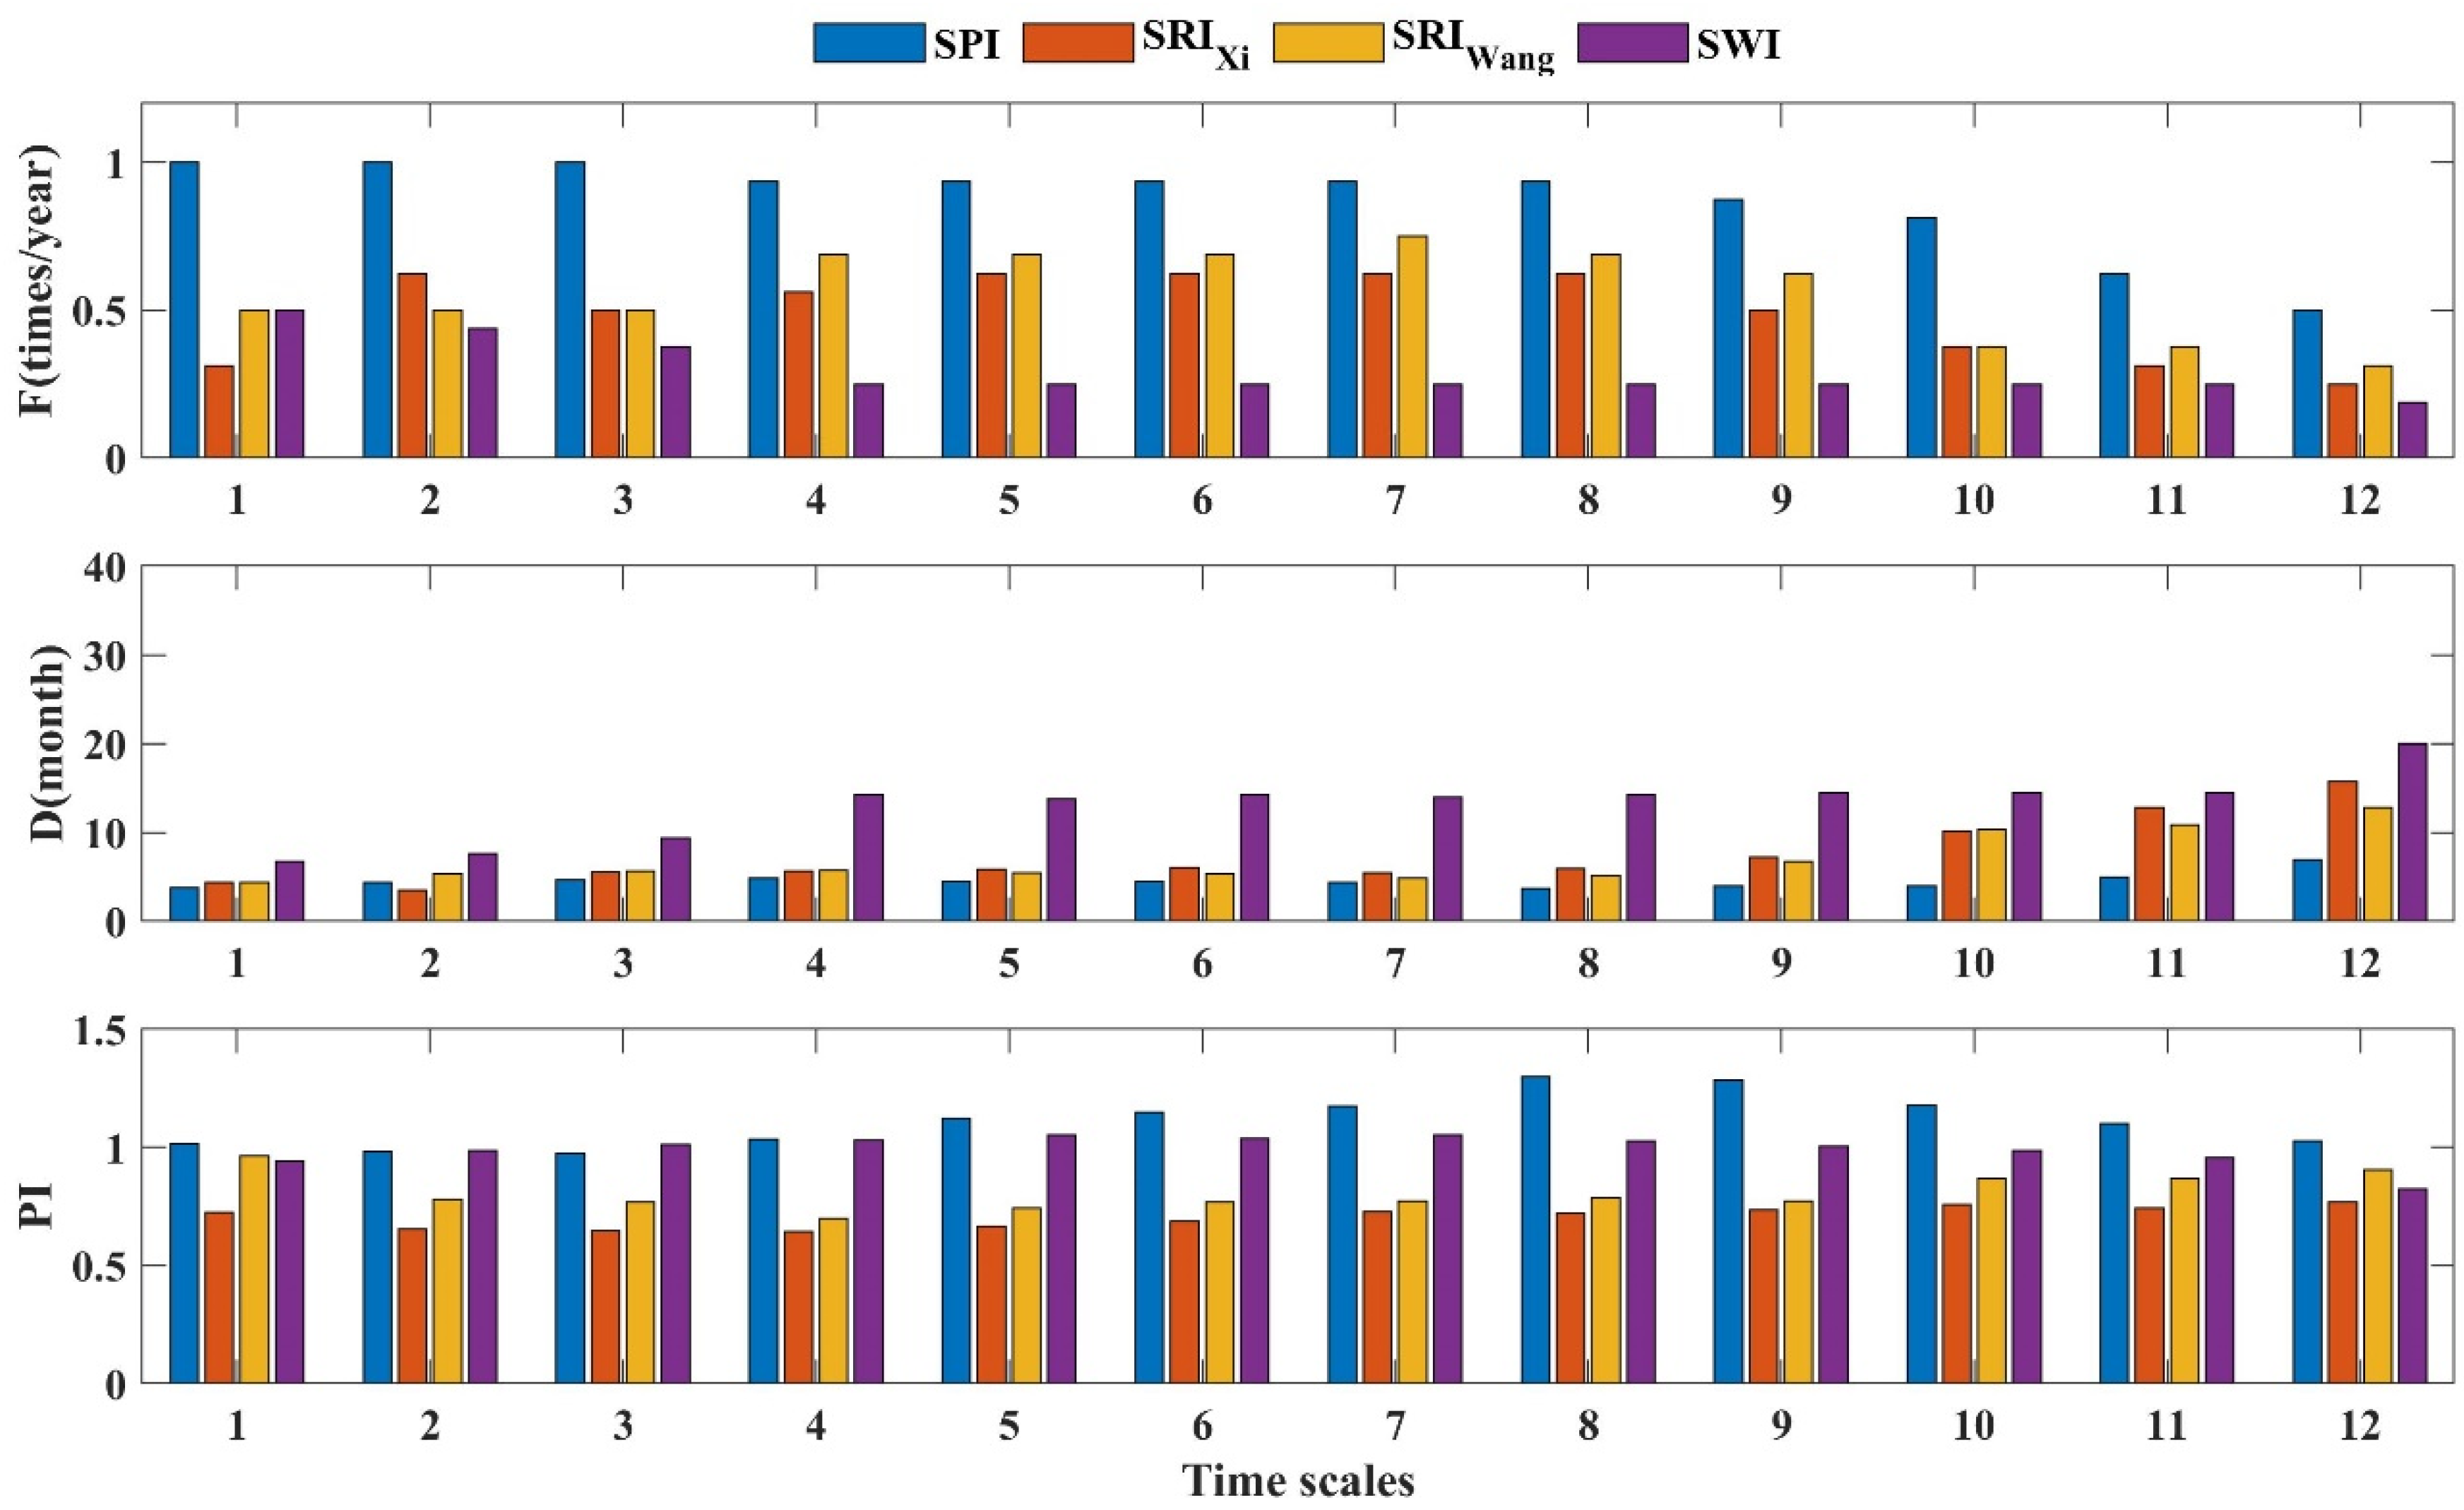
Figure 8 and Figure 9 illustrate the drought characteristics of the SPI, SRIXi, SRIWang, and SWI for different timescales before and after the environment changed. It is clear that the SPI featured a higher frequency and shorter duration than the other drought indices, while the SWI had a lower frequency and longer duration.
Comparing Figure 8 with Figure 9, the frequency of the four drought indices was lessened, their duration was lengthened, and the PI differed little on the whole before versus after a changing environment. In particular, the SWI of the lake hydrological drought fell in frequency, but its duration was greatly prolonged. This indicates that the changing environment led to the further intensification of the lake hydrological drought. In addition, when the timescales were more than 7 months, the duration of the SRIXi was significantly prolonged. This demonstrates that the influence of environmental change was much greater on the Xidayang Reservoir hydrological station than the Wangkuai Reservoir hydrological station.
4.3. Propagation of Meteorological to Hydrological Drought before and after a Changing Environment
The Pearson correlation coefficients between the SRI-1 and SPI-n, SWI-1 and SRI-n, SWI-1 and SPI-n were calculated to determine the meteorological-to-hydrological drought propagation time (Figure 10).
The timescale with the largest correlation coefficient was considered here as the most suitable propagation time. Before the environmental change occurred, the propagation time from the meteorological drought SPI to the hydrological drought SRI was 2 to 3 months, with the correlation coefficient of about 0.68. The propagation time from the SRI to the lake hydrological drought SWI was 4 to 6 months, with the correlation coefficient of 0.72. The propagation time from the SPI to the SWI was 11 months, with the correlation coefficient of 0.71. After the environmental change, the propagation time from the SPI to the SRI extended to 3 months, for which the correlation coefficient was 0.60. The propagation time from the SRI to the SWI took 10 months, with the correlation coefficient reduced to 0.66. The propagation time from the SPI to the SWI was extended to 12 months, with the correlation coefficient lower, at 0.55. As expected, the propagation time from the SPI to the SWI was the longest, and the propagation time from the SPI to the SRI was shorter than that from the SRI to the SWI. In other words, it took a longer time for a meteorological drought to spread and generate a lake drought event. In addition, it can be seen that environmental changes greatly lengthen the propagation from meteorological drought to hydrological drought, thus obstructing the drought propagation process.
The maximum correlation coefficient value conveys the degree of meteorological drought’s influence on hydrological drought. Clearly, the relevance of meteorological drought for hydrological drought is diminished in that the maximum correlation coefficient decreases after the environmental change occurs. This indicates that environmental changes can weaken the influence of meteorological droughts on hydrological droughts. The timescale of a drought index corresponding to the maximum correlation coefficient can also reflect the sensitivity of hydrological droughts to meteorological droughts. A shorter timescale would imply a more sensitive response of hydrological droughts to meteorological droughts. Evidently, the lag time lengthened after the environmental change occurred in the study area, suggesting hydrological droughts became mostly insensitive to meteorological droughts.
4.4. Extension Opportunities
Hydrological droughts (in river basins and lakes) have a longer duration and an obvious lag after meteorological droughts (Table 4, Figure 5, Figure 8, Figure 9 and Figure 10). This conclusion was also confirmed by the research of Wu et al. [36]. According to Wu et al. [36], “Hydrological drought typically lags meteorological drought.” Hydrological droughts are affected by the amount of water stored in the early stage of the drought in the basin, and for this reason, there is hysteresis. Under extreme drought conditions, the water storage in the basin is very small. At the end of a meteorological drought, precipitation recharges the groundwater at first, and it takes time to recharge the runoff, which leads to decreasing runoff. As a result, hydrological droughts last longer than meteorological droughts.
Compared with meteorological droughts, hydrological droughts are also affected by human activities. Human activities (e.g., dams, urbanization, and irrigation) greatly change the drought propagation process [41,42]. According to Xu et al. [22], “Reservoir construction is one of the most important controlling factors that can lead to changes in drought transmission through the regulation of runoff.” They conducted research about the propagation from meteorological drought to hydrological drought under the impact of human activities using a case study in northern China. They found human activities weakened the link between meteorological droughts and hydrological droughts (in the river basin). This result is also confirmed by our research. Reservoir operation alters the relationship between precipitation and runoff. We studied the propagation from meteorological to hydrological drought not only in the river basin, but also further, to the lake, under a changing environment. The impact of human activities and climate change on lake hydrological droughts in a changing environment has not yet been quantitatively assessed. Further investigation is required to distinguish their impacts and assess their contributions to lake hydrological droughts through quantitative simulation in the future.
5. Conclusions
To research the characteristics of propagation of meteorological to hydrological drought for a lake, this study chose Lake Baiyangdian as the case study. We applied various drought indicators (SPI, SRI, and SWI) to define and evaluate the meteorological droughts and hydrological droughts. In particular, drought propagation time was analyzed based on the time-lag cross-correlation analysis. The results show that it takes longer for a meteorological drought to propagate to a lake hydrological drought than to a hydrological drought in the river basin. In recent decades, Lake Baiyangdian has gone through a changing environment as climate change and human activities disturbed the drought propagation characteristics. The Mann–Kendall test was used to divide the study period into two subintervals (pre-change and post-change), and we compared the drought events between these two subintervals. Our results mainly show that changes in the external environment tend to result in longer drought propagation times. This study can help us to understand more clearly the occurrence and evolution of droughts in different water bodies in the basin, especially in lakes.
Author Contributions
Conceptualization, S.H. and J.H.; methodology, S.H.; validation, E.Z.; data curation, S.H. and E.Z.; writing—original draft preparation, S.H. and E.Z.; visualization, S.H. and M.Y.; funding acquisition, S.H., J.H. and M.Y. All authors have read and agreed to the published version of the manuscript.
Funding
The research was financially supported by the National Key Research and Development Program of China (grant No. 2021YFC3000202), the China Postdoctoral Science Foundation (grant No. 2022M710491), the Fundamental Research Funds for the Central Public Welfare Research Institutes (grant No. CKSF2021432, grant No. CKSF2021440), and the Research Service Plan of the Yangtze River to the Huaihe River Diversion project (grant No. HNYJJH/JS/FWKY-2021004).
Institutional Review Board Statement
Not applicable.
Informed Consent Statement
Not applicable.
Data Availability Statement
Not applicable.
Conflicts of Interest
The authors declare no conflict of interest.
References
- Chen, H.; Sun, J. Changes in Drought Characteristics over China Using the Standardized Precipitation Evapotranspiration Index. J. Clim. 2015, 28, 5430–5447. [Google Scholar] [CrossRef]
- Wong, G.; van Lanen, H.A.J.; Torfs, P.J.J.F. Probabilistic Analysis of Hydrological Drought Characteristics Using Meteorological Drought. Hydrol. Sci. J. 2013, 58, 253–270. [Google Scholar] [CrossRef]
- Peng, J.; Dadson, S.; Hirpa, F.; Dyer, E.; Lees, T.; Miralles, D.G.; Vicente-Serrano, S.M.; Funk, C. A Pan-African High-Resolution Drought Index Dataset. Earth Syst. Sci. Data 2020, 12, 753–769. [Google Scholar] [CrossRef]
- Guo, Y.; Huang, S.; Huang, Q.; Wang, H.; Fang, W.; Yang, Y.; Wang, L. Assessing Socioeconomic Drought Based on an Improved Multivariate Standardized Reliability and Resilience Index. J. Hydrol. 2019, 568, 904–918. [Google Scholar] [CrossRef]
- Zhang, C.; Tang, Q.; Chen, D.; Li, L.; Liu, X.; Cui, H. Tracing Changes in Atmospheric Moisture Supply to the Drying Southwest China. Atmos. Chem. Phys. 2017, 17, 10383–10393. [Google Scholar] [CrossRef]
- Zeng, P.; Sun, F.Y.; Liu, Y.Y.; Wang, Y.; Li, G.; Che, Y. Mapping future droughts under global warming across China: A combined multi-timescale meteorological drought index and SOM-K means approach. Weather Clim. Extrem. 2021, 31, 100304. [Google Scholar] [CrossRef]
- Hao, C.; Zhang, J.; Yao, F. Combination of Multi-Sensor Remote Sensing Data for Drought Monitoring over Southwest China. Int. J. Appl. Earth Obs. Geoinf. 2015, 35, 270–283. [Google Scholar] [CrossRef]
- Mishra, A.K.; Singh, V.P. A Review of Drought Concepts. J. Hydrol. 2010, 391, 202–216. [Google Scholar] [CrossRef]
- Wilhite, D.A. (Ed.) Drought and Water Crises; CRC Press: Boca Raton, FL, USA, 2005; ISBN 978-1-4200-2838-6. [Google Scholar]
- Heim, R.R. A Review of Twentieth-Century Drought Indices Used in the United States. Bull. Am. Meteorol. Soc. 2002, 83, 1149–1166. [Google Scholar] [CrossRef]
- Wilhite, D.A.; Glantz, M.H. Understanding: The Drought Phenomenon: The Role of Definitions. Water Int. 1985, 10, 111–120. [Google Scholar] [CrossRef] [Green Version]
- Li, R.; Chen, N.; Zhang, X.; Zeng, L.; Wang, X.; Tang, S.; Li, D.; Niyogi, D. Quantitative Analysis of Agricultural Drought Propagation Process in the Yangtze River Basin by Using Cross Wavelet Analysis and Spatial Autocorrelation. Agric. For. Meteorol. 2020, 280, 107809. [Google Scholar] [CrossRef]
- Yuan, X.; Zhang, M.; Wang, L.; Zhou, T. Understanding and Seasonal Forecasting of Hydrological Drought in the Anthropocene. Hydrol. Earth Syst. Sci. 2017, 21, 5477–5492. [Google Scholar] [CrossRef]
- Hao, Z.; Singh, V.P.; Xia, Y. Seasonal Drought Prediction: Advances, Challenges, and Future Prospects. Rev. Geophys. 2018, 56, 108–141. [Google Scholar] [CrossRef]
- Li, J.; Zhou, S.; Hu, R. Hydrological Drought Class Transition Using SPI and SRI Time Series by Loglinear Regression. Water Resour. Manag. 2016, 30, 669–684. [Google Scholar] [CrossRef]
- Shukla, S.; Wood, A.W. Use of a Standardized Runoff Index for Characterizing Hydrologic Drought. Geophys. Res. Lett. 2008, 35, L02405. [Google Scholar] [CrossRef]
- McKee, T.B.; Doesken, N.J.; Kleist, J. The relationship of drought frequency and duration to time scale. Eighth Conf. Appl. Climatol. Anaheim Calif. 1993, 17, 179–184. [Google Scholar]
- Barker, L.J.; Hannaford, J.; Chiverton, A.; Svensson, C. From Meteorological to Hydrological Drought Using Standardised Indicators. Hydrol. Earth Syst. Sci. 2016, 20, 2483–2505. [Google Scholar] [CrossRef]
- Lorenzo-Lacruz, J.; Vicente-Serrano, S.; González-Hidalgo, J.; López-Moreno, J.; Cortesi, N. Hydrological Drought Response to Meteorological Drought in the Iberian Peninsula. Clim. Res. 2013, 58, 117–131. [Google Scholar] [CrossRef]
- Sun, P.; Zhang, Q.; Singh, V.P.; Xiao, M.; Zhang, X. Transitional Variations and Risk of Hydro-Meteorological Droughts in the Tarim River Basin, China. Stoch. Environ. Res. Risk Assess. 2017, 31, 1515–1526. [Google Scholar] [CrossRef]
- Huang, S.; Li, P.; Huang, Q.; Leng, G.; Hou, B.; Ma, L. The Propagation from Meteorological to Hydrological Drought and Its Potential Influence Factors. J. Hydrol. 2017, 547, 184–195. [Google Scholar] [CrossRef]
- Xu, Y.; Zhang, X.; Wang, X.; Hao, Z.; Singh, V.P.; Hao, F. Propagation from Meteorological Drought to Hydrological Drought under the Impact of Human Activities: A Case Study in Northern China. J. Hydrol. 2019, 579, 124147. [Google Scholar] [CrossRef]
- Zhang, X.; Hao, Z.; Singh, V.P.; Zhang, Y.; Feng, S.; Xu, Y.; Hao, F. Drought Propagation under Global Warming: Characteristics, Approaches, Processes, and Controlling Factors. Sci. Total Environ. 2022, 838, 156021. [Google Scholar] [CrossRef]
- Waylen, P.; Annear, C.; Bunting, E. Interannual Hydroclimatic Variability of the Lake Mweru Basin, Zambia. Water 2019, 11, 1801. [Google Scholar] [CrossRef]
- Beklioğlu, M.; Bucak, T.; Coppens, J.; Bezirci, G.; Tavşanoğlu, Ü.N.; Çakıroğlu, A.İ.; Levi, E.E.; Erdoğan, Ş.; Filiz, N.; Özkan, K.; et al. Restoration of Eutrophic Lakes with Fluctuating Water Levels: A 20-Year Monitoring Study of Two Inter-Connected Lakes. Water 2017, 9, 127. [Google Scholar] [CrossRef]
- Wantzen, K.M.; Rothhaupt, K.-O.; Mörtl, M.; Cantonati, M.; G.-Tóth, L.; Fischer, P. Ecological Effects of Water-Level Fluctuations in Lakes: An Urgent Issue. Hydrobiologia 2008, 613, 1–4. [Google Scholar] [CrossRef]
- Gubiani, É.A.; Thomaz, S.M.; Bini, L.M.; Piana, P.A. Metapopulation Models Predict the Temporal Response of Two Macrophytes to Drought in a Subtropical Water Reservoir. Ecol. Eng. 2017, 100, 1–7. [Google Scholar] [CrossRef]
- Bond, N.R.; Lake, P.S.; Arthington, A.H. The Impacts of Drought on Freshwater Ecosystems: An Australian Perspective. Hydrobiologia 2008, 600, 3–16. [Google Scholar] [CrossRef]
- Havens, K.E.; East, T.L.; Beaver, J.R. Zooplankton Response to Extreme Drought in a Large Subtropical Lake. Hydrobiologia 2007, 589, 187–198. [Google Scholar] [CrossRef]
- Sobhani, B.; Zengir, V.S.; Kianian, M.K. Drought Monitoring in the Lake Urmia Basin in Iran. Arab. J. Geosci. 2019, 12, 448. [Google Scholar] [CrossRef]
- Perales, K.M.; Hein, C.L.; Lottig, N.R.; Vander Zanden, M.J. Lake Water Level Response to Drought in a Lake-Rich Region Explained by Lake and Landscape Characteristics. Can. J. Fish. Aquat. Sci. 2020, 77, 1836–1845. [Google Scholar] [CrossRef]
- Erdem, F.; Atun, R.; Yigit Avdan, Z.; Atila, I.; Avdan, U. Drought Analysis of Van Lake Basin with Remote Sensing and GIS Technologies. Egypt. J. Remote Sens. Space Sci. 2021, 24, 1093–1102. [Google Scholar] [CrossRef]
- Jitariu, V.; Dorosencu, A.; Ichim, P.; Ion, C. Severe Drought Monitoring by Remote Sensing Methods and Its Impact on Wetlands Birds Assemblages in Nuntași and Tuzla Lakes (Danube Delta Biosphere Reserve). Land 2022, 11, 672. [Google Scholar] [CrossRef]
- Wang, F.; Wang, Z.; Yang, H.; Di, D.; Zhao, Y.; Liang, Q.; Hussain, Z. Comprehensive Evaluation of Hydrological Drought and Its Relationships with Meteorological Drought in the Yellow River Basin, China. J. Hydrol. 2020, 584, 124751. [Google Scholar] [CrossRef]
- Yevjevich, V. An Objective Approach to Definitions and Investigations of Continental Hydrologic Droughts. J. Hydrol. 1969, 7, 353. [Google Scholar] [CrossRef]
- Wu, J.; Yao, H.; Chen, X.; Wang, G.; Bai, X.; Zang, D. A framework for assessing compound drought events from a drought propagation perspective. J. Hydrol. 2022, 604, 127228. [Google Scholar] [CrossRef]
- Yang, F.; Duan, X.; Guo, Q.; Lu, S.; Hsu, K. The spatiotemporal variations and propagation of droughts in Plateau Mountains of China. Sci. Total Environ. 2022, 805, 150257. [Google Scholar] [CrossRef]
- Shadmani, M.; Marofi, S.; Roknian, M. Trend Analysis in Reference Evapotranspiration Using Mann-Kendall and Spearman’s Rho Tests in Arid Regions of Iran. Water Resour. Manag. 2012, 26, 211–224. [Google Scholar] [CrossRef]
- Kendall, M.G. Rank Correlation Methods; Griffin: Oxford, UK, 1948. [Google Scholar]
- Han, Q.; Zhou, L.; Sun, W.; Wang, G.; Shrestha, S.; Xue, B.; Li, Z. Assessing Alterations of Water Level Due to Environmental Water Allocation at Multiple Temporal Scales and Its Impact on Water Quality in Baiyangdian Lake, China. Environ. Res. 2022, 212, 113366. [Google Scholar] [CrossRef]
- López-Moreno, J.I.; Vicente-Serrano, S.M.; Beguería, S.; García-Ruiz, J.M.; Portela, M.M.; Almeida, A.B. Dam effects on droughts magnitude and duration in a transboundary basin: The Lower River Tagus, Spain and Portugal. Water Resour. Res. 2009, 45, W02405. [Google Scholar] [CrossRef]
- Wen, L.; Rogers, K.; Ling, J.; Saintilan, N. The impacts of river regulation and water diversion on the hydrological drought characteristics in the Lower Murrumbidgee River Australia. J. Hydrol. 2011, 405, 382–391. [Google Scholar] [CrossRef]
Figure 1.
Map of the study area showing Lake Baiyangdian and the extent of the Baiyangdian Basin in China. Wangkuai Reservoir hydrological station (WRHS) and Xidayang Reservoir hydrological station (XRHS).
Figure 1.
Map of the study area showing Lake Baiyangdian and the extent of the Baiyangdian Basin in China. Wangkuai Reservoir hydrological station (WRHS) and Xidayang Reservoir hydrological station (XRHS).

Figure 2.
Schematic illustration of drought events and their characteristics (I denotes the intensity of a drought).
Figure 2.
Schematic illustration of drought events and their characteristics (I denotes the intensity of a drought).

Figure 3.
Boxplots of the goodness-of-fit for the runoff and water levels (Sd is the standard deviation, Rco is the Pearson correlation coefficient, and Rna is the Nash coefficient between the observed values and the simulated values). (a) Wangkuai Reservoir runoff, (b) Water level of Lake Baiyangdian.

Figure 4.
Results for the SPI, SRIXi, SRIWan, and SWI at different timescales from 1956 to 2010.

Figure 5.
Drought characteristics of the SPI, SRIXi, SRIWang, and SWI at different timescales (PI denotes the absolute values).
Figure 5.
Drought characteristics of the SPI, SRIXi, SRIWang, and SWI at different timescales (PI denotes the absolute values).

Figure 6.
The MK (Mann–Kendall) test results for precipitation, runoff, and water level.

Figure 7.
Change in the gross domestic product (GDP) of Baoding, Hebei Province, China, from 1952 to 2020.
Figure 7.
Change in the gross domestic product (GDP) of Baoding, Hebei Province, China, from 1952 to 2020.

Figure 8.
Drought characteristics of the SPI, SRIXi, SRIWang, and SWI for different timescales before a changing environment (PI denotes the absolute values.).
Figure 8.
Drought characteristics of the SPI, SRIXi, SRIWang, and SWI for different timescales before a changing environment (PI denotes the absolute values.).

Figure 9.
Drought characteristics of the SPI, SRIXi, SRIWang, and SWI at different timescales after a changing environment (PI denotes the absolute values).
Figure 9.
Drought characteristics of the SPI, SRIXi, SRIWang, and SWI at different timescales after a changing environment (PI denotes the absolute values).

Figure 10.
Correlation coefficients between the meteorological drought and hydrological drought series at various timescales: (a) before a changing environment and (b) after a changing environment in the study area. Black circles show the locations of the most suitable propagation time.
Figure 10.
Correlation coefficients between the meteorological drought and hydrological drought series at various timescales: (a) before a changing environment and (b) after a changing environment in the study area. Black circles show the locations of the most suitable propagation time.


Table 1.
Classification of the drought indices.
| Grade | SPI/SRI/SWI | Drought Grade |
|---|---|---|
| 1 | >−0.5 | Normal |
| 2 | −1.0~−0.5 | Slight |
| 3 | −1.5~−1.0 | Moderate |
| 4 | −2.0~–1.5 | Severe |
| 5 | <−2.0 | Extreme |
The SPI, SRI, and SWI were calculated at different timescales spanning 1 to 12 months (SPI-n, SRI-n, and SWI-n).
Table 2.
The KS test results for the runoff and water level of each month.
| Distribution Pattern | 1 | 2 | 3 | 4 | 5 | 6 | 7 | 8 | 9 | 10 | 11 | 12 | |
|---|---|---|---|---|---|---|---|---|---|---|---|---|---|
| Runoff: Xidayang Reservoir | Normal | − | − | − | − | − | − | − | − | − | − | − | − |
| Log-normal | + | + | − | − | + | + | + | + | + | + | + | + | |
| Exponential | − | − | − | − | − | − | − | − | − | − | − | − | |
| Poisson | − | − | − | − | − | − | − | − | − | − | − | − | |
| Gamma | + | + | − | − | + | + | + | + | + | + | + | + | |
| Weibull | + | + | + | + | + | + | + | + | + | + | + | + | |
| Runoff: Wangkuai Reservoir | Normal | − | − | − | − | − | − | − | − | − | − | − | − |
| Log-normal | + | + | + | + | + | + | + | + | + | + | + | + | |
| Exponential | − | − | − | − | − | + | + | + | + | − | − | − | |
| Poisson | − | − | − | − | − | − | − | − | − | − | − | − | |
| Gamma | + | + | + | + | + | + | + | + | + | + | + | + | |
| Weibull | + | + | + | + | + | + | + | + | + | + | + | + | |
| Water level | Normal | − | − | − | − | − | − | − | − | − | − | − | − |
| Log-normal | + | + | + | + | + | + | + | + | + | + | + | + | |
| Exponential | − | − | − | + | + | + | + | + | + | − | − | − | |
| Poisson | − | − | − | − | − | − | − | − | − | − | − | − | |
| Gamma | + | + | + | + | + | + | + | + | + | + | + | + | |
| Weibull | + | + | + | + | + | + | + | + | + | + | + | + |
Table 3.
Goodness-of-fit results for the runoff and water level data fitted to three distributions.
| Month | Log-Normal Distribution | Gamma Distribution | Weibull Distribution | |||||||
|---|---|---|---|---|---|---|---|---|---|---|
| dn | Correlation Coefficient | Nash Coefficient | dn | Correlation Coefficient | Nash Coefficient | dn | Correlation Coefficient | Nash Coefficient | ||
| Runoff: Xidayang Reservoir | 1 | 0.072 | 0.996 | 0.992 | 0.052 | 0.997 | 0.992 | 0.090 | 0.994 | 0.982 |
| 2 | 0.051 | 0.996 | 0.992 | 0.046 | 0.998 | 0.994 | 0.077 | 0.995 | 0.979 | |
| 3 | – | – | – | – | – | – | 0.101 | 0.994 | 0.984 | |
| 4 | – | – | – | – | – | – | 0.086 | 0.994 | 0.979 | |
| 5 | 0.061 | 0.994 | 0.989 | 0.065 | 0.995 | 0.990 | 0.086 | 0.993 | 0.983 | |
| 6 | 0.103 | 0.991 | 0.967 | 0.096 | 0.993 | 0.973 | 0.108 | 0.990 | 0.960 | |
| 7 | 0.065 | 0.997 | 0.991 | 0.088 | 0.992 | 0.978 | 0.104 | 0.989 | 0.971 | |
| 8 | 0.091 | 0.993 | 0.980 | 0.165 | 0.973 | 0.909 | 0.145 | 0.976 | 0.920 | |
| 9 | 0.112 | 0.995 | 0.985 | 0.163 | 0.984 | 0.949 | 0.167 | 0.979 | 0.930 | |
| 10 | 0.044 | 0.998 | 0.996 | 0.069 | 0.997 | 0.987 | 0.101 | 0.994 | 0.966 | |
| 11 | 0.065 | 0.994 | 0.987 | 0.065 | 0.996 | 0.989 | 0.088 | 0.996 | 0.975 | |
| 12 | 0.068 | 0.994 | 0.989 | 0.067 | 0.997 | 0.991 | 0.090 | 0.997 | 0.978 | |
| Runoff: Wangkuai Reservoir | 1 | 0.087 | 0.994 | 0.985 | 0.061 | 0.997 | 0.992 | 0.084 | 0.994 | 0.981 |
| 2 | 0.096 | 0.990 | 0.975 | 0.080 | 0.995 | 0.988 | 0.098 | 0.994 | 0.979 | |
| 3 | 0.084 | 0.993 | 0.985 | 0.047 | 0.998 | 0.996 | 0.063 | 0.998 | 0.992 | |
| 4 | 0.095 | 0.987 | 0.957 | 0.047 | 0.998 | 0.996 | 0.042 | 0.999 | 0.997 | |
| 5 | 0.088 | 0.991 | 0.977 | 0.043 | 0.997 | 0.994 | 0.046 | 0.997 | 0.994 | |
| 6 | 0.115 | 0.989 | 0.978 | 0.068 | 0.996 | 0.987 | 0.066 | 0.996 | 0.989 | |
| 7 | 0.088 | 0.992 | 0.982 | 0.066 | 0.996 | 0.989 | 0.068 | 0.996 | 0.989 | |
| 8 | 0.063 | 0.995 | 0.989 | 0.087 | 0.995 | 0.982 | 0.079 | 0.996 | 0.988 | |
| 9 | 0.071 | 0.994 | 0.987 | 0.056 | 0.998 | 0.992 | 0.061 | 0.997 | 0.991 | |
| 10 | 0.126 | 0.985 | 0.964 | 0.080 | 0.996 | 0.991 | 0.058 | 0.997 | 0.994 | |
| 11 | 0.088 | 0.988 | 0.969 | 0.056 | 0.996 | 0.991 | 0.081 | 0.996 | 0.991 | |
| 12 | 0.109 | 0.984 | 0.953 | 0.066 | 0.994 | 0.985 | 0.056 | 0.998 | 0.994 | |
| Water level | 1 | 0.115 | 0.969 | 0.933 | 0.115 | 0.973 | 0.941 | 0.095 | 0.987 | 0.968 |
| 2 | 0.114 | 0.970 | 0.931 | 0.114 | 0.973 | 0.941 | 0.104 | 0.985 | 0.966 | |
| 3 | 0.131 | 0.967 | 0.915 | 0.132 | 0.970 | 0.928 | 0.120 | 0.985 | 0.967 | |
| 4 | 0.122 | 0.966 | 0.897 | 0.121 | 0.971 | 0.916 | 0.114 | 0.991 | 0.980 | |
| 5 | 0.134 | 0.972 | 0.908 | 0.133 | 0.977 | 0.928 | 0.118 | 0.993 | 0.986 | |
| 6 | 0.111 | 0.984 | 0.962 | 0.109 | 0.987 | 0.971 | 0.082 | 0.995 | 0.988 | |
| 7 | 0.114 | 0.979 | 0.946 | 0.113 | 0.982 | 0.957 | 0.089 | 0.993 | 0.986 | |
| 8 | 0.071 | 0.995 | 0.990 | 0.067 | 0.996 | 0.992 | 0.105 | 0.994 | 0.983 | |
| 9 | 0.101 | 0.988 | 0.975 | 0.095 | 0.989 | 0.979 | 0.063 | 0.994 | 0.986 | |
| 10 | 0.106 | 0.985 | 0.968 | 0.101 | 0.987 | 0.972 | 0.095 | 0.993 | 0.982 | |
| 11 | 0.115 | 0.978 | 0.952 | 0.107 | 0.981 | 0.959 | 0.073 | 0.992 | 0.980 | |
| 12 | 0.114 | 0.973 | 0.942 | 0.108 | 0.977 | 0.950 | 0.086 | 0.990 | 0.974 | |
Note: The bold characters show the best Nash coefficients among the log-normal, gamma, and Weibull distributions.
Table 4.
Correlation coefficients between the meteorological drought and hydrological drought events.
Table 4.
Correlation coefficients between the meteorological drought and hydrological drought events.
| Timescale (n) | SPI-n and SRI-1xi | SPI-n and SRI-1wang | SRI-nxi and SWI-1 | SRI-nwang and SWI-1 | SPI-n and SWI-1 |
|---|---|---|---|---|---|
| 1 | 0.526 | 0.500 | 0.406 | 0.305 | 0.008 |
| 2 | 0.601 | 0.586 | 0.480 | 0.386 | 0.077 |
| 3 | 0.610 | 0.607 | 0.518 | 0.427 | 0.128 |
| 4 | 0.592 | 0.605 | 0.545 | 0.458 | 0.171 |
| 5 | 0.561 | 0.589 | 0.570 | 0.487 | 0.215 |
| 6 | 0.529 | 0.567 | 0.593 | 0.515 | 0.263 |
| 7 | 0.491 | 0.533 | 0.614 | 0.540 | 0.317 |
| 8 | 0.452 | 0.487 | 0.630 | 0.561 | 0.379 |
| 9 | 0.404 | 0.422 | 0.634 | 0.570 | 0.451 |
| 10 | 0.338 | 0.331 | 0.632 | 0.571 | 0.537 |
| 11 | 0.300 | 0.260 | 0.626 | 0.567 | 0.616 |
| 12 | 0.368 | 0.301 | 0.620 | 0.562 | 0.626 |
Note: The bold characters show the largest correlation coefficients.
Publisher’s Note: MDPI stays neutral with regard to jurisdictional claims in published maps and institutional affiliations. |
© 2022 by the authors. Licensee MDPI, Basel, Switzerland. This article is an open access article distributed under the terms and conditions of the Creative Commons Attribution (CC BY) license (https://creativecommons.org/licenses/by/4.0/).
Share and Cite
MDPI and ACS Style
He, S.; Zhang, E.; Huo, J.; Yang, M. Characteristics of Propagation of Meteorological to Hydrological Drought for Lake Baiyangdian in a Changing Environment. Atmosphere 2022, 13, 1531. https://doi.org/10.3390/atmos13091531
AMA Style
He S, Zhang E, Huo J, Yang M. Characteristics of Propagation of Meteorological to Hydrological Drought for Lake Baiyangdian in a Changing Environment. Atmosphere. 2022; 13(9):1531. https://doi.org/10.3390/atmos13091531
Chicago/Turabian StyleHe, Shan, Enze Zhang, Junjun Huo, and Mingzhi Yang. 2022. "Characteristics of Propagation of Meteorological to Hydrological Drought for Lake Baiyangdian in a Changing Environment" Atmosphere 13, no. 9: 1531. https://doi.org/10.3390/atmos13091531
Note that from the first issue of 2016, this journal uses article numbers instead of page numbers. See further details here.