1. Introduction
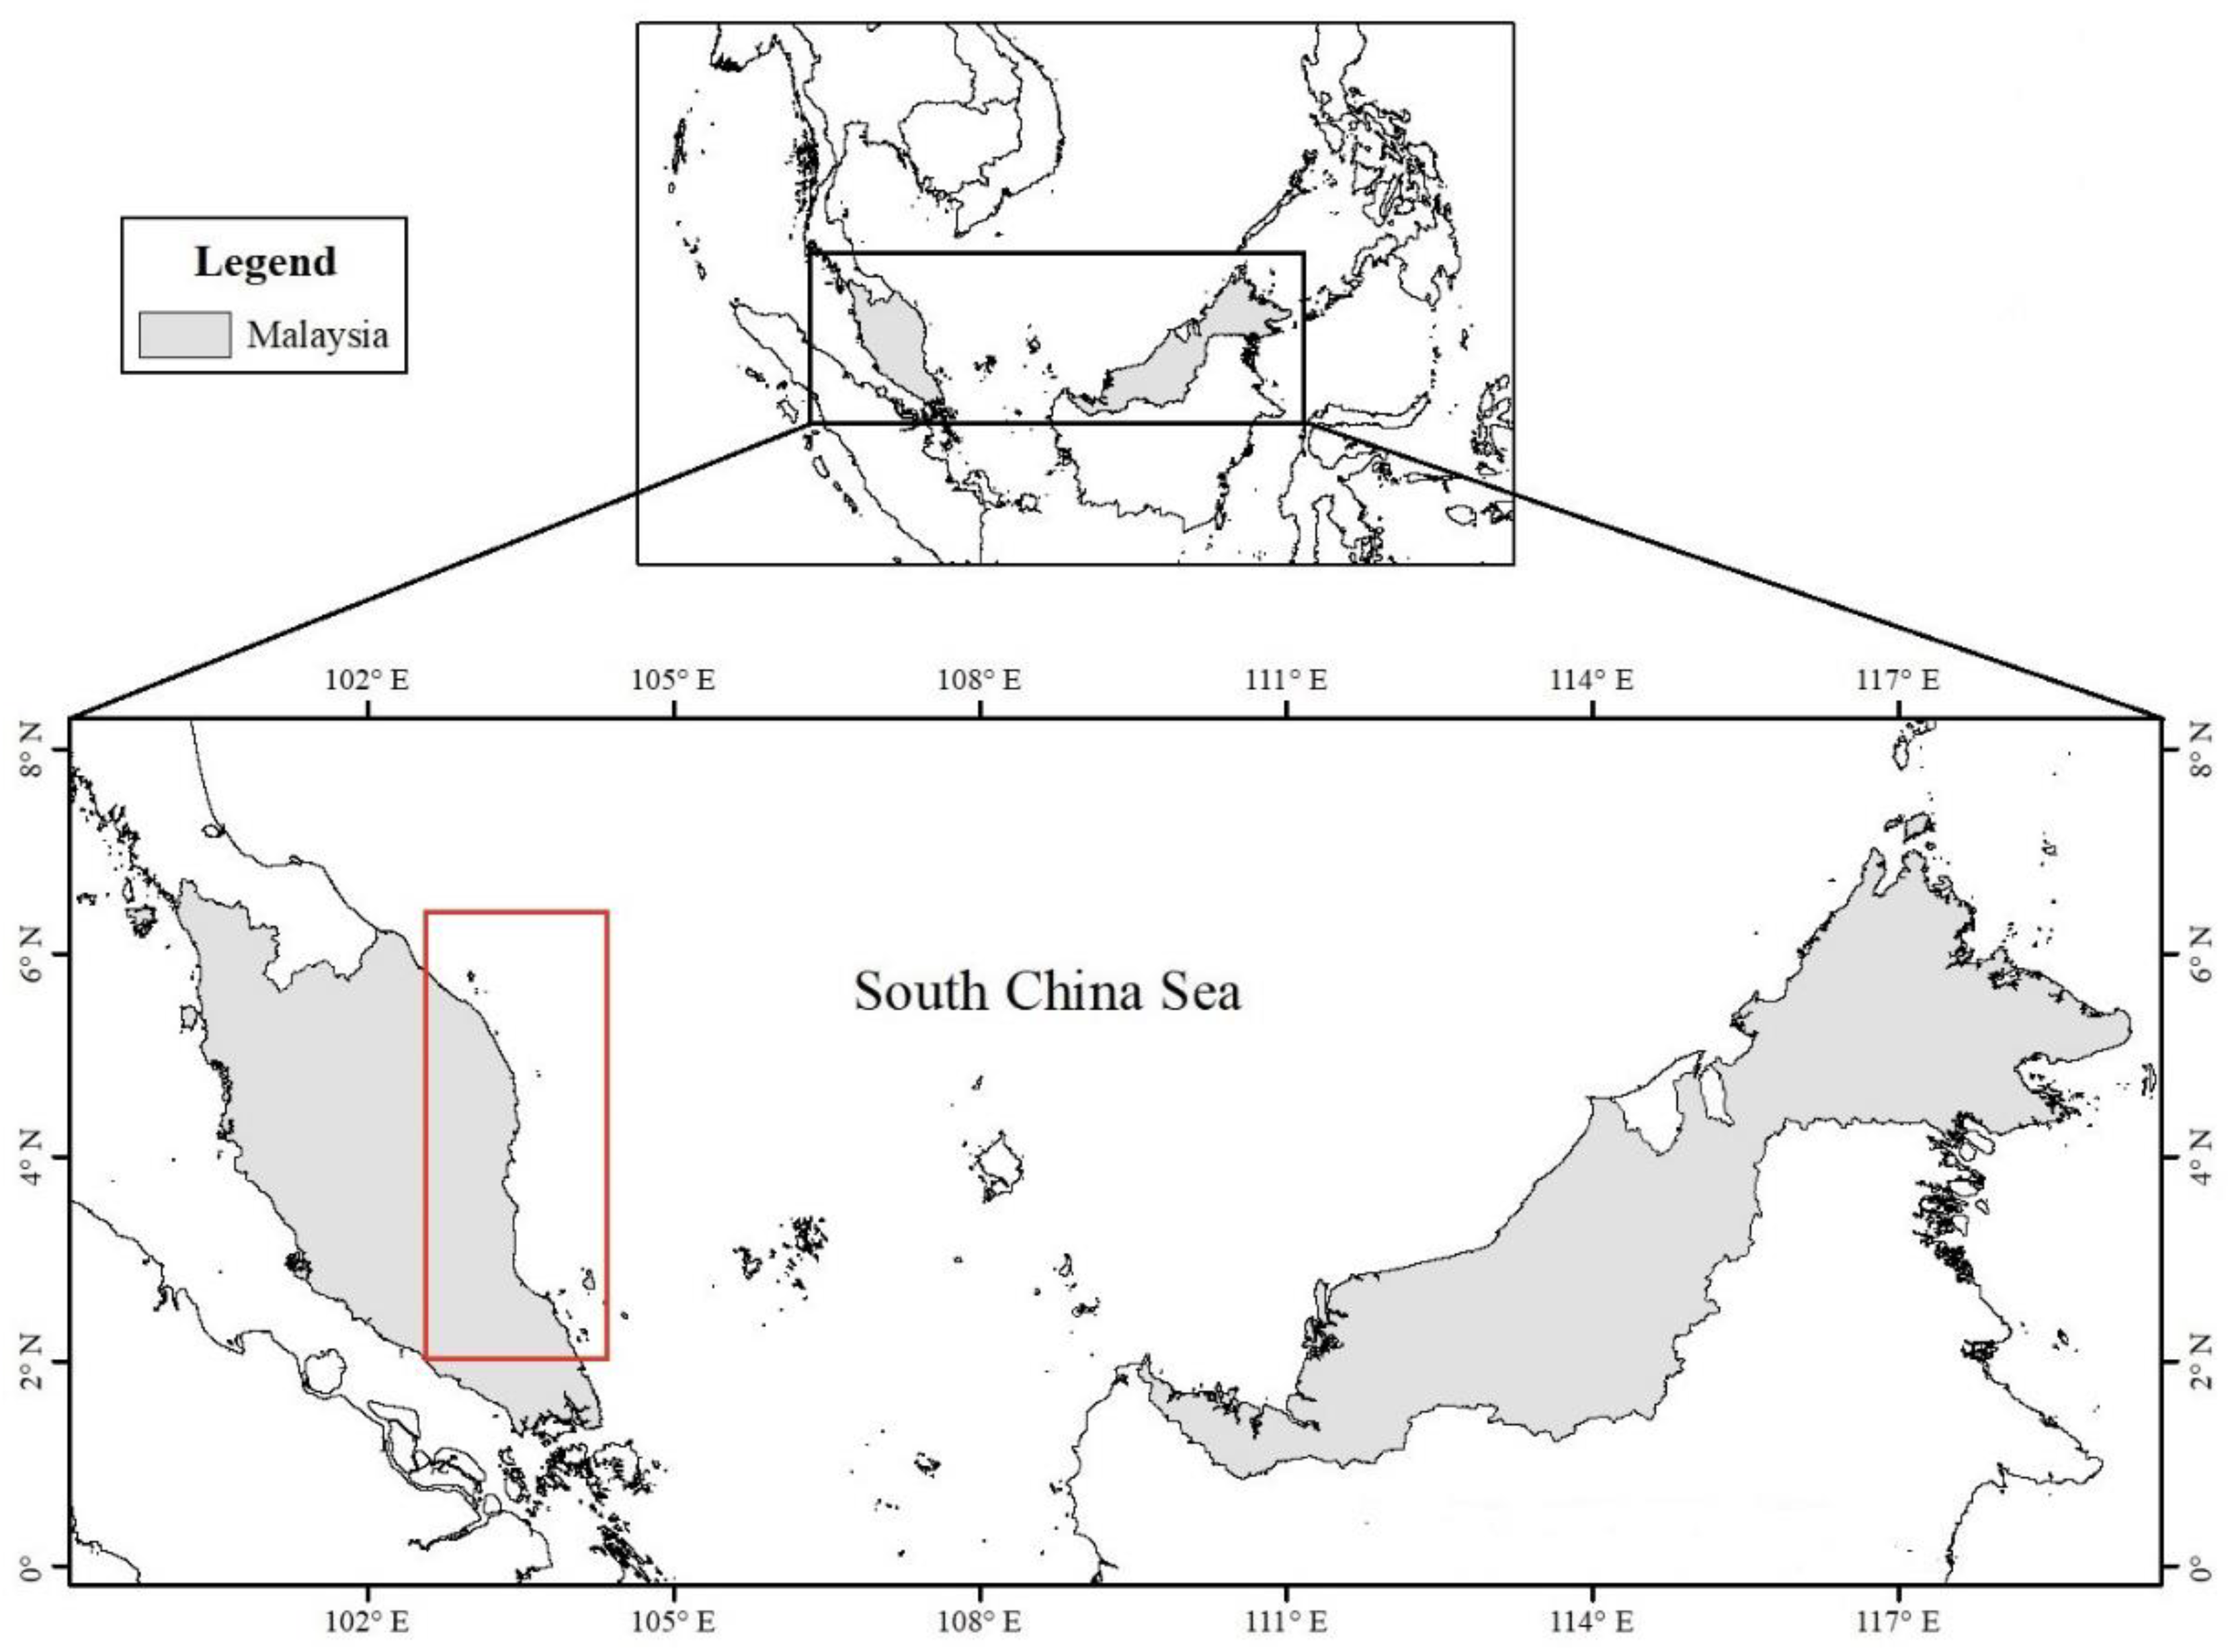
Located in the southwestern part of the South China Sea (SCS), the Malay Peninsular is surrounded by the SCS to the east and the Malacca Strait to the west. The SCS is one of the largest marginal seas in the western Pacific, located between 0–25° N and 99–122° E, and is surrounded by multiple countries, including Malaysia, Vietnam, the Philippines and China (
Figure 1). The SCS is dominated by the East Asian Monsoon, meaning the Peninsular Malaysia is influenced by the northeast monsoon during the boreal winter and the southwest monsoon during the boreal summer [
1,
2]. The southwest monsoon occurs from late May to September, while the northeast monsoon occurs from October to March. During the southwest (northeast) monsoon, the wind mainly flows from the southwest (northeast) direction [
3]. The north–south orientation of the coastline and the southwesterly prevailing wind during the southwest monsoon cause upwelling along most of the western coast of the SCS [
4,
5,
6,
7].
Upwelling is an important process in the marine environment because it brings cold and nutrient-rich water from deeper layers to the surface, replenishing nutrient-depleted surface water phytoplankton growth and so enhancing primary productivity and fishery production [
8,
9]. At the east coast of Peninsular Malaysia (ECPM), upwelling occurs during the southwest monsoon from June to August with the prevailing southwesterly wind serving as an essential mechanism in generating upwelling [
3,
10].
Previous studies have found that climate change can affect the upwelling process, whereby the change in global climate can cause upwelling in coastal areas to intensify [
11]. For this reason, numerous studies have been conducted to assess the impact of climate change on upwelling at different places [
12,
13,
14,
15,
16,
17]. However, no previous research has been conducted to investigate upwelling at the ECPM in the context of climate change.
Many products have been developed under the Coupled Model Intercomparison Projects (CMIPs) to project future climate using general circulation models (GCMs) [
18]. However, the resolution of GCMs, which is typically between 100 and 300 km, is too coarse, making their use in climate change impact assessments at local scales impractical. As a result, numerous regional climate models (RCMs) have been employed to downscale the GCMs. Here in Southeast Asia, the Southeast Asia Regional Climate Downscaling/Coordinated Regional Climate Downscaling Experiment-Southeast Asia (SEACLID/CORDEX-SEA; hereafter referred to as CORDEX-SEA) has successfully downscaled a substantial number of GCMs in order to provide the scientific community with free, high-resolution, regional climate change simulations for Southeast Asia [
19,
20].
Since the CORDEX-SEA product would have enough resolution to study ECPM upwelling and could potentially be used to study the impact of climate change on ECPM upwelling, this study aims to assess the ability of the CORDEX-SEA products in reproducing historical ECPM patterns. Although there are many factors that can cause upwelling to occur, such as local bathymetry, topographic effects and the nature of the coastline, this paper focuses on wind, which is the most important process that causes upwelling along the ECPM [
3,
10,
21]. Thus, in this study, the ability of the CORDEX-SEA product in recreating the features of wind speed and wind stress curl during the ECPM upwelling season, i.e., the southwest monsoon, will be assessed.
Furthermore, this study also creates an ensemble from the viable CORDEX-SEA products with the intention of determining whether the intensity of upwelling is able to be reproduced by the ensemble. The reason this study is interested in investigating the ability of the ensemble in reproducing the upwelling intensity is that such an approach is often used by scientists in studying future climate changes [
22]. According to Osman et al. [
23], greater predictive accuracy can often be achieved by combining a number of forecasting or predicting models to produce an overall combined or integrated forecast or prediction. This statement is also supported by [
24,
25], which state that a multi-model ensemble is more reasonable than individual model results. The ensemble can be used as a baseline for other studies pertaining to wind simulation or projection in the future.
2. Materials and Methods
2.1. Data
In this study, five regional climate downscaling simulations within the framework of the Coordinated Downscaling Experiment South-East Asia (CORDEX-SEA) [
22,
26,
27,
28] were used. Launched in November 2013, CORDEX-SEA is the fourteenth domain of CORDEX, a program of the World Climate Research Programme (WCRP). The CORDEX–SEA project was carried out by a consortium of many institutions from within and outside Southeast Asia and represents the most comprehensive set of simulations over SEA thus far [
28]. The CORDEX-SEA products provide high-resolution climate change scenarios (25 km × 25 km) for the Southeast Asia region.
Table 1 shows the overview of the models and their simulated period, which is offered by CORDEX-SEA and used in this study.
The reference data used to evaluate the CORDEX-SEA model performances were obtained from the European Centre Medium-Range Weather Forecast (ECMWF) fifth generation atmospheric reanalysis (ERA5) with a horizontal resolution of 0.125° × 0.125°. ERA5 is generated using 4D-Var data assimilation and model forecasts in CY41R2 of the ECMWF Integrated Forecast System (IFS), with 137 hybrid sigma/pressure (model) levels in the vertical and the top level at 0.01 hPa [
29]. Additionally, ERA5 estimates a wide range of atmospheric, land and oceanic climate variables hourly. The data cover the Earth on a 30 km grid and resolve the atmosphere using 137 levels from the surface to 80 km in altitude [
29]. Furthermore, the ERA5 dataset contains one (hourly, 31 km) high resolution realization (referred to as “reanalysis” or “HRES”) and a reduced resolution ten-member ensemble (referred to as “ensemble” or “EDA”). The ensemble is required for the data assimilation procedure, but as a by-product also provides an estimate of the relative random uncertainty [
30]. Many studies have been conducted using the ERA5 data around the globe with a focus on wind-based analysis, indicating that the reanalysis is suitable and reliable for research pertaining to wind [
31,
32,
33,
34,
35,
36,
37].
2.2. Domain & Upwelling Season of Interest
The study domain spans 100° E to 107° E and 1° N to 7° N (
Figure 1, red box), the site where ECPM upwelling tends to occur. The water circulation at the SCS is largely influenced by the monsoon system as the SCS experiences strong seasonal variation that is typically associated with the northeast and southwest monsoon systems [
38,
39,
40]. Thus, the ocean circulation along Peninsular Malaysia is highly dependent on the monsoon. The monsoon controls the sea-surface currents as well as the exchange of water between the east coast of Peninsular Malaysia and the adjacent bodies of water. Surface currents flow north to south along the east coast of Peninsular Malaysia to the Java Sea during the northeast monsoon in December to February. Conversely, the currents flow from south to north during the southwest monsoon in June to August [
41]. As a result, the current circulation system within the SCS main basin is cyclonic during the northeast monsoon and anti-cyclonic during the southwest monsoon [
3]. The southeast monsoon seasonal wind is favorable for the formation of upwelling as, when the wind is blowing from south to north along the ECPM, offshore Ekman transport will be generated, inducing coastal upwelling. This is similar to the upwelling that occurs at the Vietnam coast [
42]. Thus, the wind that occurs along the ECPM coast during the southwest monsoon season will be the main focus of this study.
2.3. Model Assessment Methodology
2.3.1. Wind Stress Curl & Wind Speed Climatology
Wind is widely acknowledged as the most important component in generating upwelling around the world, and earlier research [
10,
43] has shown that wind speed and wind stress curl are both important in shaping upwelling along Peninsular Malaysia’s east coast (ECPM). Therefore, this study focuses on assessing the ability of the CORDEX-SEA downscaled simulations to reproduce the historical wind speed and wind stress curl climatology over the ECPM upwelling region during the JJA seasons of 1980–2005.
The wind stress curl is described based on the sum of Ekman driven flows (in X and Y) in the surface ocean (Ekman layer). Both the wind stress and Ekman transport vary with position, which can result in convergence or divergence of the water within the Ekman layer. At the ECPM, the current circulation system within the SCS main basin is cyclonic during the northeast monsoon and anti-cyclonic during the southwest monsoon [
3]. An anti-cyclonic (cyclonic) wind at the ECPM would cause surface divergence (convergence) which would result in upwelling (downwelling) into (out of) the Ekman layer, which shows a positive (negative) wind stress curl.
The wind stress curl was calculated from the meridional and zonal wind stress using the mathematical formula adapted from [
44]. The wind stress curl was defined as follows:
where
and
represent the zonal and meridional components of wind stress.
and
can be calculated from Equation (2) adapted from [
45]:
where
= 1.22 kg m
−3 is the air density and
= 1.4 × 10
−3 is a dimensionless drag coefficient and
Vmag is the wind speed magnitude. The subscript x corresponds to the zonal components and the subscript y to the meridional.
The wind speed, on the other hand, was defined as follows:
whereby
U is the zonal wind component and
V is the meridional wind component.
2.3.2. Bias Calculation
Biases in climate models are characterized by differences in statistical distributions between the simulations and reference data. The calculation of bias is calculated by means of the following equation:
Hence in our case, the “Model” is the CORDEX-SEA product while the “Reference” is ERA5.
2.3.3. Upwelling Index
The upwelling index is a wind-based index used to measure the strength of upwelling occurrences. The first step of calculating the upwelling index is to calculate the Ekman transport. This can be calculated in terms of the wind speed,
by means of the following equation:
where
= 1.22 kg m
−3 is the air density,
= 1025 kg m
−3 is the sea water density,
= 1.4 × 10
−3 is a dimensionless drag coefficient and f is the Coriolis parameter defined as twice the vertical component of the Earth’s angular velocity, Ω, about the local vertical given by f = 2Ω sin (θ) at latitude θ. The subscript x corresponds to the zonal components and the subscript y to the meridional. The upwelling index (UI) can be calculated as the Ekman transport component in the direction perpendicular to the shoreline using the following formula:
where
φ is the angle of the unitary vector perpendicular to the shoreline pointing landwards. Positive (negative) UI values mean upwelling-favorable (-unfavorable) conditions.
In this study, the applicability of the CORDEX-SEA simulations in reproducing ECPM upwelling was assessed by using the CORDEX-SEA model simulated wind to calculate the UI at the ECPM and comparing these simulations with those of ERA5.
3. Results
3.1. Model Performance
Wind Speed Magnitude and Wind Stress Curl
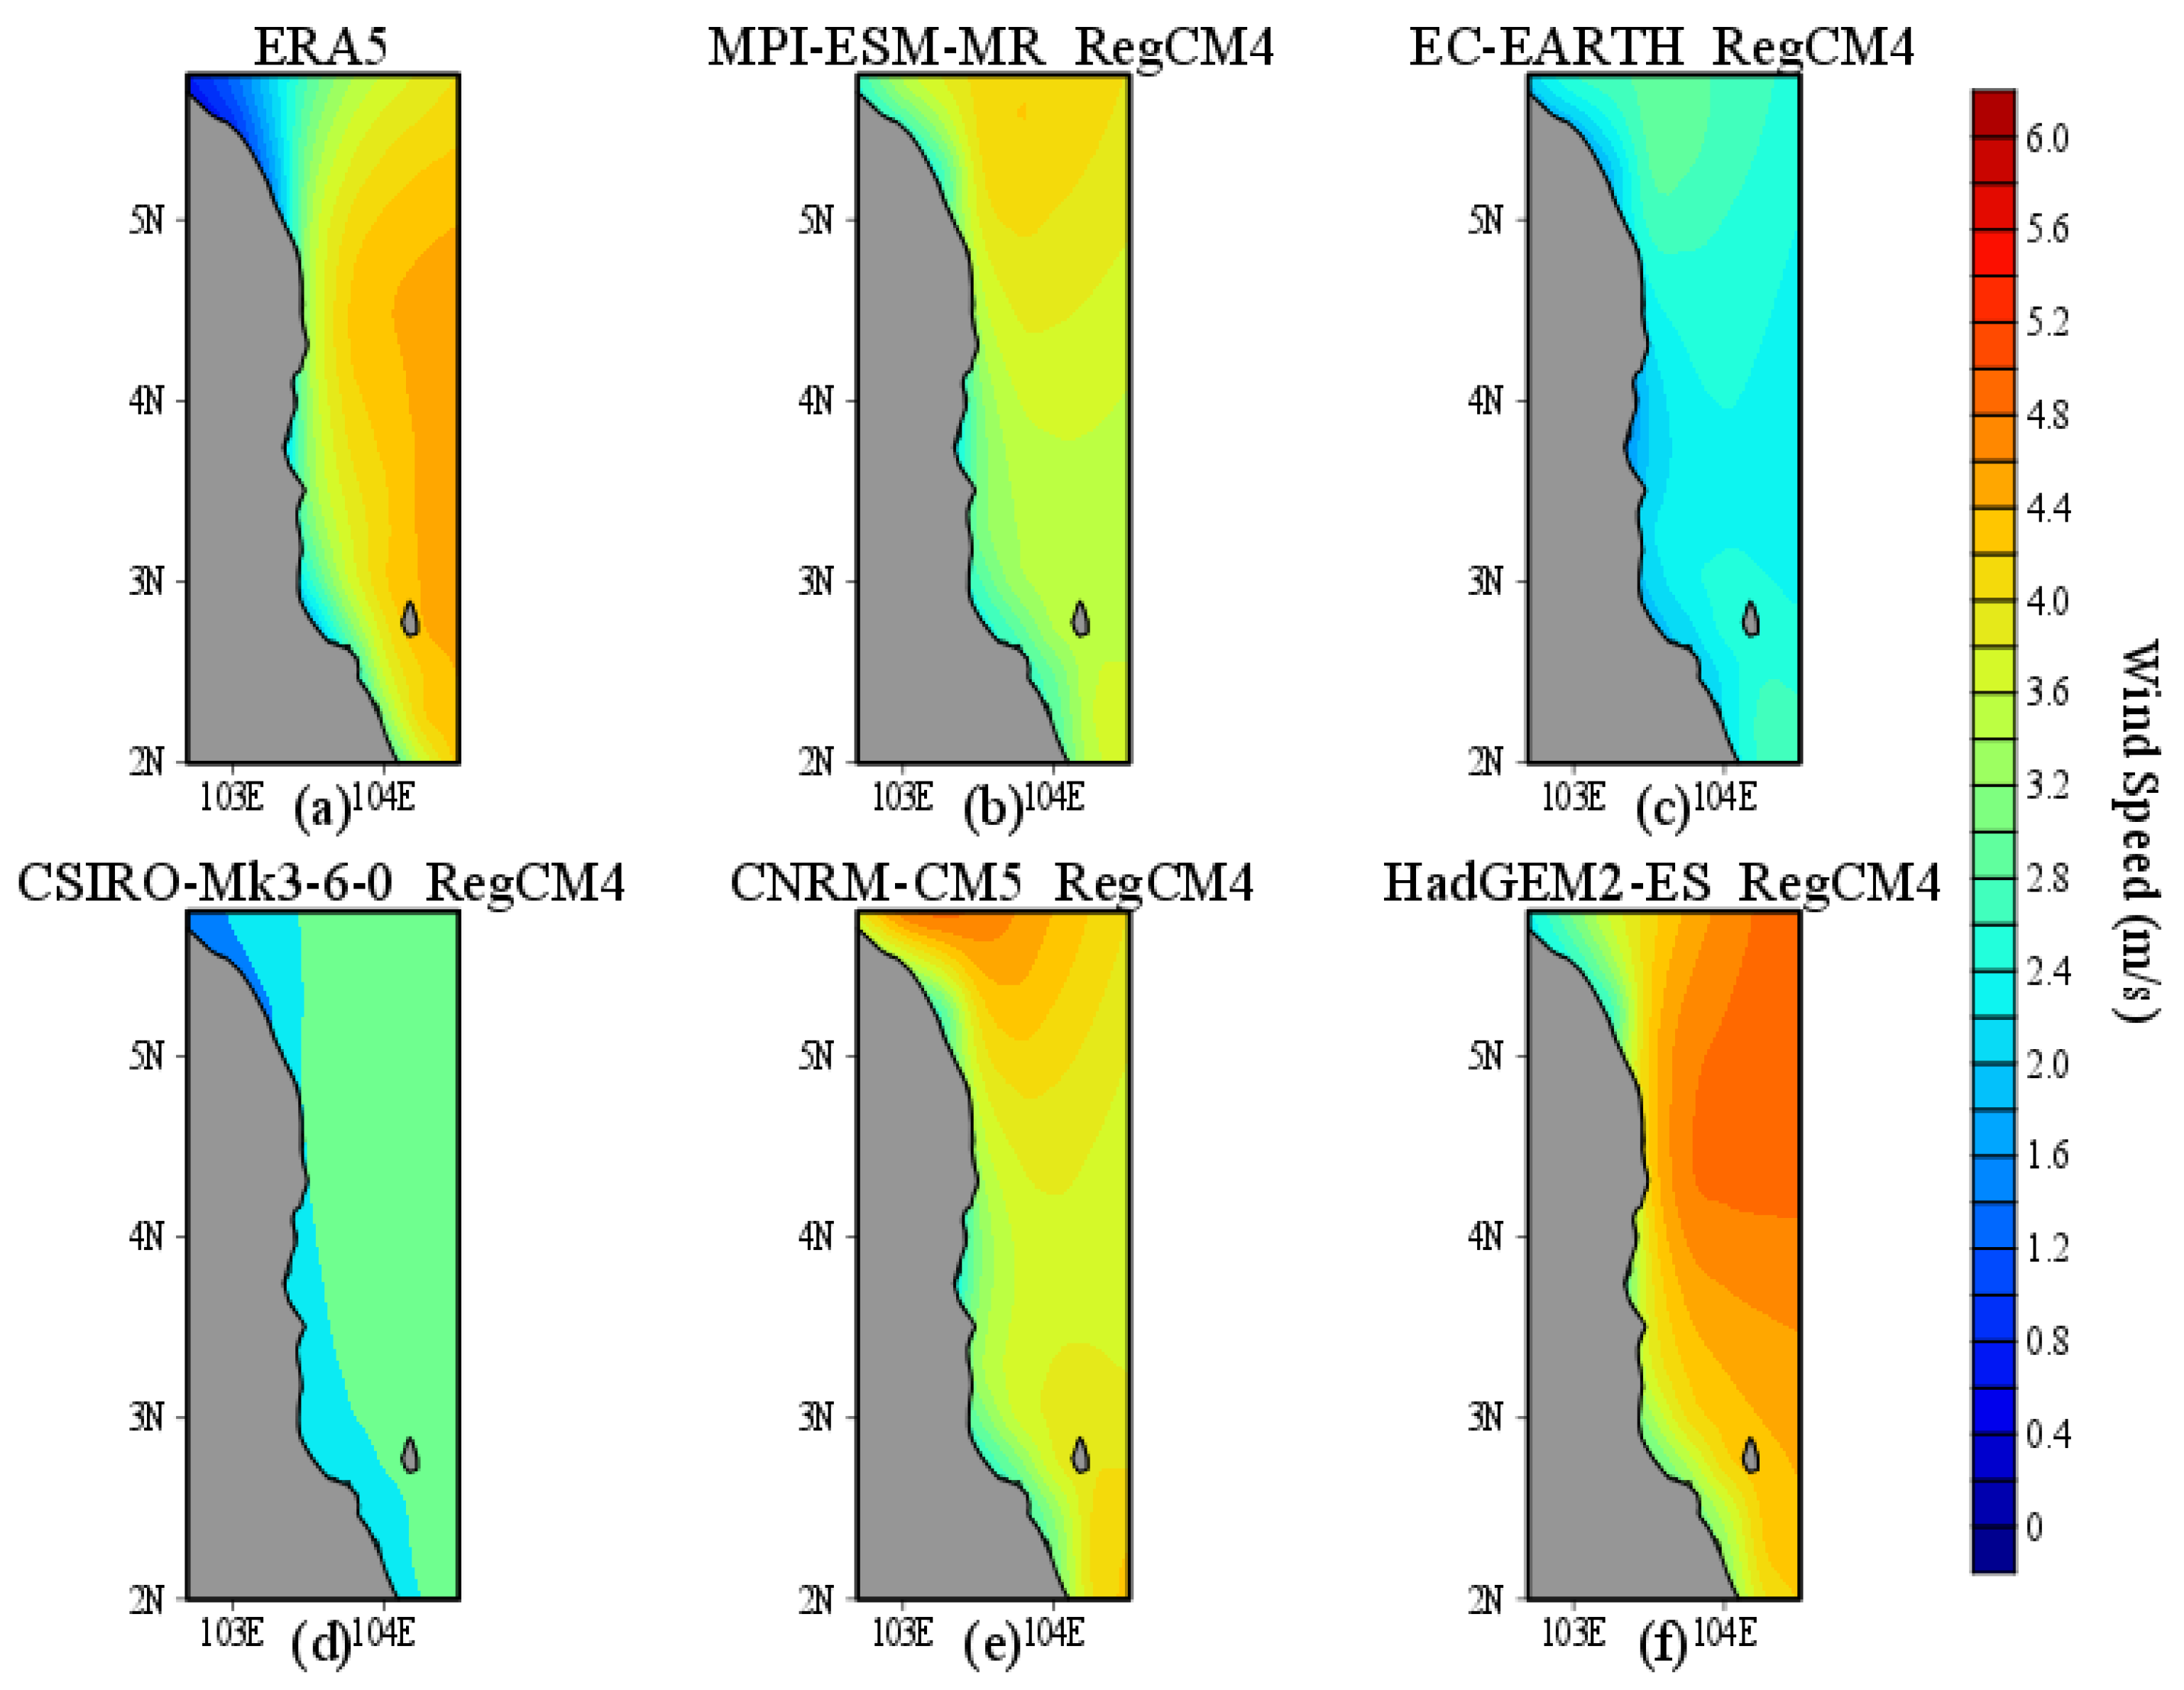
Figure 2 depicted the wind speed derived from ERA5 and the five CORDEX-SEA products. ERA5 shows increasing values of wind speed as it moves further offshore, with the highest wind speed being 4.5 m/s. The CORDEX-SEA products that show similar values to those of ERA5 are HadGEM2-ES(RegCM4), MPI-ESM-MR(RegCM4) and CNRM-CM5(RegCM4), although the locations of the wind speed peaks in the offshore region are very different to those in ERA5. Meanwhile, EC-EARTH(RegCM4) and CSIRO-Mk3-6-0(RegCM4) underestimated the value of offshore wind, producing a simulated highest wind speed of around 3–3.5 m/s.
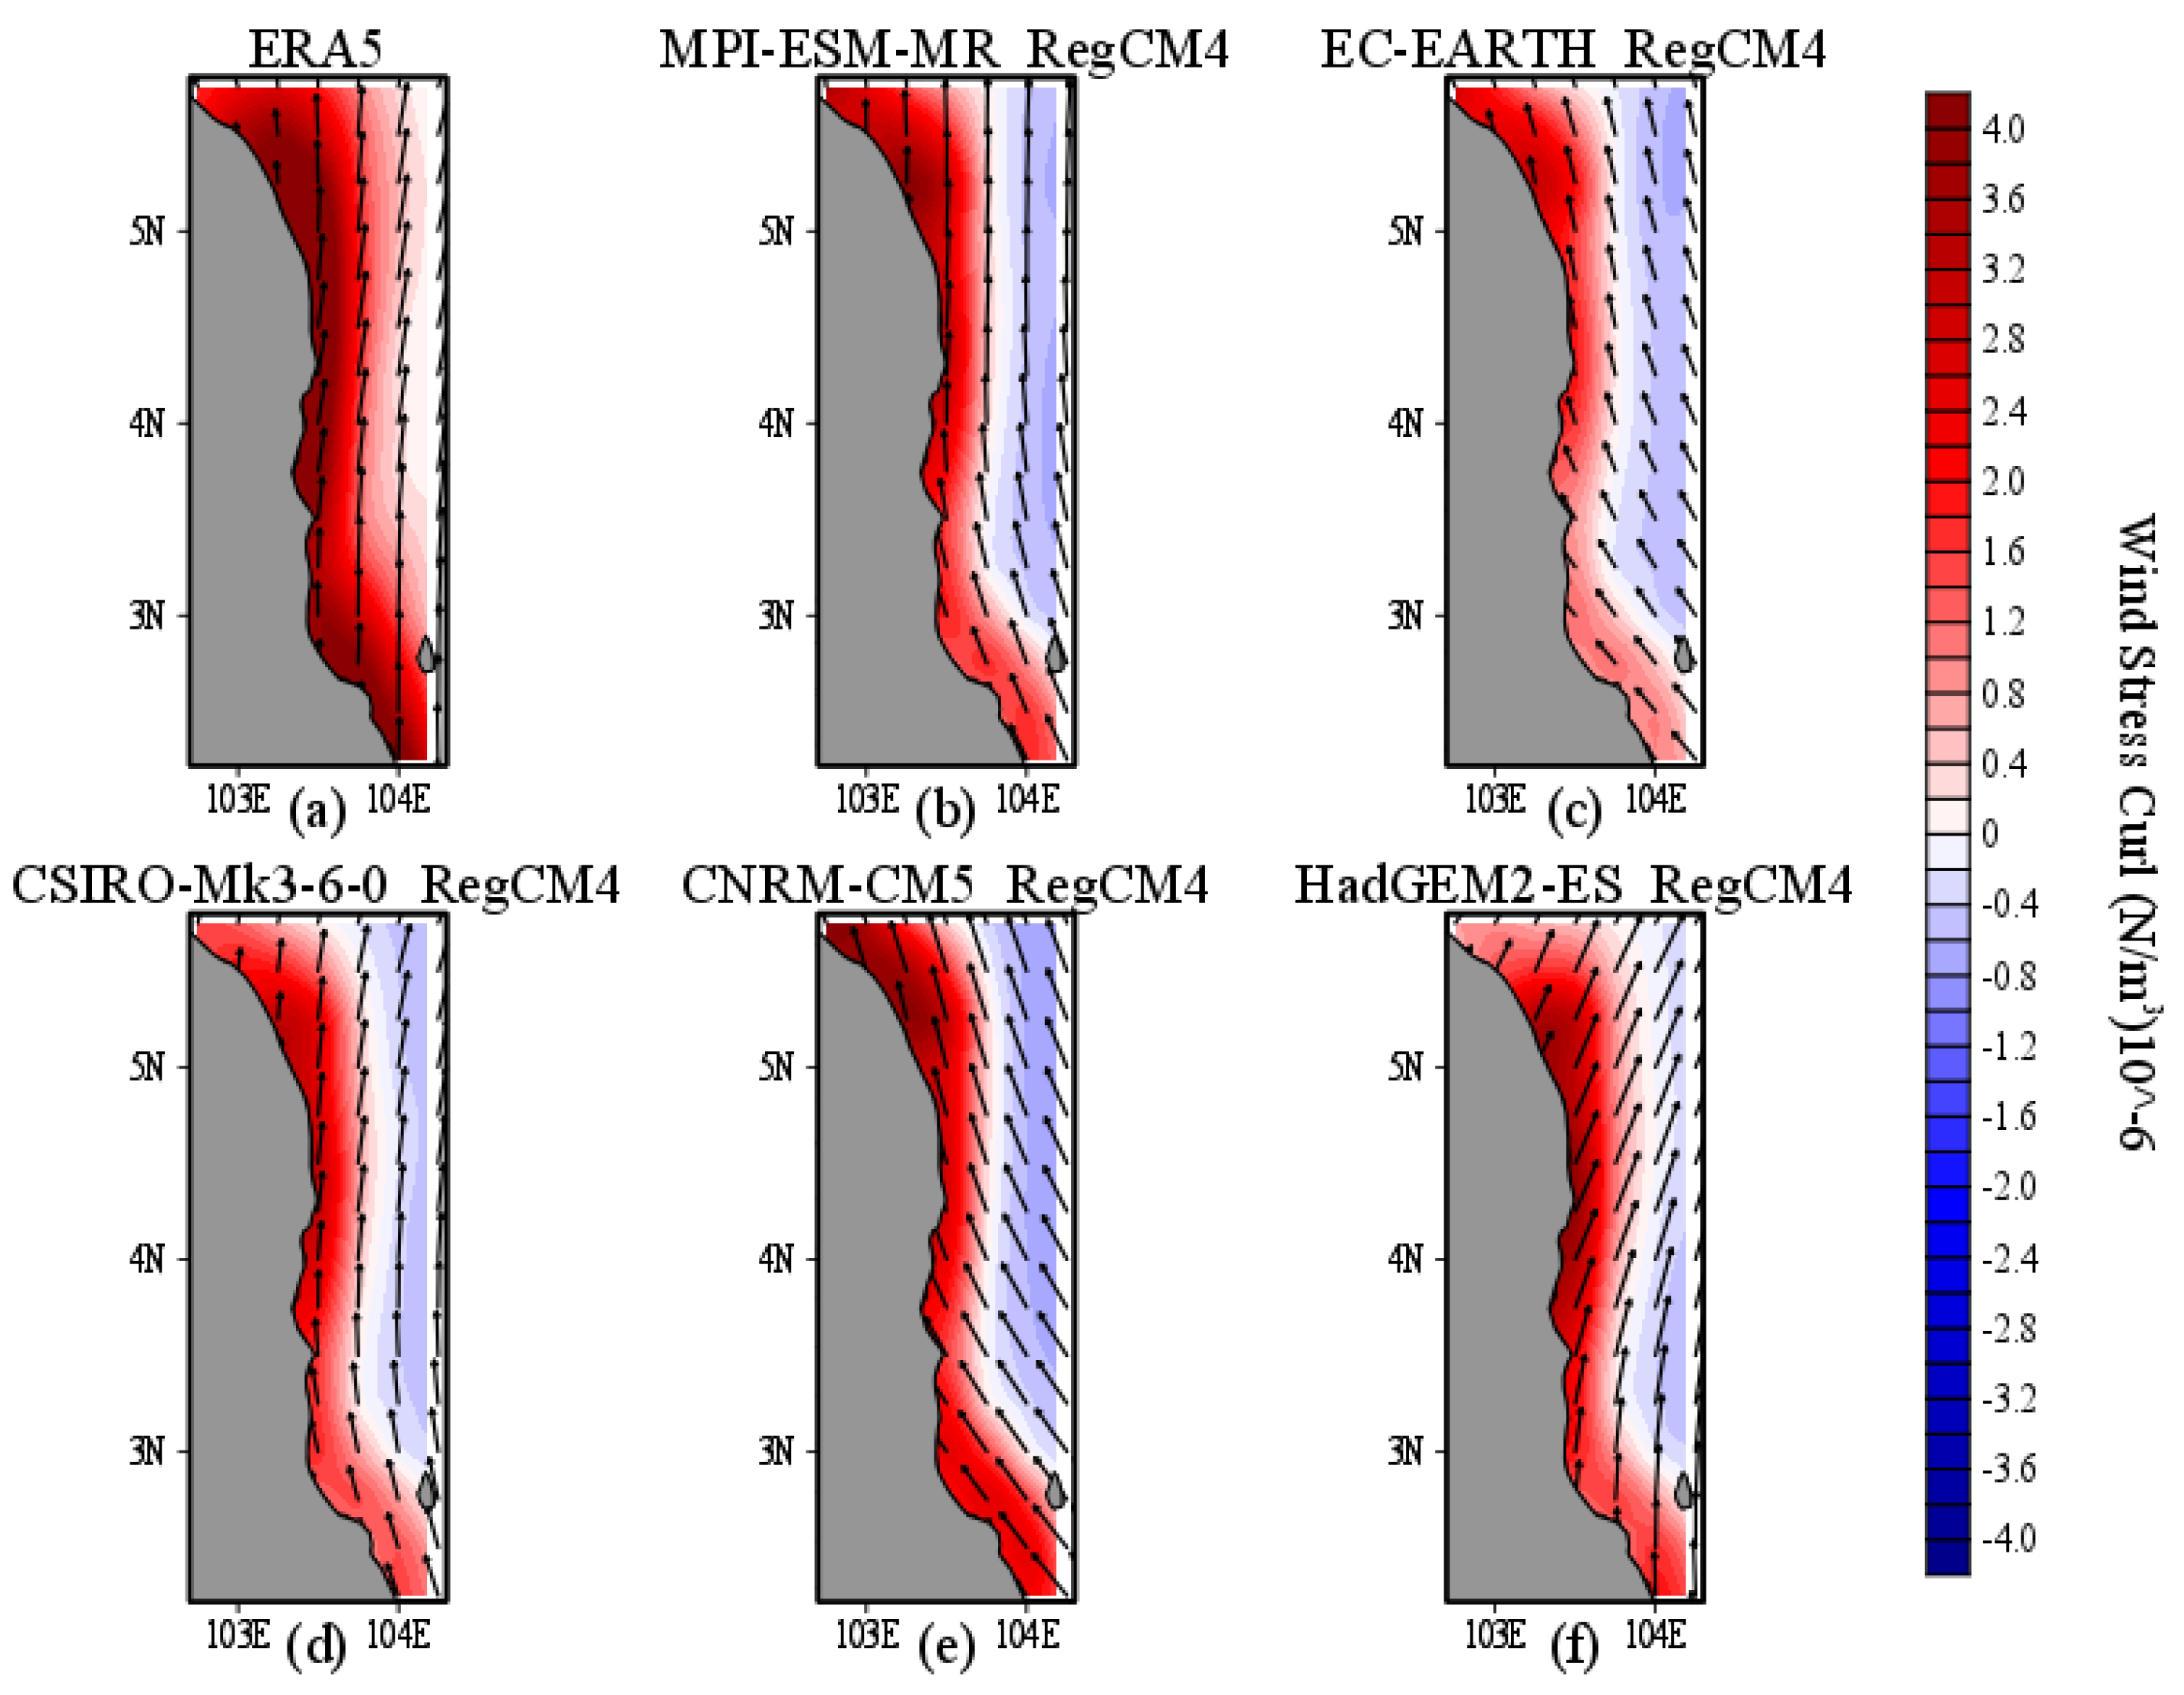
Figure 3 depicts the wind direction and wind stress curl during JJA as derived from the five CORDEX-SEA products and ERA5 during JJA from 1980–2005. In general, southwesterly winds persisted over the ECPM, and these were dominated by the meridional component; these winds ran nearly parallel to the coastline. According to Ekman [
46] theory, a wind configuration approximately parallel to the coastline of the ECPM is conducive to upwelling because it generates a net transport of water to the right of the wind direction in the Northern Hemisphere under the effect of the Coriolis force. Furthermore, the ECPM was dominated by positive wind stress curl. Positive wind stress curl promotes ocean surface divergence and forces water upward, contributing to upwelling [
47,
48,
49]. Positive wind stress caused the offshore component of Ekman transport to increase seaward, resulting in ocean surface divergence, forcing the upward movement of water, which causes upwelling, whereas negative wind stress curl caused the offshore component of Ekman transport to decrease seaward, resulting in surface convergence, forcing the downward movement of water, which causes downwelling [
47,
48,
49].
As can be seen in
Figure 3, the positive wind stress curl measured by ERA5 at the ECPM was relatively even. Meanwhile, the positive wind stress curl estimated by the CORDEX-SEA products varied spatially, with a higher value (3–4 N/m
3) in the north and a lower value (0–2 N/m
3) in the south. Furthermore, when compared to ERA5, the CORDEX-SEA products underestimated the positive wind stress curl in general.
However, there seem to be some areas that showed similar values to ERA5, such as MPI-ESM-MR(RegCM4), CNRM-CM5(RegCM4) and HadGEM2-ES(RegCM4), which showed a higher positive wind stress curl at the northern and middle coasts of the ECPM. Nevertheless, even though the values varied spatially compared to ERA5, the CORDEX-SEA products were able to show a positive wind stress curl along the study area. In terms of wind direction, we can observe that only MPI-ESM-MR(RegCM4) and CSIRO-Mk3-6-0(RegCM4) were able to accurately show the same wind direction as ERA5. Meanwhile, the other products showed deviation, with EC-EARTH(RegCM4) and CNRM-CM5(RegCM4) deviating easterly and HadGEM2-ES deviating westerly, and the wind configuration was not parallel to the coastline.
Although all of the CORDEX-SEA products were able to simulate both wind speed and wind stress curl close to ERA5, it was still unclear how much the CORDEX-SEA products differed from ERA5 and how good the CORDEX-SEA products technically are. Consequently, quantitative comparison (bias) and statistical analysis were undertaken to investigate the reliability of the CORDEX-SEA products.
3.2. Model Bias
Model bias was an important metric to consider before selecting or implementing climate projections in the present study because bias is one indicator of a projection’s quality. A model with large biases indicates large errors. In this section, the bias was calculated for four terms: the zonal wind component (U), meridional wind component (V), wind speed and wind stress curl.
Figure 4 and
Figure 5 depict the bias for the zonal and meridional winds component against ERA5 respectively.
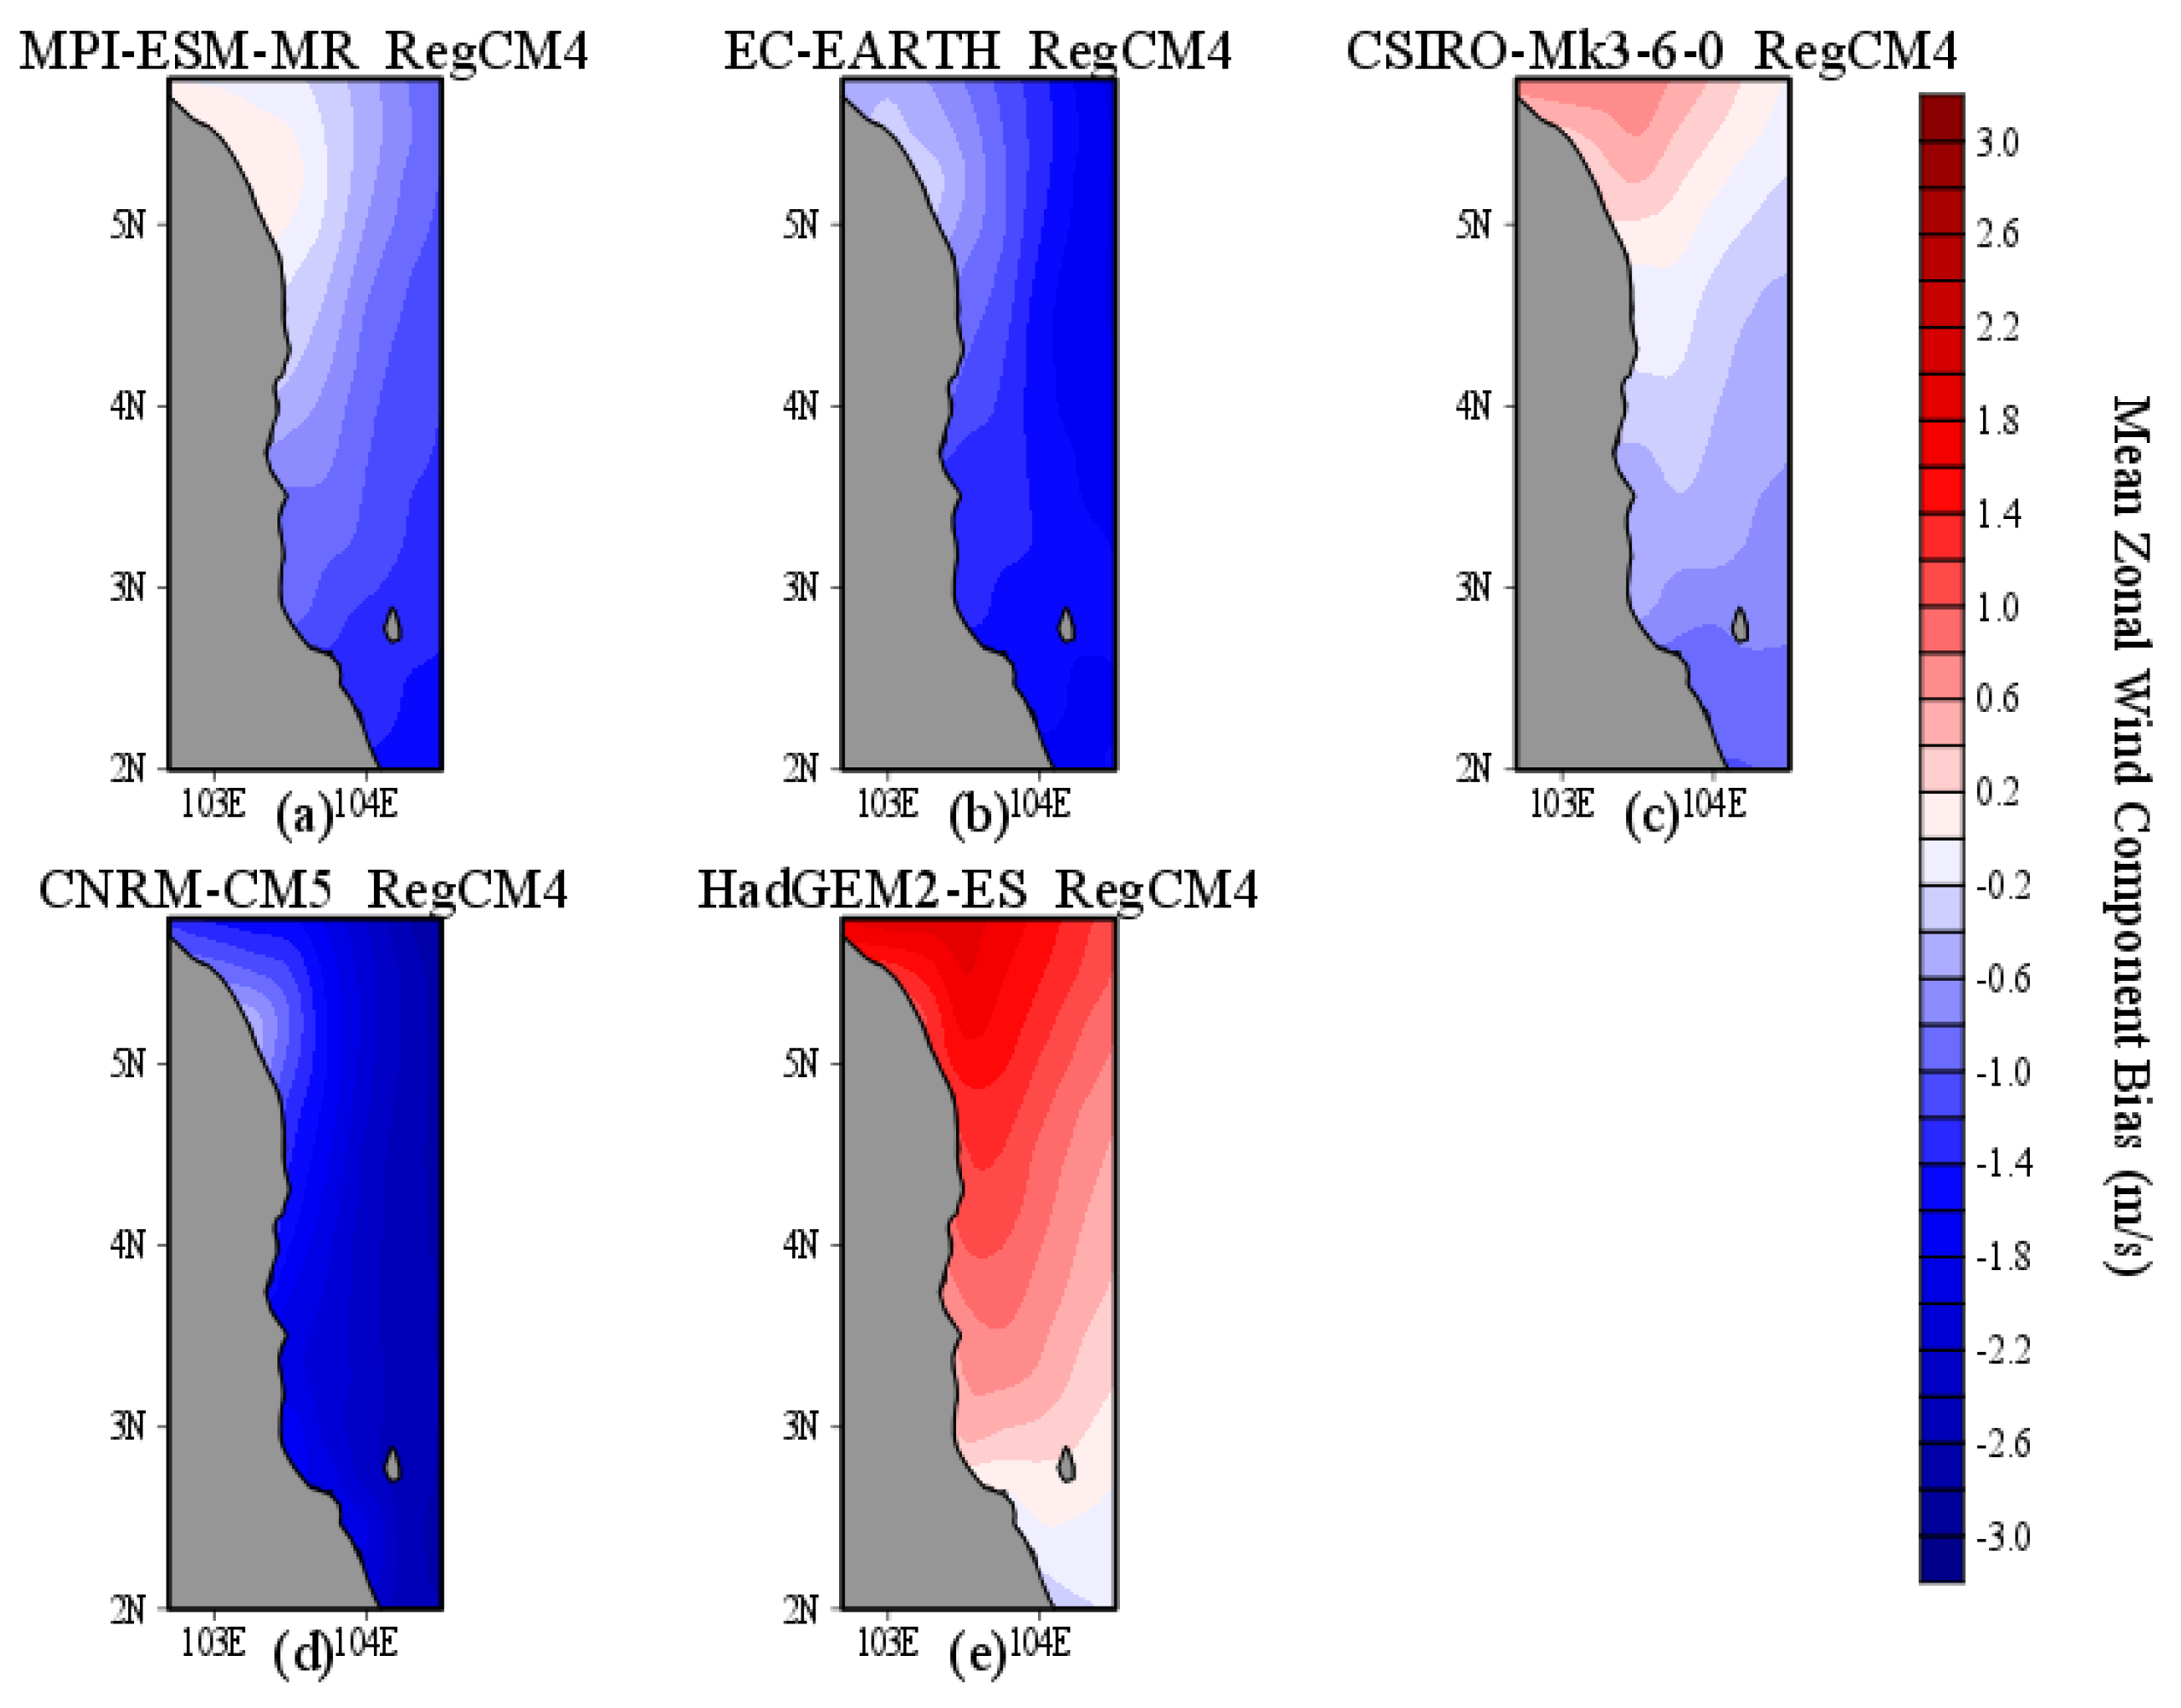
It is important to know the bias of the wind component because the wind component is the main contributor in calculating the wind stress curl and wind speed. Based on
Figure 4, it can be observed that most of the products depicted had a negative bias, with the greatest negative value for bias being shown by CNRM-CM5(RegCM4), which was −3 m/s for zonal wind components. Meanwhile, only HadGEM2-ES(RegCM4) showed a positive bias, approximately 0.5–2 m/s, in most of the areas of interest. Overall, all of the products produced an underestimation of the zonal (U) wind component, except for HadGEM2-ES, which had a slightly higher value when compared to ERA5.
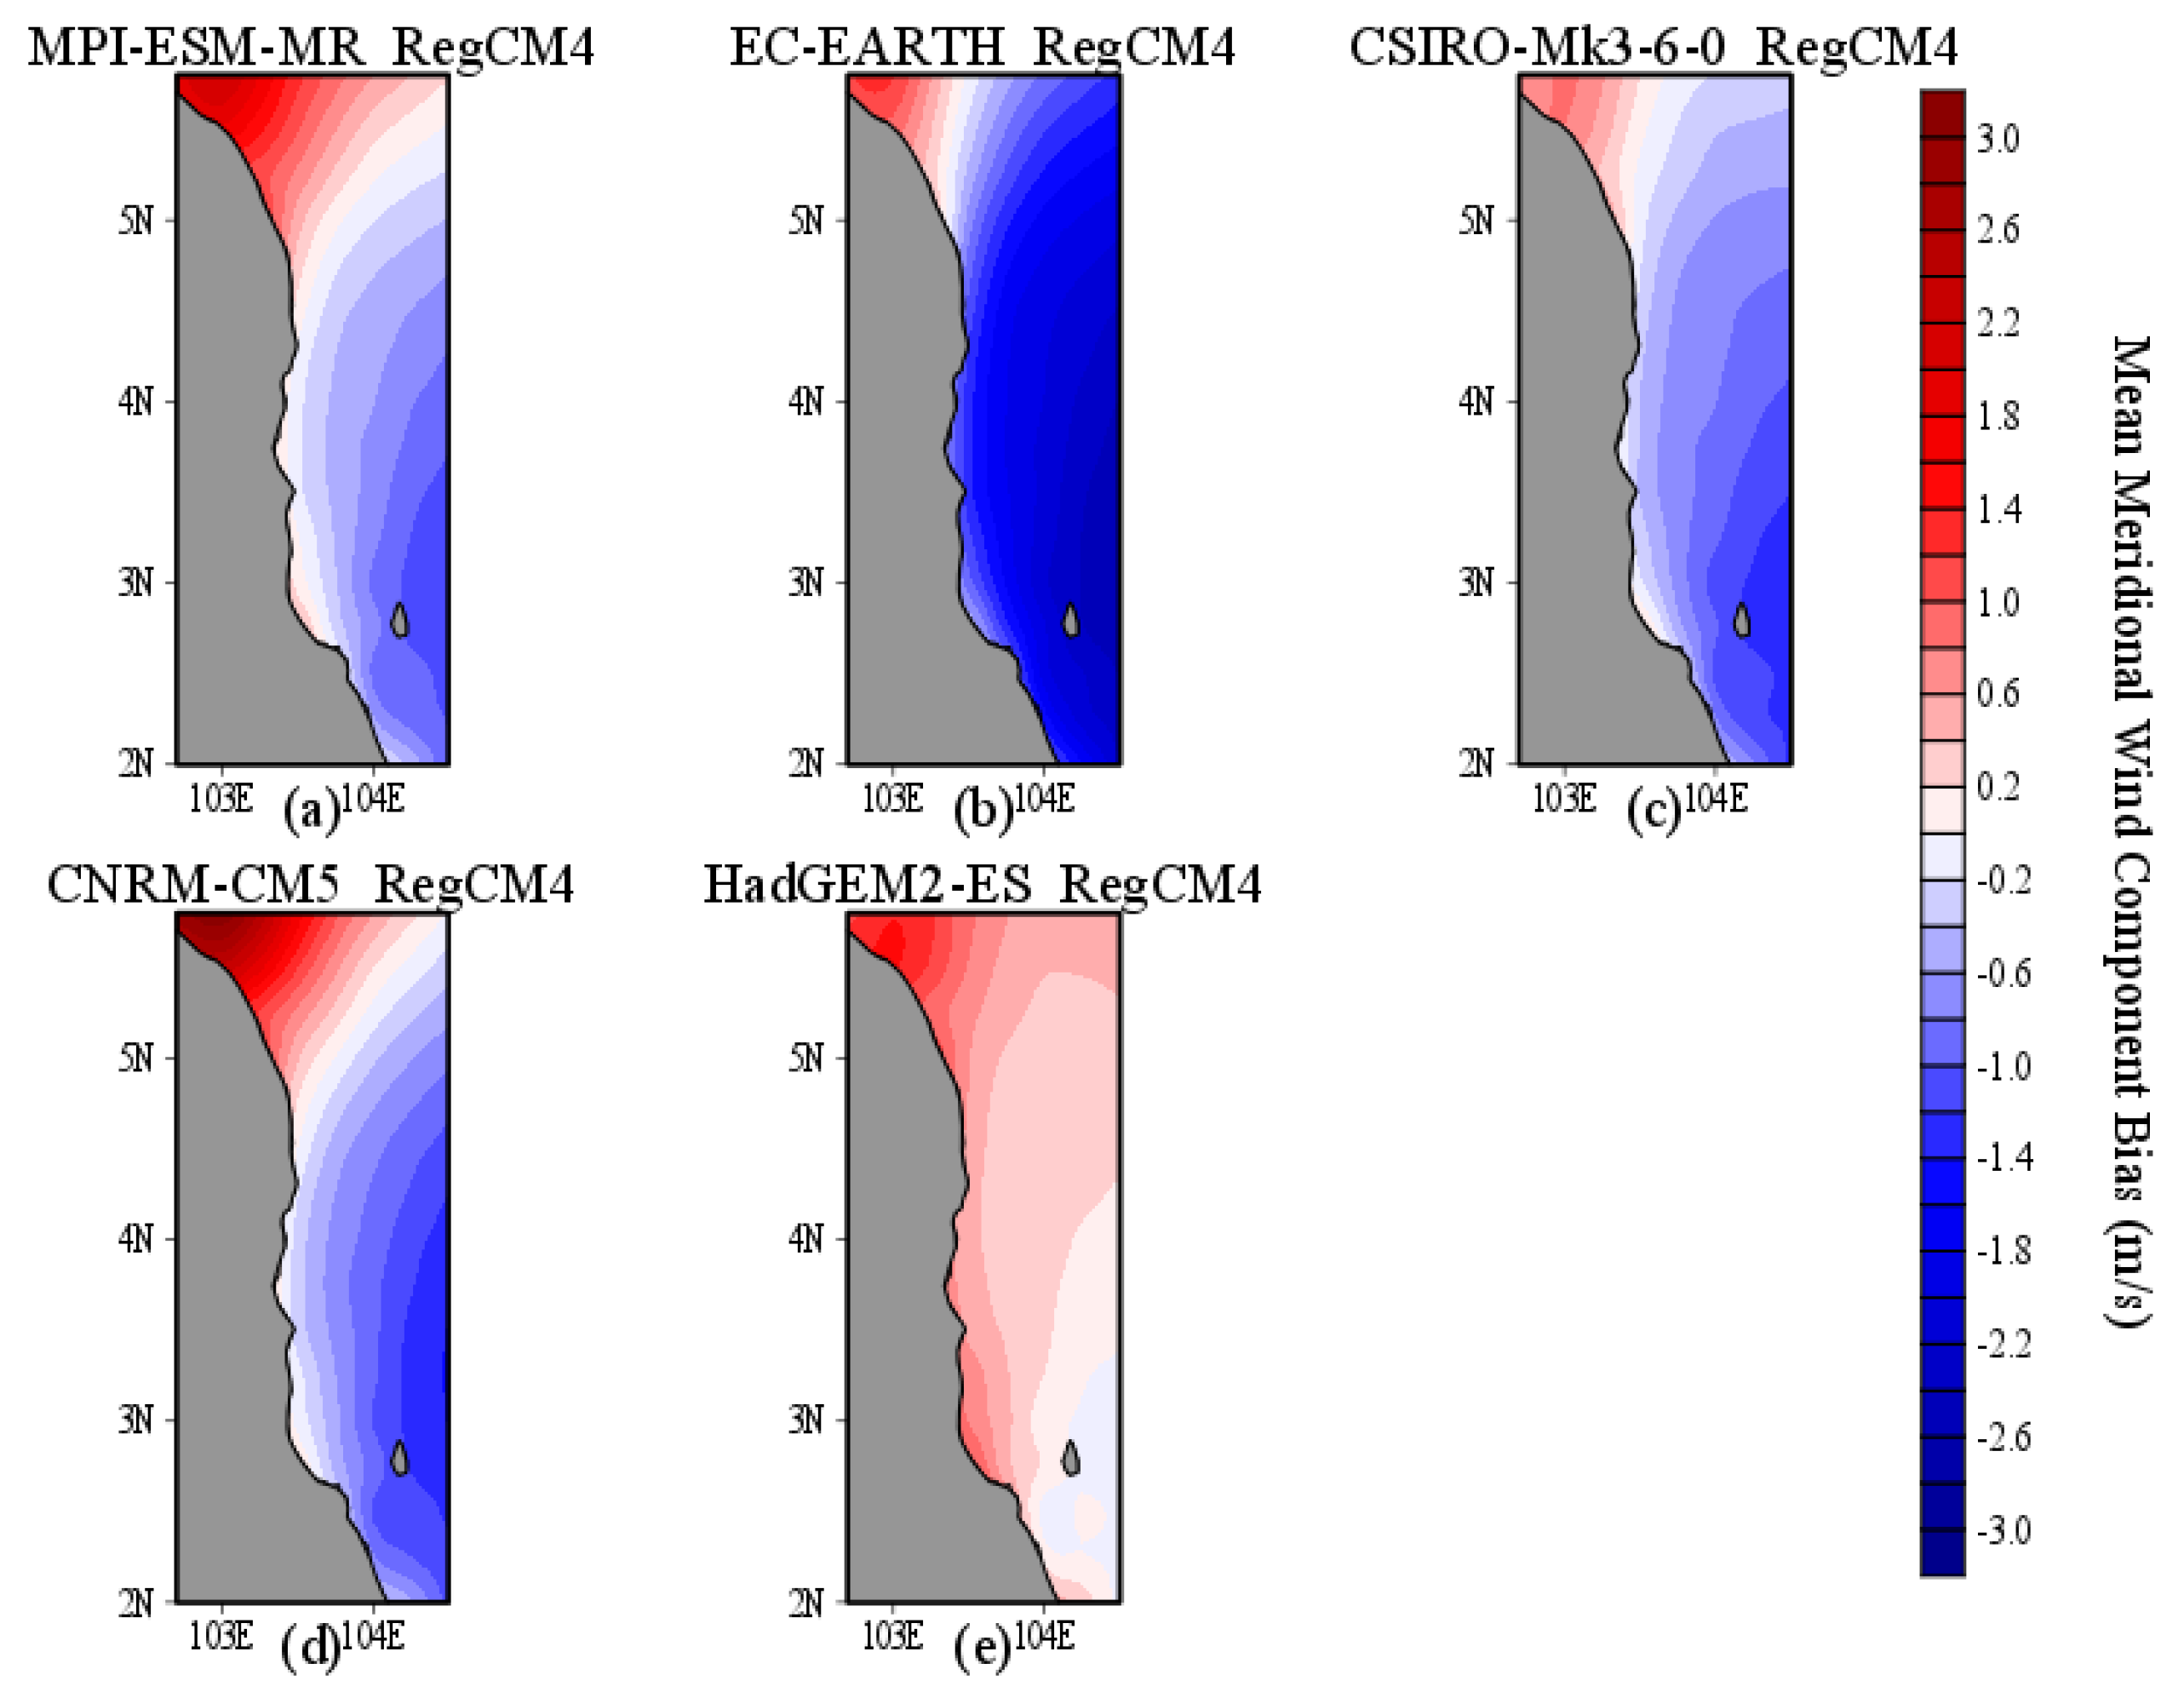
Simultaneously, based on
Figure 5, it can be observed that most of the CORDEX-SEA products showed a variety of biases in terms of the meridional wind component. Most of the CORDEX-SEA products showed a positive bias (0.5–2.5 m/s) in the northern part of the study area. However, overall, these products resulted in an underestimation, with the greatest underestimation shown by EC-EARTH(RegCM4), which was −3 m/s. Thus, most of the CORDEX-SEA products exhibited a negative bias for both zonal and meridional wind components. The CORDEX-SEA products could therefore be expected to produce lower wind speed and wind stress curl values when compared to ERA5. Thus, the bias of the wind speed and wind stress curl were further examined to test this expectation.
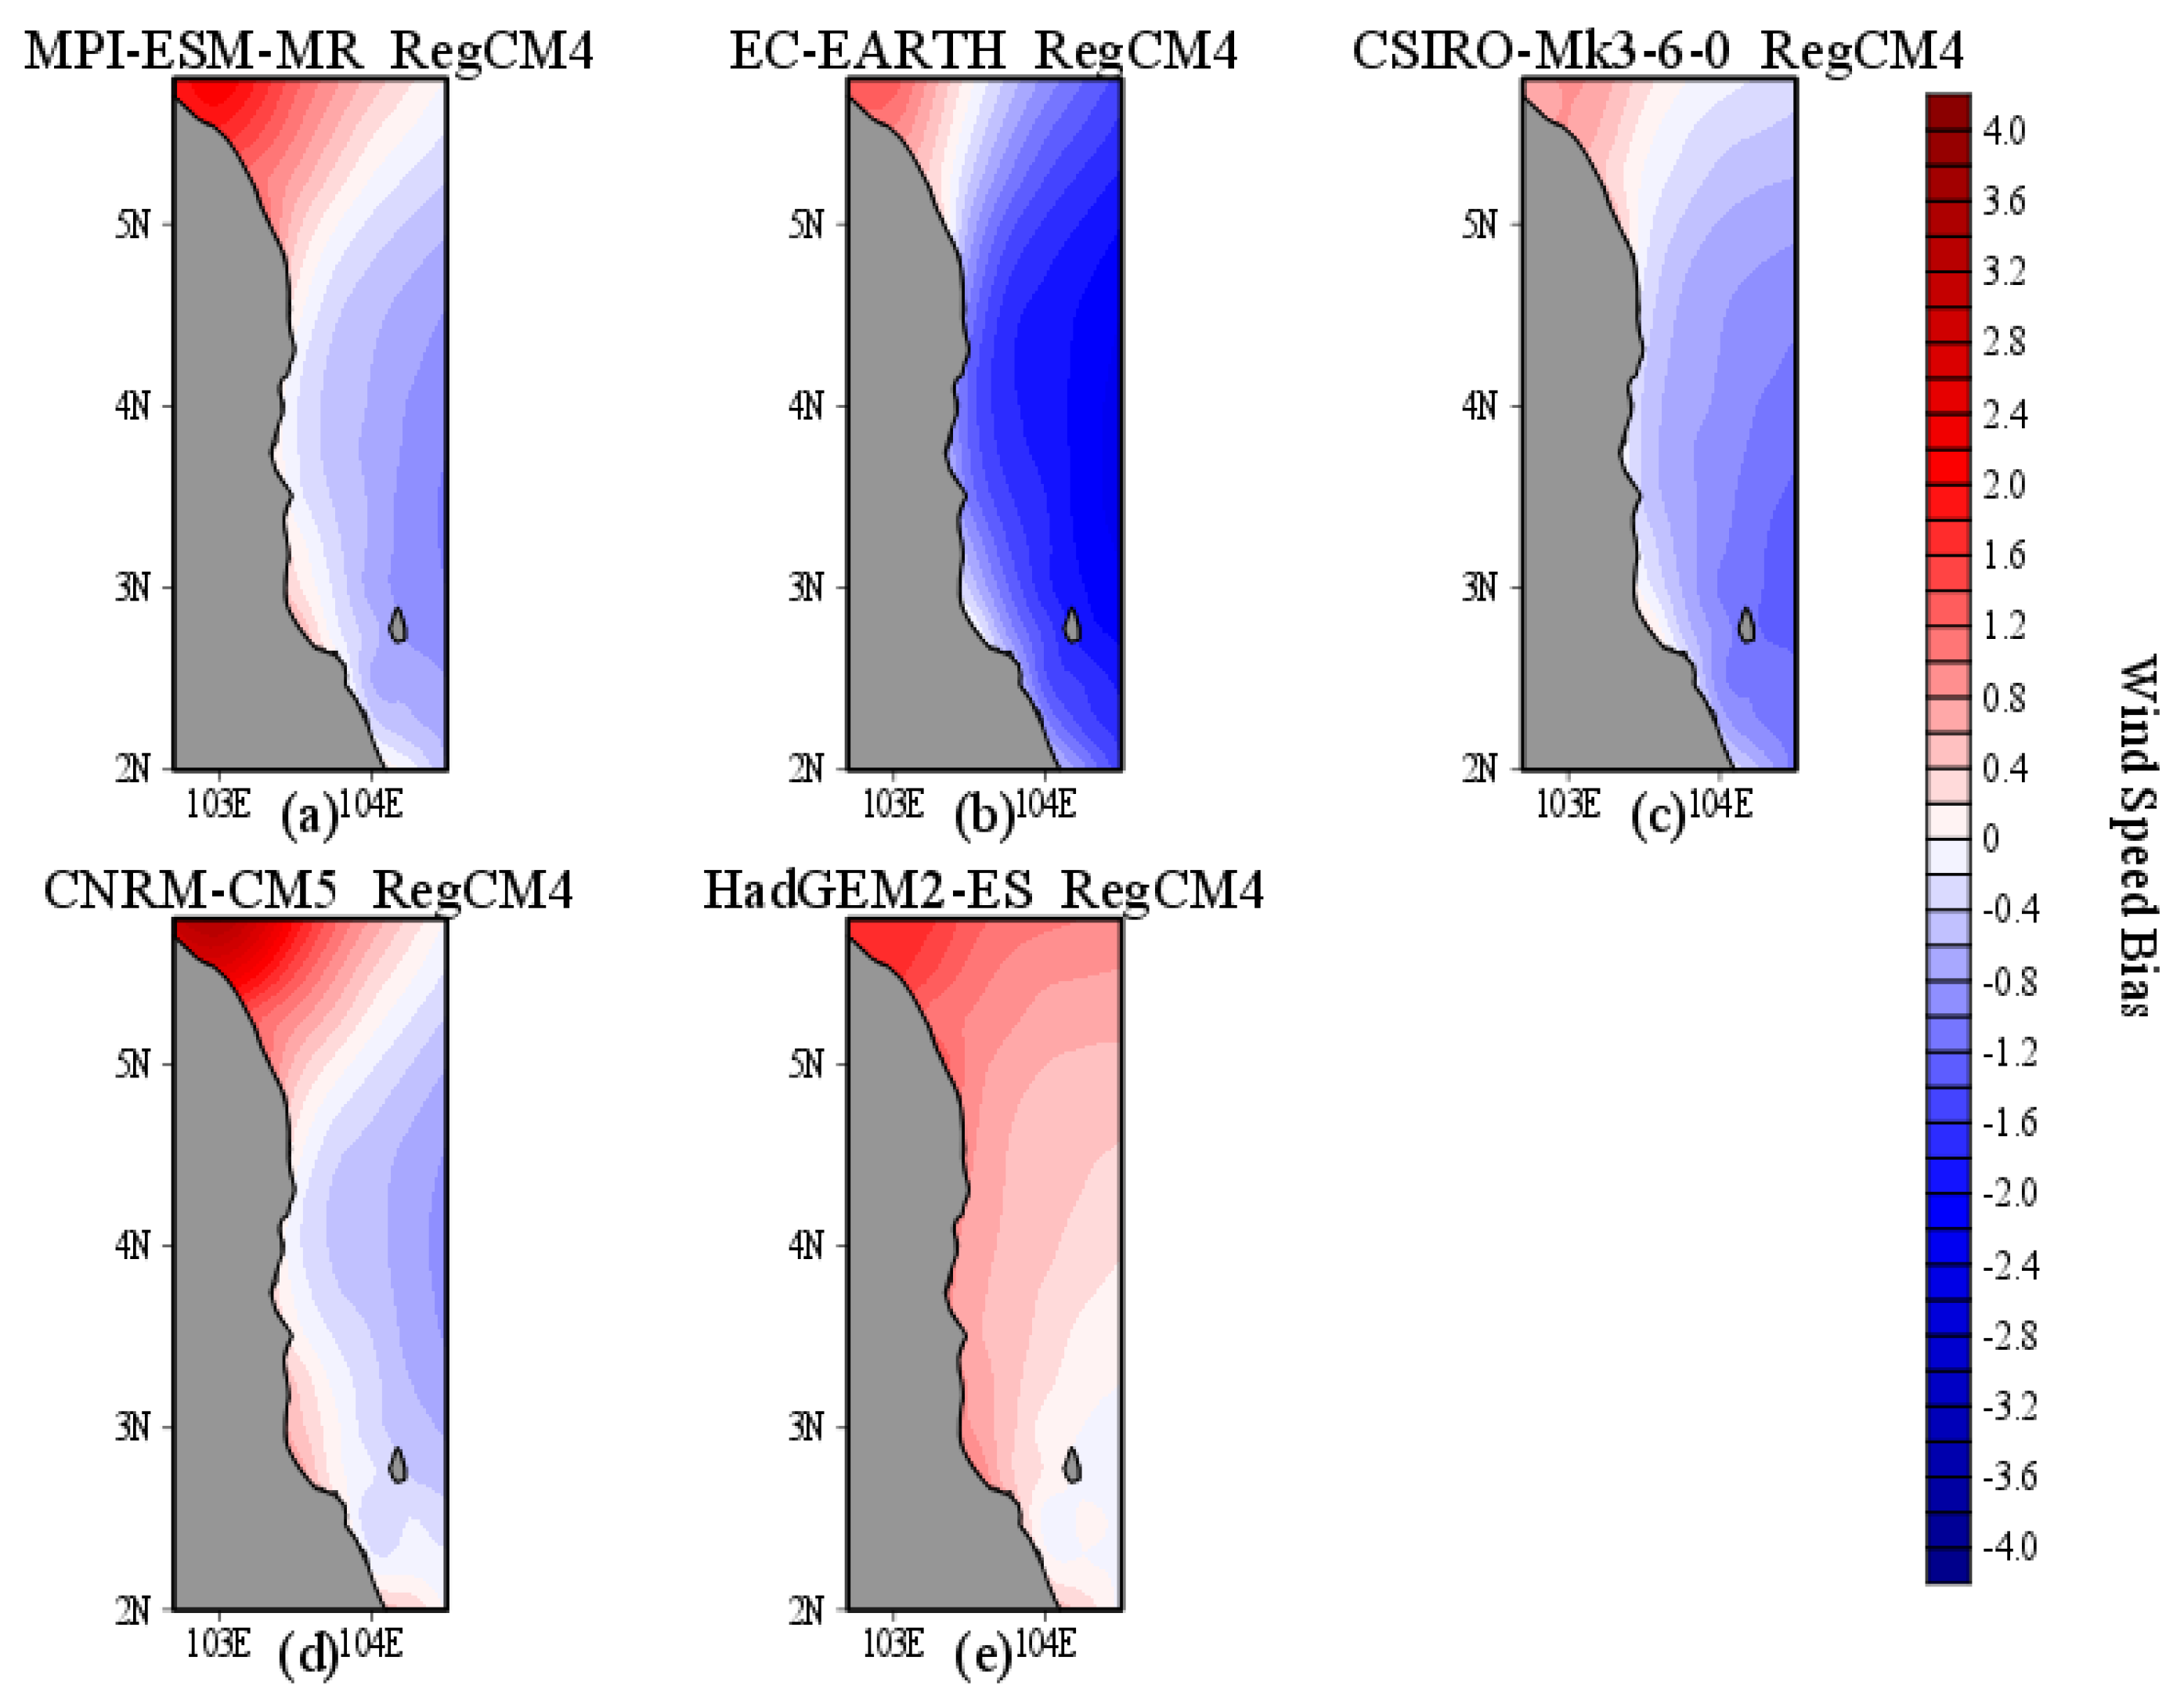
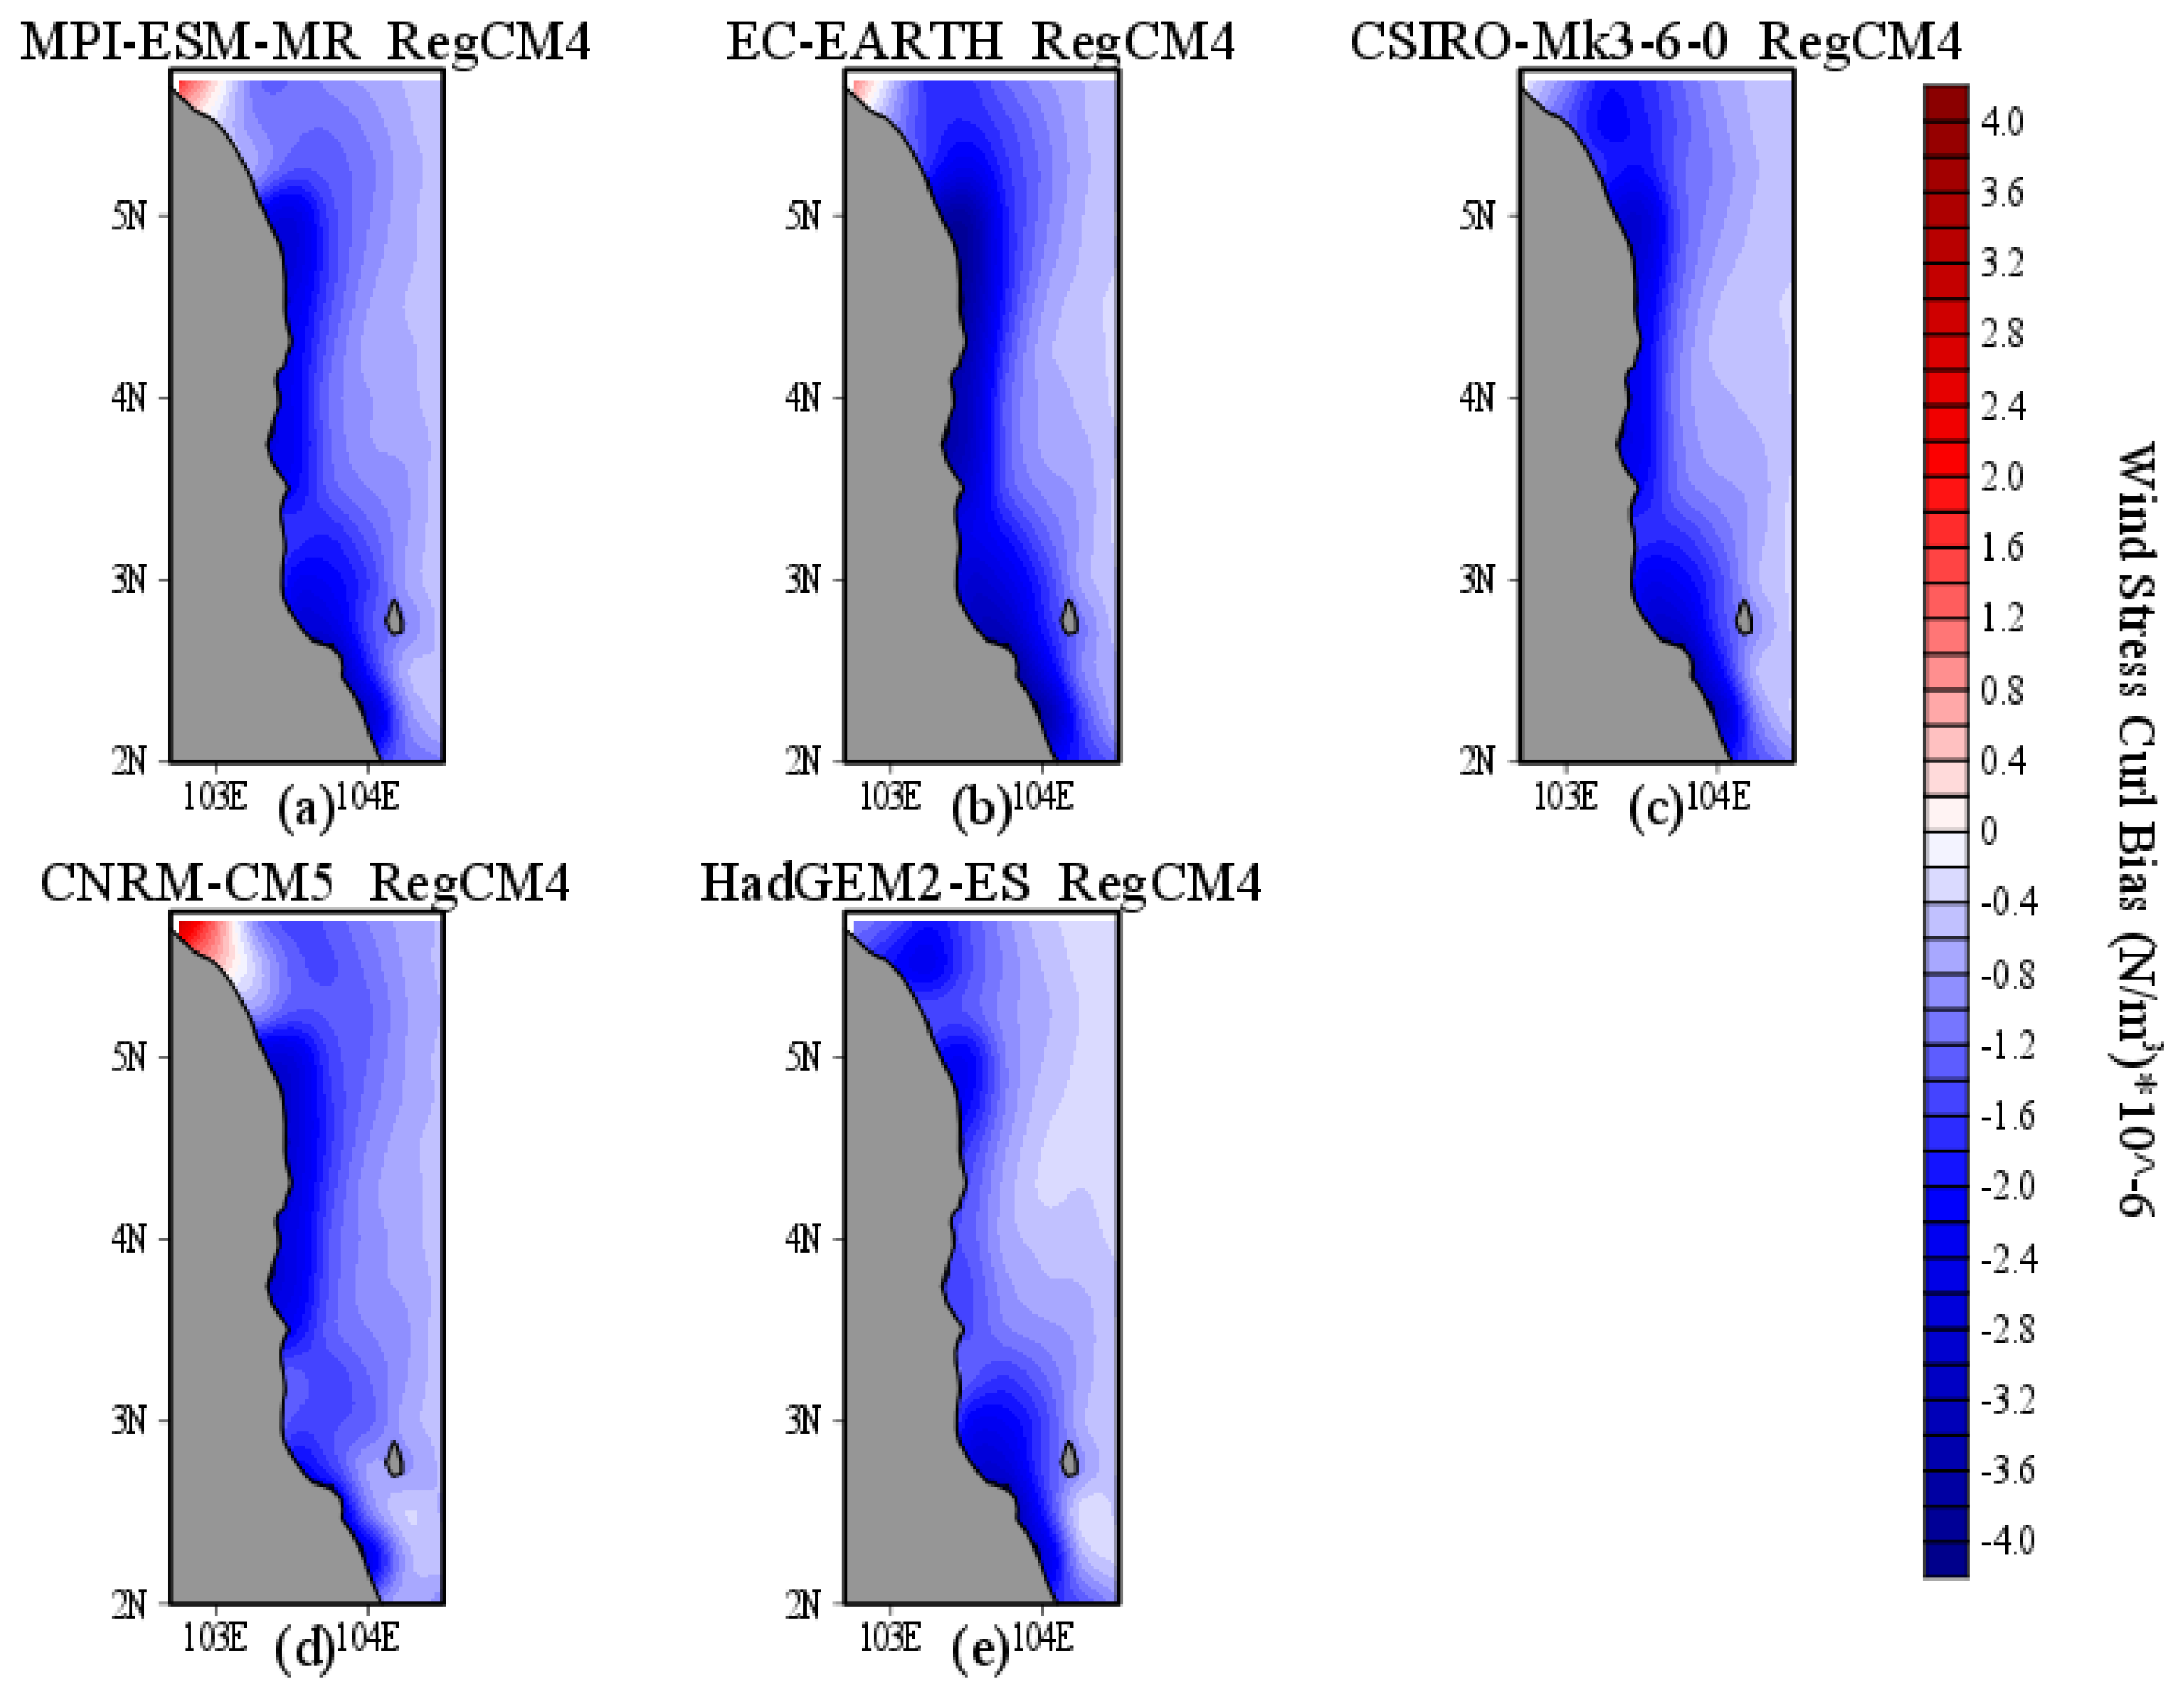
Based on
Figure 6, it can be observed that most of the wind speed biases showed an underestimation (0 to −3 m/s) with the underestimation seeming to increase as the location moved away from the coastal area into the ocean. Meanwhile, based on
Figure 7 which depict the wind stress curl, the CORDEX-SEA products showed an underestimation of the value (0.5 to 4 N/m
3) along the ECPM. This was in line with our previous statement that the bias of the zonal and meridional wind components also directly affected the wind stress and wind stress curl value. Based on the input, it can be seen that, although the CORDEX-SEA products exhibited biases, the bias values compared to ERA5 were quite small. Furthermore, when the wind speed and wind stress curl were examined, they showed similar tendencies to ERA5.
The CORDEX-SEA product biases might be due to the following: (i) The lack of summer air–sea interactions in the model may have resulted in enhanced oceanic forcing over the regions [
26], leading to an underestimation of wind speeds on the ocean grid during the southwest monsoon, which would in turn result in stronger atmospheric forcing of the land surface processes compared to those of ERA5; (ii) The simulations may have been influenced by the existence of a cold bias within the CORDEX-SEA products, which is associated with contributions from the radiative and surface fluxes, which in turn cause more cloud cover within the model, contributing to lower surface temperatures [
28]; (iii) The parametrization for the CORDEX-SEA might also be the cause of the current bias. The CORDEX-SEA product uses the convection scheme of Emanuel and Zivkovic-Rothman [
50] and the Land surface scheme Biosphere–Atmosphere Transfer Scheme version 1e (BATS1e) [
51]. This has been analyzed by Tangang (2020) [
29] and explained in (Cruz et al. 2017; Chung et al.) [
27,
52], whose authors state that the combination of these two parameterization schemes would produce a higher rate of cloud cover and an increase in rainfall compared to usual levels. This might be the cause of the underestimation that can be seen on the ocean grid for the CORDEX-SEA product.
Thus, all of the CORDEX-SEA products showed bias in all of the variables tested, a finding that provides important information as to the difference between the CORDEX-SEA products and ERA5 and the extent of these biases. However, bias should not be the only metric that is used to determine model credibility. For this reason, a Taylor’s diagram was plotted to graphically summarize how close a set of patterns match the reference data.
3.3. Taylor’s Diagram
Taylor’s diagram, as proposed by [
53], is a way of plotting on a 2-D graph using three statistics to indicate how closely a pattern matches the reference data. Statistical measures of correspondence between the modelled and observed fields provide a practical method for objectively assessing and summarizing the abilities of a model. The Taylor’s diagram indicates the baseline observed point where the correlation is 1 and the RMSD is 0 (Black Dot). If the simulation point is close to the observed point, it means that both the model and reference data are highly similar.
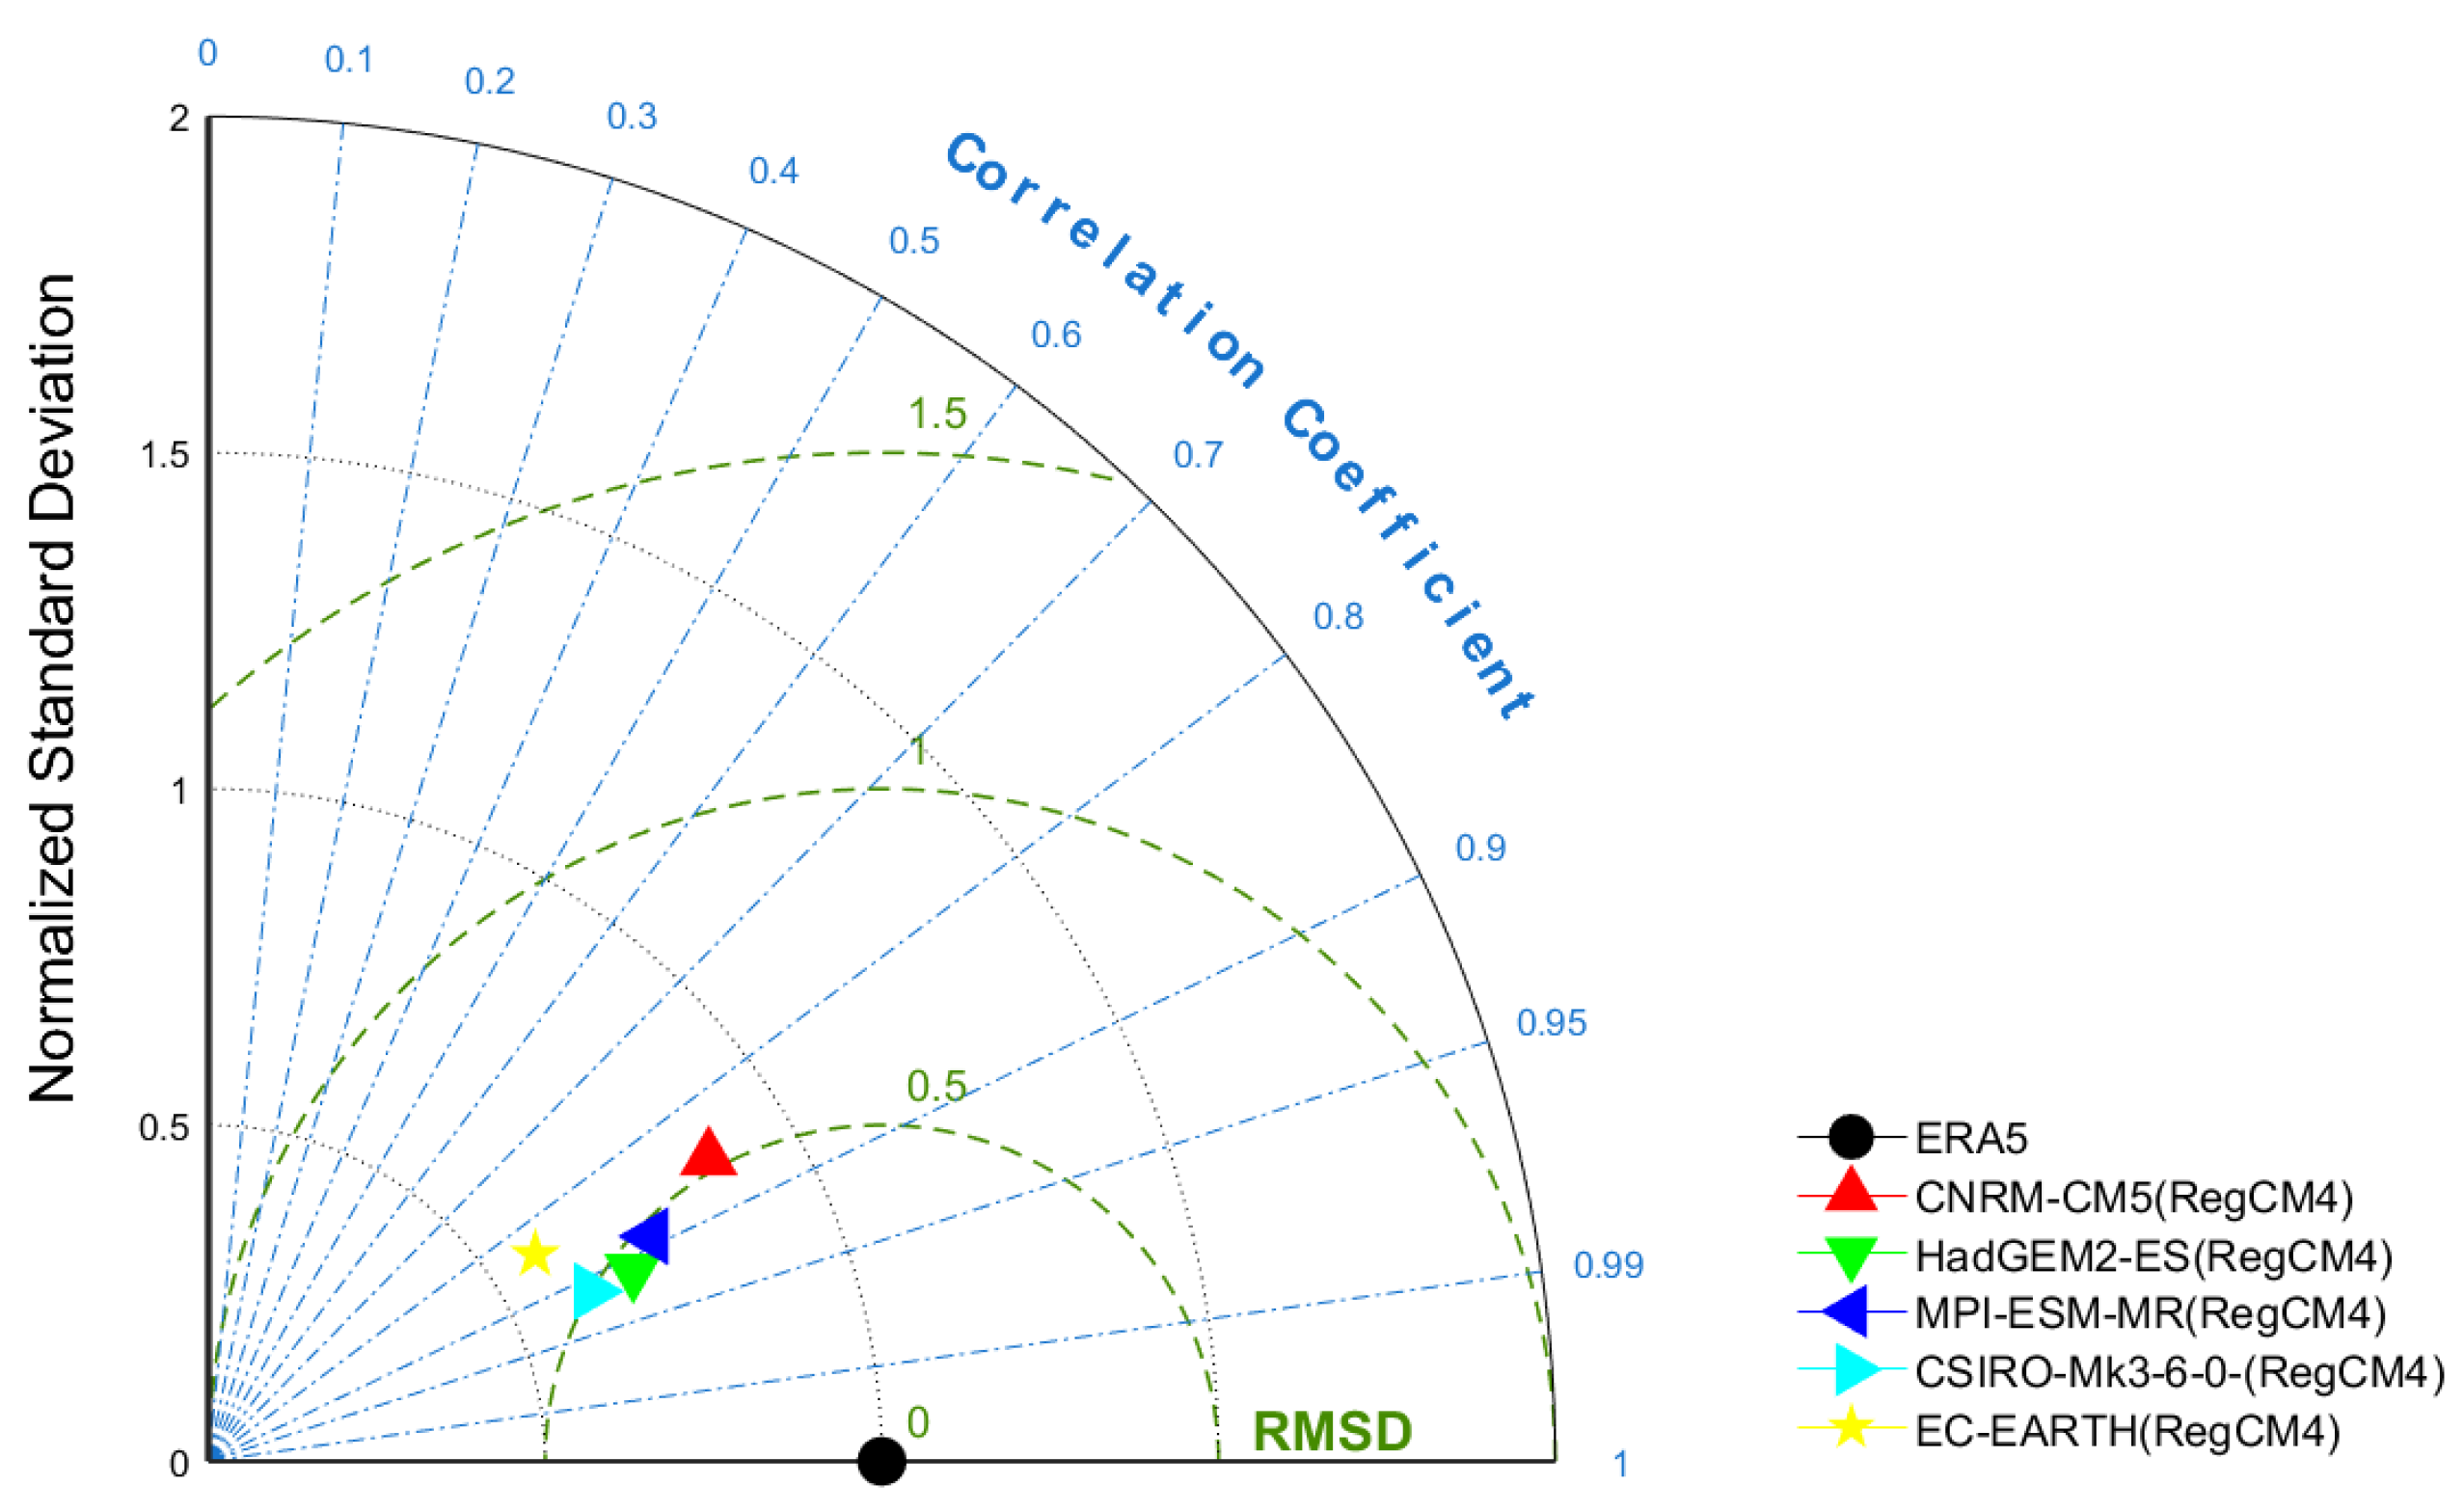
Figure 8 depicts the Taylor’s diagrams constructed for wind speed. In terms of wind speed, it can be observed that all the CORDEX-SEA models were generally able to reproduce the spatial pattern of the wind speed relatively well, with a spatial correlation coefficient >0.6 and RMSD below 1. However, it should also be noted that the CORDEX-SEA models show relatively large variations in terms of their performance. From the Taylor’s diagram, it can be observed that HadGEM2-ES(RegCM4) was the best performing model, followed by CSIRO-Mk3-6-0(RegCM4) and MPI-ESM-MR(RegCM4), while the weakest performing models were CNRM-CM5(RegCM4) and EC-EARTH(RegCM4). These clear differences in performance among the models are very much related to the ability of the models to reproduce the wind direction correctly. ERA5 depicted that the JJA surface wind around the ECPM tends to blow northward with the offshore wind bending slightly northeastward (
Figure 3a). CSIRO-Mk3-6-0(RegCM4) simulated this pattern most faithfully, followed by HadGEM2-ES(RegCM4) and MPI-ESM-MR(RegCM4), while CNRM-CM5(RegCM4) and EC-EARTH(RegCM4) simulated the wind bending northwestward (
Figure 3b–f). The reason CSIRO-Mk3-6-0(RegCM4) was not the best performing model was its strong underestimation of the JJA ECPM surface wind speed (
Figure 6c).
In terms of the ECPM JJA wind stress curl (
Figure 9), all CORDEX-SEA models seemingly had good agreement with that of ERA5, with a spatial correlation >0.8. This could be due to all of the models having correctly simulated the south-to-north wind direction, producing a positive wind stress curl around the ECPM coastal area (
Figure 3). That said, it can be observed that model HadGEM2-ES(RegCM4), CSIRO-Mk3-6-0(RegCM4) and MPI-ESM-MR(RegCM4) most faithfully reproduced the JJA ECPM wind stress curl climatological pattern with respect to that of ERA5. Since the calculation of the wind stress curl is very reliant on the simulated wind direction, the best performance of these three models in reproducing the wind stress curl was to be expected.
3.4. Upwelling Index
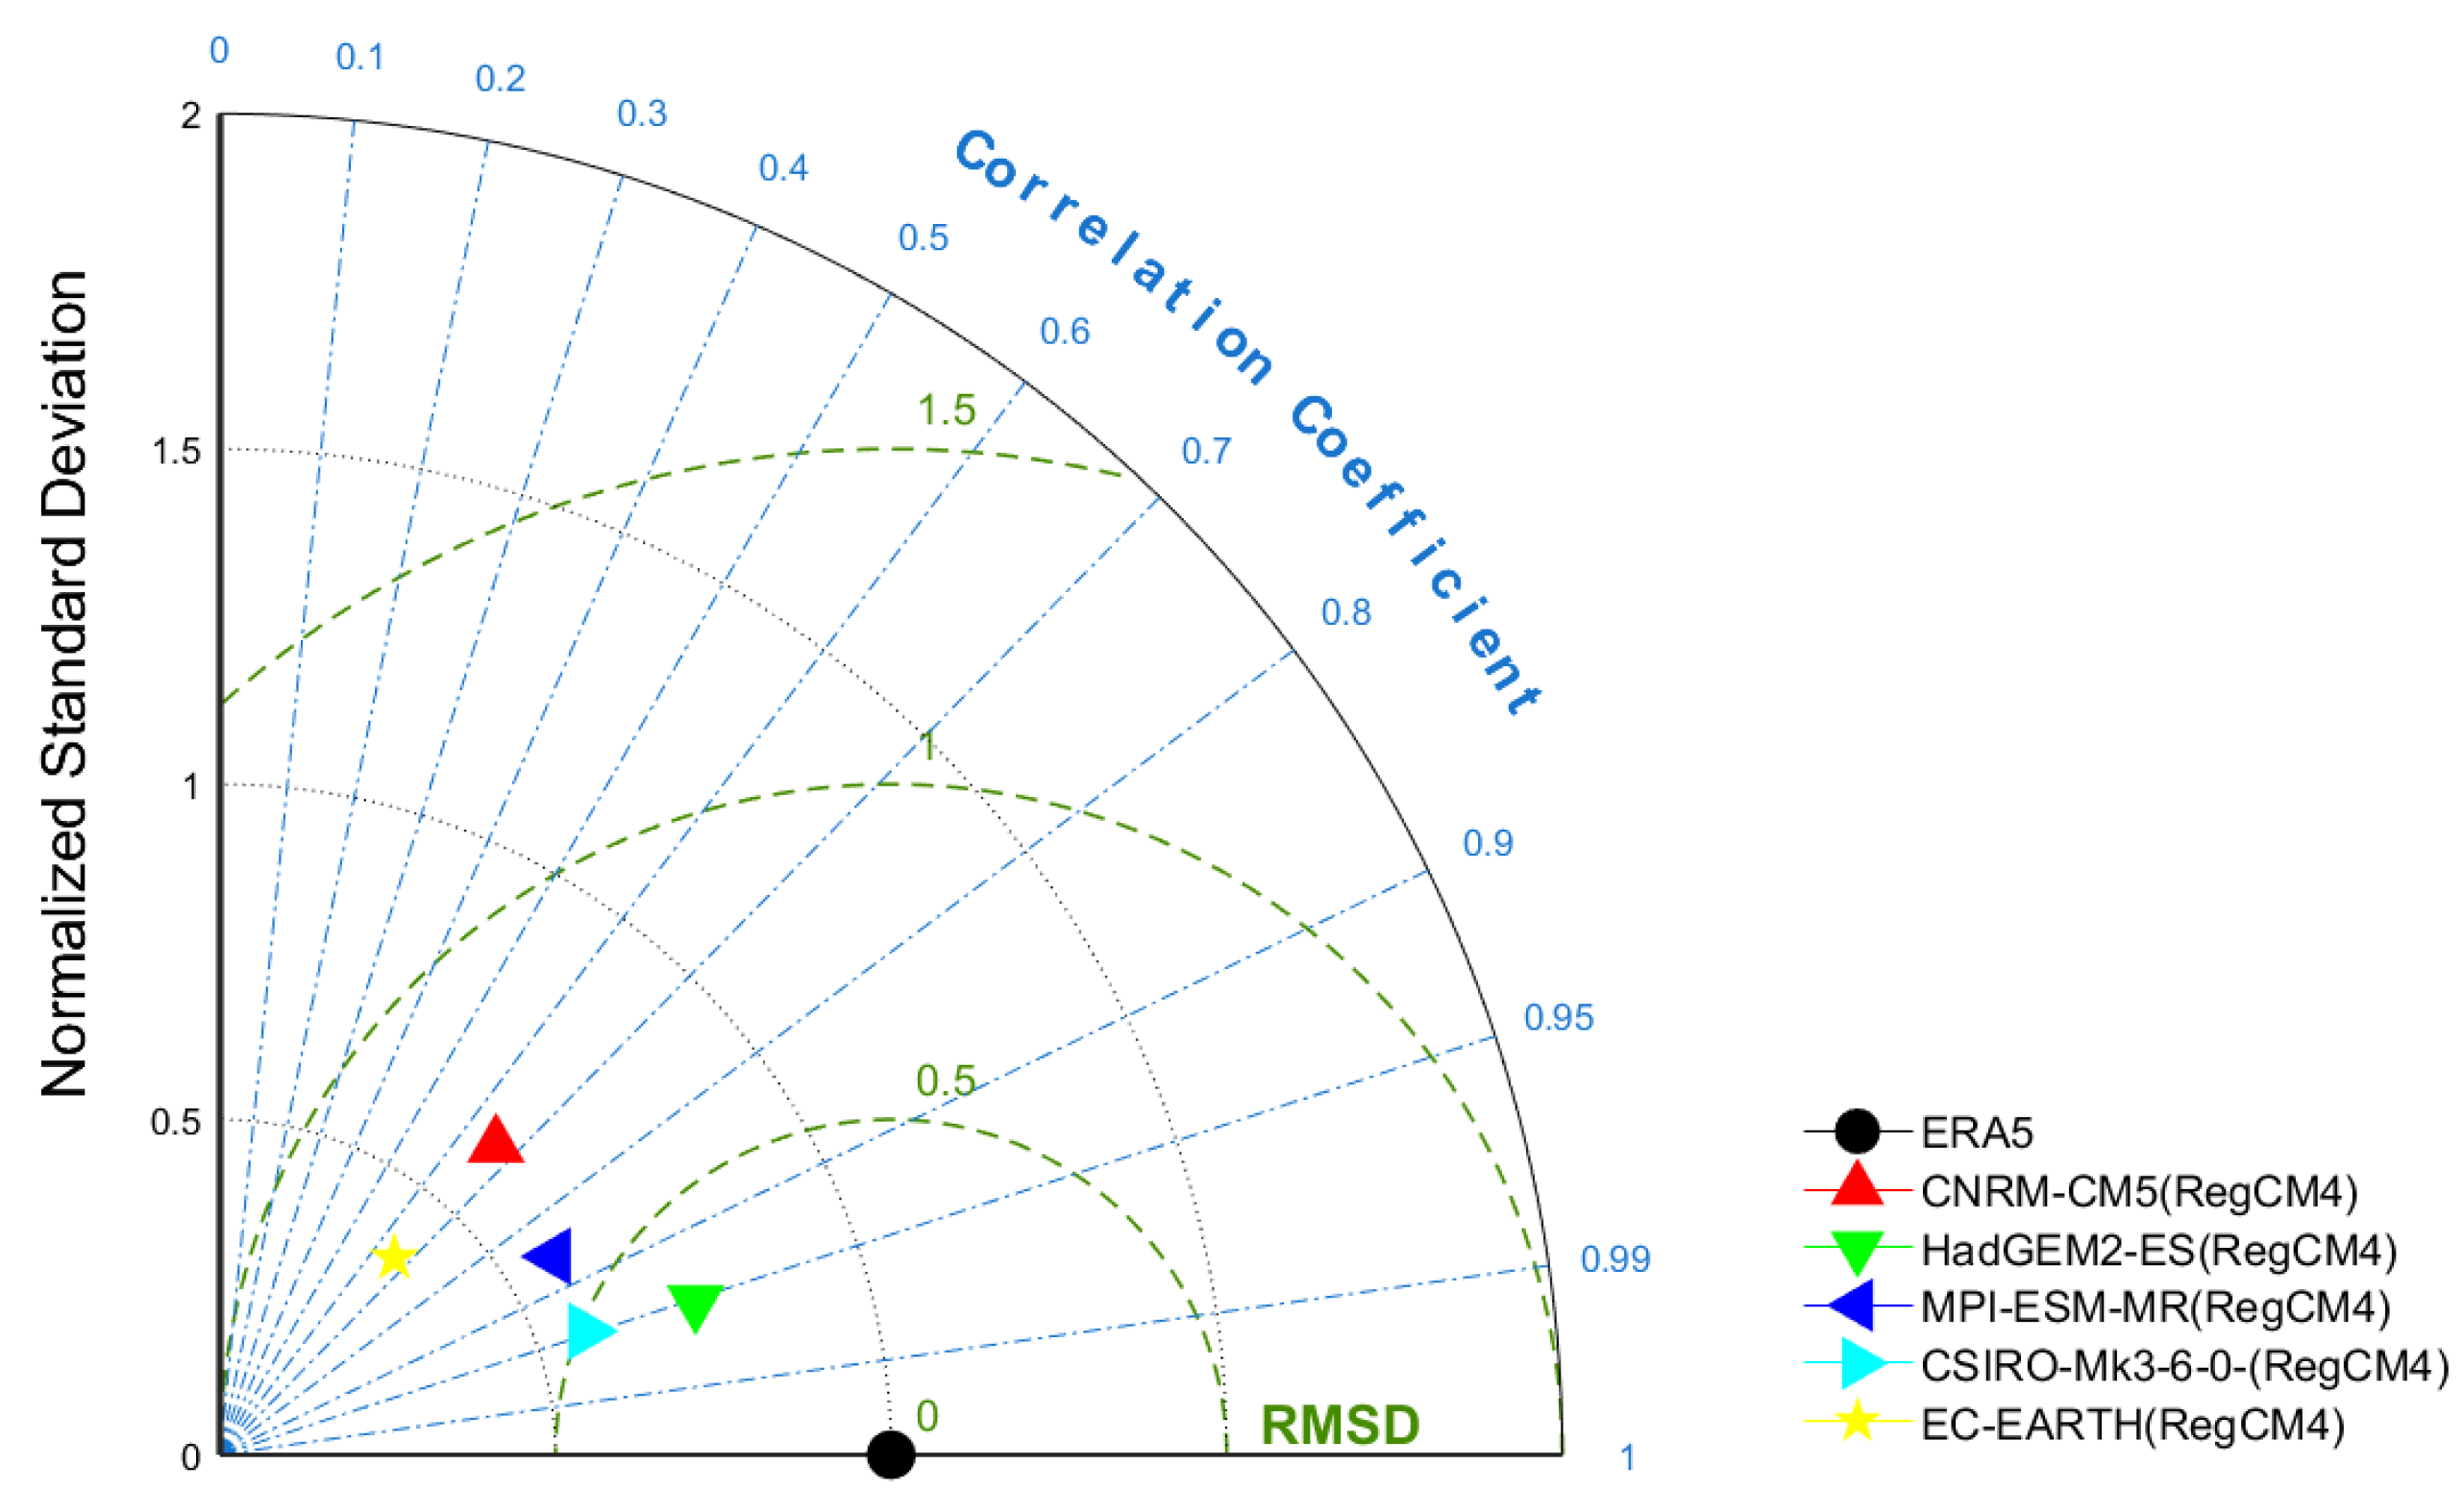
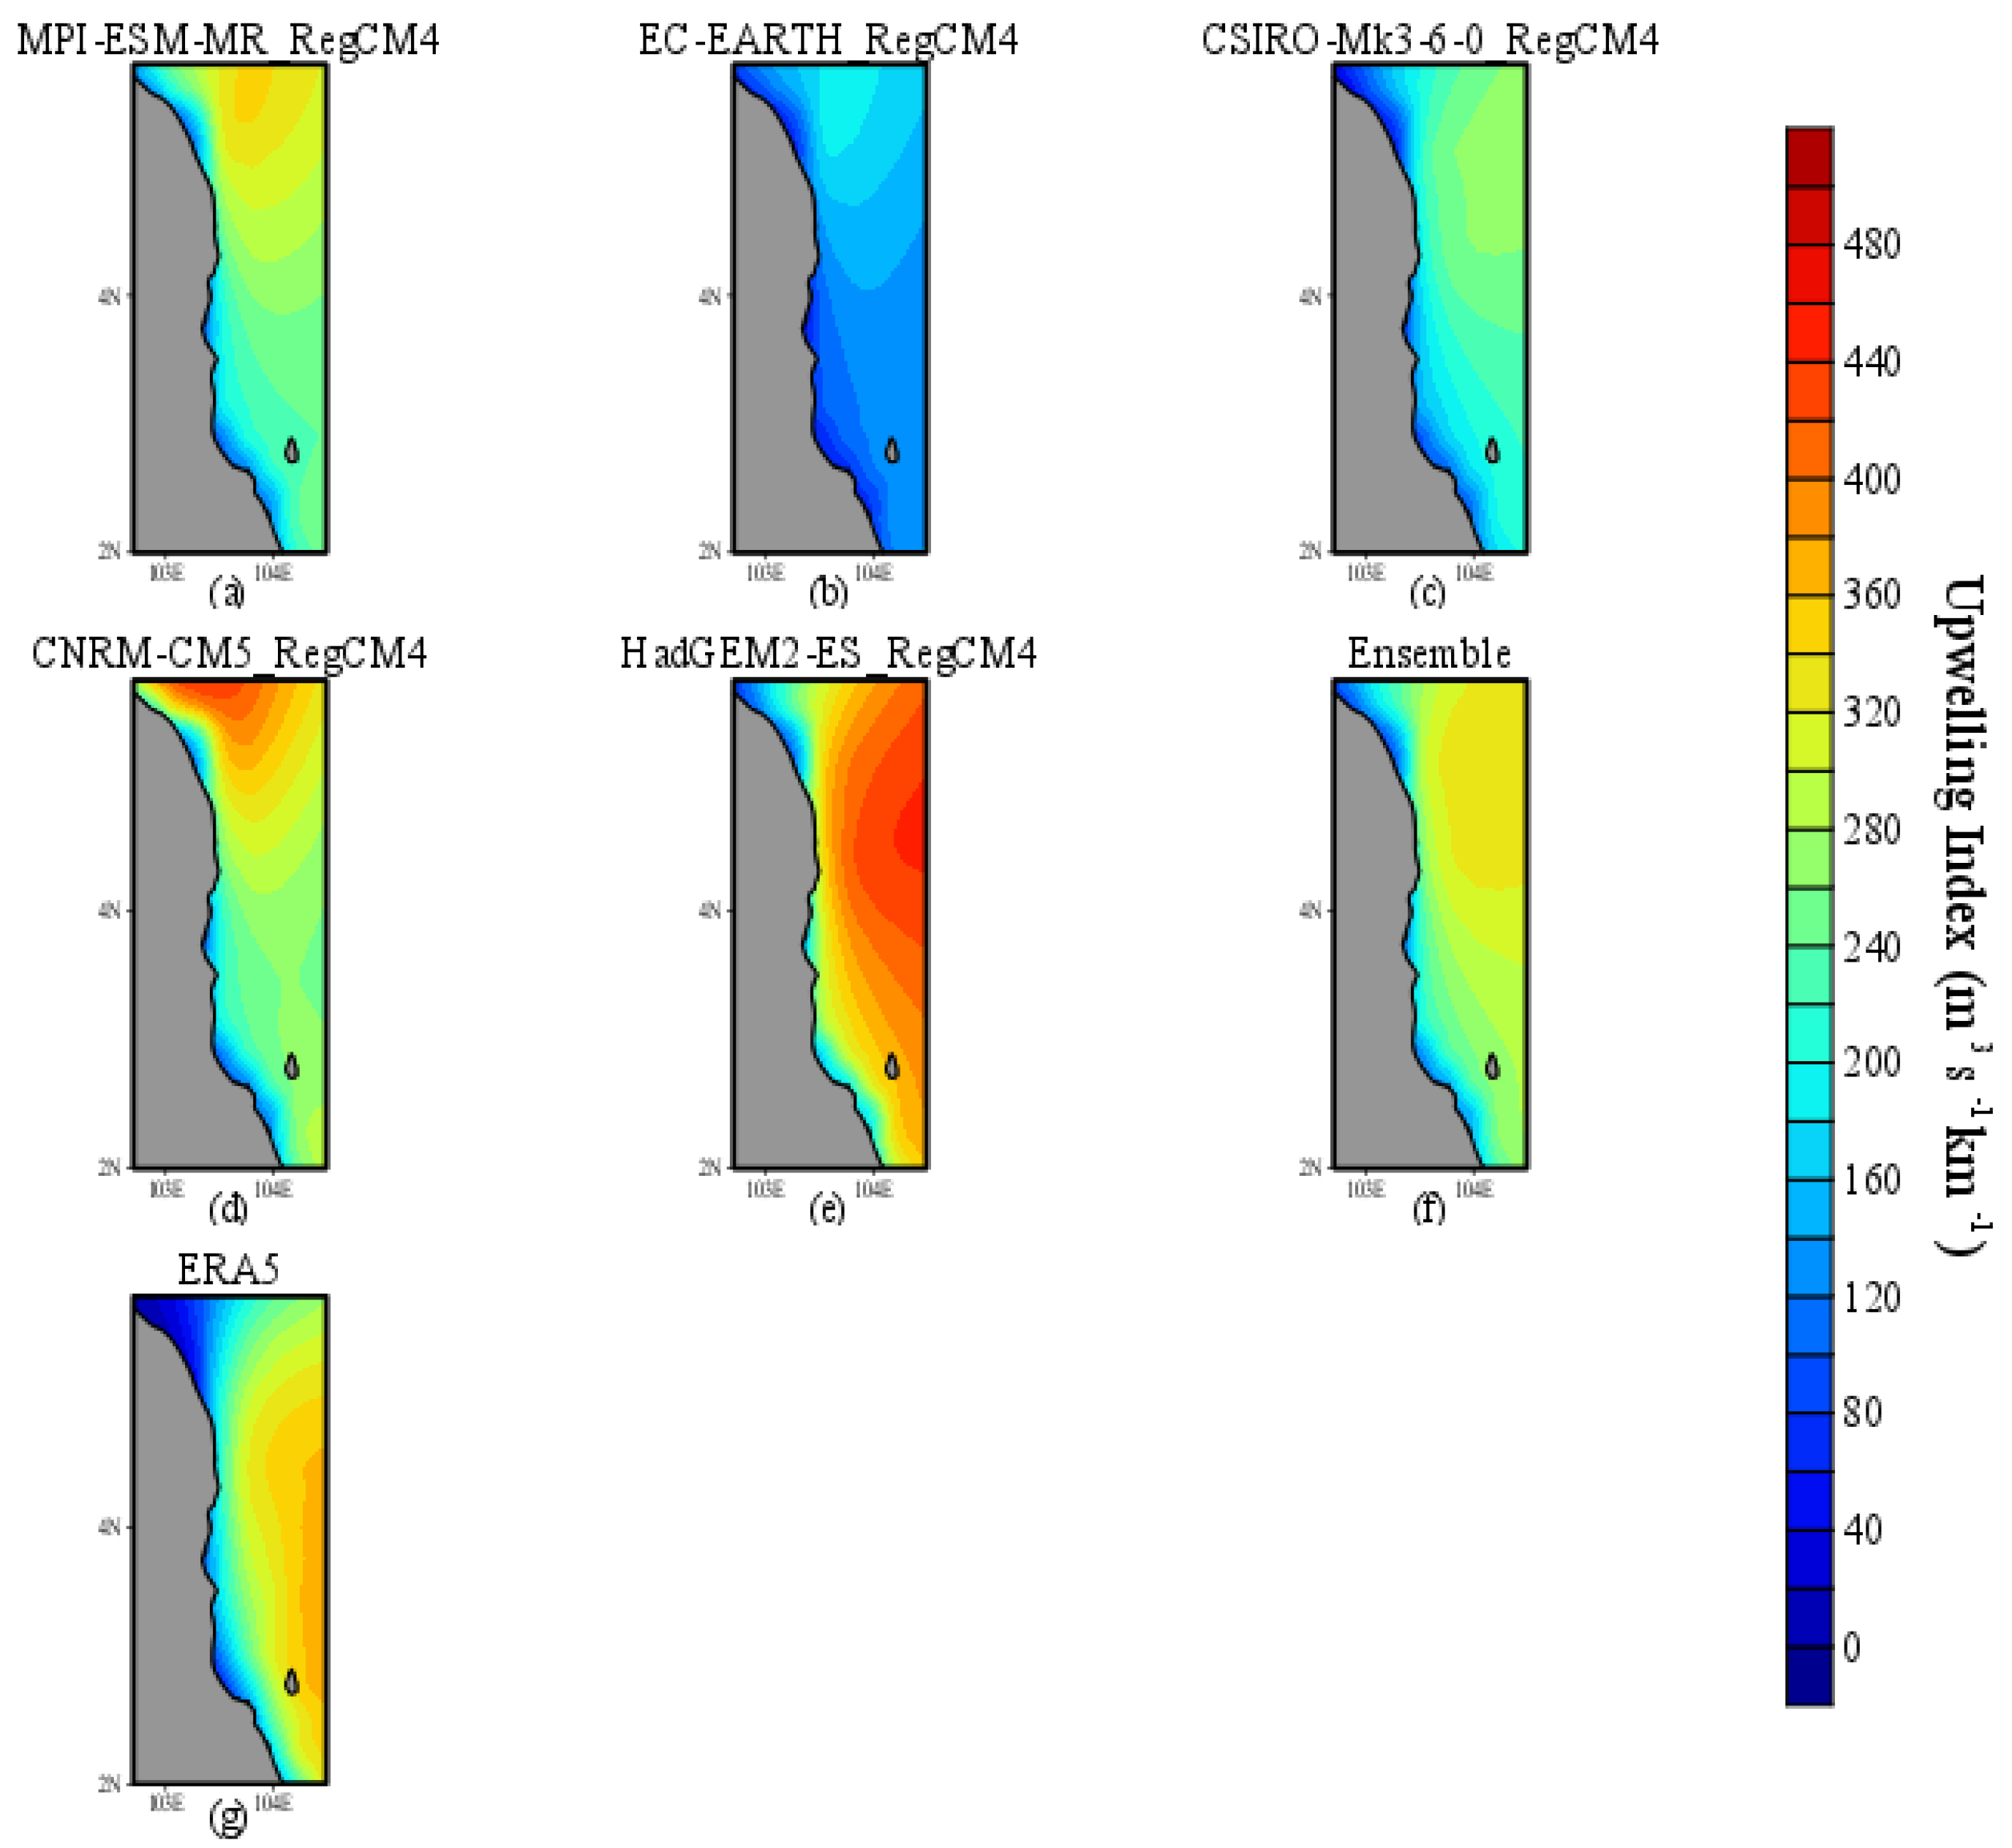
Another vital part of the experiment was to provide an insight into whether the CORDEX-SEA products were able to recreate the phenomenon of upwelling in our study region based on the value of the upwelling index. The upwelling index is defined as the strength of the wind forcing on the ocean. Based on
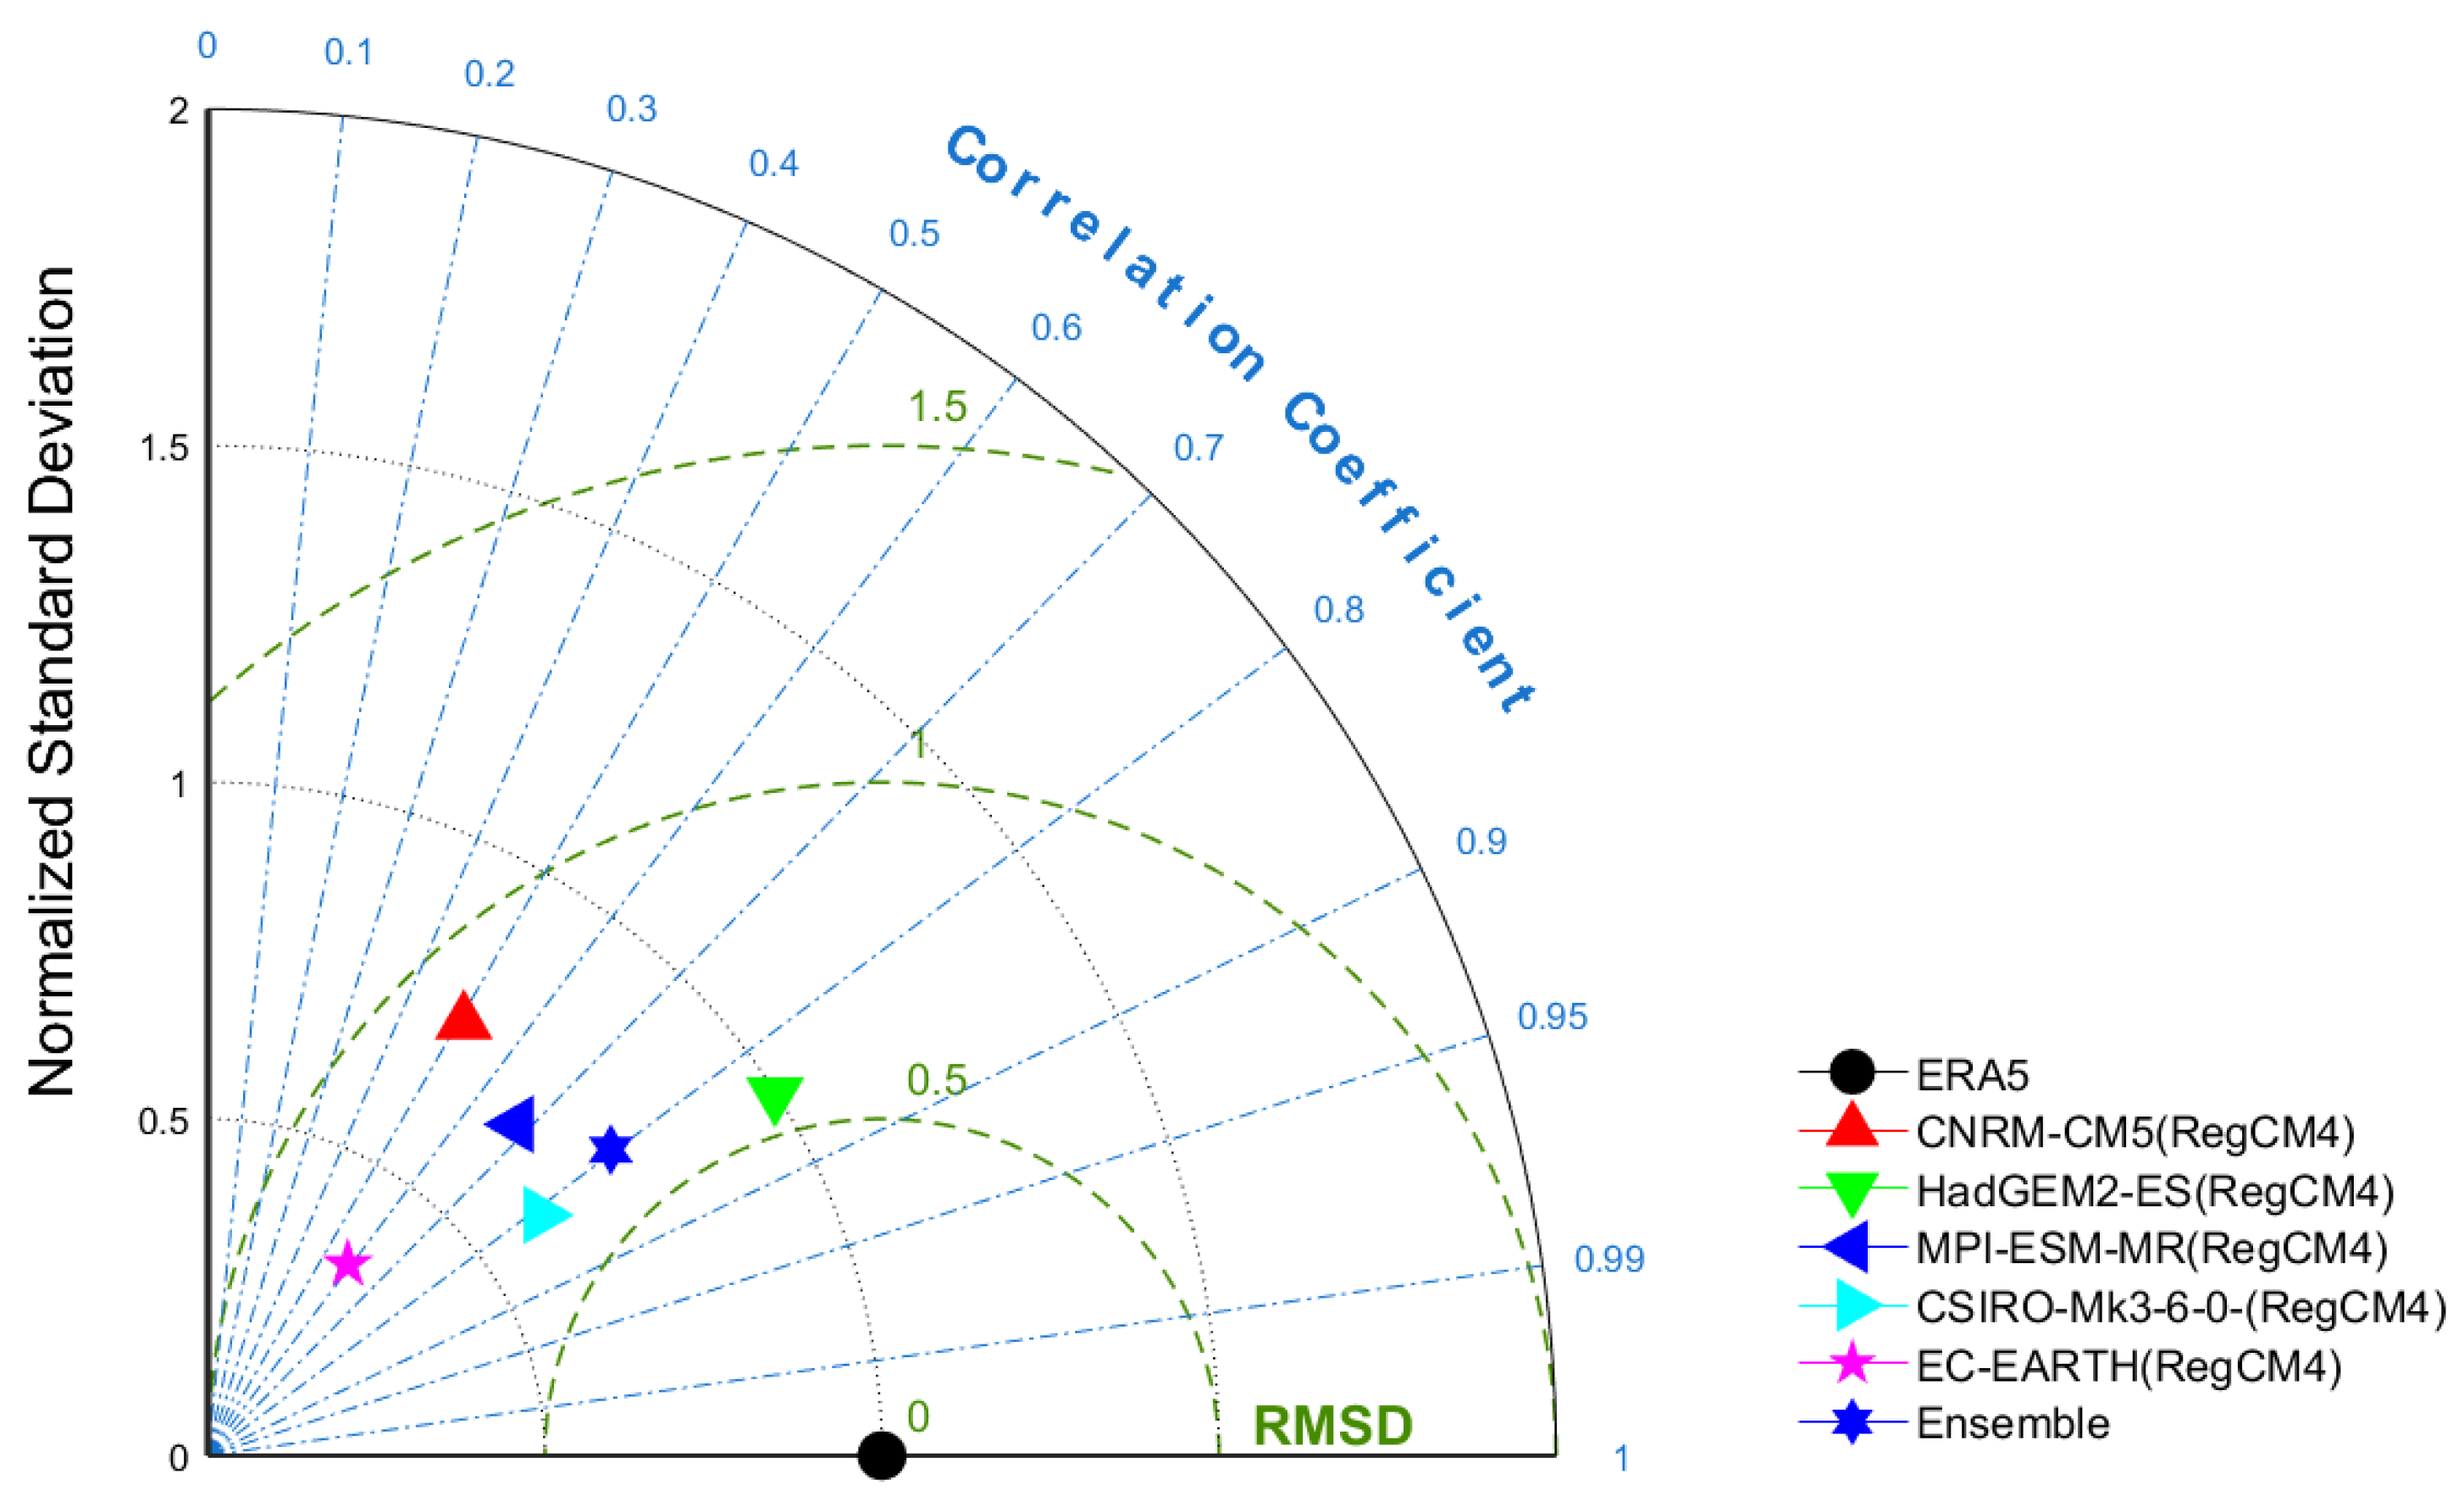
Figure 10, it can be observed that all of the CORDEX-SEA products showed a positive value in terms of the upwelling index, which means that upwelling does occur in our region of study. However, the value of the upwelling index did vary between each individual model, with some showing a higher value and some depicting a lower value. The highest value of UI was shown by HadGEM2-ES(RegCM4), while the lowest value was depicted by EC-EARTH(RegCM4). In order to provide an objective overview of how well each of the CORDEX-SEA models and the ensemble performed in reproducing the UI, Taylor’s diagram was used to compare the simulations from the models and ensemble to those of ERA5 in terms of the spatial correlation, normalized standard deviation and root mean square difference (
Figure 11). From the Taylor’s diagram, it can be observed that the best performing model was HadGEM2-ES(RegCM4), which had a spatial correlation of 0.84, the UI standard deviation closest to that of ERA5 and the smallest RMSD. This can be attributed to the ability of HadGEM2-ES(RegCM4) to simulate the UI pattern that most closely resembled that of ERA5 (
Figure 10). CSIRO-Mk3-6-0(RegCM4) came next due to its simulated UI, which showed a spatial correlation of 0.81 with respect to ERA5 and a normalized RMSD of ~0.6. CSIRO-Mk3-6-0(RegCM4), however, did not reproduce the UI spatial standard deviation well, which may be because it did not simulate the UI gradient correctly (
Figure 10c). The third model worth mentioning is MPI-ESM-MR(RegCM4), which simulated a UI spatial pattern with a correlation coefficient of 0.75. However, MPI-ESM-MR(RegCM4) was noticeably lackluster in reproducing the UI standard deviation and RMSD. Models CNRM-CM5(RegCM4) and EC-EARTH(RegCM4) noticeably underperformed in terms of the simulation of the UI spatial pattern. Such an outcome was to be expected because these two models were unable to capture the UI’s shape and contour well, as indicated by
Figure 10.
Based on the CORDEX-SEA product evaluation so far, it was decided that only three of the CORDEX-SEA products were suitable to be used as an ensemble as they were able to recreate the same phenomenon as ERA5 and exhibited a strong spatial correlation with ERA5, albeit with some deviation in values. Thus, using the three best CORDEX-SEA products, namely HadGEM2-ES(RegCM4), CSIRO-Mk3-6-0(RegCM4) and MPI-ESM-MR(RegCM4), an ensemble was produced. This ensemble was able to produce very similar values to those of ERA5 in capturing the features of the UI. This concordance was not perfect. However, the ensemble of the CORDEX-SEA products showed better results than those obtained using most of the CORDEX-SEA products individually (
Figure 10). From the Taylor’s diagram, it can be noted that the ensemble UI performance was slightly weaker compared to HadGEM2-ES(RegCM4) but outperformed all other models (
Figure 11).
4. Discussion
The objective of this paper was to investigate the ability of the CORDEX-SEA products to recreate wind features that are critical in the generation of upwelling at the EPCM and to provide insight into which CORDEX-SEA products are suitable for use in forming an ensemble. The wind stress curl and wind speed were investigated during the southwest monsoon for the period 1980–2005 in terms of the climatology, bias, Taylor’s diagram and temporal correlation. In terms of climatology, it was discovered that the CORDEX-SEA products were capable of reproducing the wind stress curl along the ECPM, despite an apparent underestimation of the value, implying that there was a bias for the CORDEX-SEA products.
From the view of the wind direction, some of the CORDEX-SEA products indicated that the wind flowed in a different direction compared to ERA5. For example, during the southwest monsoon, the wind is supposed to blow southwesterly, yet some of the CORDEX-SEA products were blowing southeasterly instead. It has been previously reported [
54] that directional deviation is dependent on wind speed and wind direction variability, whereby low deviation will occur where speed and directional variances are small. On the other hand, high deviation would occur in areas with either high speed or high direction variability, or both. Thus, this explains the wind direction deviation.
Based on the wind speed at the ECPM, three out of five of the CORDEX-SEA products, namely HadGEM2-ES(RegCM4), CSIRO-Mk3-6-0(RegCM4) and MPI-ESM-MR(RegCM4), were able to reproduce similar wind speeds as ERA5, while the remaining two products were not able to show similar results to the others, and tended to underestimate these values instead. However, in terms of wind pattern, all of the CORDEX-SEA products were able to reproduce the same pattern as ERA5, namely the trend of an increasing wind speed pattern as it moves further offshore. This means that the products were good at simulating the wind speed within the area of study, albeit with an underestimation of values. This also raises the possibility that the previous deviation in the wind direction might not be due to wind speed but rather to the wind direction variability only.
The CORDEX-SEA products were shown to have spatial variability, with a tendency to underestimate or overestimate wind speed and wind stress curl when compared to ERA5, indicating that there was a bias to the simulations of the CORDEX-SEA products. To obtain more information, the bias for the zonal and meridional wind components, as well as wind speed, were computed. The results indicated that the biases of the CORDEX-SEA products were similar, and almost all of the CORDEX-SEA products showed a negative bias, whereby the CORDEX-SEA products produced lower values compared to ERA5.
The disparity between ERA5 and the CORDEX-SEA products might be due to the CORDEX-SEA using an atmospheric only model, which does not factor in the air–sea interaction. Being an atmosphere only model can seemingly affect the reliability of the model in reproducing certain climatic features in this region [
26]. Another possible reason for such differences could be related to the CORDEX-SEA products forcing GCMs. As demonstrated by the Taylor’s diagram, the CORDEX-SEA products exhibited a large variation in terms of their performance in reproducing the wind speed and wind stress curl climatology, despite their being produced using the same RCM, i.e., RegCM4. The potential differences in the capability of GCMs in resolving important climatic variabilities over the maritime continent such as MJO, ENSO and equatorial waves [
55,
56,
57,
58,
59], could have been inherited by these RCMs and resulted in the large discrepancy in wind simulations among the models. This can be explained according to the Garbage in, Garbage out (GIGO) concept, whereby the quality of the output is determined by the quality of the input [
60].
Nevertheless, this study found that the CORDEX-SEA products are suitable to be used for the study of future climate change impacts on ECPM upwelling. However, the models used must be carefully selected, and, for ECPM upwelling, HadGEM2-ES(RegCM4), CSIRO-Mk3-6-0(RegCM4) and MPI-ESM-MR(RegCM4) would be the most suitable. After calculating each individual upwelling index for the CORDEX-SEA products and determining that the products were able to recreate the upwelling within the region, an ensemble was created based on three of the CORDEX-SEA products. The ensemble was found to show similar values to ERA5 in terms of depicting upwelling in the region. This means that the ensemble created from the CORDEX-SEA products is suitable for the study of wind and upwelling within the region of study, as it was able to almost recreate the same phenomenon as ERA5 in this study, though with some degree of bias.
5. Conclusions
Overall, based on the result obtained from the statistical analysis, it can be concluded that only three of the CORDEX-SEA products are suitable to be used for the study of wind-driven upwelling around the ECPM, as these products showed good accuracy in simulating the wind pattern. This decision was made based on the biases and Taylor’s diagrams. All of the CORDEX-SEA product were able to reproduce the spatial wind pattern of the wind speed and wind stress curl well, with spatial correlation coefficients of >0.6 and >0.8, respectively, and with both parameters having an RMSD below 1. However, HadGEM2-ES(RegCM4), CSIRO-Mk3-6-0(RegCM4) and MPI-ESM-MR(RegCM4) showed the best performance, whereby they were able to reproduce the wind direction correctly. In addition, due to the wind stress curl being very reliant on the simulated wind direction, there is no doubt that in this scenario the CORDEX-SEA products that are able to correctly simulate the south-to-north wind direction would be the best among the CORDEX-SEA products. Although the CORDEX-SEA products and ensemble showed biases in their simulated values, the most important factor that we considered was their ability to recreate the wind features within the area of study correctly.
The main purpose of this study was to assess the ability of the CORDEX-SEA products to simulate upwelling. Similar to the generation of the wind speed and wind stress curl, the CORDEX-SEA products that were able to generate a UI closest to that of the reference data were HadGEM2-ES(RegCM4), CSIRO-Mk3-6-0(RegCM4) and MPI-ESM-MR (RegCM4). This underscores the huge role played by wind in generating UI at the ECPM. Hence, only three of the CORDEX-SEA products and their ensemble are suitable to be used for studying the impact of climate change on ECPM upwelling due to their strong performance in recreating the wind features that are critical in the generation of upwelling at the ECPM. The assessment of the CORDEX-SEA products and their selection in creating an ensemble are critical for the study of climate change. If the products are seen to produce reliable simulations, then they should be able to produce reliable future climate projections, which can provide reliable information for the scientific community in making future climate change impact assessments, and aid policy makers in decision making.
The caveat of this study is that this finding is only applicable to the selected study area, and it is unknown how the CORDEX-SEA product would react under a different region due to the variability of the models. Hence, assessments such as this one need to be repeated in different regions as this can provide a better understanding of the product’s suitability for future studies. On the other hand, since the CORDEX-SEA product could reproduce the characteristics of winds favorable to the occurrence of ECPM upwelling, it would be interesting for future studies to assess the performance of these dynamically downscaled products in reproducing the onset and offset of ECPM upwelling.
Author Contributions
Conceptualization, F.S.M.A., J.X.C. and M.F.M.A.; methodology, F.S.M.A., J.X.C. and M.F.M.A.; validation, F.S.M.A., J.X.C. and P.H.K.; formal analysis, F.S.M.A., J.X.C. and P.H.K.; investigation, F.S.M.A., J.X.C. and P.H.K.; resources, F.S.M.A., J.X.C. and M.F.M.A.; data curation, F.S.M.A.; writing—original draft preparation, F.S.M.A. and P.H.K.; writing—review and editing, P.H.K., K.N.A.A.K.M., J.X.C. and M.F.M.A.; visualization, F.S.M.A.; supervision, M.F.M.A. and J.X.C.; project administration, M.F.M.A.; funding acquisition, M.F.M.A. All authors have read and agreed to the published version of the manuscript.
Funding
This research was funded by the Higher Education Ministry research grant, under the Long-Term Research Grant Scheme. Grant number: LRGS/1/2020/UMT/01/1/2/.
Institutional Review Board Statement
Not applicable.
Informed Consent Statement
Not applicable.
Data Availability Statement
Acknowledgments
The authors would also like to acknowledge INOS Supercomputing Facility (INOSURF)
https://inos.umt.edu.my/inosurf (accessed on 4 July 2022) and the CORDEX-SEA community for the data provided for this study.
Conflicts of Interest
The authors declare no conflict of interest. The funders had no role in the design of the study; in the collection, analyses, or interpretation of data; in the writing of the manuscript, or in the decision to publish the results.
References
- Fang, G.; Chen, H.; Wei, Z.; Wang, Y.; Wang, X.; Li, C. Trends and interannual variability of the South China Sea surface winds, surface height, and surface temperature in the recent decade. J. Geophys. Res. 2006, 111, C11S16. [Google Scholar] [CrossRef]
- Wyrtki, K. Scientific results of marine investigations of the South China Sea and the Gulf of Thailand 1959–1961. Naga Rep. 1961, 2, 164–169. [Google Scholar]
- Akhir, M.F.; Daryabor, F.; Husain, M.L.; Tangang, F.; Qiao, F. Evidence of Upwelling along Peninsular Malaysia during Southwest Monsoon. Open J. Mar. Sci. 2015, 5, 273–279. [Google Scholar] [CrossRef]
- Chu, P.C.; Fan, C.; Lozano, C.J.; Kerling, J.L. An airborne expendable bathythermograph survey of the South China Sea, May 1995. J. Geophys. Res. Ocean 1998, 103, 21637–21652. [Google Scholar] [CrossRef]
- Huang, Q.Z.; Wang, W.Z.; Li, Y.S.; Li, C.W. Current characteristics of the South China Sea. In Oceanography of China Sea; Zhou, D., Liang, Y.B., Tseng, C.K., Eds.; Kluwer Academic Publishing: Dordrecht, The Netherlands, 1994; Volume 1, pp. 39–47. [Google Scholar]
- Pohlmann, T. A three-dimensional circulation model of the South China Sea. In Three-Dimensional Model of Marine and Estuarine Dynamics; Nihoul, J.J., Jamart, B.M., Eds.; Elsevier: New York, NY, USA, 1987; pp. 245–268. [Google Scholar]
- Shaw, P.T.; Chao, S.Y. Surface circulation in the South China Sea. Deep. Sea Res. Part I Oceanogr. Res. Pap. 1994, 41, 1663–1683. [Google Scholar] [CrossRef]
- Pennington, J.T.; Chavez, F.P. Seasonal fluctuations of temperature, salinity, nitrate, chlorophyll and primary production at station H3/M1 over 1989–1996 in Monterey Bay, California. Deep Sea Res. Part II Top. Stud. Oceanogr. 2000, 47, 947–973. [Google Scholar] [CrossRef]
- Risien, C.; Reason, C.J.C.; Shillington, F.A.; Chelton, D.B. Variability in satellite winds over the Benguela upwelling system during 1999–2000. J. Geophys. Res. Earth Surf. 2004, 109, 1880. [Google Scholar] [CrossRef]
- Kok, P.H.; Akhir, M.F.; Tangang, F.T. Thermal frontal zone along the east coast of Peninsular Malaysia. Cont. Shelf Res. 2015, 110, 1–15. [Google Scholar] [CrossRef]
- Bakun, A. Global Climate Change and Intensification of Coastal Ocean Upwelling. Science 1990, 247, 198–201. [Google Scholar] [CrossRef]
- Snyder, M.A.; Sloan, L.C.; Diffenbaugh, N.S.; Bell, J.L. Future climate change and upwelling in the California Current. Geophys. Res. Lett. 2003, 30, 1823–1826. [Google Scholar] [CrossRef]
- Miranda, P.M.A.; Alves, J.M.R.; Serra, N. Climate change and upwelling: Response of Iberian upwelling to atmospheric forcing in a regional climate scenario. Clim. Dyn. 2013, 40, 2813–2824. [Google Scholar] [CrossRef]
- Sydeman, W.J.; García-Reyes, M.; Schoeman, D.S.; Rykaczewski, R.R.; Thompson, S.A.; Black, B.A. Climate change and wind intensification in coastal upwelling ecosystems. Science 2014, 345, 77–80. [Google Scholar] [CrossRef]
- Wang, D.; Gouhier, T.; Menge, B.A.; Ganguly, A.R. Intensification and spatial homogenization of coastal upwelling under climate change. Nature 2015, 518, 390–394. [Google Scholar] [CrossRef]
- Bakun, A.; Black, B.A.; Bograd, S.J.; García-Reyes, M.; Miller, A.J.; Rykaczewski, R.R.; Sydeman, W.J. Anticipated Effects of Climate Change on Coastal Upwelling Ecosystems. Curr. Clim. Change Rep. 2015, 1, 85–93. [Google Scholar] [CrossRef]
- Sousa, M.C.; Decastro, M.; Alvarez, I.; Gomez-Gesteira, M.; Dias, J.M. Why coastal upwelling is expected to increase along the western Iberian Peninsula over the next century? Sci. Total Environ. 2017, 592, 243–251. [Google Scholar] [CrossRef]
- Meehl, G.A.; Boer, G.J.; Covey, C.; Latif, M.; Stouffer, R.J. The coupled model intercomparison project (CMIP). Bull. Am. Meteorol. Soc. 2000, 81, 313–318. [Google Scholar] [CrossRef]
- Tangang, F.; Supari, S.; Chung, J.X.; Cruz, F.; Salimun, E.; Ngai, S.T.; Juneng, L.; Santisirisomboon, J.; Santisirisomboon, J.; Ngo-Duc, T.; et al. Future changes in annual precipitation extremes over Southeast Asia under global warming of 2 °C. APN Sci. Bull. 2018, 8, 436. [Google Scholar] [CrossRef]
- Tangang, F.; Santisirisomboon, J.; Juneng, L.; Salimun, E.; Chung, J.; Supari, S.; Cruz, F.; Ngai, S.T.; Ngo-Duc, T.; Singhruck, P.; et al. Projected future changes in mean precipitation over Thailand based on multi-model regional climate simulations of CORDEX Southeast Asia. Int. J. Clim. 2019, 39, 5413–5436. [Google Scholar] [CrossRef]
- Daryabor, F.; Tangang, F.; Juneng, L. Simulation of southwest monsoon current circulation and temperature in the east coast of peninsular Malaysia. Sains Malays. 2014, 43, 389–398. [Google Scholar]
- Tangang, F.; Chung, J.X.; Juneng, L.; Supari; Salimun, E.; Ngai, S.T.; Jamaluddin, A.F.; Mohd, M.S.F.; Cruz, F.; Narisma, G.; et al. Projected future changes in rainfall in Southeast Asia based on CORDEX–SEA multi-model simulations. Clim. Dyn. 2020, 55, 1247–1267. [Google Scholar] [CrossRef]
- Osman, Y.Z.; Abdellatif, M.E. Improving accuracy of downscaling rainfall by combining predictions of different statistical downscale models. Water Sci. 2016, 30, 61–75. [Google Scholar] [CrossRef]
- Tebaldi, C.; Knutti, R. The use of the multi-model ensemble in probabilistic climate projections. Philos. Trans. R. Soc. 2007, 365, 2053–2075. [Google Scholar] [CrossRef] [PubMed]
- Xu, C.H.; Xu, Y. The projection of temperature and precipitation over China under RCP scenarios using a CMIP5 multi-model ensemble. Atmos. Ocean. Sci. Lett. 2012, 5, 527–533. [Google Scholar]
- Juneng, L.; Tangang, F.; Chung, J.; Ngai, S.; Tay, T.; Narisma, G.; Cruz, F.; Phan-Van, T.; Ngo-Duc, T.; Santisirisomboon, J.; et al. Sensitivity of Southeast Asia rainfall simulations to cumulus and air-sea flux parameterizations in RegCM4. Clim. Res. 2016, 69, 59–77. [Google Scholar] [CrossRef]
- Ngo-Duc, T.; Tangang, F.T.; Santisirisomboon, J.; Cruz, F.; Trinh-Tuan, L.; Nguyen-Xuan, T.; Phan-Van, T.; Juneng, L.; Narisma, G.; Singhruck, P.; et al. Performance evaluation of RegCM4 in simulating extreme rainfall and temperature indices over the CORDEX-Southeast Asia region. Int. J. Clim. 2016, 37, 1634–1647. [Google Scholar] [CrossRef]
- Cruz, F.T.; Narisma, G.T.; Dado, J.B.; Singhruck, P.; Tangang, F.; Linarka, U.A.; Wati, T.; Juneng, L.; Phan-Van, T.; Ngo-Duc, T.; et al. Sensitivity of temperature to physical parameterization schemes of RegCM4 over the CORDEX-Southeast Asia region. Int. J. Clim. 2017, 37, 5139–5153. [Google Scholar] [CrossRef]
- Guillory, A. ERA5. ECMWF. Available online: https://www.ecmwf.int/en/forecasts/datasets/reanalysis-datasets/era5 (accessed on 17 June 2022).
- ERA5: Data Documentation (n.d). ECMWF Confluence Wiki. Available online: https://confluence.ecmwf.int/display/CKB/ERA5%3A+data+documentation (accessed on 4 July 2022).
- Dee, D.P.; Uppala, S.M.; Simmons, A.J.; Berrisford, P.; Poli, P.; Kobayashi, S.; Andrae, U.; Balmaseda, M.A.; Balsamo, G.; Bauer, P.; et al. The ERA-Interim reanalysis: Configuration and performance of the data assimilation system. Q. J. R. Meteorol. Soc. 2011, 137, 553–597. [Google Scholar] [CrossRef]
- Gubbala, C.S.; Dodla, V.B.R.; Desamsetti, S. Assessment of wind energy potential over India using high-resolution global reanalysis data. J. Earth Syst. Sci. 2021, 130, 64. [Google Scholar] [CrossRef]
- Rivas, M.B.; Stoffelen, A. Characterizing ERA-Interim and ERA5 surface wind biases using ASCAT. Ocean Sci. 2019, 15, 831–852. [Google Scholar] [CrossRef]
- Olauson, J. ERA5: The new champion of wind power modelling? Renew. Energy 2018, 126, 322–331. [Google Scholar] [CrossRef]
- Jiang, Y.; Han, S.; Shi, C.; Gao, T.; Zhen, H.; Liu, X. Evaluation of HRCLDAS and ERA5 Datasets for Near-Surface Wind over Hainan Island and South China Sea. Atmosphere 2021, 12, 766. [Google Scholar] [CrossRef]
- Gualtieri, G. Reliability of ERA5 Reanalysis Data for Wind Resource Assessment: A Comparison against Tall Towers. Energies 2021, 14, 4169. [Google Scholar] [CrossRef]
- Minola, L.; Zhang, F.; Azorin-Molina, C.; Pirooz, A.A.S.; Flay, R.G.J.; Hersbach, H.; Chen, D. Near-surface mean and gust wind speeds in ERA5 across Sweden: Towards an improved gust parametrization. Clim. Dyn. 2020, 55, 887–907. [Google Scholar] [CrossRef]
- Saadon, M.N.; Marghany, M.M. Surface circulation off Kuala Terengganu in the transitional period between the northeast and southwest monsoon. Pertanika J. Sci. Technol. 1996, 4, 141–148. [Google Scholar]
- Hu, J.; Kawamura, H.; Hong, H.; Suetsugu, M.; Lin, M. Hydrographic and Satellite Observations of Summertime Upwelling in the Taiwan Strait: A Preliminary Description. Terr. Atmos. Ocean. Sci. 2001, 12, 415–430. [Google Scholar] [CrossRef]
- Akhir, M.F.; Yong, J.C. Seasonal variation of water characteristics during inter-monsoon along the east coast of Johor. J. Sustain. Sci. Manag. 2011, 6, 206–214. [Google Scholar]
- Jilan, S. Overview of the South China Sea circulation and its influence on the coastal physical oceanography outside the Pearl River Estuary. Cont. Shelf Res. 2004, 24, 1745–1760. [Google Scholar] [CrossRef]
- Kuo, N.-J.; Zheng, Q.; Ho, C.-R. Satellite Observation of Upwelling along the Western Coast of the South China Sea. Remote Sens. Environ. 2000, 74, 463–470. [Google Scholar] [CrossRef]
- Kok, P.H.; Akhir, M.F.M.; Tangang, F.; Husain, M.L. Spatiotemporal trends in the southwest monsoon wind-driven upwelling in the southwestern part of the South China Sea. PLoS ONE 2017, 12, e0171979. [Google Scholar] [CrossRef]
- Amedo, C.L.A.; Villanoy, C.L. Wind stress curl and surface circulation in the South China Sea and the Philippine Sea. Sci. Diliman 2003, 15, 32–40. [Google Scholar]
- Jayaram, C.; Chacko, N.; Joseph, K.A.; Balchand, A.N. Interannual variability of upwelling indices in the Southeastern Arabian Sea: A satellite based study. Ocean Sci. J. 2010, 45, 27–40. [Google Scholar] [CrossRef]
- Ekman, V.W. On the influence of the earth’s rotation on ocean currents. Arkiv för Matematik, Astronomi och Fysik 1905, 2, 1–52. [Google Scholar]
- Pickett, M.H.; Paduan, J.D. Ekman transport and pumping in the California Current based on the U.S. Navy’s high-resolution atmospheric model (COAMPS). J. Geophys. Res. 2003, 108, 1902. [Google Scholar] [CrossRef]
- Castelao, R.M.; Barth, J.A. Upwelling around Cabo Frio, Brazil: The importance of wind stress curl. Geophys. Res. Lett. 2006, 33, gl025182. [Google Scholar] [CrossRef]
- Pérez-Santos, I.; Schneider, W.; Sobarzo, M.; Montoya-Sánchez, R.; Valle-Levinson, A.; Garcés-Vargas, J. Surface wind variability and its implications for the Yucatan basin-Caribbean Sea dynamics. J. Geophys. Res. Earth Surf. 2010, 115, jc006292. [Google Scholar] [CrossRef]
- Emanuel, K.A.; Zivkovic-Rothman, M. Development and evaluation of a convection scheme for use in climate models. J. Atmos. Sci. 1999, 56, 1766–1782. [Google Scholar] [CrossRef]
- Dickinson, R.E.; Henderson-Sellers, A.; Kennedy, P. Biosphere-Atmosphere Transfer Scheme (BATS) Version 1e as Coupled to the NCAR Community Climate Model; National Center for Atmospheric Research: Boulder, CO, USA, 1993. [Google Scholar]
- Chung, J.X.; Juneng, L.; Tangang, F.; Jamaluddin, A.F. Performances of BATS and CLM land-surface schemes in RegCM4 in simulating precipitation over CORDEX Southeast Asia domain. Int. J. Clim. 2017, 38, 794–810. [Google Scholar] [CrossRef]
- Taylor, K.E. Summarizing multiple aspects of model performance in a single diagram. J. Geophys. Res. Atmos. 2001, 106, 7183–7192. [Google Scholar] [CrossRef]
- Klink, K. Complementary Use of Scalar, Directional, and Vector Statistics with an Application to Surface Winds. Prof. Geogr. 1998, 50, 3–13. [Google Scholar] [CrossRef]
- Xavier, P.; Lim, S.Y.; Bin Abdullah, M.F.A.; Bala, M.; Chenoli, S.N.; Handayani, A.S.; Marzin, C.; Permana, D.; Tangang, F.; Williams, K.D.; et al. Seasonal Dependence of Cold Surges and their Interaction with the Madden–Julian Oscillation over Southeast Asia. J. Clim. 2020, 33, 2467–2482. [Google Scholar] [CrossRef]
- Lubis, S.W.; Jacobi, C. The modulating influence of convectively coupled equatorial waves (CCEWs) on the variability of tropical precipitation. Int. J. Climatol. 2015, 35, 1465–1483. [Google Scholar] [CrossRef]
- Sakaeda, N.; Kiladis, G.; Dias, J. The Diurnal Cycle of Rainfall and the Convectively Coupled Equatorial Waves over the Maritime Continent. J. Clim. 2020, 33, 3307–3331. [Google Scholar] [CrossRef]
- Peatman, S.C.; Schwendike, J.; Birch, C.E.; Marsham, J.H.; Matthews, A.J.; Yang, G.-Y. A local-to-large scale view of Maritime Continent rainfall: Control by ENSO, MJO and equatorial waves. J. Clim. 2021, 34, 8933–8953. [Google Scholar] [CrossRef]
- Muhammad, F.R.; Lubis, S.W.; Setiawan, S. Impacts of the Madden–Julian oscillation on precipitation extremes in Indonesia. Int. J. Clim. 2020, 41, 1970–1984. [Google Scholar] [CrossRef]
- Bininda-Emonds, O.R.P.; Jones, K.E.; Price, S.A.; Cardillo, M.; Grenyer, R.; Purvis, A. Garbage in, Garbage out. In Phylogenetic Supertrees; Springer: Dordrecht, The Netherlands, 2004; pp. 267–280. [Google Scholar] [CrossRef]
Figure 1.
Location of the southern South China Sea. Red box marks the domain of the study (East Coast of Peninsular Malaysia).
Figure 1.
Location of the southern South China Sea. Red box marks the domain of the study (East Coast of Peninsular Malaysia).
Figure 2.
Mean wind speed during JJA derived from (a) ERA5 (b) MPI-ESM-MR(RegCM4), (c) EC-EARTH(RegCM4), (d) CSIRO-Mk3-6-0(RegCM4), (e) CNRM-CM5(RegCM4) and (f) HadGEM2-ES(RegCM4).
Figure 2.
Mean wind speed during JJA derived from (a) ERA5 (b) MPI-ESM-MR(RegCM4), (c) EC-EARTH(RegCM4), (d) CSIRO-Mk3-6-0(RegCM4), (e) CNRM-CM5(RegCM4) and (f) HadGEM2-ES(RegCM4).
Figure 3.
Mean wind stress curl and wind direction during JJA derived from (a) ERA5, (b) MPI-ESM-MR(RegCM4), (c) EC-EARTH(RegCM4), (d) CSIRO-Mk3-6-0(RegCM4), (e) CNRM-CM5(RegCM4) and (f) HadGEM2-ES(RegCM4).
Figure 3.
Mean wind stress curl and wind direction during JJA derived from (a) ERA5, (b) MPI-ESM-MR(RegCM4), (c) EC-EARTH(RegCM4), (d) CSIRO-Mk3-6-0(RegCM4), (e) CNRM-CM5(RegCM4) and (f) HadGEM2-ES(RegCM4).
Figure 4.
Mean zonal(U) wind component bias for JJA derived from (a) MPI-ESM-MR(RegCM4), (b) EC-EARTH(RegCM4), (c) CSIRO-Mk3-6-0(RegCM4), (d) CNRM-CM5(RegCM4) and (e) HadGEM2-ES(RegCM4).
Figure 4.
Mean zonal(U) wind component bias for JJA derived from (a) MPI-ESM-MR(RegCM4), (b) EC-EARTH(RegCM4), (c) CSIRO-Mk3-6-0(RegCM4), (d) CNRM-CM5(RegCM4) and (e) HadGEM2-ES(RegCM4).
Figure 5.
Mean meridional(V) wind component bias for JJA derived from (a) MPI-ESM-MR(RegCM4), (b) EC-EARTH(RegCM4), (c) CSIRO-Mk3-6-0(RegCM4), (d) CNRM-CM5(RegCM4) and (e) HadGEM2-ES(RegCM4).
Figure 5.
Mean meridional(V) wind component bias for JJA derived from (a) MPI-ESM-MR(RegCM4), (b) EC-EARTH(RegCM4), (c) CSIRO-Mk3-6-0(RegCM4), (d) CNRM-CM5(RegCM4) and (e) HadGEM2-ES(RegCM4).
Figure 6.
Mean wind speed bias for JJA derived from (a) MPI-ESM-MR(RegCM4), (b) EC-EARTH(RegCM4), (c) CSIRO-Mk3-6-0(RegCM4), (d) CNRM-CM5(RegCM4) and (e) HadGEM2-ES(RegCM4).
Figure 6.
Mean wind speed bias for JJA derived from (a) MPI-ESM-MR(RegCM4), (b) EC-EARTH(RegCM4), (c) CSIRO-Mk3-6-0(RegCM4), (d) CNRM-CM5(RegCM4) and (e) HadGEM2-ES(RegCM4).
Figure 7.
Mean wind stress curl bias for JJA derived from (a) MPI-ESM-MR(RegCM4), (b) EC-EARTH(RegCM4), (c) CSIRO-Mk3-6-0(RegCM4), (d) CNRM-CM5(RegCM4) and (e) HadGEM2-ES(RegCM4).
Figure 7.
Mean wind stress curl bias for JJA derived from (a) MPI-ESM-MR(RegCM4), (b) EC-EARTH(RegCM4), (c) CSIRO-Mk3-6-0(RegCM4), (d) CNRM-CM5(RegCM4) and (e) HadGEM2-ES(RegCM4).
Figure 8.
Wind Speed spatial pattern correlations and standard deviation with respect to ERA5 over the study area.
Figure 8.
Wind Speed spatial pattern correlations and standard deviation with respect to ERA5 over the study area.
Figure 9.
Wind stress curl spatial pattern correlations and standard deviation with respect to ERA5 over the study area.
Figure 9.
Wind stress curl spatial pattern correlations and standard deviation with respect to ERA5 over the study area.
Figure 10.
Upwelling Index during the period of 1980–2005 during JJA for (a) MPI-ESM-MR(RegCM4), (b) EC-EARTH(RegCM4), (c) CSIRO-Mk3-6-0(RegCM4), (d) CNRM-CM5(RegCM4) (e), HadGEM2-ES(RegCM4), (f) Ensemble and (g) ERA5.
Figure 10.
Upwelling Index during the period of 1980–2005 during JJA for (a) MPI-ESM-MR(RegCM4), (b) EC-EARTH(RegCM4), (c) CSIRO-Mk3-6-0(RegCM4), (d) CNRM-CM5(RegCM4) (e), HadGEM2-ES(RegCM4), (f) Ensemble and (g) ERA5.
Figure 11.
Upwelling Index spatial pattern correlations and standard deviation with respect to ERA5 over the study area.
Figure 11.
Upwelling Index spatial pattern correlations and standard deviation with respect to ERA5 over the study area.
Table 1.
Overview of five CORDEX-SEA products (CSIRO-MK3-6-o(RegCM4), EC-EARTH(RegCM4), HadGEM2-ES(RegCM4), MPI-ESM-MR(RegCM4) and CNRM-CM5(RegCM4)) and their period of coverage.
Table 1.
Overview of five CORDEX-SEA products (CSIRO-MK3-6-o(RegCM4), EC-EARTH(RegCM4), HadGEM2-ES(RegCM4), MPI-ESM-MR(RegCM4) and CNRM-CM5(RegCM4)) and their period of coverage.
| Models | Period |
|---|
| CSIRO-Mk3-6-0(RegCM4) | 1980–2005
2006–2100 |
| EC-EARTH(RegCM4) | 1980–2005
2006–2100 |
| HadGEM2-ES(RegCM4) | 1980–2005
2006–2100 |
| MPI-ESM-MR(RegCM4) | 1980–2005
2006–2100 |
| CNRM-CM5(RegCM4) | 1980–2005
2006–2100 |
| Publisher’s Note: MDPI stays neutral with regard to jurisdictional claims in published maps and institutional affiliations. |
© 2022 by the authors. Licensee MDPI, Basel, Switzerland. This article is an open access article distributed under the terms and conditions of the Creative Commons Attribution (CC BY) license (https://creativecommons.org/licenses/by/4.0/).


 ,
, 


