
Error Characteristic Analysis of Satellite-Based Precipitation Products over Mainland China


1
School of Geography and Tourism, Qufu Normal University, Rizhao 276825, China
2
State Key Laboratory of Desert and Oasis Ecology, Xinjiang Institute of Ecology and Geography, Chinese Academy of Sciences, Urumqi 830011, China
*
Author to whom correspondence should be addressed.
Atmosphere 2022, 13(8), 1211; https://doi.org/10.3390/atmos13081211
Submission received: 7 June 2022
/
Revised: 24 July 2022
/
Accepted: 26 July 2022
/
Published: 1 August 2022
(This article belongs to the Special Issue Drought in Arid and Semi-arid Regions)
Abstract
:Satellite-based precipitation products (SPPs) provide valuable precipitation information for various applications. Their performance, however, varies significantly from region to region due to various data sources and production processes. This paper aims to evaluate four selected SPPs (Precipitation Estimation from Remotely Sensed Information using Artificial Neural Networks Climate Data Record (PERSIANN-CDR), Multi-Source Weighted-Ensemble Precipitation (MSWEP), Gauge-adjusted Global Satellite Mapping of Precipitation (GSMAP-gauge), and Global Precipitation Measurement (GPM)) over mainland China from 2016 to 2019. Both conventional statistical indicators (e.g., correlation coefficients (CC), root mean square error (RMSE), mean absolute error (MAE), relative bias (RB), and Nash–Sutcliffe efficiency (NSE)) and categorical indicators (probability of detection (POD), probability of true detection (POTD), false-alarm rate (FAR), and critical success index (CSI)) are used for quantitative analysis. The results show that: (1) GSMAP-gauge and GPM perform best in reproducing the spatial distribution pattern of precipitation over mainland China, whereas SPPs generally underestimate summer precipitation with a high frequency of no-rain cases. (2) MSWEP has the best capability for recording precipitation events, although some parts of northern China exhibit abnormal overestimations for winter precipitation. (3) All SPPs, especially the PERSIANN-CDR, significantly underestimate the precipitation in the mountainous areas of southwestern China. (4) The GSMAP-gauge and GPM outperformed the other two of the four SPPs, in terms of the probability density function of daily precipitation for cases (PDFc) and the probability density function of daily precipitation for volume (PDFv). Generally, PERSIANN-CDR shows the poorest performance when compared to the other three products. The product’s algorithm for estimating heavy precipitation and mountainous precipitation needs further improvement.
1. Introduction
In recent years, extreme weather events such as floods and droughts have occurred frequently, which have had a major impact on national food security and economic production [1,2,3]. Precipitation is the key parameter for climatological studies, and it is highly variable in both spatial and temporal distribution. Currently, the main techniques to obtain precipitation information include precipitation measurement by ground stations and radar or estimation by remote sensing. The ground stations can provide precipitation data with a high temporal resolution. However, the distribution of ground stations is affected by the terrain, resulting in a small sampling area that affects its various applications at global or regional scales [4]. Although radar technology can track precipitation in real time with high spatial resolution, its coverage is limited, and its precipitation estimates are not representative of regional precipitation [5]. However, the quality of precipitation data observed by radar is easily disturbed by complex terrain and atmospheric condition [6]. With the development of remote sensing technology, various SPPs have been developed. SPPs can reflect the spatial and temporal distribution characteristics of precipitation. The large coverage of precipitation estimation can effectively offset the challenge of obtaining precipitation values for mountainous areas, deserts, oceans, and other areas with sparse or even missing observations. SPPs have been widely used in hydro-meteorological research [7,8]. However, there are some uncertainties in the different generation algorithms of SPPs [9,10,11]. Therefore, it becomes necessary to evaluate the accuracy of SPPs.
PERSIANN-CDR (Precipitation Estimation from Remotely Sensed Information using Artificial Neural Networks Climate Data Record), MSWEP (Multi-Source Weighted-Ensemble Precipitation), GSMAP-gauge (Gauge-adjusted Global Satellite Mapping of Precipitation), GPM (Global Precipitation Measurement), and others are currently the most popular SPPs applicable to China. Most of the SPPs’ evaluation works are limited to the local area or watershed scale, or only conducted for one single product. The existing SPP evaluation studies acknowledged the critical function that SPPs serve in precipitation detection. In this regard, we might cite Bharti et al. [12], who used standard statistical and classification metrics to assess the error features of the TRMM (Tropical Rainfall Measuring Mission satellite) 3B42V7 over the Northwest Himalayan region. Over mainland China, Zhao et al. [13] evaluated the performance of two versions of GPM (IMERGF-V3 and IMERGF-V4 products), and Deng et al. [14] quantitatively assessed the accuracy of MSWEP by using various metrics, such as RB and CC. Meanwhile, many studies have also conducted the intercomparison between different SPPs. Tian et al. [15] carried out an error evaluation of four SPPs in the United States and concluded that GSMAP performed better at capturing the spatial distribution of precipitation. Guo et al. [16] used the APHRODITE dataset as a reference to analyze the errors of eight SPPs in Central Asia in terms of spatial distribution, elevation error, and precipitation intensity error. Chaudhary et al. [17] extended the traditional contingency table by splitting hit events into over-hit, under-hit, and true-hit events to provide additional information on the similarity in frequency and intensity of rainy events. Furthermore, the method was applied in the evaluation of SPPs’ performance in India. However, few evaluation studies have been conducted for the intercomparison of MSWEP with other SPPs such as PERSIANN-CDR, GPM, and GSMAP-gauge.
To address the aforementioned gap, this study aims to analyze the error characteristics of various major SPPs over mainland China. This goal is achieved through correlation coefficients (CC), root mean square error (RMSE), mean absolute error (MAE), relative bias (RB), and Nash–Sutcliffe efficiency (NSE). The contingency indices such as the probability of detection (POD), probability of true detection (POTD), false-alarm rate (FAR), and critical success index (CSI) are also used to quantify the performance of SPPs to capture precipitation events. This is to compare the error characteristics of four widely used SPPs and ground station measurements. The results of this study will assist developers to improve the algorithm of SPPs and their ability to record precipitation [18,19], as well as provide a reference for selecting the most suitable SPP for mainland China.
The remaining parts of this paper are organized as follows. Section 2 introduces the overview of the study area, as well as the research methods and statistical indicators used. Section 3 shows the results of error characteristics of precipitation detection by satellite products in various aspects, such as the spatial distribution patterns at daily and seasonal scales, probability distribution functions, and contingency statistics results, analyzing the performance of error characteristics over typical terrain precipitation areas in southwestern and northwestern China. Section 4 discusses the uncertainties of the ground reference dataset. Finally, conclusions are summarized in Section 5.
2. Materials and Methods
2.1. Study Area
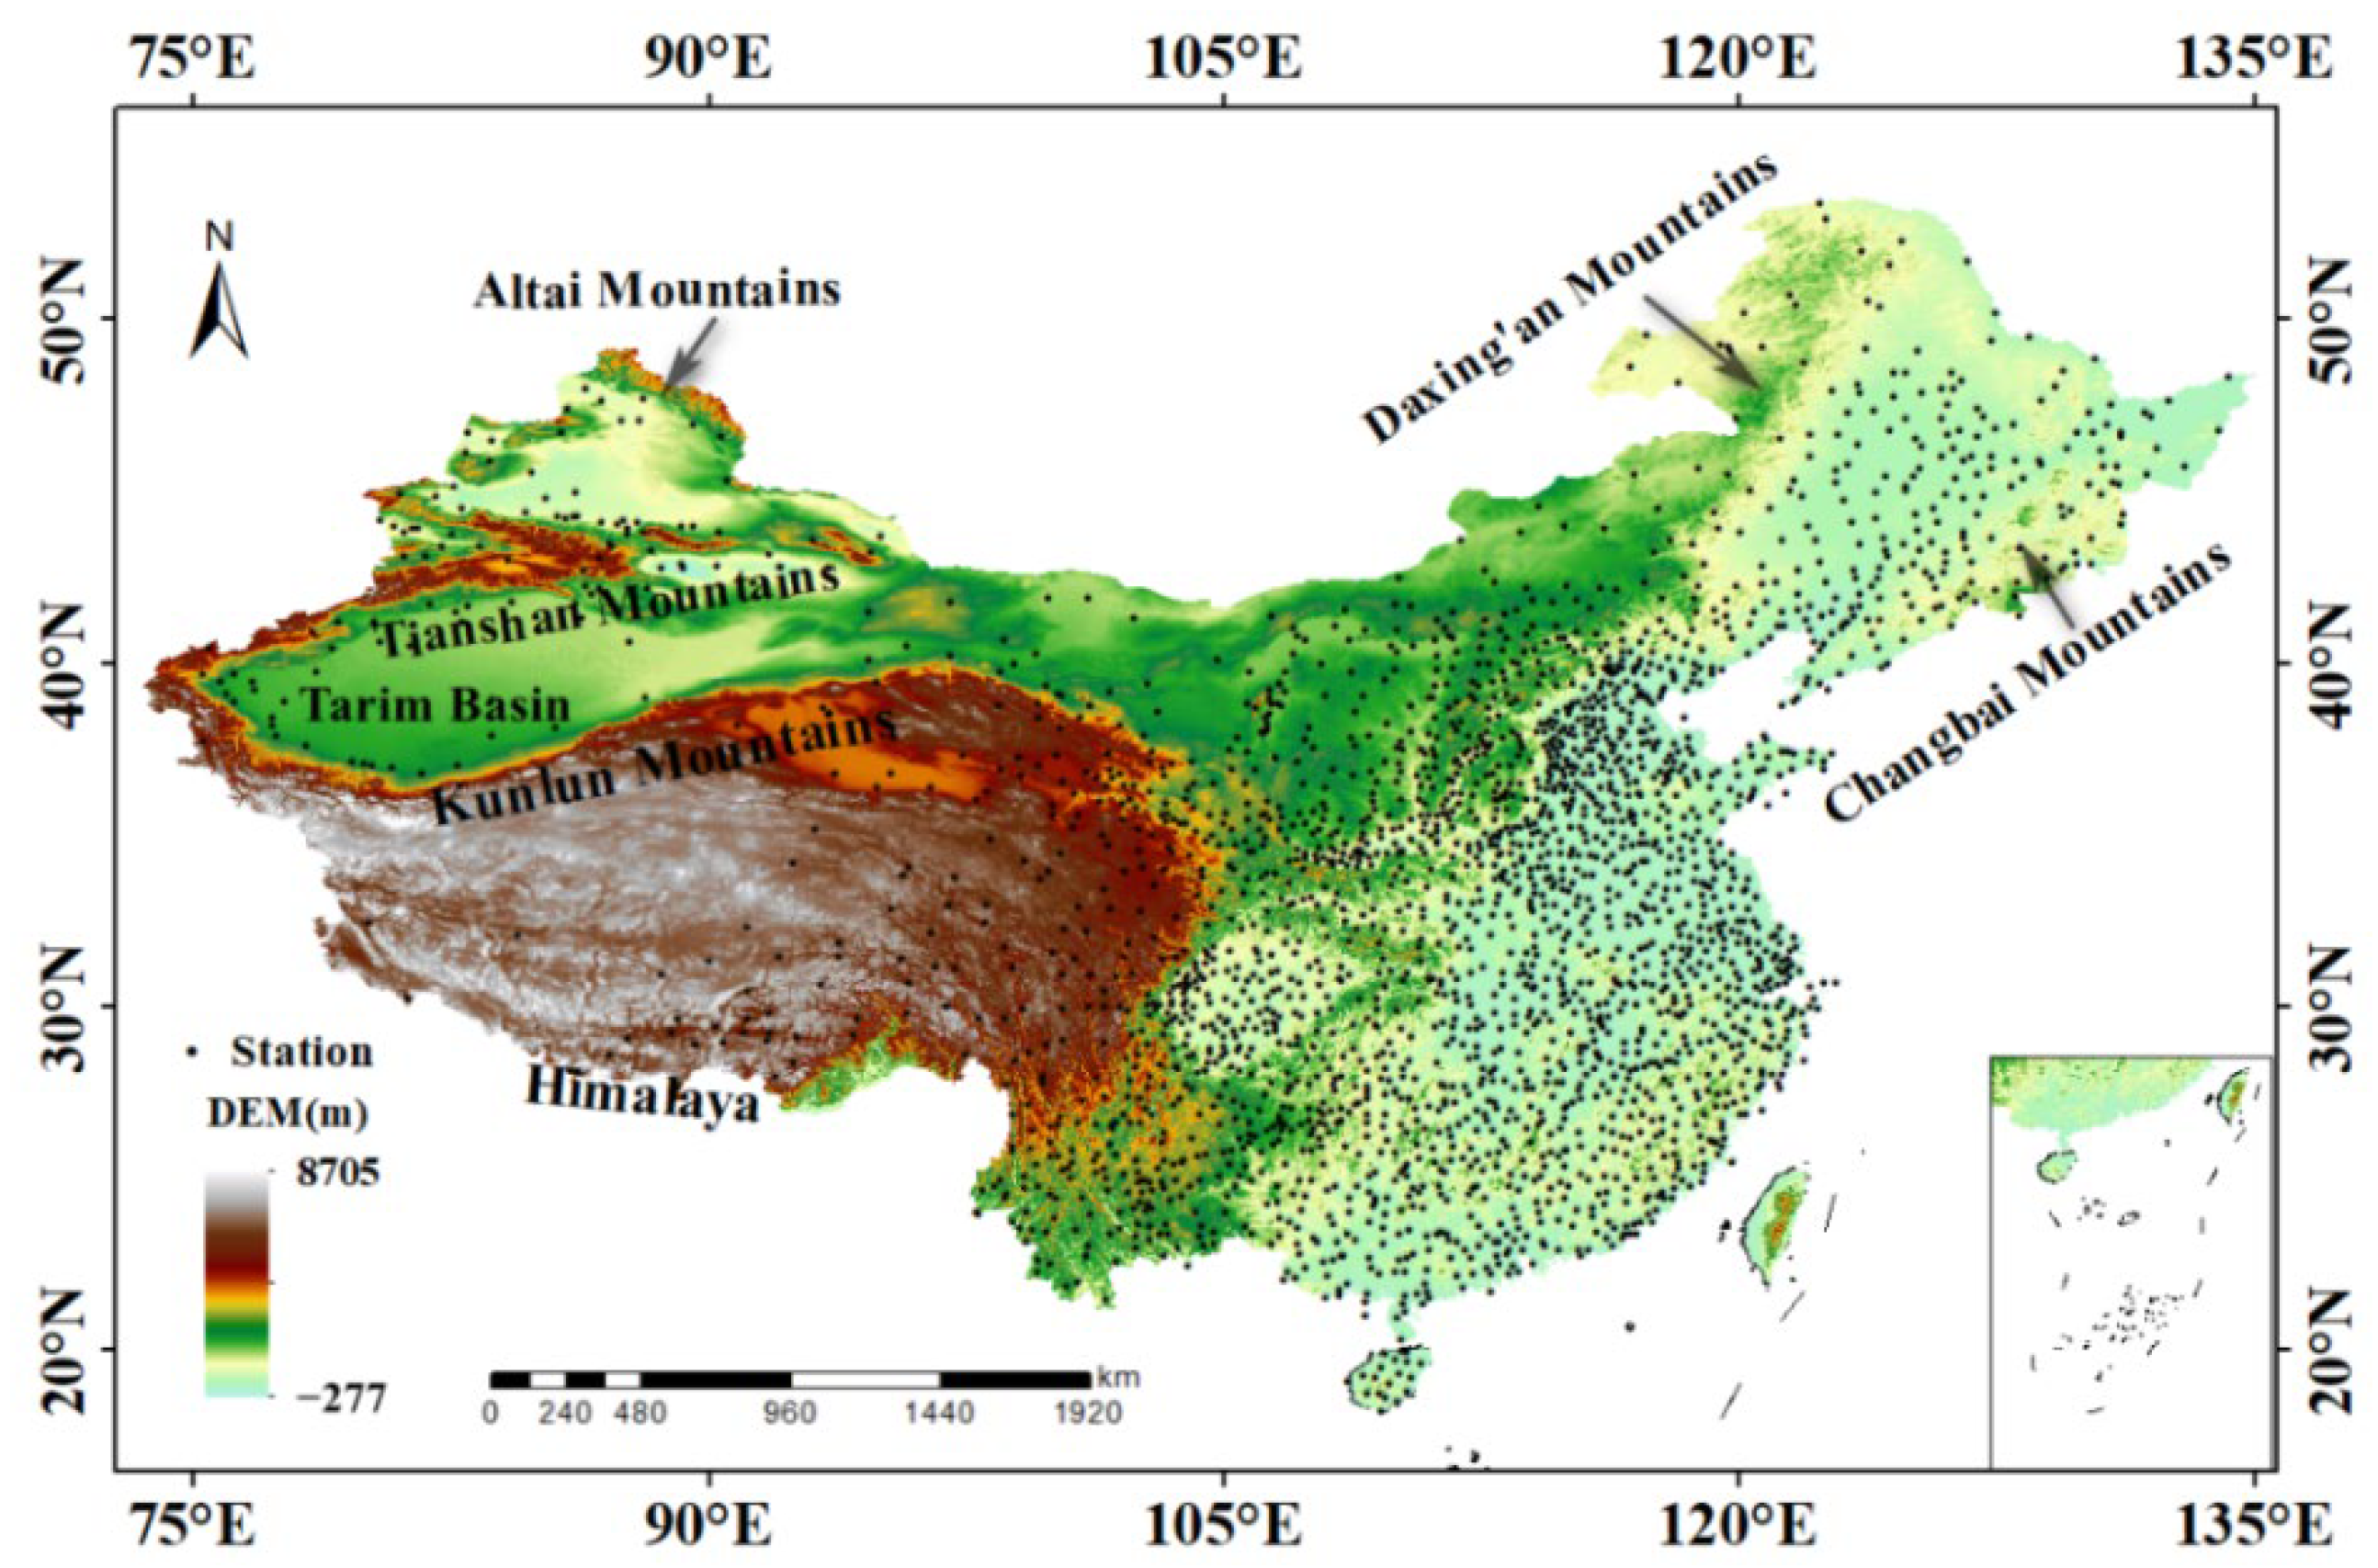
The latitude and longitude of mainland China range from 73° to 136° E and 3° to 54° N. Monsoons and tropical cyclones dominate most regions, resulting in the uneven spatial and temporal distribution of precipitation [20,21]. It greatly increases the possibility of droughts and floods, causing certain disturbances not only in agricultural production but also in people’s daily life. In addition, China has a lot of undulating mountains. The altitude decreases from west to east with a stepped distribution. The spatial distribution of China’s ground meteorological observation stations is uneven, with more in the southeast and less in the northwest. Due to China’s geographic location and complex terrain features, Tibet has just 39 state-level manned ground meteorological observation stations since 2020 (Figure 1) [12]. China is a typical monsoon climate region with four seasons (i.e., March–May for spring, June–August for summer, September–November for autumn, and December–February for winter). The annual precipitation gradually decreases from the southeast to the northwest due to the different distances from the ocean.
2.2. Datasets
2.2.1. Ground Reference Dataset
Due to the unavailability of ground station data, this paper uses the China Daily Precipitation Analysis Products (CPAP) of the National Meteorological Information Center (NMIC) and the China Meteorological Administration (CMA) as the ground reference. CPAP has high accuracy and many scholars have affirmed its ability to assess the quality of SPPs [22,23,24]. CPAP was generated based on the daily precipitation observations (0:00 to 24:00 UTC) from 2419 national-level meteorological stations by using an optimal interpolation technique at 0.25° spatial resolution [25,26]. It has undergone strict quality control on three levels, including the extreme values check, internal consistency check, and spatial consistency check [27]. The quality of CPAP has been systematically evaluated by Shen et al. [25], and they found that the daily analysis has excellent agreements with their observations in different parts of China. An overall 3.21% relative bias was found at the 0.5° scale when compared to the independently observed values [27]. CPAP has been widely used in the evaluation of error characteristics of SPPs [28,29,30,31].
2.2.2. Satellite-Based Precipitation Product
Four SPPs, including PERSIANN-CDR, GPM-IMERG, GSMAP-gauge, and MSWEP, are evaluated in this study. The main parameters for each SPP are listed in Table 1.
The PERSIANN-CDR developed by the National Oceanic and Atmospheric Administration (NOAA) was obtained through the PERSIANN algorithm based on Gridded Satellite (GridSat-B1) data [32,34]. Then, an artificial neural network (ANN) model was trained to correlate changes in the GridSat-B1 brightness temperature of cold cloud pixels and their surroundings with surface rainfall rates from the National Center for Environmental Prediction (NCEP) Phase IV hourly precipitation data. Finally, the bias adjustment for precipitation estimates has been applied by matching the Global Precipitation Climate Project (GPCP) Monthly Product Version 2.2 (GPCPv2.2) at 2.5° resolution. The spatial coverage of this precipitation product is 60° N–60° S and its highest temporal resolution could reach up to 3 h [33].
The GSMAP [46] is developed for Global Precipitation Measurement (GPM) and is now operated by the Japan Aerospace Exploration Agency (JAXA) in near-real-time. To generate GSMAP-gauge, a Kalman filter was used to integrate both passive microwave (PWM) datasets and infrared (IR) datasets [38]. Then, the atmospheric motion vector derived from the IR images was adopted to refine the precipitation rate based on the backward and forward morphing technique. Furthermore, the rain type data from the TRMM Precipitation Radar and a scattering algorithm were used to separate the rain and no-rain cases. Finally, to improve its accuracy, a correction algorithm was implemented to GSMAP-gauge based on the observations from the NOAA Climate Prediction Center (CPC) [39,40].
MSWEP is a newly released global precipitation dataset [43] with a 3 h temporal resolution and 0.1° spatial resolution since 1979. It combines the strengths of gauge-based, satellite-based, and reanalysis data to improve performance in densely measured, convective-dominated, and front-dominated weather conditions and provides high-quality precipitation estimates on a global scale [41]. MSWEP V2.8 features new data sources, improved weight values, fewer peak estimation statistics, longer records, and near-real-time estimation for compatibility with multi-source weather (MSWX) [42], showing significant advantages over other precipitation products in both intensively measured and unmeasured regions [44,45]. The main steps for obtaining MSWEP include: (1) data quality control for both satellite-based retrievals and in situ observations, (2) data assessments of satellite-based retrievals based on observations from various sources, (3) determination of weights for each input source, (4) long-term mean precipitation calculation based on the WorldClim dataset, (5) precipitation frequency correction, (6) calculation of precipitation distribution and its harmonization, and (7) merging of different data sources based on an interpolated weight map.
After the Tropical Rainfall Measuring Mission (TRMM), the National Aeronautics and Space Administration (NASA) and the Japan Aerospace Exploration Agency (JAXA) launched the Global Precipitation Measurement (GPM) program in 2014 to take over from the precipitation measurement mission [35,36,37]. The GPM core observatory collects data from non-solar synchronous orbit, extending the coverage to higher latitudes for providing a near-global view of precipitation. The 30 min IMERG precipitation data were calculated by incorporating instantaneous PMW estimates when available and PMW estimates propagated from precipitation time series based on the Lagrangian interpolation technique. Then, IR images were adopted to replenish the area where PMW estimates were not available or of low-quality. Finally, to refine the quality of data, the preliminary precipitation estimates were calibrated with the GPCC monthly data. The GPM IMERG data used in this paper are the latest generation of satellite fusion inversion data with 0.1° spatial resolution and 0.5 h temporal resolution [37].
PMW data from low earth orbit satellites could provide relatively high-quality estimates but with limited samples, while IR data from geosynchronous orbit satellites could provide data with excellent temporal resolution, but the indirect relationship with estimates results in large uncertainty [28]. The four selected precipitation products are generated from both PMW and IR retrievals with global coverage and near-real-time release but with different data sources and generating algorithms. GPM product is generated using an Integrated Multi-Satellite Retrievals algorithm, GSMAP-gauge is based on the moving vector with the Kalman filter method, and PERSIANN-CDR is generated based on the Artificial Neural Network algorithm. GPM and GSMAP-gauge estimate precipitation using PMW where available and IR elsewhere. In contrast, PERSIANN-CDR estimates the rainfall rate using IR data which is updated when PMW data are available. MSWEP is created by combining multiple datasets, such as the Climate Prediction Center morphing technique (CMORPH), Tropical Rainfall Measuring Mission Near Real-Time Product (TRMM 3B42RT), and European Centre for Medium-Range Weather Forecasts Interim Re-Analysis (ERA-Interim) by using a weighted assembling technique.
In this paper, daily precipitation data from 2016 to 2019 were obtained for PERSIANN-CDR, MSWEP, GSMAP-gauge, GPM products, and CPAP. The reference dataset (CPAP) incorporates a higher number of rain gauges in the selected period, and the four-year length is long enough to reveal the error characteristics of SPPs [26,47,48,49]. To be consistent with the observations, the original datasets were resampled to a spatial resolution of 0.25° using the bilinear interpolation method.
2.3. Research Methods
2.3.1. Conventional Statistical Metrics
Quantitative statistical analysis metrics used in this paper are shown in Table 2. The table includes the equations for CC, RB, MAE, RMSE, and NSE as well as the optimal values for performance.
2.3.2. Categorical Indicators
A comprehensive analysis has been conducted to determine whether the product can successfully capture the precipitation event and whether it miscalculates its occurrence. In this paper, the conventional classification evaluation indexes including POD, FAR, and CSI are adopted. In addition, to further check the capability of SPP for identifying precipitation events with volume information, the probability of true detection (POTD) has been adopted by following [17]. When a precipitation event is detected, it is used to assess whether SPPs can correctly capture precipitation volume within ±25% tolerance [17]. The detailed calculation formulas are shown in Table 3.
The detection of precipitation events by SPPs is mainly divided into four cases, where H in the table indicates that both ground-based stations and SPPs monitor the occurrence of precipitation events, TH indicates that the occurrence of precipitation events is correctly detected and the precipitation volume is accurately estimated (±25% tolerance), OH means the precipitation volume is overestimated, and UH means the precipitation volume is underestimated. F means that the SPPs do not monitor precipitation, but the ground-based stations record precipitation, and M indicates that the SPPs monitor the occurrence of precipitation events but the ground-based station records no-rain cases. Finally, N means that both the SPPs and the ground-based stations detect no-rain cases (Table 4). The POD, POTD, FAR, and CSI all take values from 0 to 1. When the SPP observes the occurrence of a precipitation event, the error evaluation index of whether precipitation actually occurs is POD. When the POD is closer to 1, it indicates that the SPP has a higher correct detection rate of the precipitation event and can accurately record the occurrence of precipitation events. The higher the POTD, the better the capture effect of precipitation. FAR indicates whether the SPP successfully detects the precipitation event as it occurs on the ground. The closer FAR gets to 0, the lower the probability that the SPP will incorrectly estimate the precipitation occurrence. POD, POTD, FAR, and CSI are used to comprehensively evaluate the capability of detection of precipitation conditions by the SPPs. The closer the CSI is to 1, the higher its comprehensive detection capability of precipitation events. By following the previous studies [50,51,52], the precipitation event is defined as the daily precipitation amount larger than 0.1 mm/day.
3. Results
3.1. Evaluation at a Multi-Year Scale
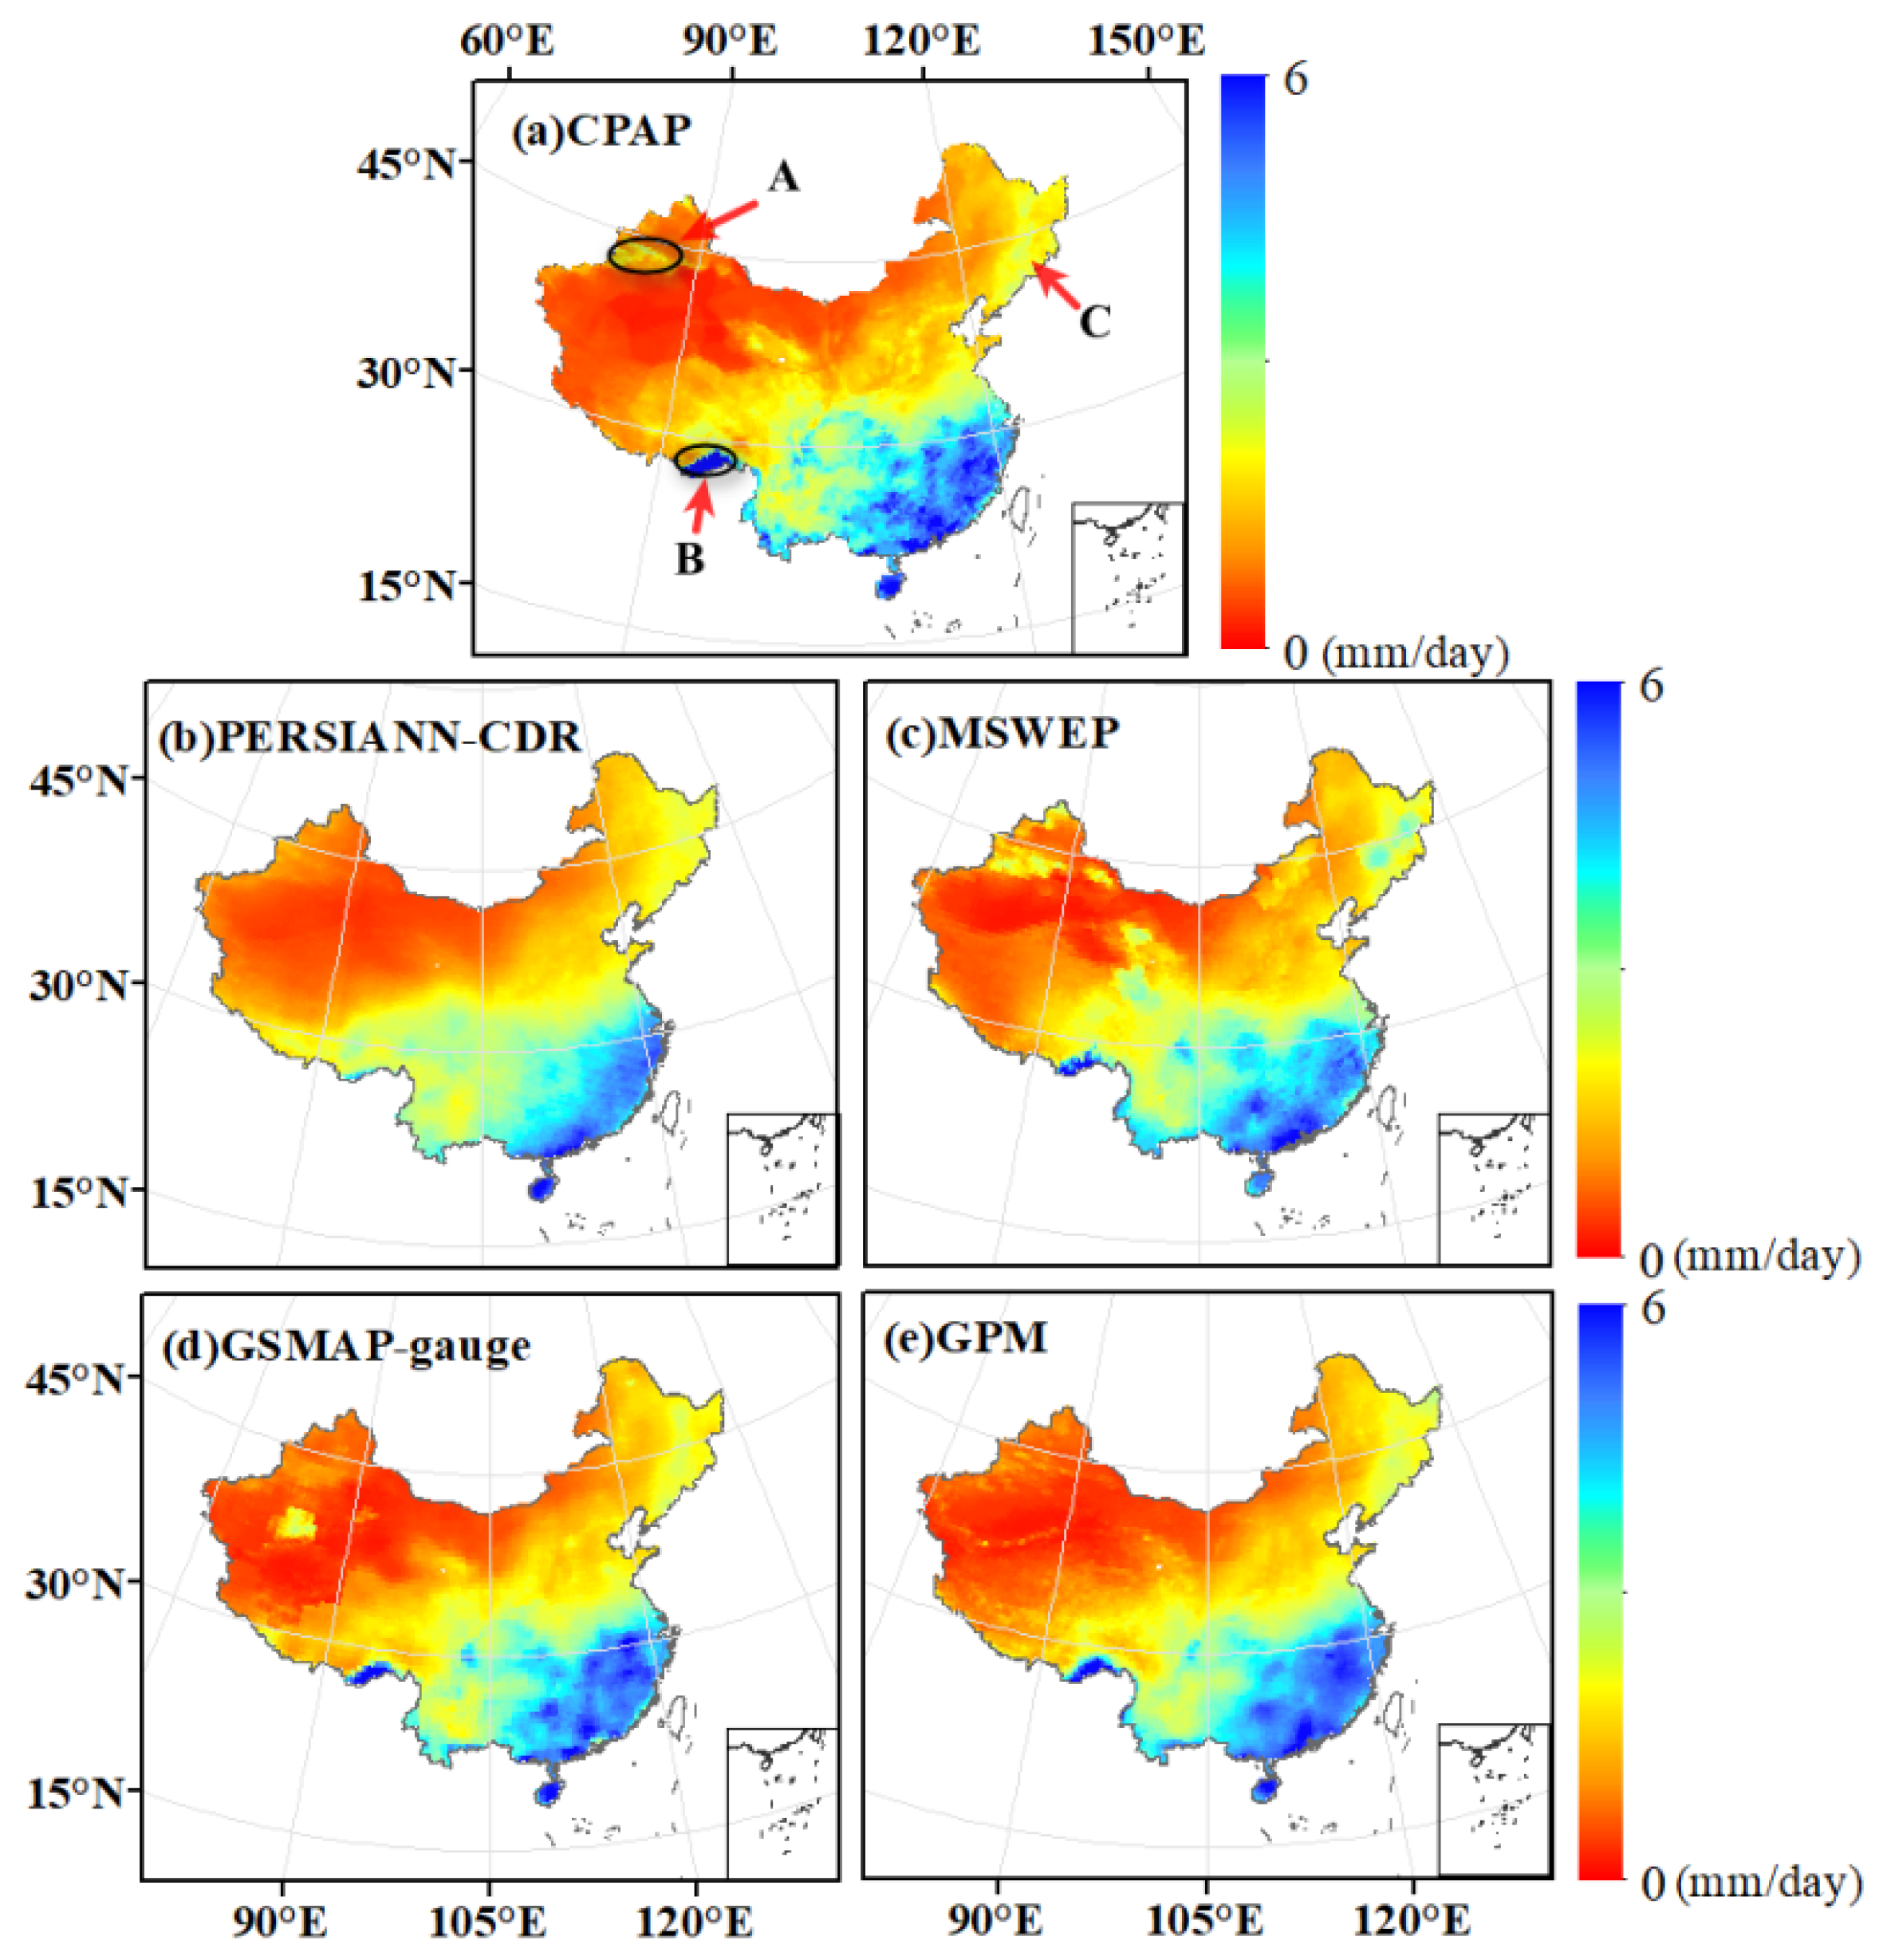
A spatial distribution map of multi-year averaged daily precipitation of SPPs (i.e., PERSIANN-CDR, MSWEP, GSMAP-gauge, and GPM) and CPAP was calculated (Figure 2). From Figure 2a, it can be seen that the spatial distribution of precipitation is more in the southeast and less in the northwest, and there are some high precipitation values in the topographic area (e.g., southwestern China). All four SPPs could capture the general spatial pattern of multi-year precipitation, which is witnessed by the similar pattern of more precipitation in the southeast and less in the northwest.
Interestingly, among the four SPPs, PERSIANN-CDR underestimates precipitation over many areas, which are mainly concentrated in the southeast and southwest parts of China (Figure 2b). In addition, PERSIANN-CDR misses a lot of precipitation in the Brahmaputra Grand Canyon marked by the character B in Figure 2a. In Figure 2c, the spatial distribution pattern of precipitation between MSWEP and CPAP is consistent, especially in the Yili River Valley and its surrounding areas, marked by the character A in Figure 2a, and the difference in precipitation between deserts and mountains can be clearly distinguished. At the same time, the precipitation in the mountains is slightly overestimated, which is also verified by the Changbai Mountains in northeastern China, marked by the character C in Figure 2a. The GSMAP-gauge and GPM seem to be closer to the precipitation conditions in eastern China, as reflected in Figure 2d,e. PERSIANN-CDR performs relatively worse than the other three SPPs in terms of the spatial distribution of the multi-year mean daily precipitation, with a smoother pattern but lacking the details of mountainous precipitation. GSMAP-gauge and GPM perform well in the coastal areas of China, while MSWEP shows better performance in the inland areas of northwest China.
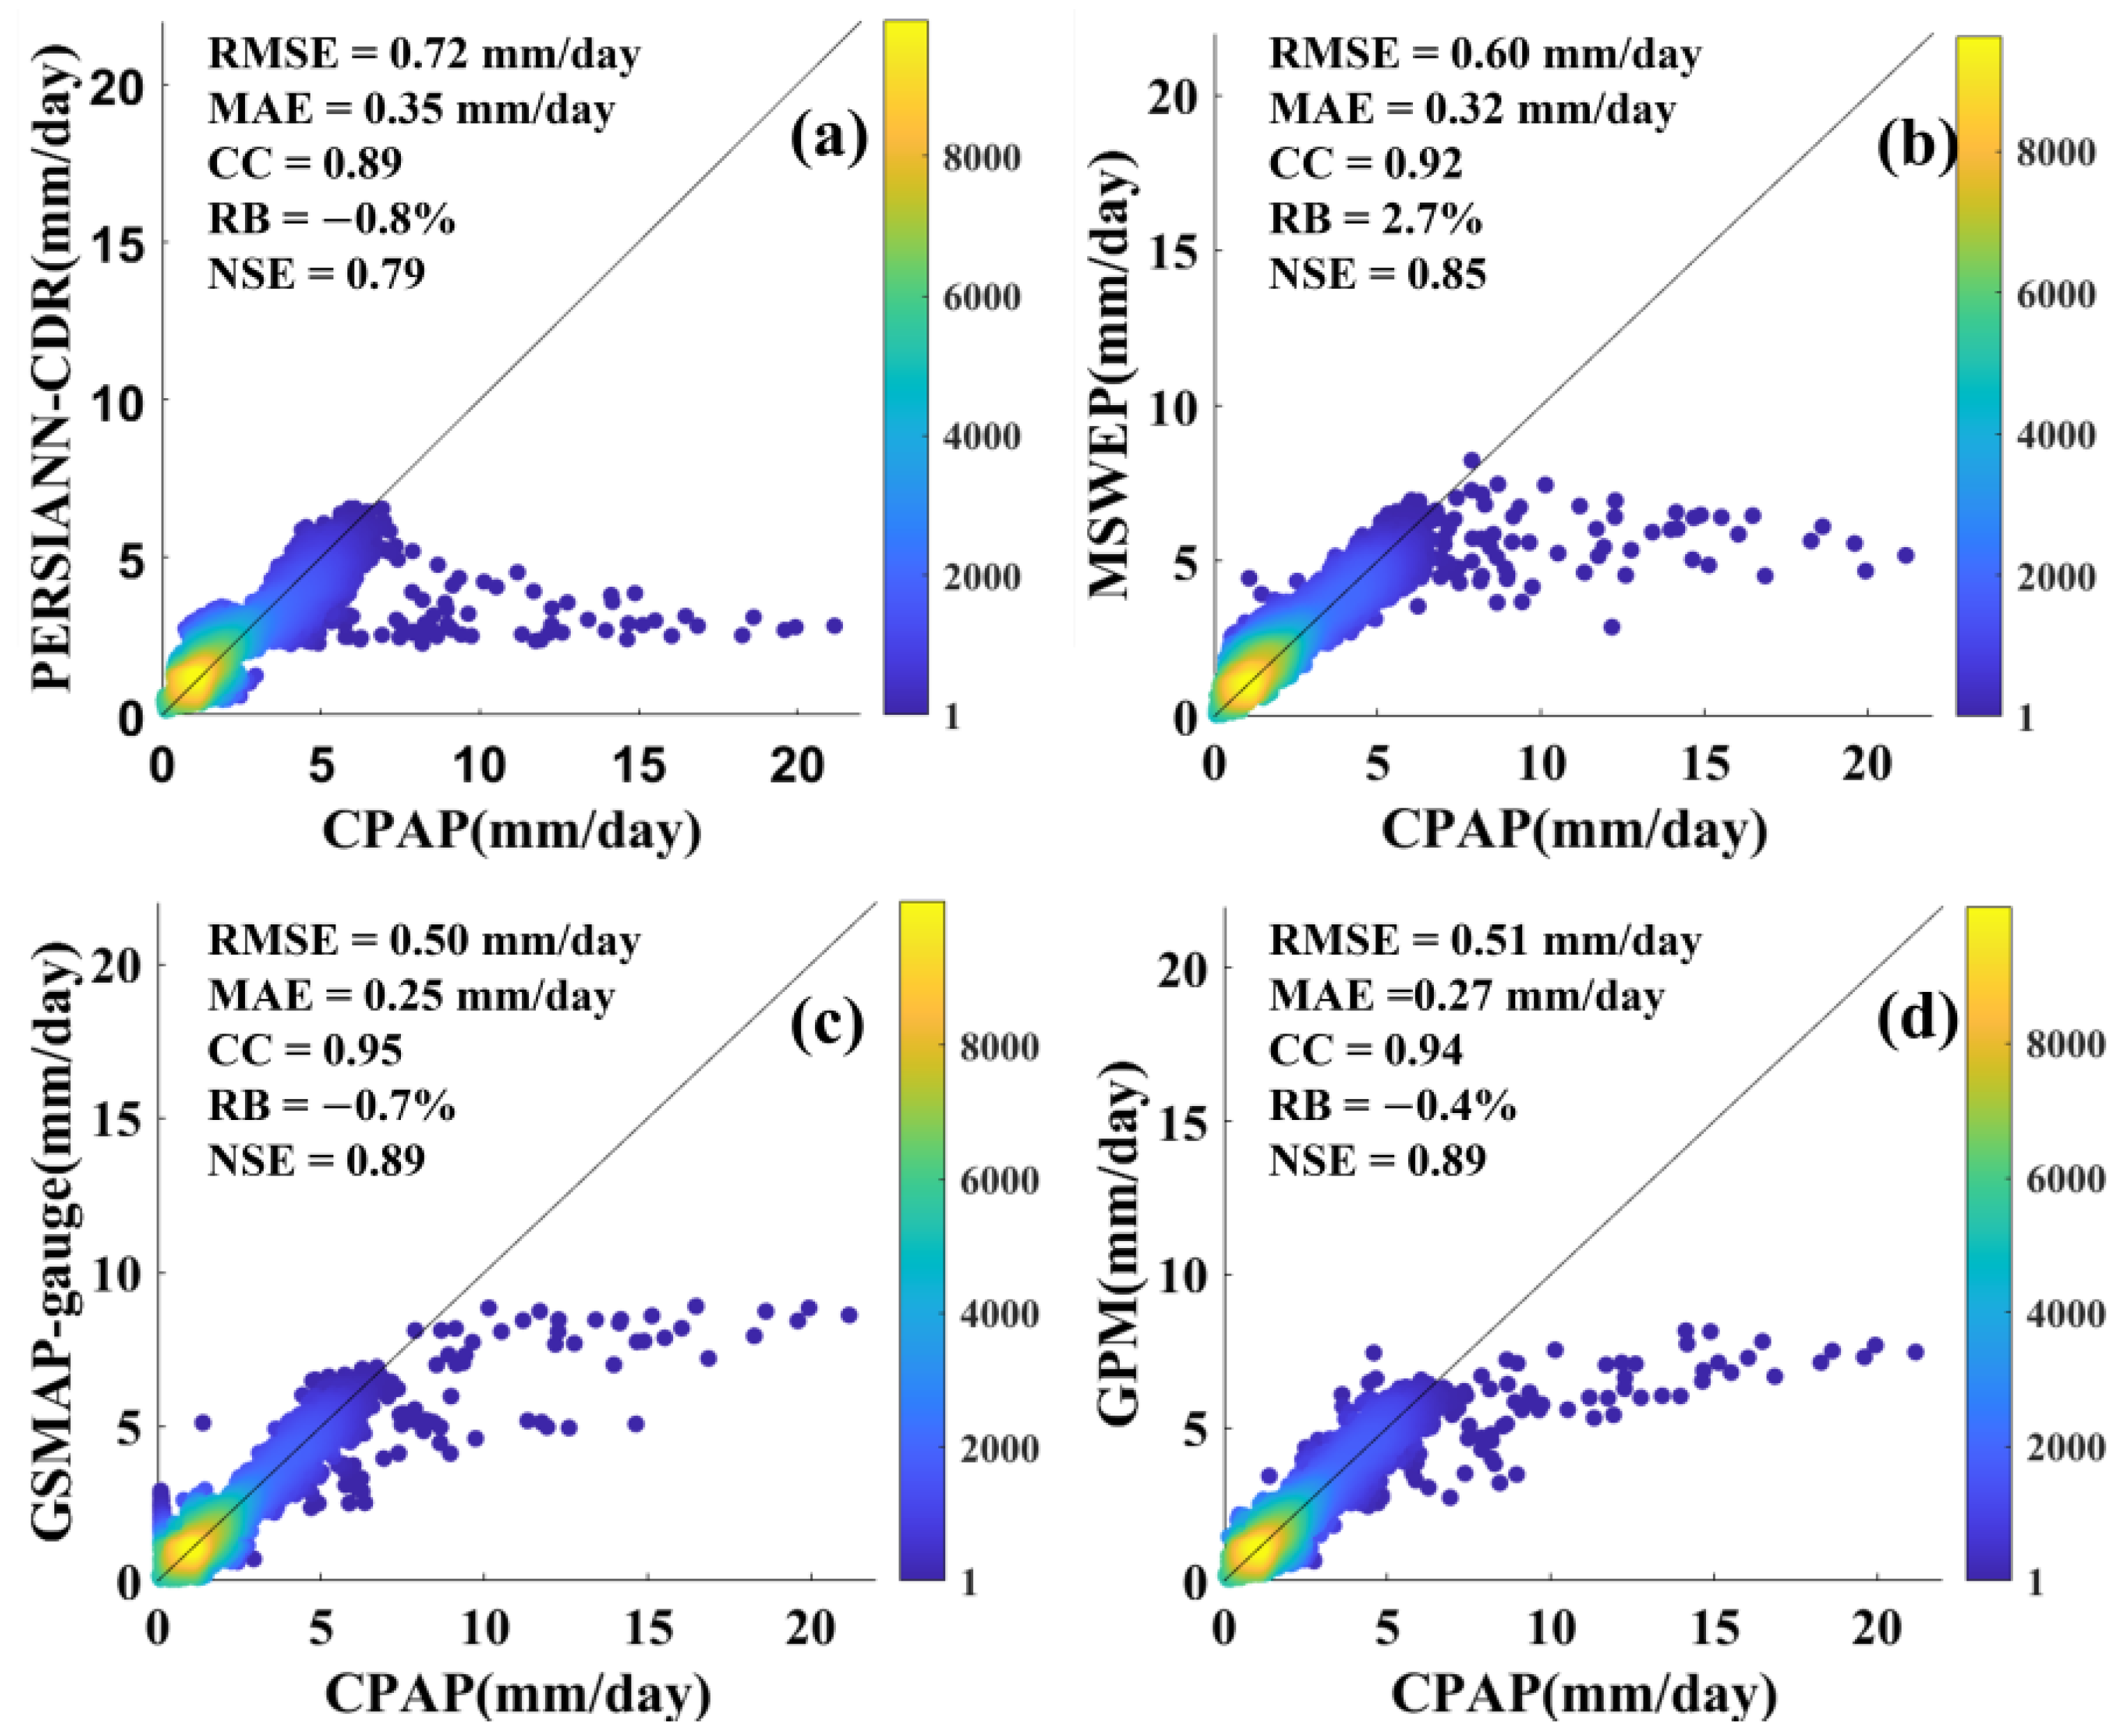
Figure 3a–d shows the daily precipitation scatter density plots and each statistical index of the four SPPs with CPAP. The color bar in each scatterplot represents the density of points, which is calculated based on the corresponding grids between SPPs and CPAP in the multi-year average precipitation map. In Figure 3, the horizontal coordinates of each point represent the in situ precipitation observation, and the vertical coordinates represent the precipitation estimates from four SPPs. It is found that there is a long right-skewed tail in each subplot of Figure 3. When the precipitation intensity is greater than 10 mm/day, this shows a significant underestimation of precipitation for all SPPs. This phenomenon is mainly due to the SPPs’ significant underestimation of the terrain precipitation in the Brahmaputra Grand Canyon, which is denoted by the B character in Figure 2a. Generally, SPPs have a good agreement with CPAP, as evidenced by the points distributed close to the 1:1 line when daily precipitation is less than 10 mm/day.
To analyze the relationship between SPPs and CPAP from a more objective perspective, CC, RB, RMSE, MAE, and NSE metrics were also calculated in Figure 3. The estimated precipitation of the four SPPs and the precipitation measured by ground stations show a strong correlation of about 0.9 CC values. The NSE coefficients of SPPs are all above 0.75, demonstrating the excellent hydrological simulation performance. PERSIANN-CDR, GSMAP-gauge, and GPM tend to underestimate precipitation over mainland China with RB values of −0.8%, −0.7%, and −0.4%, respectively. However, MSWEP tends to overestimate precipitation with an RB of 2.7%. In contrast, among the four SPPs, PERSIANN-CDR performs the worst (Figure 3a), with the highest RMSE (0.72 mm/day) and MAE (0.35 mm/day), and the lowest CC (0.89). GSMAP-gauge performs best, with the highest CC (0.95) and the lowest MAE (0.25 mm/day) and RMSE (0.50 mm/day) (Figure 3c). GPM (Figure 3d) performs similarly to and even better than GSMAP-gauge in terms of RB (−0.4%). Combined density-colored scatterplot results of the SPPs, GSMAP-gauge, and GPM perform the best, followed by MSWEP, while PERSIANN-CDR performs the worst.
3.2. Evaluation at a Seasonal Scale
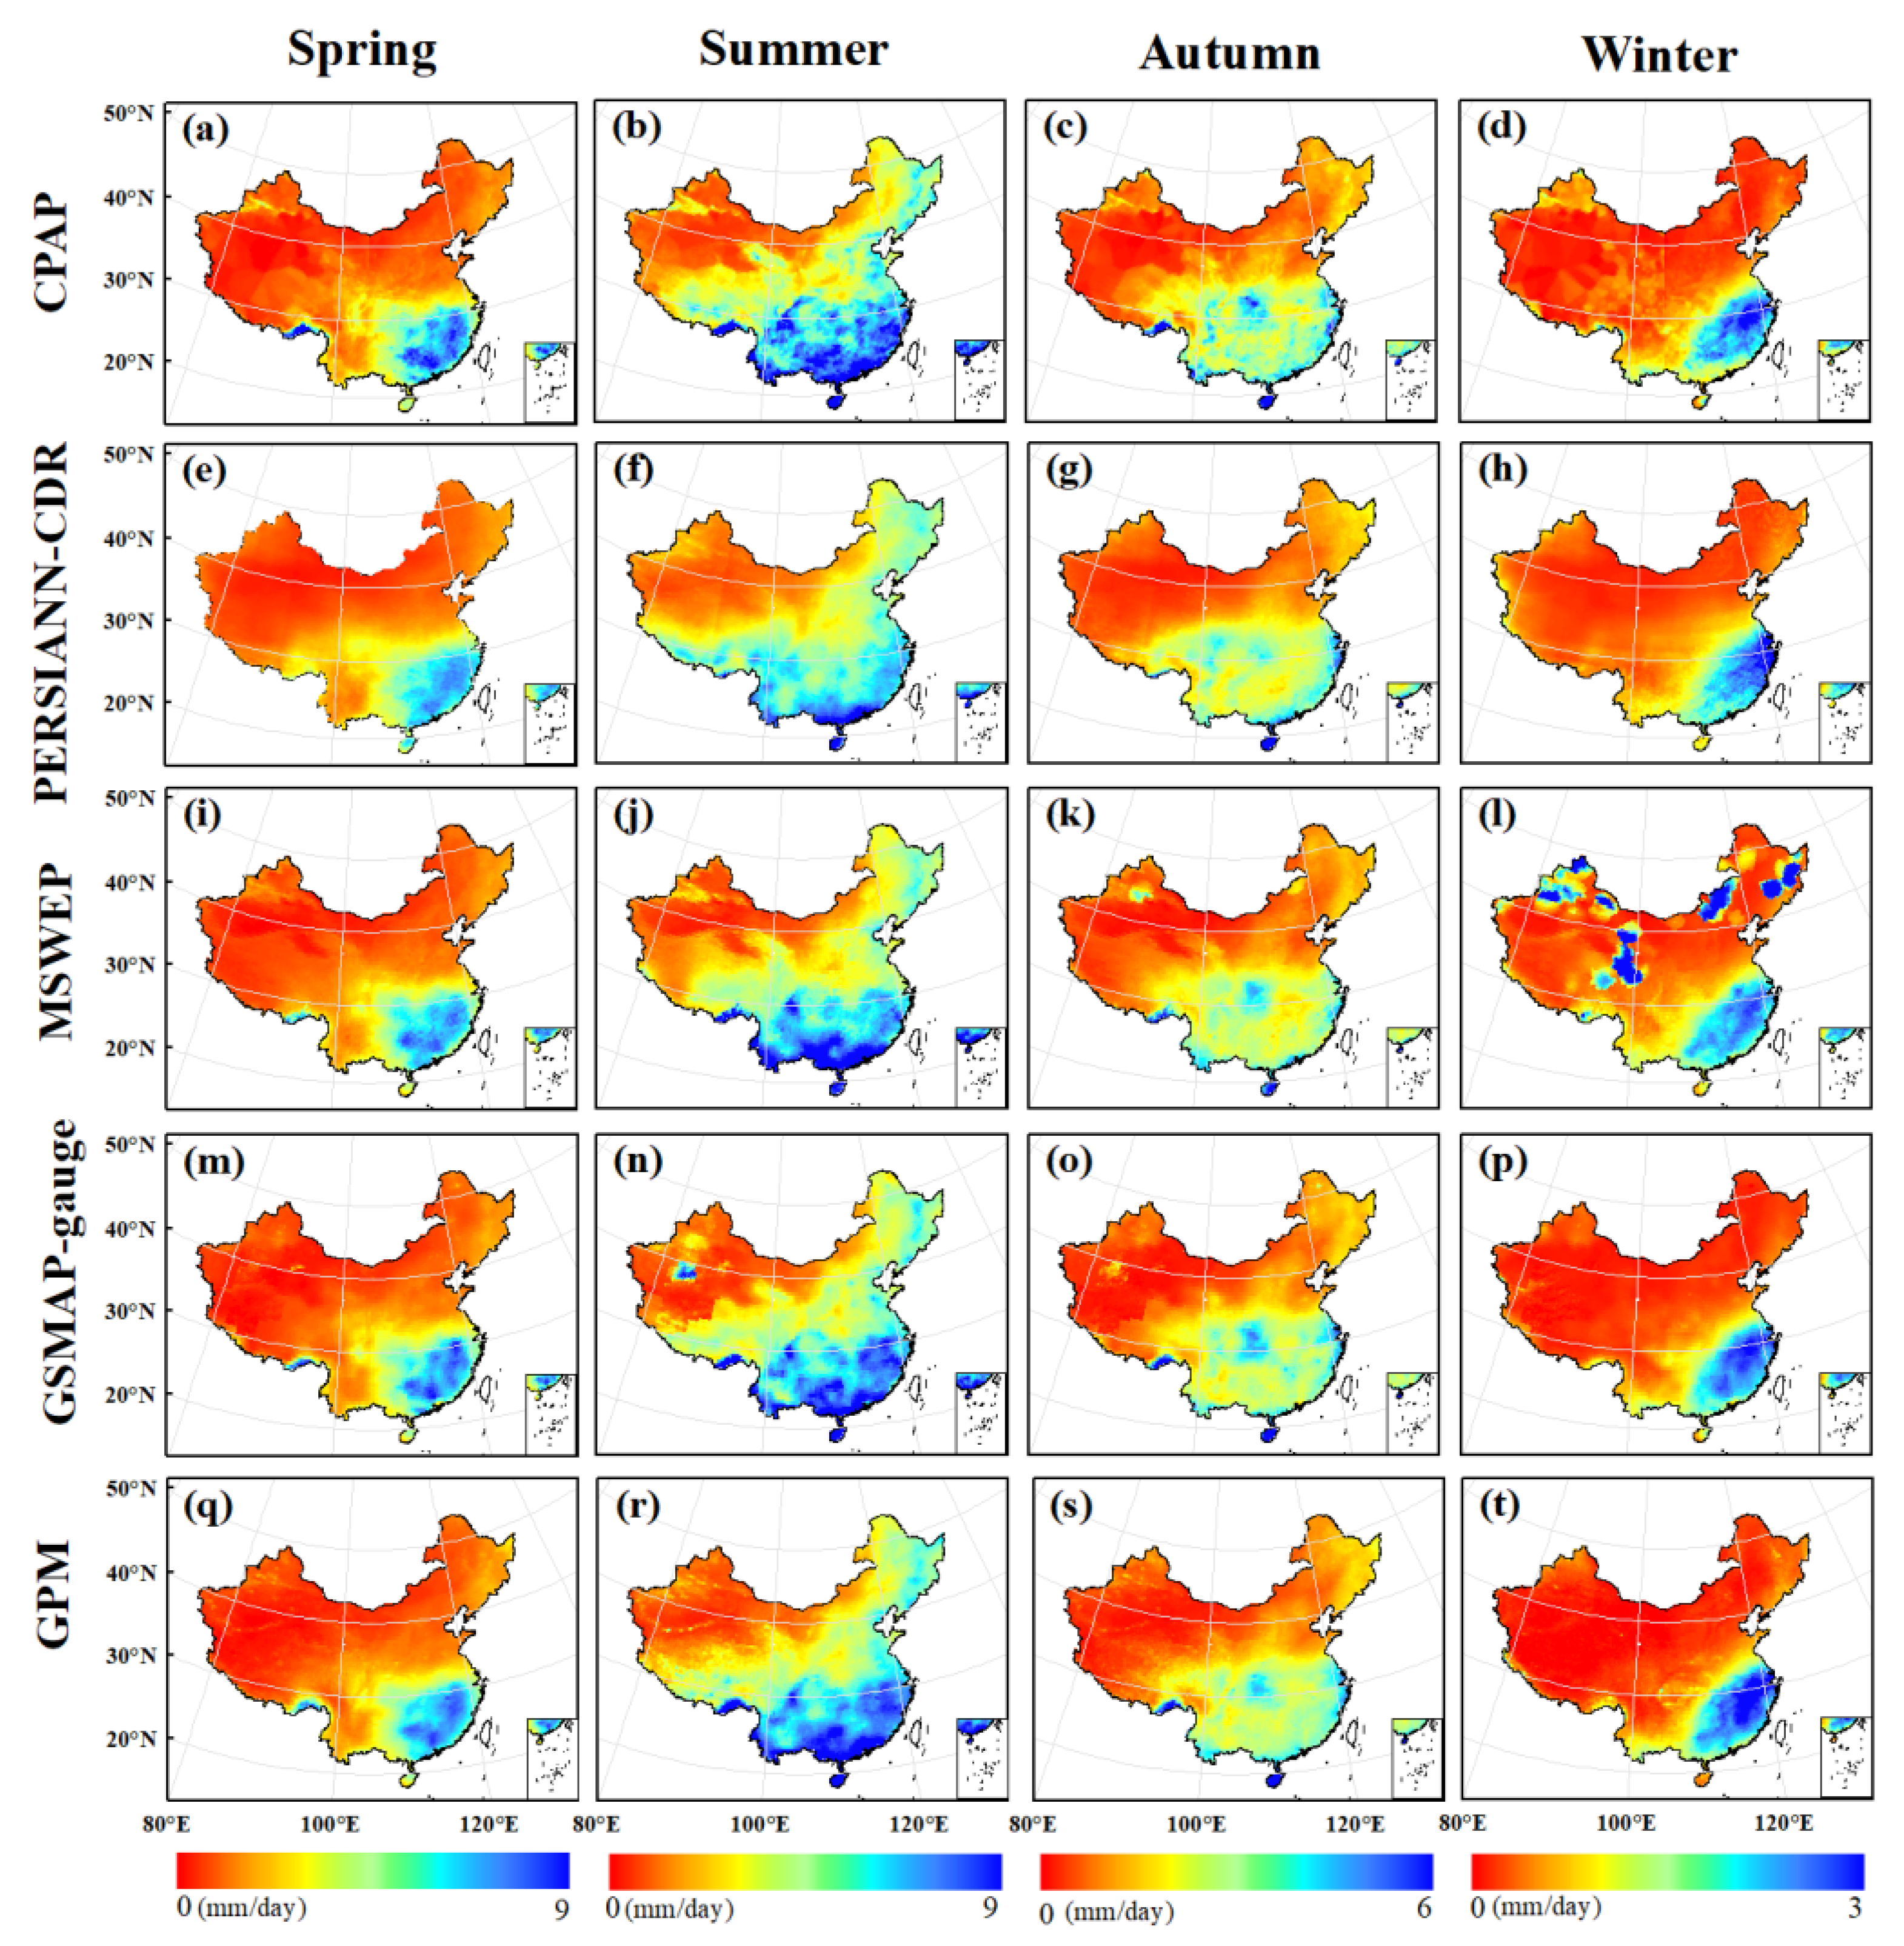
Due to seasonal variations in precipitation, the spatial distribution of precipitation for SPPs and CPAP is presented in Figure 4. From the spatial distribution of CPAP (Figure 4a–d), we can see that mainland China has more precipitation in summer and less in winter, which is generally captured by all SPPs.
Specifically, the spatial pattern of precipitation from PERSIANN-CDR is smoother (Figure 4e–h). In summer, there is a significant underestimation of precipitation in southeastern and southwestern China (Figure 4f), while in winter, PERSIANN-CDR overestimates precipitation in western China (Figure 4h). MSWEP shows the closest spatial pattern in spring, summer, and autumn (Figure 4i–k). It is noteworthy that MSWEP shows several isolated overestimation speckles in winter (Figure 4l). The spatial distribution of precipitation for GSMAP-gauge and GPM is satisfactory in spring and autumn. Nevertheless, they also underestimate summer precipitation in southern China as well as winter precipitation in the inland areas of China.
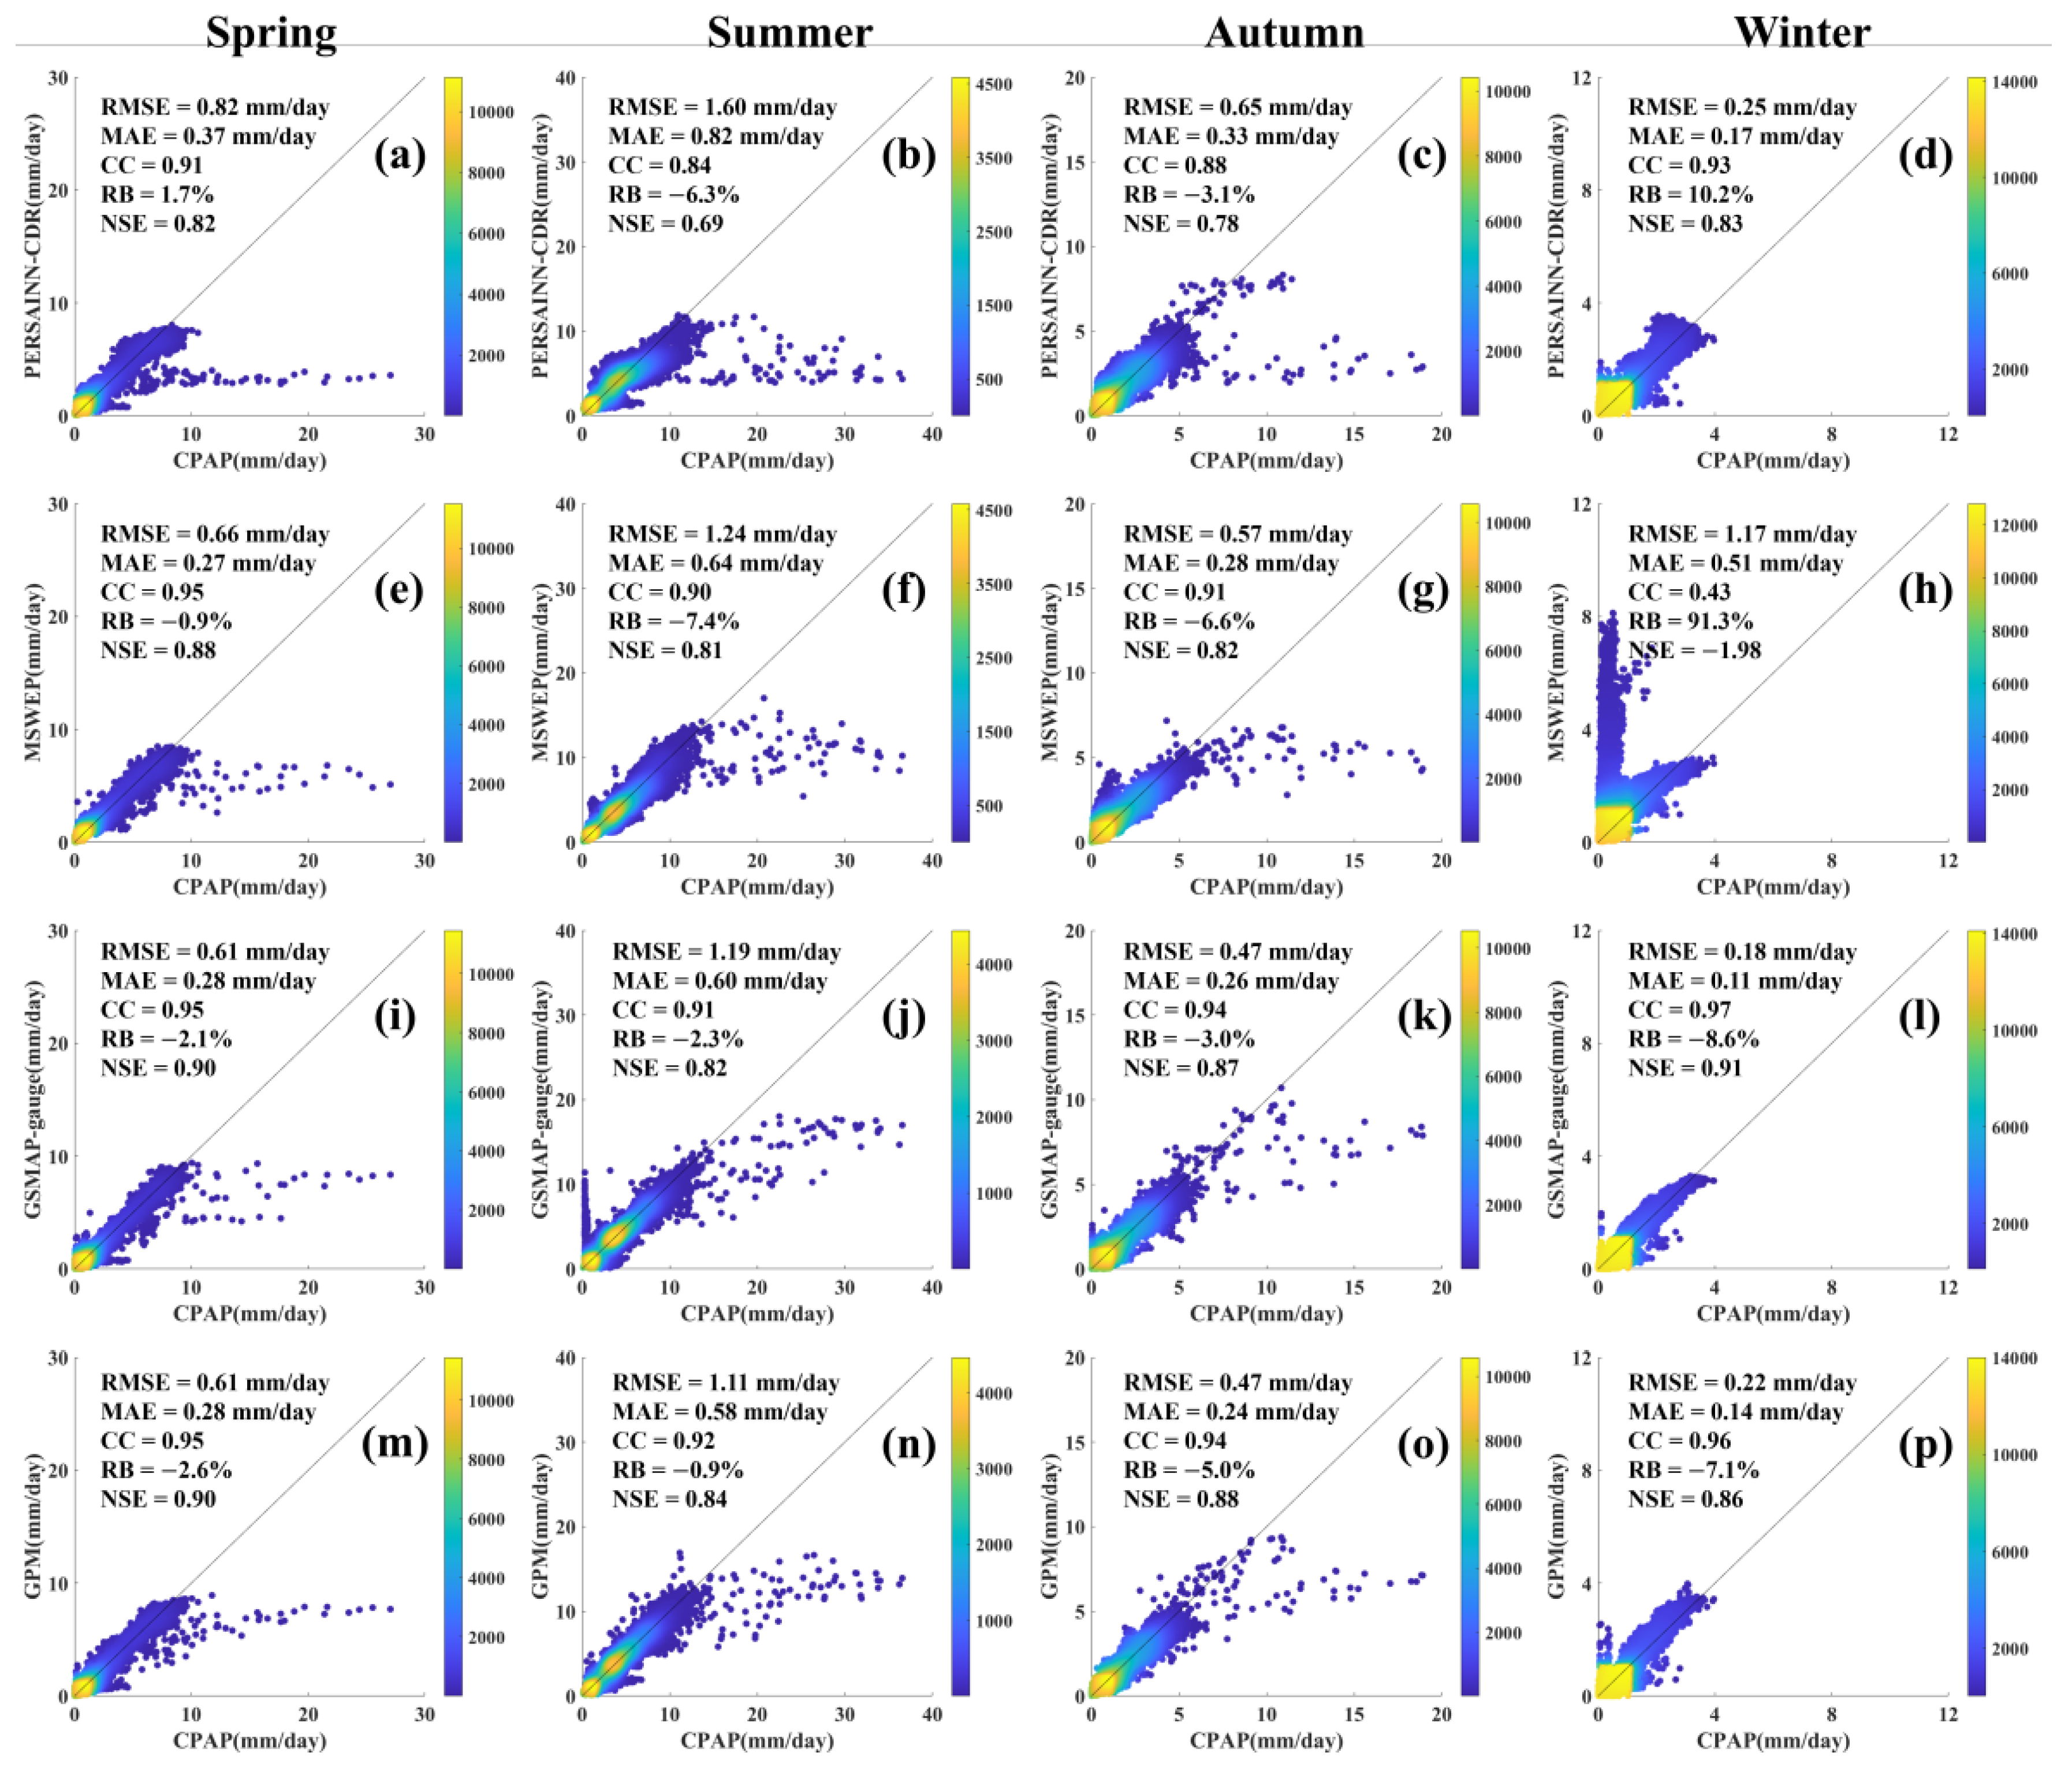
To further examine whether the different seasons will affect the inversion precision of SPPs, Figure 5 quantifies the error between SPPs and CPAP through density-colored scatter plots and statistical indicators. The seasonal characteristics of precipitation can be generally recorded by all SPPs. Except for the density-colored scatter plots of winter precipitation in Figure 5, there is still a long tail. The terrain may be one of the important factors contributing to this phenomenon. Some points deviate significantly from the 1:1 line, which indicates that the precipitation is underestimated over different seasons. All SPPs have CC values close to 0.9 in different seasons, and the highest CC can reach 0.97 (Figure 5l). The only discrepancy is with the observation of MSWEP in winter, where the CC is only 0.43, and the NSE is −1.98, but the RB is strikingly high at 91.3%. When CPAP captures no precipitation or light precipitation occurred in a day, MSWEP considers that a heavy precipitation case occurred, relatively resulting in a large RB. This is consistent with MSWEP’s overestimation of speckles in the spatial distribution of precipitation patterns in winter (Figure 4l).
The SPPs correspond well with CPAP in spring with CC above 0.91. Except for PERSIANN-CDR, which overestimates the precipitation in spring with an RB of 1.7%, MSWEP, GSMAP-gauge, and GPM underestimate spring precipitation with an RB of −0.9%, −2.1%, and −2.6%, respectively. In contrast, MSWEP captures the spring precipitation best over mainland China. The negative values of RB in summer confirm that all SPPs underestimate precipitation. Results are consistent with the underestimation of precipitation in southern China by SPPs in Figure 4. Compared to CPAP, GPM is effective in observing summer precipitation. In autumn, GSMAP-gauge exhibits the best performance with the highest CC (0.94), the lowest RB (−3.0%), and relatively low RMSE and MAE (0.47 and 0.26 mm/day, respectively). The winter precipitation is almost less than 4 mm/day, and the CC of the product is quite high, except for MSWEP. PERSIANN-CDR and MSWEP tend to overestimate precipitation in winter with RB greater than zero, while GAMAP-gauge and GPM tend to underestimate precipitation with negative RB. GSMAP-gauge has the lowest RMSE (0.18 mm/day) and MAE (0.11 mm/day). GPM has the lowest RB (−7.1%) because the sensor of the GPM IMERG selected in this paper is expanded on the basis of the original TRMM, which improves the ability to observe solid precipitation [35,49]. Generally, precipitation during summer and autumn has a greater volume and higher frequency (Figure S1), but the results in Figure 5 show that all SPPs underestimated the precipitation in summer and autumn, resulting in the lowest CC values in the whole year. The phenomenon is consistent with the assessment of seasonal spatial distribution (Figure 4).
3.3. Categorical Evaluation for Precipitation Occurrence and Volume
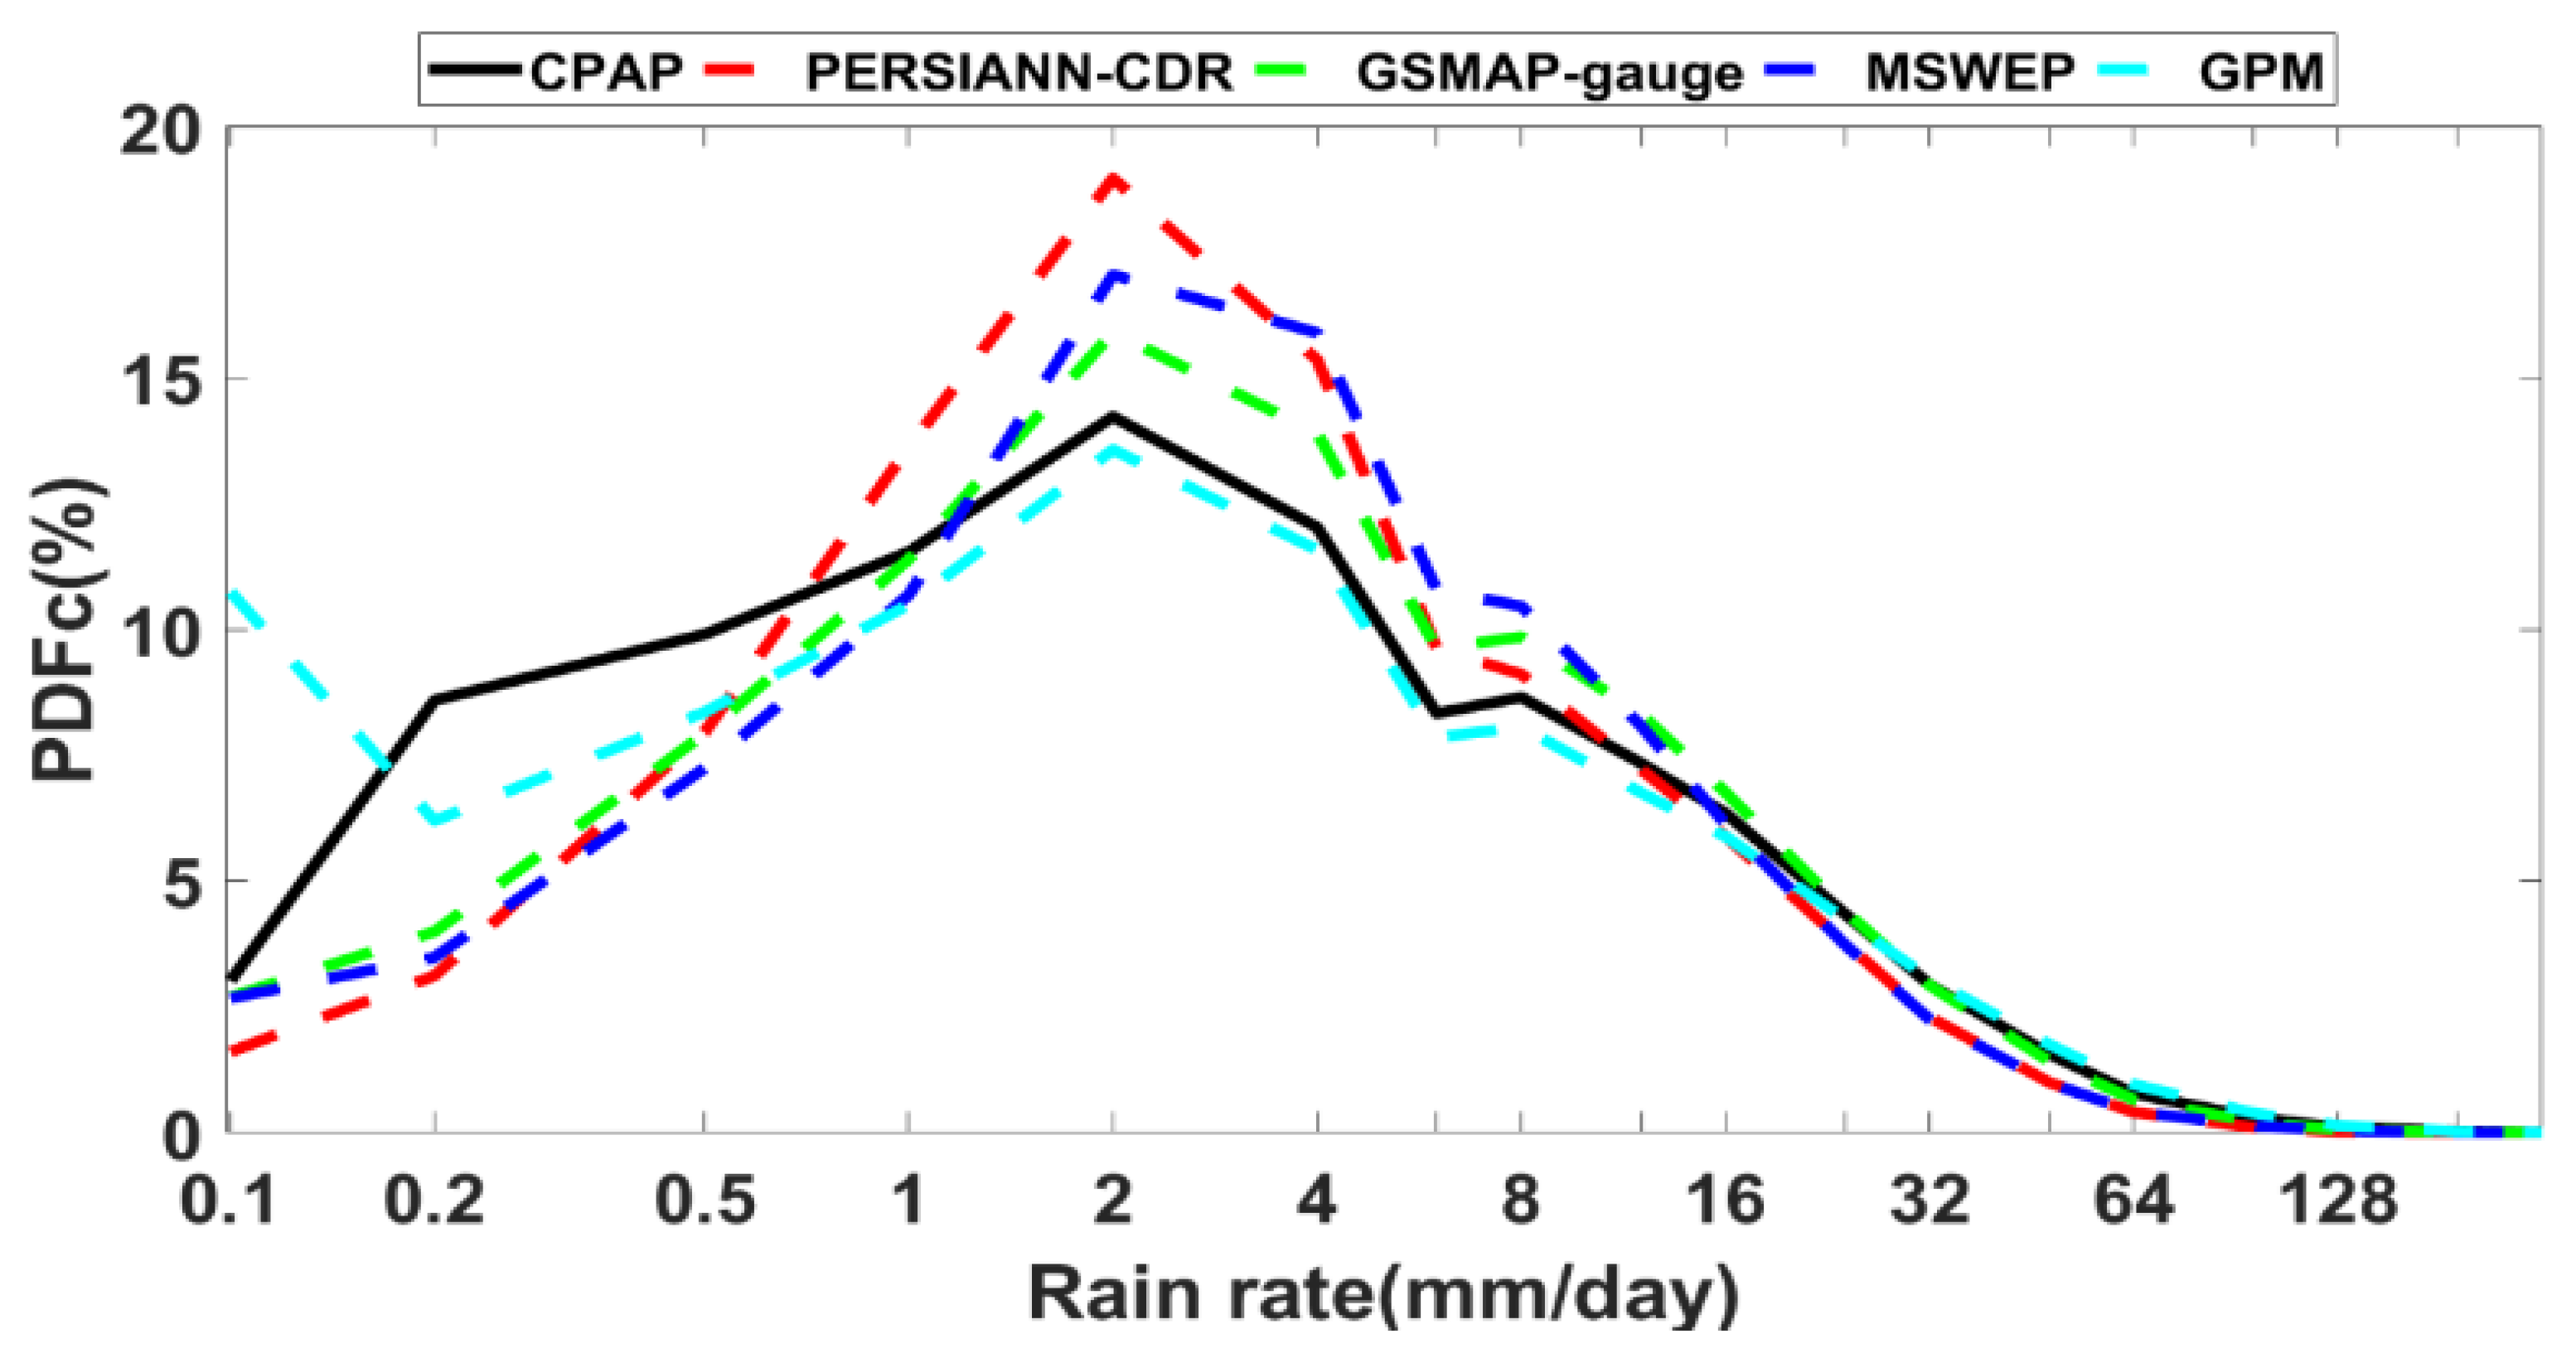
The ability to accurately estimate precipitation of different intensities is an important task for accuracy evaluation. In this paper, the probability distribution function (PDF) of daily precipitation cases (PDFc) is used to reflect the accuracy of SPPs for identifying the rain or no-rain cases. The PDF of daily precipitation volume (PDFv) is used to check the accuracy of SPPs for identifying the precipitation volume under different precipitation intensity levels. Figure 6 shows the PDFc under different precipitation intervals, and Figure 7 depicts the PDFc of each SPP under no-rain cases.
GPM outperforms other SPPs for any precipitation intensity. In the rain rate range from 1 to 16 mm/day, all SPPs except for GPM overestimated precipitation, and the performance of the four SPPs can be sorted as PERSIANN-CDR < MSWEP < GSMAP-gauge < GPM. When the rain rate was less than 0.5 mm/day, SPPs underestimated precipitation. It is worth noting that GPM detected more precipitation events than the ground measurements when the precipitation was less than 0.2 mm/day, which may be related to the interpolation process of CPAP. When the precipitation was higher than 16 mm/day, the frequency of precipitation captured by SPPs was relatively close to that of CPAP. PERSIANN-CDR has the worst performance in detecting heavy precipitation events (R > 16 mm/day), which is indirectly supported by the underestimation of precipitation in southern and southwestern China in Figure 2b.
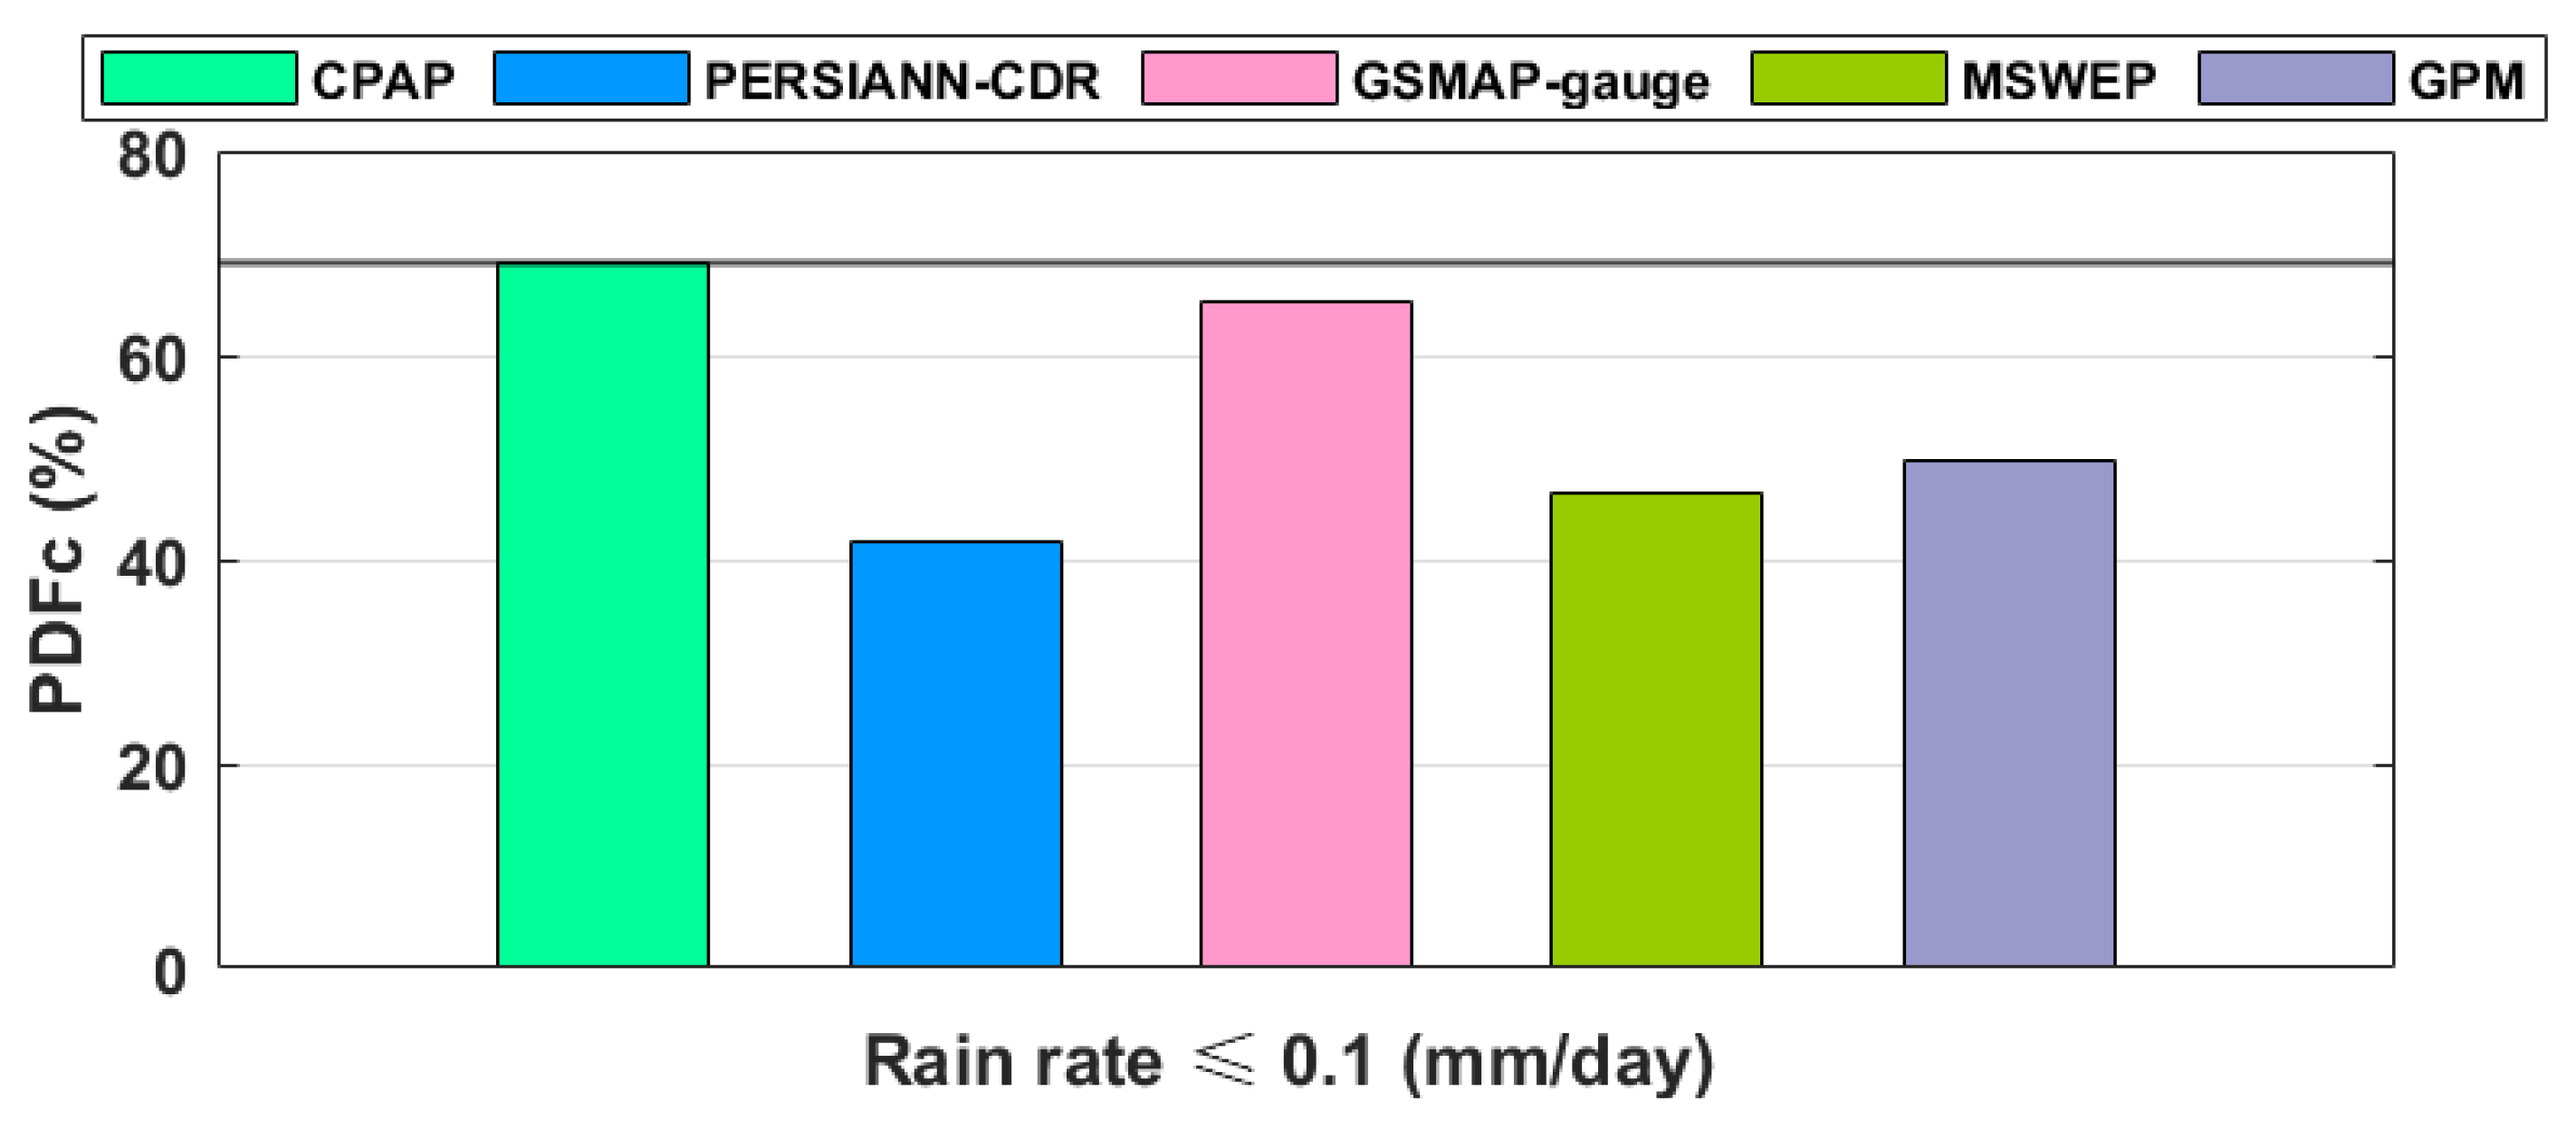
In this paper, Figure 7 separately counts the detection frequency for no-rain cases, which is not included in Figure 6. About 70% are reported by CPAP in the frequency of no-rain events. It is clear that all SPPs detect fewer no-rain cases, which means SPPs detect more precipitation events than CPAP. Among the four SPPs, GSMAP-gauge shows the closest no-rain cases with observations thanks to the gauge correction algorithm. PERSIANN-CDR and MSWEP still perform poorly in detecting no-rain conditions, with values around 40% and 45%, respectively.
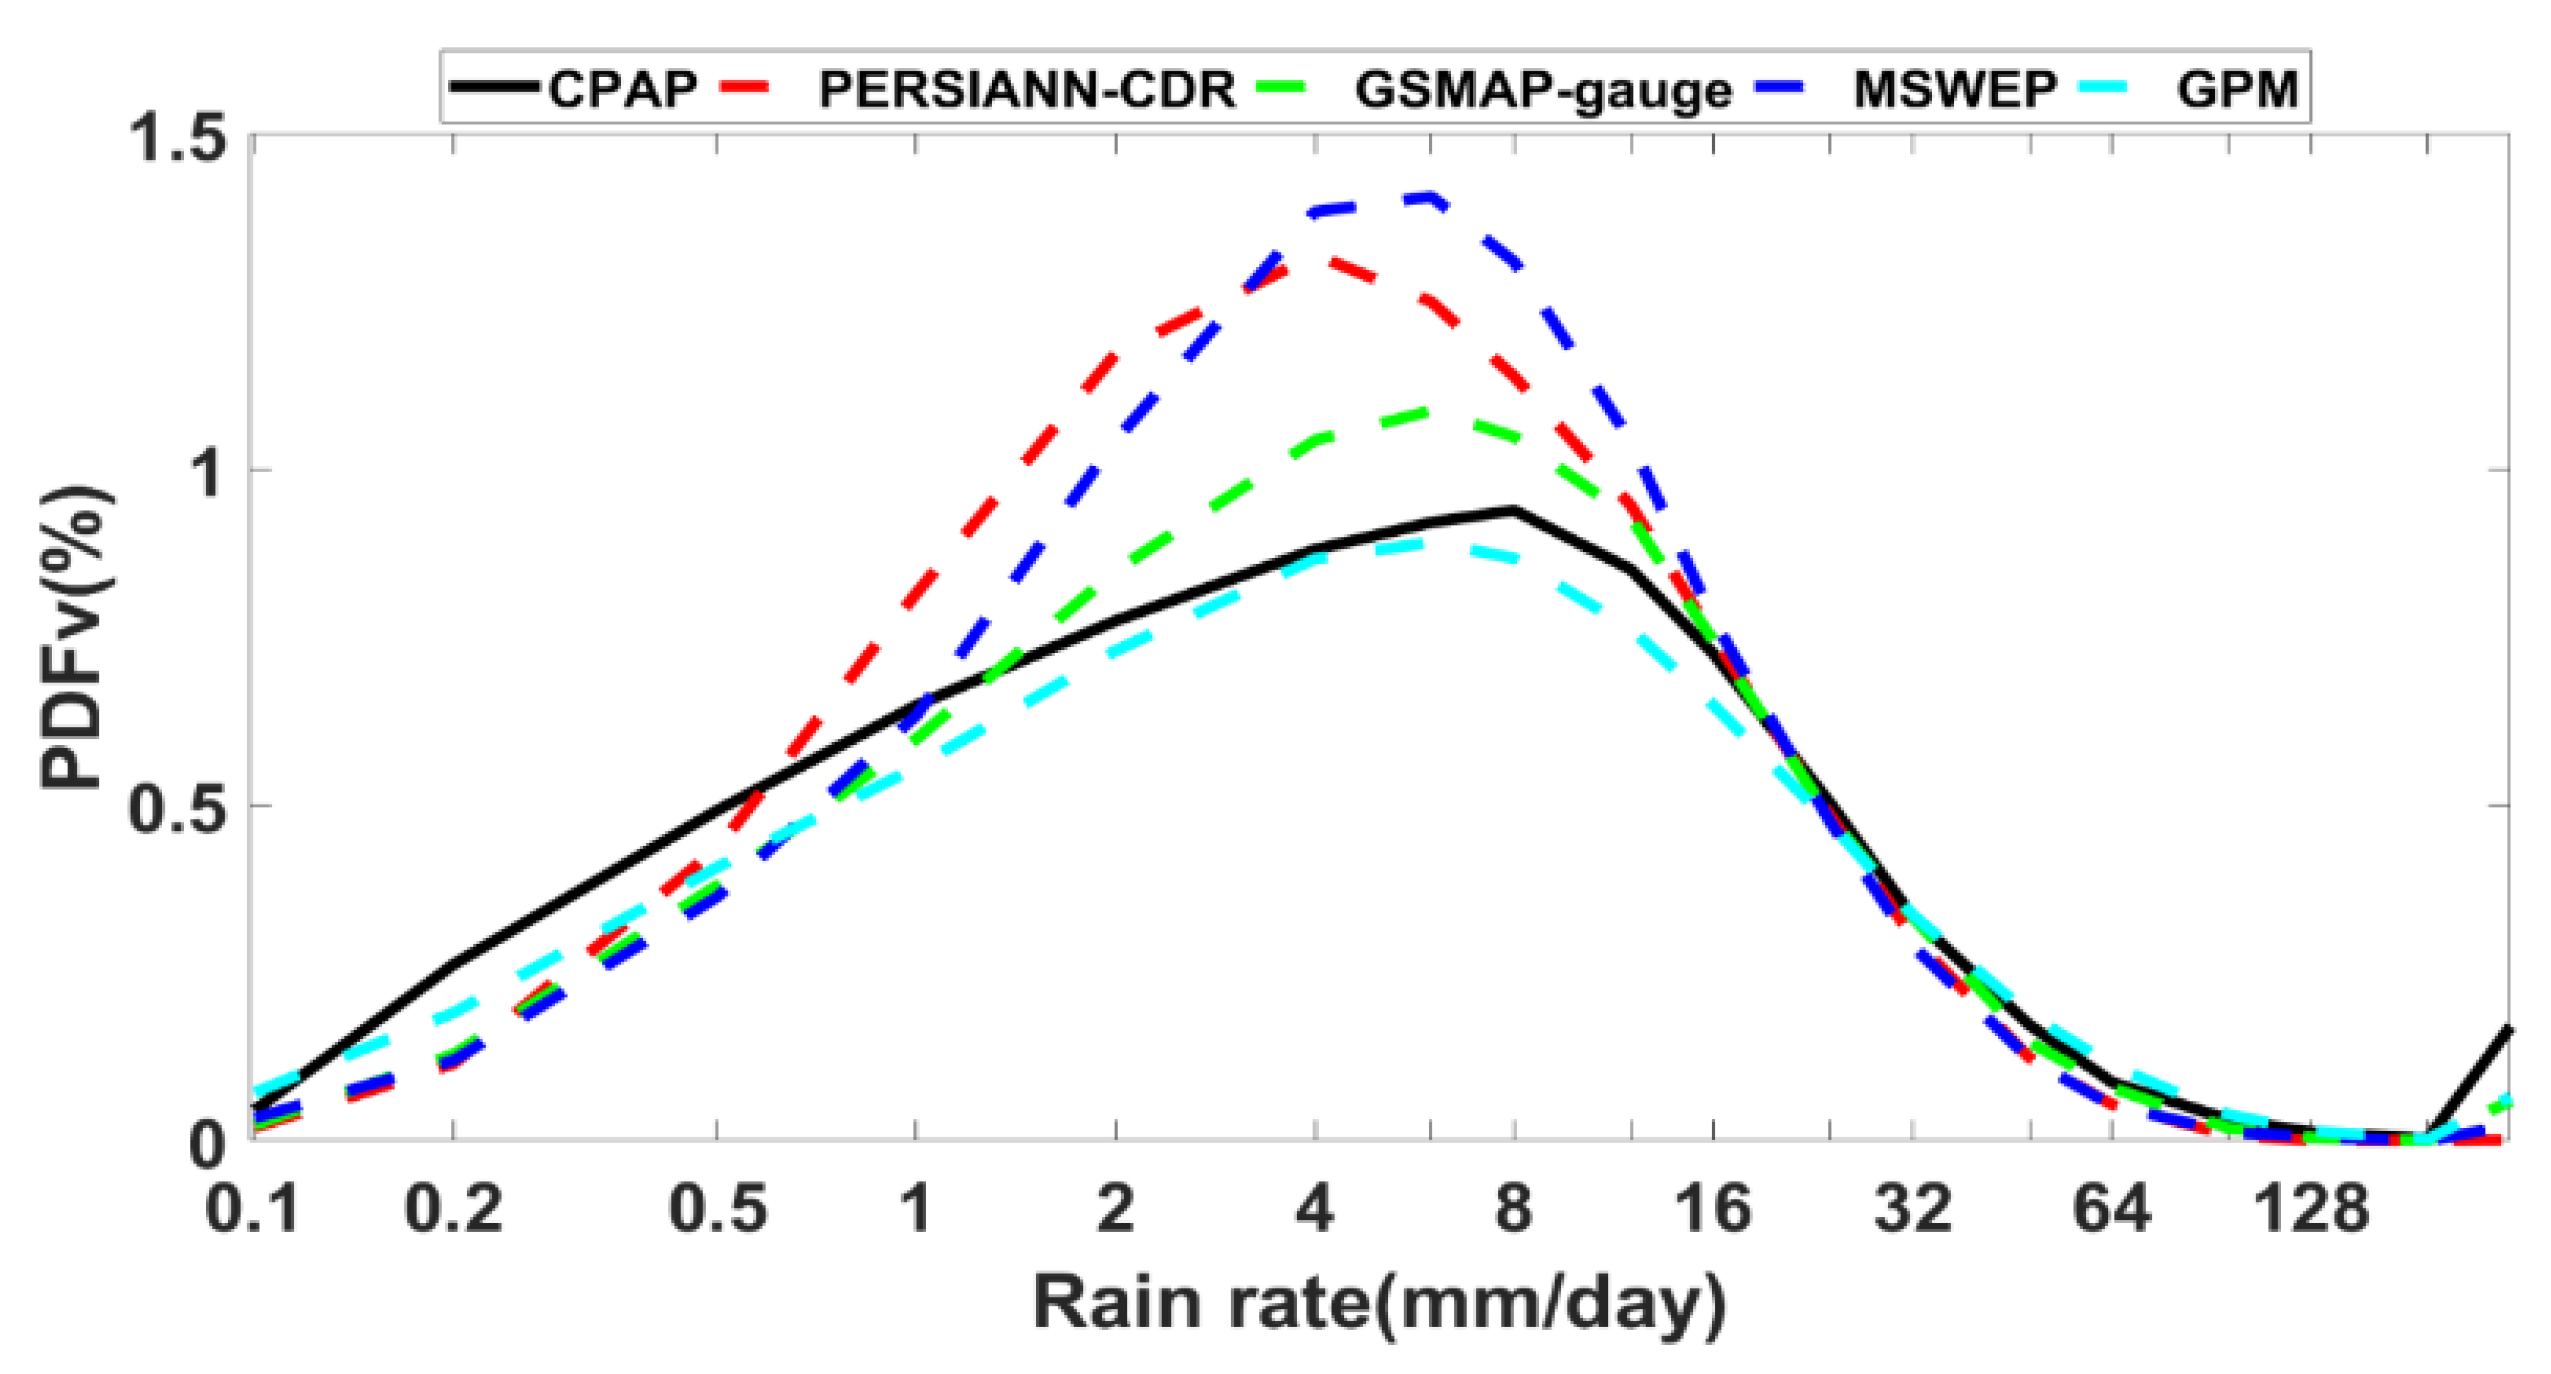
Since PDFc focuses on indicating the frequency of SPPs occurring in certain precipitation intervals, it cannot reflect the proportion of precipitation in the intervals to the total precipitation. Furthermore, Figure 8 is used to show the PDFv under different precipitation intervals. In the rain rate range from 1 to 16 mm/day, all SPPs except for the GPM showed an overestimation of precipitation. When the rain rate was less than 0.5 mm/day or greater than 16 mm/day, all SPPs showed an underestimation of precipitation. In general, GPM accurately captures precipitation in different precipitation ranges, followed by GSMAP-gauge.
3.4. Contingency Evaluation
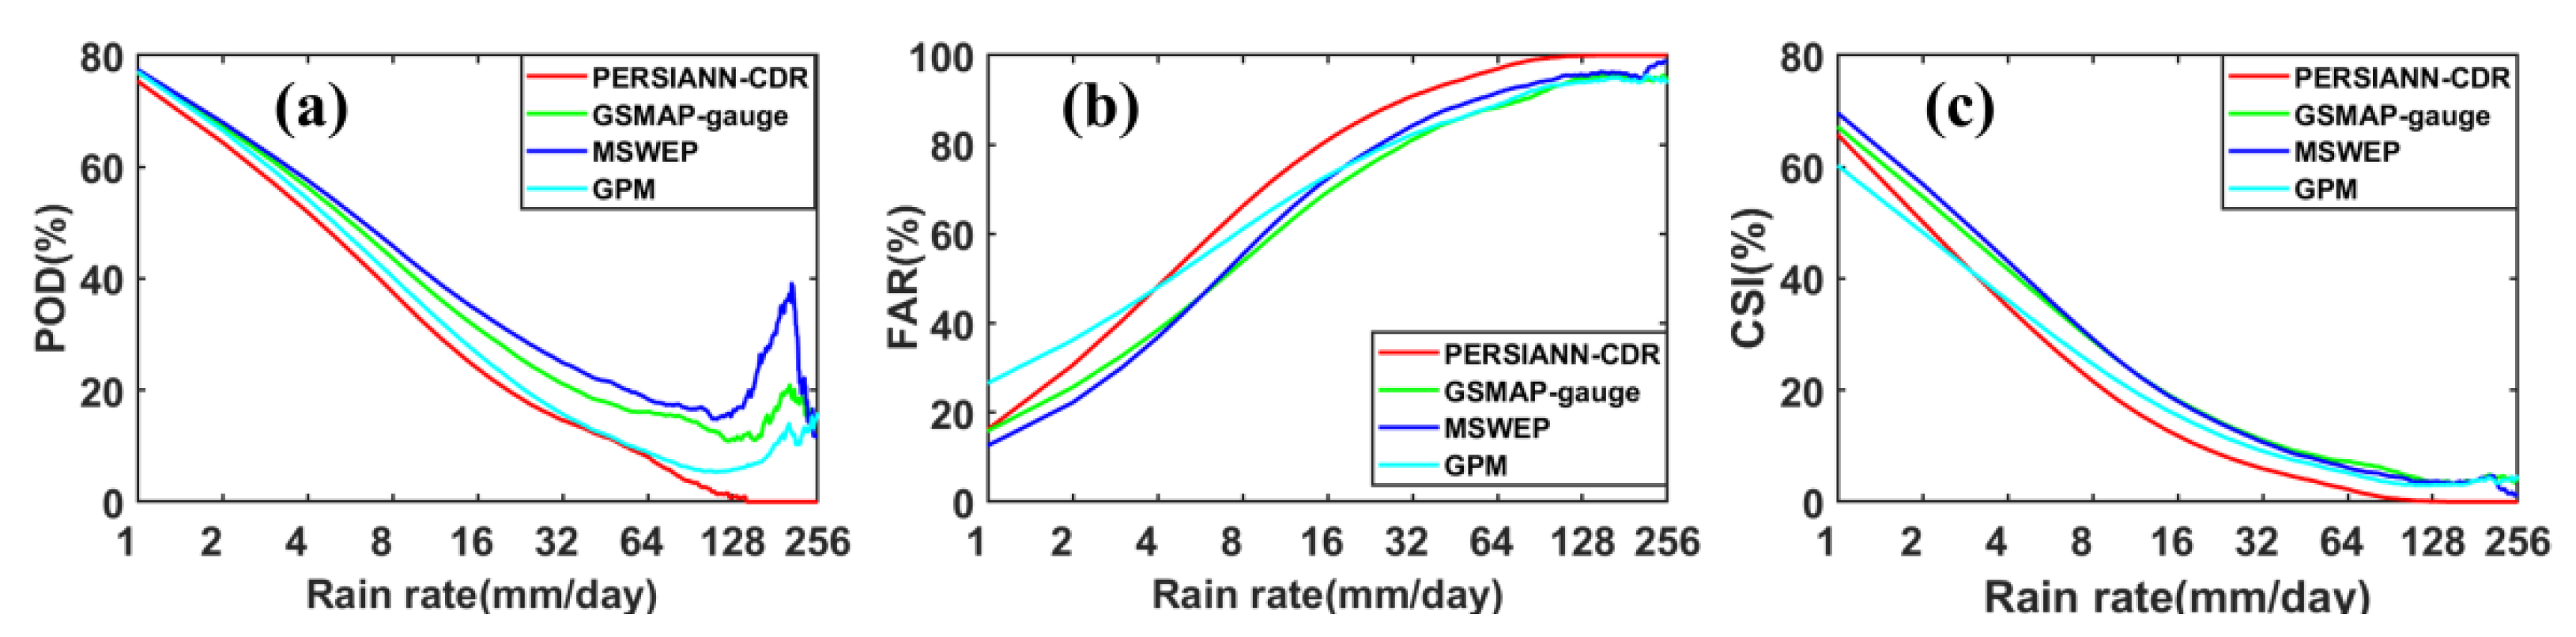
Referring to the categorical indices mentioned in Table 3 to evaluate the performance of SPPs in capturing precipitation events, Figure 9 provides contingency statistics in terms of the POD, FAR, and CSI. For light precipitation (R ≤ 4 mm/day), the POD of SPPs exceeded 60% and the FAR was below 40%, which indicates that SPPs detect light precipitation cases with relatively good confidence. As the rain rate increased, the POD percentage decreased and the FAR percentage increased, both very rapidly. Surprisingly, when the rain rate was greater than 64 mm/day, the POD percentage of PERSIANN-CDR was close to zero and the FAR percentage reached about 100%, which indicates the limited capability in detecting heavy precipitation (R > 64 mm/day). MSWEP and GSMAP-gauge showed the lowest FAR in different rain rates (1–6 and 6–128 mm/day, respectively). In the rain rate range from 1 to 6 mm/day, MSWEP had the highest CSI, followed by GSMAP-gauge. When the rain rate exceeded 6 mm/day, GSMAP-gauge showed the best performance in detection capability.
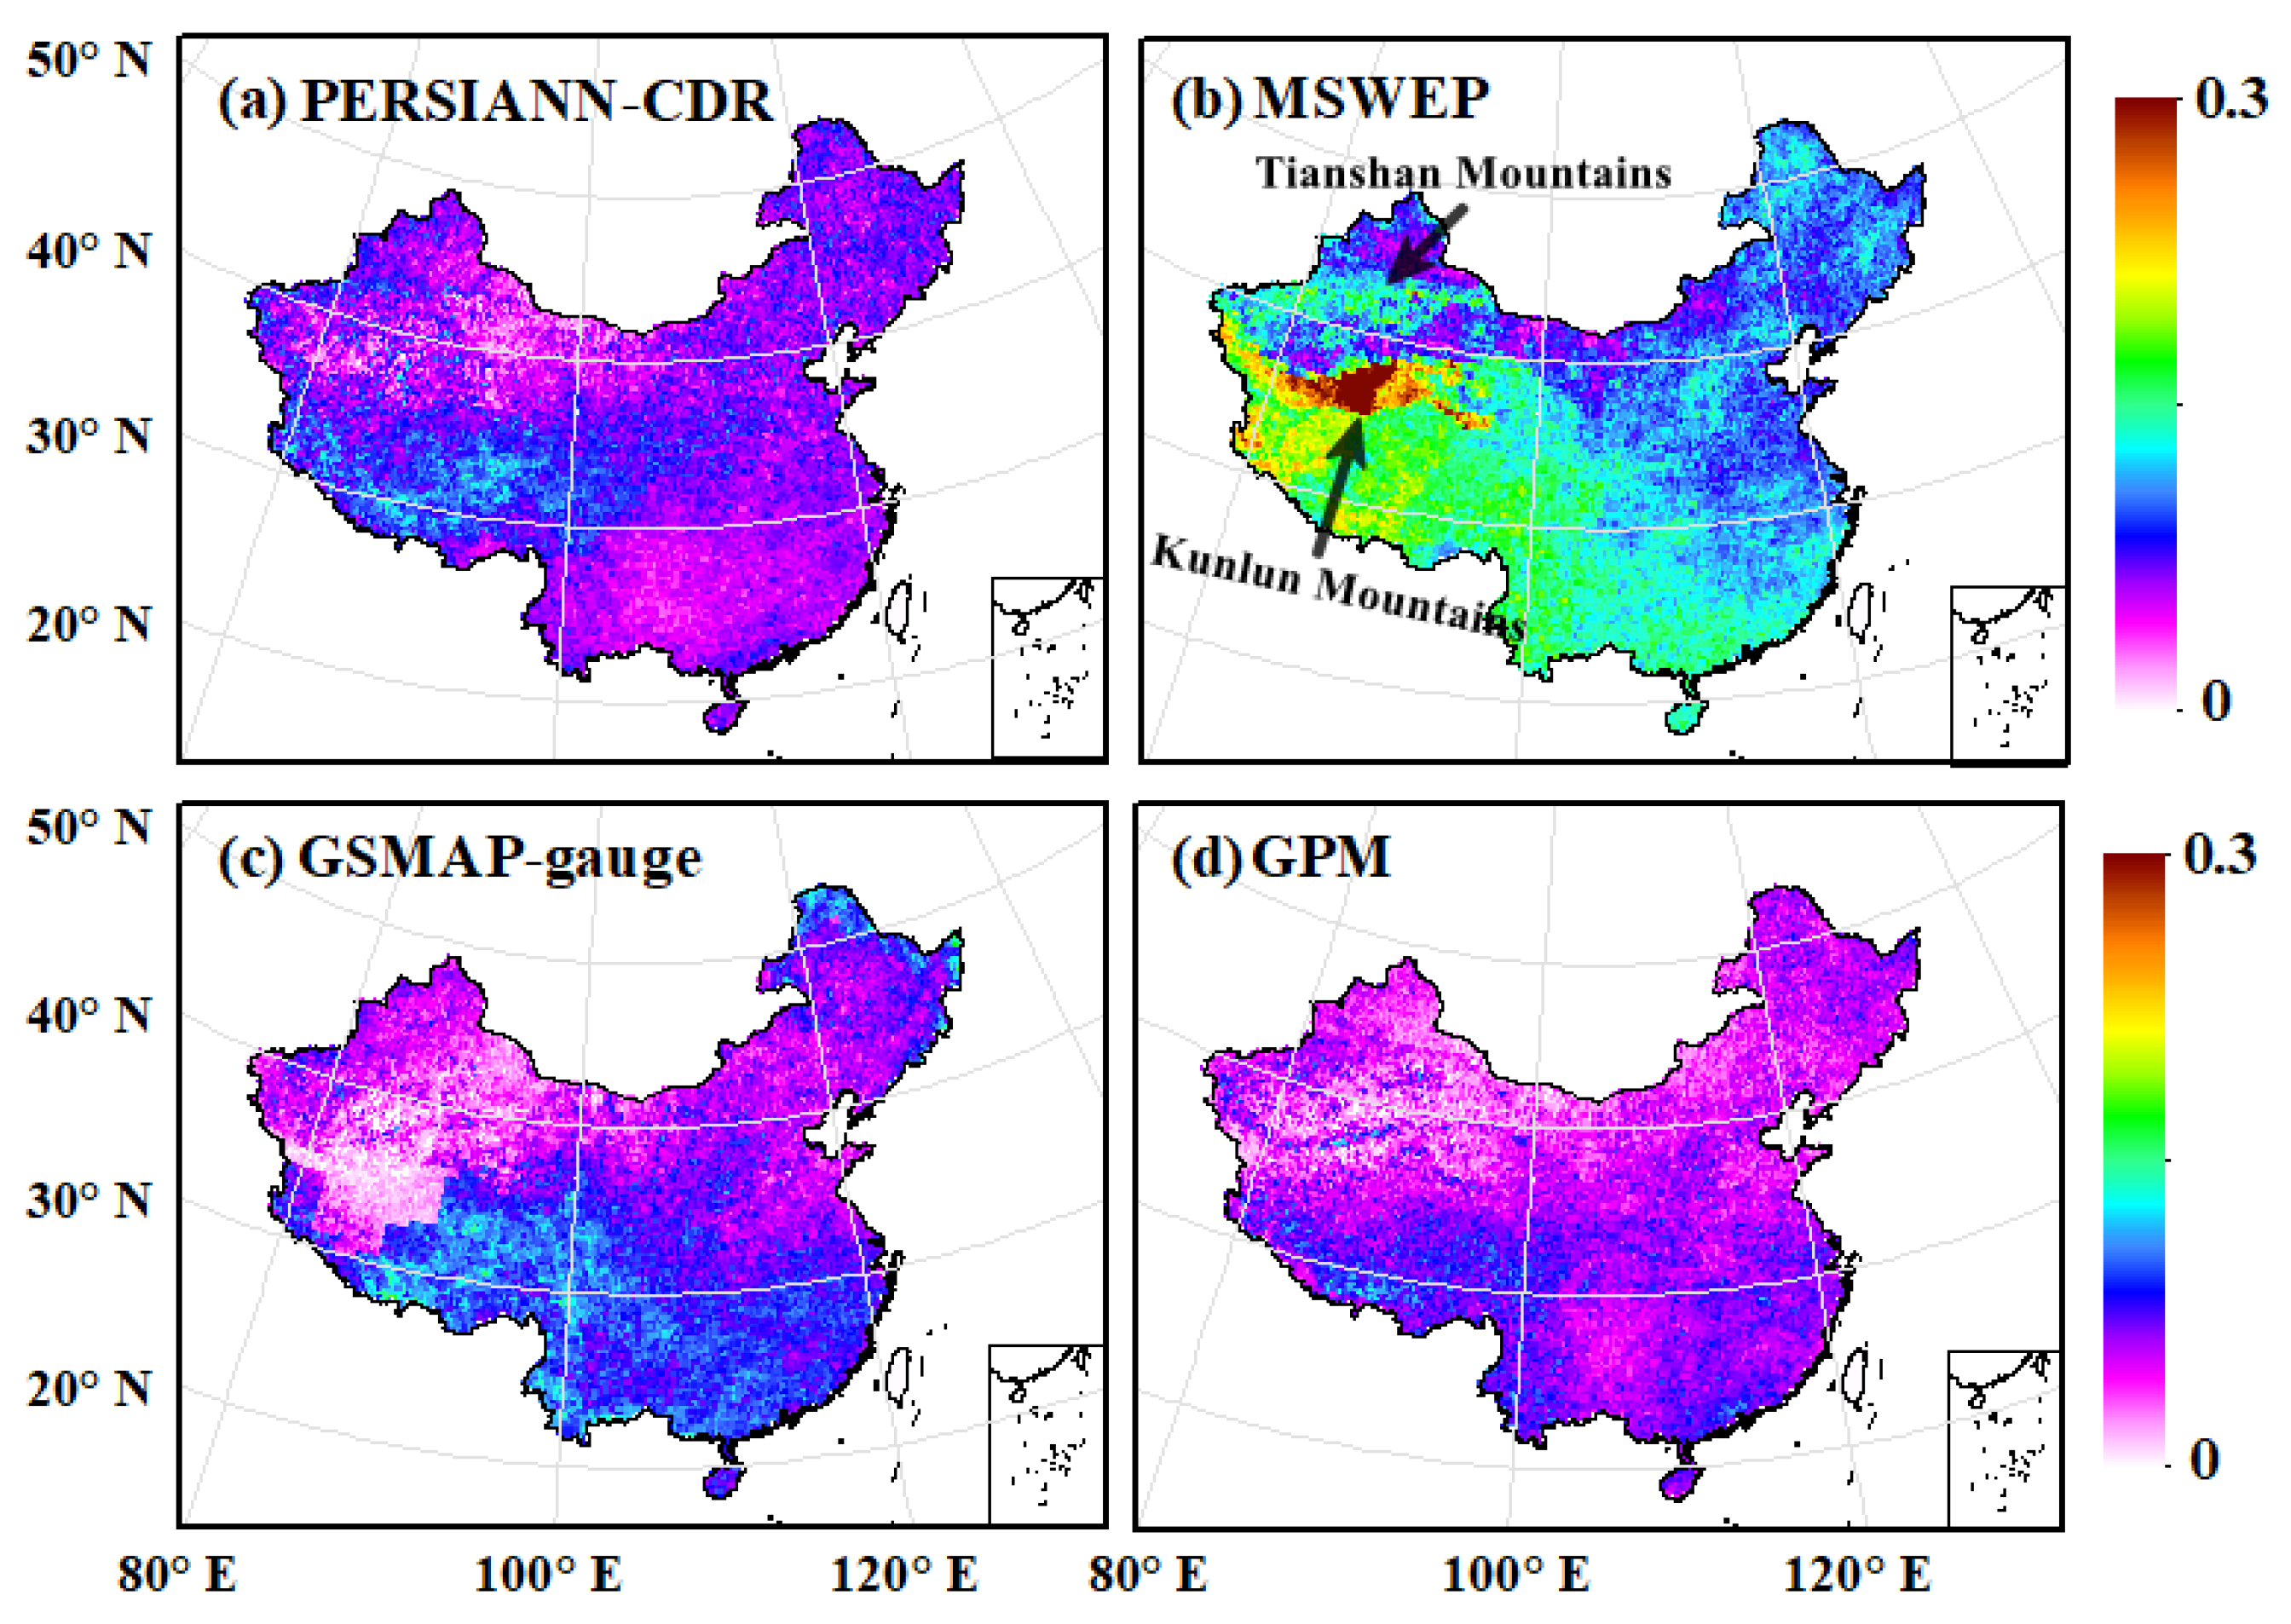
To further consider the condition of both event detection and the precipitation volume information, POTD is used here to reflect the correct estimation of precipitation intensity in the case of detecting precipitation. Based on the results in Figure 10, MSWEP has the best ability to accurately capture precipitation intensity, indicating an outstanding ability in the southwest region, followed by GSMAP-gauge. It is worth noting that MSWEP correctly captured orographic precipitation, such as those in the Kunlun Mountains and the Tianshan Mountains (Figure 10b). For northeastern China, almost all SPPs cannot correctly capture the occurrence intensity of the precipitation.
3.5. Evaluation over Typical Terrain Precipitation Area
Based on the results of Figure 2 and Figure 4, it is found that SPPs greatly underestimated terrain precipitation, which deserves our attention. Therefore, the accuracy of SPPs in capturing terrain precipitation is discussed over two typical regions, which include the Brahmaputra Grand Canyon of southwestern China (marked as B in Figure 2a) and the Yili River Valley in northwestern China (marked as A in Figure 2a).
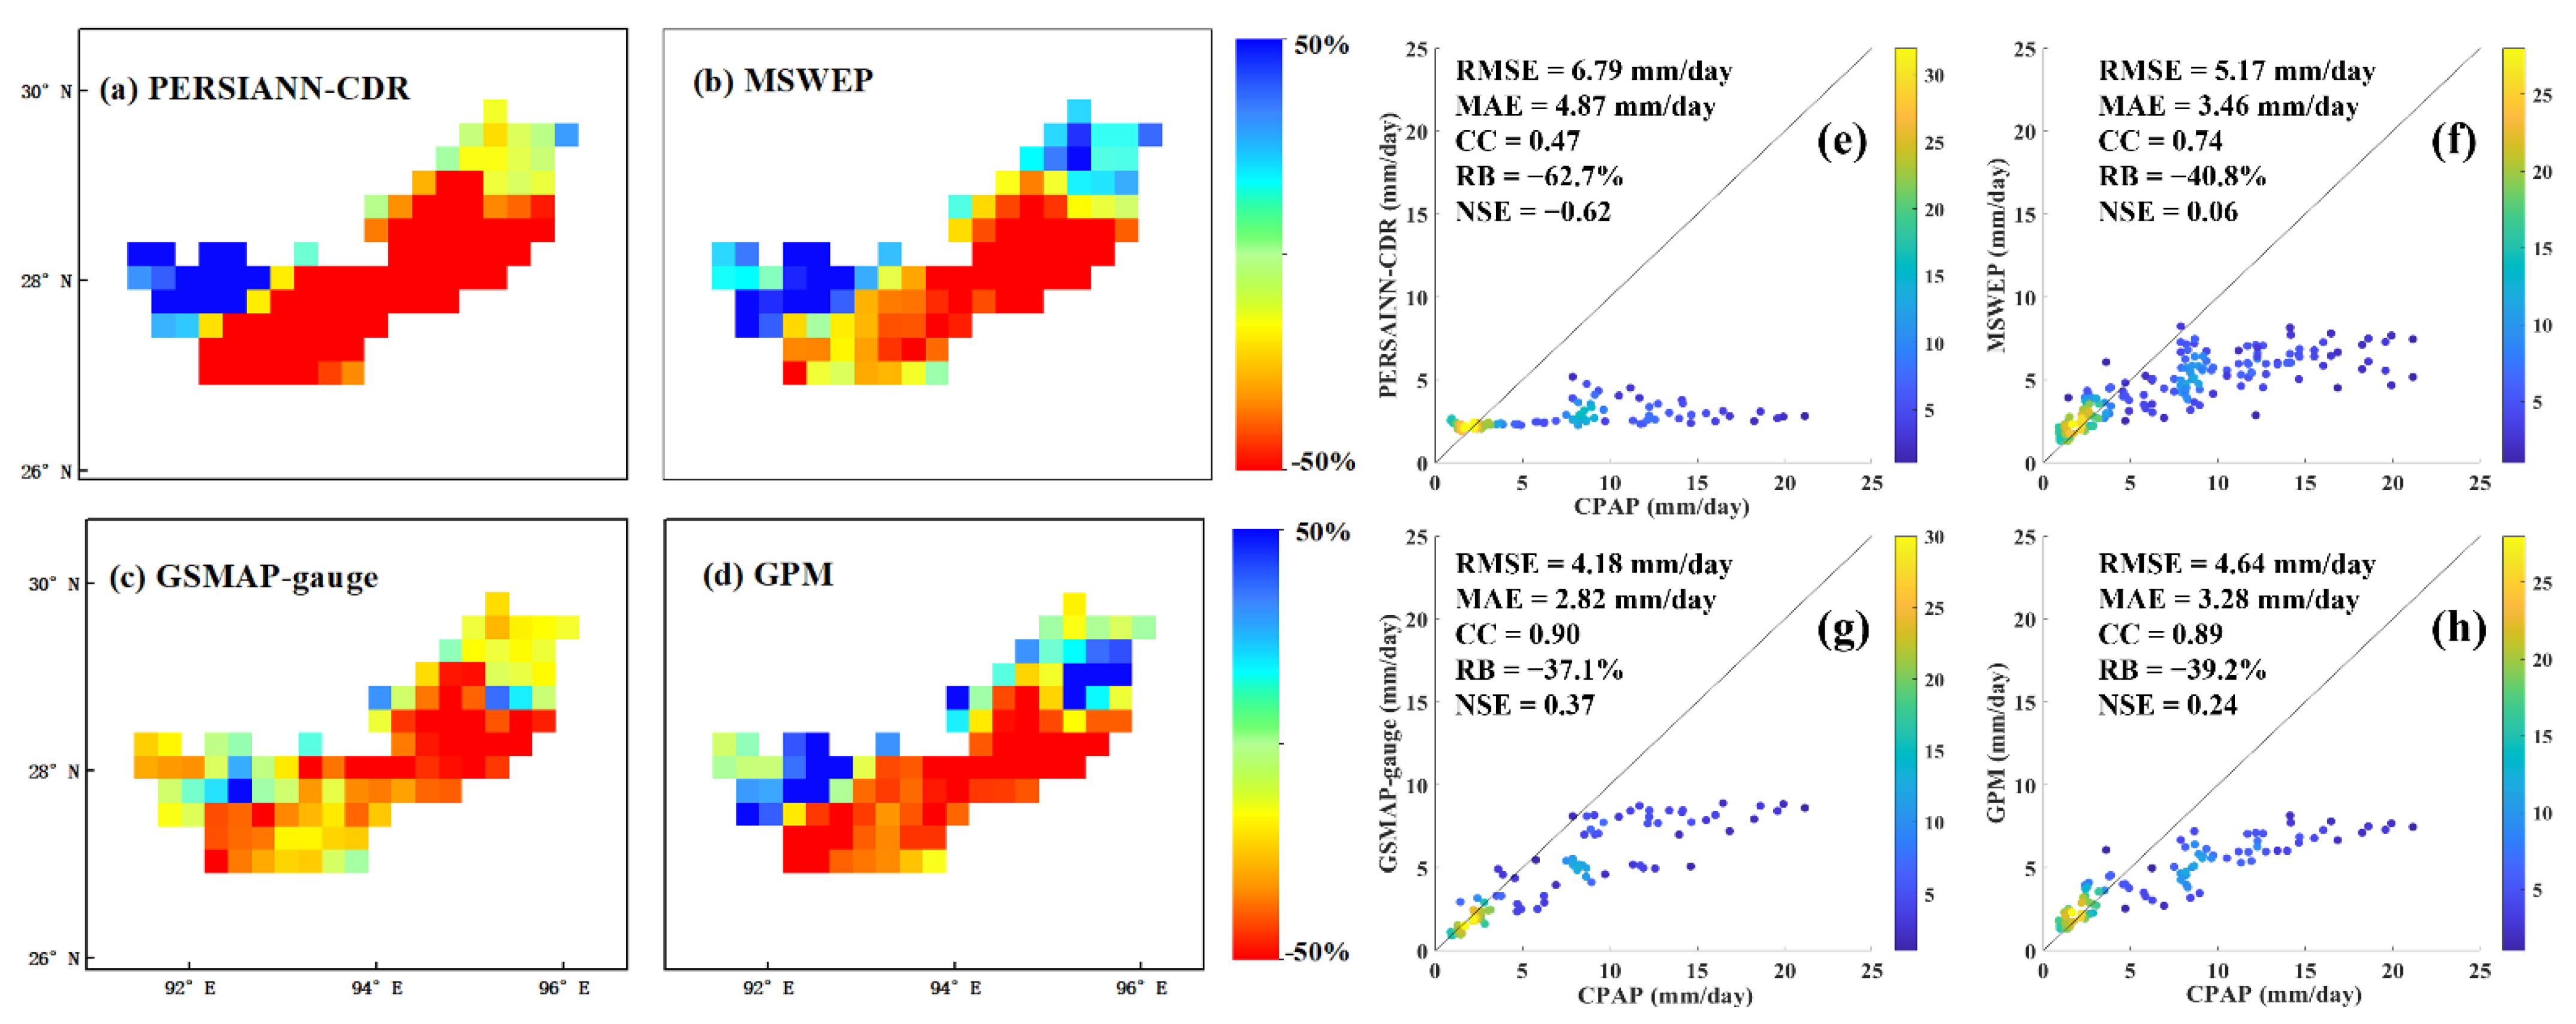
Figure 11 shows the spatial distribution of RB between different SPPs and CPAP and density-colored scatter plots of the annual average precipitation in the Brahmaputra Grand Canyon. The Brahmaputra Grand Canyon conducts water vapor from the Indian Ocean region to the interior of the Qinghai-Tibet Plateau by the narrow-channel terrain, generating the world’s second-largest precipitation belt [53]. It is obvious that all SPPs significantly underestimate the precipitation in the Brahmaputra Grand Canyon, with negative RB from −37.1% of GSMAP-gauge (Figure 11g) to −62.7% of PERSIANN-CDR (Figure 11e). Among the four SPPs, GSMAP-gauge captures the orographic precipitation well, with the highest CC (0.90) and the lowest RB (−37.1%). The underestimation of precipitation by PERSIANN-CDR is the most glaring, with an RB value as high as −62.7%. Possible reasons for the significant underestimation of precipitation by PERSIANN-CDR are as follows: Firstly, PERSIANN estimates precipitation primarily based on IR brightness temperature data from geostationary satellites [32,47]. Precipitation data obtained by the PERSIANN-CDR product are generated by an algorithm based on infrared data to detect the water vapor content in the cloud layer. Heavy precipitation generated by the forced lift of air currents cannot be observed, which leads to the underestimation phenomenon. Secondly, in the south of the Brahmaputra Grand Canyon, the water vapor brought by the southwest monsoon is uplifted to produce precipitation due to the influence of the terrain. Rapidly changing water vapor cannot be captured in the detection gap of PERSIANN-CDR [4,54].
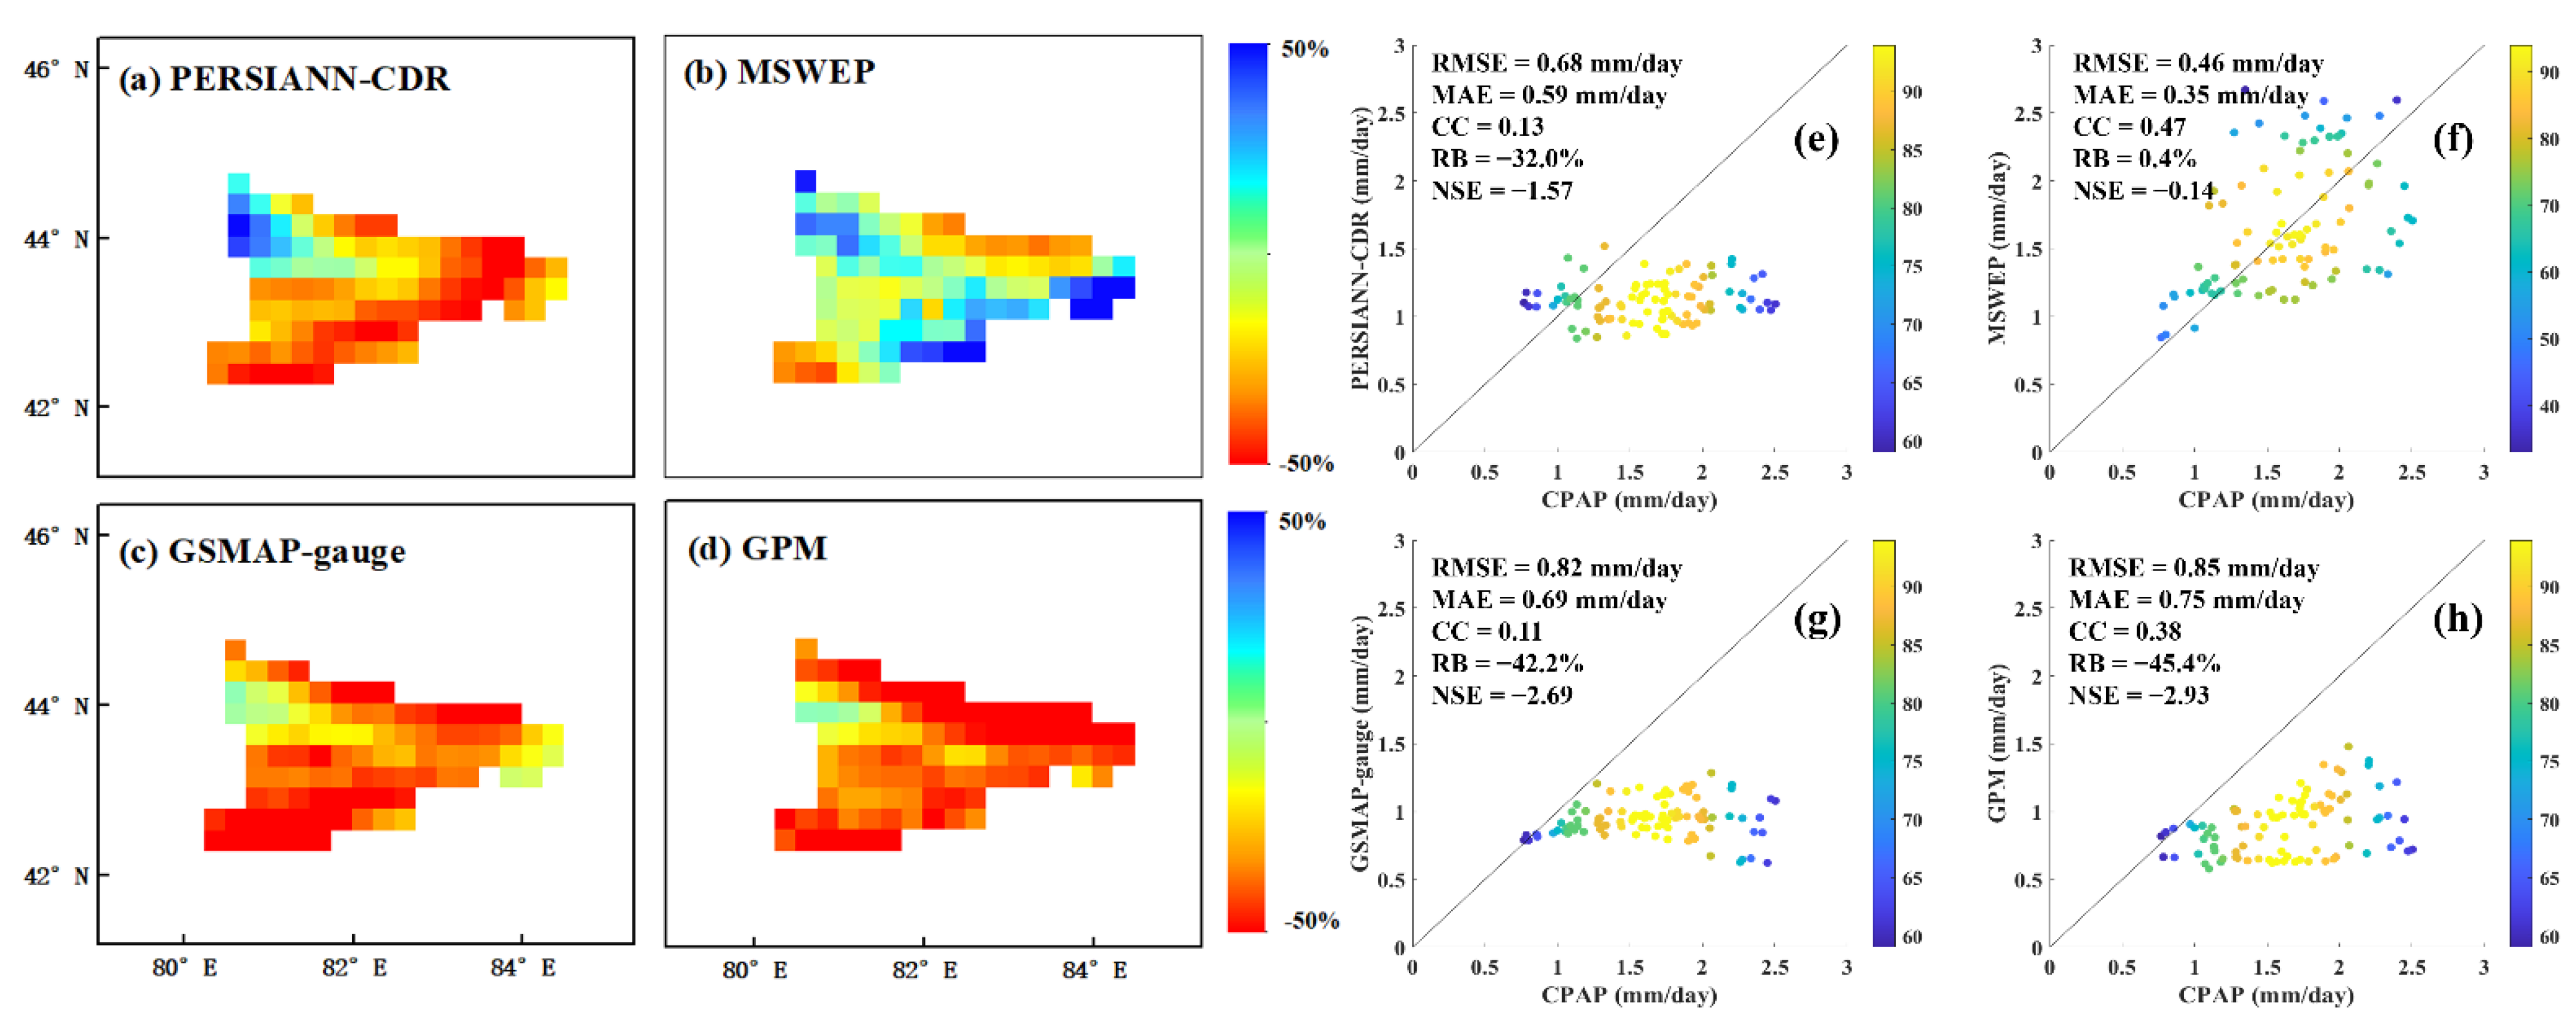
Figure 12 shows the spatial distribution of RB in the Yili River Valley between different SPPs and CPAP, and density-colored scatter plots of the annual average precipitation, respectively. Similar to the results for the Brahmaputra Grand Canyon, all SPPs except MSWEP significantly underestimate the precipitation in the Yili River Valley with RB from −32.0% of PERSIANN-CDR (Figure 12e) to −45.4% of GPM (Figure 12h). The significant underestimation leads to a pattern in which most of the points in the scatter plots are distributed under the 1:1 line. Since MSWEP integrates multiple remote sensing precipitation products and corrects them with a large number of ground stations, MSWEP performs best in capturing orographic precipitation. Although GSMAP-gauge, PERSIANN-CDR, and GPM have also performed corrections by ground stations, there is still a serious underestimation problem for orographic precipitation.
The results of Figure 11 and Figure 12 have a long tail, which are completely consistent with the results of Figure 3 and Figure 5. The existence of trailing in Figure 11 and Figure 12 may be, at least partially, caused by the significant underestimation of precipitation by SPPs in Figure 3 and Figure 5.
4. Discussion
This paper used the CPAP as the ground reference dataset. CPAP is a high-quality reference dataset, which has been well-evaluated and widely used in different applications. However, there are still some potential uncertainties in CPAP, which are discussed as follows:
The spatial distribution of ground stations (Figure 1) is unevenly distributed, with more gauges in southeastern China and less in the northwest. Therefore, the quality of CPAP may be lower in regions with sparse gauges such as the Tarim Basin.
CPAP uses a tipping bucket rain gauge to record precipitation. The tipping bucket rain gauge has a high level of automation, able to obtain precipitation quickly, and is simple to save and transmit. It is noted that the rain gauge design and operation inevitably lead to some systematic instrument bias, such as the evaporation of the collected precipitation, loss of bouncing raindrops, and funnel losses in the precipitation observations that go into CPAP. The aforementioned issues will cause precipitation measurement uncertainties.
The CPAP interpolation process may also introduce some uncertainties in accurately reflecting the precipitation occurrence. Given the lack of gauges, this phenomenon might be more noticeable in the northwestern part of China.
It is noted that the performance of SPPs was evaluated from 2016 to 2019. The existing results can reveal the accuracy of SPPs over mainland China during the study period (2016–2019) but cannot fully represent the performance of SPPs during other periods and over different regions. The performance of SPPs in a long-term period for different applications such as drought monitoring will be assessed in our future works.
5. Conclusions
In this paper, the error characteristics of four widely used SPPs were comprehensively analyzed from multiple aspects, such as spatial distribution patterns at daily and seasonal scales, scatter plots with quantitative indicators, error characteristics with different precipitation intensities, and the performance of error characteristics over typical terrain precipitation areas. The findings of this paper could provide a reference for selecting suitable precipitation products over mainland China and assist in the improvement of retrieval algorithms. The major conclusions of this paper were as follows:
- (1)
- For the daily mean precipitation from 2016 to 2019, all SPPs with CC values around 0.9 (Figure 3) had the ability to capture the spatial distribution patterns of precipitation (Figure 2). Only the MSWEP could capture the terrain precipitation pattern well in the Yili River Valley area. PERSIANN-CDR underestimated precipitation in southeastern and southwestern China and performed the worst among the four SPPs, with relatively lower CC and higher RB and RMSE. Overall, GSMAP-gauge and GPM had the best performance in reproducing the spatial distribution pattern over mainland China.
- (2)
- Seasonally, all SPPs could reflect the seasonal distribution of precipitation over mainland China. GSMAP-gauge performed best in autumn and winter (Figure 5k,l), with the highest CC (0.94 and 0.97) and the lowest RMSE (0.47 and 0.18 mm/day). MSWEP performed better in spring (Figure 5e), with the lowest RB (−0.9%). It was found that GPM performed best in summer (Figure 5n), with the lowest RB (−0.9%). It is necessary to highlight the fact that all four selected SPPs tended to underestimate precipitation in summer (RB was negative) over mainland China.
- (3)
- Based on the results of the categorical evaluation, it was found that all four SPPs tended to detect fewer no-rain events than CPAP. GPM and GSMAP-gauge were closer to CPAP for precipitation detection with relatively high accuracy. For the percentage of precipitation without rainfall cases, GSMAP-gauge detected 65%, with the best performance compared to the CPAP of 70% (Figure 7). PERSIANN-CDR demonstrated a 30% error and had the worst performance in capturing precipitation events.
- (4)
- MSWEP with the highest POD and POTD outperformed the other SPPs. MSWEP and GSMAP-gauge exhibited the lowest FAR and the highest CSI percent during 1–6 and 6–128 mm/day, respectively. PERSIANN-CDR showed a lower ability in detecting heavy precipitation (R ≥ 64 mm/day) with a high FAR (up to 100%).
Supplementary Materials
The following are available online at https://www.mdpi.com/article/10.3390/atmos13081211/s1, Figure S1: The temporal variation of the domain-averaged daily precipitation from 2016 to 2019 shows that all SPPs can correctly capture the seasonal distribution of precipitation, with more precipitation in summer and less precipitation in winter. However, there is also an overestimation or underestimation of precipitation among different SPPs.
Author Contributions
Conceptualization, H.G. and L.Z.; methodology, H.F.; software, H.F.; validation, X.L. and L.Z.; formal analysis, V.N.; resources, H.G.; data curation, H.F.; writing—original draft preparation, H.F.; writing—review and editing, H.G.; visualization, L.Z.; supervision, H.G.; project administration, H.G.; funding acquisition, H.F. and H.G. All authors have read and agreed to the published version of the manuscript.
Funding
This research was jointly funded by the College Student Innovation and Entrepreneurship Training Program (Grant No. S202110446022) and the National Natural Science Foundation of China (Grant No. 42001363).
Institutional Review Board Statement
Not applicable.
Informed Consent Statement
Not applicable.
Data Availability Statement
Not applicable.
Acknowledgments
PERSIANN-CDR data were provided by the National Oceanic and Atmospheric Administration (https://www.ncei.noaa.gov/data/precipitation-persiann/access/, accessed on 6 June 2022), and MSWEP data were obtained through GloH2O (http://www.gloh2o.org/mswep/, accessed on 6 June 2022). GSMAP-gauge data were provided by the Japan Aerospace Exploration Agency (https://sharaku.eorc.jaxa.jp/GSMaP/, accessed on 6 June 2022), and GPM IMERG data were supported by data from the National Aeronautics and Space Administration (https://gpm.nasa.gov/data/imerg, accessed on 6 June 2022). The CPAP was provided by the National Meteorological Information Center and the China Meteorological Administration (http://cdc.nmic.cn/sksj.do?method=ssrjscp, accessed on 6 June 2022), which the authors would like to acknowledge together. The authors thank Vincent Nzabarinda and Friday Uchenna Ochege for polishing the manuscript and two anonymous reviewers for their constructive comments, which helped improve the manuscript.
Conflicts of Interest
The authors declare no conflict of interest.
References
- Jiang, S.; Ren, L.; Yong, B.; Yang, X.; Shi, L. Evaluation of high-resolution satellite precipitation products with surface rain gauge observations from Laohahe Basin in northern China. Water Sci. Eng. 2010, 3, 405–417. [Google Scholar]
- Chen, S.; Liu, H.; You, Y.; Mullens, E.; Hu, J.; Yuan, Y.; Huang, M.; He, L.; Luo, Y.; Zeng, X. Evaluation of high-resolution precipitation estimates from satellites during July 2012 Beijing flood event using dense rain gauge observations. PLoS ONE 2014, 9, e89681. [Google Scholar] [CrossRef] [PubMed]
- Wang, H.; Shao, Z.; Gao, T.; Zou, T.; Liu, J.; Yuan, H. Extreme precipitation event over the yellow sea western coast: Is there a trend? Quat. Int. 2017, 441, 1–17. [Google Scholar] [CrossRef]
- Guo, H.; Chen, S.; Bao, A.; Hu, J.; Yang, B.; Stepanian, P. Comprehensive evaluation of high-resolution satellite-based precipitation products over China. Atmosphere 2015, 7, 6. [Google Scholar] [CrossRef] [Green Version]
- Vu, T.T.; Li, L.; Jun, K.S. Evaluation of multi-satellite precipitation products for streamflow simulations: A case study for the Han river basin in the Korean Peninsula, East Asia. Water 2018, 10, 642. [Google Scholar] [CrossRef] [Green Version]
- Wan-Ru, H.; Pin-Yi, L.; Jie, H. Multiple timescale assessment of wet season precipitation estimation over Taiwan using the Persian family products. Int. J. Appl. Earth Obs. Geoinf. 2021, 103, 102521. [Google Scholar]
- Jiang, S.; Ren, L.; Yong, B.; Yang, H.; Yang, X.; Fei, Y. Evaluation of latest TMPA and CMORPH precipitation products with independent rain gauge observation networks over high-latitude and low-latitude basins in China. Chin. Geogr. Sci. 2016, 26, 439–455. [Google Scholar] [CrossRef] [Green Version]
- Han, W.S.; Burian, S.J.; Shepherd, J.M. Assessment of satellite-based rainfall estimates in urban areas in different geographic and climatic regions. Nat. Hazards 2011, 56, 733–747. [Google Scholar] [CrossRef]
- Hong, Y.; Hsu, K.L.; Moradkhani, H.; Sorooshian, S. Uncertainty quantification of satellite precipitation estimation and Monte Carlo assessment of the error propagation into hydrologic response. Water Resour. Res. 2006, 42, W08421. [Google Scholar] [CrossRef] [Green Version]
- Su, F.; Hong, Y.; Lettenmaier, D.P. Evaluation of TRMM Multisatellite precipitation analysis (TMPA) and its utility in hydrologic prediction in the La Plata basin. J. Hydrometeorol. 2008, 9, 622–640. [Google Scholar] [CrossRef] [Green Version]
- Turk, F.J.; Arkin, P.; Ebert, E.E.; Sapiano, M.R. Evaluating high-resolution precipitation products. Bull. Amer. Meteor. Soc. 2008, 89, 1911–1916. [Google Scholar] [CrossRef]
- Bharti, V.; Singh, C. Evaluation of error in TRMM 3b42v7 precipitation estimates over the Himalayan region. J. Geophys. Res. Atmos. 2015, 120, 12458–12473. [Google Scholar] [CrossRef]
- Zhao, H.; Yang, S.; You, S.; Huang, Y.; Zhou, Q. Comprehensive evaluation of two successive V3 and V4 IMERG final run precipitation products over mainland China. Remote Sens. 2017, 10, 34. [Google Scholar] [CrossRef] [Green Version]
- Deng, Y.; Jiang, W.; Wang, X.; Lyu, J. Accuracy assessment of MSWEP over mainland China. Shuikexue Jinzhan/Adv. Water Sci. 2018, 29, 455–464. [Google Scholar]
- Tian, Y.; Peters-Lidard, C.D.; Adler, R.F.; Kubota, T.; Ushio, T. Evaluation of GSMaP precipitation estimates over the contiguous united states. J. Hydrometeorol. 2010, 11, 566–574. [Google Scholar] [CrossRef]
- Guo, H.; Bao, A.; Ndayisaba, F.; Liu, T.; Kurban, A.; De Maeyer, P. Systematical evaluation of satellite precipitation estimates over central Asia using an improved error-component procedure. J. Geophys. Res. Atmos. 2017, 122, 10906–10927. [Google Scholar] [CrossRef]
- Chaudhary, S.; Dhanya, C.T. Expanding contingency table for intensity and frequency based “true” detection of rainy events in precipitation datasets. Atmos. Res. 2020, 244, 105119. [Google Scholar] [CrossRef]
- Hamza, A.; Anjum, M.N.; Cheema, M.; Chen, X.; Gulakhmadov, A. Assessment of IMERG-v06, TRMM-3b42v7, SM2RAIN-ascat, and PERSIANN-CDR precipitation products over the Hindu Kush mountains of Pakistan, South Asia. Remote Sens. 2020, 12, 3871. [Google Scholar] [CrossRef]
- Mou, L.T.; Santo, H. Comparison of GPM IMERG, TMPA 3b42 and PERSIANN-CDR satellite precipitation products over Malaysia. Atmos. Res. 2018, 202, 63–76. [Google Scholar]
- Zhai, P.; Zhang, X.; Hui, W.; Pan, X. Trends in total precipitation and frequency of daily precipitation extremes over China. J. Clim. 2005, 18, 1096–1108. [Google Scholar] [CrossRef]
- Wang, B.; Wu, R.; Lau, K.M. Interannual variability of the Asian summer monsoon: Contrasts between the Indian and the western north pacific–east Asian monsoons. J. Clim. 2001, 14, 4073–4090. [Google Scholar] [CrossRef]
- Shi, L.; Yang, C.; Wei, L.; Jiang, S. Utility analysis of IMERG satellite precipitation product Forreal-time drought monitoring over the yellow river basin. Water Resour. Power 2021, 39, 9–11. [Google Scholar]
- Shen, Y.; Feng, M.; Zhang, H.; Gao, F. Interpolation methods of China daily precipitation data. J. Appl. Meteorol. Sci. 2010, 21, 279–286. [Google Scholar]
- Ren, L.; Wei, L.; Jiang, S.; Shi, J.; Yuan, F.; Zhang, L. Drought monitoring utility assessment of chirps and gleam satellite products in China. Trans. Chin. Soc. Agric. Eng. 2019, 35, 146–154. [Google Scholar]
- Shen, Y.; Xiong, A. Validation and comparison of a new gauge-based precipitation analysis over mainland China. Int. J. Climatol. 2016, 36, 252–265. [Google Scholar] [CrossRef]
- Chen, S.; Hong, Y.; Cao, Q.; Gourley, J.J.; Kirstetter, P.E.; Yong, B.; Tian, Y.; Zhang, Z.; Shen, Y.; Hu, J. Similarity and difference of the two successive v6 and v7 TRMM Multisatellite precipitation analysis performance over China. J. Geophys. Res. Atmos. 2013, 118, 13060–013074. [Google Scholar] [CrossRef]
- Shen, Y.; Xiong, A.; Wang, Y.; Xie, P. Performance of high-resolution satellite precipitation products over China. J. Geophys. Res. Atmos. 2010, 115, 114. [Google Scholar] [CrossRef]
- Guo, H.; Chen, S.; Bao, A.; Behrangi, A.; Hong, Y.; Ndayisaba, F.; Hu, J.; Stepanian, M.P. Early assessment of integrated multi-satellite retrievals for global precipitation measurement over China. Atmos. Res. 2016, 176, 121–133. [Google Scholar] [CrossRef]
- Guo, H.; Bao, A.; Liu, T.; Chen, S.; Ndayisaba, F. Evaluation of PERSIANN-CDR for meteorological drought monitoring over China. Remote Sens. 2016, 8, 379. [Google Scholar] [CrossRef] [Green Version]
- Gao, F.; Zhang, Y.; Chen, Q.; Wang, P.; Yang, H.; Yao, Y.; Cai, W. Comparison of two long-term and high-resolution satellite precipitation datasets in Xinjiang, China. Atmos. Res. 2018, 212, 150–157. [Google Scholar] [CrossRef]
- Zhao, H.; Yang, B.; Yang, S.; Huang, Y.; Dong, G.; Bai, J.; Wang, Z. Systematical estimation of GPM-based global satellite mapping of precipitation products over China. Atmos. Res. 2018, 201, 206–217. [Google Scholar] [CrossRef]
- Ashouri, H.; Hsu, K.L.; Sorooshian, S.; Braithwaite, D.K.; Knapp, K.R.; Cecil, L.D.; Nelson, B.R.; Prat, O.P. PERSIANN-CDR: Daily precipitation climate data record from multisatellite observations for hydrological and climate studies. Bull. Am. Meteorol. Soc. 2014, 96, 197–210. [Google Scholar] [CrossRef] [Green Version]
- Guo, H.; Min, L.; Nzabarinda, V.; Bao, A.; Meng, X.; Li, Z. Assessment of three long-term satellite-based precipitation estimates against ground observations for drought characterization in northwestern China. Remote Sens. 2022, 14, 828. [Google Scholar] [CrossRef]
- Sorooshian, S.; Hsu, K.-L.; Gao, X.; Gupta, H.V.; Imam, B.; Dan, B. Evaluation of PERSIANN system satellite-based estimates of tropical rainfall. Bull. Am. Meteorol. Soc. 2000, 81, 2035–2046. [Google Scholar] [CrossRef] [Green Version]
- Huffman, G.J.; Bolvin, A.; Dan, B.; Hsu, K.; Joyce, R.; Xie, P. Nasa Global Precipitation Measurement (GPM) Integrated Multi-satellite Retrievals for GPM (IMERG). Available online: https://storm.pps.eosdis.nasa.gov/storm/IMERG_ATBD_V4.pdf (accessed on 10 May 2022).
- Xu, R.; Tian, F.; Yang, L.; Hu, H.; Lu, H.; Hou, A. Ground validation of GPM IMERG and TRMM 3b42v7 rainfall products over southern Tibetan plateau based on a high-density rain gauge network. J. Geophys. Res. Atmos. 2017, 122, 910–924. [Google Scholar] [CrossRef]
- Kim, K.; Park, J.; Baik, J.; Choi, M. Evaluation of topographical and seasonal feature using GPM IMERG and TRMM 3b42 over far-east Asia. Atmos. Res. 2016, 187, 95–105. [Google Scholar] [CrossRef]
- Kachi, M.; Kubota, T.; Aonashi, K.; Ushio, T.; Oki, R. Recent improvements in the global satellite mapping of precipitation (GSMAP). In Proceedings of the 2014 IEEE Geoscience and Remote Sensing Symposium, Quebec City, QC, Canada, 13–18 July 2014; pp. 3762–3765. [Google Scholar]
- Mega, T.; Ushio, T.; Matsuda, T.; Kubota, T.; Kachi, M.; Oki, R. Gauge-adjusted global satellite mapping of precipitation. IEEE Trans. Geosci. Remote Sens. 2018, 57, 1928–1935. [Google Scholar] [CrossRef]
- Kentaro, T.; Saavedra, V.; Masahiro, R.; Kazuki, T.; Tomoo, U.; Takuji, K. Spatiotemporal evaluation of the gauge-adjusted global satellite mapping of precipitation at the basin scale. J. Meteorol. Soc. JPN 2016, 94, 185–195. [Google Scholar]
- Beck, H.E.; Wood, E.F.; Pan, M.; Fisher, C.K.; Miralles, D.G.; van Dijk, A.I.J.M.; McVicar, T.R.; Adler, R.F. MSWEP v2 global 3-hourly 0.1 degrees precipitation: Methodology and quantitative assessment. Bull. Am. Meteorol. Soc. 2019, 100, 473–502. [Google Scholar] [CrossRef] [Green Version]
- Beck, H.E.; van Dijk, A.I.J.M.; Levizzani, V.; Schellekens, J.; Miralles, D.G.; Martens, B.; de Roo, A. MSWEP: 3-hourly 0.25 degrees global gridded precipitation (1979–2015) by merging gauge, satellite, and reanalysis data. Hydrol. Earth Syst. Sci. 2017, 21, 589–615. [Google Scholar] [CrossRef] [Green Version]
- Alijanian, M.; Rakhshandehroo, G.R.; Mishra, A.K.; Dehghani, M. Evaluation of satellite rainfall climatology using CMORPH, PERSIANN-CDR, PERSIANN, TRMM, MSWEP over Iran. Int. J. Climatol. A J. R. Meteorol. Soc. 2017, 37, 4896–4914. [Google Scholar] [CrossRef]
- Beck, H.E.; Vergopolan, N.; Pan, M.; Levizzani, V.; van Dijk, A.I.J.M.; Weedon, G.P.; Brocca, L.; Pappenberger, F.; Huffman, G.J.; Wood, E.F. Global-scale evaluation of 22 precipitation datasets using gauge observations and hydrological modeling. Hydrol. Earth Syst. Sci. 2017, 21, 6201–6217. [Google Scholar] [CrossRef] [Green Version]
- Beck, H.E.; Pan, M.; Roy, T.; Weedon, G.P.; Pappenberger, F.; van Dijk, A.I.J.M.; Huffman, G.J.; Adler, R.F.; Wood, E.F. Daily evaluation of 26 precipitation datasets using stage-iv gauge-radar data for the conus. Hydrol. Earth Syst. Sci. 2019, 23, 207–224. [Google Scholar] [CrossRef] [Green Version]
- Darand, M.; Siavashi, Z. An evaluation of global satellite mapping of precipitation (GSMAP) datasets over Iran. Meteorol. Atmos. Phys. 2021, 133, 911–923. [Google Scholar] [CrossRef]
- Guo, H.; Chen, S.; Bao, A.; Hu, J.; Gebregiorgis, A.S.; Xue, X.; Zhang, X. Inter-comparison of high-resolution satellite precipitation products over central Asia. Remote Sens. 2015, 7, 7181–7211. [Google Scholar] [CrossRef] [Green Version]
- Conti, F.L.; Hsu, K.-L.; Noto, L.V.; Sorooshian, S. Evaluation and comparison of satellite precipitation estimates with reference to a local area in the Mediterranean Sea. Atmos Res. 2014, 138, 189–204. [Google Scholar] [CrossRef] [Green Version]
- Chen, F.; Li, X. Evaluation of IMERG and TRMM 3b43 monthly precipitation products over mainland China. Remote Sens. 2016, 8, 472. [Google Scholar] [CrossRef] [Green Version]
- Fengjiao, C.; Yingxin, L.; Jinlan, G.; Yun, W.; Hualiang, Z. Evaluation of IMERG and TMPA precipitation datasets over summer mid-Castern China. Meteorol. Mon. 2019, 45, 1680–1690. [Google Scholar]
- Yu, L.; Yang, Y.; Zhou, X.; Ma, L.; Li, H.; Kong, F. Quality assessment of Chinese merged precipitation product over Taihang Mountains. J. Water Resour. Water Eng. 2020, 31, 33–43. [Google Scholar]
- Liu, X.; Wang, Z. Quality evaluation of precipitation products commonly used by remote sensing in the Yangtze river delta. Sci. Technol. Eng. 2021, 21, 4801–4810. [Google Scholar]
- Prakash, S.; Mitra, A.K.; Pai, D.S.; Aghakouchak, A. From TRMM to GPM: How well can heavy rainfall be detected from space? Adv. Water Resour. 2016, 88, 1–7. [Google Scholar] [CrossRef]
- Huffman, G.J. Algorithm Theoretical Basis Document (ATBD) Version 4.4 for the NASA Global Precipitation Measurement (GPM) Integrated Multi-Satellite Retrievals for GPM (I-MERG). Available online: https://gpm.nasa.gov/sites/default/files/document_files/IMERG_ATBD_V4.6.pdf (accessed on 28 March 2022).
Figure 1.
Terrain condition and position of ground-based stations in China.

Figure 2.
Spatial distribution pattern of multi-year means of daily precipitation over mainland China by (a) CPAP, (b) PERSIANN-CDR, (c) MSWEP, (d) GSMAP-gauge, and (e) GPM. The Brahmaputra Grand Canyon in southwestern China is marked B and the Yili River Valley in northwestern China is marked A. The Changbai Mountains in northeastern China are marked C.

Figure 3.
Density-colored scatter plots between (a) PERSIANN-CDR, (b) MSWEP, (c) GSMAP-gauge, and (d) GPM and CPAP. The black line is the 1:1 line. In addition, each statistical indicator is also shown in this figure. The colors in this figure represent the frequency of occurrence.
Figure 3.
Density-colored scatter plots between (a) PERSIANN-CDR, (b) MSWEP, (c) GSMAP-gauge, and (d) GPM and CPAP. The black line is the 1:1 line. In addition, each statistical indicator is also shown in this figure. The colors in this figure represent the frequency of occurrence.

Figure 4.
Spatial distribution of PERSIANN-CDR, MSWEP, GSMAP-gauge, GPM (e–t) and ground reference dataset CPAP (a–d) in different seasons.
Figure 4.
Spatial distribution of PERSIANN-CDR, MSWEP, GSMAP-gauge, GPM (e–t) and ground reference dataset CPAP (a–d) in different seasons.

Figure 5.
Density-colored scatter plots of (a–d) PERSIANN-CDR, (e–h) MSWEP, (i–l) GSMAP-gauge, and (m–p) GPM in different seasons with ground-based observations. The colors in the figure represent the frequency of occurrence.
Figure 5.
Density-colored scatter plots of (a–d) PERSIANN-CDR, (e–h) MSWEP, (i–l) GSMAP-gauge, and (m–p) GPM in different seasons with ground-based observations. The colors in the figure represent the frequency of occurrence.

Figure 6.
The probability density function of daily precipitation for cases under different precipitation intensities.
Figure 6.
The probability density function of daily precipitation for cases under different precipitation intensities.

Figure 7.
The probability density function of daily precipitation for cases without a precipitation event.
Figure 7.
The probability density function of daily precipitation for cases without a precipitation event.

Figure 8.
The probability density function of daily precipitation for volume with different precipitation.
Figure 8.
The probability density function of daily precipitation for volume with different precipitation.

Figure 9.
Contingency metrics of (a) probability of detection (POD), (b) false-alarm rate (FAR), and (c) critical successful index (CSI) for satellite-based precipitation products over mainland China.
Figure 9.
Contingency metrics of (a) probability of detection (POD), (b) false-alarm rate (FAR), and (c) critical successful index (CSI) for satellite-based precipitation products over mainland China.

Figure 10.
Metrics of probability of true detection (POTD) for SPPs (i.e., (a) PERSIANN-CDR, (b) MSWEP, (c) GSMAP-gauge, and (d) GPM) over mainland China.
Figure 10.
Metrics of probability of true detection (POTD) for SPPs (i.e., (a) PERSIANN-CDR, (b) MSWEP, (c) GSMAP-gauge, and (d) GPM) over mainland China.

Figure 11.
Spatial distribution of RB between different SPPs (i.e., (a) PERSIANN-CDR, (b) MSWEP, (c) GSMAP-gauge, and (d) GPM) and CPAP over Brahmaputra Grand Canyon. Density-colored scatter plots between (e) PERSIANN-CDR, (f) MSWEP, (g) GSMAP-gauge, and (h) GPM and CPAP. The black line is the 1:1 line. In addition, each statistical indicator is also shown in this figure. The colors in this figure represent the frequency of occurrence [33].

Figure 12.
Spatial distribution of RB between different SPPs (i.e., (a) PERSIANN-CDR, (b) MSWEP, (c) GSMAP-gauge, and (d) GPM) and CPAP. Density-colored scatter plots between (e) PERSIANN-CDR, (f) MSWEP, (g) GSMAP-gauge, and (h) GPM and CPAP.
Figure 12.
Spatial distribution of RB between different SPPs (i.e., (a) PERSIANN-CDR, (b) MSWEP, (c) GSMAP-gauge, and (d) GPM) and CPAP. Density-colored scatter plots between (e) PERSIANN-CDR, (f) MSWEP, (g) GSMAP-gauge, and (h) GPM and CPAP.


Table 1.
Summary of satellite-based precipitation products used in this study.
| Name | Data Source | Spatial Resolution | Temporal Resolution | Period | Domain | Reference |
|---|---|---|---|---|---|---|
| PERSIANN-CDR | G, S | 0.25° × 0.25° | 1 day | 1983–NRT | 60° N–60° S | [6,32,33,34] |
| GPM-IMERG | G, S, Ra, Re | 0.1° × 0.1° | 0.5 h | 2014–NRT | 60° N–60° S | [35,36,37] |
| GSMAP-gauge | S | 0.1° × 0.1° | 1 h | 2000–NRT | 60° N–60° S | [38,39,40] |
| MSWEP | G, S, Re | 0.1° × 0.1° | 3 h | 1979–NRT | 90° N–90° S | [41,42,43,44,45] |
Where G stands for the rain gauge, S is for satellite, Re is for reanalysis, Ra means radar, and NRT stands for near-real-time.
Table 2.
Quantitative statistical analysis indicators.
| Index | Equation | Optimal Value |
|---|---|---|
| Correlation Coefficient | 1 | |
| Relative Bias | 0 | |
| Mean Absolute Error | 0 | |
| Root Mean Square Error | 0 | |
| Nash–Sutcliffe Efficiency | 1 |
Where Rs is the estimated precipitation from remotely sensed precipitation products, Rc is the CPAP daily precipitation value, and are the average values of daily precipitation from SPPs and CPAP, and N is the sample size.
Table 3.
Classification statistics evaluation indicators.
| Index | Equation | Optimal Value |
|---|---|---|
| POD | 1 | |
| POTD | 1 | |
| FAR | 0 | |
| CSI | 1 |
Table 4.
Classification statistical indicators’ parameters list.
| Precipitation Events Detected by Satellite-Based Precipitation Products | ||||
|---|---|---|---|---|
| Yes | No | |||
| Precipitation Events Detected by Stations | Yes | Hit (H) | Over-Hit (OH) | False (F) |
| Under-Hit (UH) | ||||
| True-Hit (TH) | ||||
| No | Miss (M) | Null Event (N) | ||
Publisher’s Note: MDPI stays neutral with regard to jurisdictional claims in published maps and institutional affiliations. |
© 2022 by the authors. Licensee MDPI, Basel, Switzerland. This article is an open access article distributed under the terms and conditions of the Creative Commons Attribution (CC BY) license (https://creativecommons.org/licenses/by/4.0/).
Share and Cite
MDPI and ACS Style
Fu, H.; Zhu, L.; Nzabarinda, V.; Lv, X.; Guo, H. Error Characteristic Analysis of Satellite-Based Precipitation Products over Mainland China. Atmosphere 2022, 13, 1211. https://doi.org/10.3390/atmos13081211
AMA Style
Fu H, Zhu L, Nzabarinda V, Lv X, Guo H. Error Characteristic Analysis of Satellite-Based Precipitation Products over Mainland China. Atmosphere. 2022; 13(8):1211. https://doi.org/10.3390/atmos13081211
Chicago/Turabian StyleFu, Hanjia, Li Zhu, Vincent Nzabarinda, Xiaoyu Lv, and Hao Guo. 2022. "Error Characteristic Analysis of Satellite-Based Precipitation Products over Mainland China" Atmosphere 13, no. 8: 1211. https://doi.org/10.3390/atmos13081211
Note that from the first issue of 2016, this journal uses article numbers instead of page numbers. See further details here.