
Latitude Dependence of the Total Ozone Trends for the Period 2005–2020: TOC for Bulgaria in the Period 1996–2020

National Institute of Geophysics, Geodesy and Geography—Bulgarian Academy of Sciences, Acad. G. Bonchev Str., bl. 3, 1113 Sofia, Bulgaria
*
Author to whom correspondence should be addressed.
Atmosphere 2022, 13(6), 918; https://doi.org/10.3390/atmos13060918
Submission received: 21 April 2022
/
Revised: 19 May 2022
/
Accepted: 3 June 2022
/
Published: 6 June 2022
(This article belongs to the Special Issue Atmospheric Composition and Regional Climate Studies in Bulgaria)
Abstract
:The present study examines a long-term statistical trend analysis of Total Ozone Content (TOC) data from the AURA satellite for latitudes 60° and 60° S. A methodology for eliminating the strong dependence on the season has been applied by introducing the relative deviation of the average monthly TOC from the climatological average. The analysis presents comparisons of the trends of the zonal average values of TOC and its relative values. In addition, the standard error of both parameters is calculated. The course of the obtained mass of Ozone (O3) and its trend for the period 2005–2020 is presented, and a division is made into three areas: (i) from 30° S to 30° N, (ii) from 30° S to 60° S, and (iii) from 30° N to 60° N. The last part of this study demonstrates the trends of TOC and relative TOC for Bulgaria in the period 1996–2020. The main results of this study show that (a) in the considered latitude range, a slow but steady increase in O3 prevails, (b) the main part of the O3 mass is in low and mid-latitudes, and (c) the general trend in O3 mass for both hemispheres is determined by the positive trend in the southern hemisphere.
1. Introduction
It is well known that O3 is the most interesting part of the stratosphere. Despite its low concentrations, O3 is the main absorber of ultraviolet radiation, which makes it the largest source of heat in the atmosphere at altitudes between about 10 and 50 km [1,2]. The role of O3 on biologically active solar radiation is well described by [3]. The measurement of O3 by the method of Dobson and Brewer is based on the absorption of UV-B by O3. The effects of elevated levels of UV-B radiation are well known as the depletion of the stratospheric Ozone layer on human and terrestrial health and aquatic ecosystems [4]. It is well known that for the troposphere, O3 is considered a pollutant. Because its extra oxygen bond can be easily broken, O3 is a strong oxidant that is both corrosive to materials and toxic to plants and animals [5]. Changes in the chemistry and dynamics of O3 reflect its changes in the lower stratosphere [6]. Global O3 amounts decreased severely between the nineteen-eighties and the mid-nineteen-nineties, when they reached minimum values. The Montreal Protocol was signed in 1987 to prevent the depletion of the Ozone layer. This protocol establishes legal controls on the production and consumption of halogen source gases that are known to deplete the Ozone layer. Halogen chlorine and bromine source gases controlled under the Montreal Protocol are listed as O3-depleting substances.
One extremely interesting and important task for humanity in the last few decades after the introduction of the Montreal Protocol is the study of the changes and trends of TOC around the globe.
The main results of the study of trends in total O3 from NIMBUS 7 TOMS data and a specific statistical model show that it exists in the linear trend between 65° N and 65° S latitudes [7]. The results for the average mass and O3 transport in the high northern latitudes show a clear annual cycle. The transport season in transport has been found to be an important contributor to the resulting seasonal movement of O3 at high latitudes [8]. A study of the mean annual cycle and its evolution over a period of 19 years under volcanic eruptions and hemispheric differences shows that the O3 mass for the globe or within a latitude zone is more suitable than the mean column amount because it is invariant under transport within zones and is a direct measure of exchange between zones [9]. The period used from 1963 to 2007 by observations by Belsk illustrates the negative trend in total O3 (∼3.5% per decade) established for the period 1980–1995. Observations show that after this, the trends in the total O3 and in the lower and middle stratospheric O3 are not statistically significant, and in the upper stratosphere for the period from 1996 to 2007, there is an increase of ∼3–5% per decade [10]. The analysis of the trends of the total O3 content (TOC) in Tomsk and some points of the northern hemisphere for the period 1979–2010 shows a negative linear trend of (−2.3 ± 0.1) DU per year for the period 1979–1995 and a positive trend of (1.08 ± 0.1) DU per year for the period 1996–2010 [11]. A large-scale study of a long statistical series of O3 data from different satellites shows that QBO dominates O3 variability in the tropics (±7 DU), while at higher latitudes, dynamic indices, AO/AAO, and vortex heat flux have significant effects on total O3 variations of up to ±10 DU [12]. Based on monthly mean data from the ERAInterim reanalysis database in different latitudinal belts and satellite data, variations and trends in total O3 (TO) for the period 1979–2014 were studied. The results show that the averages for different geographical width variations of TO are modulated by the Arctic and Antarctic oscillations, quasi-biennial oscillations of zonal wind in the equatorial stratosphere, El Niño—Southern Oscillation, zonal average meridional heat flux in the lower stratosphere, solar activity (SA), stratospheric content of Ozone-depleting substances (ODS), and volcanic aerosol particles [13]. Another study based on combined satellite measurements from Nimbus-7 and TOMS, combined with measurements from the Ozone Monitoring Instrument (OMI/MLS), showed that tropospheric O3 had shown increases over the last four decades [14]. The main results of the study of variations in TOC are for a period of 31 years. They are measured at the Kislovodsk High-Altitude Scientific Station and show the following: (i) the annual trend of TOC is positive for the period 1989–2002 (1.6% per decade) and negative for 2003–2020 (−1.2% per decade) and (ii) the strongest trends are in the spring; reach 4% per decade (in absolute value) [15]. The TCO data from the Ozone Monitoring Instrument (OMI) for the period 2005–2019 were used to track the spatiotemporal distribution of O3 concentrations in China. The results indicate that the seasonal variations of O3 concentration change with season [16].
The aim of this paper is to determine the presence and value of long-term trends in the monthly mean zonal values of TOC for the period 2005–2020 and to assess the resilience of the Earth’s protective Ozone layer over the last decade and a half. Problems with the state of the Ozone layer became a priority in the 1980s when the destructive effects of halogen gas products on the Ozone layer were discovered. In 1987, the Montreal Protocol on the Control of the Production of Products Harmful to the Ozone Layer was signed [17]. The aim of the present work is to follow the changes of TOC both on a global scale and on the territory of Bulgaria after an extremely important step for humanity, namely the signed Montreal Protocol.
2. Data and Methods
Total Ozone Content is presented in Dobson Units (DU), which is the height of the Ozone layer at a point on Earth if all atmospheric O3 at that point is mentally placed at normal pressure and temperature. The unit DU is given in mm·10−2. This integral characteristic of the state of the Ozone layer characterizes the ability of O3 to absorb the ultraviolet radiation of the Sun in the range 280–315 nm (UVB) and to protect the Earth’s biosphere, including humans, from its harmful effects.
The present study uses global TOC data from the OMI, located on the AURA orbiting satellite in 2004. The data used in the present work are from the period 2005–2020 and are freely available on the Internet; address https://Ozonewatch.gsfc.nasa.gov/data/omi/, (accessed on 20 April 2022). TOC values are daily in a coordinate grid with a step of 1° latitude and longitude. Those which are in relation to the territory of Bulgaria are from 42° to 44° N and from 23° to 28° E. The measurement method of the total O3 is based on the reflection of solar radiation from the cloud cover by conditions close to local noon. During the winter months, data at high latitudes are missing or have many gaps, which limits the current study on latitudes between 60° N and 60° S. The monthly averages used in this article are calculated provided that there are more than 10 valid values in a given month. Otherwise, a gap is introduced for the given month. The observed time period used in the present work is 16 years after the enforcement of the Montreal Protocol.
The measurements of TOC in NIGGG have been carried out with the sun photometer Microtops II, a production of Solar Light Company, USA http://www.solarlight.com (accessed on 20 April 2022). The results were obtained completely automatically from the built-in microcomputer. The accuracy of the device is 1–2%. The error amounted to 6 DU from an average of the total content of O3, which is about 300 DU [18,19,20,21].
The use of data from the same equipment has an advantage in cases where small variations in value are studied, such as TOC trends over a long period of time. When using data from different devices, there is a problem with the systematic deviations between the values obtained from them. In their research, some of the authors of [18,19,20,21] show the results of the calibration of the data from the photometer used at the National Institute of Geophysics, Geodesy and Geography and OMI data. The results indicate some systematic bias between the two types of measurements used, about 11 DU.
In this work, an analysis of the trend of TOC over the territory of Bulgaria for a longer period of time—from 1996 to 2005—is carried out, for which a synthetic time series of data obtained from different equipment but normalized by one type of data was used.
3. Results and Discussion
3.1. Global Distribution of TOC Variations and Trends in the TOC
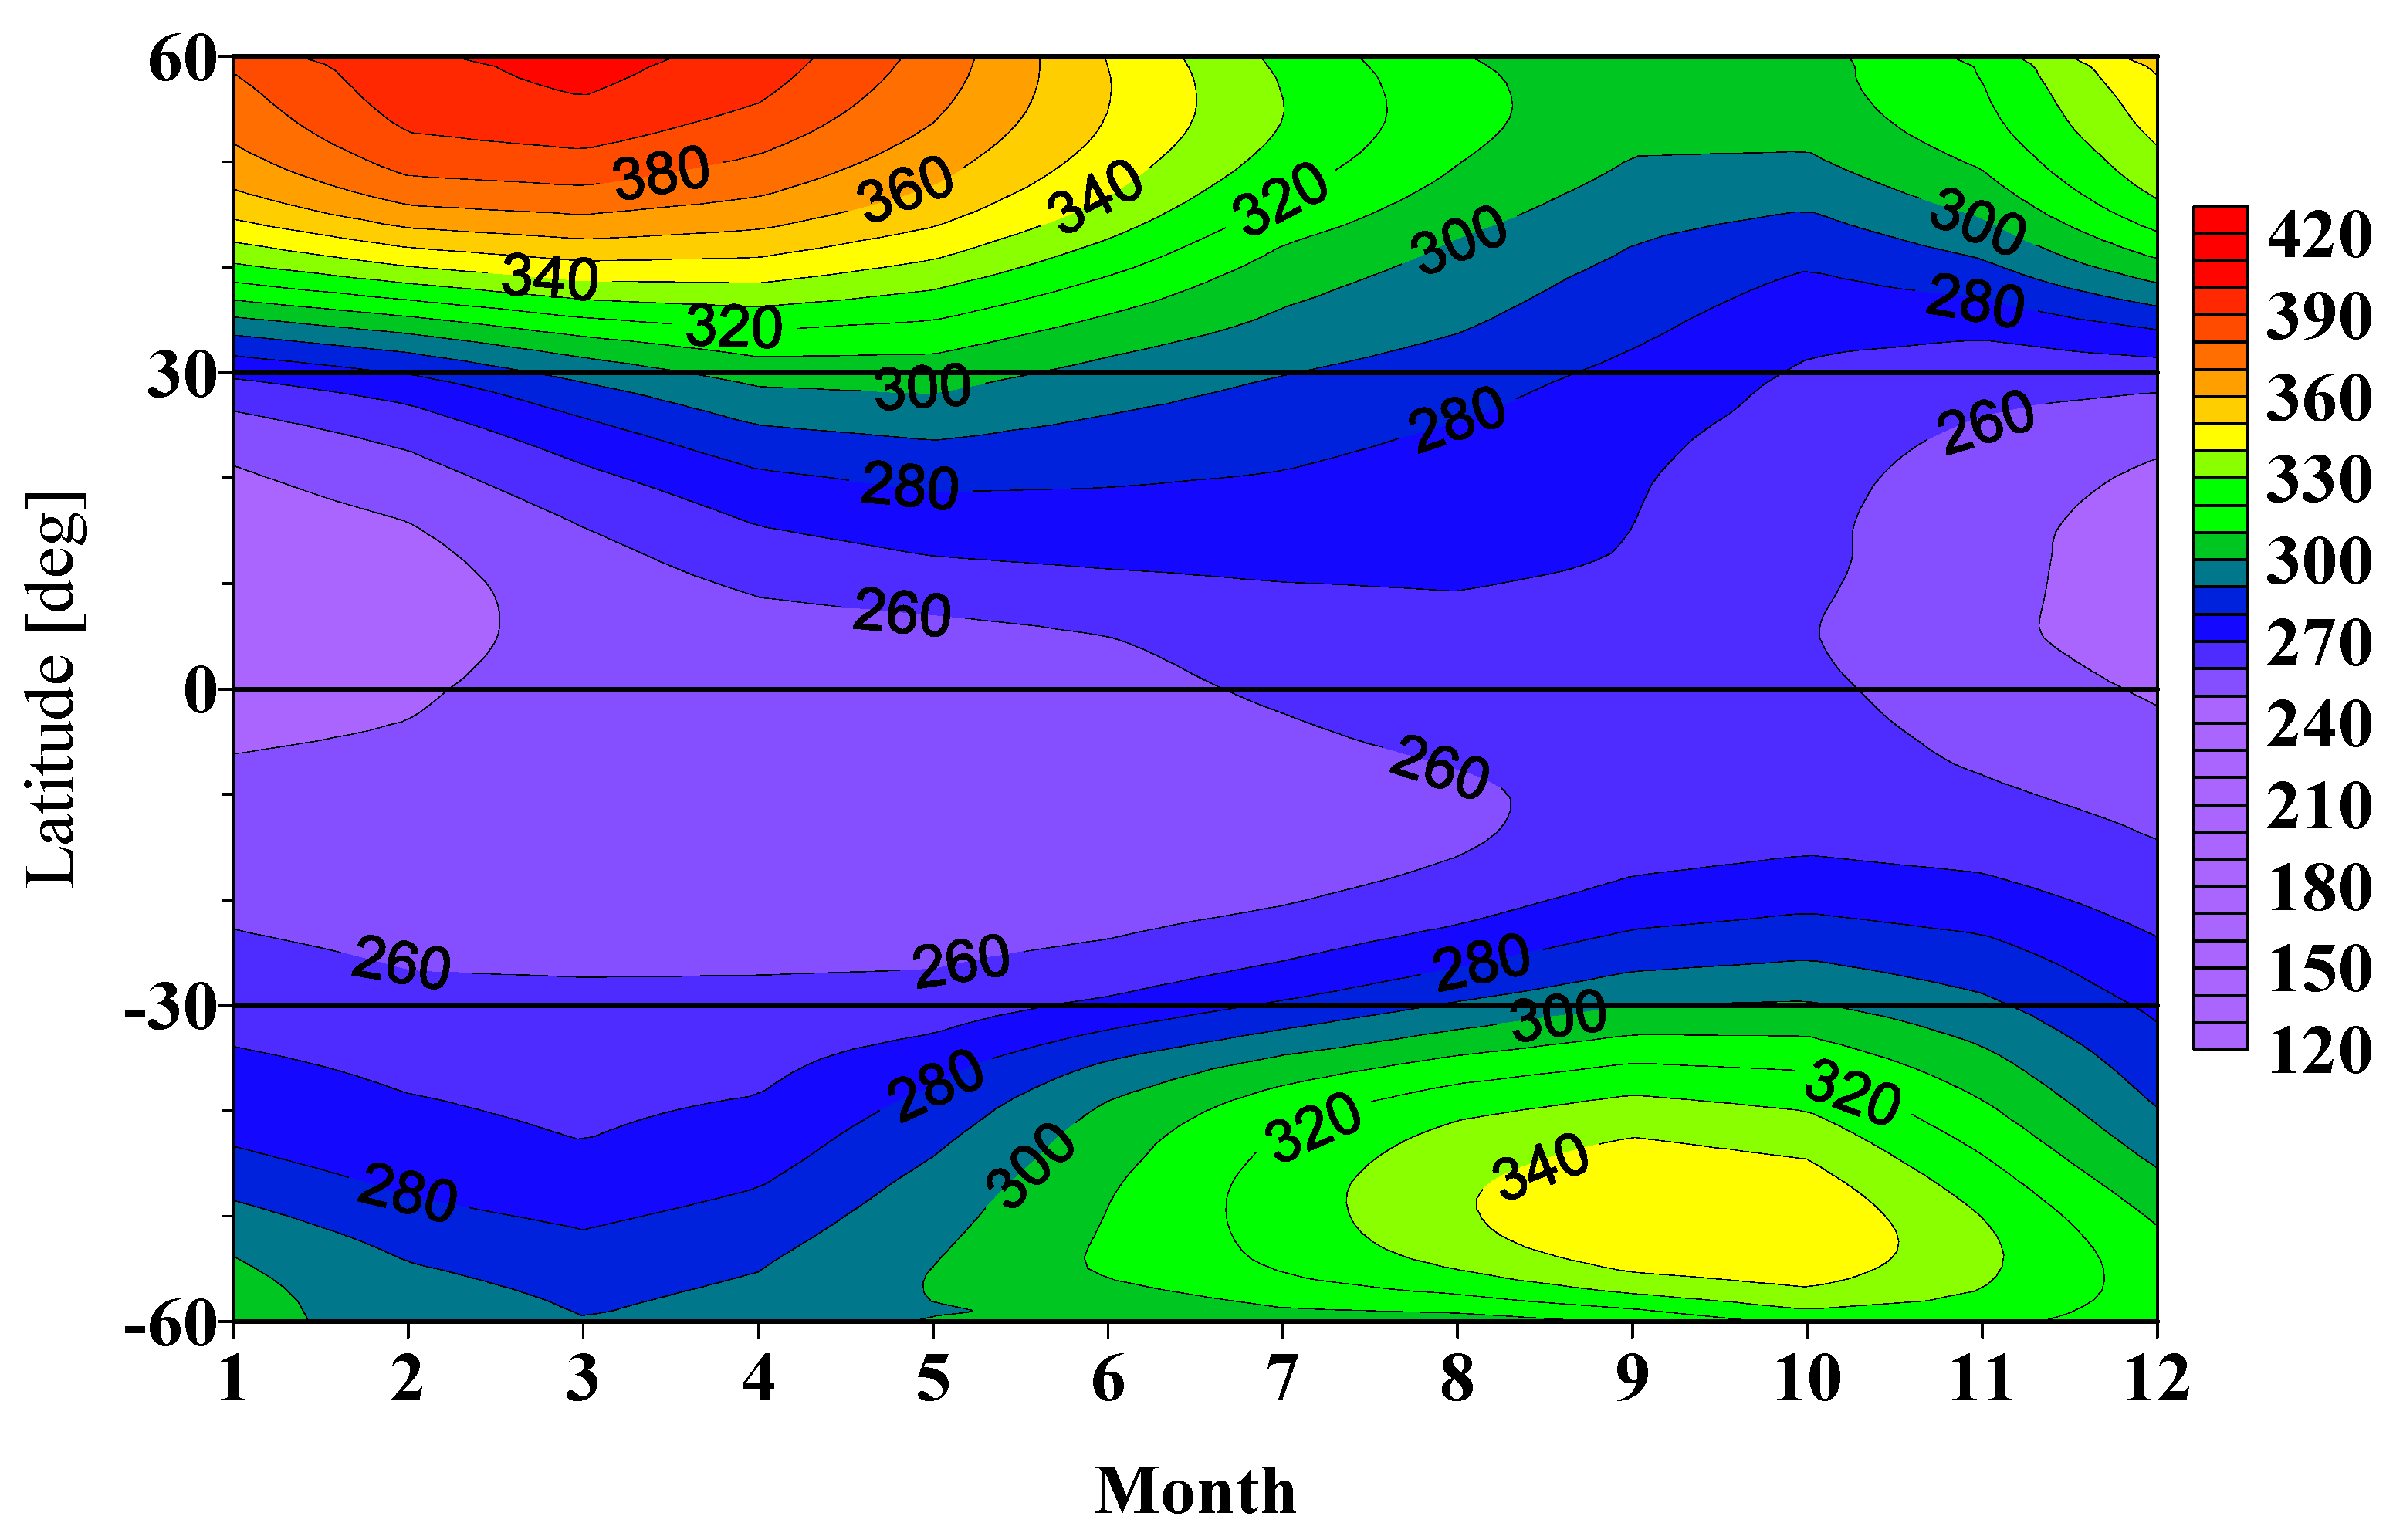
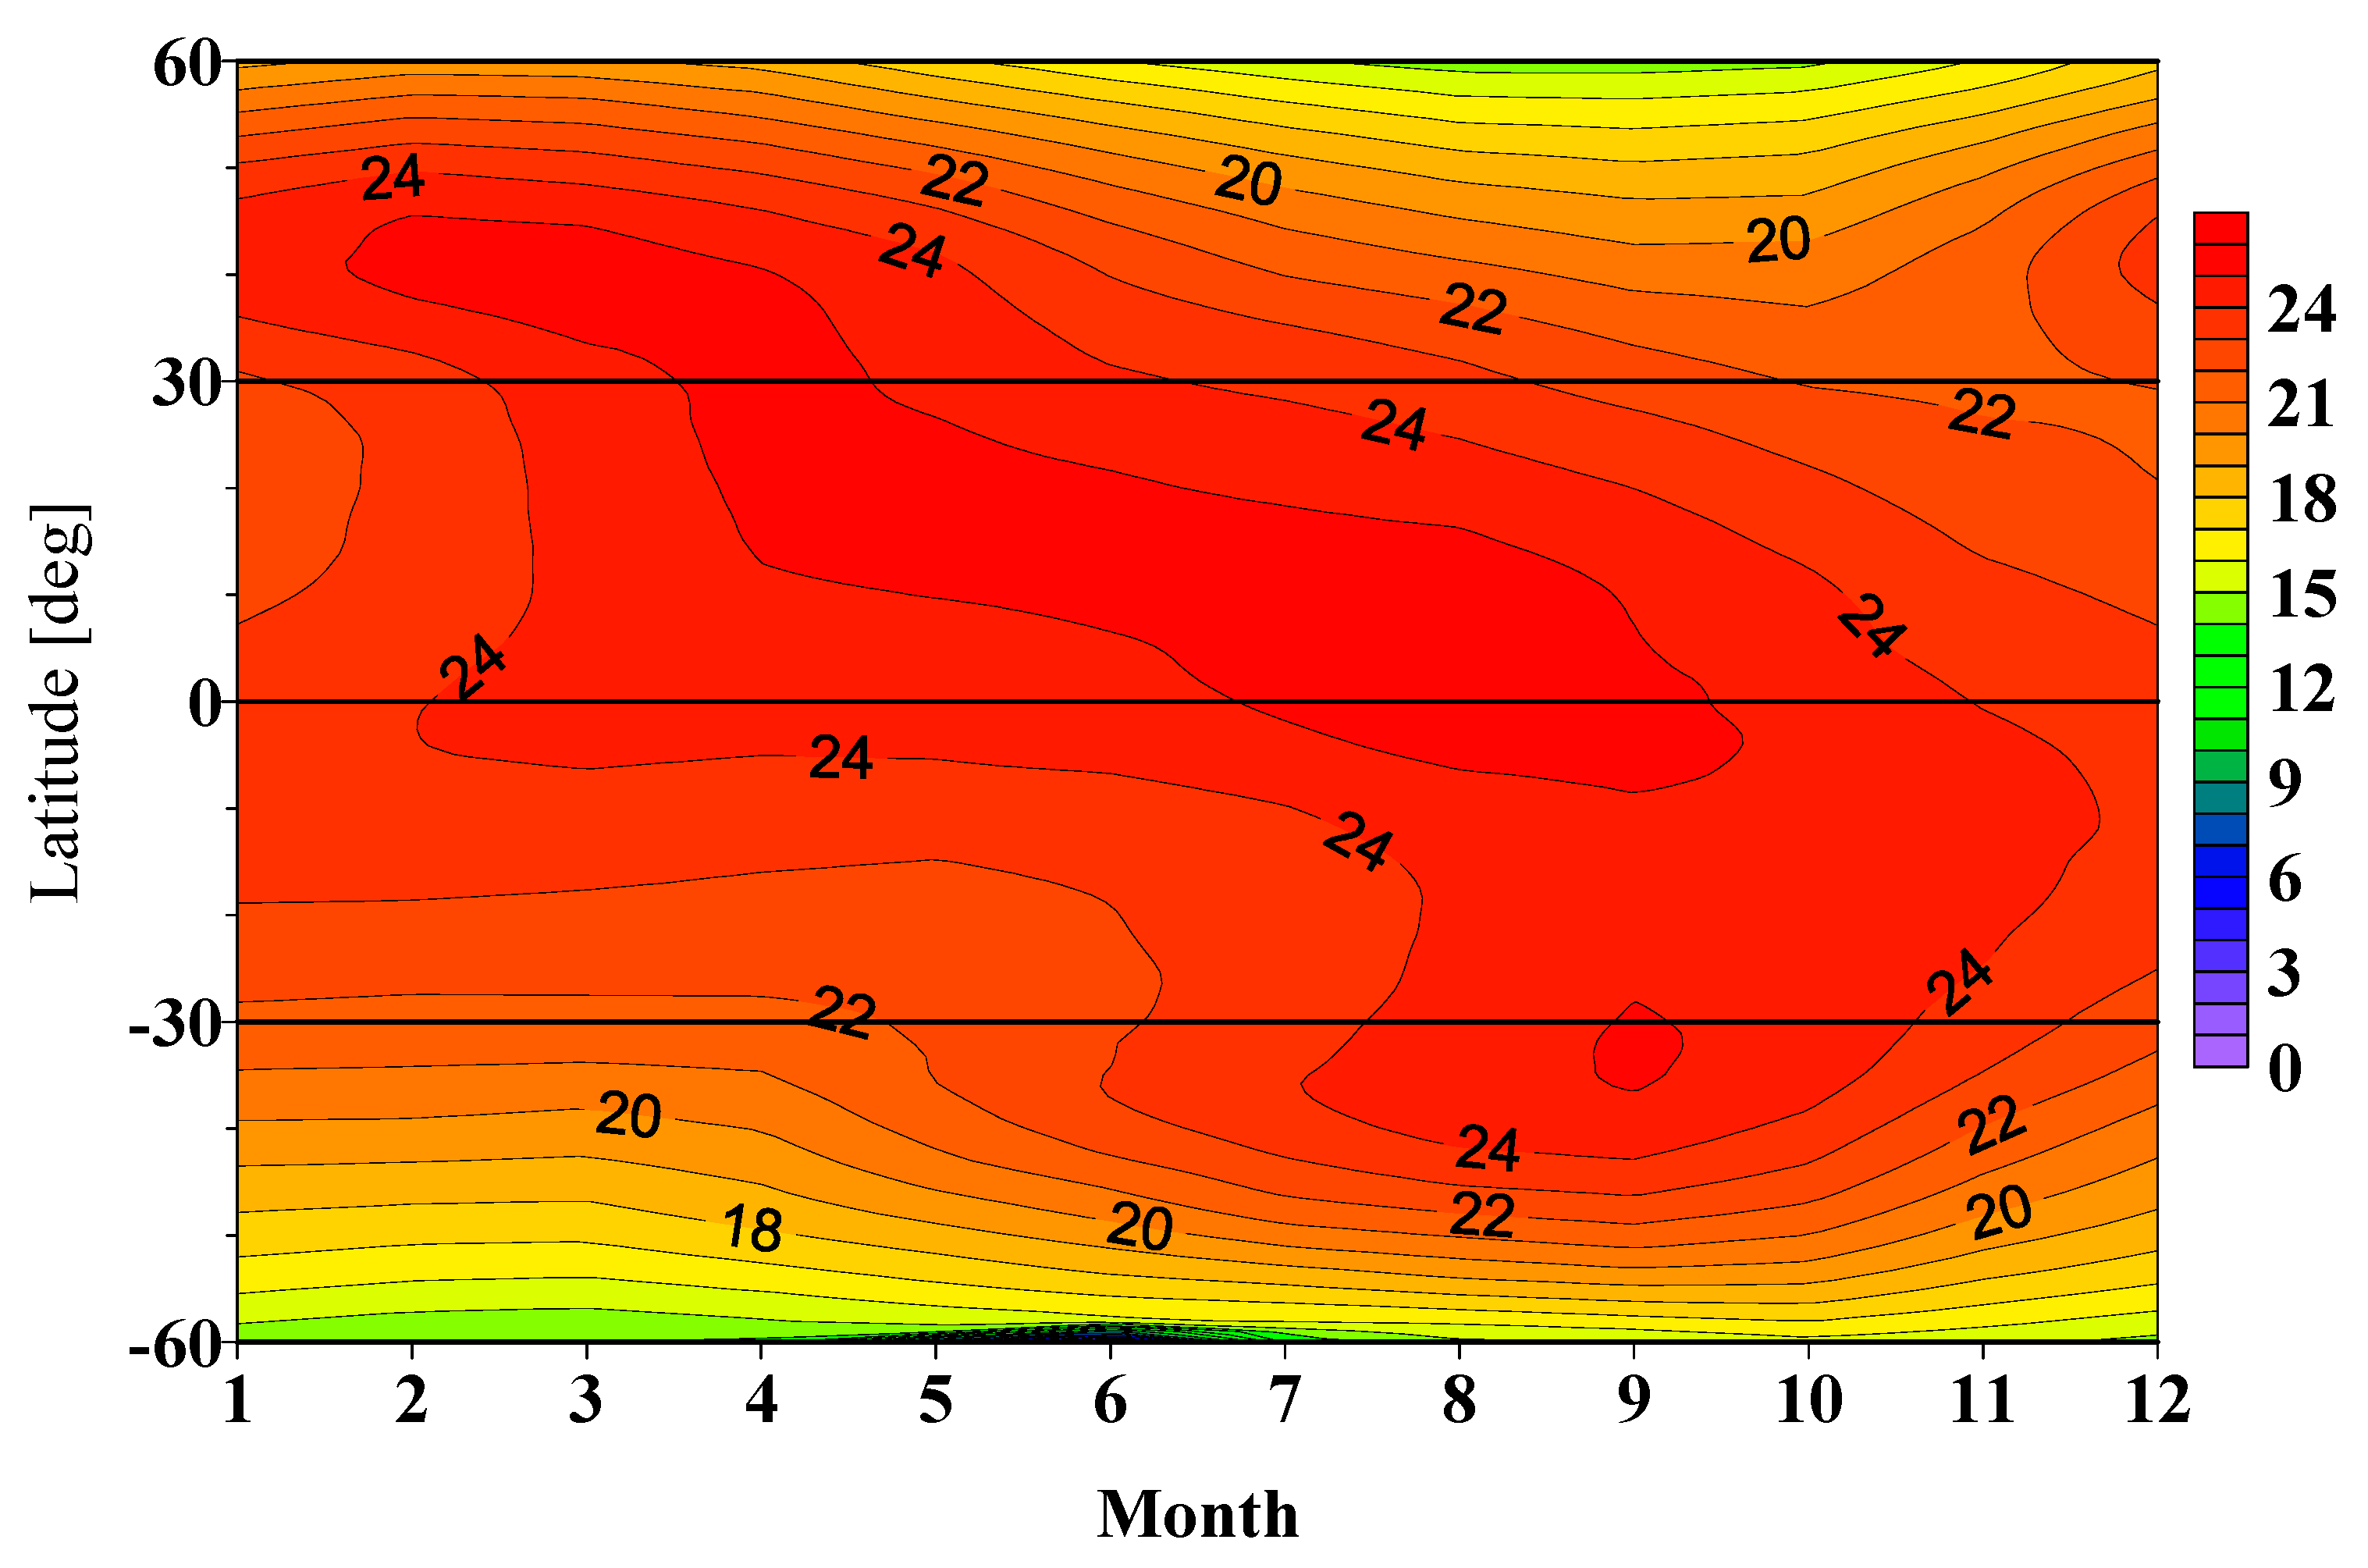
In the present study, which aims to determine macroscale changes in the Ozone layer, mean monthly and zonal mean values of TOC are used, which eliminates short-period variations in O3 concentration and longitudinal inhomogeneities. Figure 1 shows the average seasonal cycle of the TOC for the latitude range of 60° S to 60° N.
The presented 16-year climatological seasonal course of the average monthly zonal averages of TOC shows the regularities of the geographical distribution of O3 in the atmosphere during the different seasons. Figure 1 shows the well-defined seasonal cycle, which increases in latitude and has the highest values in the northern hemisphere at high latitudes, which in this article reach 60°, where TOC has values around 400 DU. At mid-latitudes (between 30° and 60° in both hemispheres), the concentration of O3 reaches maximum values in spring and minimum in autumn. In the equatorial region, the seasonal maximum is in September–October, and the minimum is in December–January. The mean diabatic circulation allows the transport of stratospheric O3, which is the explanation for the seasonal variation in TOC. Seasonal variations in TOC are significant, reaching about 100 DU in the northern hemisphere. The obtained average seasonal rate coincides well with that published in [3]. In their work, the authors illustrate a similar figure for the global distribution of TOC, and the results show that the O3 is low in the tropics and increases with latitude.
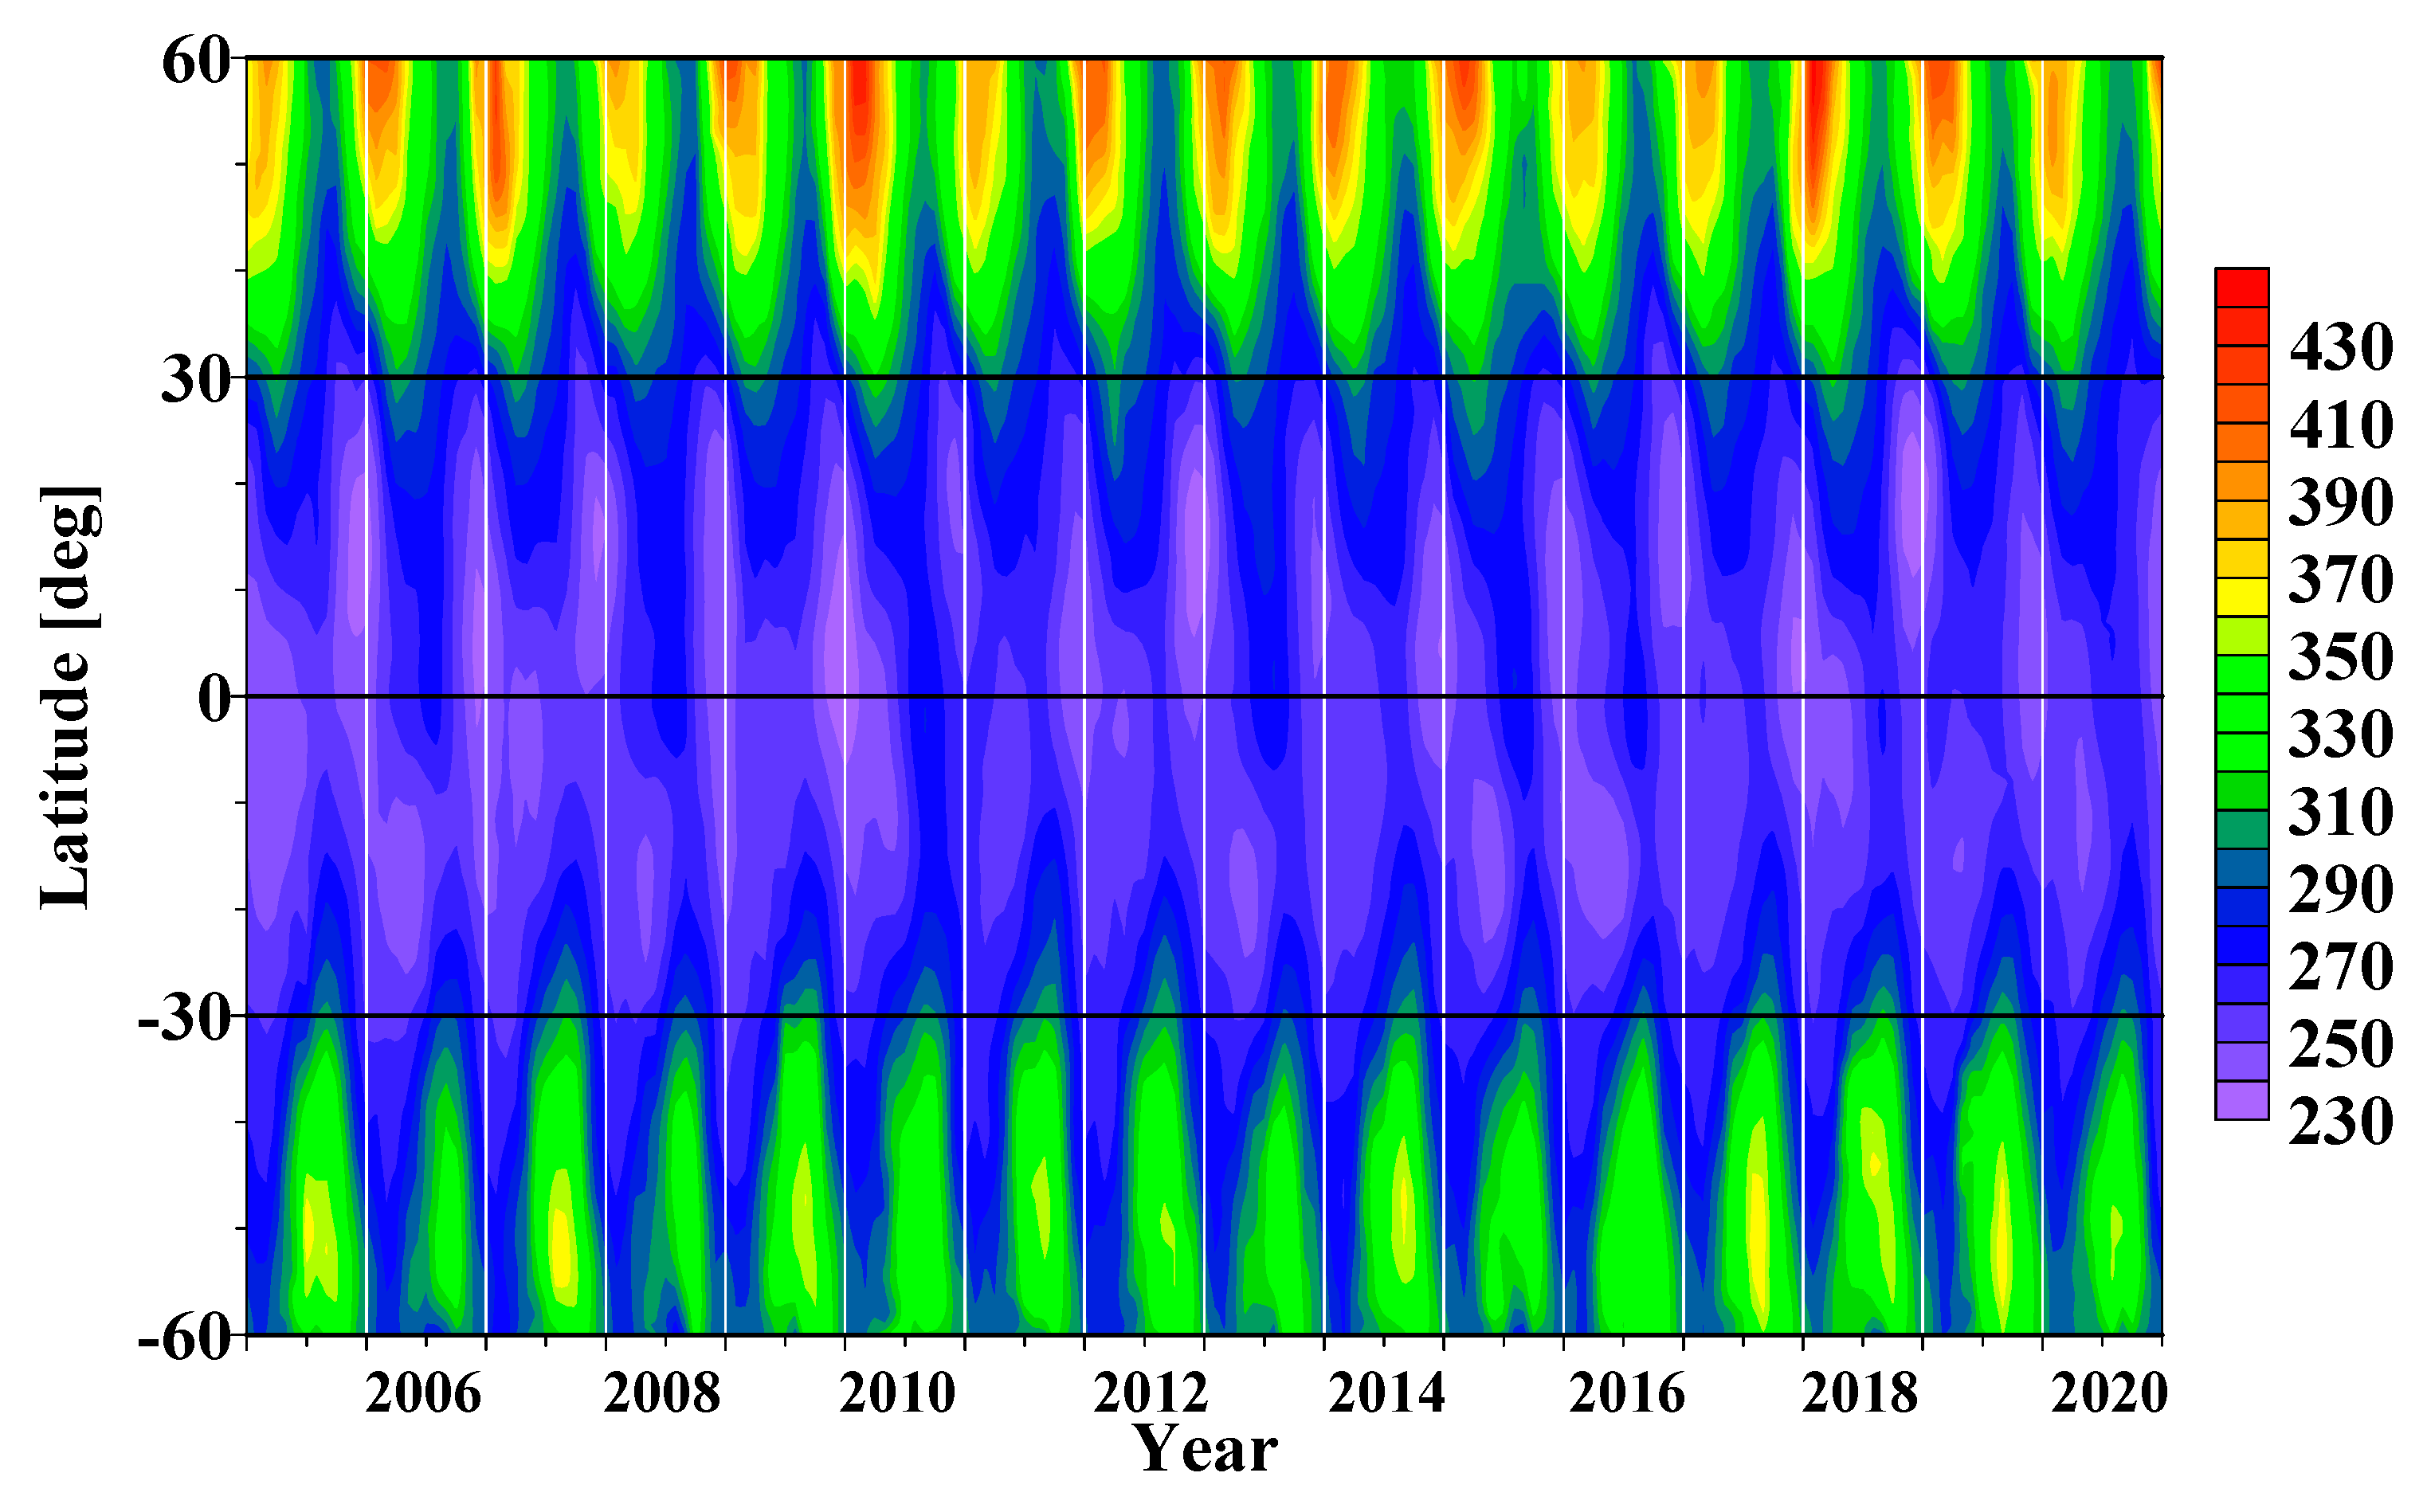
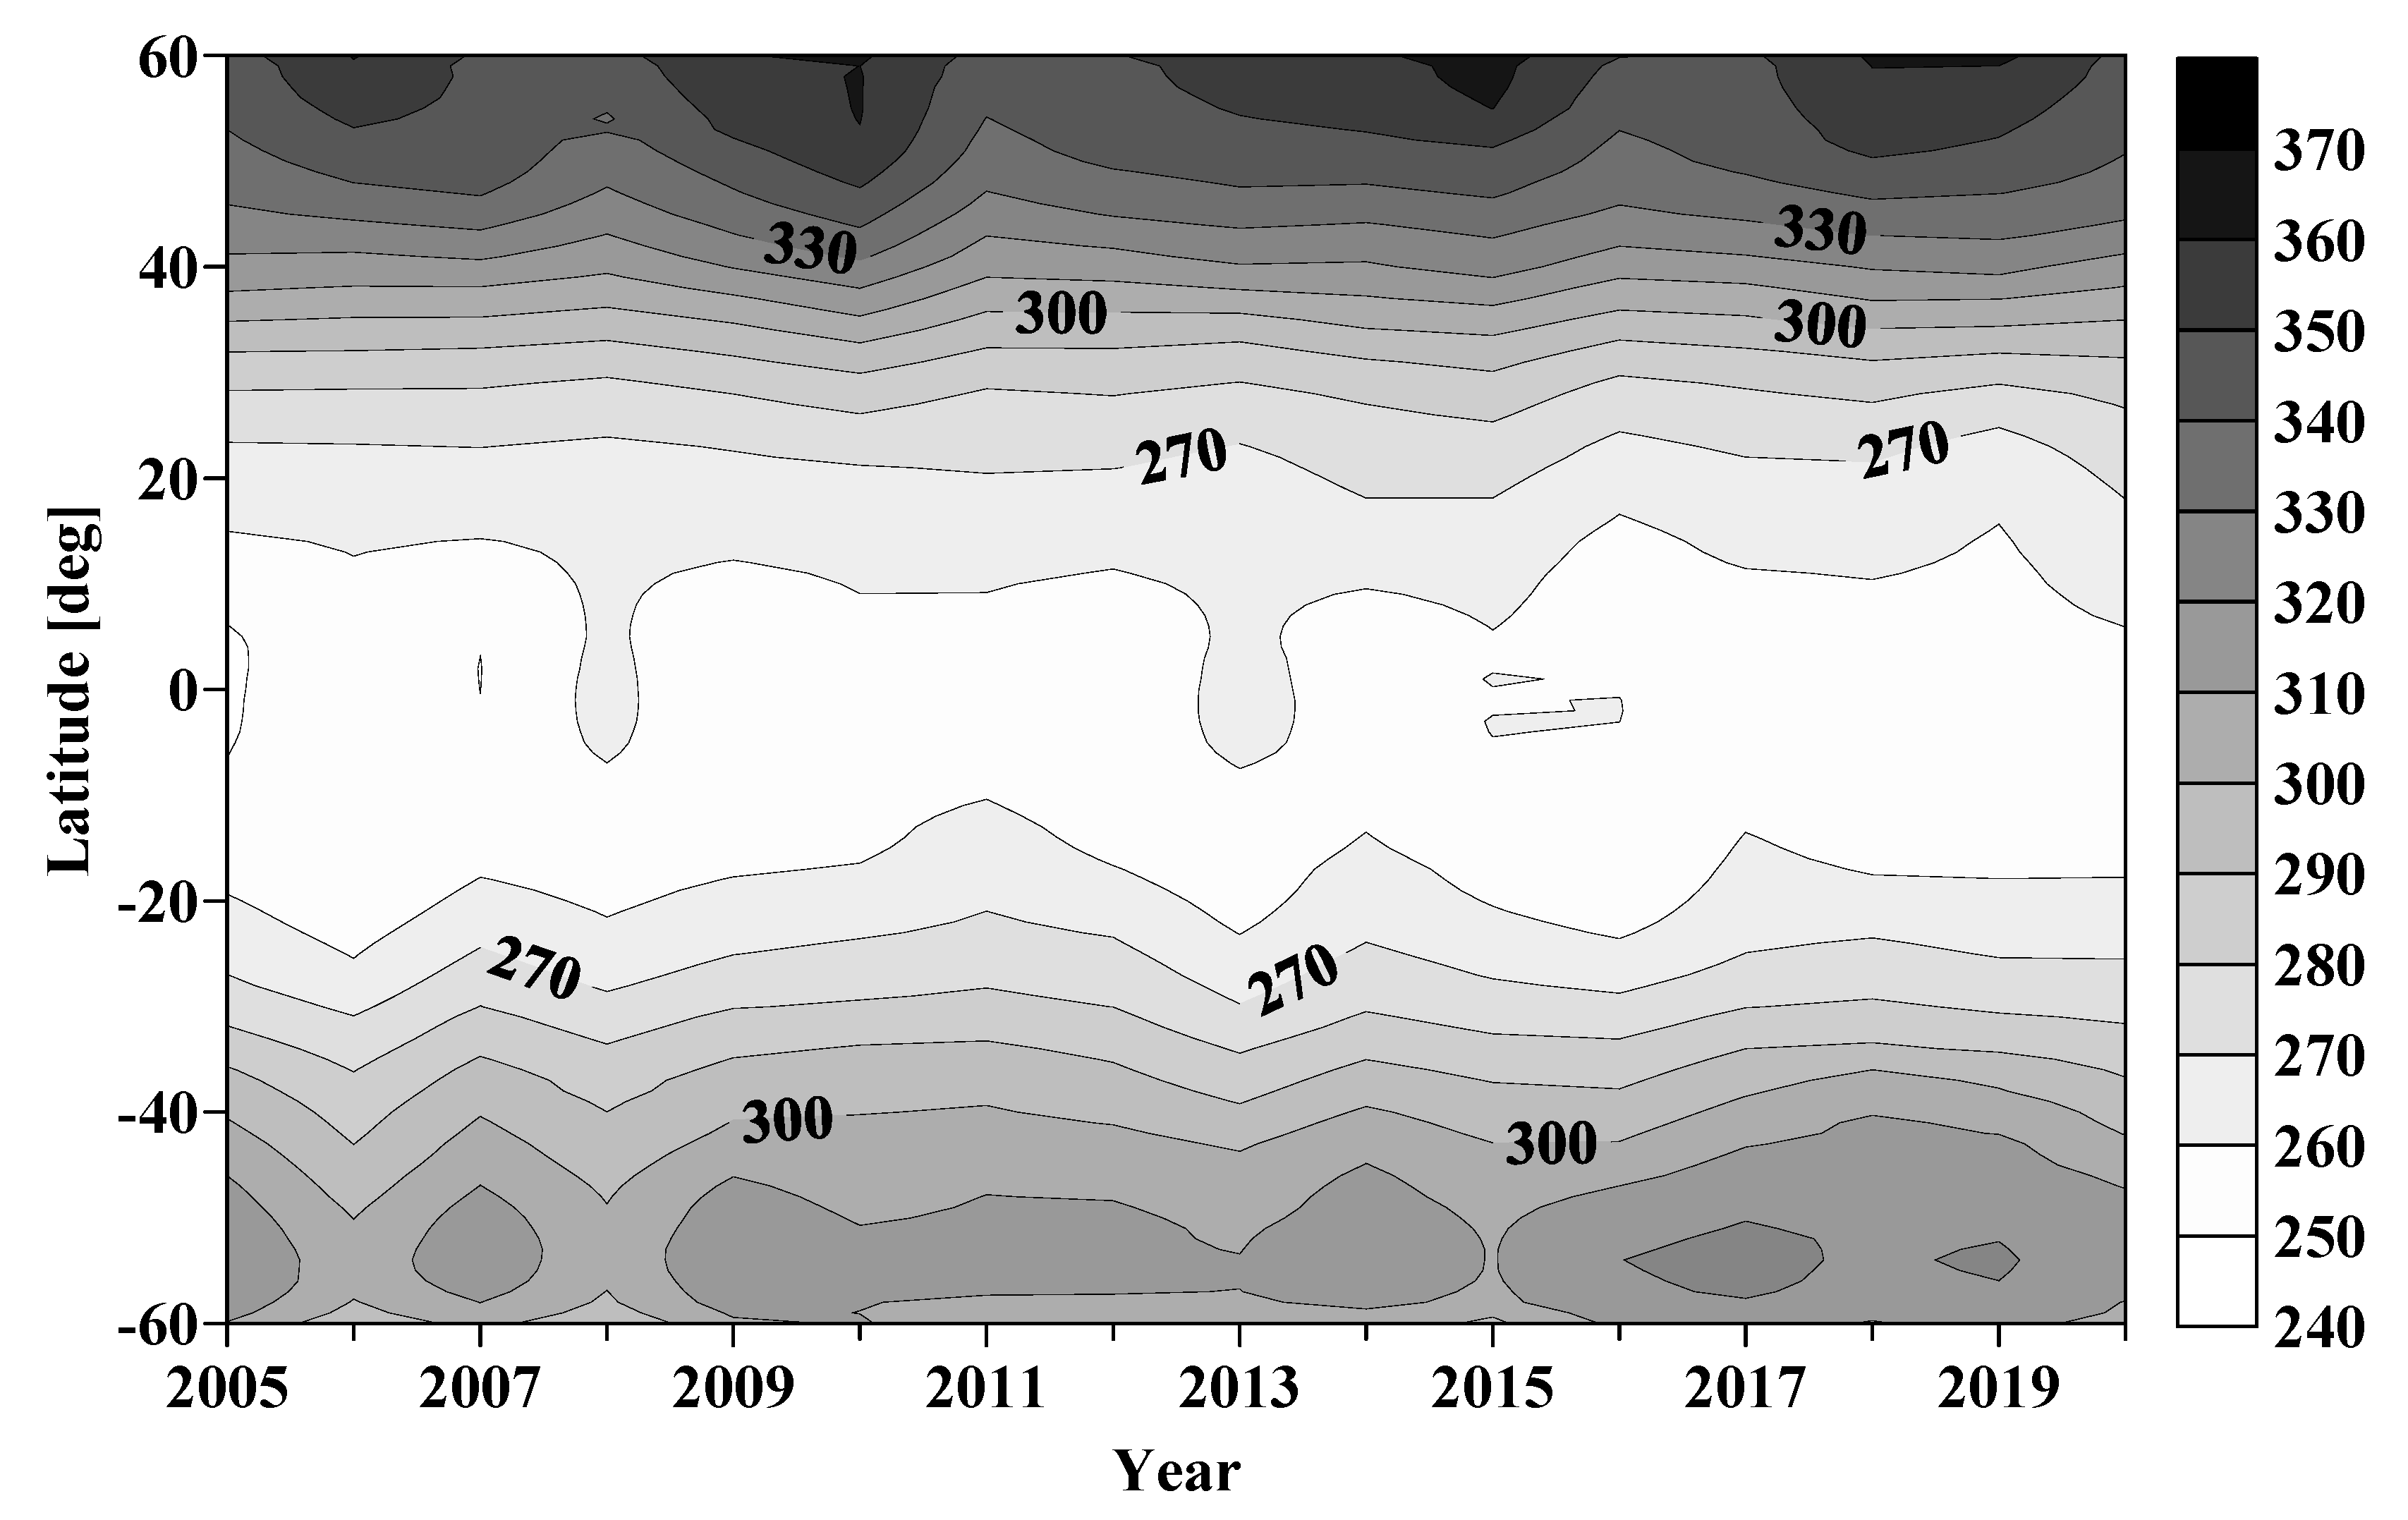
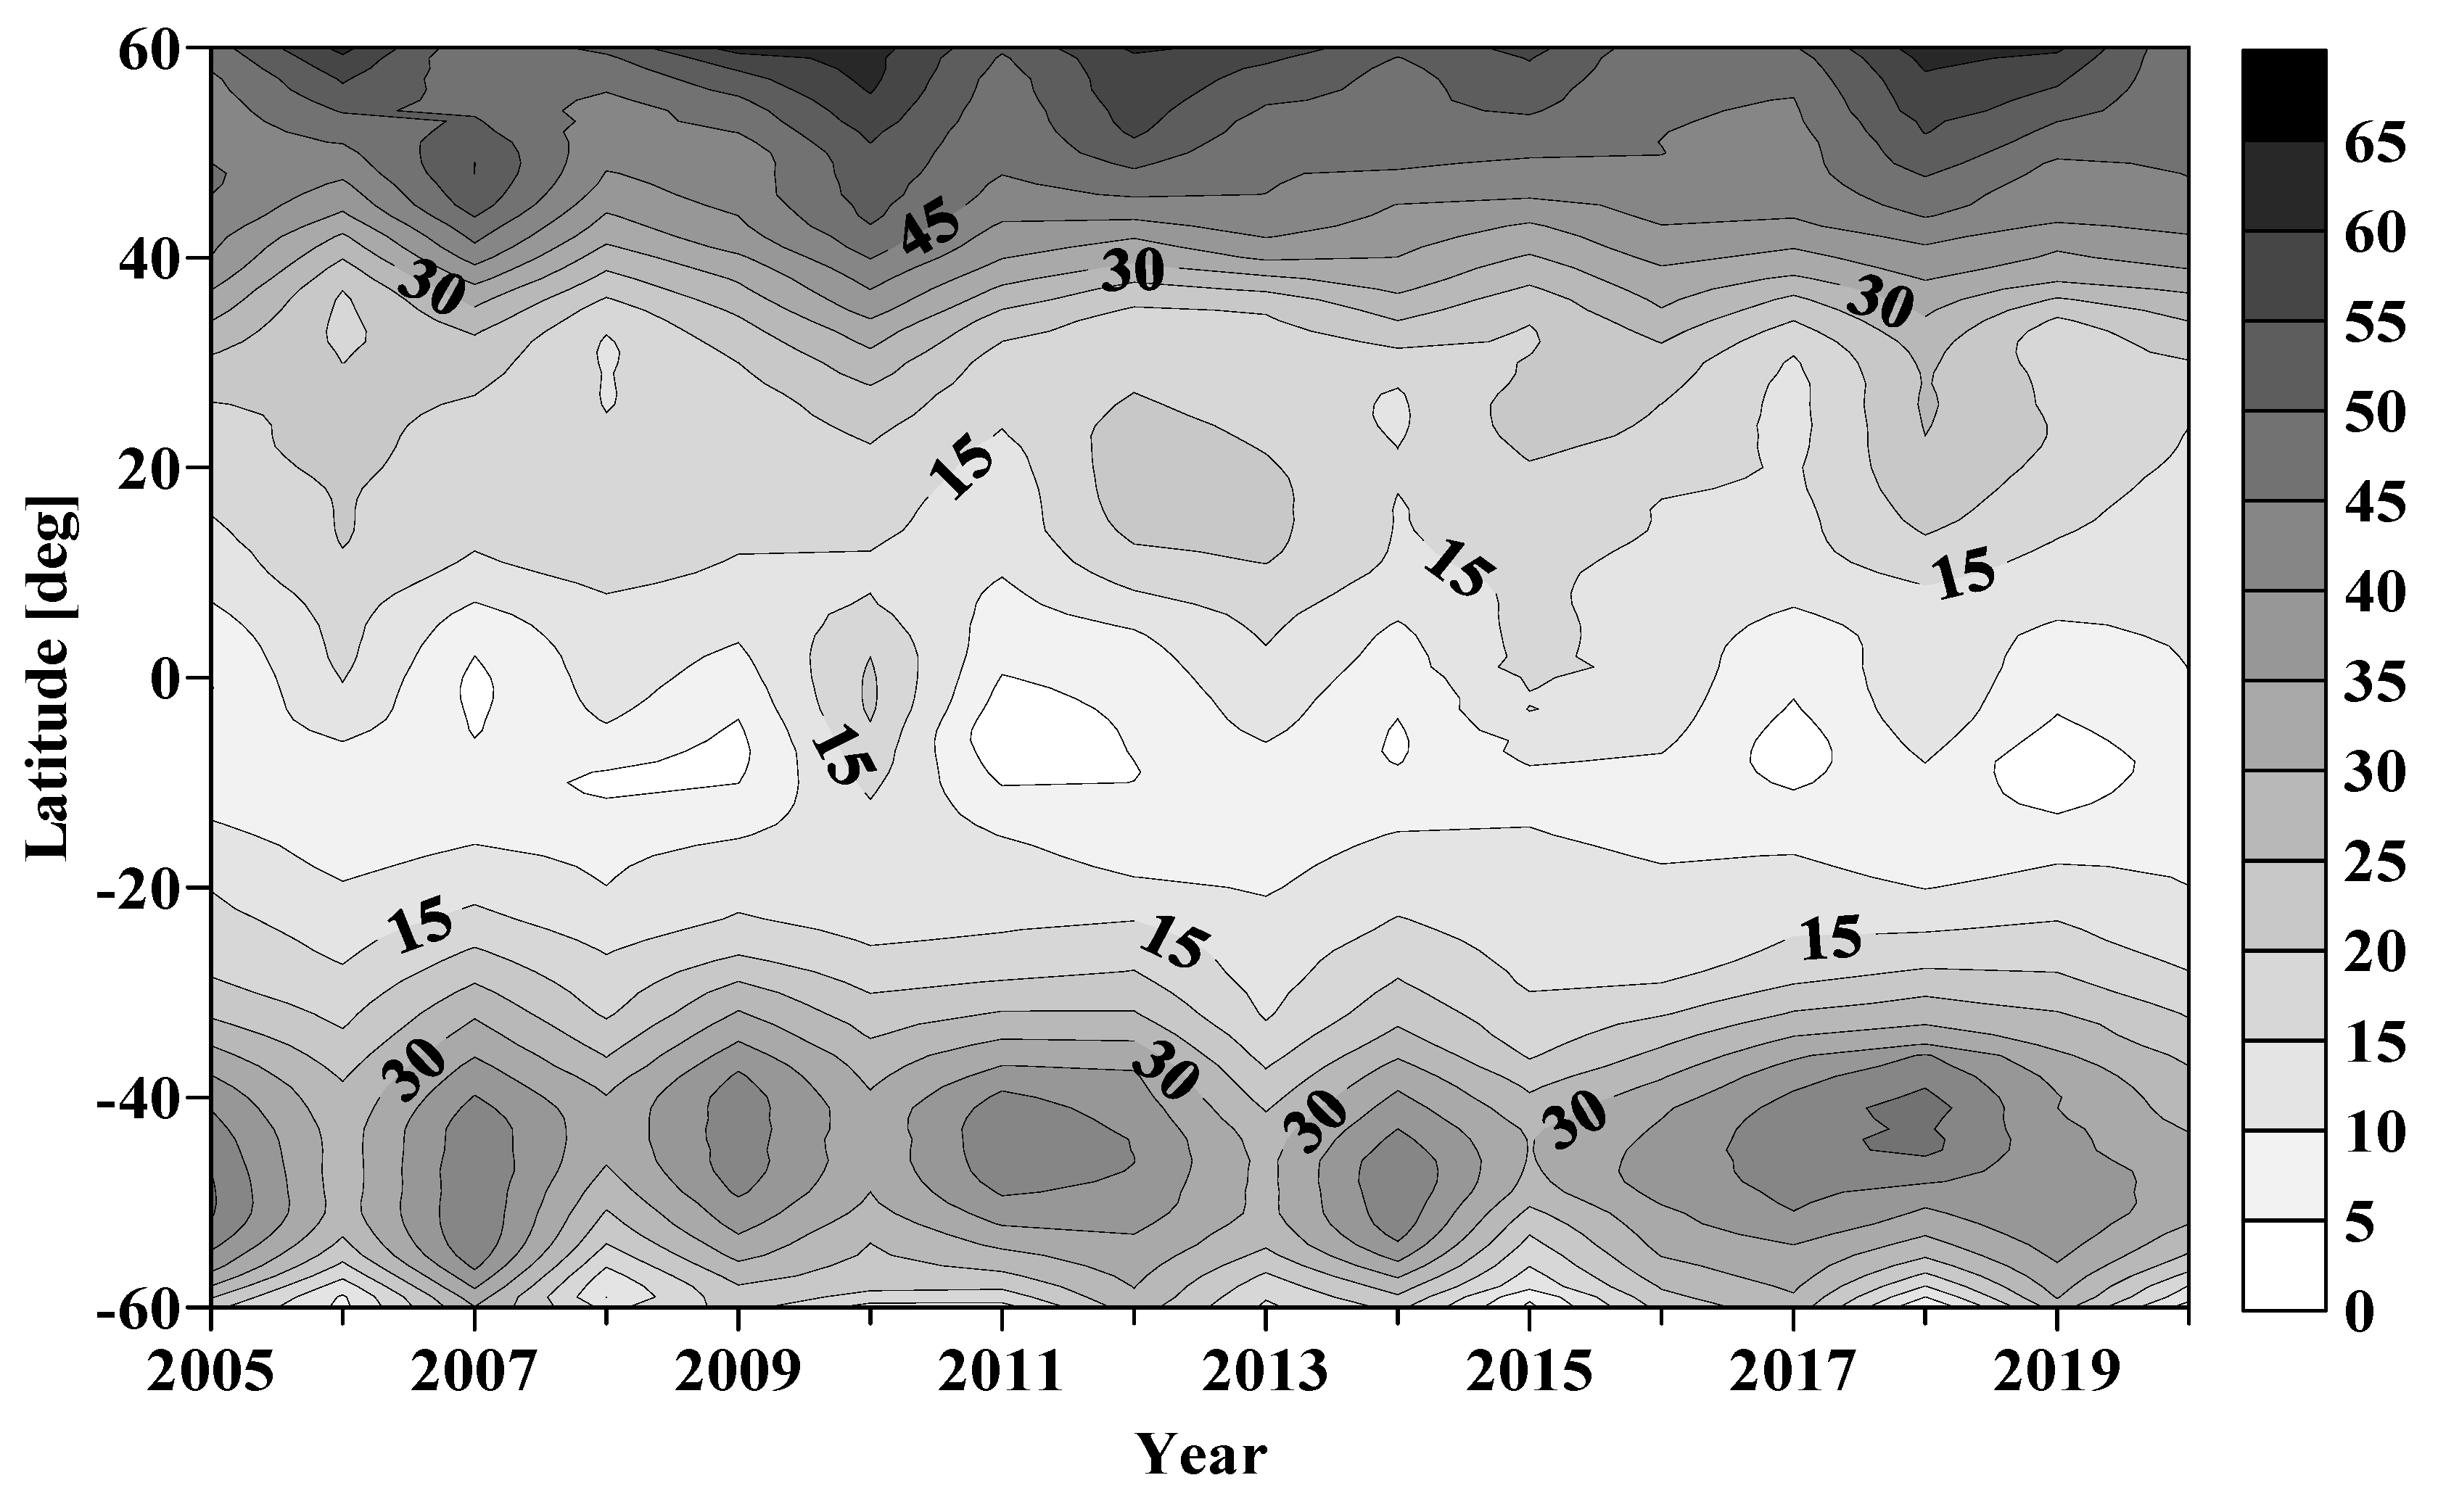
Figure 2 presents the course of the average monthly values of TOC for the period 2005–2020, which illustrates the repeatability of the seasonal cycle of all latitudes for the studied period of time. The trends of the zonal mean values of TOC are represented by the angular coefficient of the linear approximation of their time dependence, obtained by the method of least squares. The trends thus obtained actually determine the trend of the annual TOC values for the relevant latitude. The values presented are given in units of DU/decade, i.e., the amendment of the TOC for ten years.
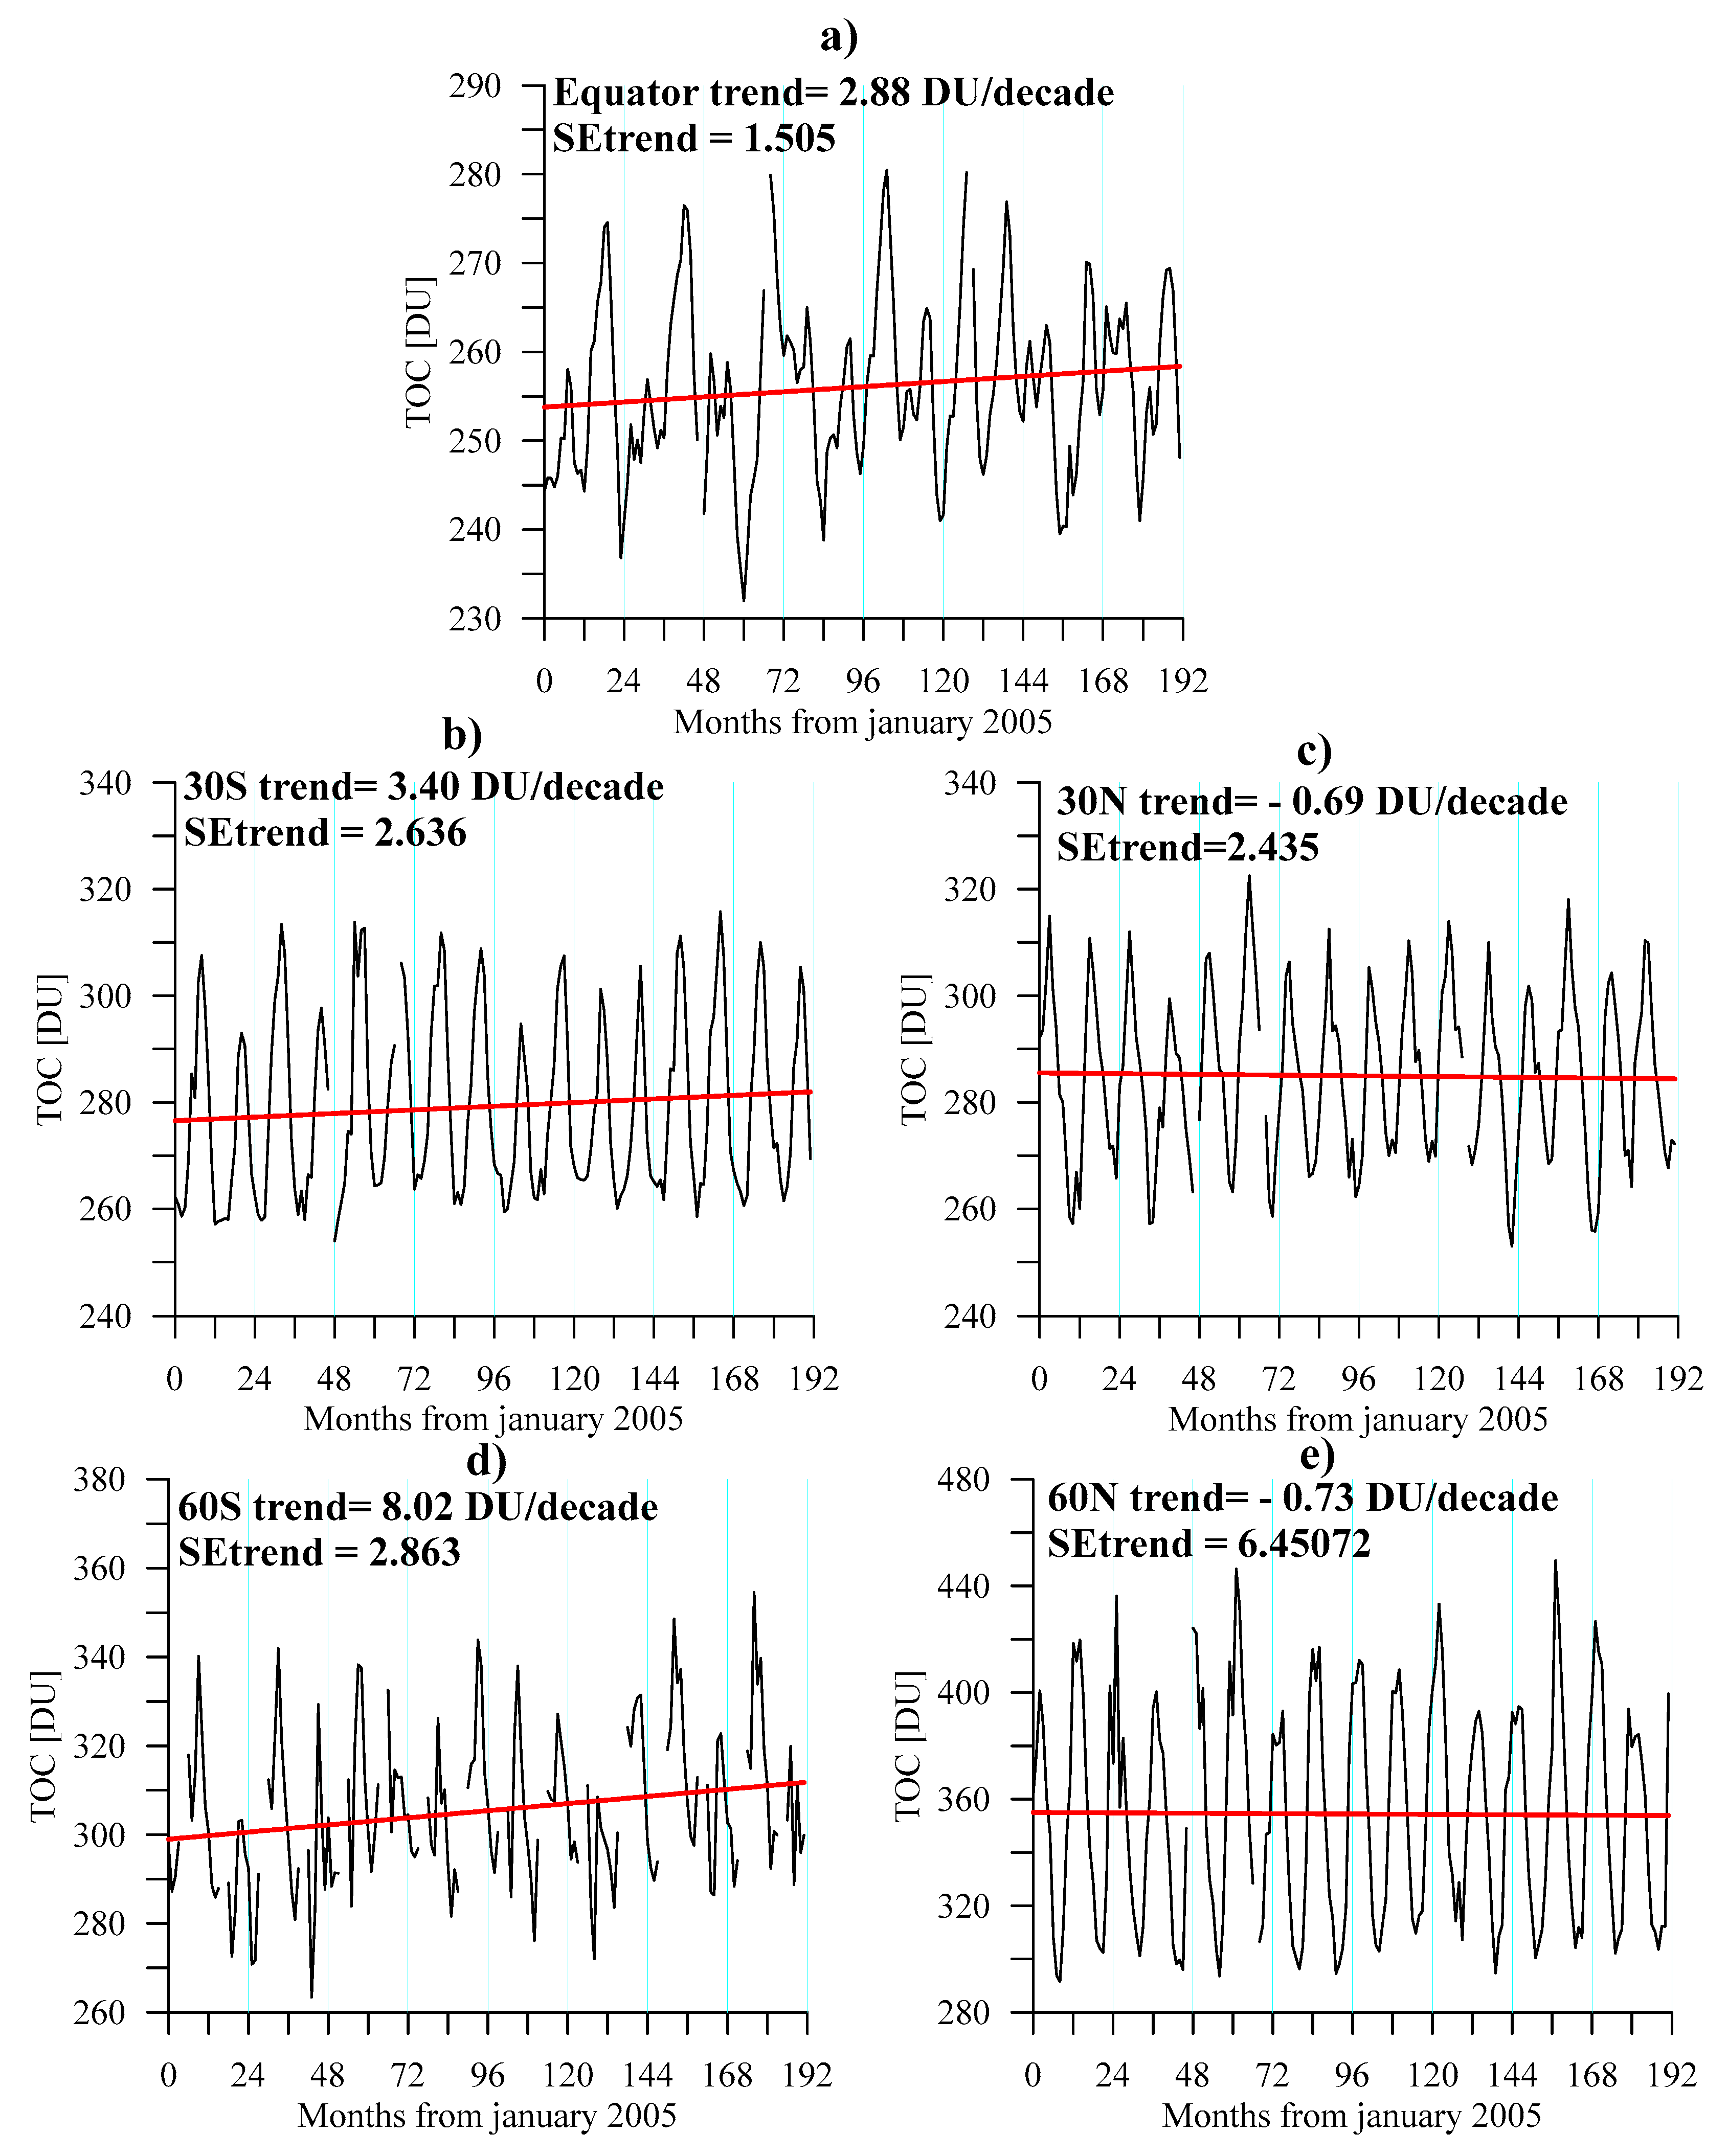
Figure 3 presents the course of the monthly mean zonal values of TOC for selected latitudes of the northern and southern hemispheres and for the equator and the corresponding linear trends. For these trends, their standard error is calculated by the following formula:
where σ2 is the dispersion of the differences between the data and the regression, and Sxx is the sum of the squares of the differences between the values of the independent time variable and its mean value.
The presented examples show that the obtained trends are insignificant compared to the seasonal variations of TOC, which are the main variability of the Ozone layer. The quasi-biennial oscillation is also visible at the equator, which is due to the quasi-biennial oscillation of the stratospheric zonal wind [20]. The values of the linear trend of TOC show clear latitude dependence. At 60° S, the value is positive 8 DU per decade, at the equator, it decreases to 2.88 DU per decade, and in the northern hemisphere, it becomes negative at 30° N, it is −0.69 DU per decade, and at 60° N, it is −0.73 DU per decade.
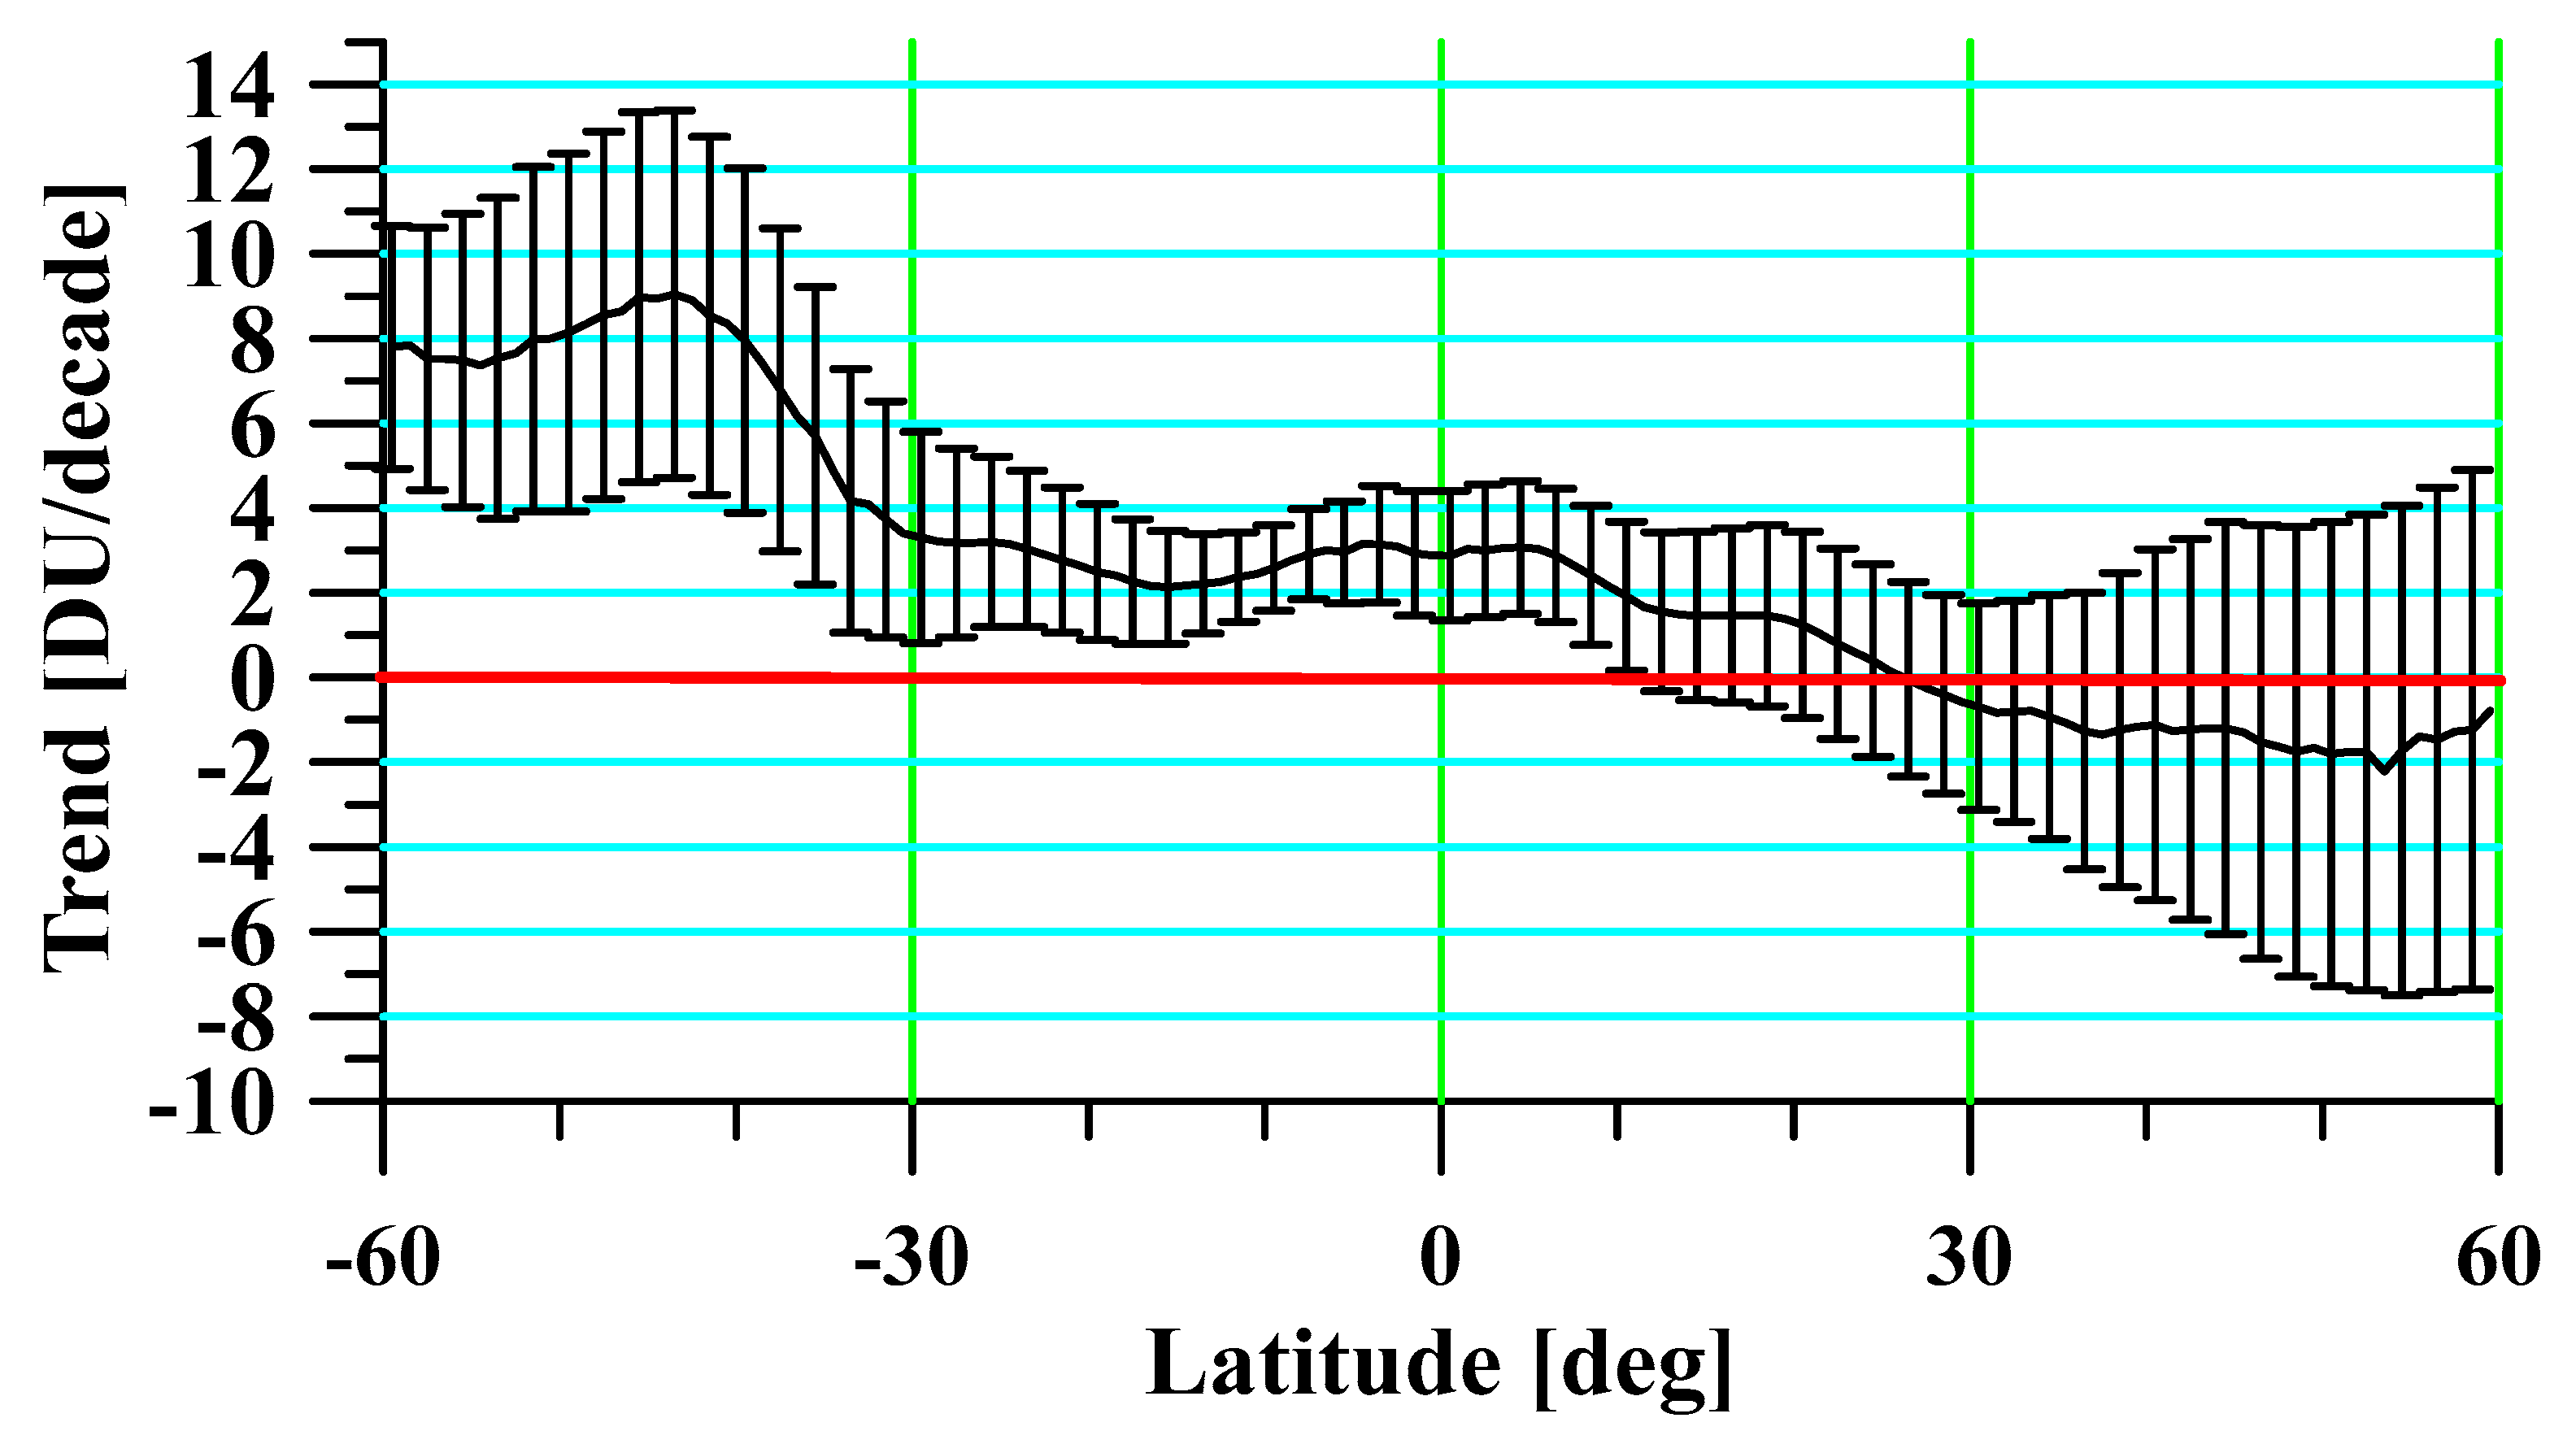
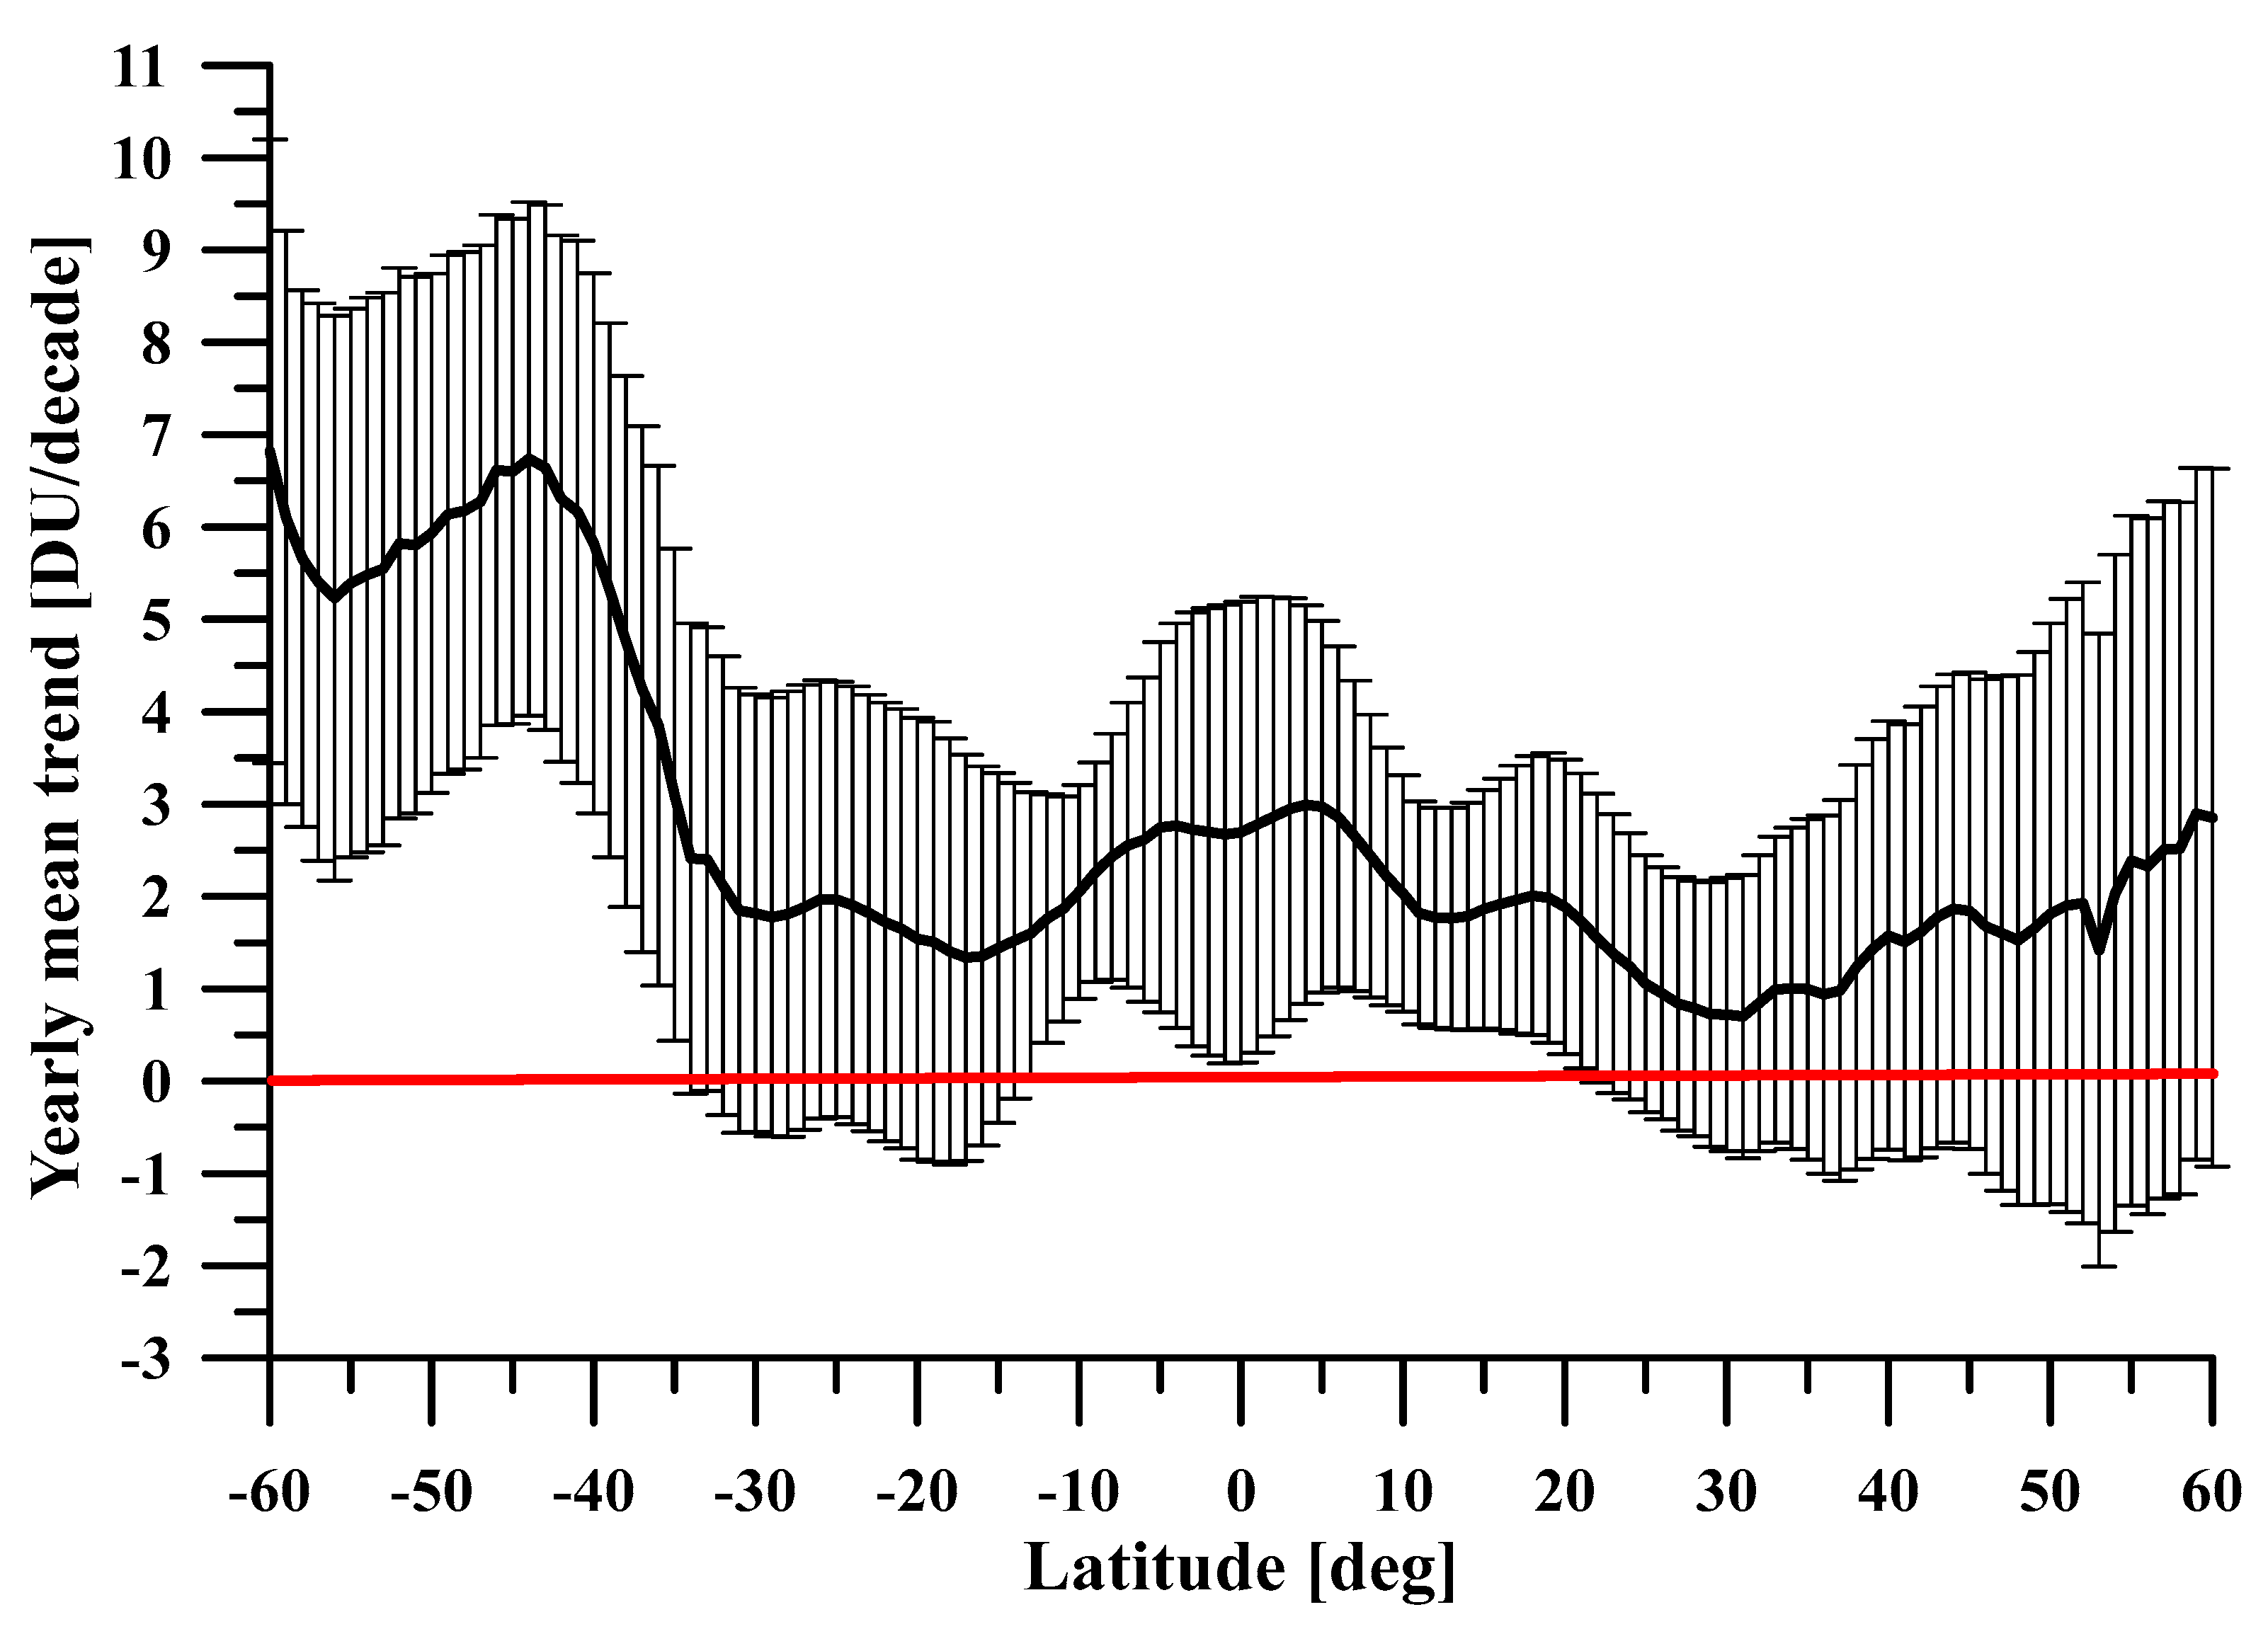
Figure 4 shows the latitude dependence of the linear trend, calculated in steps of 1°. The change in the sign of the linear trend occurs at 25° N. The largest negative value is observed at 55° N and is about −2 DU per decade. The obtained values of the linear trend can be compared with the results of [22], which were received by ground-based measurements for the time interval 1979–2016. Trends are summarized for latitude intervals from 35° S to 60° S and from 35° N to 60° N. The authors receive two sub-periods with a boundary around 1997. In the first period in both hemispheres, there is a negative trend, which is replaced by a small positive trend in the second period. The authors think that the period after 1997 is a period of recovery of the Ozone layer after its depletion in the previous period. The results received in the present study for the period 2005–2020 do not contradict this conclusion. The results show that the O3 recovery process has a latitude dependence. The presented latitude dependence is more significant in the southern hemisphere, while in the northern hemisphere, at mid-latitudes, there is a slight decrease in O3 concentration. The resulting latitude dependence is related to purely intra-atmospheric asymmetry of both hemispheres, which is clearly evident in the climatology of the seasonal cycle of TOC. The range of probable, with 50% probability values of the linear trend (trend ± SEtrend) at the latitudes between 60° S and 10° N, shown in Figure 4, is located in the area of positive values. The increase in standard error at high latitudes in both hemispheres is due to the increase in seasonal variation of TOC.
The trends received for the period 1979–1991 are −3.7 DU per decade for the tropics and −7.2 DU per decade for mid-latitudes, respectively [23]. The values obtained in the present investigation for the next time period confirm that the Ozone layer has been recovering for the last 16 years. In order to eliminate the influence of the seasonal cycle of TOC, the relative deviation of the average monthly TOC from the climatological average value is marked as TOCmean (month) by the following formula:
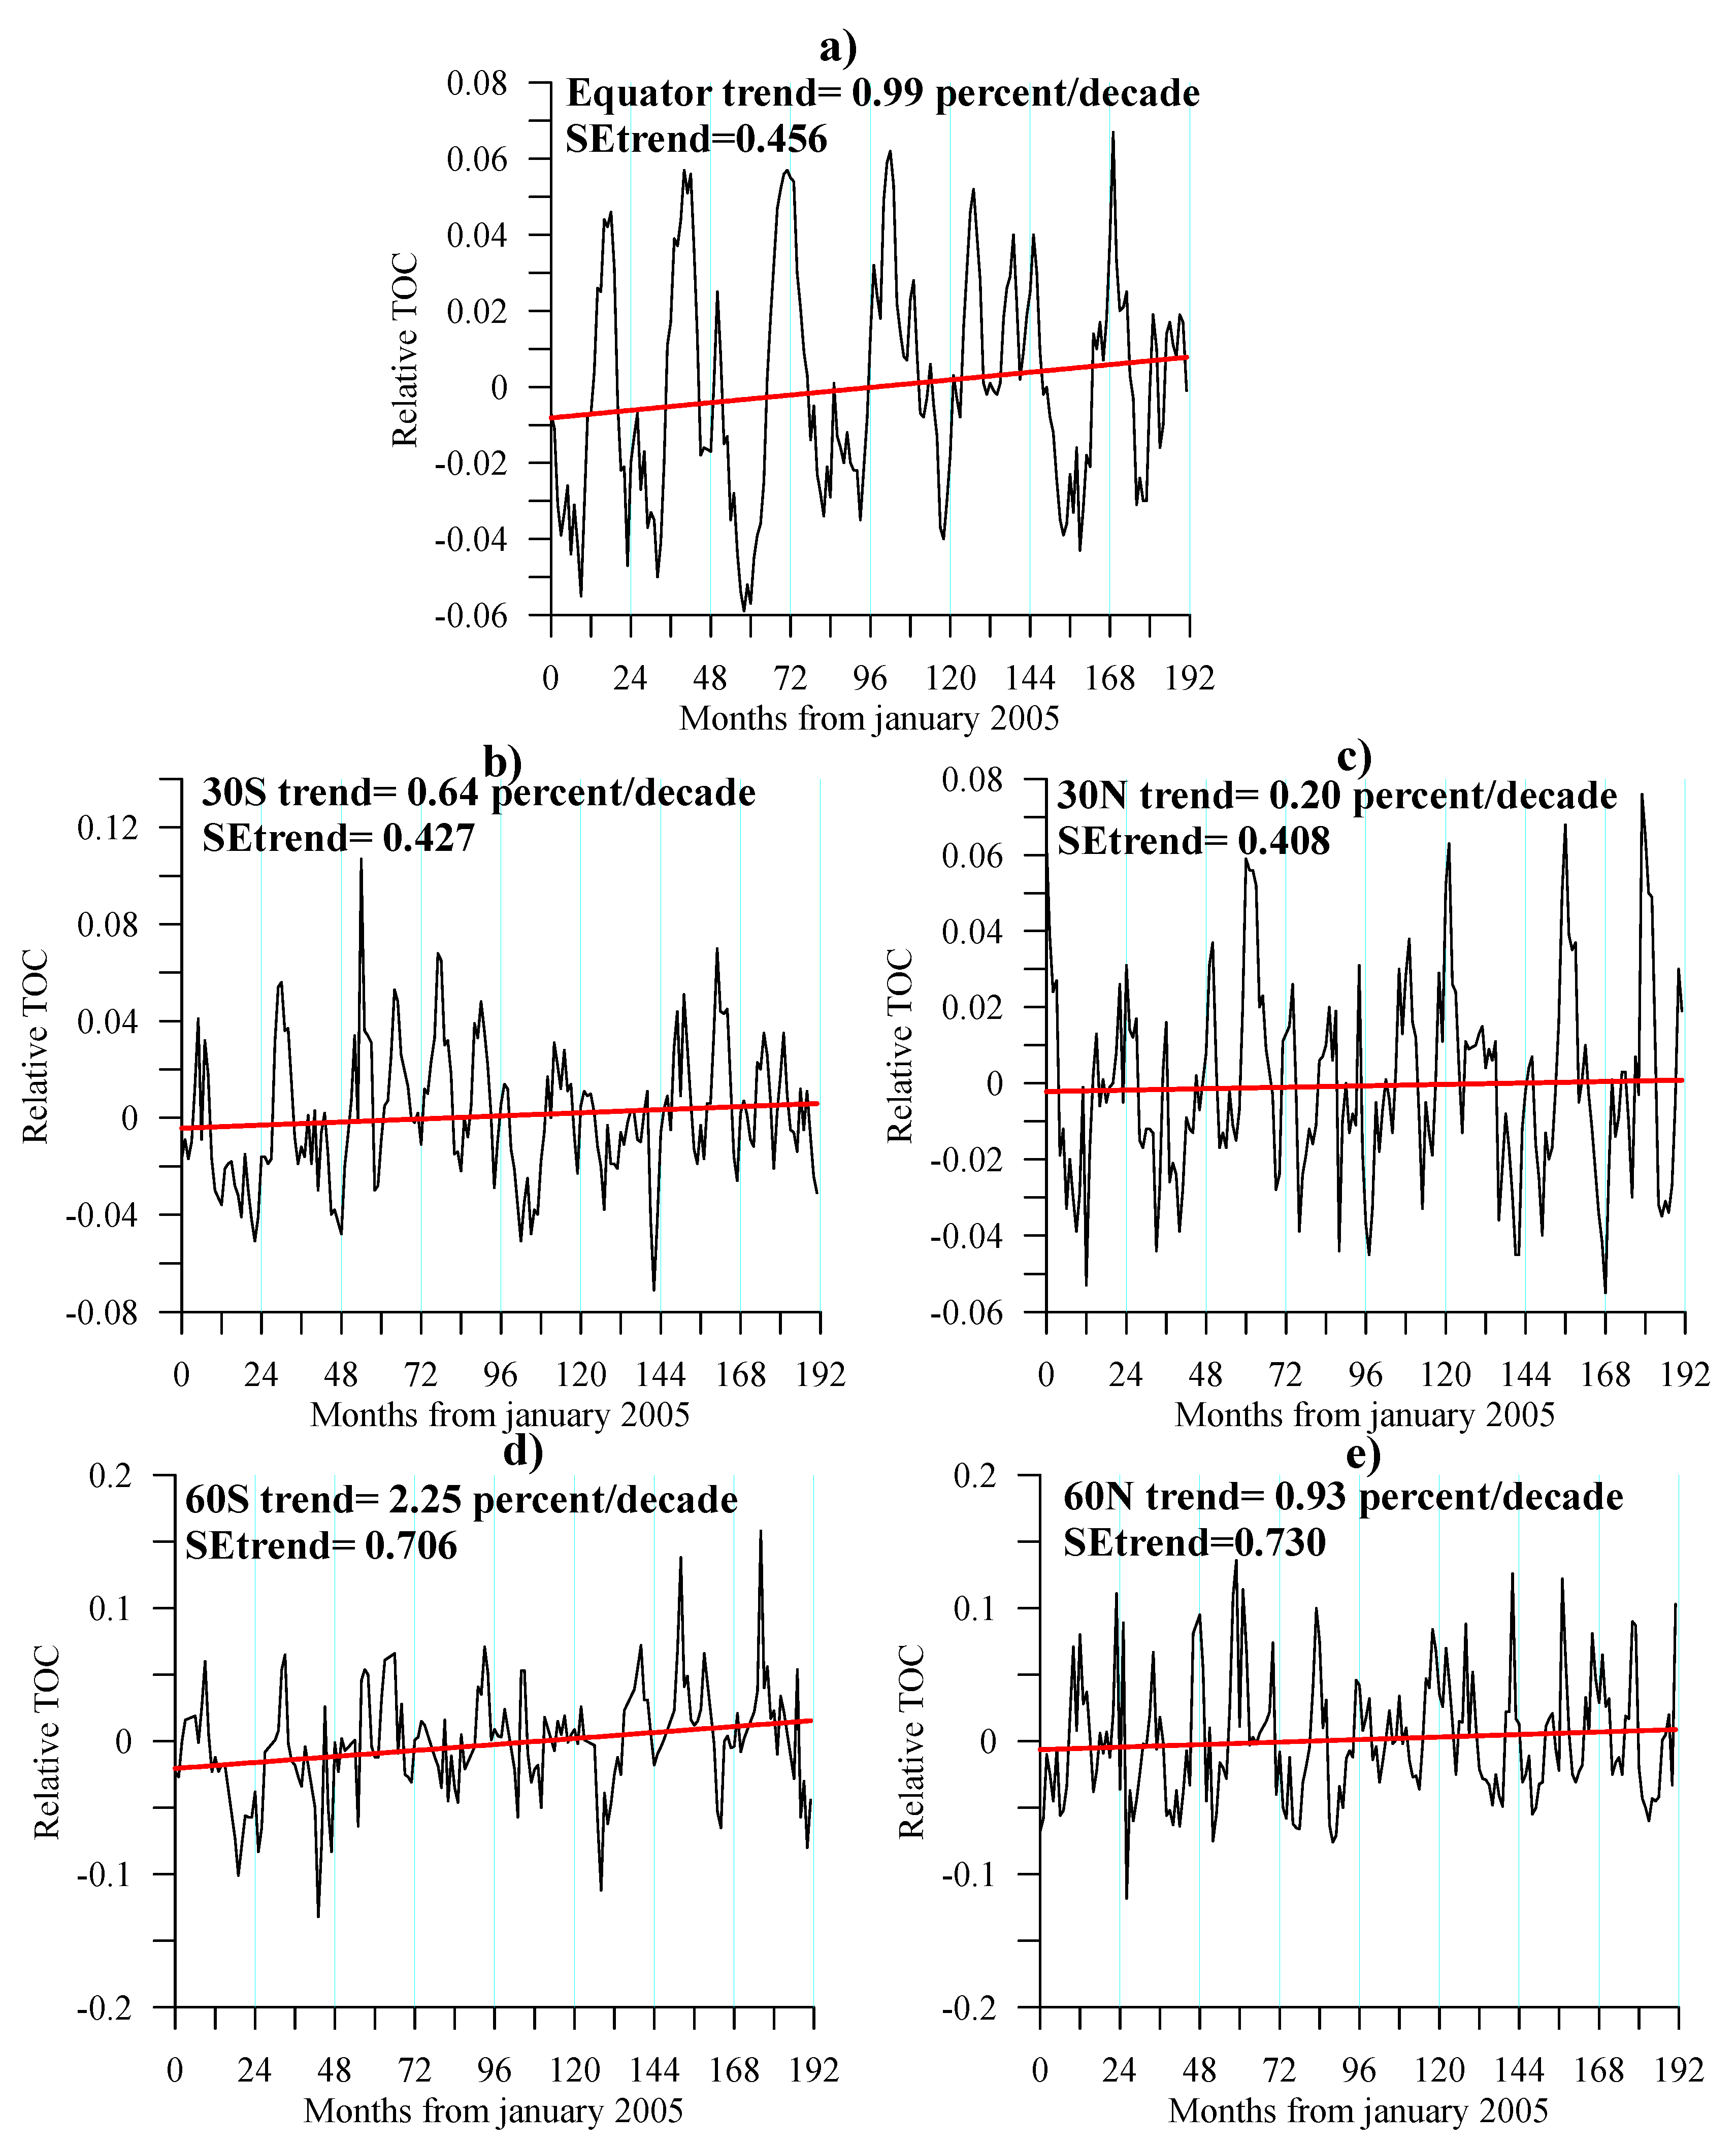
In the time series of the calculated relative TOC by Formula (2), there is no stationary seasonal cycle, but all long-period trends are preserved. Figure 5 shows examples of the course of the relative monthly mean and their trends of the same latitudes as in Figure 3, namely: (i) the equator, (ii) the northern and southern hemispheres of mid-latitudes (30° N and 30° S, respectively), and (iii) the distribution and trend of high latitudes in both hemispheres (northern hemisphere 60° N and southern hemisphere 60° S).
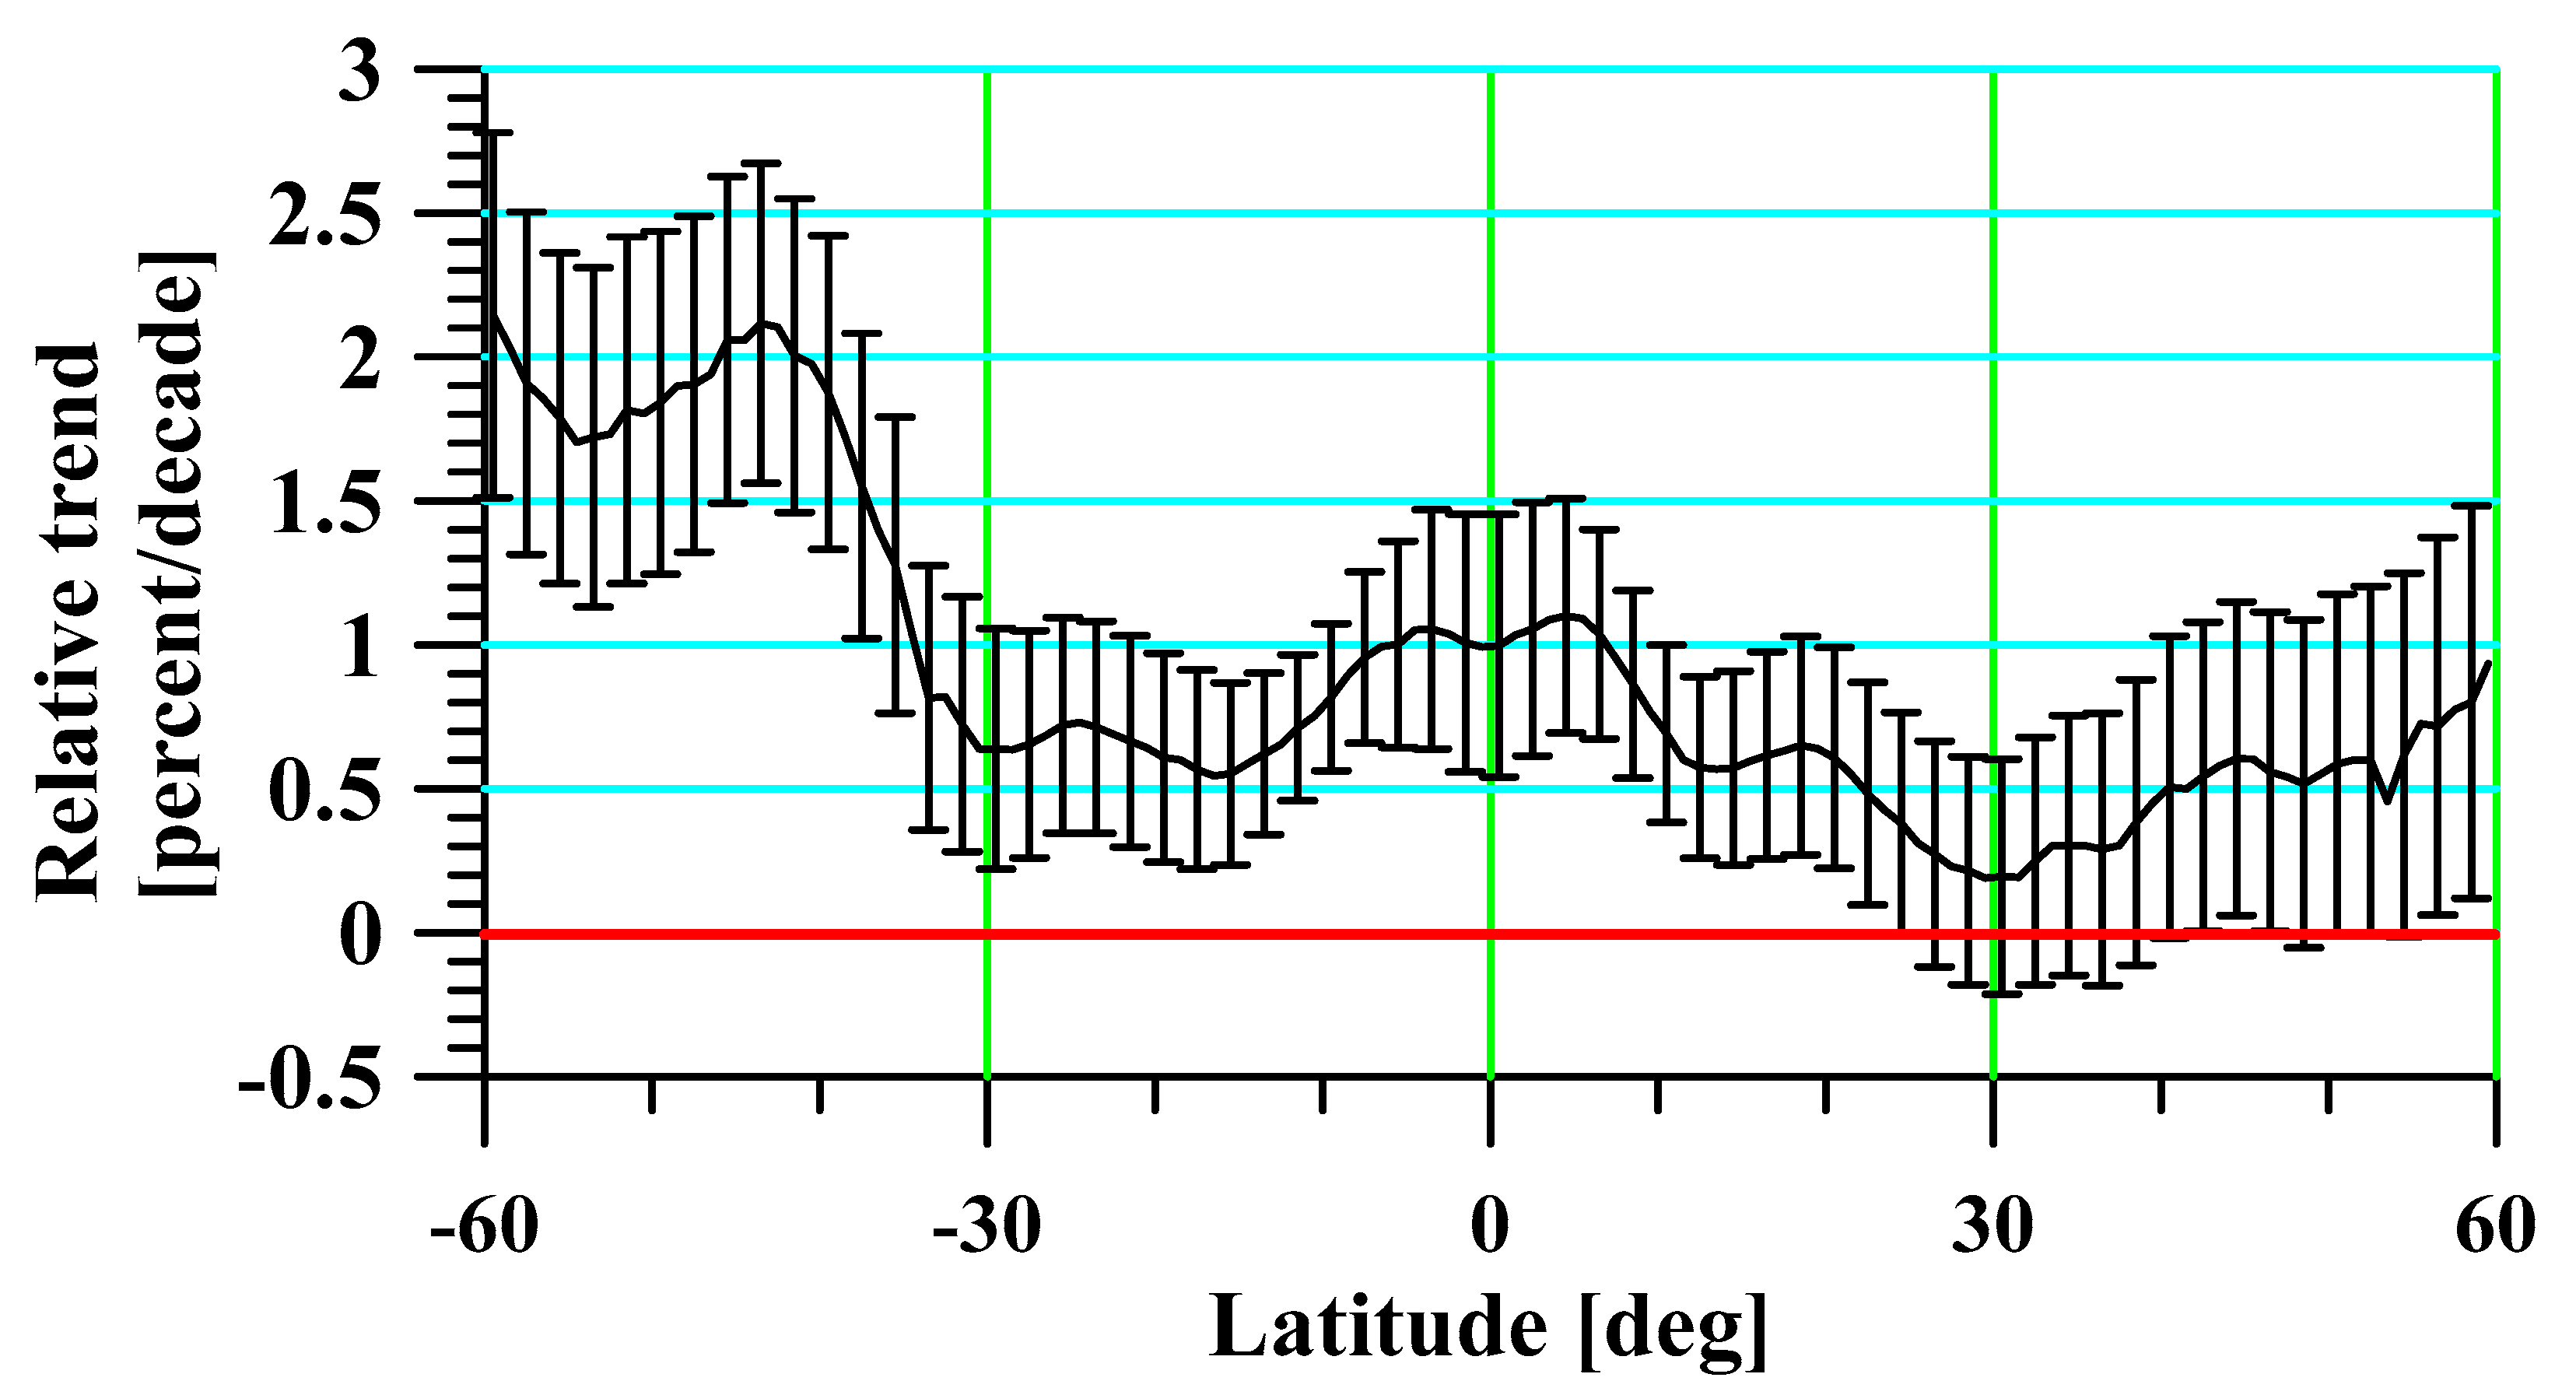
Figure 6 illustrates the latitude dependence of the linear trends of the relative TOC values, analogous to Figure 4. Compared to Figure 3 and Figure 4, the relative TOC has a positive trend at all latitudes, with maximum values of around 2% per decade in the area between 60° S and 40° S. In the area between 30° S and 30° N, the trend is between 0.5° and 1° per decade. The lowest value is indicated at 30° N of about 0.2% per decade. The range of probable values of the relative trend shown in the figure with a 50% probability with small exceptions around 30° N is in the range of positive values. Eliminating the seasonal cycle in determining the relative TOC values significantly reduces the dispersion of data around the regression line and, therefore, reduces the standard error of the trend. The values of the relative trend can be compared with those obtained by Weber et al., 2018, for the period 1979–2016. The obtained values for the latitude range from 60° S to 35° S are about 0.7% per decade and about 0.5% per decade for 35° N–60° N; these are close enough to those received in the present work.
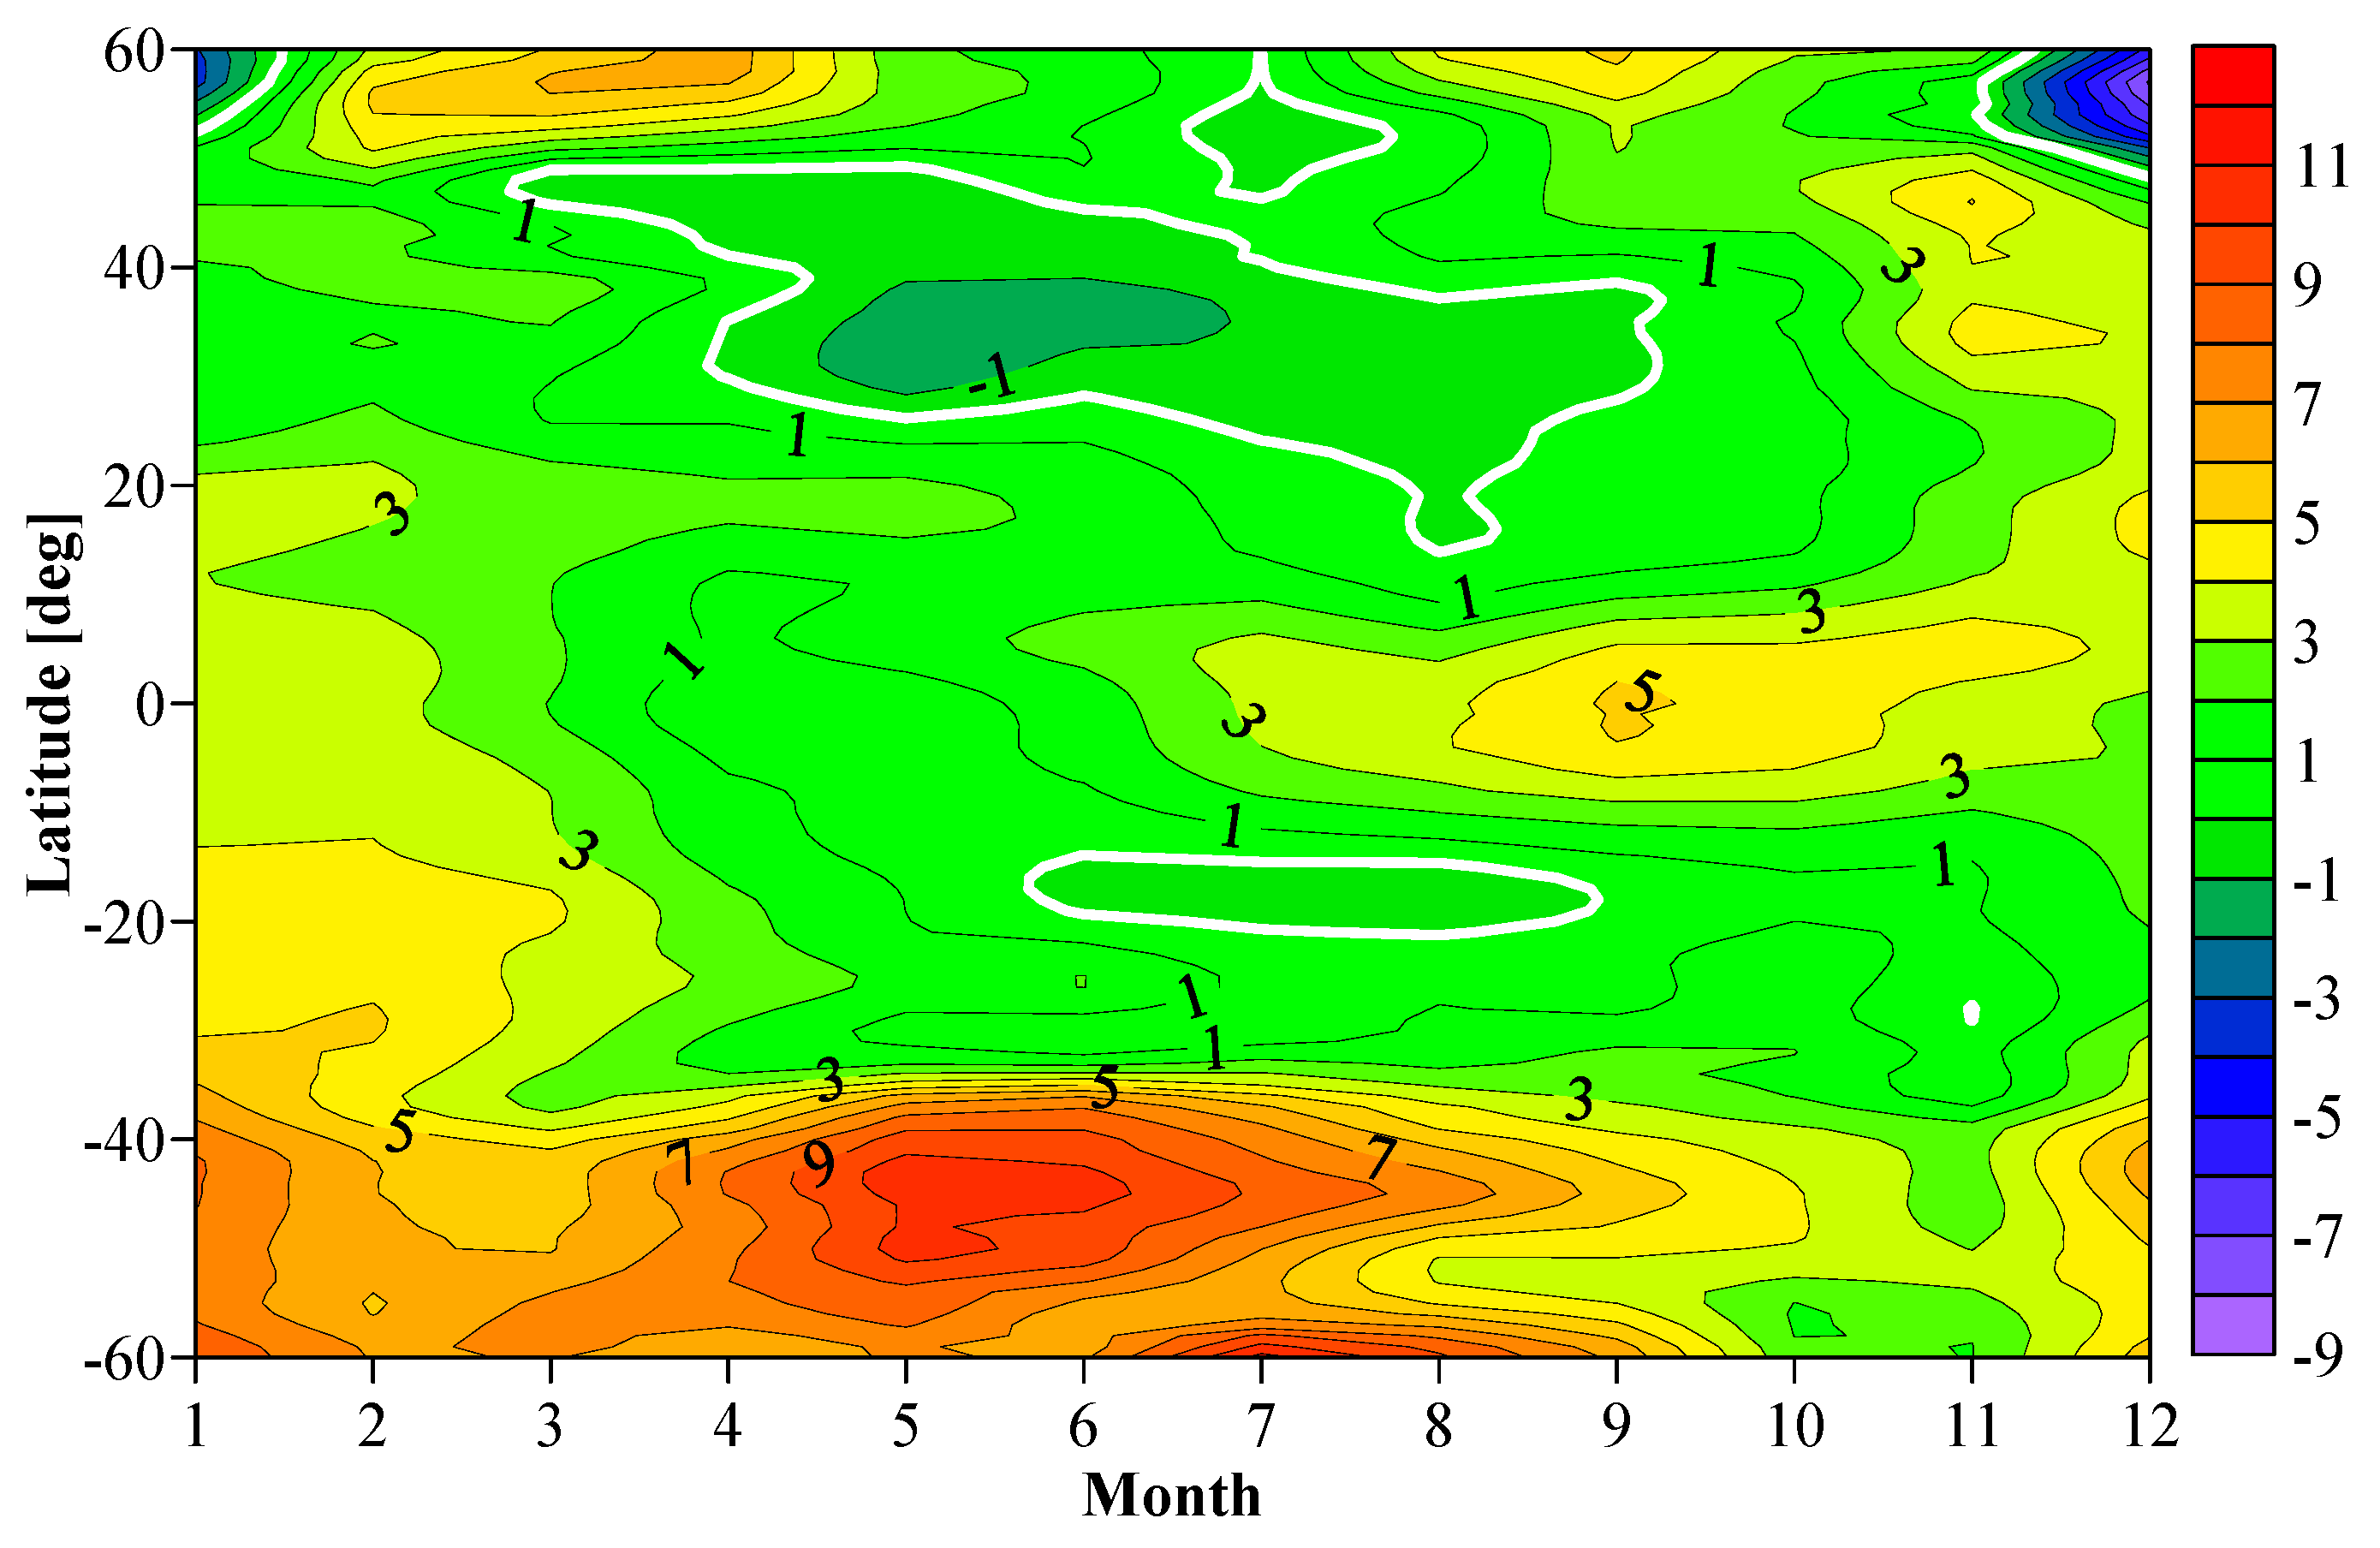
It is of interest to study the influence of the season on TOC trends. The meridional transport of O3 from tropical latitudes to mid-latitudes and high latitudes under the action of Brewer–Dobson circulation [3] is strongest during the winter period, and different values of trends can be expected depending on the season. For this purpose, the TOC trends for each calendar month in the studied time period were calculated. The results are shown in Figure 7. It turns out that in the northern hemisphere, the trends show an increase in the months of November–March. In the southern hemisphere, an increase is observed in the months of April–July. These months coincide with the winter periods in the respective hemispheres.
3.1.1. Trends in Seasonal Components of TOC
In the present work, an attempt is made to determine whether there are long-term trends in the characteristics of the seasonal cycle of TOC. The results of the climatology of the seasonal cycle of TOC for the period 2005–2020 (see Figure 1) show that at all latitudes, the seasonal cycle has a distinct periodicity with a period of one year. For this reason, the seasonal cycle of the zonal mean TOC was decomposed for each latitude and year by the following formula:
The quantity TOC0 introduces the average annual value of TOC. The quantity TOC1 represents the amplitude of the seasonal cycle. The quantity Phase presents the month of the year in which the TOC has a maximum value. The three characteristics of the seasonal cycle for each latitude and year are determined unambiguously by the condition for the best approximation to the data by the method of least squares. The next few figures, namely Figure 8, Figure 9 and Figure 10, show the course of these three quantities in years and in latitude.
The results show that the average annual value of O3 in latitudes has a maximum of about 60° N for the northern hemisphere and about 50° S for the southern hemisphere. A similar result is obtained for the hemispheric asymmetry visible in Figure 1 and Figure 2. In the southern hemisphere, the maximum observed influence of quasi-biennial oscillation is based on the equatorial zonal stratospheric wind QBO, while in the northern hemisphere. there is a periodicity of about 4 years, probably also associated with QBO [3]. At the same latitudes where the average annual TOC value is maximized, the amplitude of the seasonal cycle is maximized, and in the southern hemisphere, the influence of QBO is very clear.
The latitude distribution of the seasonal phase shows that at high northern latitudes, the maximum TOC occurs in the middle of northern winter (January and February). At high southern latitudes, the maximum of TOC is observed in May and June, also in the middle of the southern winter. Towards low latitudes in both hemispheres, the phase increases, which can be explained by the way in which O3 is transported by Brewer–Dobson circulation. Once transported meridionally at altitudes of about 30 km to latitudes of about 50–60°, the O3 is transported to lower altitudes, causing an increase in TOC at these latitudes. The process is associated with delays, which increase at lower latitudes.
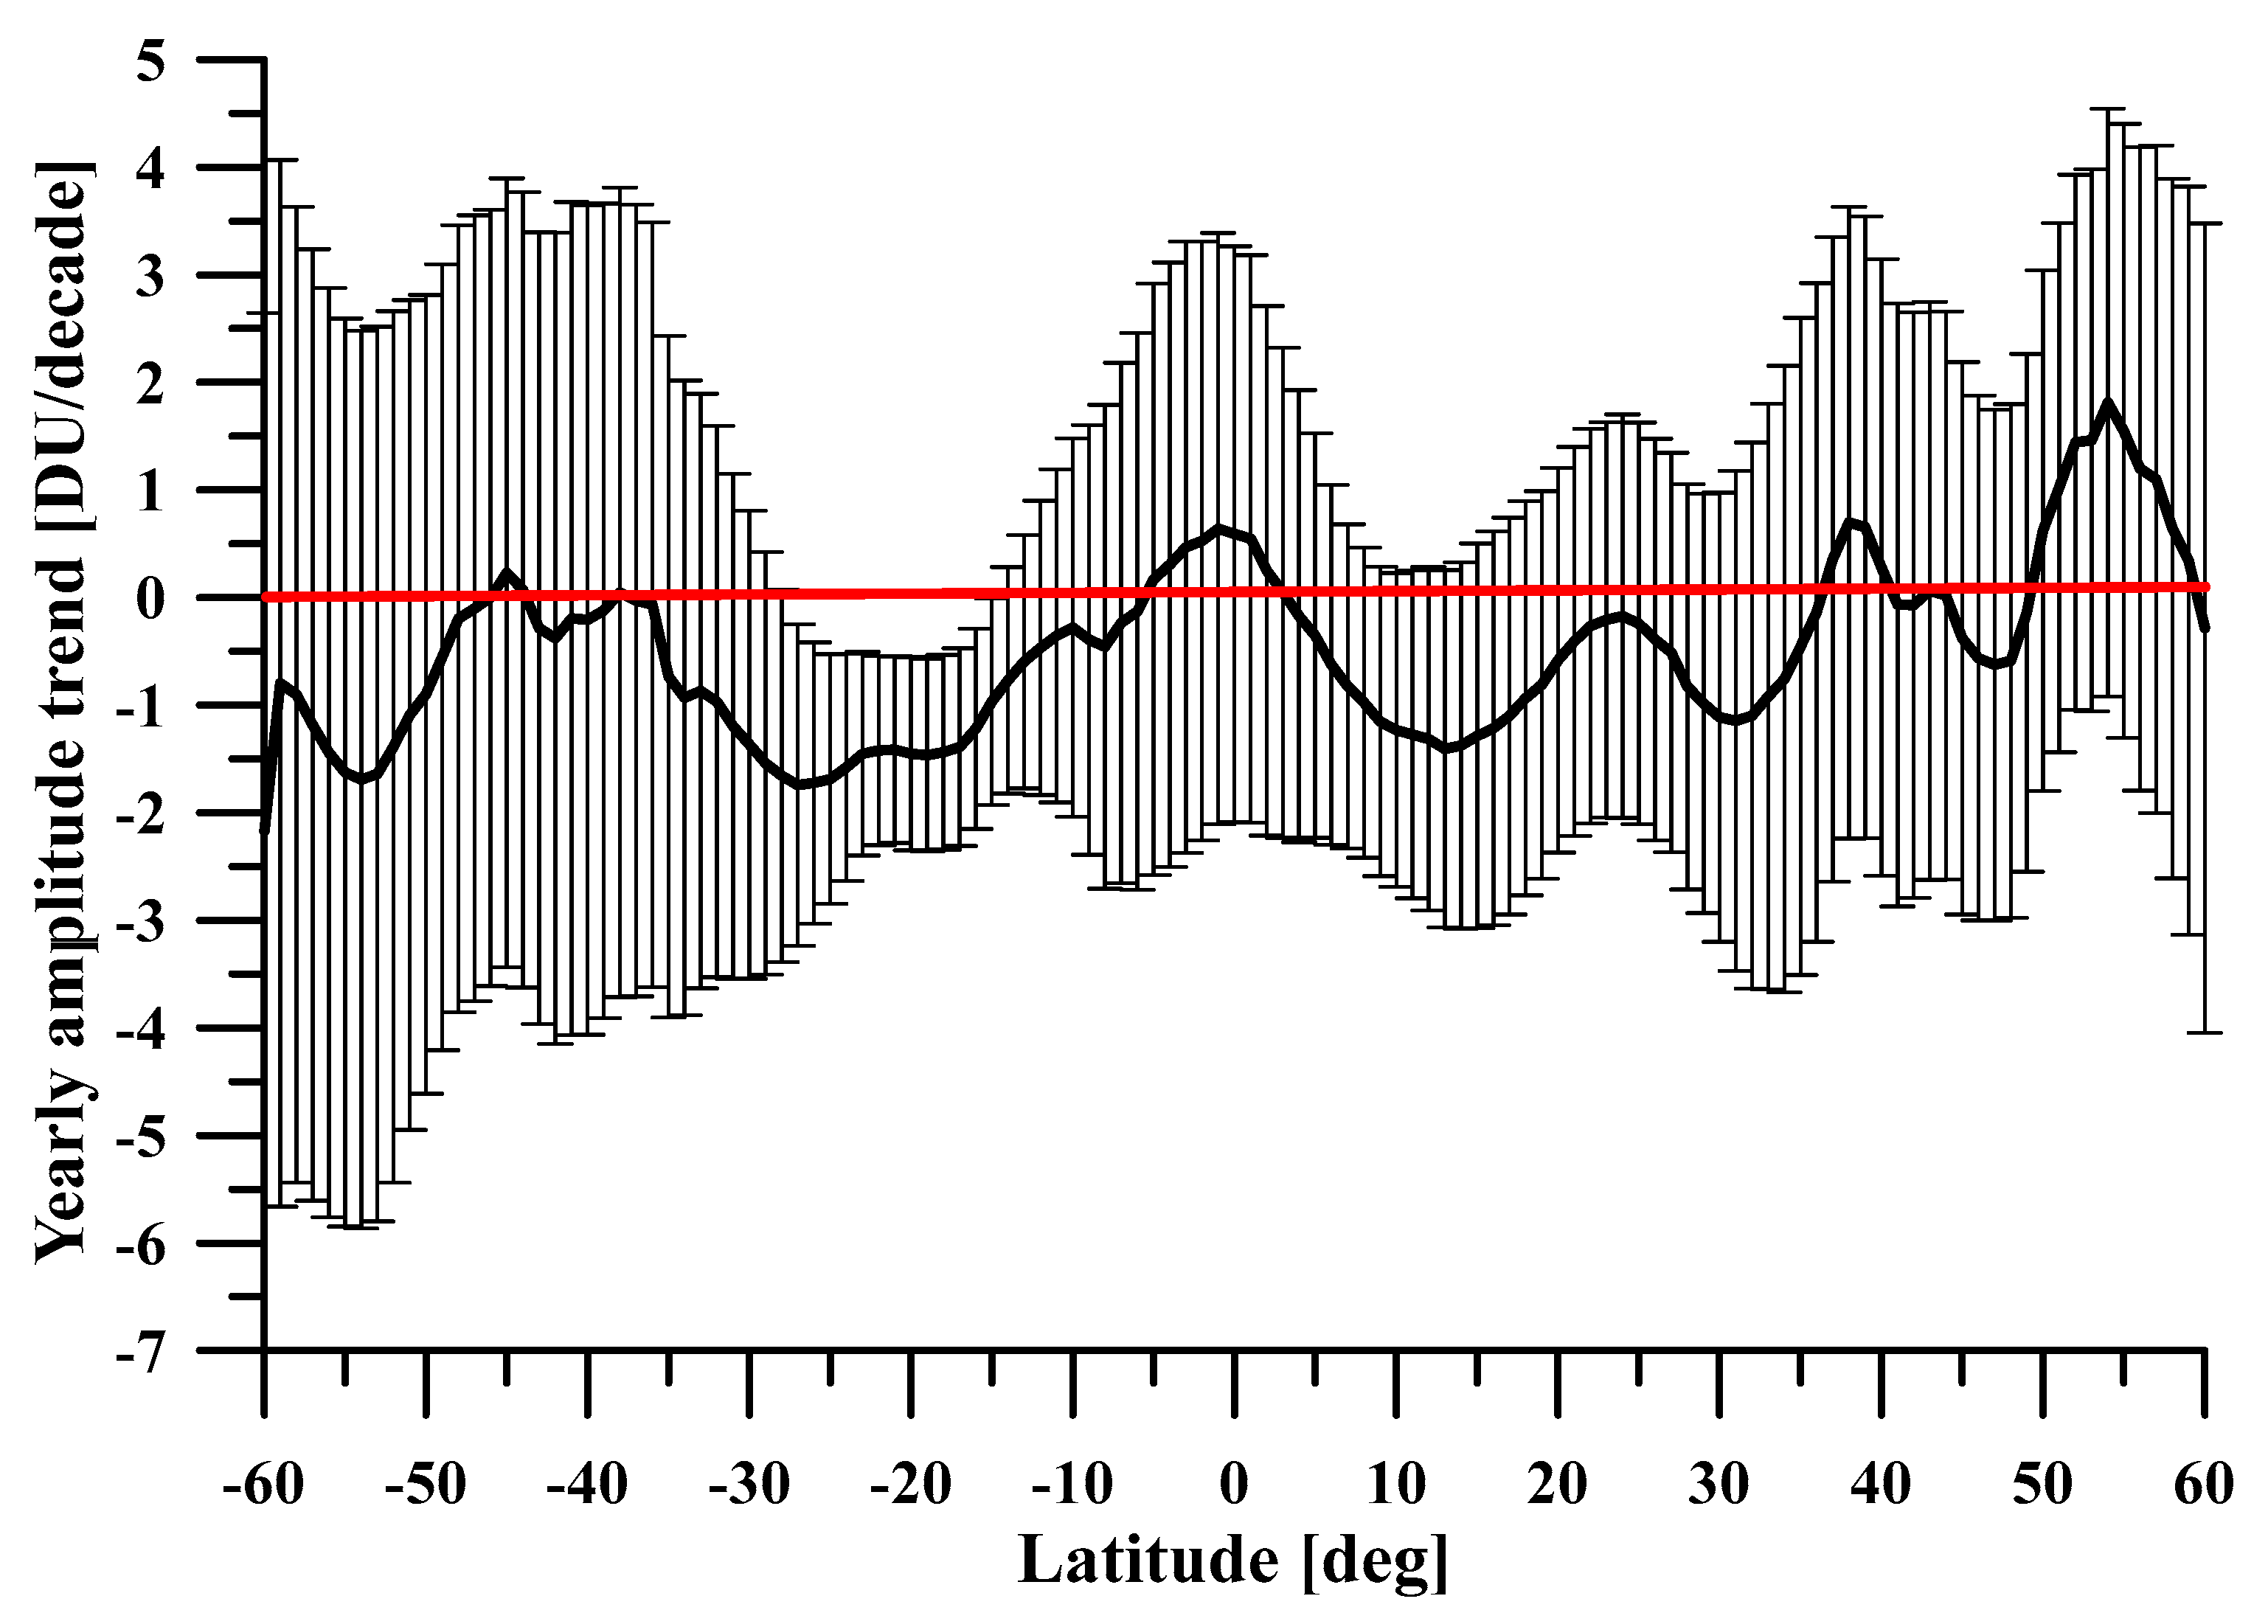
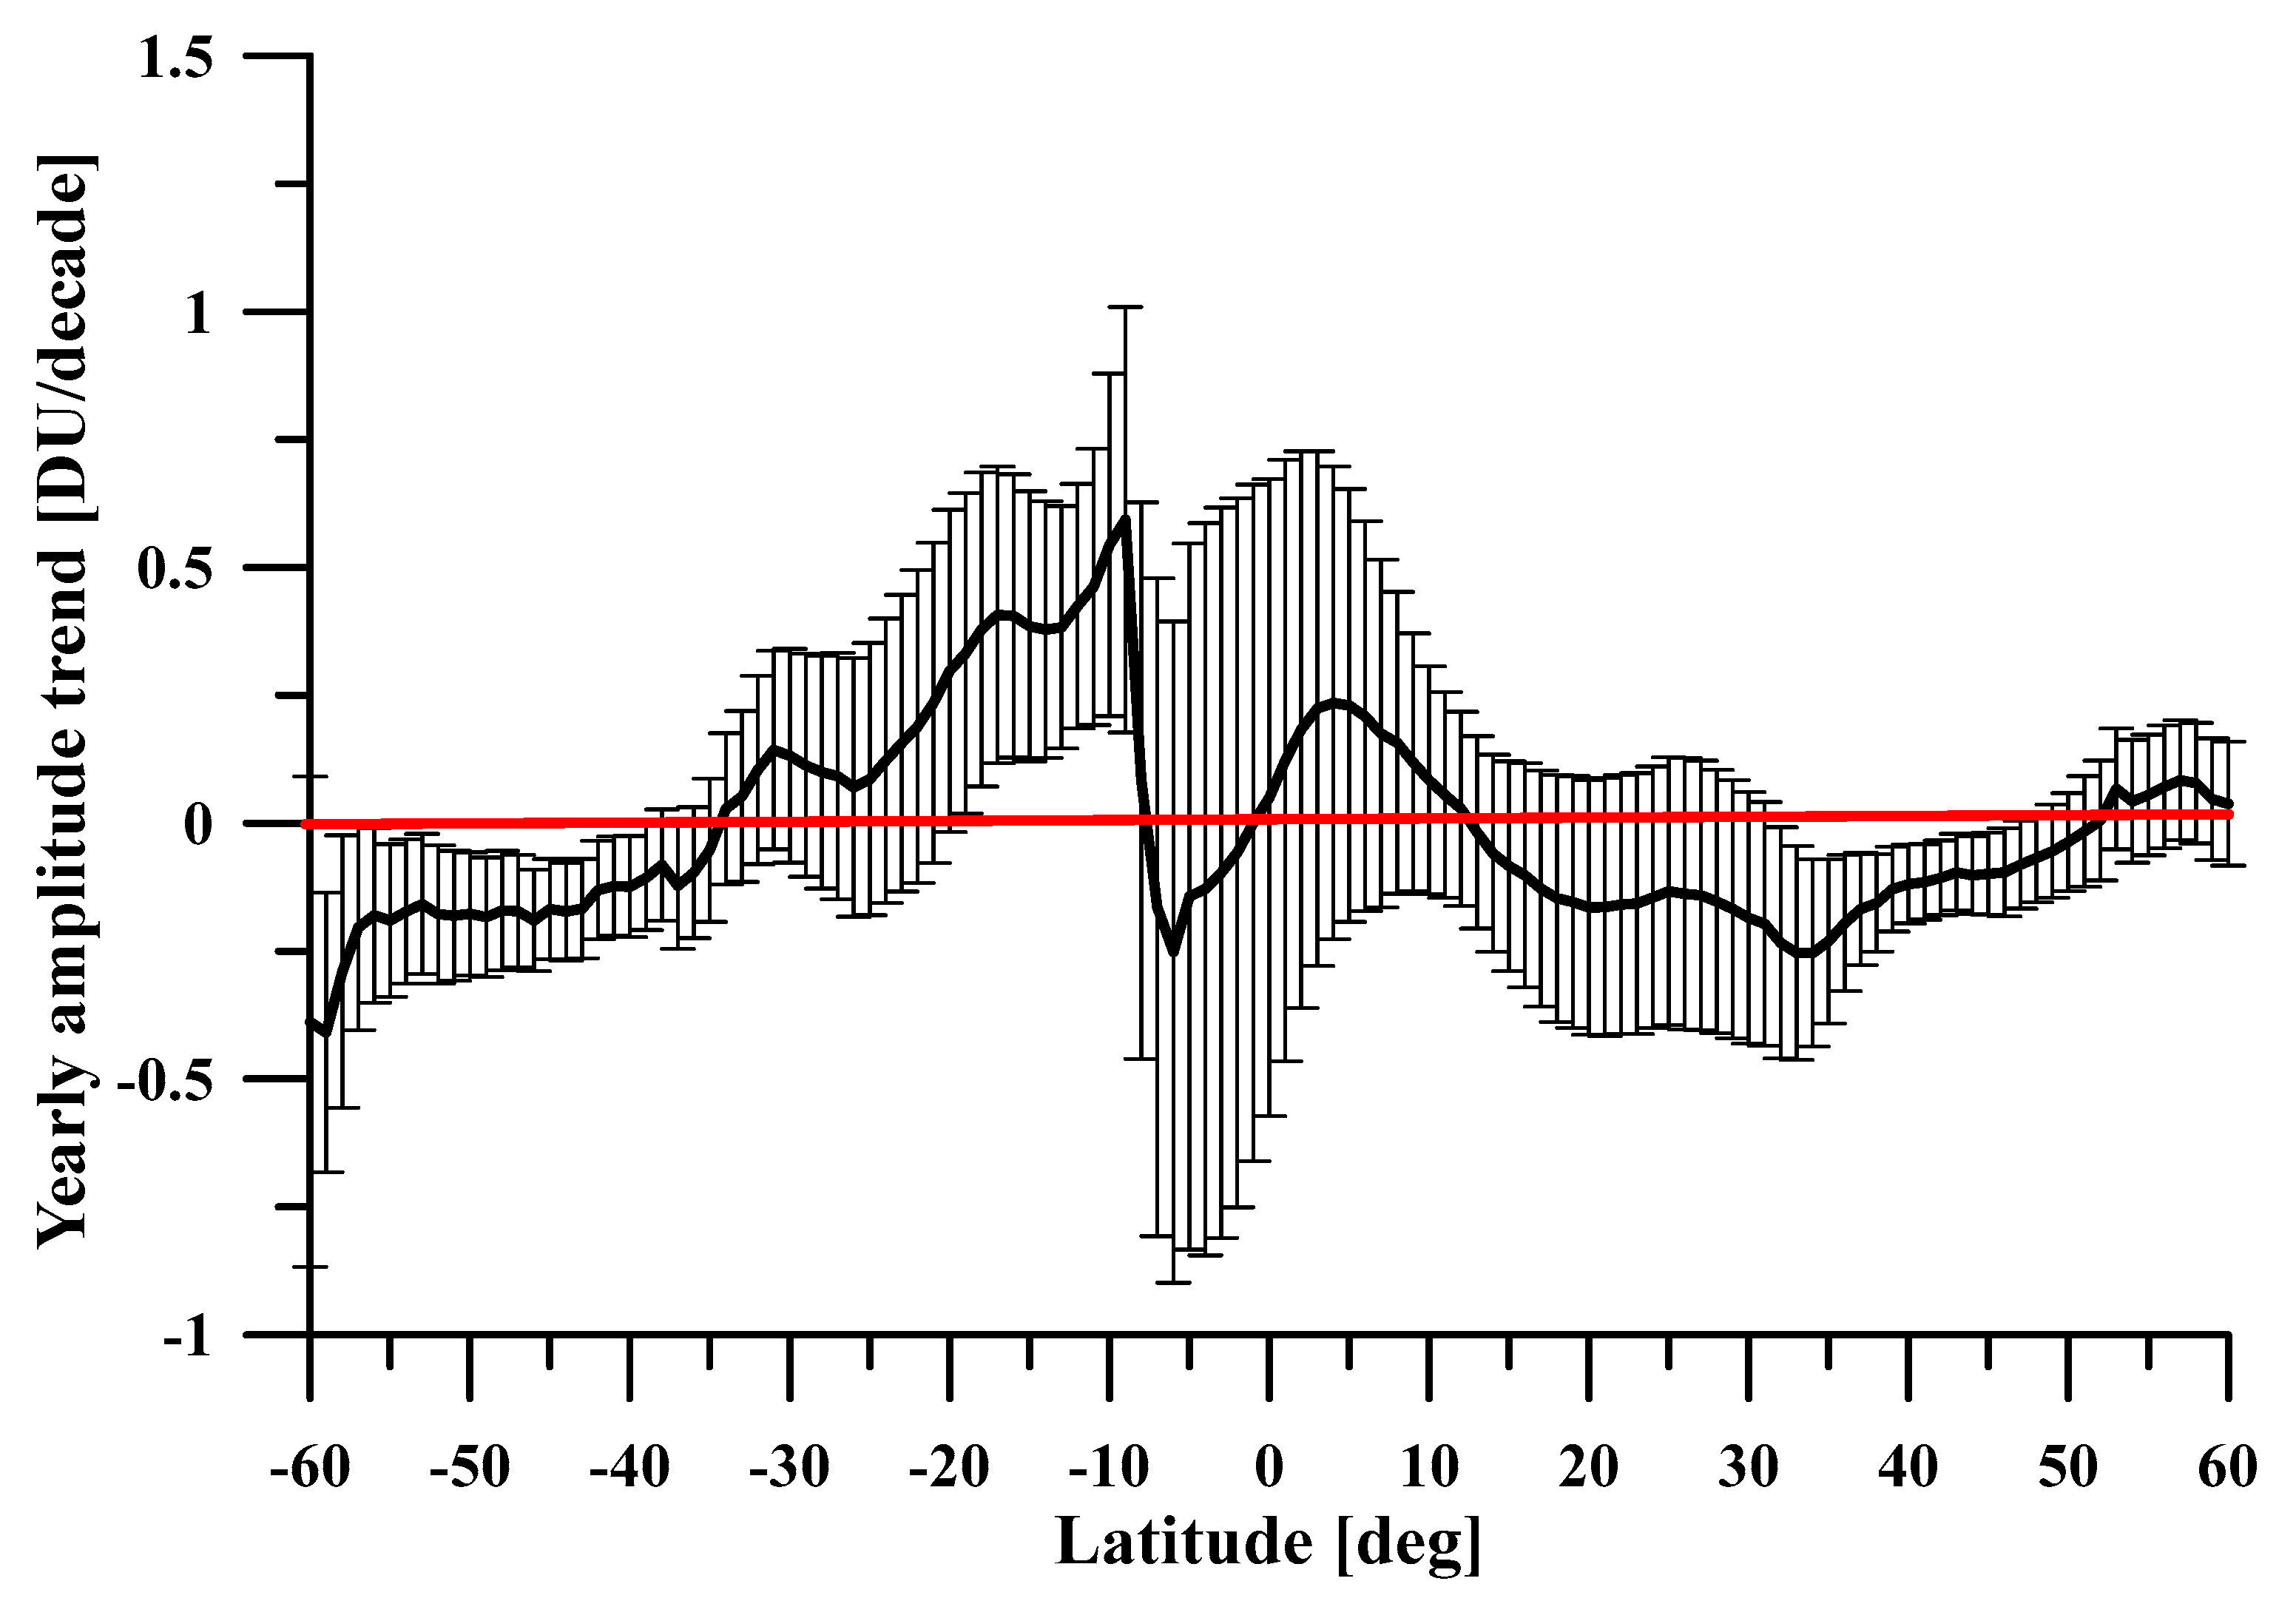
Figure 11, Figure 12 and Figure 13 show the latitude distribution of trends in the three quantities, which characterize the seasonal cycle of TOC. The trends of the average annual values (see Figure 11) match with those obtained on the basis of the monthly values (see Figure 4). However, the latitude dependence of the trends on the annual averages (Figure 11) is more similar to that shown in Figure 6; latitude dependence of the trend of relative TOC, which is explained by the elimination of seasonal variations in both cases. In particular, trends in high mid-latitudes are positive. Figure 12 does not show a significant trend in the amplitudes of the seasonal cycle. The trends in the phases are also insignificant, with only the southern hemisphere having any latitude dependence observed, which is difficult to explain on the basis of the available data. The obvious effect of QBO on TOC, which can be seen in Figure 8, Figure 9 and Figure 10; the influence of which has been the subject of a significant number of studies [20,24,25].
The latitude dependence of the seasonal phase shown in Figure 13 illustrates the change in the months in which the TOC acquires its maximum and minimum. In particular, in the interval between 10° N and 50° N, the trend of the phase is negative, which means that the seasonal maximum moves to earlier months. The sharp change in the trend in the phase around 10° S coincides with the sharp change in the phase itself (see Figure 10).
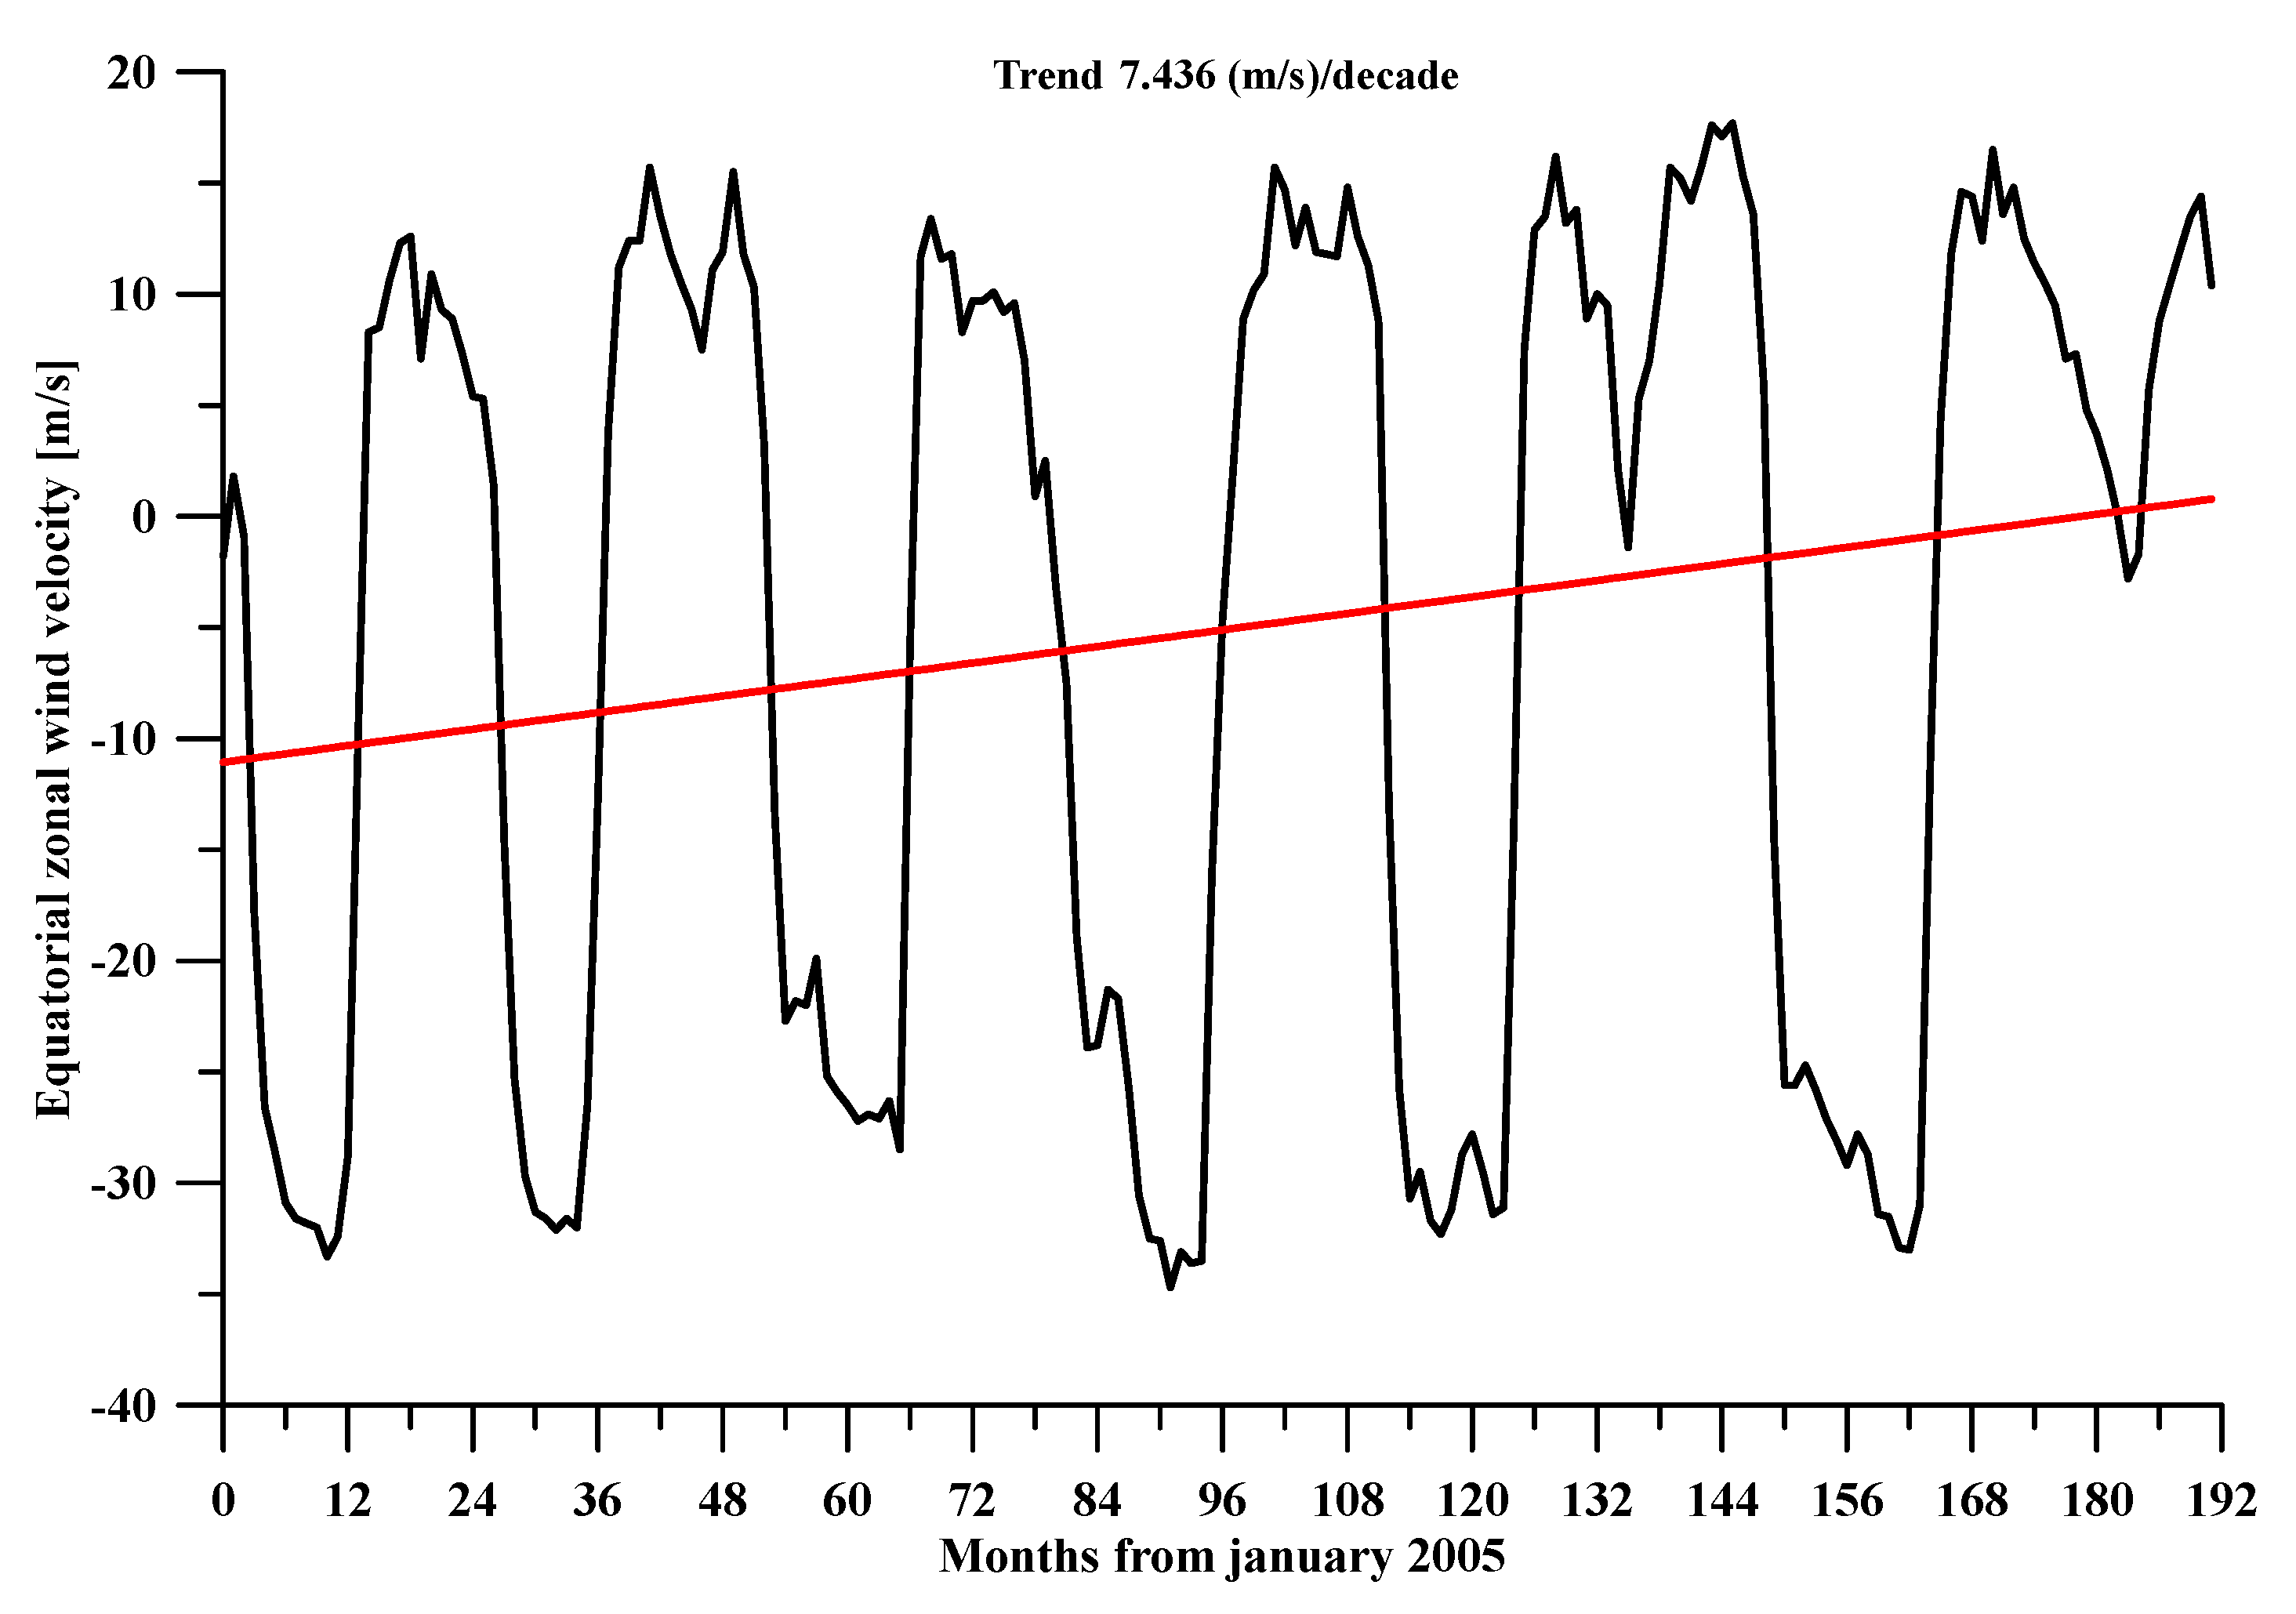
Figure 14 shows the course of average monthly values of the equatorial zonal wind at an altitude of 30 hPa (about 24 km). A positive trend of 7.44 (m/s)/decade was observed for the studied time period.
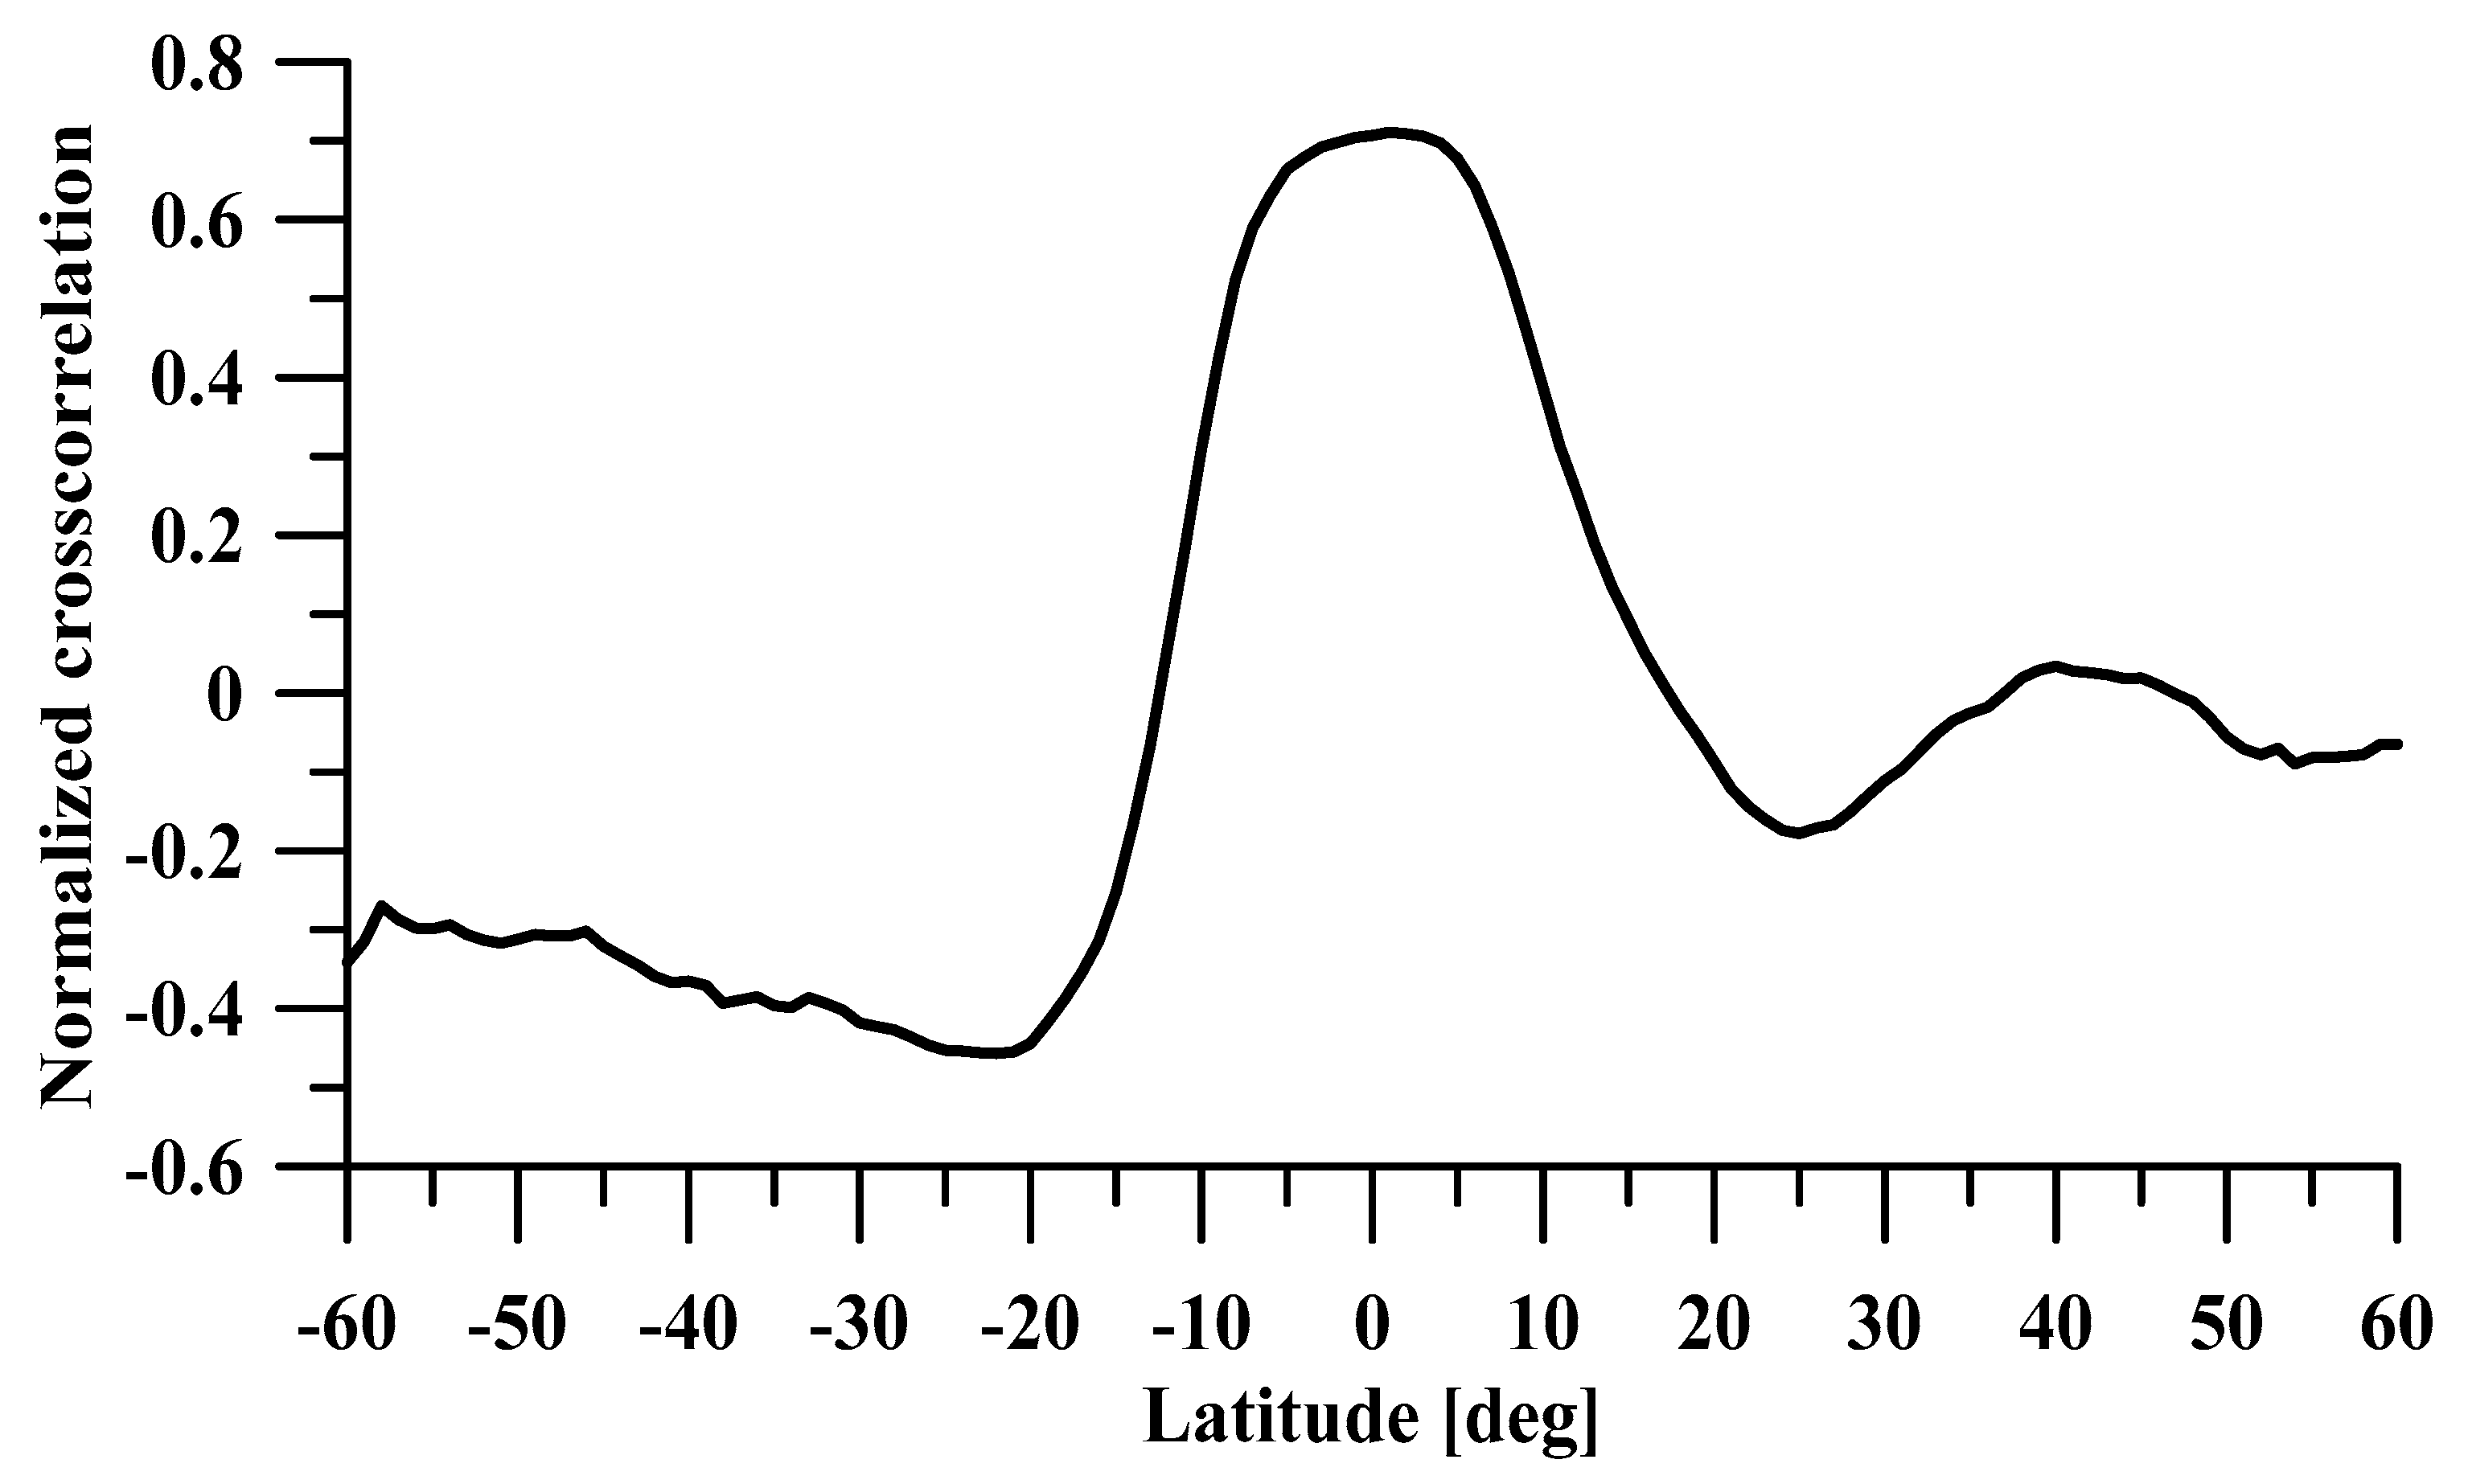
The latitude distribution of the correlation coefficient (zero time-lag) between the equatorial wind speeds and the relative TOC is shown in Figure 15. The dependence is very close to that received for the period 1989–1997 [25]. The latitude distribution of the correlation shows that it is positive in the tropics. In the southern hemisphere, the correlation is negative south of 10° S, and in the southern mid-latitudes, it reaches −0.4 (see Figure 15). In the northern hemisphere, in mid-latitudes, it varies in small limits around zero. It can be hypothesized that the positive trend in the equatorial zonal wind speed is the reason for the positive trend in the equatorial TOC due to the strong positive correlation between the two quantities. Another assumption that can be made is that the asymmetry between the correlations in the mid-latitudes in the two hemispheres is related to the resulting asymmetry between the TOC trends. Contrary to this assumption is the discrepancy between the signs of correlation and trends.
3.1.2. Trends in Mass of O3
In the present work, the course of the mass of O3 in the atmosphere has been calculated as an additional study of the trends in the recovery of the Earth’s Ozone layer. The results of a study of O3 variations over Europe at around 50° N between 1964 and 2004 show the presence of O3 recovery, and the proposed explanation is that this is due to overlapping ‘natural’ processes. All this gives grounds to study the trend in O3 based on its mass [26]. The calculation of the O3 mass was performed on the basis of TOC data. The altitude of the Ozone layer (1 DU = 0.01 mm) adjusted to normal pressure and temperature is assumed to be evenly distributed for each cell in the data network (1 × 1 deg).
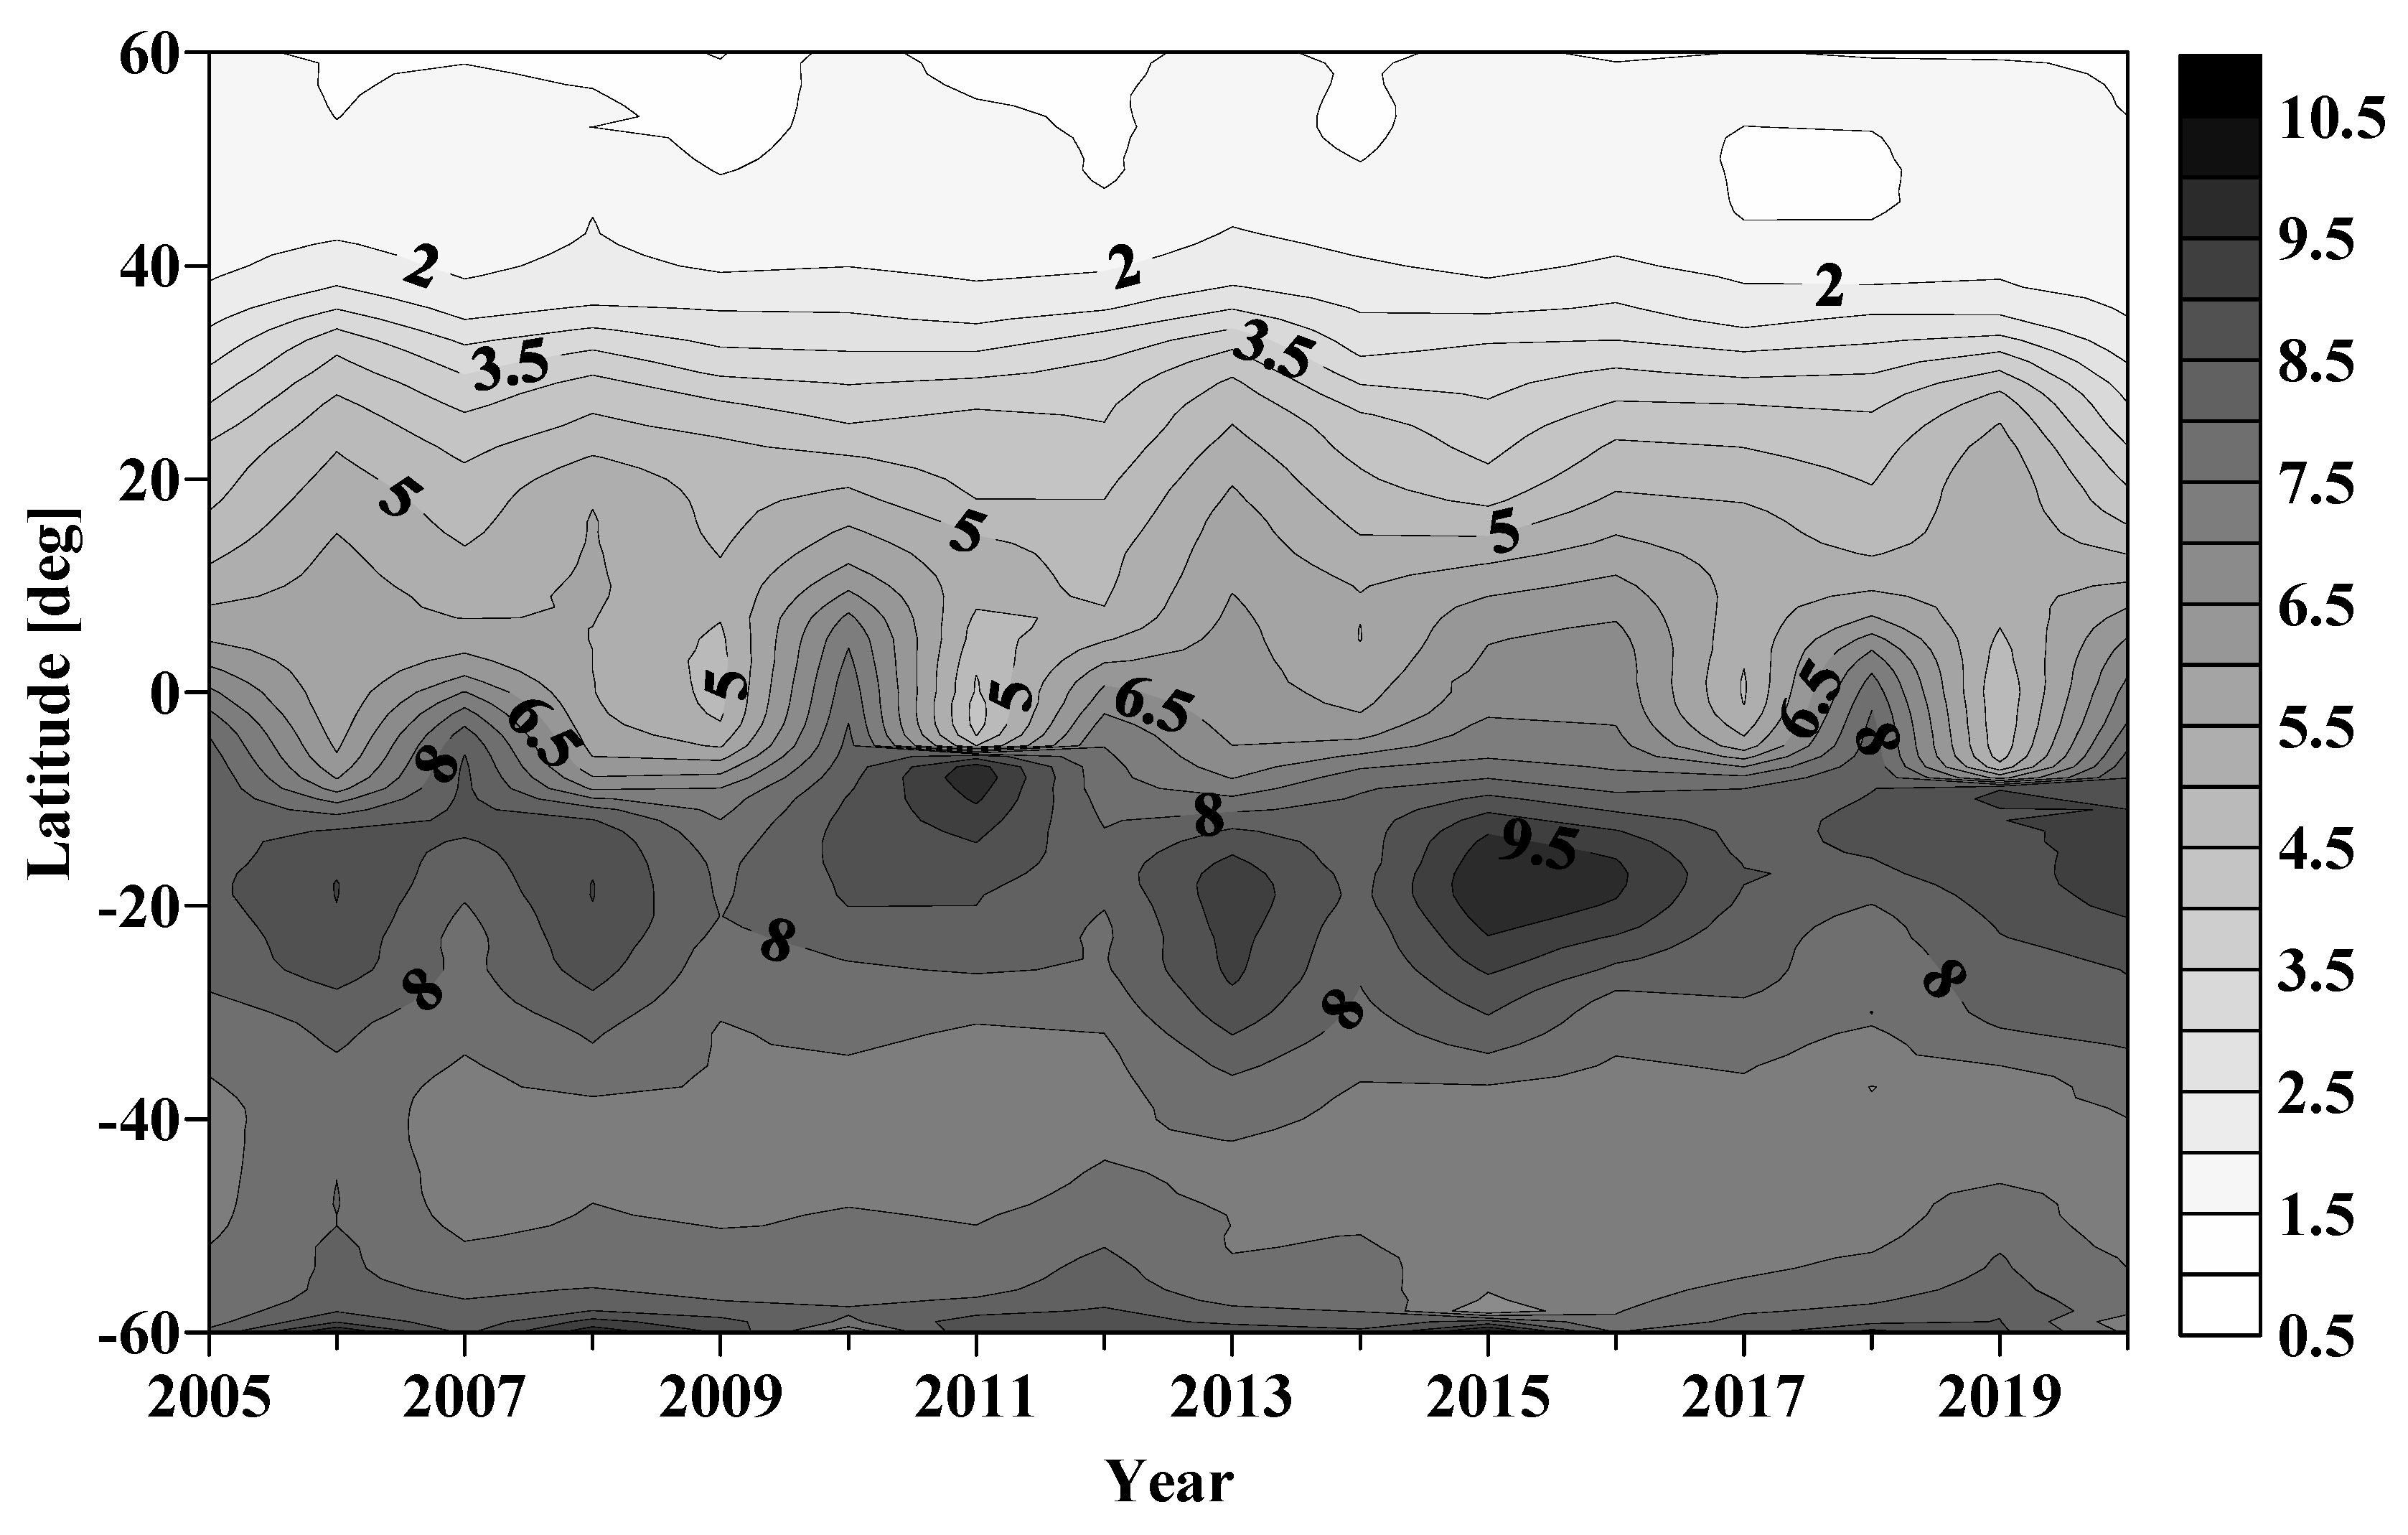
Taking into account the different length of the section of 1° longitude of the different latitudes, the area of each cell in the network and the volume of O3 adjusted to normal conditions were determined. Based on the results, the mass of O3 in MT was calculated for each latitude zone, for the individual hemispheres between 60° and the equator, and for the latitude range 60° S–60° N. The climatological seasonal cycle of the mean zonal mass of O3 shown in Figure 16, which shows that the main part of the O3 mass is in low and mid-latitudes.
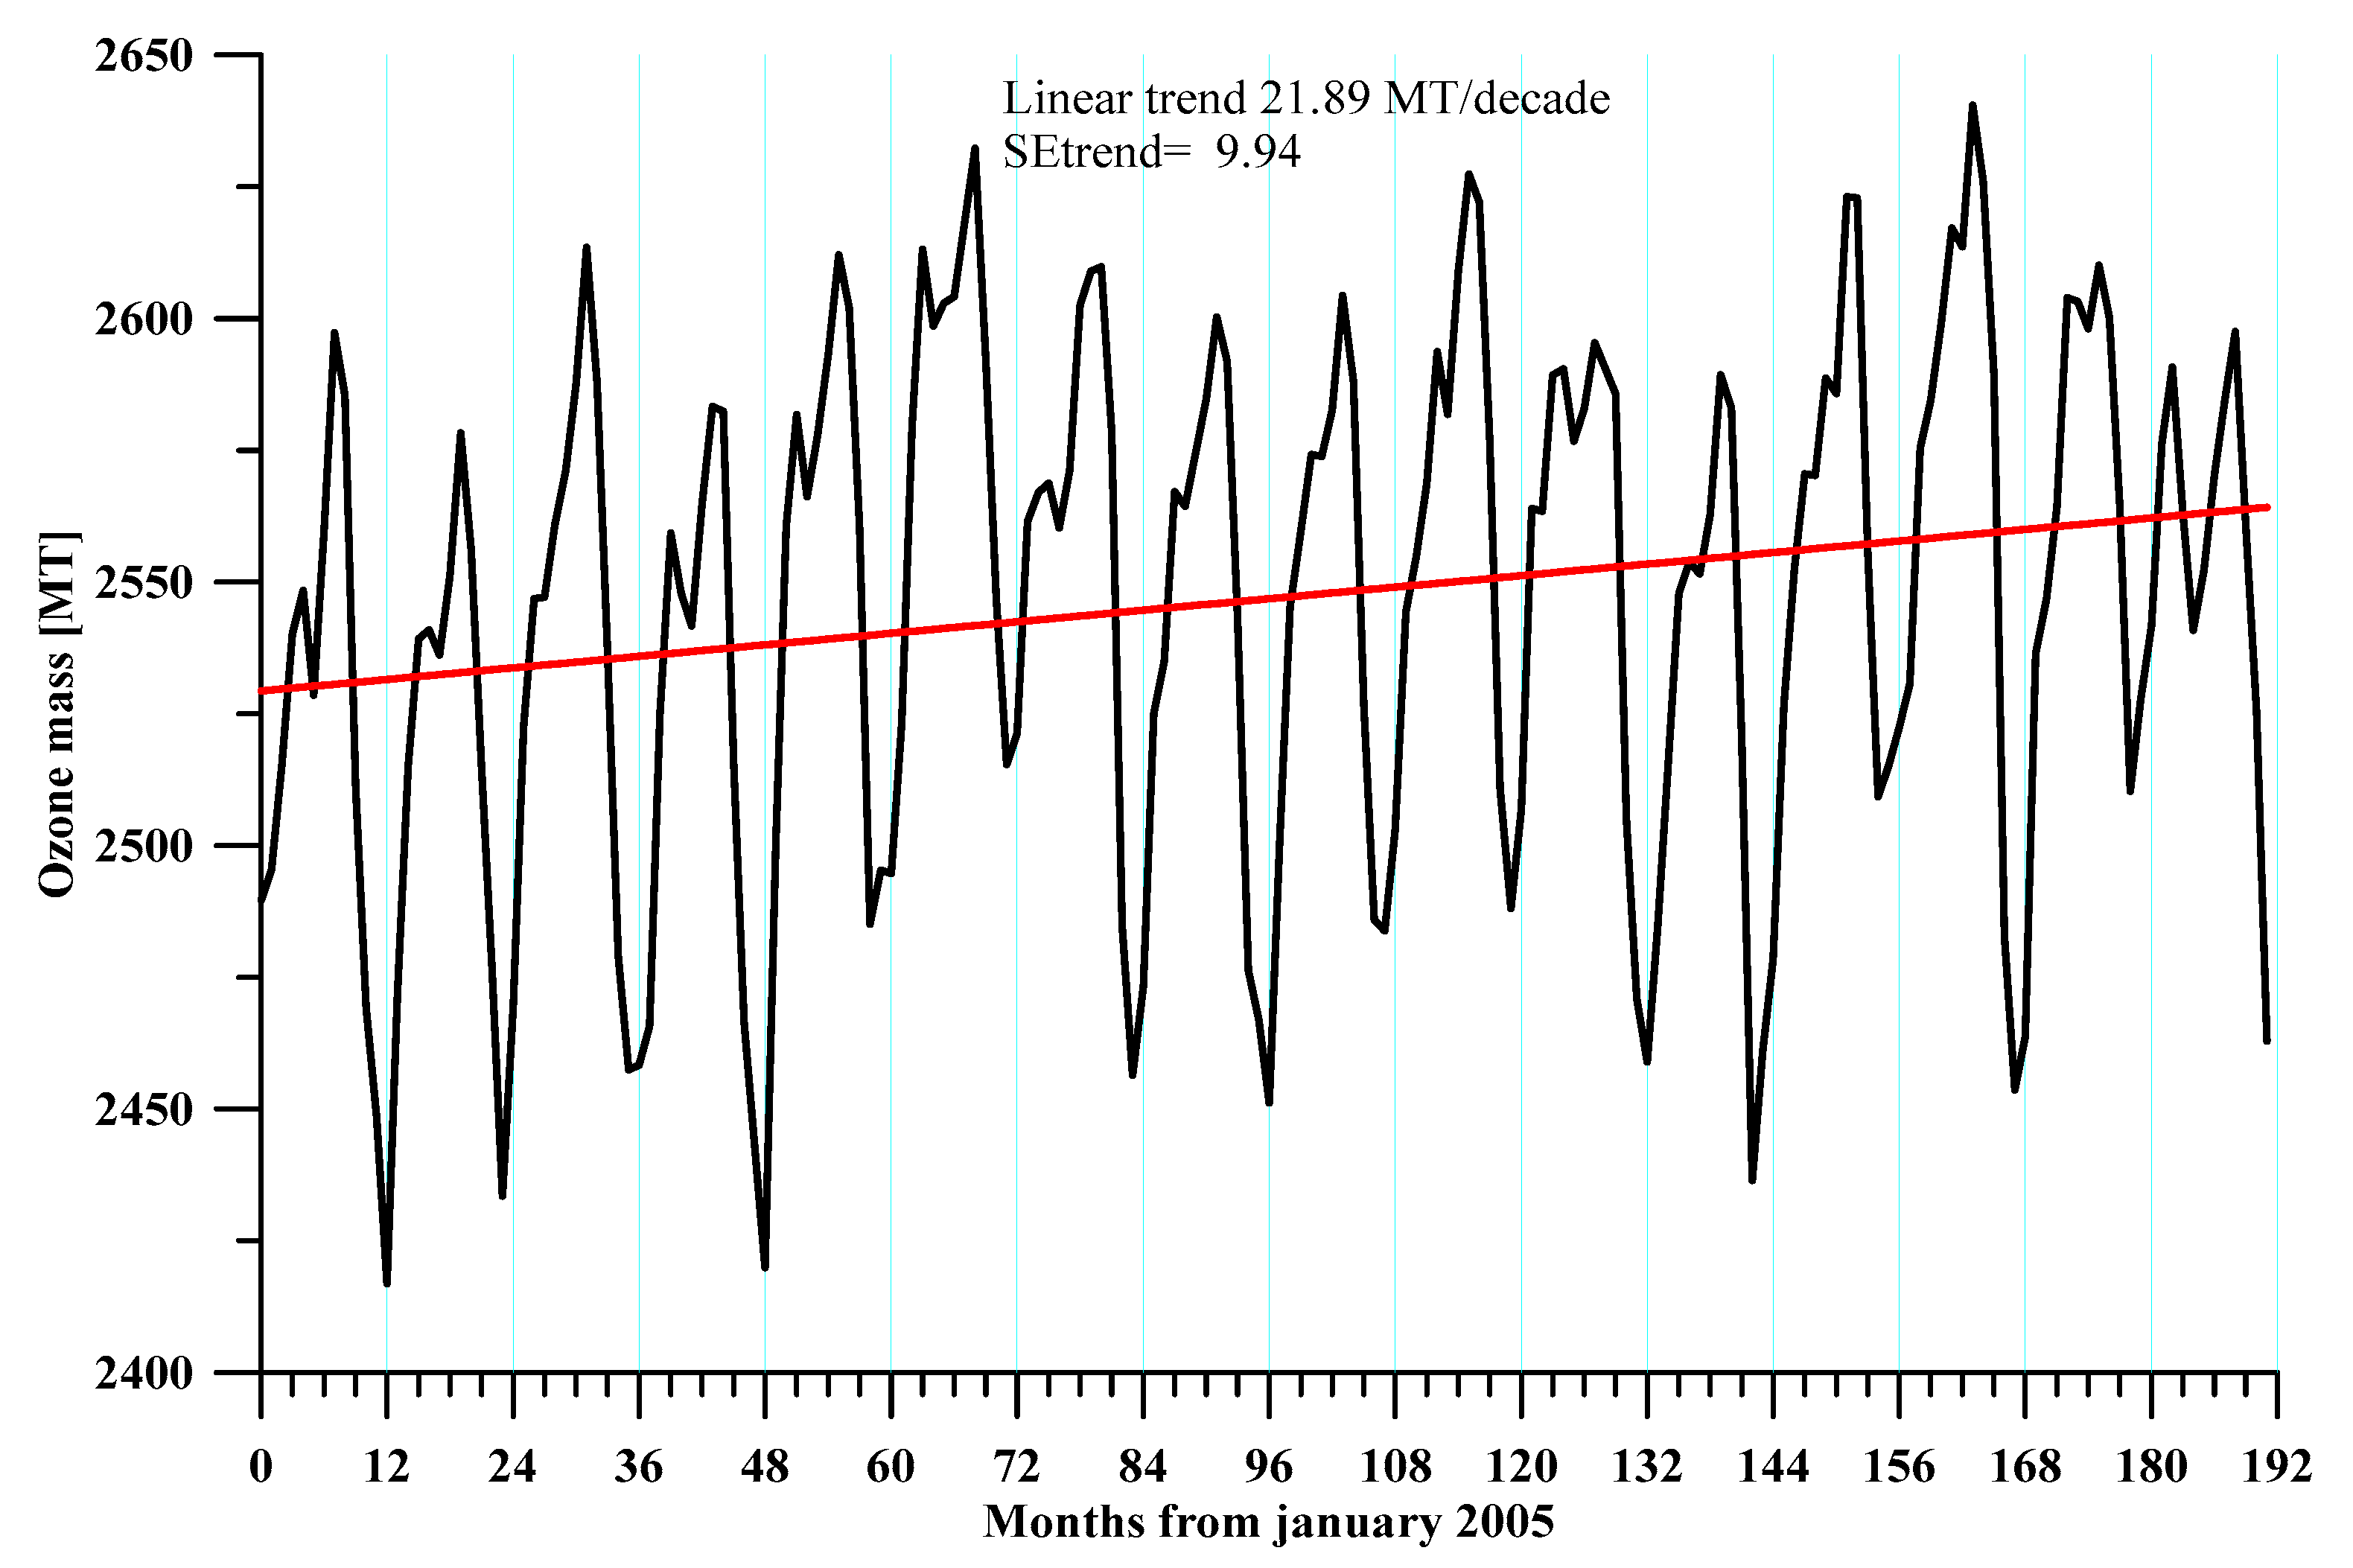
The total mass of O3 in the latitude range 60° S–60° N has a seasonal cycle with a minimum in the northern winter and a maximum in the northern summer. Seasonal variations in the total mass of O3 are not significant. For the whole study period, the mass of O3 varied between 2417 and 2640 MT, which means a variation of ±4.4% at an average of 2547 MT. The determined most probable trend in the total O3 mass—21.89 MT per decade, means that for the whole studied period (16 years), the O3 mass has increased by an average of 35 MT. This represents 1.37%. The results show that the total O3 mass in low and mid-latitudes remains constant. This conclusion confirms the received results obtained based on a TOC study.
Figure 17 shows the course and trend of O3 mass in the northern and southern hemispheres. The seasonal variation is significant but is in antiphase for the northern and southern hemispheres. The obtained result for a weak seasonal cycle of the total O3 mass for both hemispheres and the insignificant positive trend over time means that seasonal changes in O3 mass in both hemispheres, and, therefore, O3 concentrations, are due to redistribution of O3 in latitudes under the action of the dynamics of the middle atmosphere. Due to the missing data from high latitudes, no conclusions can be drawn about the processes in the polar latitudes, in particular for the area of the Antarctic Ozone hole.
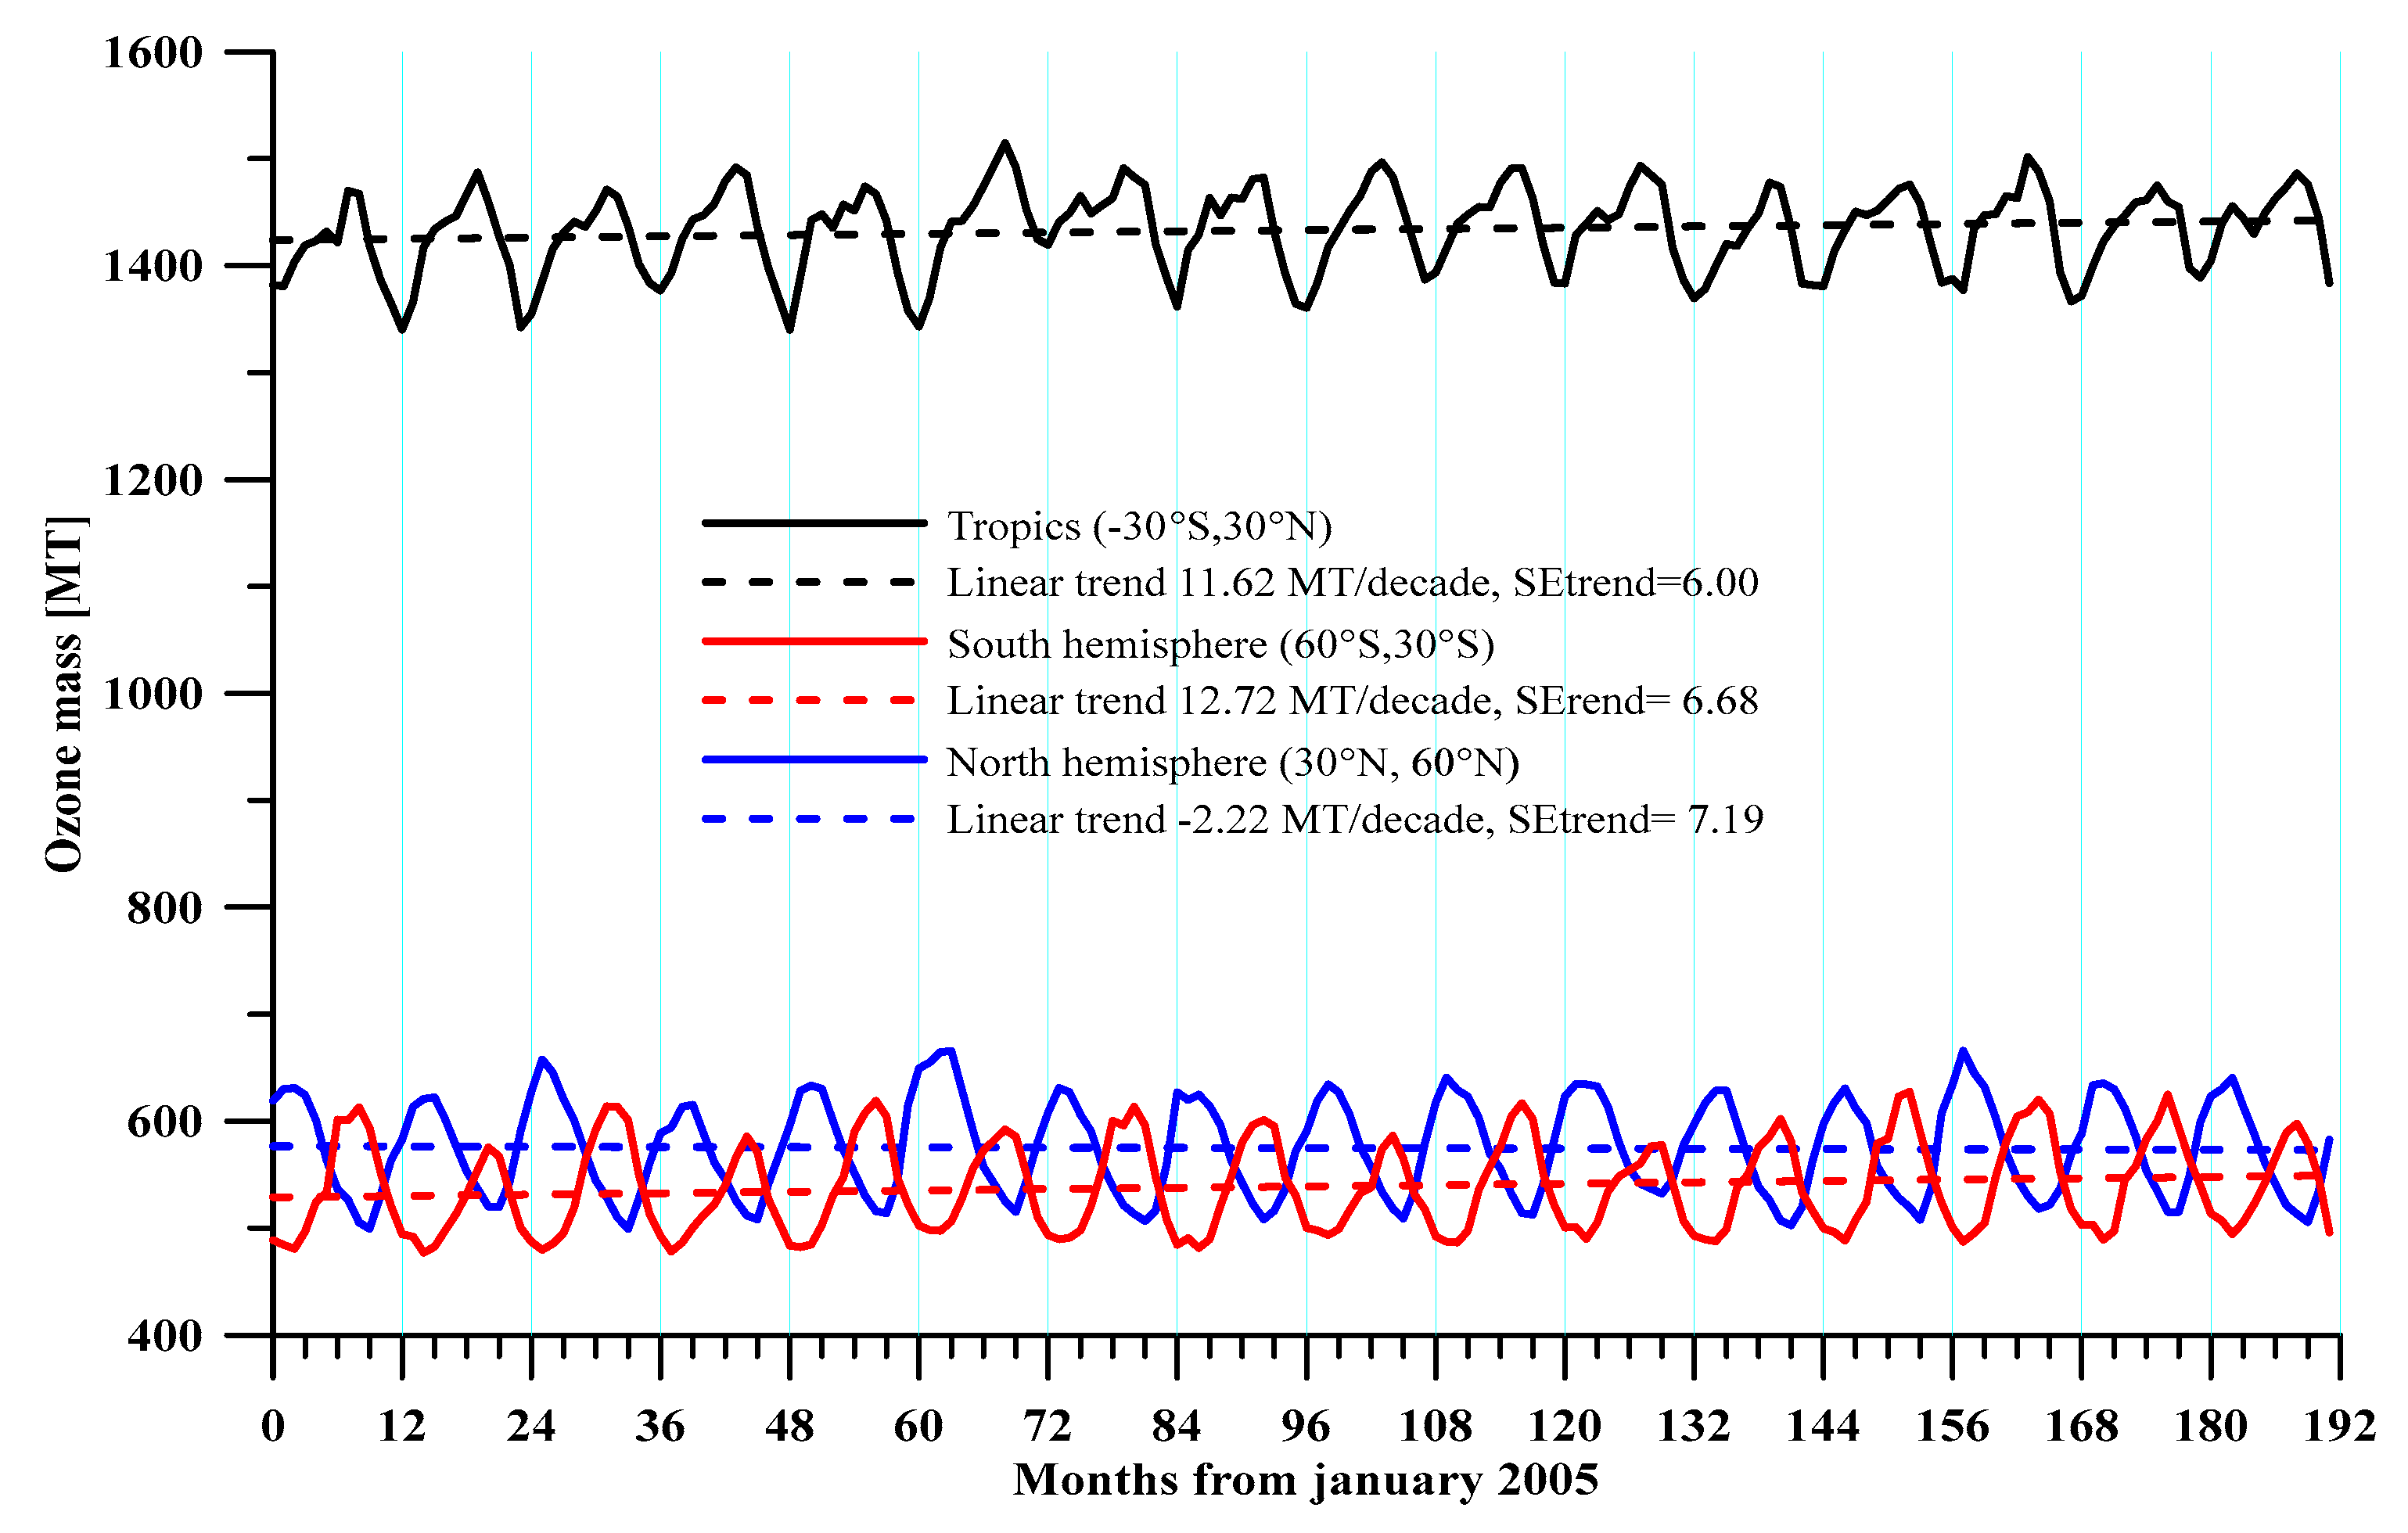
Figure 18 shows the course of the O3 mass in three latitudinal bands—southern mid-latitudes (between 60° S and 30° S), tropical region (between 30° S and 30° N), and the northern mid-latitudes (between 30° N and 60° N) and trends in these bands. In northern mid-latitudes, the trend is negligibly small. In the other bands, the trend is practically the same and is half the trend of the total O3 mass.
3.2. Investigation of TOC for the Territory of Bulgaria in the Period 1996–2020
One of the tasks of the National Institute of Geophysics, Geodesy and Geography is to study the state of the Ozone layer over Bulgaria. Due to the impossibility of obtaining a continuous series of data (measurements with ground-based devices are only possible in clear weather), O3 data with ground-based devices are supplemented by measurements from satellite equipment.
Based on data from ground-based measurements and satellite data, an analysis of the seasonal distribution of TOC in Bulgaria was performed. To obtain a long and continuous database, a regression analysis was used to determine the relationship between the values of the total O3 obtained from the measurements in Sofia and the respective satellite data of OMI and TOMS. The results of the analysis of the studied period (1997–2012) show that the state of stratospheric O3 is stable, and there are no tendencies toward its destruction. It was found that the seasonal cycle of TOC over Bulgaria is described by the average annual value and the amplitudes and phases of the 12 and 6-month components. The annual component shows clear trends in amplitude and phase, with the best coincidence being observed with variations in the average annual zonal wind values of 68 hPa [18,19,20]. The results of spectral analysis of the short-term variations in TOC over Bulgaria show that they are not of a completely random character and are quasi periodical variations [19]. Recent research of the seasonal cycle of the Total Ozone Content over Bulgaria during the period 1997–2018 shows no trends towards its destruction. On the contrary, the results show that (i) the TOC tends to increase slightly and (ii) the resulting seasonal variations are relatively constant [21].
All the results described above give reason to conduct a study to show whether there is a positive trend of TOC over Bulgaria at the moment.
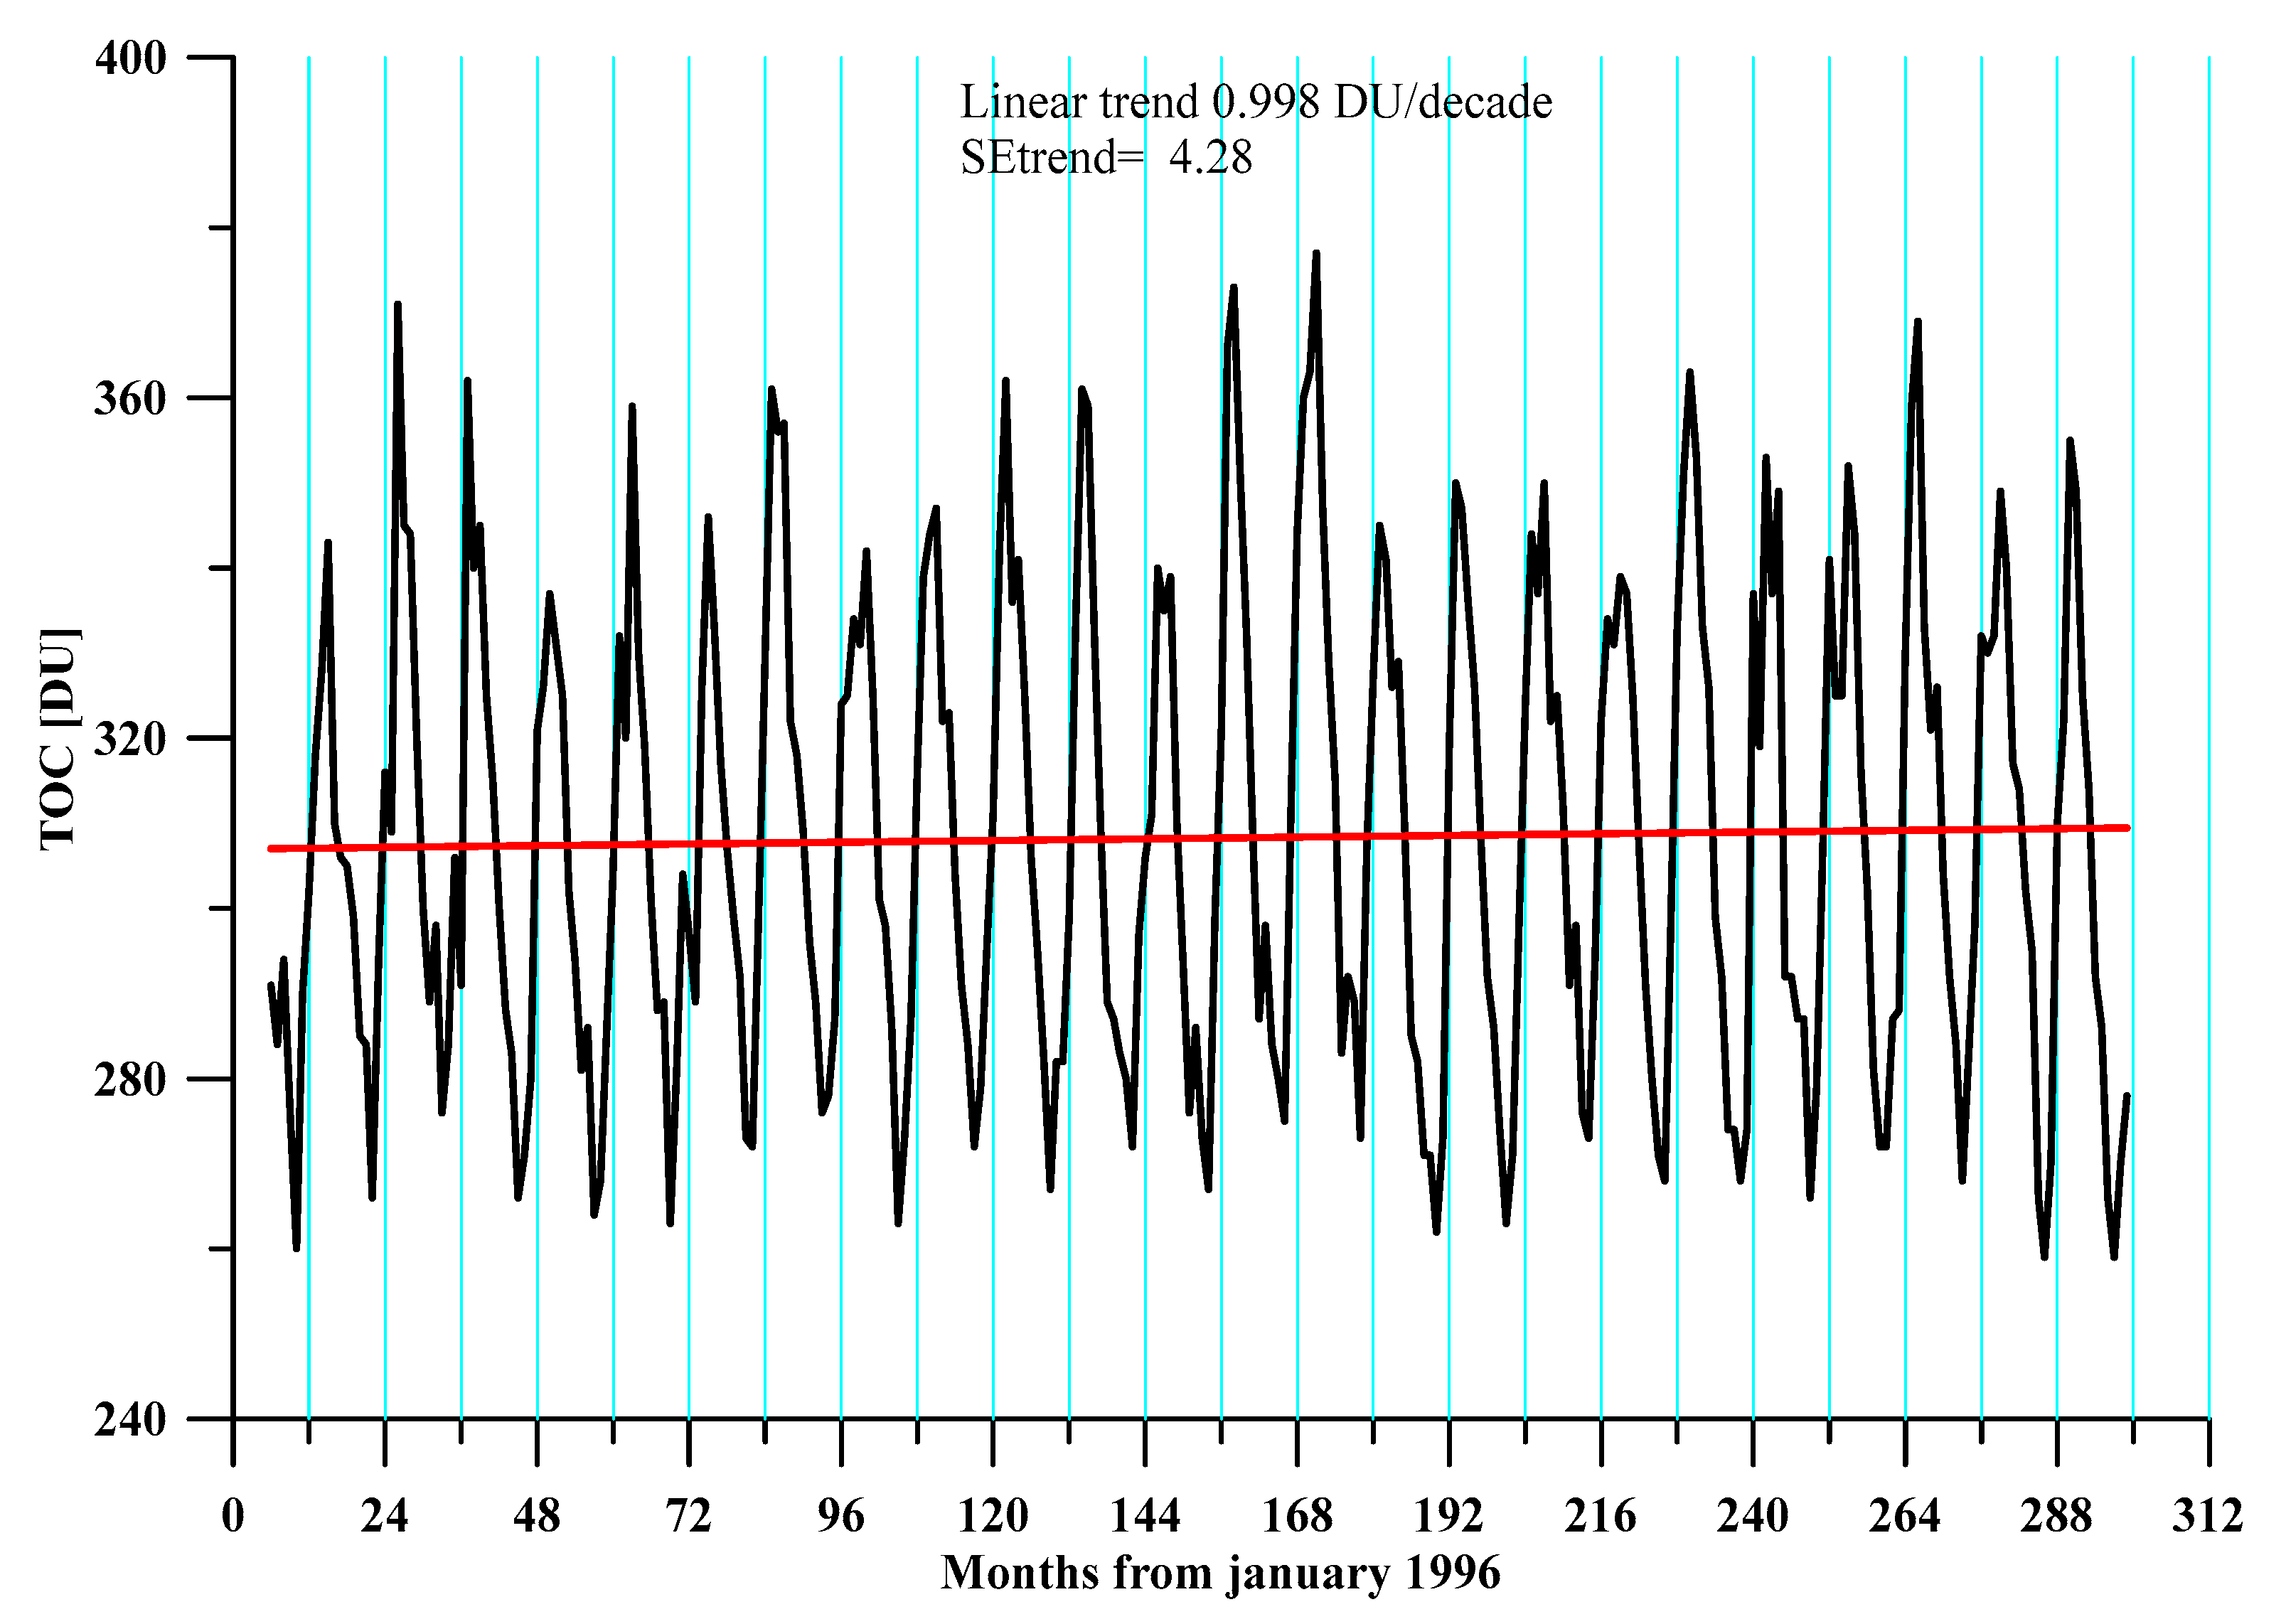
Figure 19 shows the trend in the TOC values obtained by supplementing the measurements and satellite data for the territory of Bulgaria in the period from 1996 to 2020. The results show a positive linear trend of almost 1 DU/decade, which is less than 1% of the average TOC value for the period considered. The standard error of the linear trend is 4.28.
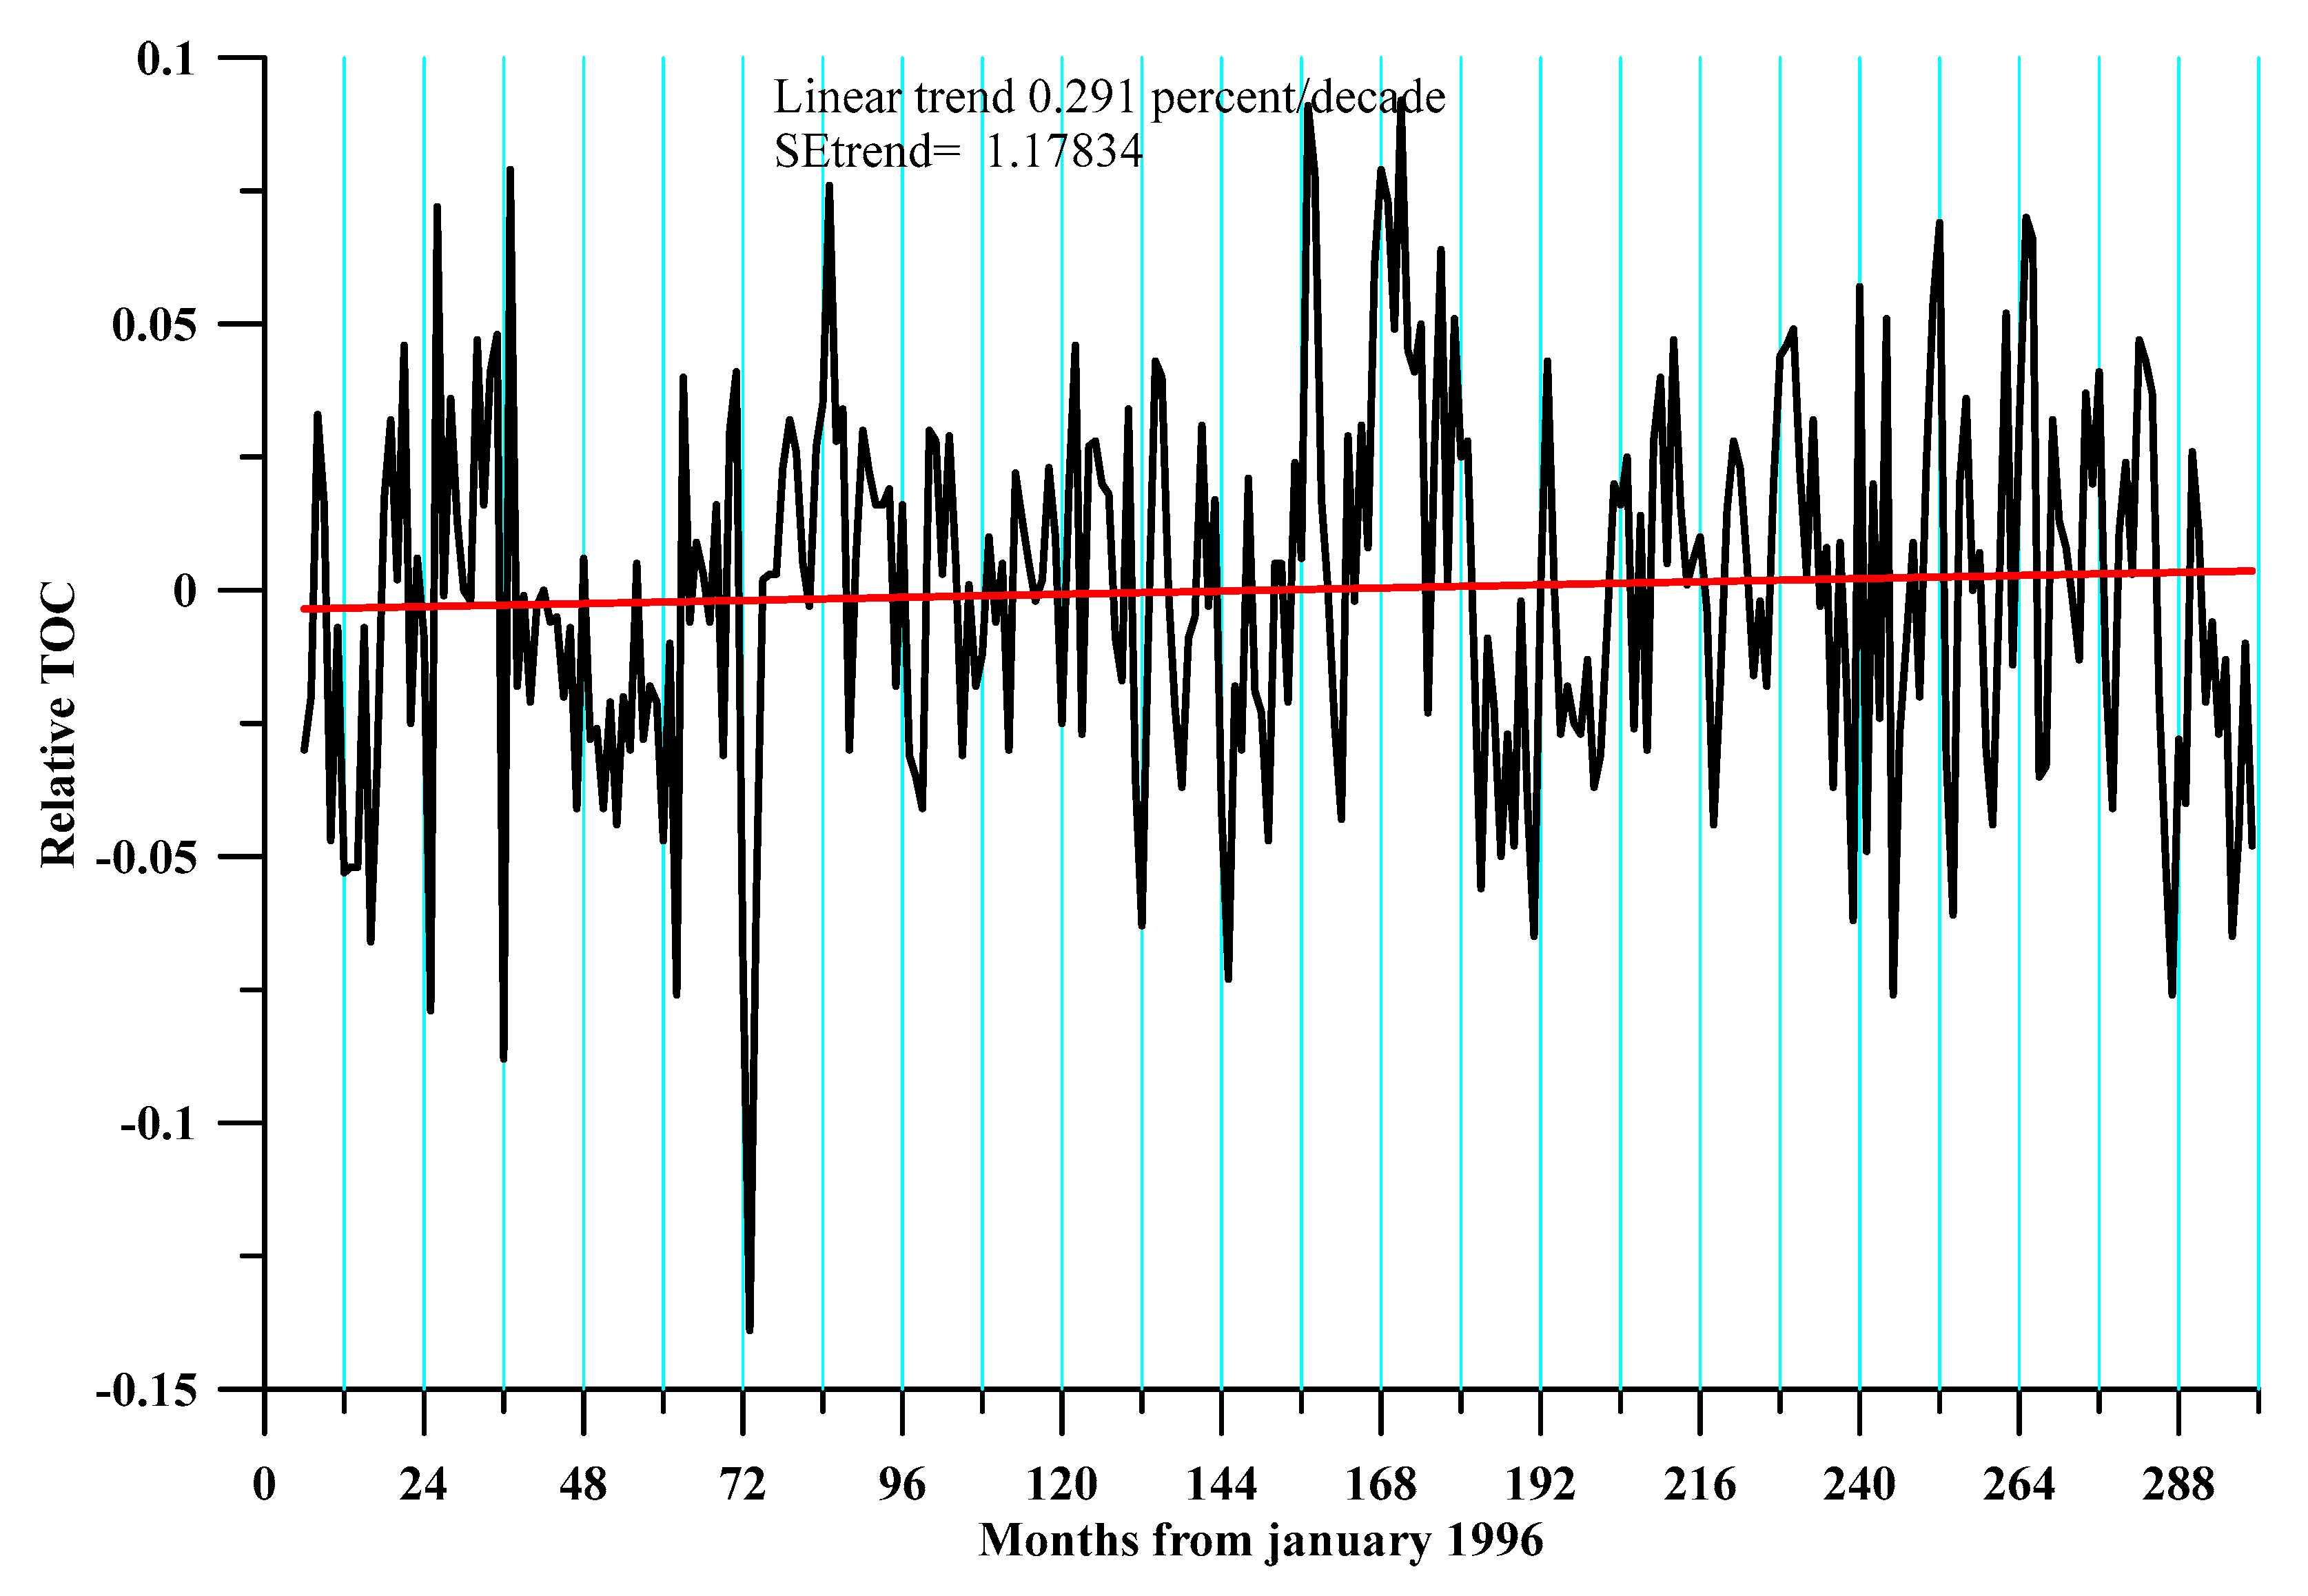
Figure 20 is analogous to Figure 19 and shows the trend in relative TOC values. The results illustrate a positive linear trend of 0.29 per cent/decade, which confirms the positive values obtained in the relative TOC trends for the northern hemisphere, shown in Figure 5. The standard error of the linear trend is 1.18.
4. Conclusions
This paper analyzes the long-term trends in the change of TOC for the period 2005–2020 in tropical and mid-latitudes of the Earth based on global data from OMI equipment running on the AURA satellite. The use of data from the same equipment largely eliminates the problems that arise when using data from different devices. The course of the monthly average zonal values of TOC for latitude bands with a step of 1 degree was studied, which gave a detailed latitude dependence of the long-period variation of TOC, represented by the linear trend over time.
The presented analysis of the linear trend of TOC shows that in the latitude range 60° S–60° N, a slow but steady increase in the amount of O3 prevails. The maximum value of the increase is observed in the southern hemisphere, as its value reaches 9 DU per decade at 45° S. As we approach the equator, the values decrease, and in the northern hemisphere, about 25° N wide, the trend is reversed. From 25° to 60° N there is a slow decrease in TOC at a rate of less than 2 DU/decade. Trends in the mean zonal relative TOC, which filters the seasonal cycle of the TOC, show similar latitude dependence, about 2 per cent per decade from 60° S to 30° S, between 0.5 and 1 per cent per decade from 30° S to 30° N, and about 0.5 per cent per decade of 30° N to 60° N.
The received trends for the period 2005–2020 can be considered insignificant, as in most latitudes, they have positive values. The trends in the components of the seasonal cycle—average annual value, amplitude, and phase of the 12-month component of the seasonal cycle—were studied. The trends in the average annual values are similar to those obtained above, and the amplitude and phase do not show significant trends. Due to the strong correlation between TOC and QBO, the trend existing in the equatorial zonal wind speed at the level of 30 hPa was studied. There is a significant positive trend in it. Due to the strong (about 70%) correlation between the equatorial zonal wind speed and the TOC in the equatorial region, it is hypothesized that the positive trend of the TOC in the tropics is related to the trend in the equatorial zonal wind.
The trend in the values of TOC for the territory of Bulgaria is studied on the basis of a synthetic time series from 1996 to 2020 composed of data from different satellites and ground measurements, which are mutually calibrated. For the studied period, the linear trend is practically zero. The obtained results confirm that in the period after the introduction of control over the production of chemical compounds that cause stratospheric O3 depletion, the Ozone layer has recovered and, accordingly, so has its protective role on the Earth’s biosphere. A probable reason for the latitudinal asymmetry of the Ozone layer recovery process is the asymmetry of atmospheric dynamics in the two hemispheres of the Earth and the asymmetry in the meridional and altitude transfer of O3, which determines its latitude and seasonal distribution.
Author Contributions
Conceptualization, P.M. and N.M.; methodology, P.M.; software, P.M. and R.B.; validation, P.M. and R.B.; formal analysis, R.B.; investigation, P.M.; resources, P.M.; data curation, P.M. and R.B.; writing—original draft preparation, P.M. and R.B.; writing—review and editing, N.M.; visualization, P.M.; supervision, N.M. All authors have read and agreed to the published version of the manuscript.
Funding
This work has been carried out in the framework of the National Science Program “Environmental Protection and Reduction of Risks of Adverse Events and Natural Disasters”, approved by the Resolution of the Council of Ministers No. 577/17.08.2018 and supported by the Ministry of Education and Science (MES) of Bulgaria (Agreement No. D01-279/03.12.2021).
Institutional Review Board Statement
Not applicable.
Informed Consent Statement
Not applicable.
Data Availability Statement
The database of TOC values for Bulgaria used and analyzed during the current investigation is available from the corresponding author upon reasonable request. The following information for global TOC data from the Ozone Monitoring Instrument (OMI) can be downloaded at: https://Ozonewatch.gsfc.nasa.gov/data/omi/ (accessed on 20 April 2022).
Acknowledgments
The authors express their acknowledgment to Ozone Monitoring Instrument (OMI) for freely available data of TOC.
Conflicts of Interest
The authors declare no conflict of interest. The funders had no role in the design of the study; in the collection, analyses, or interpretation of data; in the writing of the manuscript, or in the decision to publish the results.
References
- Tarasick, D.W.; Fioletov, V.E. The distribution of Ozone and Ozone-depleting substances in the atmosphere and observed changes. In Ozone Science: A Canadian Perspective on the Changing Ozone Layer; Environment Canada: Ottawa, ON, Canada, 1997; pp. 15–40. [Google Scholar]
- Shepherd, T.G. The influence of dynamical processes on Ozone abundance. In Ozone Science: A Canadian Perspective on the Changing Ozone Layer; Environment Canada: Ottawa, ON, Canada, 1997; pp. 41–56. [Google Scholar]
- Staehelin, J.; Harris, N.R.; Appenzeller, C.; Eberhard, J. Ozone trends: A review. Rev. Geophys. 2001, 39, 231–290. [Google Scholar] [CrossRef] [Green Version]
- Morrison, M.; Percy, K.; Vaughn, H.; Cullen, J.; Alward, R. UV-B Effects. In Ozone Science: A Canadian Perspective on the Changing Ozone Layer; Environment Canada: Ottawa, ON, Canada, 1997; pp. 91–116. [Google Scholar]
- Fioletov, V.E.; Evans, W.F.J. The influence of Ozone and other factors on surface radiation. In Ozone Science: A Canadian Perspective on the Changing Ozone Layer; Environment Canada: Ottawa, ON, Canada, 1997; pp. 73–90. [Google Scholar]
- Mcconnell, J.C.; Chartrand, D.J. Ozone Chemistry: Simulation and Depletion. In Ozone Science: A Canadian Perspective on the Changing Ozone Layer; Environment Canada: Ottawa, ON, Canada, 1997; pp. 57–72. [Google Scholar]
- Stolarski, R.; Bloomfield, P.; McPeters, R.; Herman, J. Total Ozone Trends Deduced from Nimbus 7 Toms Data. Geophys. Res. Lett. 1991, 18, 1015–1018. [Google Scholar] [CrossRef]
- Rosenlof, K.H. Estimates of the seasonal cycle of mass and Ozone transport at high northern latitudes. J. Geophys. Res. Atmos. 1999, 104, 26511–26523. [Google Scholar] [CrossRef] [Green Version]
- Bodeker, G.E.; Connor, B.J.; Liley, J.B.; Matthews, W.A. The global mass of Ozone: 1978–1998. Geophys. Res. Lett. 2001, 28, 2819–2822. [Google Scholar] [CrossRef]
- Krzyścin, J.W.; Rajewska-Więch, B. Trends in the Ozone vertical distribution from the Umkehr observations at Belsk 1963–2007. Int. J. Remote Sens. 2009, 30, 3917–3926. [Google Scholar] [CrossRef]
- Bazhenov, O.E. Long-term trends of variations in total Ozone content according to data of ground-based (Tomsk: 56.48° N, 85.05° E) and satellite measurements. Atmos. Ocean. Opt. 2012, 25, 142–146. [Google Scholar] [CrossRef]
- Chehade, W.; Weber, M.; Burrows, J.P. Total Ozone trends and variability during 1979–2012 from merged data sets of various satellites. Atmos. Chem. Phys. 2014, 14, 7059–7074. [Google Scholar] [CrossRef] [Green Version]
- Zvyagintsev, A.M.; Vargin, P.N.; Peshin, S. Total Ozone variations and trends during the period 1979–2014. Atmos. Ocean. Opt. 2015, 28, 575–584. [Google Scholar] [CrossRef]
- Ziemke, J.R.; Oman, L.D.; Strode, S.A.; Douglass, A.R.; Olsen, M.A.; McPeters, R.D.; Bhartia, P.K.; Froidevaux, L.; Labow, G.J.; Witte, J.C.; et al. Trends in global tropospheric Ozone inferred from a composite record of TOMS/OMI/MLS/OMPS satellite measurements and the MERRA-2 GMI simulation. Atmos. Chem. Phys. 2019, 19, 3257–3269. [Google Scholar] [CrossRef] [Green Version]
- Savinykh, V.V.; Elansky, N.F.; Gruzdev, A.N. Interannual variations and long-term trends in total Ozone over the North Caucasus. Atmos. Environ. 2021, 251, 118252. [Google Scholar] [CrossRef]
- Zhu, L.; Liu, M.; Song, J. Spatiotemporal Variations and Influent Factors of Tropospheric Ozone Concentration over China Based on OMI Data. Atmosphere 2022, 13, 253. [Google Scholar] [CrossRef]
- Fahey, W.D.; Hegglin, M.I. Twenty Questions and Answers About the Ozone Layer: 2010. In Scientific Assessment of Ozone Depletion; Reprinted from World Meteorological Organization: Geneva, Switzerland, 2011. [Google Scholar]
- Kaleyna, P.; Muhtarov, P.; Miloshev, N. Condition of the stratospheric and mesospheric Ozone layer over Bulgaria for the period 1996–2012: Part 1—total Ozone content, seasonal variations. Bul. Geophys. J. 2013, 39, 9–16. [Google Scholar]
- Kaleyna, P.; Muhtarov, P.; Miloshev, N. Condition of The Stratospheric and Mesospheric Ozone Layer over Bulgaria for the Period 1996-2012: Part 2–Total Ozone Content, Short term variations. Bulg. Geophys. J. 2013, 39, 17–25. [Google Scholar]
- Kaleyna, P.; Mukhtarov, P.; Miloshev, N. Seasonal variations of the total column Ozone over Bulgaria in the period 1996–2012. Comptes Rendus De L’academie Bulg. Des Sci. 2014, 67, 979–986. [Google Scholar]
- Muhtarov, P.; Miloshev, N. THE OZONE LAYER OVER BULGARIA IN THE PERIOD 1997–2018. Bulg. Geophys. J. 2018, 41, 60. [Google Scholar]
- Weber, M.; Coldewey-Egbers, M.; Fioletov, V.E.; Frith, S.M.; Wild, J.D.; Burrows, J.P.; Long, C.S.; Loyola, D. Total Ozone trends from 1979 to 2016 derived from five merged observational datasets–the emergence into Ozone recovery. Atmos. Chem. Phys. 2018, 18, 2097–2117. [Google Scholar] [CrossRef] [Green Version]
- Hudson, R.D.; Andrade, M.F.; Follette, M.B.; Frolov, A.D. The total Ozone field separated into meteorological regimes–Part II: Northern Hemisphere mid-latitude total Ozone trends. Atmos. Chem. Phys. 2006, 6, 5183–5191. [Google Scholar] [CrossRef] [Green Version]
- Huang, F.T.; Mayr, H.G.; Reber, C.A.; Russell, J.M., III; Mlynczak, M.G.; Mengel, J.G. Ozone quasi-biennial oscillations (QBO), semiannual oscillations (SAO), and correlations with temperature in the mesosphere, lower thermosphere, and stratosphere, based on measurements from SABER on TIMED and MLS on UARS. J. Geophys. Res. Space Phys. 2008, 113, 1–15. [Google Scholar] [CrossRef]
- Bowman, K.P. Global patterns of the quasi-biennial oscillation in total Ozone. J. Atmos. Sci. 1989, 46, 3328–3343. [Google Scholar] [CrossRef] [Green Version]
- Krzyścin, J.W.; Jaroslawski, J.; Rajewska-Więch, B. Beginning of the Ozone recovery over Europe? − Analysis of the total Ozone data from the ground-based observations, 1964–2004. Ann. Geophys. 2005, 23, 1685–1695. [Google Scholar] [CrossRef]
Figure 1.
Climatological seasonal cycle of TOC for the period 2005–2020.

Figure 2.
Course of the average monthly values of TOC for the period 2005–2020.

Figure 3.
(a) presents the course of the monthly mean zonal values of TOC and the linear trend for the equator; (b) presents the course of the monthly mean zonal values of TOC and the linear trend for 30° S; (c) presents the course of the monthly mean zonal values of TOC and the linear trend for 30° N; (d) presents the course of the monthly mean zonal values of TOC and the linear trend for 60° S; (e) presents the course of the monthly mean zonal values of TOC and the linear trend for 60° N.

Figure 4.
Latitude dependence of the linear trend and its standard error for the period 2005–2020.

Figure 5.
(a) presents the course of the monthly mean zonal values of relative TOC and the linear trend for the equator; (b) presents the course of the monthly mean zonal values of relative TOC and the linear trend for 30° S; (c) presents the course of the monthly mean zonal values of relative TOC and the linear trend for 30° N; (d) presents the course of the monthly mean zonal values of relative TOC and the linear trend for 60° S; (e)presents the course of the monthly mean zonal values of relative TOC and the linear trend for 60° N.

Figure 6.
Latitude dependence of the linear trend of the relative TOC and its standard error for the period 2005–2020.
Figure 6.
Latitude dependence of the linear trend of the relative TOC and its standard error for the period 2005–2020.

Figure 7.
Trend of the zonal mean TOC by months in DU per decade.

Figure 8.
Course of the average annual value of TOC by years.

Figure 9.
Course of the amplitude of the seasonal cycle of TOC by years.

Figure 10.
Course of the phase of the seasonal cycle of TOC by years.

Figure 11.
Latitude dependence of the trend in the average annual values of TOC.

Figure 12.
Latitude dependence of the trend in the seasonal amplitude of TOC.

Figure 13.
Latitude dependence of the trend of the seasonal phase of TOC.

Figure 14.
Monthly mean values of the equatorial zonal wind at a height of 30 hPa, measured in Singapore.
Figure 14.
Monthly mean values of the equatorial zonal wind at a height of 30 hPa, measured in Singapore.

Figure 15.
Latitude distribution of the cross-correlation (zero time-lag) between the speed of the equatorial zonal wind and the zonal mean relative TOC.
Figure 15.
Latitude distribution of the cross-correlation (zero time-lag) between the speed of the equatorial zonal wind and the zonal mean relative TOC.

Figure 16.
Climatological seasonal cycle of O3 zonal mass in MT for the period 2005 to 2020.

Figure 17.
Course of O3 mass between 60° S and 60° N for the period 2005–2020, with the trend marked by a red line.
Figure 17.
Course of O3 mass between 60° S and 60° N for the period 2005–2020, with the trend marked by a red line.

Figure 18.
Course of O3 mass between 30° S and 30° N (black solid line) and the trend at the equator (black dash line); Course of O3 mass between 30° S and 60° S (red solid line) and the trend in the southern hemisphere (red dash line); Course of O3 mass between 30° N and 60° N (blue solid line) and the trend in the northern hemisphere (blue dash line) for the considered time interval from 2005 to 2020.

Figure 19.
Trend in TOC over Bulgaria, 1996–2020.

Figure 20.
Trend in relative TOC over Bulgaria, 1996–2020.

Publisher’s Note: MDPI stays neutral with regard to jurisdictional claims in published maps and institutional affiliations. |
© 2022 by the authors. Licensee MDPI, Basel, Switzerland. This article is an open access article distributed under the terms and conditions of the Creative Commons Attribution (CC BY) license (https://creativecommons.org/licenses/by/4.0/).
Share and Cite
MDPI and ACS Style
Bojilova, R.; Mukhtarov, P.; Miloshev, N. Latitude Dependence of the Total Ozone Trends for the Period 2005–2020: TOC for Bulgaria in the Period 1996–2020. Atmosphere 2022, 13, 918. https://doi.org/10.3390/atmos13060918
AMA Style
Bojilova R, Mukhtarov P, Miloshev N. Latitude Dependence of the Total Ozone Trends for the Period 2005–2020: TOC for Bulgaria in the Period 1996–2020. Atmosphere. 2022; 13(6):918. https://doi.org/10.3390/atmos13060918
Chicago/Turabian StyleBojilova, Rumiana, Plamen Mukhtarov, and Nikolay Miloshev. 2022. "Latitude Dependence of the Total Ozone Trends for the Period 2005–2020: TOC for Bulgaria in the Period 1996–2020" Atmosphere 13, no. 6: 918. https://doi.org/10.3390/atmos13060918
Note that from the first issue of 2016, this journal uses article numbers instead of page numbers. See further details here.