
Prediction of Emission Reduction Potential from Road Diesel Vehicles in the Beijing–Tianjin–Hebei (BTH) Region, China


Key Laboratory of Beijing on Regional Air Pollution Control, Faculty of Environment and Life, Beijing University of Technology, Beijing 100124, China
*
Author to whom correspondence should be addressed.
Atmosphere 2022, 13(5), 776; https://doi.org/10.3390/atmos13050776
Submission received: 18 March 2022
/
Revised: 29 April 2022
/
Accepted: 9 May 2022
/
Published: 10 May 2022
(This article belongs to the Special Issue Integrated Prevention and Control of Air Pollution and Carbon Emission)
Abstract
:China has started to focus on the reduction in pollutants from diesel vehicles with high emission intensities in recent years. Therefore, it is essential and valuable to conduct a deep and detailed exploration of the reduction potential from diesel vehicles and compare the abatement effect from different control measures in upcoming decades. This study attempted to estimate the present emissions of four conventional pollutants from diesel vehicles by applying the Computer Program to Calculate Emissions from Road Transport (COPERT) model, and to predict the future emission trends under different scenarios during 2019–2030, taking the Beijing–Tianjin–Hebei (BTH) region as the case study area. In addition, we analyzed the emission reduction potential of diesel vehicles and compared the reduction effects from different control measures. The results showed that the CO and NOX emissions from diesel vehicles in this region could increase by 104.8% and 83.9%, respectively, given no any additional control measures adopted over the next decade. The largest emission reduction effect could be achieved under the comprehensive scenario, which means that vehicular diesel emissions in 2030 could decrease by 74.8–94.0% compared to values in 2018. The effect of emission reduction under the emission standards’ upgrade scenario could cause a gradual increase and achieve a 19.8–82.6% reduction for the four pollutants in 2030. Furthermore, the new energy vehicle promotion scenario could achieve a considerable reduction effect. It could also offer better emission reduction effects under the highway to railway scenario for Tianjin and Hebei provinces. The old vehicle elimination scenario could have a considerable reduction effect, but only in the short term. Furthermore, emission reductions could be mainly influenced by heavy diesel trucks. These results can provide scientific support to formulate effective reduction measures to diesel vehicles for policy makers.
1. Introduction
China has been the world’s largest country in terms of motor vehicle production and sales for ten consecutive years. China’s motor vehicle sales accounted for 32.65% of the global total in 2018. Therefore, air pollution is becoming increasingly attributable to the growing vehicle population due to refinements in industrial emission management. Among the vehicle fleet, the proportion of diesel vehicles accounted for 9.1% in 2018, while they also contributed 11.6%, 21.8%, 71.2%, and 99% of CO, HC, NOX, and PM, respectively, of the total vehicular emissions [1]. Diesel vehicles emit large amounts of pollutants and contribute extensively to air quality, despite their numbers being much lower than those of gasoline vehicles. This is because most diesels vehicles are commonly used with a high frequency, have a long service life, and have high mileage due to their commercial usage, which results in greater single-diesel vehicle emissions. Furthermore, control measures for diesel vehicles started late in China, and diesel engine control technology is somewhat backward, which can reduce pollutant emissions.
To explore the emission characteristics of diesel vehicles, many researchers have conducted laboratory simulations and real road measurements to analyze the factors affecting pollutant emissions. For example, some domestic and foreign scholars have quantified pollutant emissions from diesel vehicles in various regions, using emission measurement methods in the real world, including tunnel testing [2,3,4], portable emission measurement systems (PEMS) [5,6,7,8], and remote sensing technologies [9,10,11]. There are also some studies that have focused on the estimation of pollutant emissions from diesel vehicles. McDonald [12] revised the US mobile-source emissions inventory in 2013 and calculated the NOX and CO emissions from diesel vehicles. Singh [13] estimated India’s road transport emissions in 2020 and found that 61%, 23%, and 42% of CO2, CO, and NOX, respectively, came from diesel vehicles. Jo and Kim [14] studied motor vehicle emissions in Seoul, South Korea, and concluded that diesel vehicles had the highest total emissions compared with gasoline vehicles and LPG vehicles. Chinese researchers also performed related studies on motor vehicles, and analyzed pollutant emissions from diesel vehicles, including in the Yangtze River Delta region [15], the Changsha–Zhuzhou–Xiangtan Region [16], the Guanzhong Region [17], the Henan province [18], Beijing [19], Tianjin [20], and Xi’an [21]. Only some of the literature focuses on an in-depth exploration of diesel vehicle emissions. Li [22] calculated the emissions of CO, CO2, NOX, and PM from heavy-duty diesel buses in the Hainan province in 2017 using the COPERT model. Zhou [23] defined three scenarios to analyze BC emissions from diesel vehicles in China. Xue [24] analyzed the energy consumption and pollutant emissions related to diesel-fired combustion in Beijing. However, little consideration has been given to project possible emission reduction potentials and to compare the reduction effects of different control measures.
The above studies all showed that diesel vehicles are Important sources of air pollutants, and that we need to further study the emissions of diesel vehicles. However, most previous studies have focused on a compilation of the overall emission inventory of motor vehicles. There are few studies that focus only on diesel vehicle emissions and forecasts, which cannot meet the needs of national pollution prevention and control policy formulation. Therefore, it is important to evaluate and forecast the emissions of diesel vehicles in China.
To fill this gap, this study aimed to estimate present pollutant emissions from diesel vehicles in the BTH region, China. To forecast future diesel emissions and to explore the reduction potential of all kinds of diesel vehicles, we defined several policy scenarios to quantitatively estimate the emission trends over 2018–2030. In addition, we evaluated and compared reduction effects of different control measures for diesel vehicles in the BTH region. These results could be useful when proposing the feasible control measures to diesel vehicles. The rest of this paper is as follows: Section 2 explains the study area and methodology, Section 3 presents the research results and offers a discussion, and Section 4 presents the conclusions and a summary.
2. Study Area
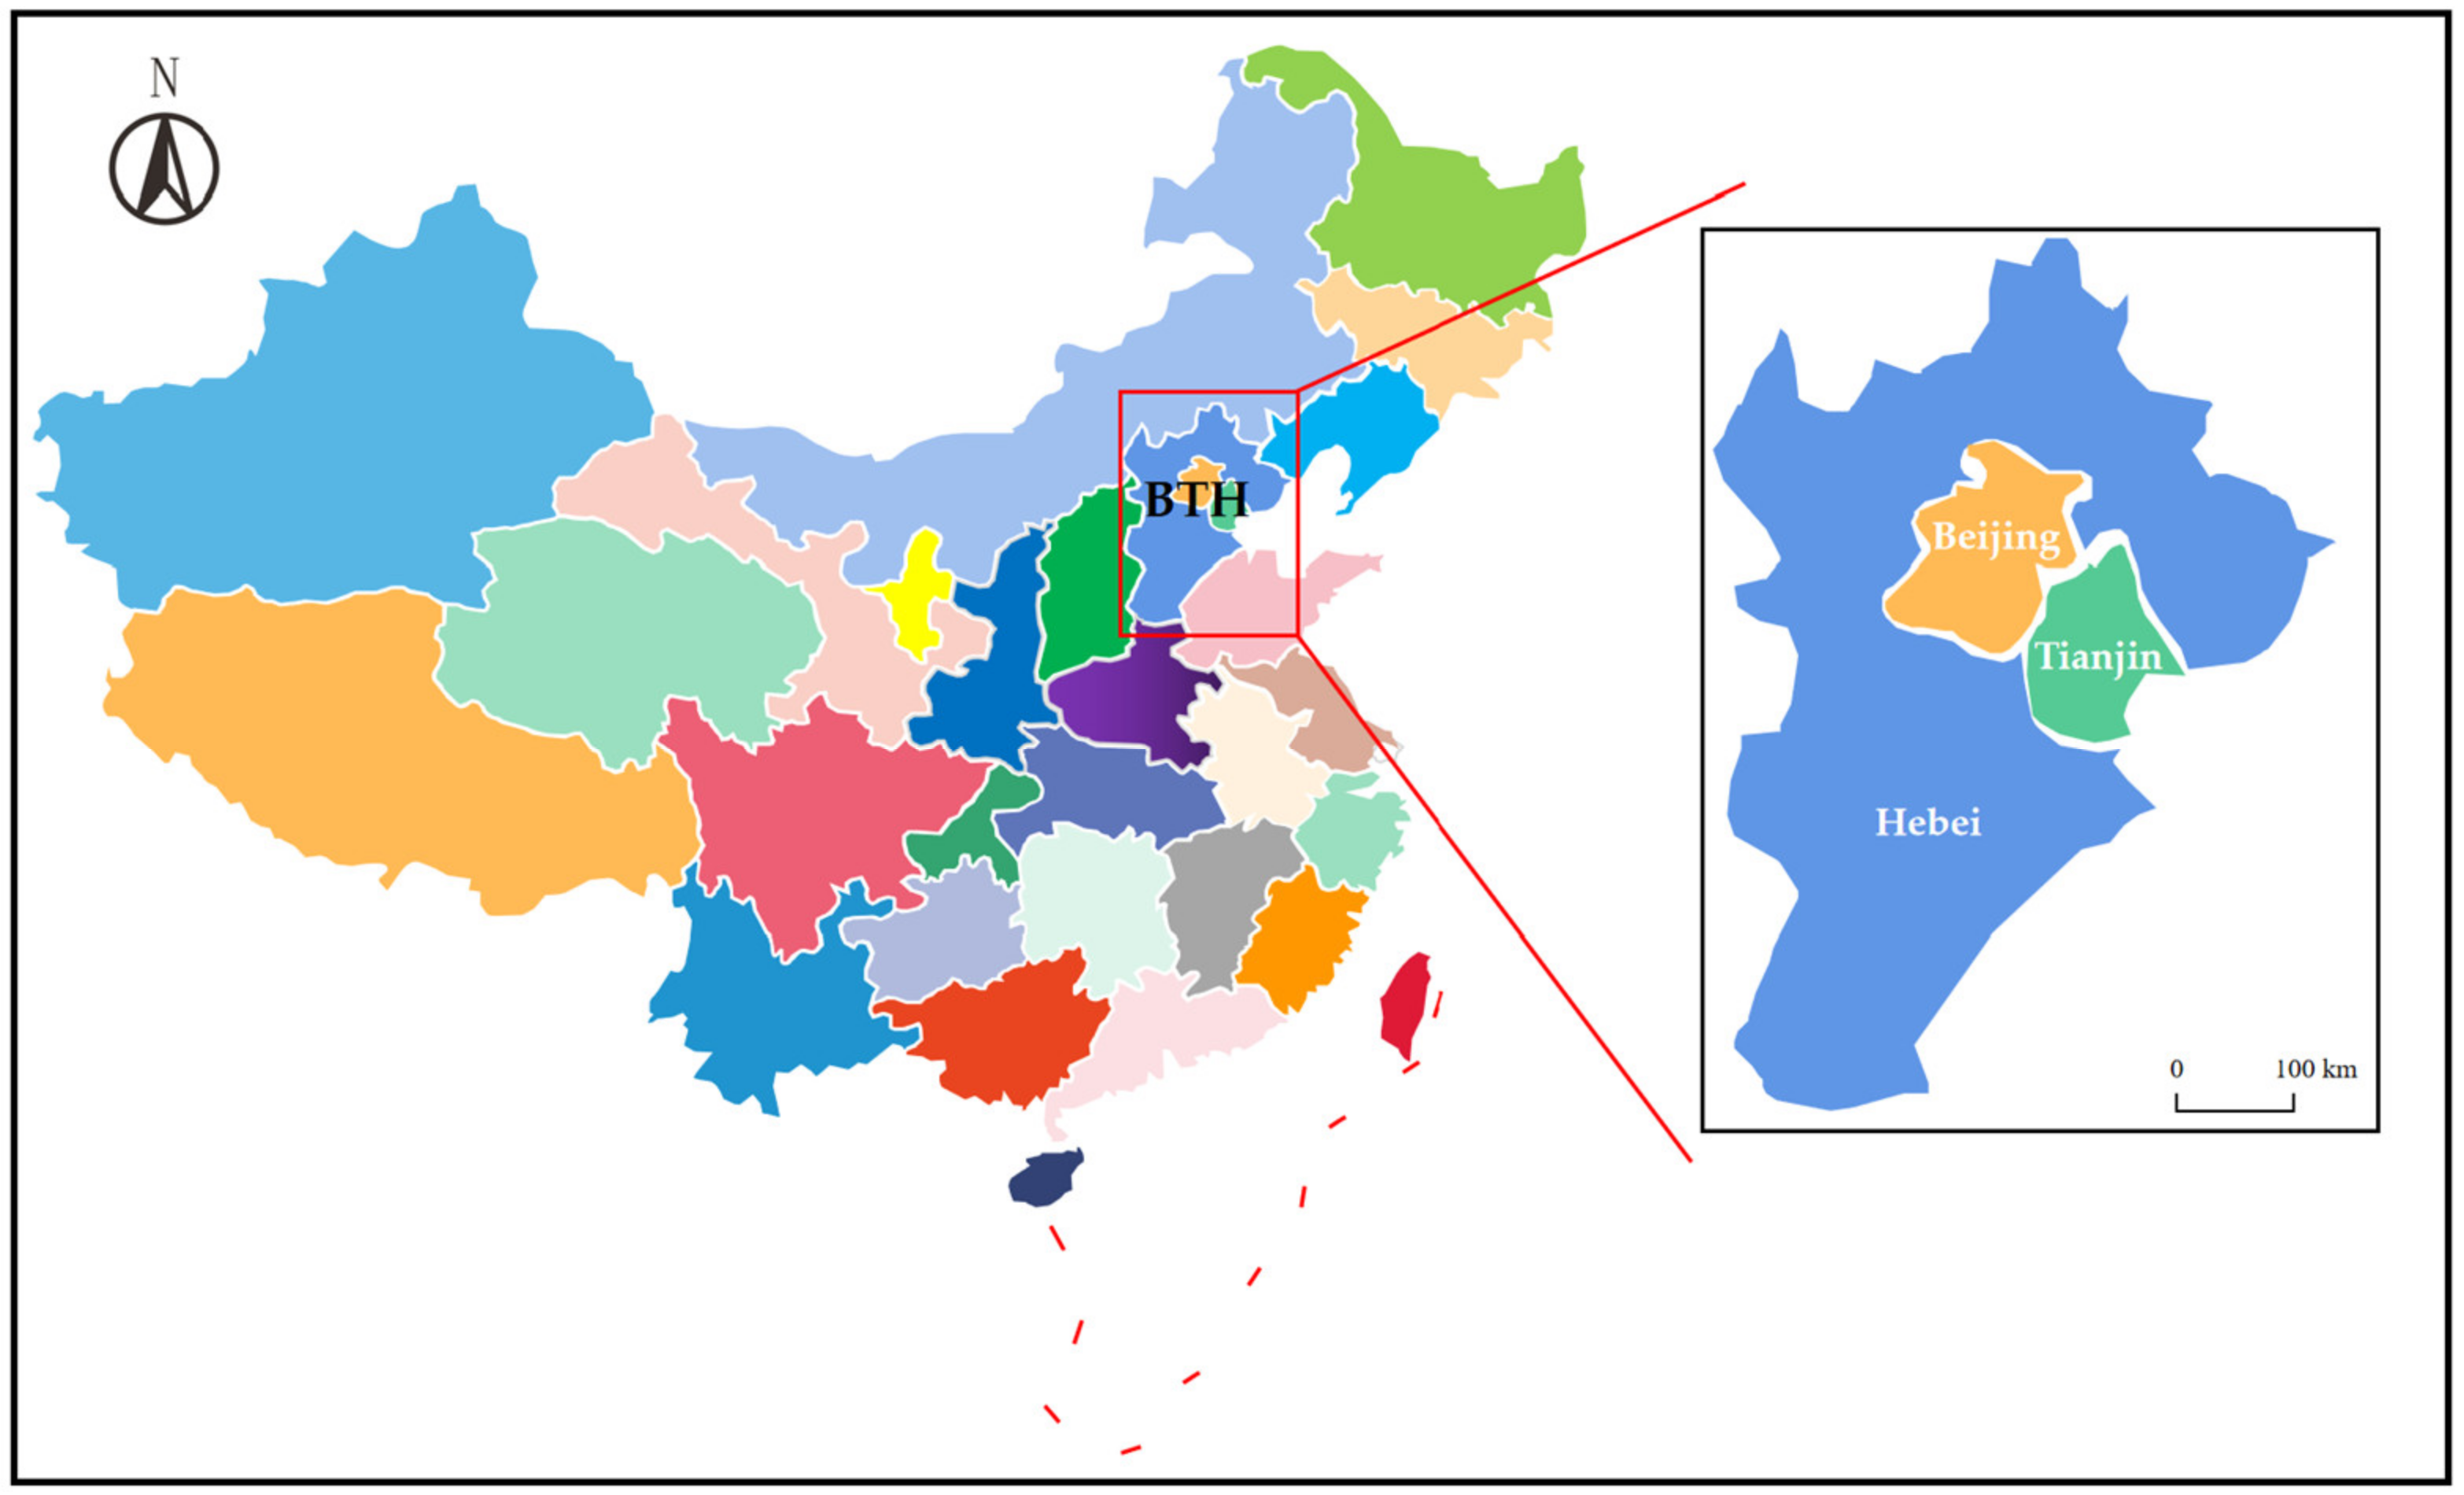
This paper chose the BTH region as the case area, which is in North China, and includes Beijing, Tianjin, and 11 prefecture-level cities in the Hebei province. It is known as China’s “capital economic circle”. The total population of this region was 112.7 million people, and the GDP amounted to CNY 8513.989 billion, accounting for 9.3% of the country’s total in 2018 [25]. Due to the high population density, rapid economic development, and intensive industrial industries, the BTH region has experienced frequent heavy air pollution in recent years. According to the air quality status reports from 74 cities in April 2018, seven of the top ten cities in China with the worst air quality are located at this region [26]. Thus, the BTH region is also one of the areas of focus for the joint prevention and control of air pollution in China. The location of the BTH region is shown in Figure 1.
The number of motor vehicles in the BTH region keeps increasing year after year. The vehicle population in the Hebei province ranked fifth in the whole country in 2018. Beijing and Tianjin both have more than 3 million vehicles, and rank among the top cities in China. It was reported that the CO, HC, NOX, and PM emissions from motor vehicles in the BTH region accounted for 11.7%, 10.0%, 11.5%, and 11.8%, respectively, of the total vehicular emissions in China in 2018 [1]. Due to the continuous implementation of pollution control measures for gasoline vehicles over the past few decades, the emission reduction potential of gasoline cars has been limited, which has highlighted emission reductions for diesel vehicles. The governments of Beijing, Tianjin, and Hebei have begun to realize this situation, and have put forward a number of effective measures to prevent and control diesel vehicular emissions, specifically through the issued blue sky defense action plans in 2018. Therefore, the effective pollution control of diesel vehicles is of great significance in order to further improve air quality in the BTH region.
3. Methodology
The research content of this study includes three parts. The first part is the calculation of present vehicular diesel emissions, in terms of conventional pollutants (NOX, PM, CO, and VOCs) in the BTH region. To project future emissions from diesel vehicles and the relevant reduction potentials of different control options, six policy scenarios were designed. Additionally, we needed to predict emissions under the different scenarios for future years (from 2020 to 2030). Based on these values, emission reduction potentials were obtained and the effects of different control measures were comparatively analyzed. The following are detailed explanations of the methods of these three parts.
To estimate present emissions from diesel vehicles in the BTH region and to predict future emissions, this study adopted the emission factor method recommended by a technical guide [27]. First, we classified the types of vehicles according to their characteristics and uses, and then obtained the activity level of diesel vehicles in the base year through statistical yearbooks, annual traffic development reports, and other relevant data. At the same time, we collected relevant model parameters and used the COPERT traffic emission model to calculate the emission factors for each pollutant. Through the prediction of the activity levels of diesel vehicles, to estimate the pollutant emissions of diesel vehicles in six scenarios from 2018 to 2030, we finally obtained the emission reduction potential of pollutants for future years. The following introduces the emission calculation method, the parameter acquisition method, and the designed scenarios in detail.
3.1. Estimation of Vehicular Emission
We used the emission factor method recommended by the Technical Guide for Development of Emission Inventory of Air Pollutants from Road Motor Vehicles [27] to estimate the diesel vehicular emissions for this study. The calculation formula is as follows:
where m represents the different provinces and cities; n represents a specific pollutant (NOX, PM, CO, VOC); i is the diesel vehicle type; j is the diesel vehicle emission standards; Qm,n is the emission of pollutants N from diesel vehicles in area m (t); Pm,i,j represents the number of i-type diesel vehicles under j emission standard in area m; VKTm,i represents the average annual kilometers travelled (km) for the i-type diesel vehicles in area m; and EFi,j,n represents the emission factor (g/km) of the pollutant n emitted by the i-type diesel vehicle under the j emission standard.
3.1.1. Vehicle Category
The classification of vehicle types is an important basis for the development of an emission inventory. Motor vehicles are divided into gasoline vehicles, diesel vehicles, gaseous fuel vehicles, and electric vehicles etc., [28]. This study focused on diesel vehicles, which are non-track-loaded vehicles driven by diesel engines with four or more wheels. The classification of diesel vehicle types was determined according to “Road traffic management—Types of motor vehicles” [29], the Statistical Yearbook [25], and the characteristics and uses of vehicles, in reference to the conversion method of Qiu [30]. Finally, diesel vehicles were divided into four types, as shown in Table S1: light diesel vehicles (LDVs), heavy diesel vehicles (HDVs), light diesel trucks (LDTs), heavy diesel trucks (HDTs), and different emission grades (China I, China II, China III, China IV, China V, and China VI).
3.1.2. Vehicle Population and VKT
In this study, the vehicle population for each diesel type (LDV, HDV, LDT, and HDT) in the BTH region in 2018 was obtained from the China Statistical Yearbook [25] and our previous studies [31]. In addition, we needed to divide the number of vehicles into different types, according to the emission standards that the vehicles were able to meet. It is assumed that all vehicles needed to meet the newest emission standards were issued upon purchase. Thus, the type of emission standard for each diesel vehicle was reflected by, and derived from, the initial vehicle age distribution, which was obtained by referring to some studies [32,33].
The vehicle kilometer travelled (VKT) represents the real average annual distance travelled by each specific vehicle in the study area. The method used to obtain these data mainly included recommendations by the recognized guidelines [34], literature research [35], a questionnaire survey [36], and data analysis [37,38]. This study referred to the Traffic Development Annual Report and other literature research results [39] to determine the VKT data for each type of diesel vehicle in the BTH region.
3.1.3. Emission Factors
As is known, emission factors represent one of the most significant parameters to calculate pollutant emissions. Due to the fact that vehicular emissions are affected by many factors, the COPERT model was employed to determine the emission factors for CO, VOCs, NOX, and PM for different types of diesel vehicles in the BTH region.
The COPERT model was developed by the European Environmental Commission and used widely used in various road emission models in Europe. The model adopted a large amount of reliable experimental data and is compatible with different national standards and parameter variables. Following European experiences in the control of motor vehicle emissions, China learned that the national motor vehicle emission standards basically followed the EU emission standards at various stages, and that the classification of various types of vehicles has many similarities. Therefore, the COPERT model is also applicable for China [40,41,42]. However, due to differences between the Chinese classification standards for motor vehicles and European classification standards used by COPERT, this study linked the types of Chinese diesel vehicles with corresponding types from COPERT.
In addition to corresponding vehicle classifications, this study localized key parameters of the model, such as meteorological data in the BTH region, diesel data, and vehicular driving parameters. These data were obtained through relevant statistical data, documents, and national regulations for the BTH region, including statistics from the China Meteorological Administration and China Energy Statistical Yearbook.
3.2. Definition of Scenarios
To project the emission reduction potential and compare the reduction effects of different control measures, some policy scenarios were defined according to the Action Plan for Tackling the Pollution Control of Diesel Trucks [43], which was jointly issued by 11 departments in January 2019, and also by considering the economic feasibility and emission reduction targets. Detailed definitions and the relevant government documents referred to for each scenario are summarized in Table 1.
3.3. Prediction of Future Diesel Vehicular Emissions
When pollutant emissions in the BTH region were projected for future years (2019–2030), the activity level and EFs data for different years were predicted using the different scenarios in this study.
We projected the activity level of diesel vehicles in the BTH region using the elastic coefficient method. It is recognized that the activity level of diesel vehicles is related to the economic development level, according to previous studies [44,45]. GDP was selected as an economic indicator, and we estimated the elasticity coefficient be 0.74 based on the historical data of the vehicular population and GDP. Thus, the future diesel vehicle population can be projected based on the determined growth rate of GDP for future years, referring to the Local Economic Development Plan for the BTH region. The next step was to estimate the different types of diesel vehicle populations that could meet different emission standards in future years, based on the initial vehicle age distribution and survival probability. The diesel VKT data for future years were predicted using a similar method. Detailed information can be seen in Figures S1 and S2.
By calculating future emission factors for diesel vehicles, it was assumed that the EF for each emitted pollutant from the specific types of diesel vehicles meeting the specific emission standards could be fixed. As diesel vehicles with different standards were changing due to dynamic vehicle age distributions, the average EFs of different types of diesel vehicles were variable for future years. Once the activity level and emission factors were predicted, pollutant emissions under the BAU scenario could be calculated. The next step was to adjust the corresponding data of activity levels and EFs, according to the specific requirements of different policy scenarios, and pollutant emissions under the different scenarios could be projected for future years.
4. Results and Discussion
4.1. Prediction of Pollutant Emissions from Diesel Vehicles
4.1.1. Diesel Vehicle Emissions under the BAU Scenario
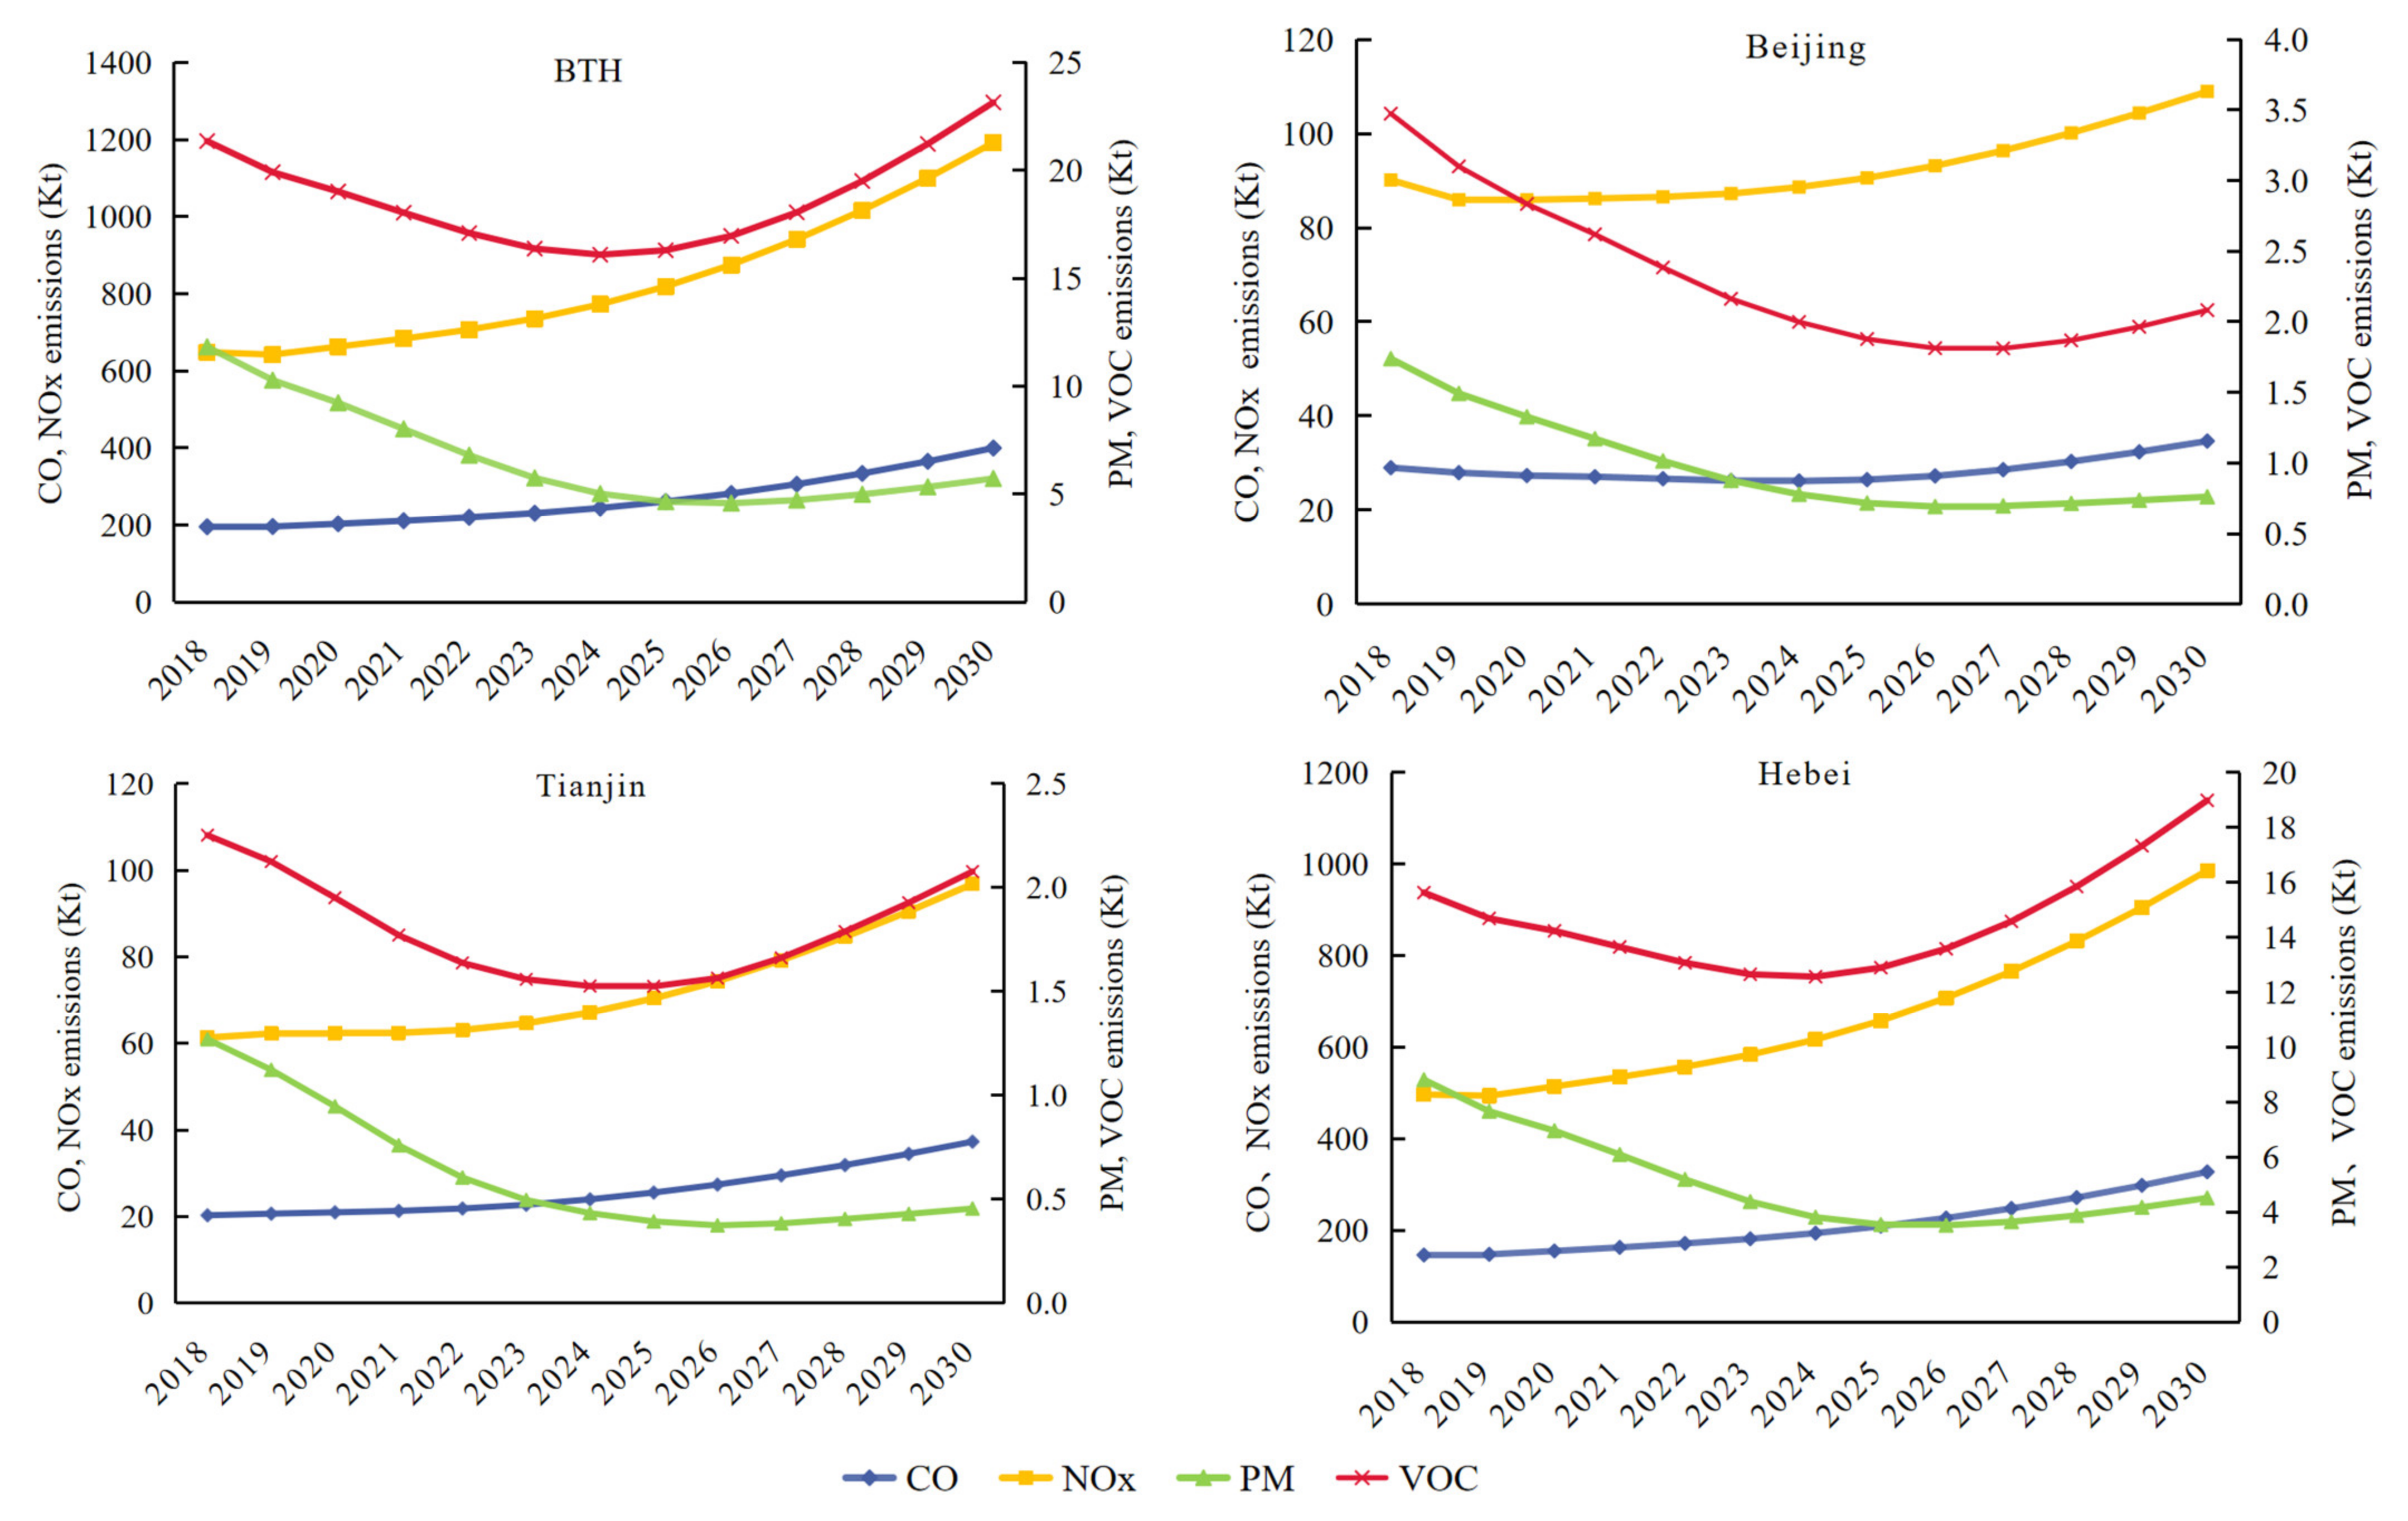
The emissions from diesel vehicles in the Beijing–Tianjin–Hebei region for 2018 were calculated. The NOX emitted by diesel vehicles could account for 92.6% of the total emissions from mobile sources, as reported by the Ministry of Ecology and Environment [1]. Figure 2 illustrates the forecasted results of diesel vehicular pollutant emissions in the Beijing–Tianjin–Hebei region under the baseline scenario (BAU). CO and NOx emissions in this region may continue to grow, with growth rates of up to 104.8% and 83.9%, respectively, under the BAU scenario, as the population of diesel vehicles is predicted to increase over the next few decades, due to the fact that existing control measures fail to effectively reduce emissions. The VOC emissions in this region could first decrease and then increase, and the value in 2030 could be 8.4% higher than the value in 2018. PM emissions could decrease during the first five years and, thereafter, remain relatively stable, which could result in a 51.6% emission reduction by 2030 compared to 2018. This is because current diesel vehicle control measures, including the abandoning of old diesel vehicles and improvements to new vehicle emission standards, could lead to a decrease in VOC and PM emissions in the short term. Considering the three sub-regions, the PM emission in Beijing, Tianjin, and Hebei could decline by 56.3%, 64.2%, and 48.9%, respectively. VOC emissions in Beijing could remain stable from 2025 to 2030, and be reduced by 40.0% in the end, while showing an upward trend in Tianjin and Hebei provinces.
4.1.2. Diesel Vehicle Emissions under Policy Scenario
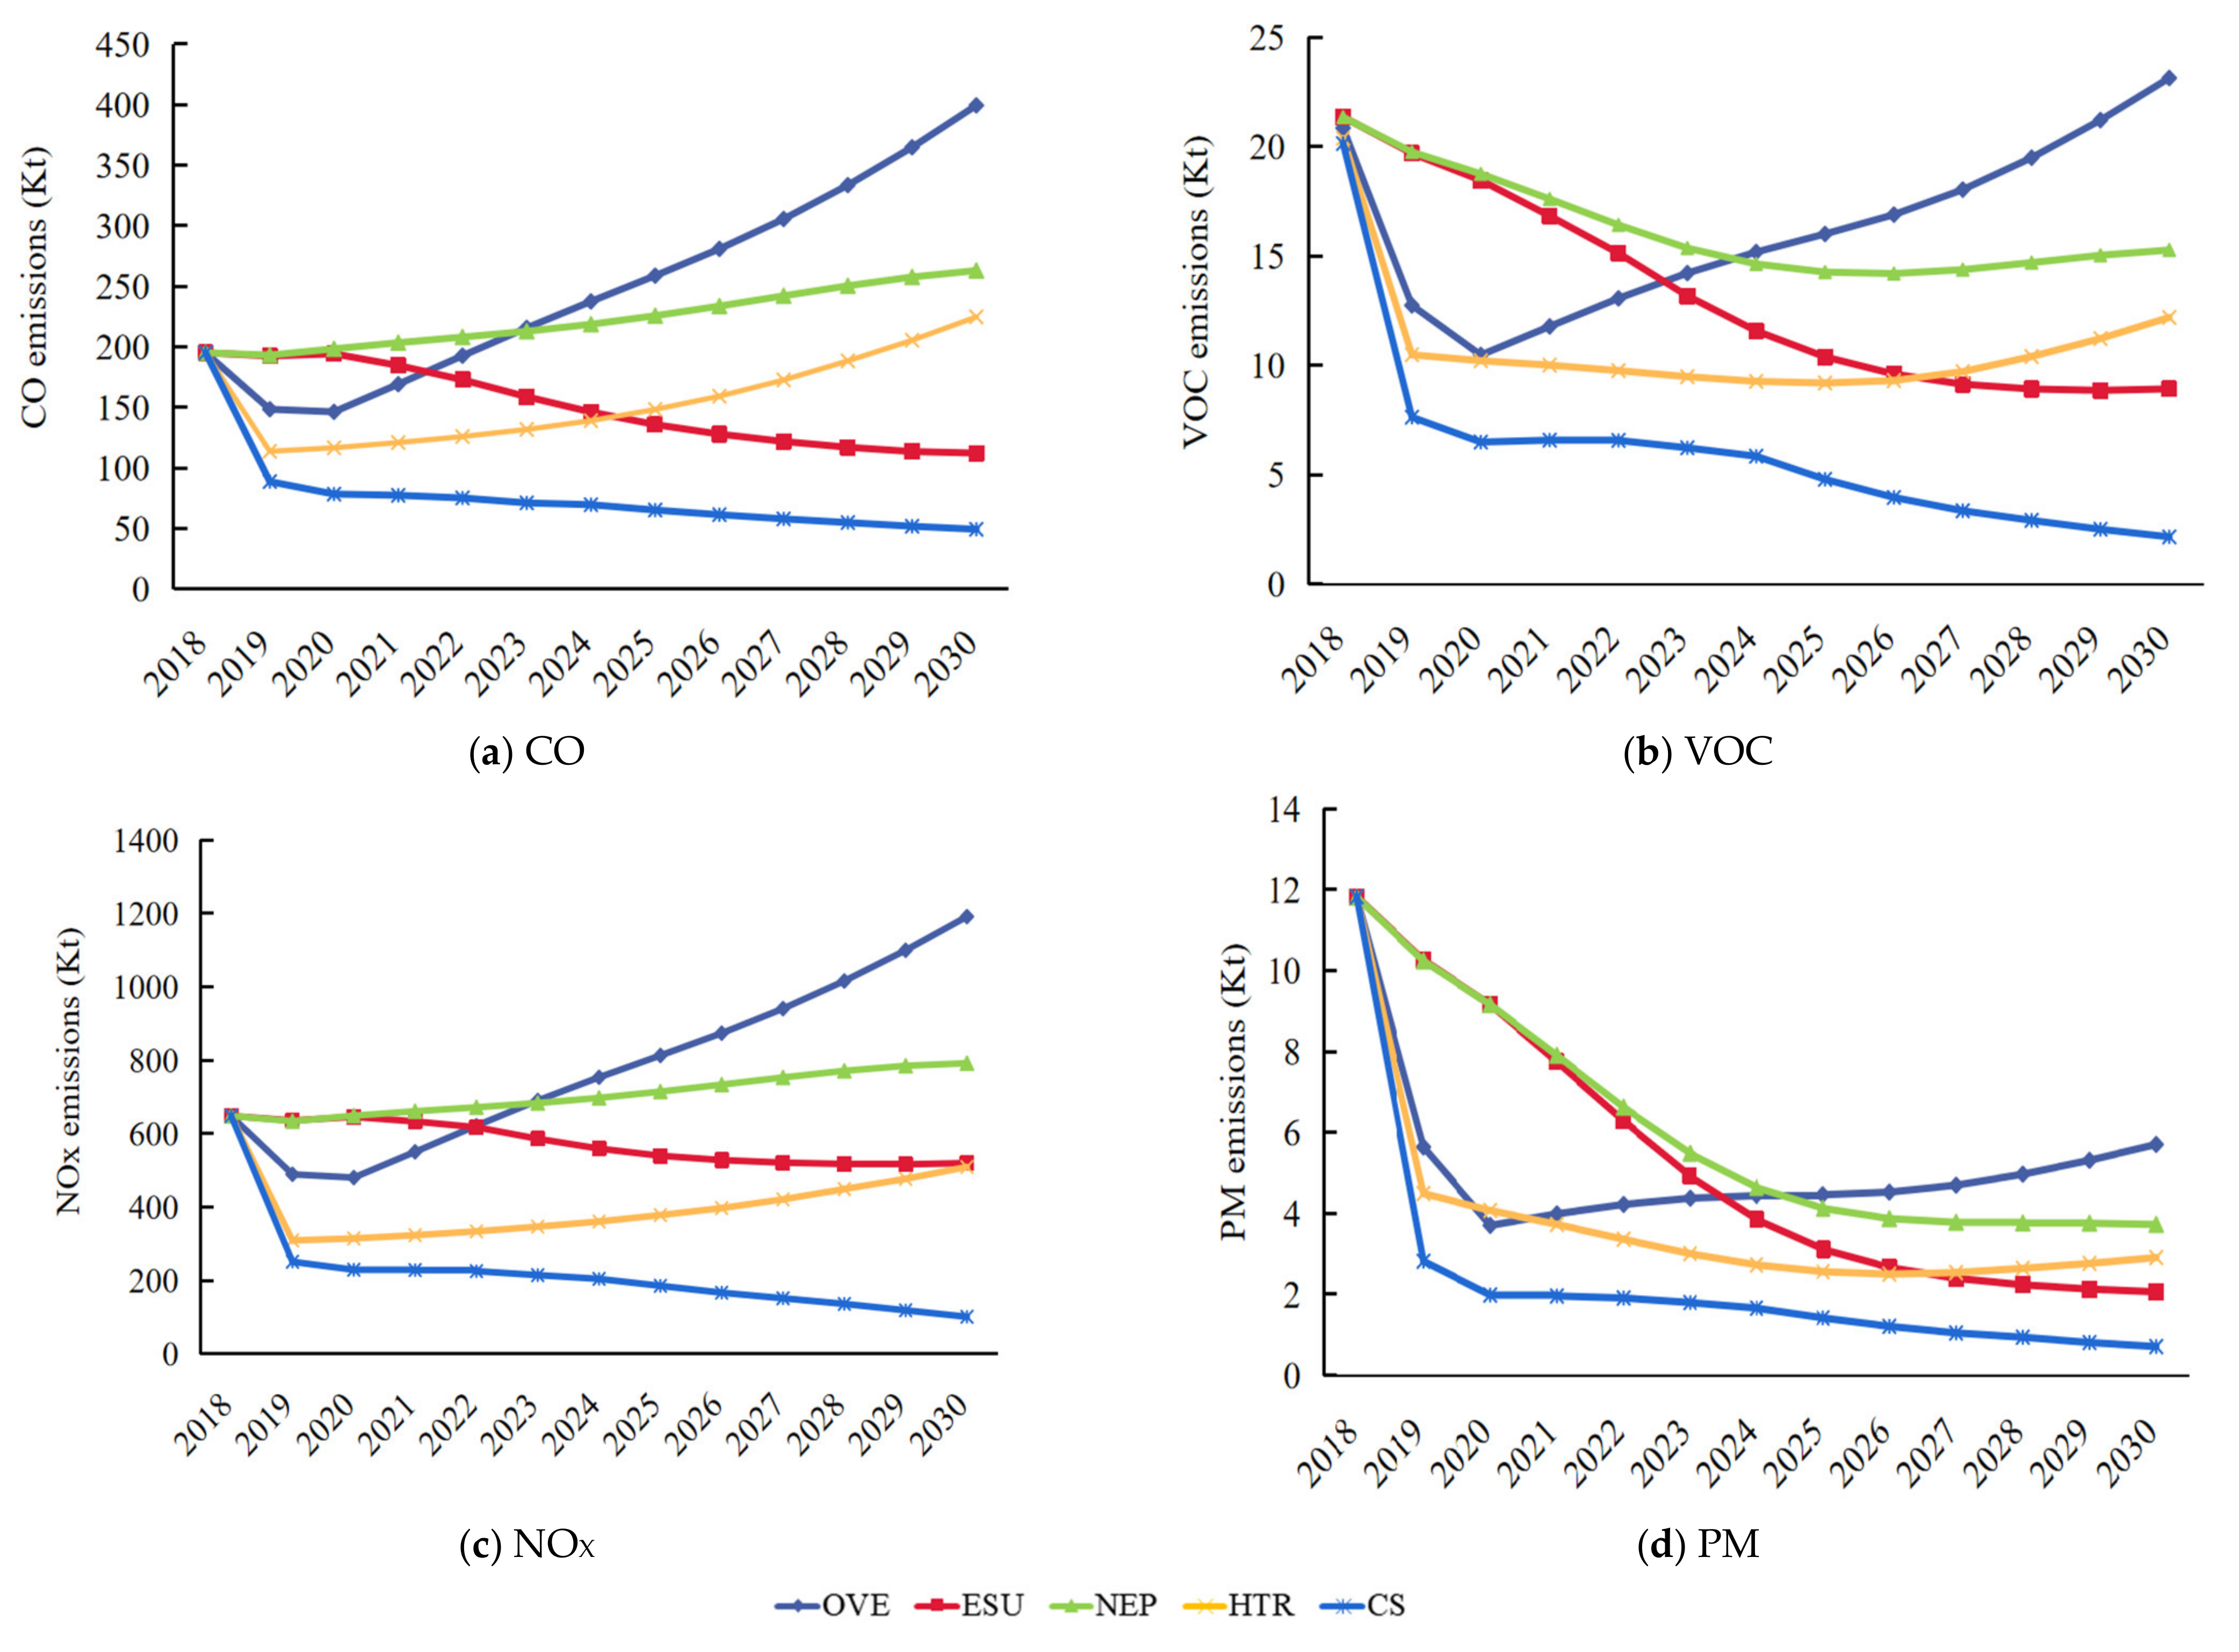
Figure 3 shows the projected emissions from diesel vehicles in the BTH region under different policy scenarios. It can be concluded that CO, VOC, NOX, and PM emissions could be reduced by 74.55, 89.3%, 84.5%, and 94.0%, respectively, by 2030 compared to the values in 2018 under the CS scenario. The pollutant emissions from diesel vehicles in 2030 under other policy scenarios could decrease relative to 2018, except under the OVE scenario. The CO, VOC, and NOX emissions from diesel vehicles under the OVE scenario could increase by 104.7%, 11.0%, and 83.9%, respectively, by 2030, which is due to the weak long-term pollution control effect in this scenario. However, the declining effect of pollutant emissions under the ESU scenario could be the most significant, with CO, VOC, NOX, and PM emissions in 2030 being 42.5%, 58.2%, 19.8%, and 82.6% of the value in 2018. The CO and NOX emissions can remain relatively stable from 2018 to 2030 under the NEP scenario. It is worth noting that PM emissions could be significantly reduced in all scenarios by 2030. Compared to the present situation, PM emissions could achieve a 94.0% reduction by 2030.
4.2. Emission Reduction Potential of Diesel Vehicles in the BTH Region
4.2.1. Emission Reduction Potential under Different Reduction Scenarios
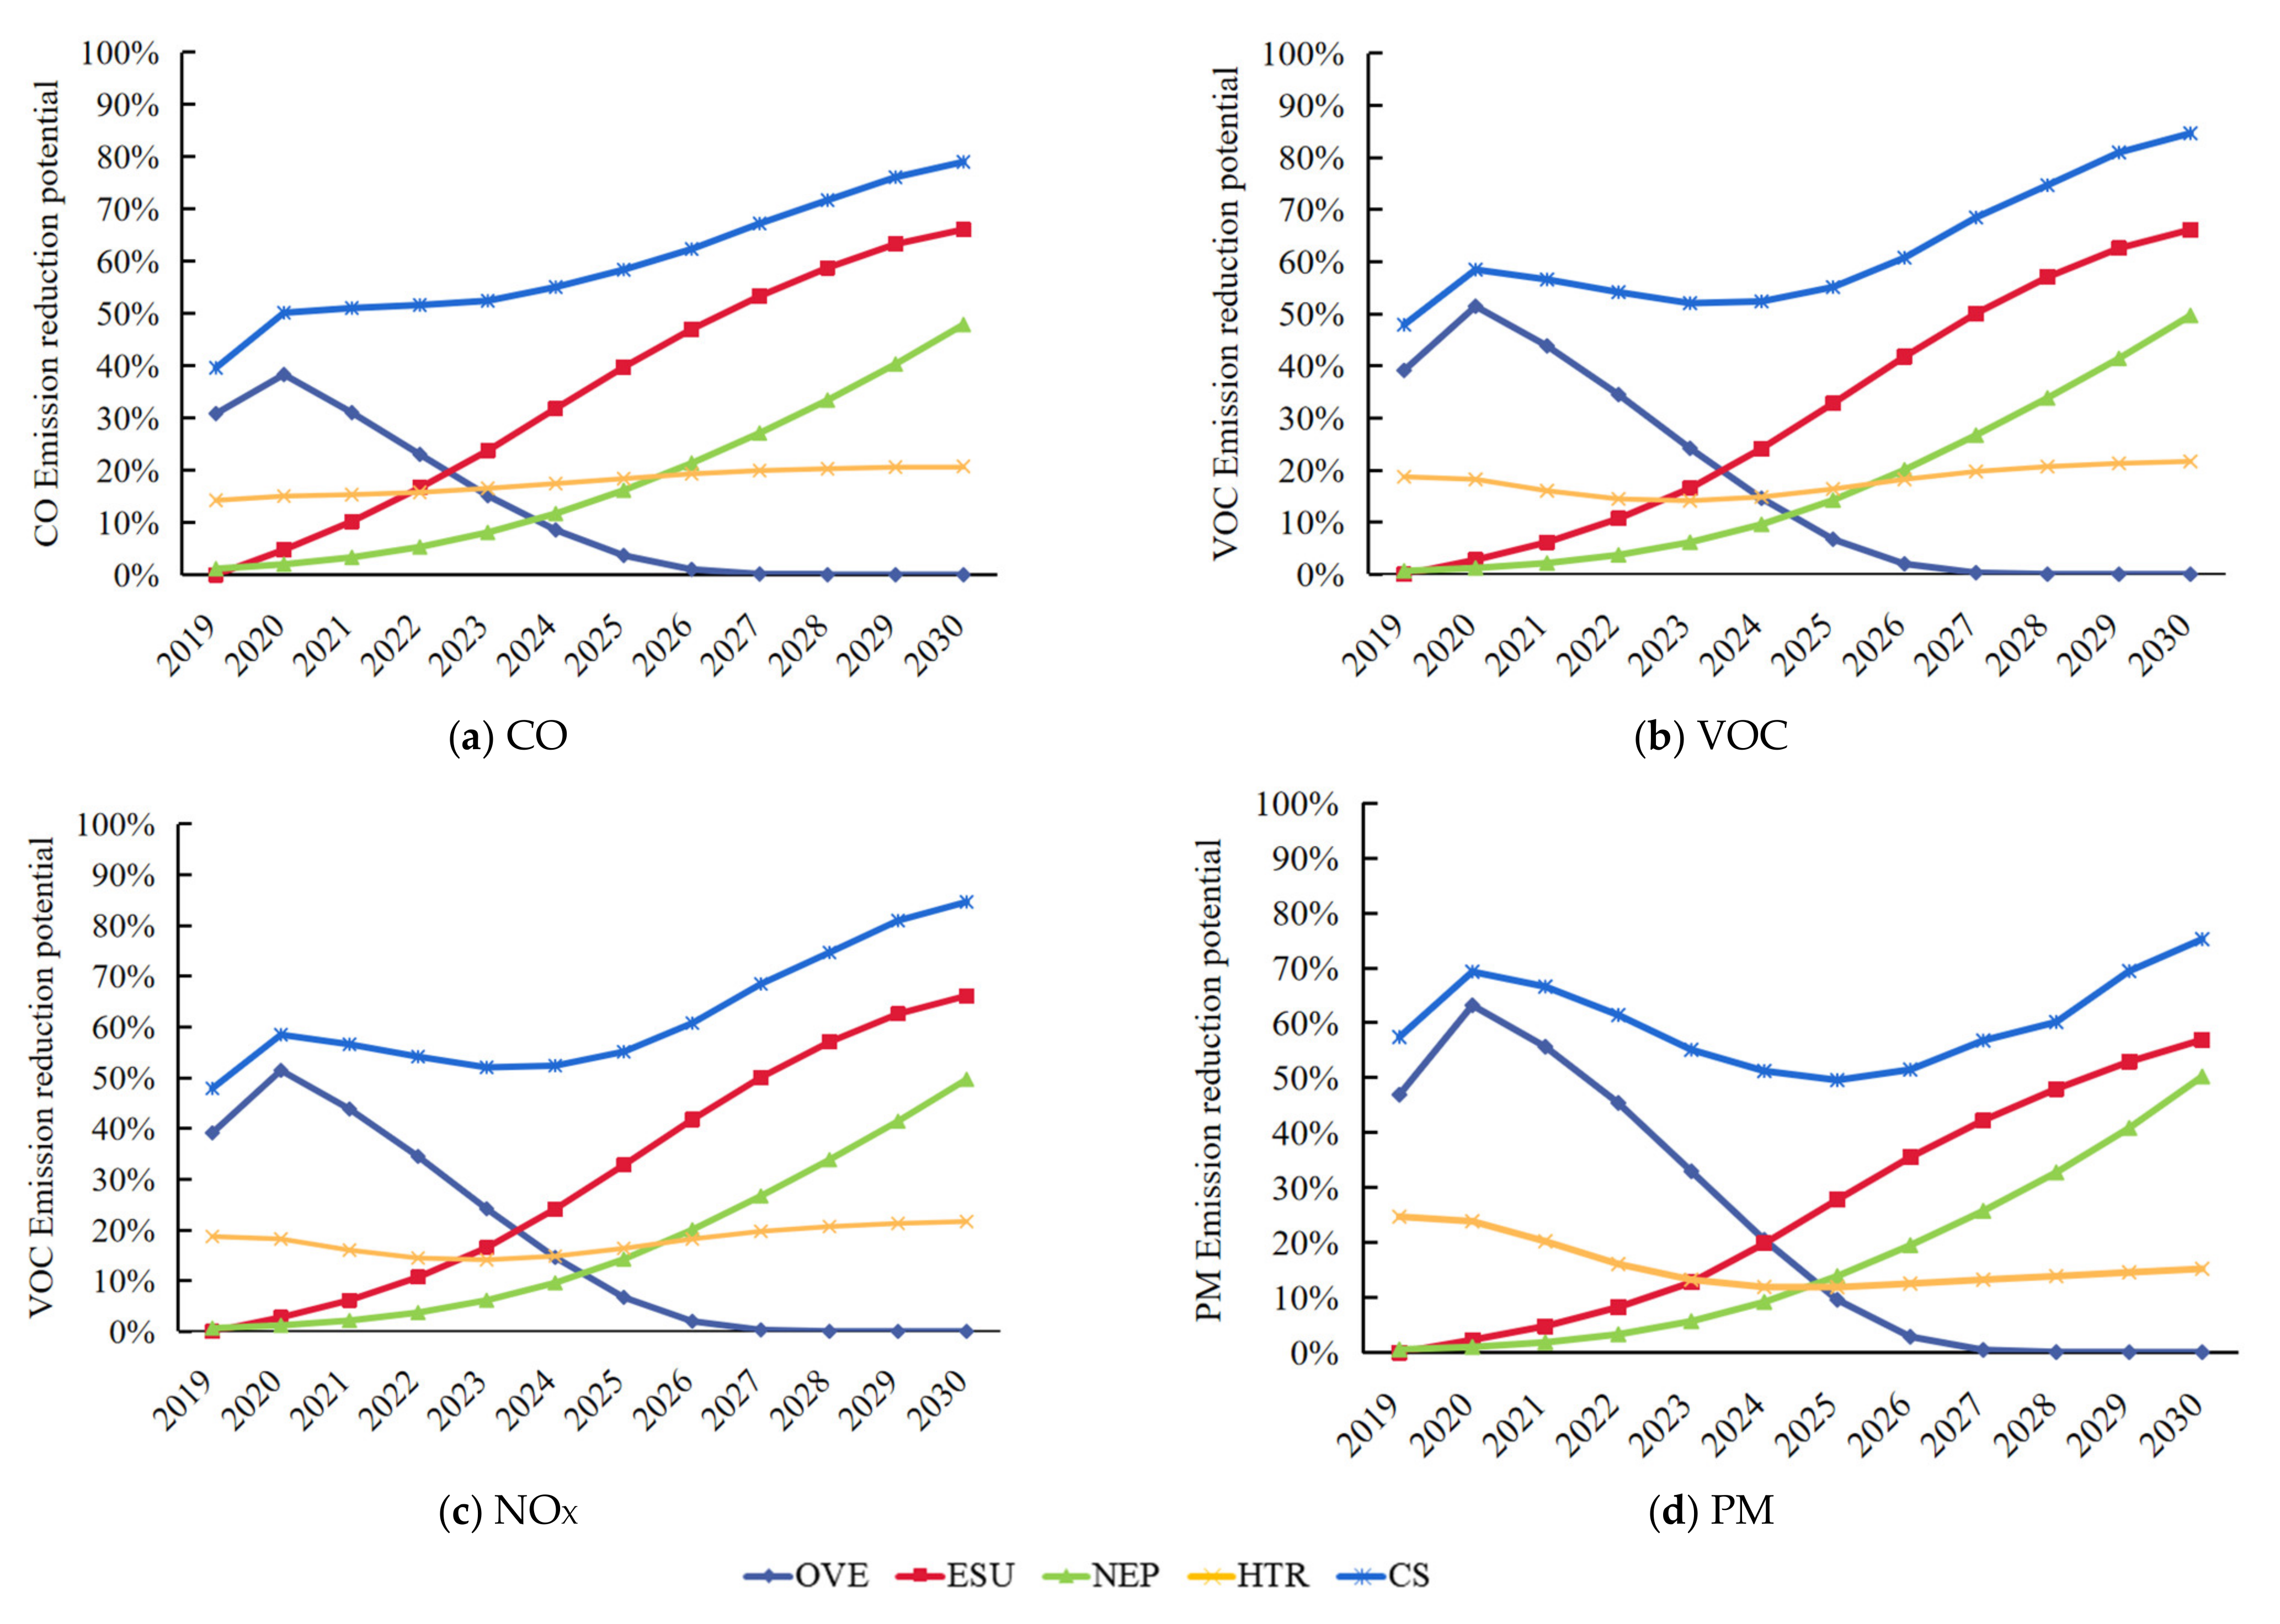
The emission reduction potential in this study was defined as the difference between pollutant emissions under policy scenarios and the BAU scenario, which could reflect the reduction effect from the specific control measures for diesel vehicles. Figure 4 shows the projected pollutant emission reduction potentials for diesel vehicles in Beijing, from 2019 to 2030, under different policy scenarios. Figures S3 and S4 show the projected pollutant emission reduction potentials for diesel vehicles in Tianjin and Hebei. Obviously, the CS scenario has the highest emission reduction potential. It was projected that the pollutant emissions from diesel vehicles could be mostly reduced by 75.2–84.6%, 88.4–94.5%, and 88.5–92.8%, respectively, for Beijing, Tianjin, and Hebei by 2030. In comparison, the CS scenario had better emission reduction effects for diesel vehicles in Tianjin and Hebei provinces than in Beijing. This may be due to the higher pollution levels and lower control standards presently used in both areas.
By comparing the reduction effect under different policy scenarios, it was found that the ESU scenario could have the best emission reduction effect in the long term, and the greatest emission reduction potential could be achieved for CO. The CO emission reduction potentials of diesel vehicles in Beijing, Tianjin, and Hebei provinces were 66.1%, 43.1%, and 72.6%, respectively. The OVE scenario in Beijing over the short term could have the best emission reduction effects for diesel vehicles, especially for VOC and PM, which reached 63.2% and 51.4%, respectively, in 2020. In a later period, this emission reduction potential could gradually weaken due to a reduction in old vehicles. The pollutant emission reduction potential in this region could remain stable under the HTR scenario, causing a considerable reduction effect, especially for Tianjin and Hebei. Under the NEP scenario, the emission reduction potentials for diesel vehicles in the BTH region could increase year after year. In comparison, this had a greater potential of reducing emissions from diesel vehicles in Beijing. The CO, VOC, NOX, and PM from diesel vehicles could be reduced by 47.9%, 49.7%, 54.4%, and 50.2%, respectively, by 2030.
4.2.2. Emission Reduction Potential of Different Types of Vehicles
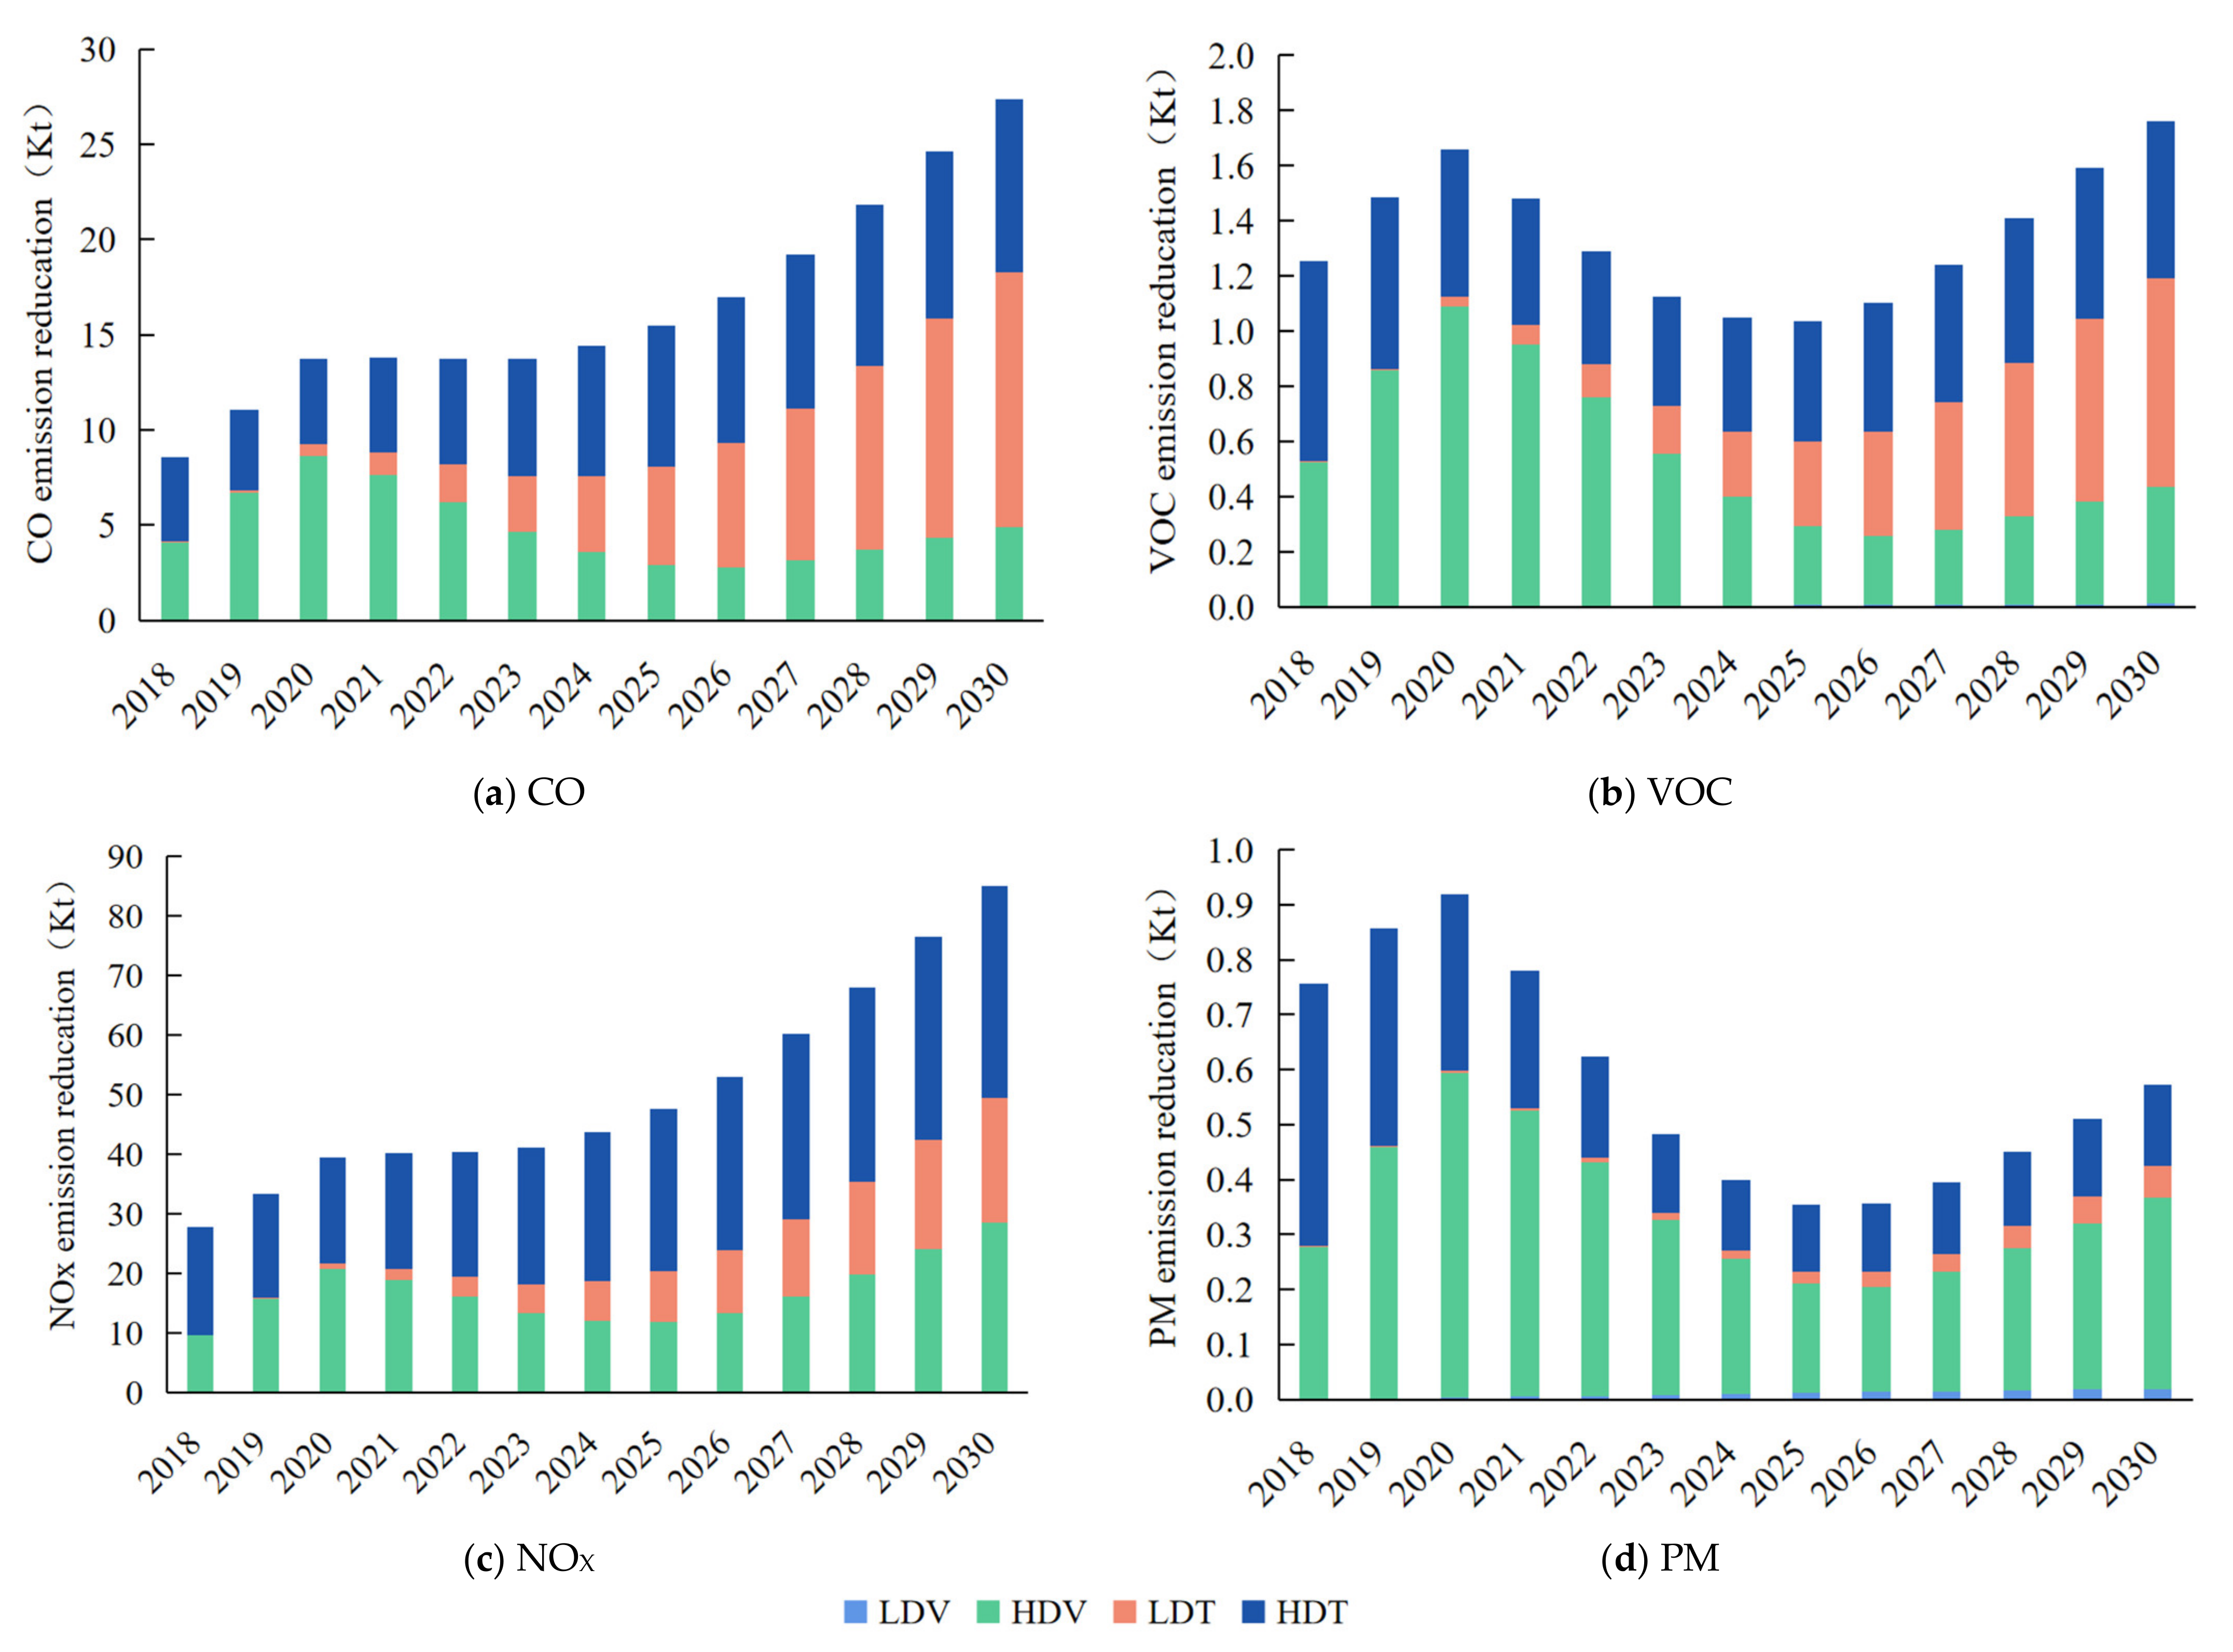
A detailed analysis of the emission reduction potential of different types of diesel vehicles could be valuable in order to formulate more efficient policy options for diesel vehicles. This study calculated the emission reduction potential of four diesel vehicle types under a comprehensive scenario in the BTH region, and conducted comparative analyses to determine the emission reduction potential. The results in Beijing are presented in Figure 5. Figures S5 and S6 show pollutant emission reductions in diesel vehicles under the CS scenario in Tianjin and Hebei.
For Beijing, the reduction from heavy diesel vehicles (HDVs) could contribute more compared with the other types of diesel vehicles in the short term. It could also lead to a considerable reduction in heavy diesel vehicle (HDT). From 2024, the light diesel truck (LDT) would begin to more conspicuously contribute to this reduction. This is similar for Tianjin and Hebei, with an overwhelmingly great proportion of emission reductions coming from HDT, accounting for 48.7–86.6% and 66.2–93.4%, respectively. LDT could contribute to some abatement in later years.
4.3. Comparison with Other Studies and Uncertainty Analysis
4.3.1. Comparison with Other Studies
This study summarized all similar studies in the published literature and performed a comparative analysis. Figure S7 presents a comparison with other studies. At the urban level, the results of the calculated emissions in this study for diesel vehicles in Beijing and Tianjin were close to those in Tangshan, as calculated by Wang [46]. However, the emissions of diesel vehicles in the BTH region (excluding NOX) estimated in this study were slightly lower than those in other studies [18,47,48,49,50]. There were several main reasons for this difference. Other studies were conducted in earlier years, and the calculated results of diesel emissions were higher due to the large number of high-emission vehicles and the higher emission factors; moreover, most of the studies were focused on motor vehicles, which may overestimate emissions from diesel vehicles. This comparison with other studies suggested that the results are reasonable and reliable.
4.3.2. Uncertainty Analysis
There were inevitably some uncertainties during the calculation of pollution emissions from diesel vehicles, probably due to inaccurate data regarding the motor vehicle population and deviations in the model output [51]. Monte Carlo simulation is an important statistical method that is widely used in uncertainty analysis for the estimation of pollutant emissions. It can simulate the uncertainty range of dependent variables based on the mathematical distribution and the coefficients of variation (CV, the standard deviation divided by the mean) of the independent variable and the relationship between them This method first needs to determine the mathematical distribution and the variables’ coefficient of variation (CV). Since vehicle populations in the BTH region came from a statistical yearbook, uncertainty is relatively low. Assuming the data were normally distributed, the CV was 5%. Previous studies found that uncertainty regarding annual average kilometers were slightly higher than the vehicle population, and the CV was usually around 10–30% [20,52,53]. The annual average kilometers in this study was obtained from official statistical reports, assuming that the data were normally distributed and the CV was 30%. According to previous studies [31,53], the four pollutant emission factors were lognormal distribution for all types of diesel vehicles. The CV of the CO, VOC, and NOX emission factors was 17%, while the CV of the PM emission factors was 34%. In addition, the number of tests was set as 100,000 to ensure the accuracy of the estimation results. The experimental results are shown in Figure S8.
The results showed that the uncertainty ranges for CO, VOC, NOX, and PM emissions from diesel vehicles in the BTH region (confidence interval was 95%) were −21–23%, −23–26%, −24–27%, and −34–43%, respectively. In this study, vehicle population data were obtained from the traffic administration and may be considered as having very low uncertainty. The main sources of uncertainty are from diesel vehicle kilometers traveled and emission factors, as well as model uncertainty. By comparison with other studies [54,55,56,57], the lower uncertainty of diesel vehicle emissions in this study indicates the reliability of the methodology. In order to further reduce the uncertainty in the calculation of pollutant emissions from diesel vehicles, more field surveys need to be carried out, with attention paid to the population and distance traveled by diesel vehicles. To further reduce the uncertainty of diesel vehicle emission inventories, measuring the actual emission factors under real-world driving conditions or using real-time traffic flow data be important.
5. Conclusions
This study aimed to project the pollutant emissions from diesel vehicles in the BTH region, from 2019 to 2030, in order to explore the reduction potential for all kinds of diesel vehicles and compare the reduction effect under different policy scenarios. CO and NOx emissions from diesel vehicles in this region could increase by 104.8% and 83.9%, respectively, if no additional control measures are adopted over the next few decades. However, the diesel vehicular emissions could decrease by 74.8–94.0% by 2030 compared to those of 2018 if all the possible measures are implemented. The reduction effect of control measures to diesel vehicles could also be considerable. Particularly, the emission reduction potential of HDT could be greater than 70%. When comparing the effects caused by different control measures, the effects of emission reductions under the ESU scenario could gradually increase and the PM emissions could be reduced by 82.6%. In addition, the NEP scenario could also achieve a considerable reduction effect. Diesel vehicles could have great emission reduction effect under the HTR scenario for Tianjin and Hebei provinces, while the OVE scenario could only have a considerable reduction effect in the short term. The emission reduction could be mainly influenced by HDV and HDT in Beijing, while HDT could contribute an overwhelmingly large proportion of emission reductions in Tianjin and Beijing.
Therefore, it is very important to continuously update emission standards for new diesel vehicles. It should to noted more time may be required for vehicle manufacturers to develop reliable treatment facilities in order to meet new emissions standards. The electrification of diesel vehicles seemed be effective measures. However, the indirect emission from the power producers should be considered. The adoption of highway to railway measures is encouraged due to their favorable reduction effects, and local governments should strengthen the capacity of the construction of railway transportation. Controlling heavy diesel trucks should be prioritized in the BTH region. To explore the change in air quality caused by possible control measures for diesel vehicles, further work should be conducted to simulate the variations of pollutant concentrations (especially PM2.5 and O3) under different policy scenarios.
Supplementary Materials
The following supporting information can be downloaded at: https://www.mdpi.com/article/10.3390/atmos13050776/s1. Figure S1: The projected population of different types of diesel vehicles in the BTH region. Figure S2: The projected VKT of different types of diesel vehicles in the BTH region. Figure S3: Prediction of pollutant emission reduction potentials from diesel vehicles under different policy scenarios in Tianjin. Figure S4: Prediction of pollutant emission reduction potentials from diesel vehicles under different policy scenarios in Hebei. Figure S5: Pollutant emission reductions in diesel vehicles under the CS scenario in Tianjin. Figure S6: Pollutant emission reductions in diesel vehicles under the CS scenario in Hebei. Figure S7: Comparison with other studies. Figure S8: The distribution map of uncertainty analysis. Table S1: Vehicle categories in this study corresponding with those in COPERT.
Author Contributions
Conceptualization, X.G. (Xiurui Guo) and Y.L.; methodology, X.G. (Xiurui Guo); validation, X.G. (Xiurui Guo); formal analysis, Y.L. and D.C.; investigation, D.C.; data curation, X.G. (Xiaoqian Gong); writing—original draft preparation, Y.L.; writing—review and editing, X.G. (Xiurui Guo) and D.C. All authors have read and agreed to the published version of the manuscript.
Funding
This study was funded by the National Natural Science Foundation of China (No. 51978011).
Acknowledgments
This paper represents the perspectives of the authors and does not necessarily represent the official views of our sponsors. We would like to appreciate the anonymous reviewers for their valuable comments and suggestions to improve the manuscript.
Conflicts of Interest
The authors declare no conflict of interest.
References
- China Mobile Source Environmental Management Annual Report. Available online: http://www.mee.gov.cn/hjzl/sthjzk/ydyhjgl/201909/P020190905586230826402.pdf (accessed on 25 February 2022). (In Chinese)
- Song, C.B.; Ma, C.; Zhang, Y.J.; Wang, T.; Wu, L.; Peng, W.; Yan, L.; Li, Q.; Zhang, J.S.; Dai, Q.L.; et al. Heavy-duty diesel vehicles dominate vehicle emissions in a tunnel study in northern China. Sci. Total Environ. 2018, 637, 431–442. [Google Scholar] [CrossRef] [PubMed]
- Li, X.; Dallmann, T.R.; May, A.A.; Presto, A. Seasonal and Long-Term Trend of on-Road Gasoline and Diesel Vehicle Emission Factors Measured in Traffic Tunnels. Appl. Sci. 2020, 10, 2458. [Google Scholar] [CrossRef] [Green Version]
- He, Y.X.; Chang, Y.H.; Zhang, H.Y.; Guo, S.X.; Bai, Y.J.; Gao, S.; Guo, Z.B. Emission characteristics of particulate emitted by motor vehicles in Nanjing based on PM2.5 sampling in tunnel. Acta Sci. Circumst. 2021, 41, 4430–4438. (In Chinese) [Google Scholar]
- Chong, H.S.; Park, Y.; Kwon, S. Analysis of real driving gaseous emissions from light-duty diesel vehicles. Transp. Res. Part D 2018, 65, 485–499. [Google Scholar] [CrossRef]
- Yang, Z.W.; Liu, Y.; Wu, L.; Martinet, S.; Zhang, Y.; Andre, M.; Mao, H.J. Real-world gaseous emission characteristics of Euro 6b light-duty gasoline- and diesel-fueled vehicles. Transp. Res. Part D 2020, 78, 102215. [Google Scholar] [CrossRef]
- Shen, X.B.; Lv, T.T.; Zhang, X.; Cao, X.Y.; Li, X.; Wu, B.B.; Yao, X.L.; Shi, Y.; Zhou, Q.; Chen, X.; et al. Real-world emission characteristics of black carbon emitted by on-road China IV and China V diesel trucks. Sci. Total Environ. 2021, 799, 149435. [Google Scholar] [CrossRef]
- McCaffery, C.; Zhu, H.W.; Tang, T.B.; Li, C.G.; Karavalakis, G.; Cao, S.; Oshinuga, A.; Burnette, B.; Johnson, K.C.; Durbin, T.D. Real-world NOX emissions from heavy-duty diesel, natural gas, and diesel hybrid electric vehicles of different vocations on California roadways. Sci. Total Environ. 2021, 784, 147224. [Google Scholar] [CrossRef]
- Huang, Y.H.; Yam, Y.S.; Lee, C.K.; Organ, B.; Zhou, J.L.; Surawski, N.C.; Chan, E.F.; Hong, G. Tackling nitric oxide emissions from dominant diesel vehicle models using on-road remote sensing technology. Environ. Pollut. 2018, 243, 1177–1185. [Google Scholar] [CrossRef]
- Bernard, Y.; Tietge, U.; German, J.; Muncrief, R. Determination of Real-World Emissions from Passenger Vehicles Using Remote Sensing Data; The Real Urban Emissions Initiative: London, UK, 2018. [Google Scholar]
- Hao, L.; Yin, H.; Wang, J.; Wang, X.; Ge, Y. Remote sensing of NO emission from light-duty diesel vehicle. Atmos. Environ. 2020, 242, 117799. [Google Scholar] [CrossRef]
- McDonald, B.C.; McKeen, S.A.; Cui, Y.Y.; Ahmadov, R.; Kim, S.W.; Frost, G.J.; Pollack, I.B.; Peischl, J.; Ryerson, T.B.; Holloway, J.S.; et al. Modeling Ozone in the Eastern U.S. using a Fuel-Based Mobile Source Emissions Inventory. Environ. Sci. Technol. 2018, 52, 7360–7370. [Google Scholar] [CrossRef]
- Singh, N.; Mishra, T.; Banerjee, R. Emission inventory for road transport in India in 2020: Framework and post facto policy impact assessment. Environ. Sci. Pollut. Res. 2021, 29, 20844–20863. [Google Scholar] [CrossRef] [PubMed]
- Jo, H.; Kim, H. Developing a Traffic Model to Estimate Vehicle Emissions: An Application in Seoul, Korea. Sustainability 2021, 13, 9761. [Google Scholar] [CrossRef]
- Zhang, S.; Wu, Y.; Zhao, B.; Wu, X.; Shu, J.; Hao, J. City-specific vehicle emission control strategies to achieve stringent emission reduction targets in China’s Yangtze River Delta region. J. Environ. Sci. 2017, 51, 75–87. [Google Scholar] [CrossRef] [PubMed]
- Li, B.; Liu, Z.; You, X.; Huang, Y. Emission and Characteristics of Vehicle Exhausts in Changsha-Zhuzhou-Xiangtan Area of Hunan Province. Environ Sci. Tech. 2016, 39, 167–173. (In Chinese) [Google Scholar]
- Yun, W. Alternative Fuel (Natural Gas) for Motor Vehicles vs. PM2.5 in Guanzhong Area Impact and Emission Reduction Analysis; Chang’an University: Xi’an, China, 2015. (In Chinese) [Google Scholar]
- Gu, X.; Yin, S.; Lu, X.; Zhang, H.; Wang, L.; Bai, L.; Wang, C.; Zhang, R.; Yuan, M. Recent development of a refined multiple air pollutant emission inventory of vehicles in the Central Plains of China. J. Environ. Sci. 2019, 84, 80–96. [Google Scholar] [CrossRef] [PubMed]
- Li, Y.; Lv, C.; Yang, N.; Liu, H.; Liu, Z. A study of high temporal-spatial resolution greenhouse gas emissions inventory for on-road vehicles based on traffic speed-flow model: A case of Beijing. J. Clean. Prod. 2020, 277, 122419. [Google Scholar] [CrossRef]
- Sun, S.; Sun, L.; Liu, G.; Zou, C.; Wang, Y.; Wu, L.; Mao, H. Developing a vehicle emission inventory with high temporal-spatial resolution in Tianjin, China. Sci. Total Environ. 2021, 776, 145873. [Google Scholar] [CrossRef]
- Song, H.; Deng, S.X.; Lu, Z.Z.; Li, J.H.; Ba, L.M.; Wang, J.F.; Sun, Z.G.; Li, G.H.; Jiang, C.; Hao, Y.Z. Scenario analysis of vehicular emission abatement procedures in Xi’an, China. Environ. Pollut. 2021, 269, 116187. [Google Scholar] [CrossRef]
- Li, F.; Zhuang, J.; Cheng, X.; Li, M. Investigation and Prediction of Heavy-Duty Diesel Passenger Bus Emissions in Hainan Using a COPERT Model. Atmosphere 2019, 10, 106. [Google Scholar] [CrossRef] [Green Version]
- Zhou, J.; Tie, X.; Yu, Y.; Zhao, S.; Li, G.; Liu, S.; Zhang, T.; Dai, W. Impact of the Emission Control of Diesel Vehicles on Black Carbon (BC) Concentrations over China. Atmosphere 2020, 11, 696. [Google Scholar] [CrossRef]
- Xue, Y.; Wu, T.; Cui, Y.; Gong, B.; Li, X.; Qin, X.; Cao, X.; Liu, X.; Ai, Y.; Han, J.; et al. Energy consumption and pollutant emission of diesel-fired combustion from 2009 to 2018 in Beijing, China. J. Environ. Manag. 2021, 285, 112137. [Google Scholar] [CrossRef] [PubMed]
- 2019 The China Statistical Yearbook. Available online: http://www.stats.gov.cn/tjsj/ndsj/2019/indexch.htm (accessed on 25 February 2022). (In Chinese)
- Report on Air Quality Status of 74 Cities in April 2018. Available online: http://www.mee.gov.cn/hjzl/dqhj/cskqzlzkyb/201806/P020180608504987081400.pdf (accessed on 25 February 2022). (In Chinese)
- Technical Guide for Compiling Air Pollutant Emission List of Road Motor Vehicles. Available online: http://www.mee.gov.cn/gkml/hbb/bgg/201501/W020150107594587831090.pdf (accessed on 25 February 2022). (In Chinese)
- Technical Specifications for Safety of Power-Driven Vehicles Operating on Roads (GB7258-2017). Available online: http://jtgl.beijing.gov.cn/jgj/resource/cms/2018/02/2018020216122563362.pdf (accessed on 25 February 2022). (In Chinese)
- Road Traffic Management—Types of Motor Vehicles (GA802-2019). Available online: http://jjzd.yiyang.gov.cn/uploadfiles/202003/20200310142619634001.pdf (accessed on 25 February 2022). (In Chinese)
- Qiu, F.M. Energy Conservation and Emission Reduction Potential of Road Transportation Sector and Its Path Based on COPERT Model: A Case Study of Beijing-Tianjin-Hebei Region; Tianjin University: Tianjin, China, 2016. (In Chinese) [Google Scholar]
- Guo, X.R.; Fu, L.W.; Ji, M.S.; Lang, J.L.; Chen, D.S.; Cheng, S.Y. Scenario analysis to vehicular emission reduction in Beijing-Tianjin-Hebei (BTH) region, China. Environ. Pollut. 2016, 216, 470–479. [Google Scholar] [CrossRef] [PubMed]
- Hao, H.; Wang, H.; Ouyang, M.; Cheng, F. Vehicle survival patterns in China. Sci. China Technol. Sci. 2011, 54, 625–629. [Google Scholar] [CrossRef]
- Rith, M.; Soliman, J.; Fillone, A.; Biona, J.B.M.; Lopez, N.S. Analysis of Vehicle Survival Rates for Metro-Manila. In Proceedings of the 2018 IEEE 10th International Conference on Humanoid, Nanotechnology, Information Technology, Communication and Control, Environment and Management (HNICEM), Baguio, Philippines, 29 November 2018; pp. 1–4. [Google Scholar]
- Liu, Q. Study on emission characteristics of motor vehicle pollutants in Honghe Prefecture. Environ. Sci. Guide 2020, 39, 79–83. (In Chinses) [Google Scholar]
- Lv, W.; Hu, Y.; Li, E.; Liu, H.; Pan, H.; Ji, S.; Hayat, T.; Alsaedi, A.; Ahmad, B. Evaluation of vehicle emission in Yunnan province from 2003 to 2015. J. Clean. Prod. 2019, 207, 814–825. [Google Scholar] [CrossRef]
- Wang, Z.; Wang, J.; Hu, S. Study on characteristics and share rate of Vehicle exhaust emission in Hefei. J. Hefei Univ. Technol. 2018, 41, 539–544. (In Chinese) [Google Scholar]
- Ou, S.; Yu, R.; Lin, Z.; Ren, H.; He, X.; Przesmitzki, S.; Bouchard, J. Intensity and daily pattern of passenger vehicle use by region and class in China: Estimation and implications for energy use and electrification. Mitig. Adapt. Strateg. Glob. Change 2020, 25, 307–327. [Google Scholar] [CrossRef]
- Sun, S.; Jin, J.; Lv, J.; Sun, L.; Zou, C.; Liu, Y.; Liu, G.; Wang, T.; Wang, L.; Mao, H. Establish vehicle emission inventory based on refined annual mileage. China Environ. Sci. 2020, 40, 2018–2029. (In Chinese) [Google Scholar]
- Lang, J.; Cheng, S.; Wei, W.; Zhou, Y.; Wei, X.; Chen, D. A study on the trends of vehicular emissions in the Beijing–Tianjin–Hebei (BTH) region, China. Atmos. Environ. 2012, 62, 605–614. [Google Scholar] [CrossRef]
- Xie, Y.; Yang, F.; Xie, F. Study on Vehicle emission inventory based on COPERT IV model: A case study of Nanjing. Anhui Agric. Sci. Bull. 2017, 23, 96–97. (In Chinese) [Google Scholar]
- Du, H.; Liu, D.; Southworth, F.; Ma, S.; Qiu, F. Pathways for energy conservation and emissions mitigation in road transport up to 2030: A case study of the Jing-Jin-Ji area, China. J. Clean. Prod. 2017, 162, 882–893. [Google Scholar] [CrossRef]
- Sun, S.; Zhao, G.; Wang, T.; Jin, J.; Wang, P.; Lin, Y.; Li, H.; Ying, Q.; Mao, H. Past and future trends of vehicle emissions in Tianjin, China, from 2000 to 2030. Atmos. Environ. 2019, 209, 182–191. [Google Scholar] [CrossRef]
- Action Plan for Tackling the Pollution Control of Diesel Trucks. Available online: http://www.mee.gov.cn/xxgk2018/xxgk/xxgk03/201901/W020190104656772362578.pdf (accessed on 25 February 2022). (In Chinese)
- Liu, Y.-H.; Liao, W.-Y.; Lin, X.-F.; Li, L.; Zeng, X.-L. Assessment of Co-benefits of vehicle emission reduction measures for 2015–2020 in the Pearl River Delta region, China. Environ. Pollut. 2017, 223, 62–72. [Google Scholar] [CrossRef] [PubMed]
- Lin, X.; Lin, W.; Liu, Y.; Li, X.; Ma, J. Curve and law of vehicle survival probability in Guangdong Province. J. Sun Yat-Sen Univ. 2019, 58, 65–73. (In Chinese) [Google Scholar]
- Wang, J.; Gui, H.; Chen, J.; Wang, Z.; Sun, S.; Yang, Z.; Zhang, X.; Mao, H. Study on tangshan Motor Vehicle Emission Inventory and economic benefit of emission reduction. Chin. Environ. Sci. 2021, 41, 5114–5124. (In Chinese) [Google Scholar]
- Gong, M.; Yin, S.; Gu, X.; Xu, Y.; Jiang, N.; Zhang, R. Refined 2013-based vehicle emission inventory and its spatial and temporal characteristics in Zhengzhou, China. Sci. Total Environ. 2017, 599–600, 1149–1159. [Google Scholar] [CrossRef]
- Huang, Y.; Zhao, Y.; Yang, Y.; Xie, Y.; Xie, F.; Xu, L. Research on air Pollutant Emission Inventory of provincial Motor vehicles based on different methods: A case study of Jiangsu Province. Chin. Sci. Technol. Pap. 2017, 12, 346–353. (In Chinese) [Google Scholar]
- Wang, J. Study on Characteristics and Control Policy Evaluation of Vehicle Pollution Emission in Yangtze River Delta; Zhejiang University: Hangzhou, China, 2018. (In Chinese) [Google Scholar]
- Liu, F. Prediction of Diesel Vehicle Emission and Control Scenarios in Beijing-Tianjin-Hebei Region; Beijing University of Technology: Beijing, China, 2018. (In Chinese) [Google Scholar]
- Dey, S.; Caulfield, B.; Ghosh, B. Modelling uncertainty of vehicular emissions inventory: A case study of Ireland. J. Clean. Prod. 2019, 213, 1115–1126. [Google Scholar] [CrossRef]
- Lang, J.; Zhou, Y.; Cheng, S.; Zhang, Y.; Dong, M.; Li, S.; Wang, G.; Zhang, Y. Unregulated pollutant emissions from on-road vehicles in China, 1999–2014. Sci. Total Environ. 2016, 573, 974–984. [Google Scholar] [CrossRef]
- Song, X.; Hao, Y. Vehicular Emission Inventory and Reduction Scenario Analysis in the Yangtze River Delta, China. Int. J. Envion. Res. Public Health 2019, 16, 4790. [Google Scholar] [CrossRef] [Green Version]
- Liu, H.; Man, H.; Cui, H.; Wang, Y.; Deng, F.; Wang, Y.; Yang, X.; Xiao, Q.; Zhang, Q.; Ding, Y.; et al. An updated emission inventory of vehicular VOCs and IVOCs in China. Atmos. Chem. Phys. 2017, 17, 12709–12724. [Google Scholar] [CrossRef] [Green Version]
- Cheewaphongphan, P.; Chatani, S.; Saigusa, N. Exploring Gaps between Bottom-Up and Top-Down Emission Estimates Based on Uncertainties in Multiple Emission Inventories: A Case Study on CH4 Emissions in China. Sustainability 2019, 11, 2054. [Google Scholar] [CrossRef] [Green Version]
- Li, J.; Chen, L.; Shen, W.; Jin, J.; Wang, T.; Wang, P.; Yang, Y.; Liao, H. Improved gridded ammonia emission inventory in China. Atmos. Chem. Phys. 2021, 21, 15883–15900. [Google Scholar] [CrossRef]
- Zhu, C.; Tian, H.; Hao, Y.; Gao, J.; Hao, J.; Wang, Y.; Hua, S.; Wang, K.; Liu, H. A high-resolution emission inventory of anthropogenic trace elements in Beijing-Tianjin-Hebei (BTH) region of China. Atmos. Environ. 2018, 191, 452–462. [Google Scholar] [CrossRef]
Figure 1.
The location of the BTH region in China.

Figure 2.
Diesel vehicle pollutant emissions under the BAU scenario in the BTH region.

Figure 3.
Prediction of pollutant emissions from diesel vehicles under different policy scenarios in the BTH region.
Figure 3.
Prediction of pollutant emissions from diesel vehicles under different policy scenarios in the BTH region.

Figure 4.
Prediction of pollutant emission reduction potential from diesel vehicles under different policy scenarios in Beijing.
Figure 4.
Prediction of pollutant emission reduction potential from diesel vehicles under different policy scenarios in Beijing.

Figure 5.
Pollutant emission reductions in diesel vehicles under the CS scenario in Beijing.


Table 1.
The description of reduction scenarios for vehicles.
| Scenario | Description | Specific Definition | Reference |
|---|---|---|---|
| Business as usual scenario (BAU) | To continue to use the existing emission standards without adding other control measures. | Taking 2018 as the base year and keep the current policy unchanged. | —— |
| Old vehicles elimination (OVE) | To eliminate old diesel vehicles with high emissions. | To eliminate all diesel vehicles below the China III standard by the end of 2020. Since then, diesel vehicles have been eliminated year after year, according to the regulations for mandatory scrapping of motor vehicles. | “Plan of Beijing to Further Promote the Elimination and Renewal of Old High-Emission Motor Vehicles (2020–2021)”. “Regulations of Tianjin on Pollution Prevention and Control of Motor Vehicle and Non-Road Mobile Machinery Emissions”. “Regulations of Hebei Province on Pollution Prevention and Control of Motor Vehicle and Non-Road Mobile Machinery Emissions”. “Provisions on Mandatory Scrapping Standards of Motor Vehicles”. |
| Emission standards upgrade (ESU) | To update the emission standards for diesel vehicles. | To adopt China VIb standards in 2020 for Beijing; China VIb standards in 2019 for LDV for Tianjin and Hebei; China VIa standards in 2021, and China VIb standards in 2023 for HDV for Tianjin and Hebei, respectively. | “Notice on Beijing’s Implementation of the Sixth Phase of Motor Vehicle Emission Standards (Draft for Comment)”. “Announcement on the implementation of the sixth phase of emission standards for motor vehicles” in Tianjin and Heibei provinces. |
| New energy vehicle promotion (NEP) | To promote the use of new energy vehicles. | To increase the sales proportion of new energy vehicles in China by 3% every year since 2019. | “New Energy Automobile Industry Development Plan (2021–2035)”. |
| Highway to railway (HTR) | To increase the amount of freight transported by rail. | To increase the total amount of rail freight by 10% every year since 2019. | “Three-year Action Plan for Promoting the Adjustment of Transportation Structure (2018–2020)”. |
| Comprehensive scenario (CS) | To combine the above control measures effectively. | To integrate the data in the other four emission reduction scenarios. | —— |
Publisher’s Note: MDPI stays neutral with regard to jurisdictional claims in published maps and institutional affiliations. |
© 2022 by the authors. Licensee MDPI, Basel, Switzerland. This article is an open access article distributed under the terms and conditions of the Creative Commons Attribution (CC BY) license (https://creativecommons.org/licenses/by/4.0/).
Share and Cite
MDPI and ACS Style
Guo, X.; Liu, Y.; Chen, D.; Gong, X. Prediction of Emission Reduction Potential from Road Diesel Vehicles in the Beijing–Tianjin–Hebei (BTH) Region, China. Atmosphere 2022, 13, 776. https://doi.org/10.3390/atmos13050776
AMA Style
Guo X, Liu Y, Chen D, Gong X. Prediction of Emission Reduction Potential from Road Diesel Vehicles in the Beijing–Tianjin–Hebei (BTH) Region, China. Atmosphere. 2022; 13(5):776. https://doi.org/10.3390/atmos13050776
Chicago/Turabian StyleGuo, Xiurui, Yao Liu, Dongsheng Chen, and Xiaoqian Gong. 2022. "Prediction of Emission Reduction Potential from Road Diesel Vehicles in the Beijing–Tianjin–Hebei (BTH) Region, China" Atmosphere 13, no. 5: 776. https://doi.org/10.3390/atmos13050776
Note that from the first issue of 2016, this journal uses article numbers instead of page numbers. See further details here.