
An Observational Analysis of a Persistent Extreme Precipitation Event in the Post-Flood Season over a Tropical Island in China

1
Key Laboratory of Meteorological Disaster, Ministry of Education & Collaborative Innovation Center on Forecast and Evaluation of Meteorological Disasters, Nanjing University of Information Science & Technology, Nanjing 210044, China
2
Key Laboratory of South China Sea Meteorological Disaster Prevention and Mitigation of Hainan Province, Haikou 570203, China
3
Hainan Meteorological Service, China Meteorological Administration, Haikou 570203, China
4
Beijing Meteorological Service, China Meteorological Administration, Beijing 100089, China
*
Author to whom correspondence should be addressed.
Atmosphere 2022, 13(5), 679; https://doi.org/10.3390/atmos13050679
Submission received: 8 February 2022
/
Revised: 31 March 2022
/
Accepted: 21 April 2022
/
Published: 23 April 2022
(This article belongs to the Special Issue Meteorological Extremes in China)
Abstract
:Featuring unique tropical land–sea contrast and mesoscale terrain, Hainan Island in China is endowed with active mesoscale convections of special regional characteristics. Persistent extreme precipitation events (PEPs) during the post-flood season, triggered by multi-scale interactions among mid-latitude and tropical weather systems, exhibit notable mesoscale features, long duration and high rainfall rates with low forecasting performance. This study is motivated by a failure to forecast a PEP in two stages with distinct characteristics and predictabilities, in the post-flood season over Hainan Island on 16–18 October 2020. Based on multiple sources of remote sensing and high-resolution rain gauge records, detailed observational analyses were conducted using a flow decomposition method. Water vapor divergence (WVD) and its three components were used to investigate the spatial distribution and temporal evolution of two stages with distinct characteristics and predictabilities during this PEP. Decomposed moisture components can be used to determine how and to what extent large- and sub-synoptic scale moisture convergence contributes to PEPs in the tropics, under similar synoptic backgrounds. Joint applications of multiple sources of remote sensing data and flow decomposed WVD are proposed to further assist predicting PEPs in terms of rainfall location and evolution.
1. Introduction
The recent IPCC report has officially demonstrated that regional persistent extreme precipitation events (PEPs) are increasing in frequency and intensity in many regions and globally [1,2]. Increased persistent precipitations cause fatalities and economic losses, and threaten the ecology of the planet. Intense research has been continuously conducted on the large-scale circulations and moisture budgets of PEPs over East Asia [3], Europe [4], North America [5], and mainland China [6,7,8,9,10,11,12]. Climatological studies on the relationship between increasing global temperatures and precipitation variability [13,14,15] have further suggested that uneven extreme floods and droughts will tend to occur more in future. Besides this uncertainty on a climate scale, mechanisms for the initiation, moisture aggregation and weakening of each individual PEP are not clear from the perspectives of synoptic and sub-synoptic scales. Besides, few works have assessed tropical islands with abundant moisture supplies in the post-flood season against background circulations on planetary and synoptic scales. Unlike the mid-latitudes, the tropics have a relatively homogeneous air mass and fairly uniform distribution of surface temperature and pressure. Therefore, local and mesoscale effects are more dominant than synoptic influences. In recent years, rapid progress has been made in understanding the mechanisms of PEPs over Hainan Island (denoted by the red box in Figure 1a), a tropical island to the south of mainland China, including diurnal cycles in the pre-summer season [16,17] and synoptic characteristics during the post-flood season [18,19,20,21]. Characterized by multiscale features, PEPs in the post-flood season are known to be potentially disastrous, leading to dangers to public safety and property, agriculture, and damage prevention. It is thus reasonable to further explore different signals of large and sub-synoptic scale moisture convergence, to improve forecasting skills for such events.
Moisture budgets are widely used as indicators for locations of and changes in anomalous precipitation [22,23]. Trends and variability of atmospheric water vapor have been studied globally [24,25] and in different regions, such as mainland China [26,27], North America [28], and the tropics [29]. Among the four moisture budget components, i.e., total precipitable water, evaporation, precipitation, and water vapor divergence (WVD), WVD has been identified as the dominant factor [30]. Moisture supply from the South China Sea has been found to play a leading role in PEPs over South China [31,32]. Equipped with abundant water vapor, the northeasterly low-level jet over the north South China Sea is known as the most prominent signal of PEPs over Hainan island [18]. Previous studies [19,20,21] have also demonstrated that as a result of multi-scale interactions between large-scale and mesoscale circulations, PEPs in the post-flood season involve tropical depression, cold surges, subtropical highs, and mesoscale convective systems (MCSs), etc. Although considerable progress has been made in the understanding of synoptic features, it remains unclear how the mesoscale systems are developed and organized. Due to limited understanding of the multi-scale interactions and model deficiencies, predicting the location and timing of heavy rainfall during these events remains a challenging task.
Flow decomposition approach is a powerful tool to facilitate studies of multi-scale interactions. From synoptic to climatic analysis, statistical tools to reveal averages over time or space are utilized to partition stationary and transient components [23,33]. Barnes filter [34] was adopted to extract synoptic or geostrophic components from the total flow in a study of diurnal precipitation in the Meiyu front [35,36]. For mesoscale to synoptic studies, flow decomposition firstly originated from the PV concept established by Hoskins [37] with solid physical foundations. However, mathematical difficulties in solving balanced models and choices of dynamic approximations for extreme events limit its availability and applicability in operational predictions. As a simple decomposition method, the Helmholtz theorem separates wind into rotational and divergent components [38]. The rotational component describes the large-scale movement and can be linked directly to geopotential, while the divergent component depicts ageostrophic or sub-synoptic motions. It has been widely used in atmospheric and oceanic circulations [39,40,41,42,43], as well as data assimilations [44,45,46,47].
Despite considerable research carried out into synoptic understandings [18,19,20,21], the ability to predict PEPs in the post-flood season over Hainan Island in terms of location and timing remains limited due to its association with mesoscale systems. The relationship between sub-synoptic scale processes and rainfall evolution was rarely addressed in the literature, such that more studies are still needed. During 16–18 October 2020, a disastrous PEP occurred over Hainan Island. This was typical in the post-flood season, involving multiscale interactions among systems from mid-latitudes and the tropics, with different forecast performance of NWP in different rainfall stages. The aim of this study is to use various remote sensing data along with other observational datasets to investigate the performance of the decomposed WVD components, where synoptic analysis and numerical prediction failed, in assessing the location and evolution of precipitation during a PEP over Hainan Island.
The remainder of this paper is organized as follows. Section 2 describe the datasets, the water vapor budget equations, and the WVD method adopted in this study. Section 3 presents traditional analyses of the synoptic background, convective organization, and the different performances of numerical forecasts during the two stages. The main results relating to the decomposed WVD in the two stages are provided in Section 4, demonstrating signals associated with the spatial and temporal evolution of rain pattern during this event. Lastly, this paper is summarized in Section 5, along with discussion.
2. Data and Methodology
2.1. Data
2.1.1. Rain Gauge Observations from Local Observatory
Rain gauge observations from an automatic weather station observation network were used to provide rainfall observations over land. There are 558 dense rain gauges from routine surface stations and automatic weather stations (DZZ4) across Hainan Island, with a time interval of 1 h and spatial resolution of 5–20 km. Thus, this dataset is adequate for the sub-synoptic investigations of spatial and temporal precipitation distributions over land.
2.1.2. Radar Observations
The regional radar mosaics of composite reflectivity operationally created by Hainan Meteorological observatory were used to examine the evolution of mesoscale systems. The composite reflectivity (CR) based on 6 S-band Doppler radars in the network of China new generation weather radar (located at the red pins in Figure 1a, including Haikou, Sanya, Dongfang, Xisha, Zhanjiang, and Yangjiang as listed in Table 1) was created every 6 min with a horizontal spatial resolution of about 2.15 km.
2.1.3. Satellite Precipitation Products
The satellite product used in this study is the Climate Prediction Center morphing technique (CMORPH). CMORPH with spatial resolution of 8 km and temporal resolution of 30 min was derived from geostationary satellite infrared imagery to obtain relatively high-quality precipitation estimates from passive low-orbit satellite microwave data. CMOPRH covers rainfall over the ocean, and thus supplemented surface-based rain gauge observations over Hainan Island. The shape and intensity of the precipitation features were morphed during the interval between microwave sensor scans by performing a time weighted linear interpolation [48]. For consistency in temporal resolution, the CMORPH rainfall data and the ERA5 data used in the present study each have a temporal resolution of 1 h.
2.1.4. Reanalysis Data
ERA5 [49] is the fifth generation of the European Center for Medium-Range Weather Forecasts (ECMWF) reanalysis data, which has been significantly upgraded from ERA-Interim [50]. It provides improved spatial and temporal resolutions, with a horizontal grid spacing of 0.25° × 0.25° and a time interval of 1 h at surface and on 37 pressure levels, with variable uncertainties evaluated using ensemble reanalysis products. Historical observational data and satellite products are each used in advanced data assimilation and model systems to estimate atmospheric conditions more accurately. The technique has therefore been widely used to identify and analyze synoptic environmental systems as well as moisture supplies.
Detailed variables from the reanalysis data and local observational datasets adopted in this study are listed in Table 1.
2.2. Water Vapor Budget Equations
The Eulerian atmospheric water budget equation for an atmospheric column of unit area [51,52] is adopted as follows:
where q represents specific humidity, P and E indicate the precipitation and the evaporation from the underlying surface, respectively. Vertical integration is performed between the surface pressure, ps, and top. Due to the impenetrability of the atmosphere, ω vanishes at the surface and the top. Equation (1) becomes:
(1/g) ∫ps0 ∂tq dp + (1/g) ∫ps0 [∇⋅(qv) + ∂p(qω)] dp = P − E,
(1/g) ∫ps0 ∂tq dp + (1/g) ∫ps0 ∇ (qv) dp + E = P.
The first term in the left-hand-side of Equation (2), ∂tq, represents the difference between q at two successive times. According to the literature on water vapor flux budget [52,53,54], the area is relatively small and is bounded within two meridians and latitude circles. The third term in the left-hand-side of Equation (2) can be calculated using the bulk aerodynamic formula [30,55]:
where ρa is the air density, CE is the turbulent exchange coefficient for moisture, U is the 10 m wind speed, qsat(SST) is the saturation specific humidity at the SST, and qa is the 10 m specific humidity. For the studies of cold season precipitation over a small domain with short duration, the influence of E on Equation (2) is less important than the vertically integrated WVD.
E = ρaCEU[qsat(SST) − qa],
2.3. Hybrid-Integral Method for Decomposing WVD in a Limited Mesoscale Domain with Complex Flow Fields
According to the Helmholtz theorem, the horizontal velocity v can be partitioned into rotational and divergent components (denoted by vr and vd) represented by streamfunction ψ and velocity potential χ, respectively, as follows:
where k is the unit vector in the vertical direction and ∇ is the horizontal gradient operator. For a limited domain D, the following relationships hold:
v = vr + vd,
vr = k × ∇ψ,
vd = ∇χ,
∇2ψ = ζ in D,
∇2χ = α in D,
∂nψ + ∂sχ = vs on ∂D,
∂nχ − ∂sψ = vn on ∂D.
Here ζ and α are vorticity and divergence, respectively; ∂D denotes the boundary of domain D; vs and vn are the tangential and normal velocity along ∂D.
Considering the special characteristics of Hainan Island in terms of its mesoscale terrain, a newly developed accurate hybrid-integral scheme [56] was first used to solve ψ and χ. Secondly, Equations (5) and (6) were adopted to obtain vr and vd. Thirdly, the integrand in the second term in the left-hand-side of Equation (2) is calculated as the summation of three components as follows:
The non-divergent property of vr is used in the above derivation. As seen in Equation (9), WVD (denoted by Qvall) is thus partitioned into three components as: flow field divergence (denoted by Qvdiv), moisture convection term by non-divergent or large-scale motions (denoted by QvL) and by divergent or sub-synoptic scale motions (denoted by QvS).
3. Synoptic Analysis of a PEP
3.1. Overviews of Synoptic and Convective Environments
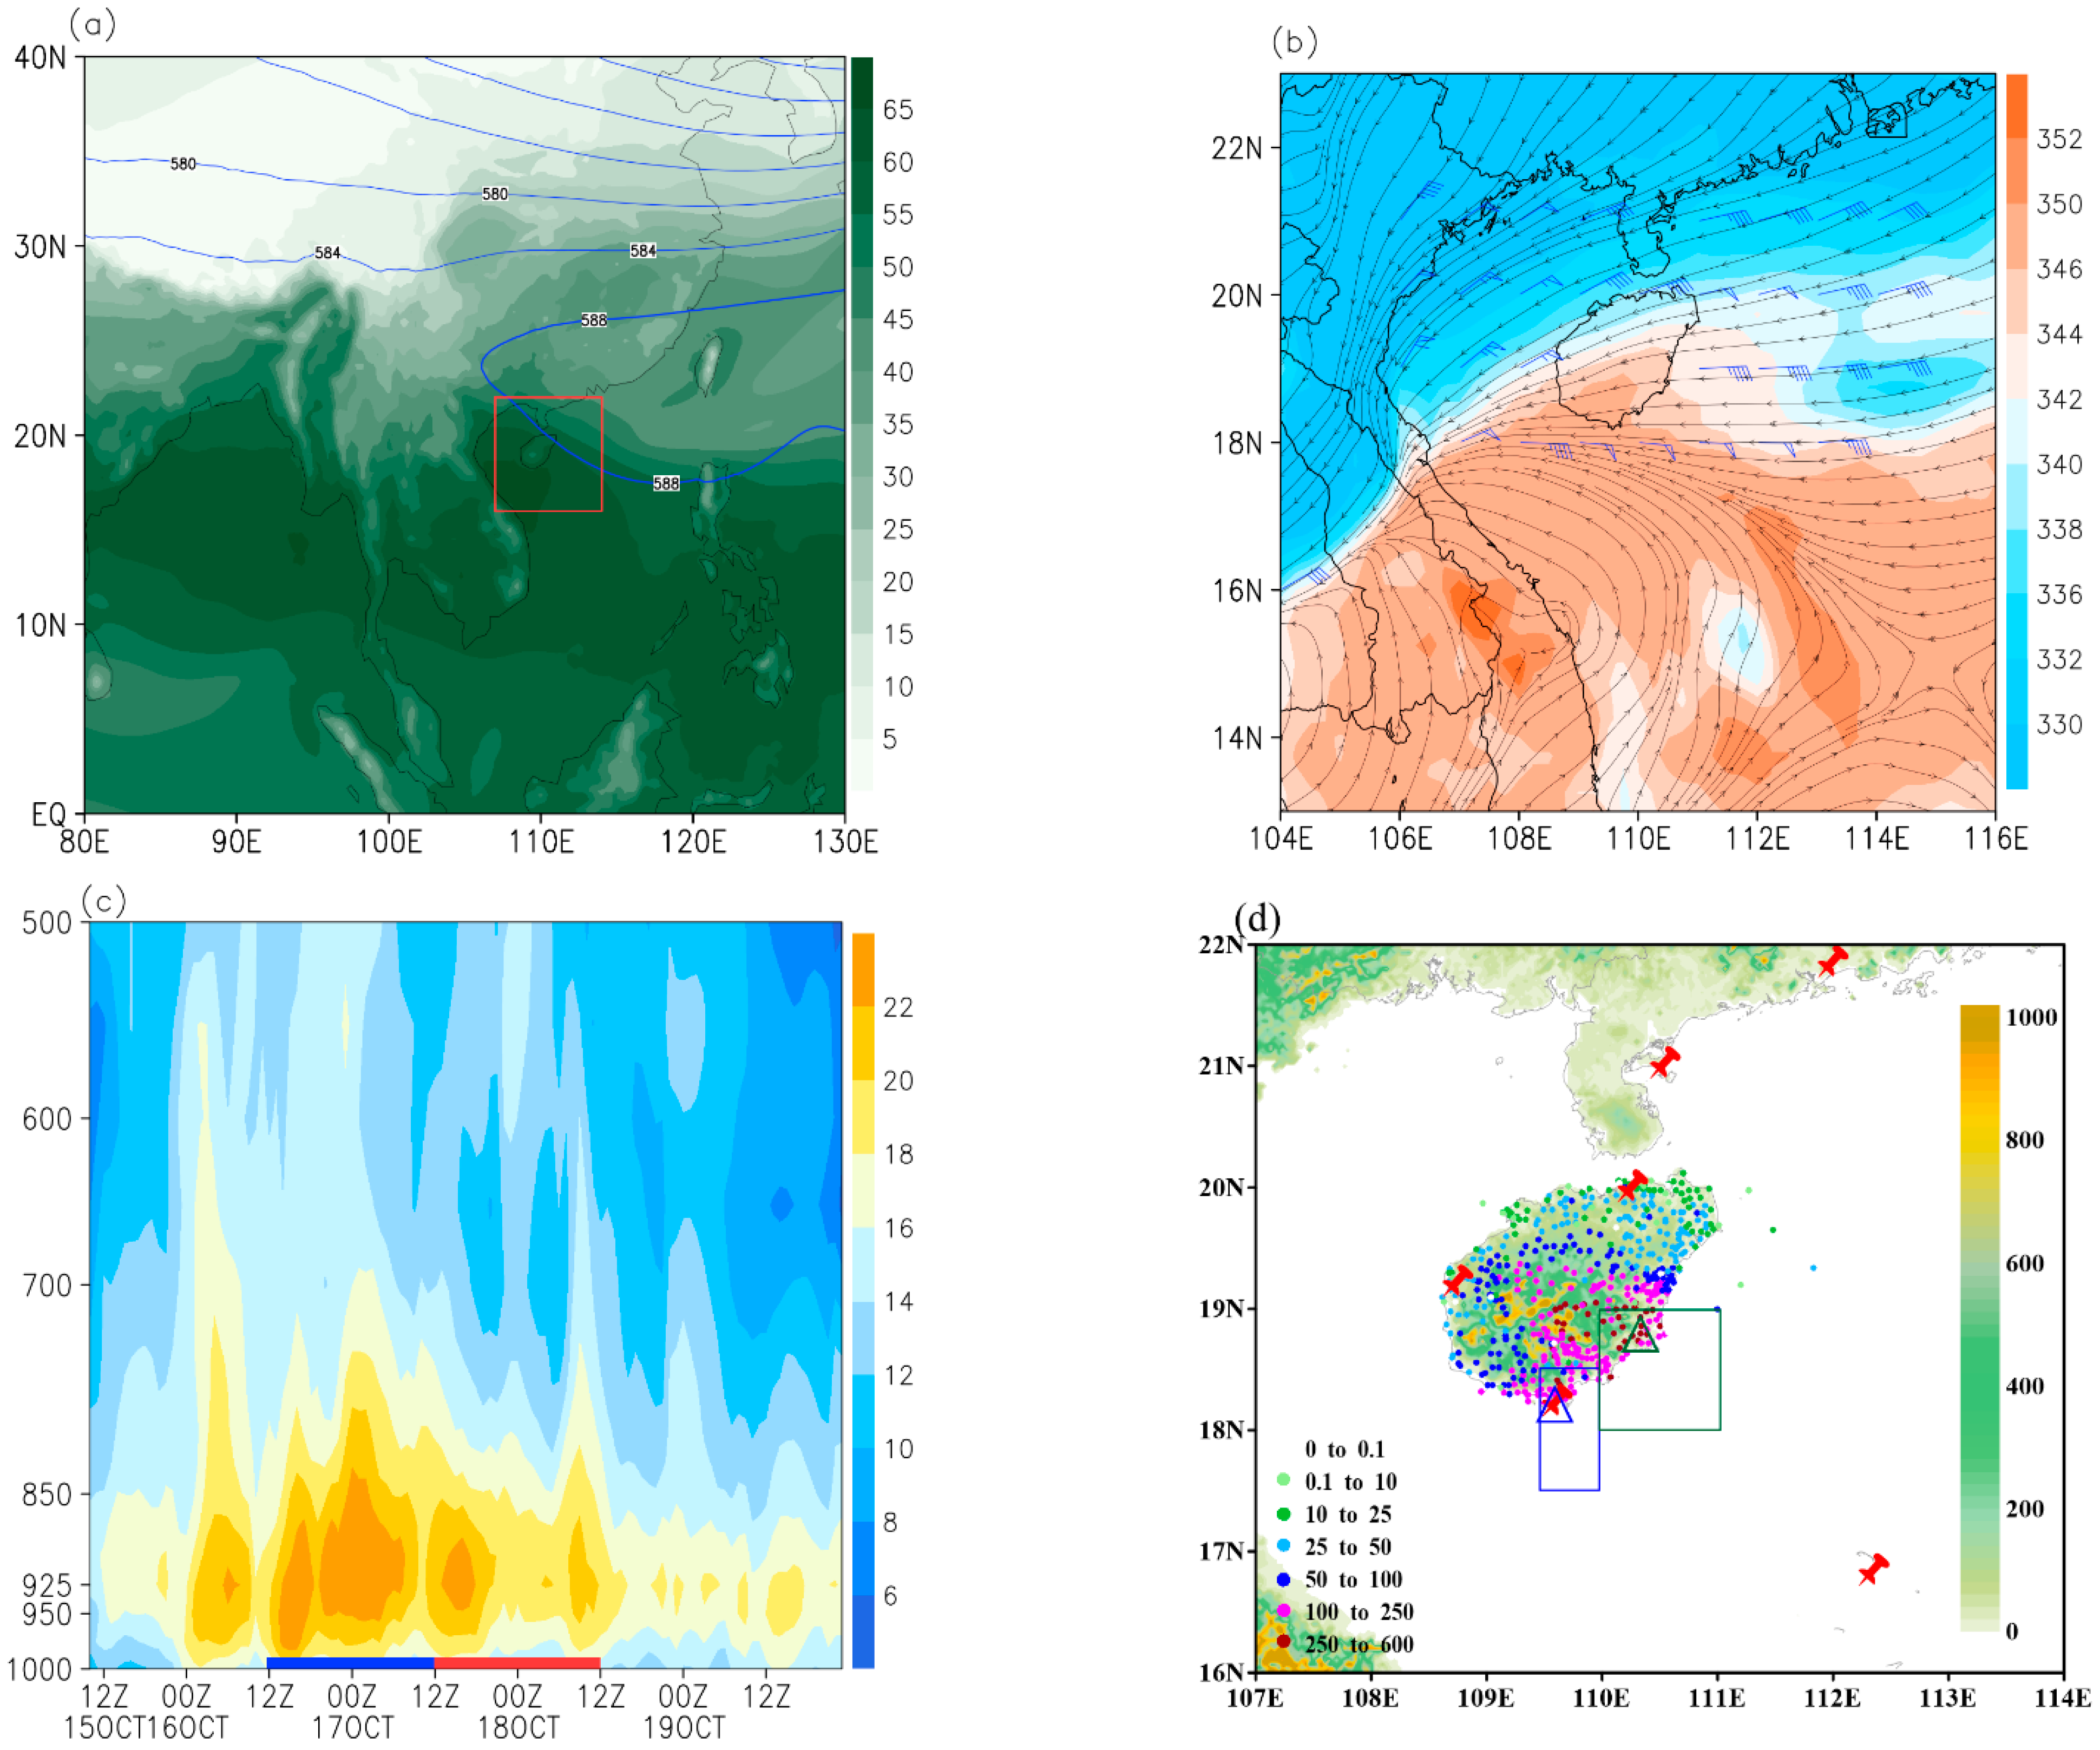
A persistent heavy rainfall occurred over Hainan Island during 16–18 October 2020, which presented a typical synoptic pattern in the post-flood season. Figure 1 shows the large-scale circulations during the event. Hainan Island is in a moist environment with precipitable water over 55 mm, to the southwest of the western Pacific subtropical high (Figure 1a). In the boundary layer, a remnant of a tropical depression of high equivalent potential temperature (θe) moved northwestward towards the north coast of Vietnam, interacting with a cold surge characterized by low θe from mid-latitudes (Figure 1b). Such a pattern gave rise to strong pressure gradients in the planetary boundary layer (PBL) and therefore a persistent notable boundary layer jet (BLJ) over the north of the South China Sea (SCS).
As shown in Figure 1c, a well-defined BLJ at 925 hPa with wind speed over 18 m·s−1 developed upstream of Hainan Island (around 18.5° N, 110° E) starting 0000 UTC 16 October 2020. The horizontal velocity of the BLJ exhibited notable variation and reached its maximum (about 24 m s−1) at around 0000 UTC 17, lasting about 36 h. This strong and persistent BLJ increased abundant horizontal moisture transports, resulting in specific humidity of greater than 16 g kg−1 and a deep moist layer of high relative humidity (85–100%) up to 500 hPa (not shown) over the north SCS. Given such a favorable ambient environment of a deep moist layer and continuous energy supply, a PEP occurred continuously over Hainan Island for a duration of 60 h (Figure 1d), resulting in a maximum accumulated rainfall of 600 mm, with 46 rain gauge stations exceeding 250 mm in the southeast area. Multiple rain gauge stations received hourly rainfall rates exceeding 30 mm·h−1. This PEP affected more than 27,700 people, damaged farm crops over 6.7 thousand hectares and cost nearly 120 million RMB in direct economic losses.
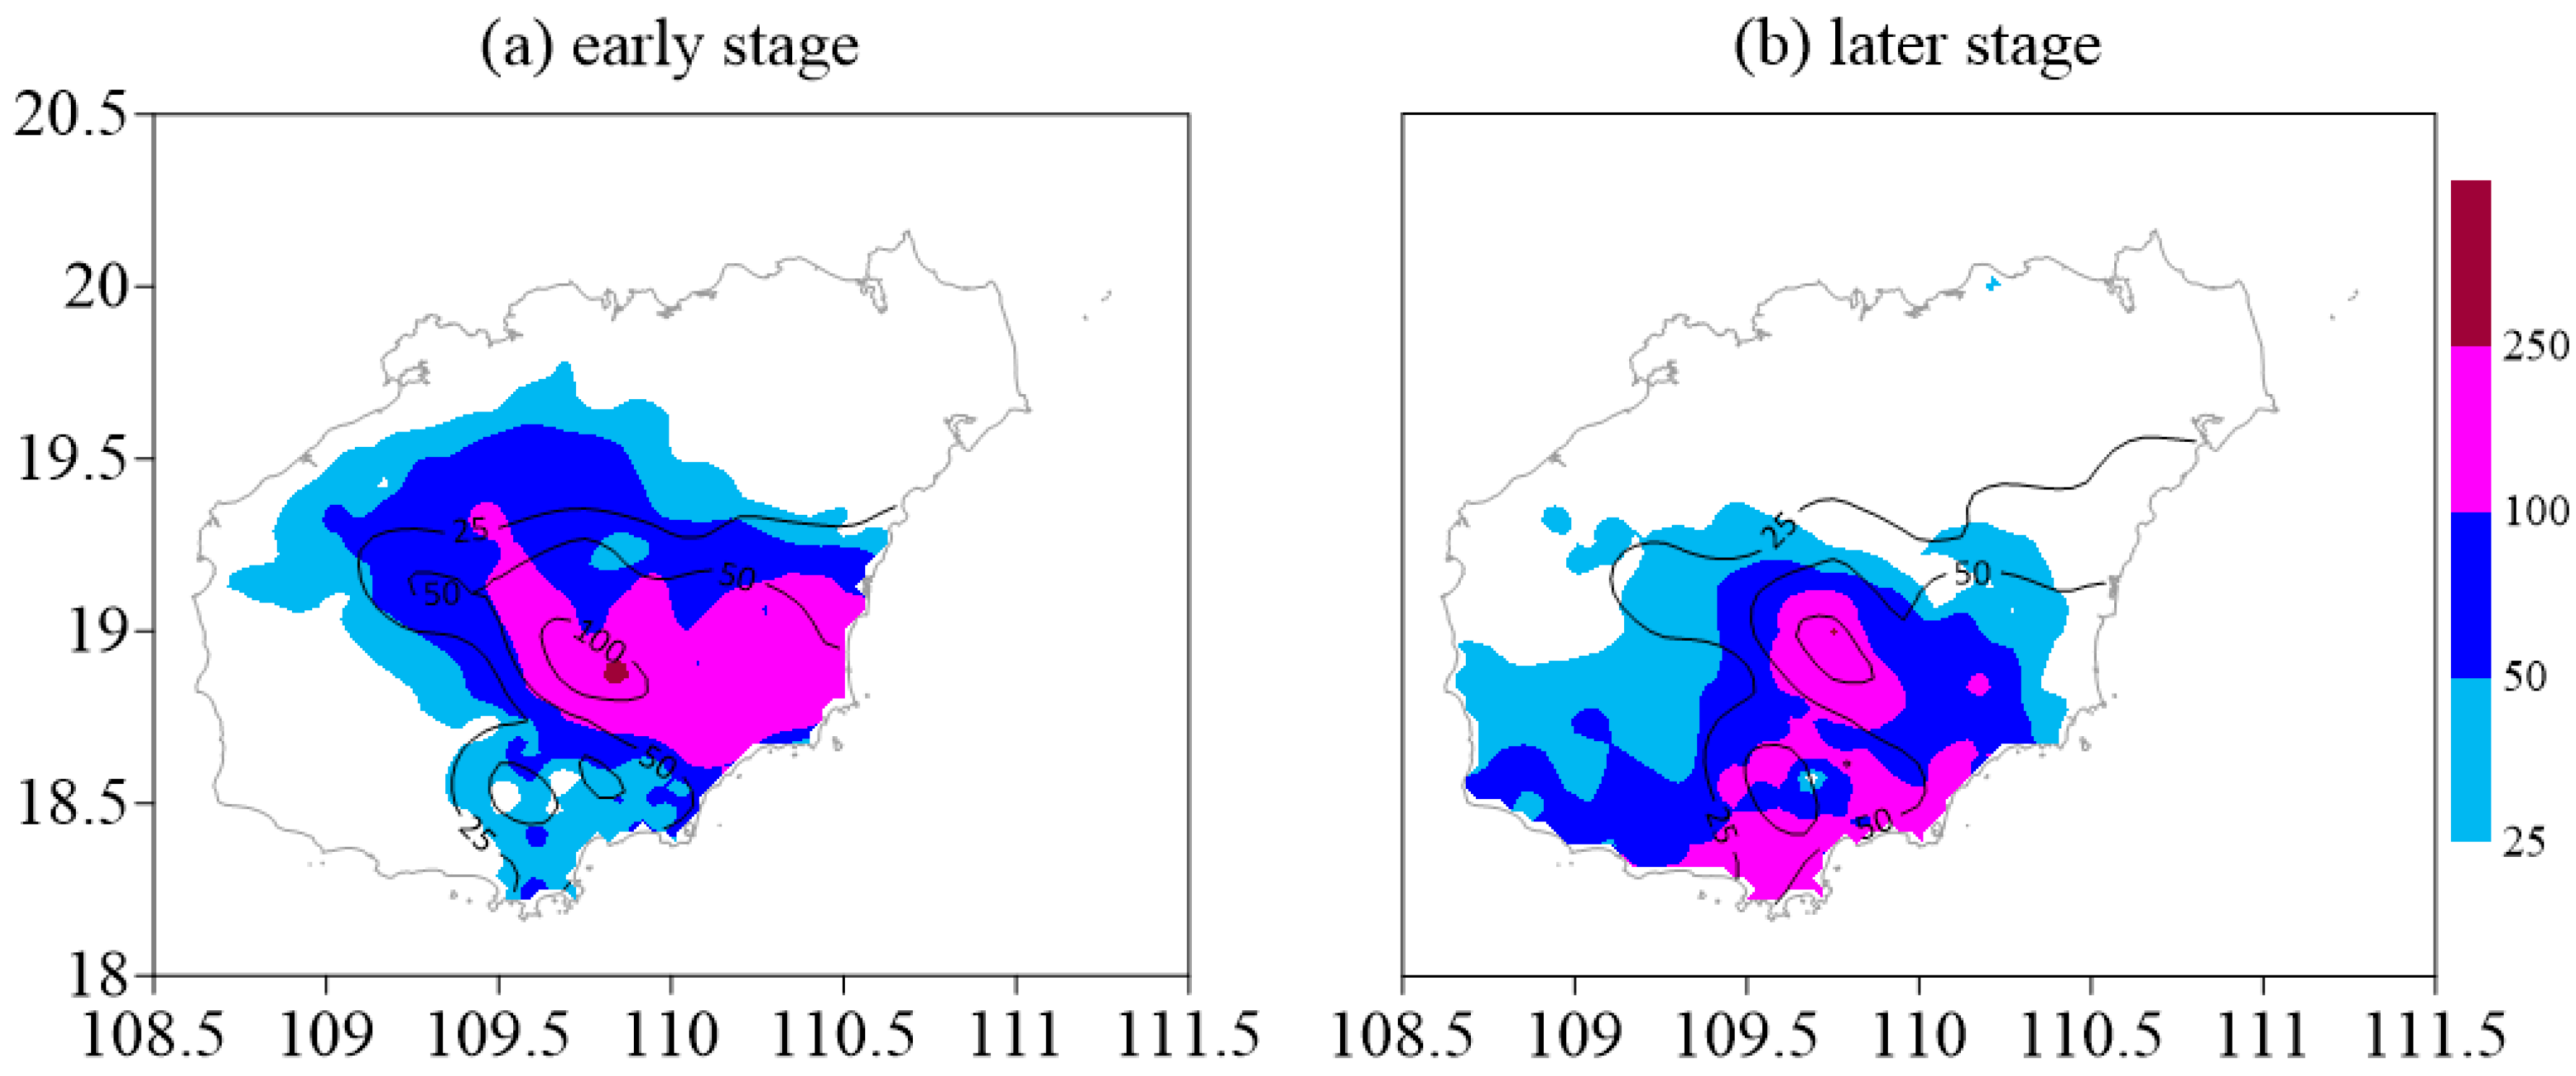
Temporal and spatial precipitation variations in the southeast and the south of the island exhibited different patterns during this event. Heavy rainfall in the southeast was mainly produced in a 24 h period of time from 1200 UTC 16 to 1200 UTC 17 (hereafter referred to as the early stage), while in the south the major precipitation period lasted about 24 h from 1200 UTC 17 to 1200 UTC 18 (hereafter referred to as the later stage). A comparison of 24 h accumulated precipitation simulated by ECMWF with the observed precipitation is given in Figure 2, showing that the observed daily accumulated precipitation exhibited spatial differences with 24 h accumulated precipitation ending 1200 UTC 17 being southwest-northeast oriented, and the 24-h accumulated rainfall on the next day (ending 1200 UTC 18) moving southward and becoming north-south oriented. It is encouraging that the model well predicted the location of the heavy rainfall (Figure 2a) although it under-predicted the maximum rainfall amount, which is common for a global model. However, on the next day when the rain belt moved southward, the NWP model failed to predict the spatial alternation (Figure 2b).
3.2. Convective Organization
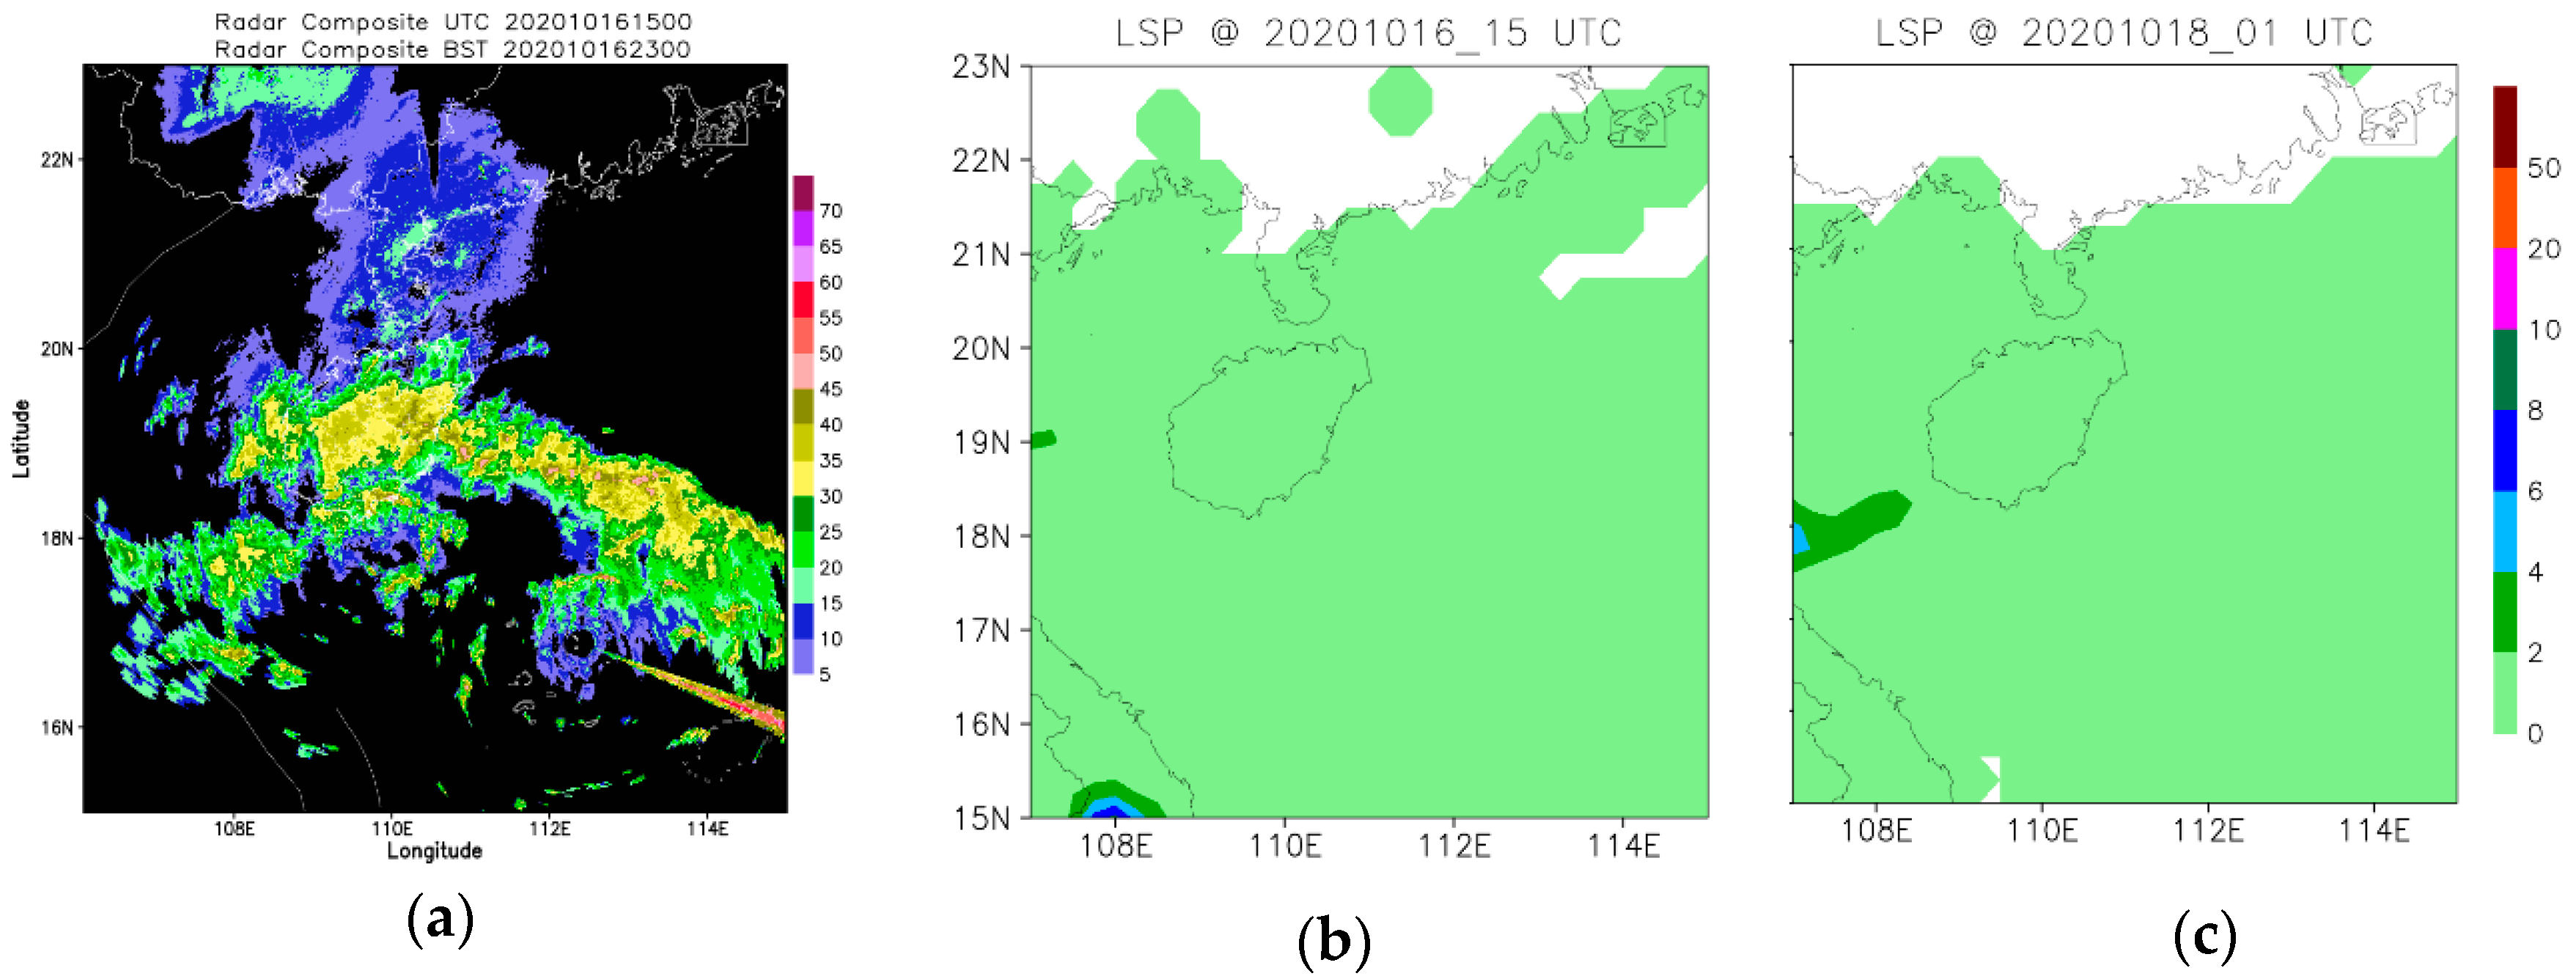
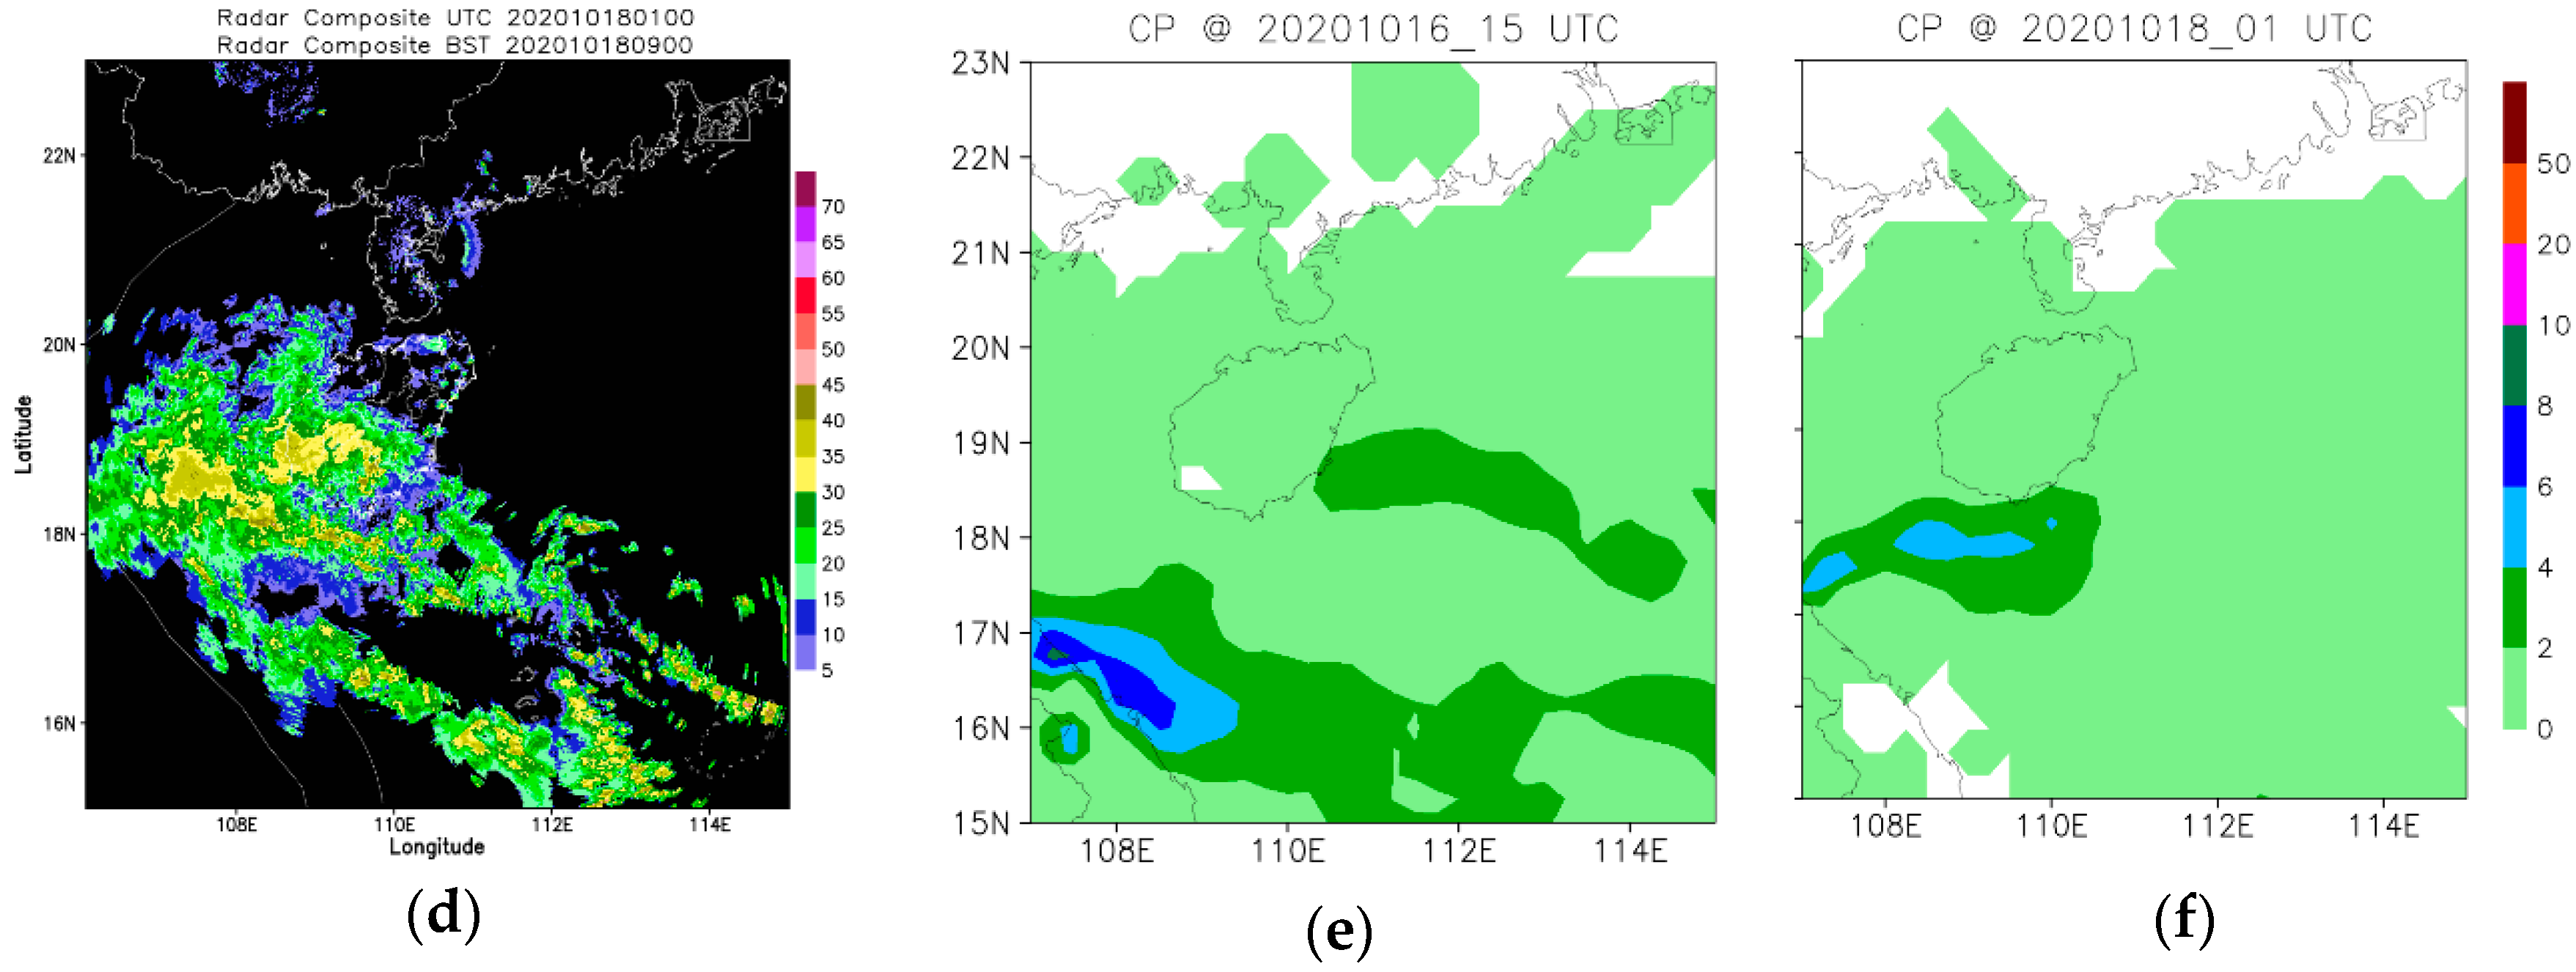
An examination of radar composite reflectivity (Figure 3a,d) indicates that two linear MCSs were responsible for this PEP. These two northwest-southeast oriented belts of high CR values (with the central value above 50 dBZ) were organized nearly parallel to each other, resulting in heavy rainfall in the southeast and south of Hainan Island respectively. A comparison of rain gauge observation (Figure 2a,b) and radar reflectivity (Figure 3a,d) reveals two rainfall stages in the event. During the early stage, the high CR belt of MCS1 moved across the southeast coast (denoted by the blue rectangle in Figure 1a), producing precipitation with a maximum rainfall rate of 64.7 mm·h−1. In the later stage after MSC1 dissipated, a new convective line (MCS2) was generated at the south coast (denoted by the green rectangle in Figure 1a). It moved in the same direction as MCS1 towards the south of the island, and was responsible for the heavy rainfall in the south of the island.
Convective precipitation from ERA5 indicates that the data model well depicts the convective activities of the event. While hourly rainfall rates of large-scale precipitation remained below 2 mm·h−1 at both stages (Figure 3b,e), convective precipitation with hourly rainfall rates exceeding 2 mm·h−1 (Figure 3c,f) exhibited a fairly good agreement with the location of high CR belts (Figure 3a,d). An examination of the evolution of hourly convective precipitation further suggests increased rainfall rates at the later stage than at the early stage. Considering that the convective precipitation is generated by the convection scheme and the cloud scheme in the IFS (ECMWF Integrated Forecasting System), the activities of MCSs at these two stages tend to be related to different extents to the sub-synoptic processes.
4. Applications of Decomposed WVD to Precipitation
4.1. Decomposed WVD at Early Stage
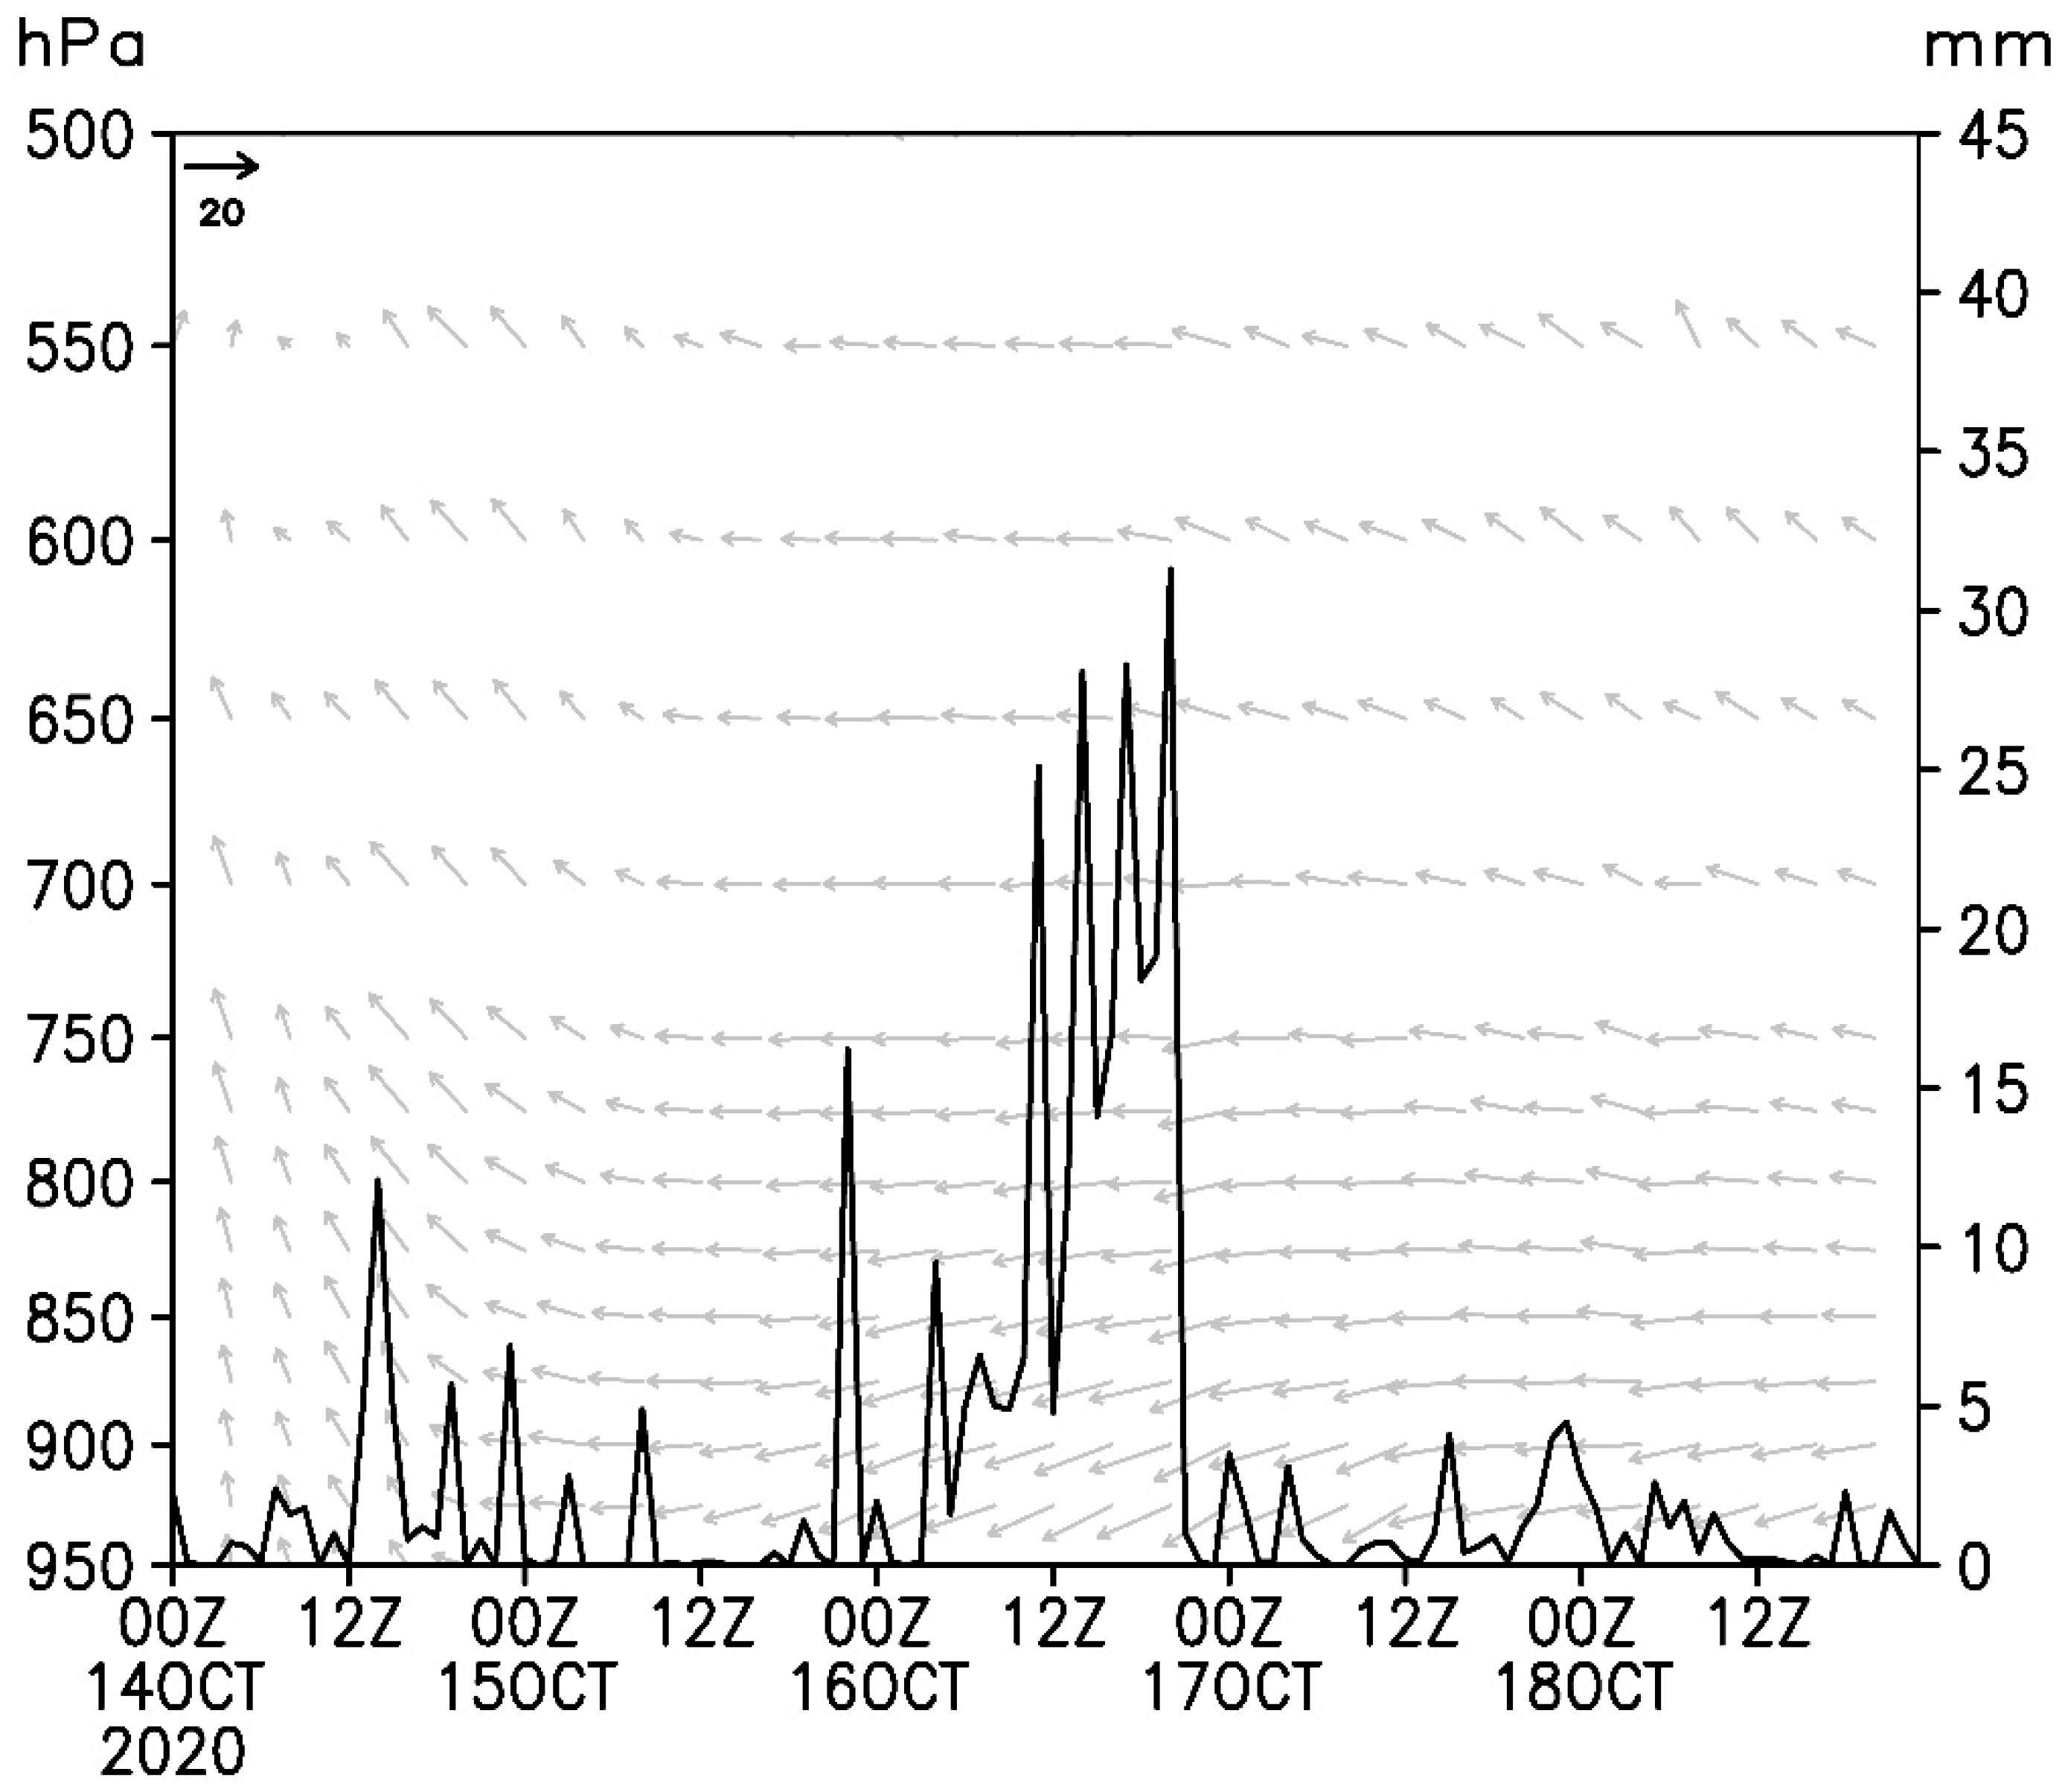
As mentioned in Section 3.1, this event was caused by a strong BLJ over the north SCS upstream from Hainan Island. Figure 4 shows the pressure-time profile of horizontal wind vectors at Wanning. At the early stage, heavy rainfall started right after the establishment of a northeasterly BLJ at about 0000 UTC 16 October, and the hourly rainfall rate decreased rapidly below 5 mm·h−1 before 0000 UTC 17. To analyze the moisture convergence at the early stage, we investigated the domain averaged decomposed WVD components in Equation (9) over the southeast coast (the green rectangle in Figure 1a).
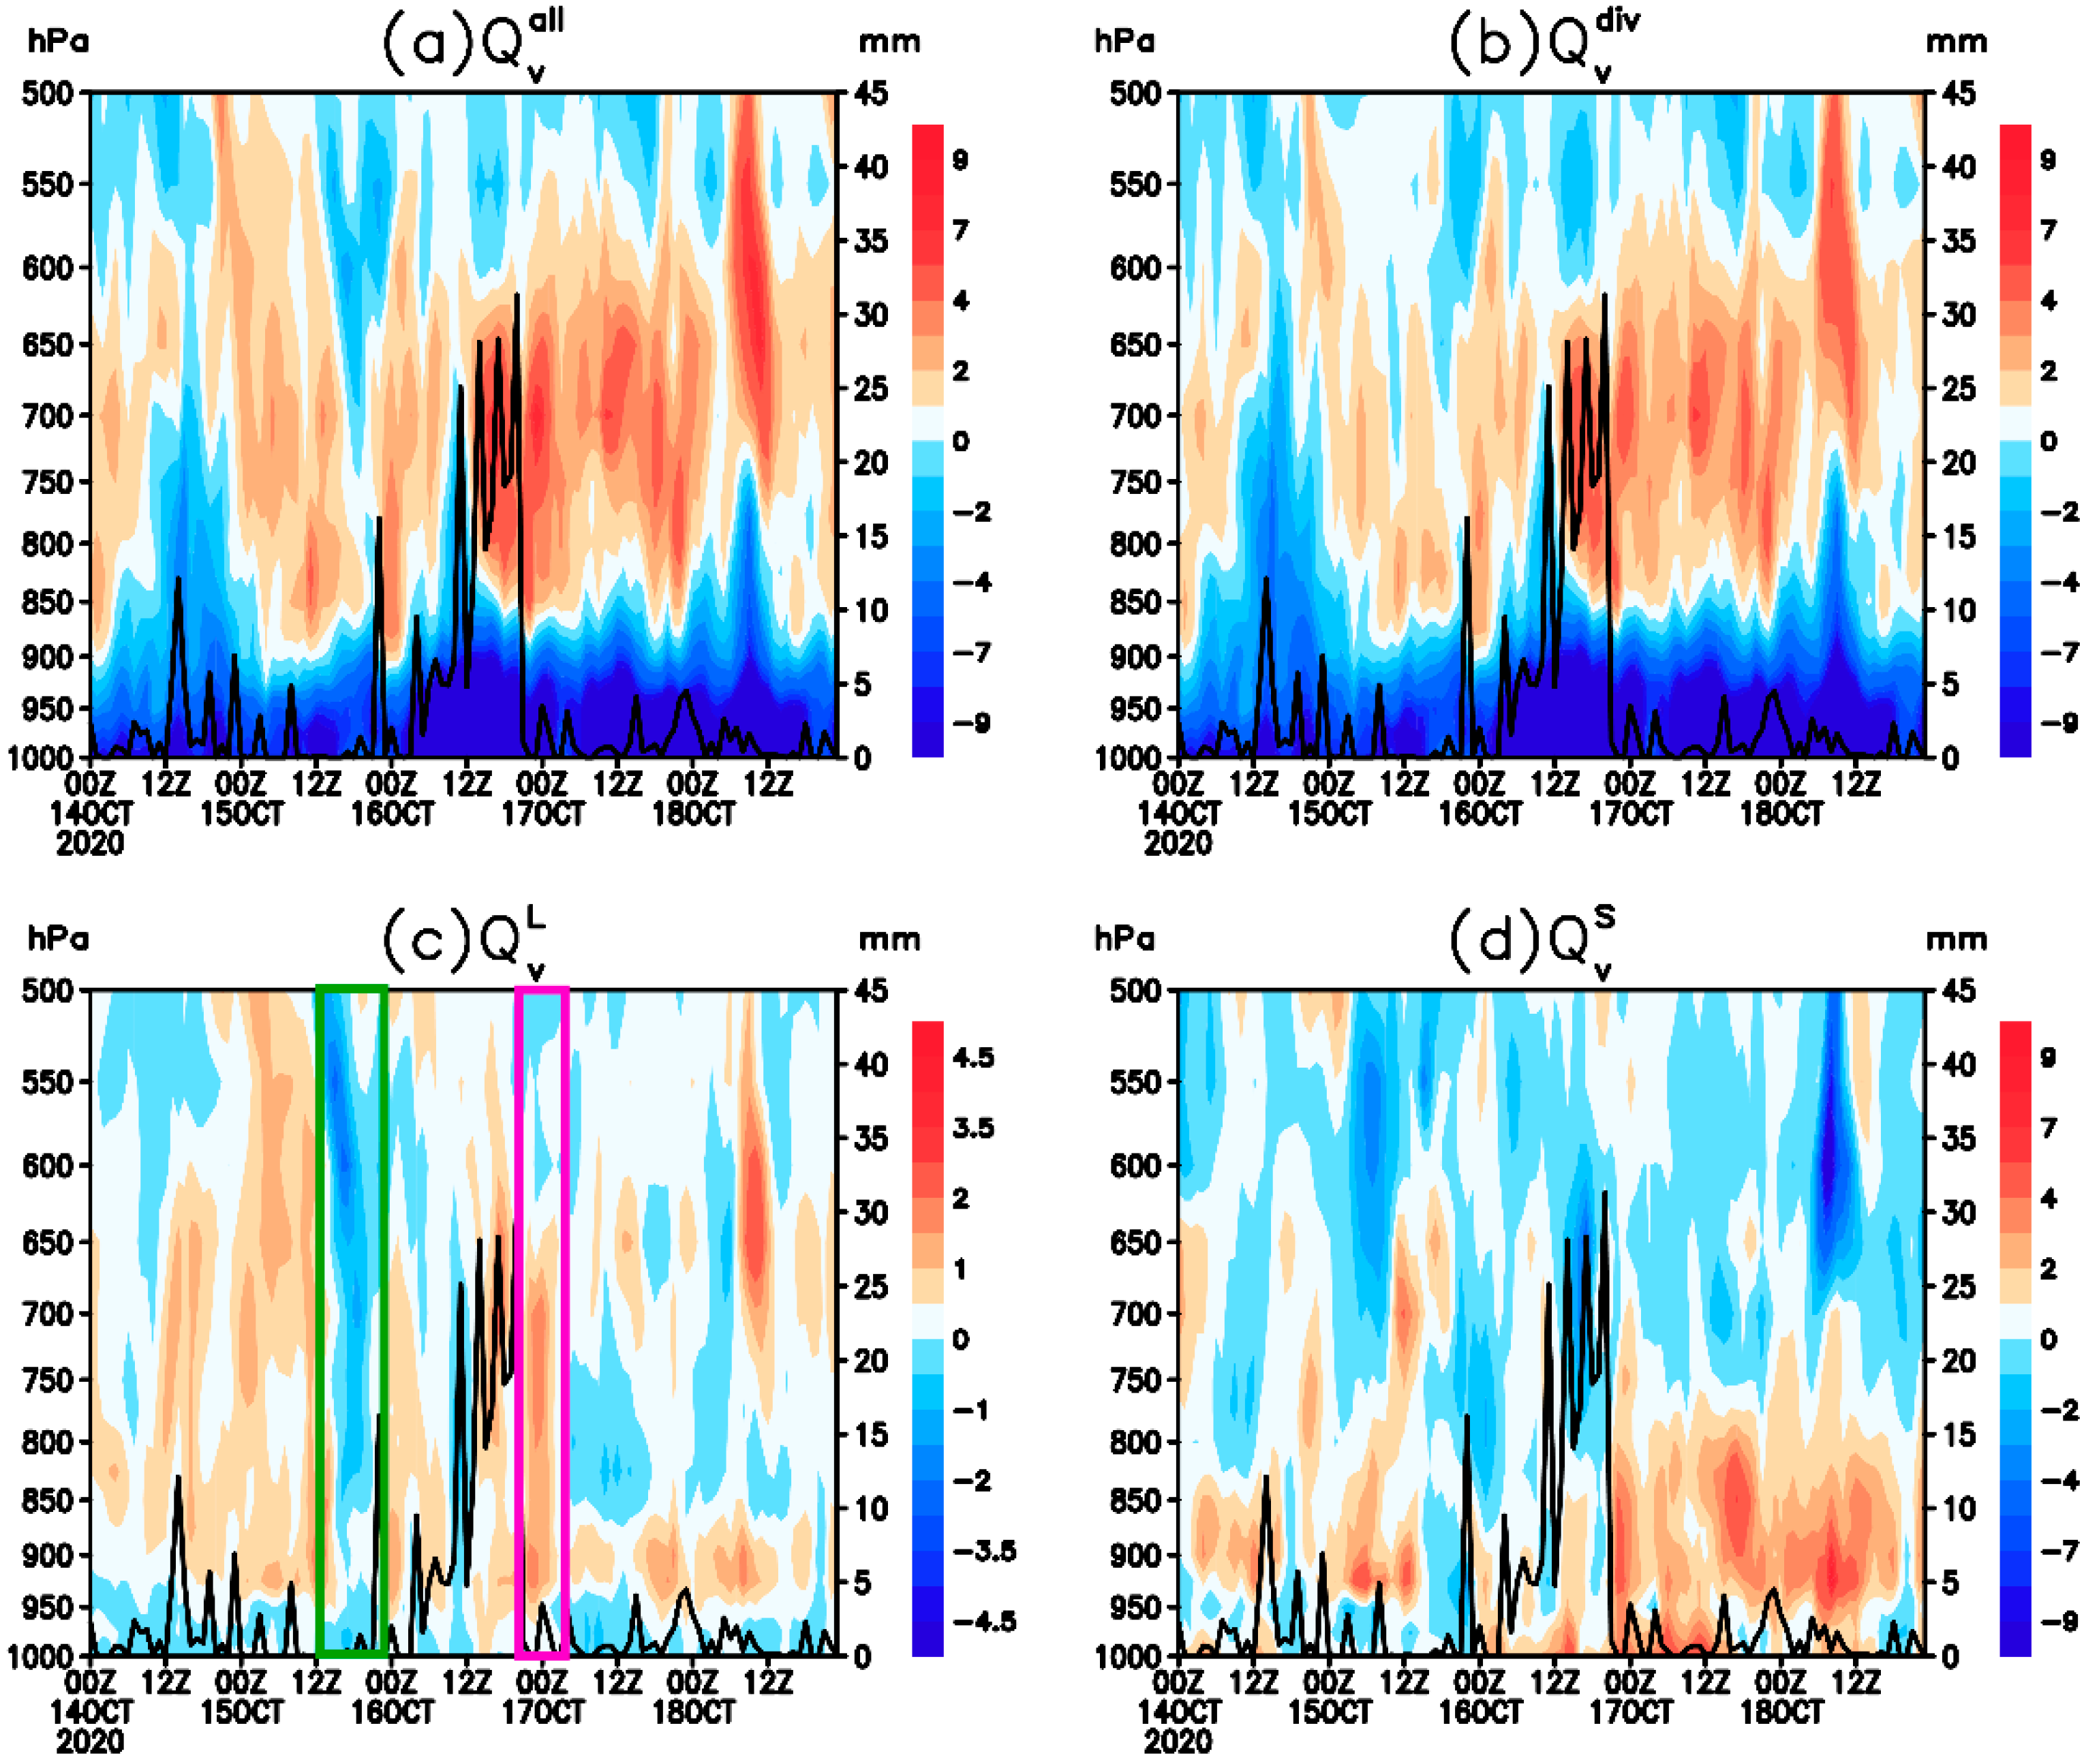
As shown in Figure 5a,b, Qvall converged below 700 hPa as southwesterly low level jet dominated this area before 15 October. After the easterly flow prevailed at around 1200 UTC 15, Qvall persistently converged below 900 hPa and diverged above up to 600 hPa nearly throughout the early stage. In spite of notable variation of hourly rainfall observed in this area, both Qvall and Qvdiv show strong convergence in the lower troposphere, indicating persistent flow convergence during this stage. Furthermore, QvL exhibited clear deep-layer convergence (the green rectangle in Figure 5c) prior to the increase of hourly rainfall rate, indicating enhanced large-scale water vapor convergence as a result of the change of low level wind direction below 500 hPa (Figure 4). Triggered by favorable large-scale moisture convergence, a high CR belt of MCS1 developed and moved towards the southeast coast (Figure 3), producing persistent precipitation with a maximum rainfall rate of 31.3 mm·h−1 in Waning and 64.7 mm·h−1 over the southeastern island. During the heavy rainfall, QvL below 700 hPa gradually weakened and is eventually dominated by areas with positive value. By 0000 UTC 17, QvL exhibits strong signals of large-scale moisture divergence (the pink rectangle in Figure 5c) with QvS diverging significantly below 800 hPa (Figure 5d). As a result, MCS1 weakened and finally dissipated. Rain gauge observations also show that the rainfall rate at Wanning decreased from 31.3 mm·h−1 to below 5 mm·h−1.
To conclude briefly, the rainfall in the southeast coast at the early stage was triggered by large-scale moisture convergence. The high predictability of precipitation by the NWP model in this period is possibly related to the large-scale ambient flow and the clear synoptic signal. The decomposed Qvdiv indicates persistent flow convergence during this stage, while QvL and QvS correspond well to the initiation and cessation of the heavy precipitation.
4.2. Decomposed WVD at Later Stage
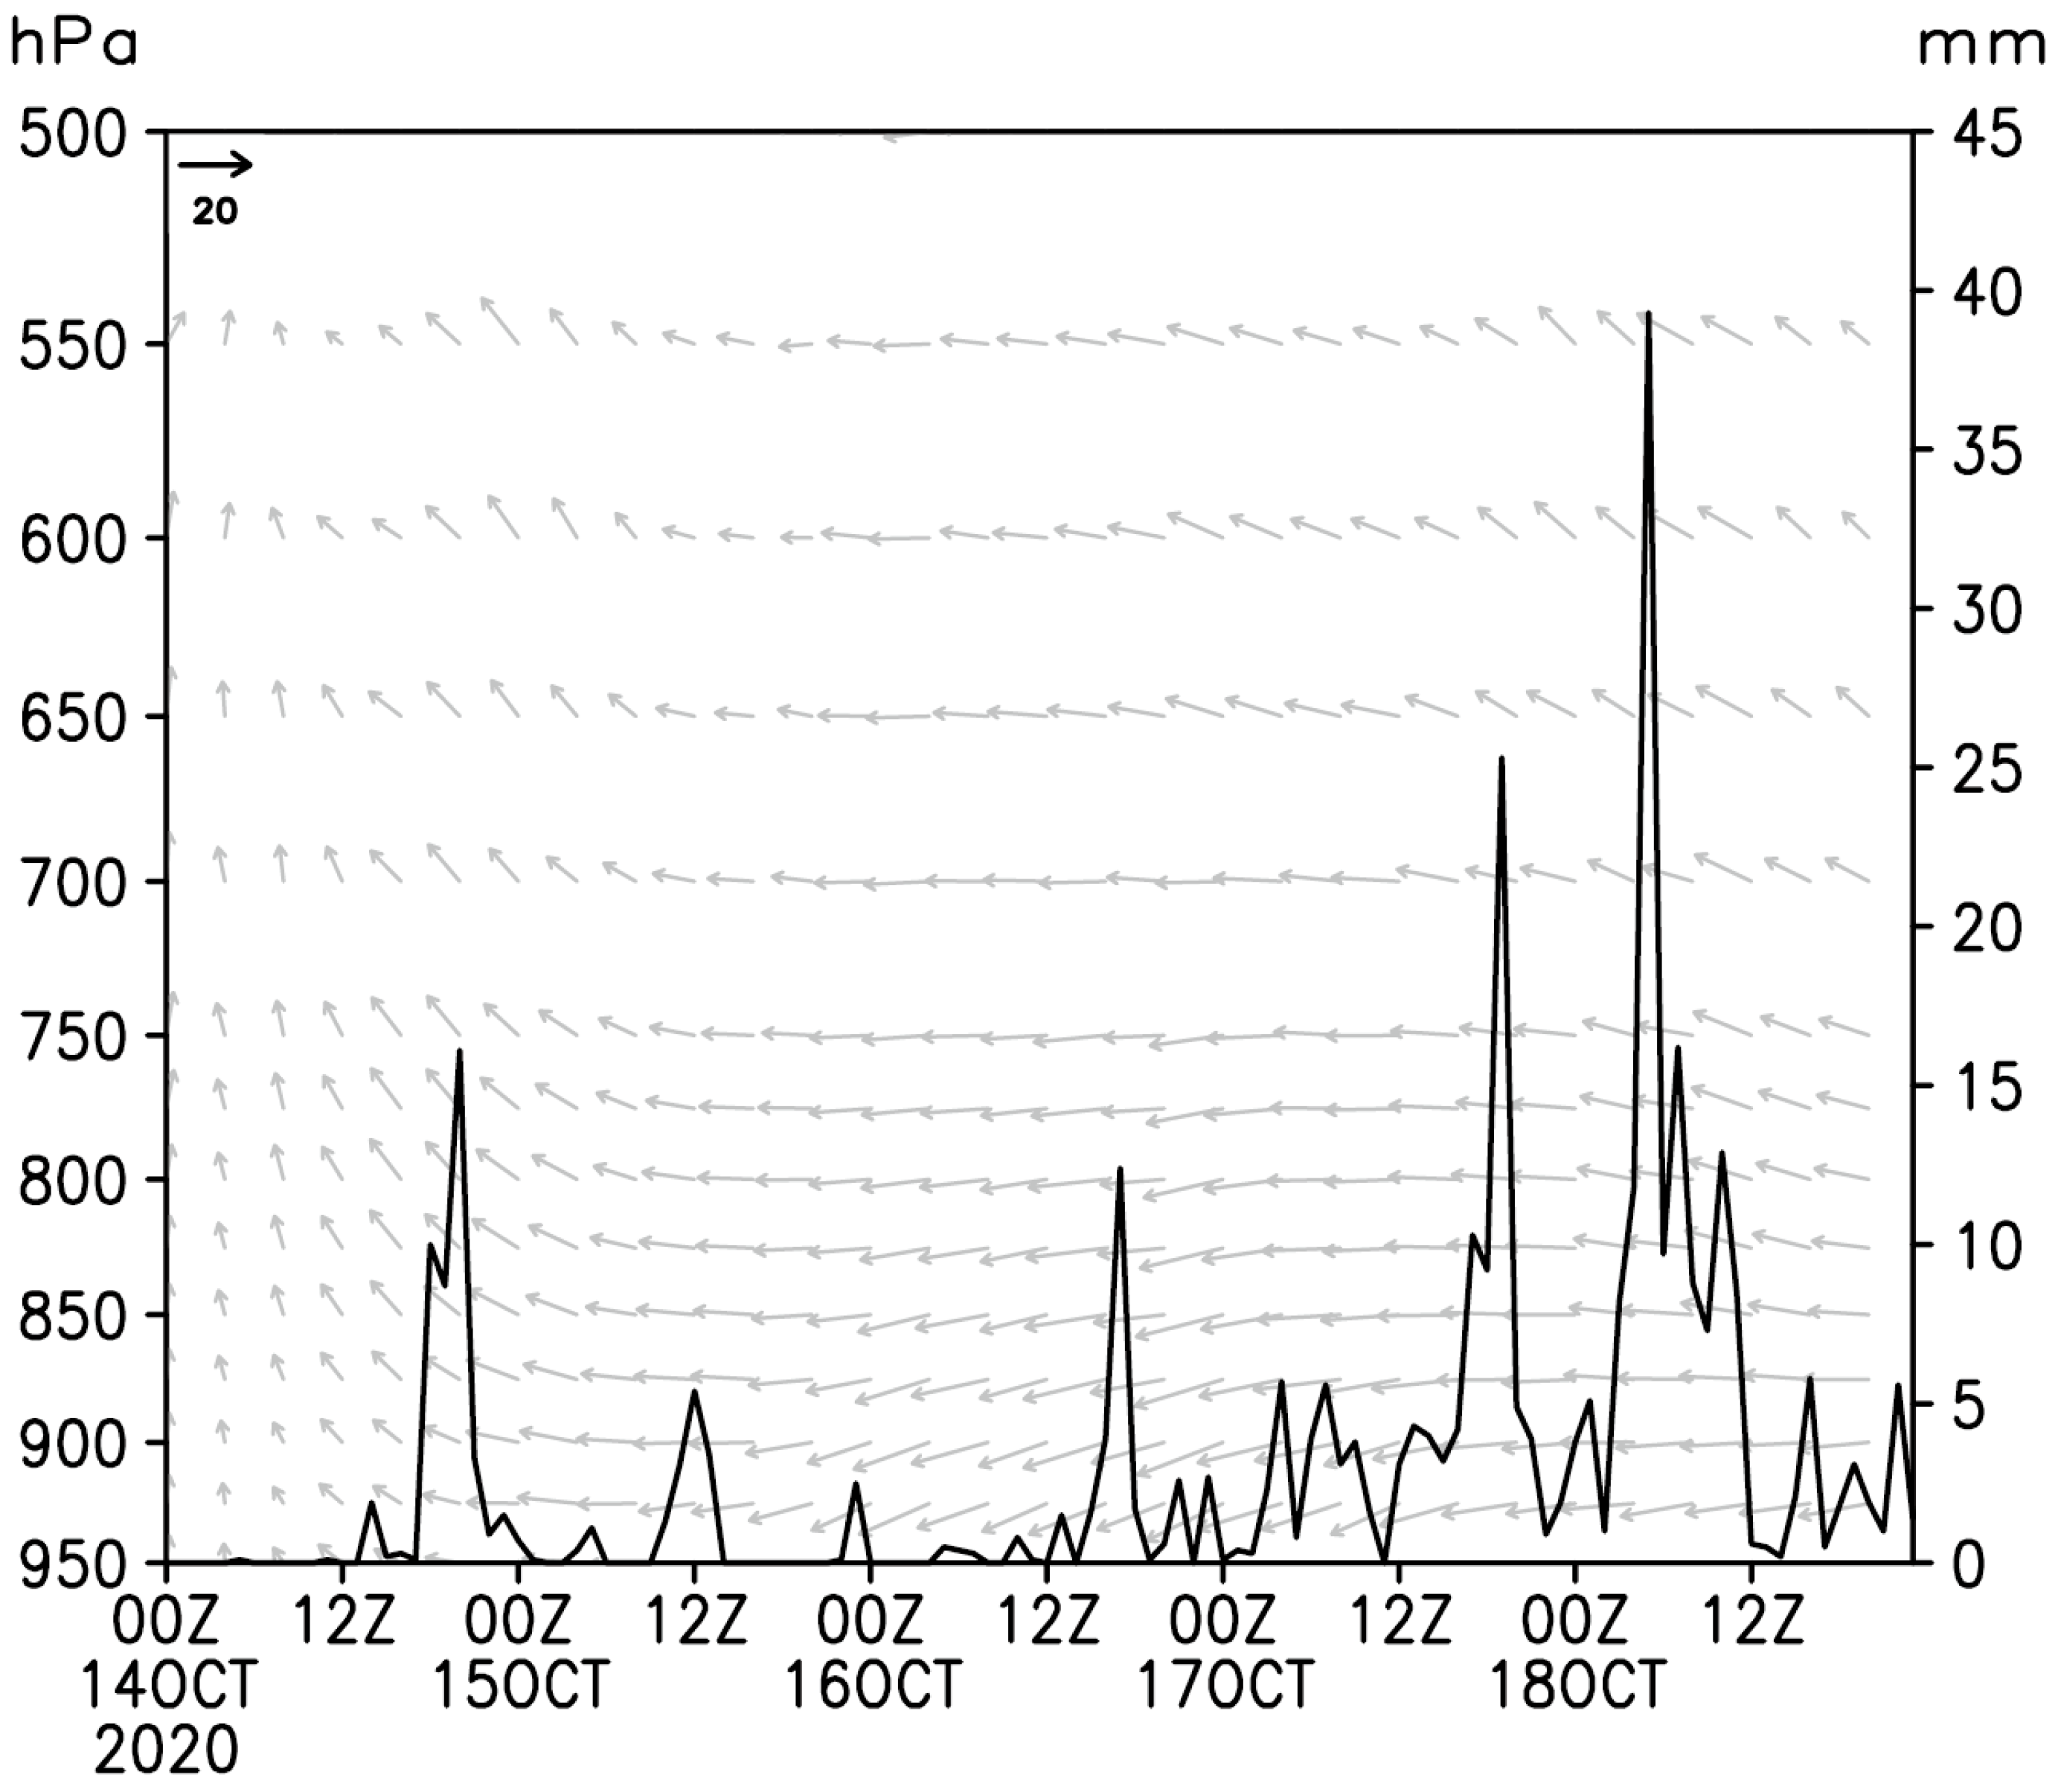
As the remnant of the tropical depression moved towards the coast of Vietnam during the later stage, the pressure gradient between the depression and the cold surge becomes stronger. The pressure-time profile of horizontal wind vector and hourly precipitation at Wanning is depicted in Figure 6, showing that the low-level ambient flow changed slightly, as the northeasterly jet over the south coast at early stage turned clockwise into the easterly jet (Figure 6). Heavy rainfall in the south coast started at about 1200 UTC 17, nearly 36 h after the establishment of northeasterly BLJ at about 0000 UTC 16.
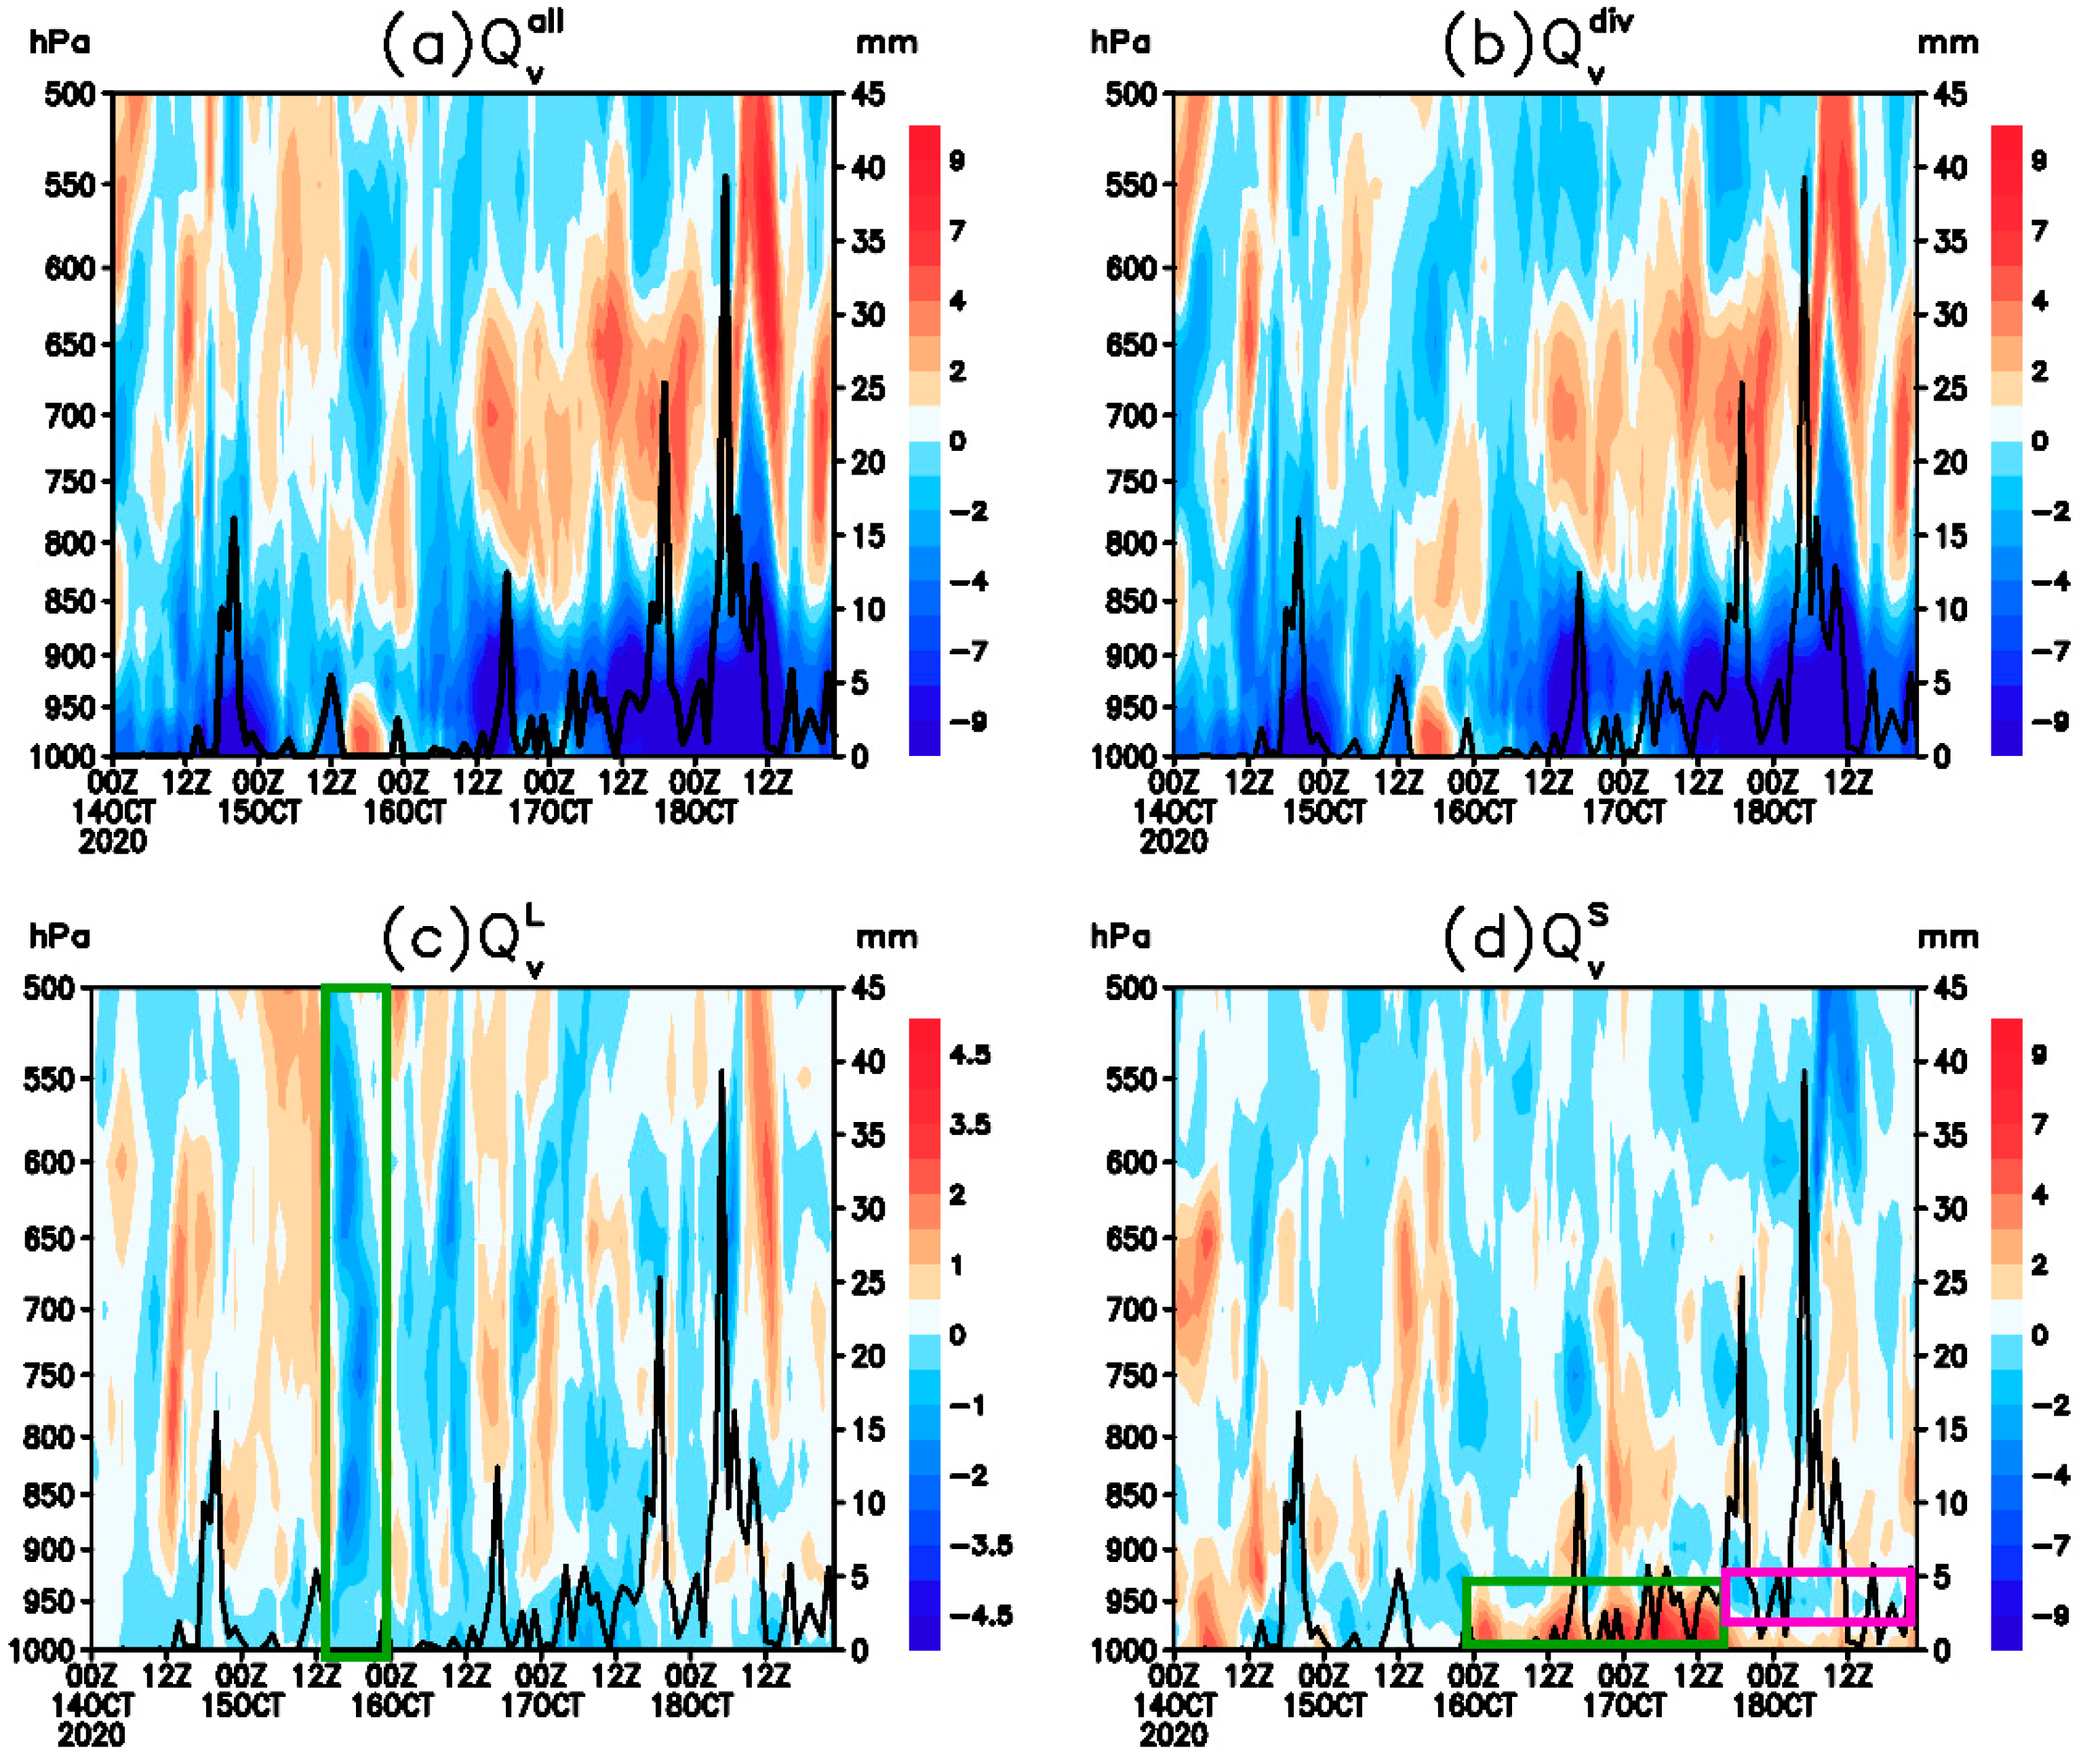
An examination of the time series of hourly rainfall rates and domain averaged moisture convergence over the south coast (Figure 7) reveals that increased rainfall rate corresdonds with the strengthening of Qvall below 850 hPa. A comparison between Figure 7a,b reveals that Qvall is mostly determined by Qvdiv. In the boundary layer also, Qvdiv shows strong negative signals indicating low level flow convergence in this period. Below 500 hPa, QvL exhibits notable convergence as a result of the change of low level wind direction (green rectangle in Figure 7c), with the negative signals stronger than those at the southeast coast (Figure 5c) continuing approximately throughout the later stage. In spite of clear signals of large-scale moisture convergence, the heavy rainfall over the south coast did not occur immediately. It is possible that stronger pressure gradients over the south coast at later stage indicate stronger sub-synoptic moisture convergence. An examination of QvS reveals strong sub-synoptic moisture divergence (the green rectangle in Figure 7d) in this area. The near-surface divergence lasted nearly 36 h, until positive values of QvS prevailed at 950 hPa (the pink rectangle in Figure 7d) after 1200 UTC 17. Due to favorable sub-synoptic moisture divergence, MCS2 became better organized and moved towards the south coast (Figure 3d), producing persistent heavy rainfall during the later stage with a maximum rainfall rate of 39.3 mm·h−1 in Sanya and 44.6 mm·h−1 over the south of the island. QvS is observed to weaken after 1200 UTC 17, as the rainfall rate in the south coast decreased rapidly.
A comparison of decomposed components in these two areas (Figure 5 and Figure 7) also suggests different features of moisture convergence during the later stage. At the southeast coast, where no heavy rainfall was predicted, both QvL and QvS diverged in the PBL (Figure 5c,d) despite convergence of Qvall and Qvdiv (Figure 5a,b). On the contrary, Qvdiv and QvS converge (Figure 7b,d) at the south coast where the heavy rainfall finally occurred.
4.3. Signals Associated with the Spatial Evolution of Rain Pattern
It is proven by the above analysis and by observational facts that the two precipitating stages were triggered and maintained by different scales of moisture convergence. Rainfall at the early stage was triggered by large-scale moisture convergence over the southeast coast, while at the later stage it was triggered by sub-synoptic scale moisture convergence and flow convergence under favorable large-scale moisture supply conditions. As mentioned in Section 3, the rainfall at the later stage was under-predicted. In this section, we investigate the performance of decomposed water vapor flux components to obtain further information about the alternation of rain pattern.
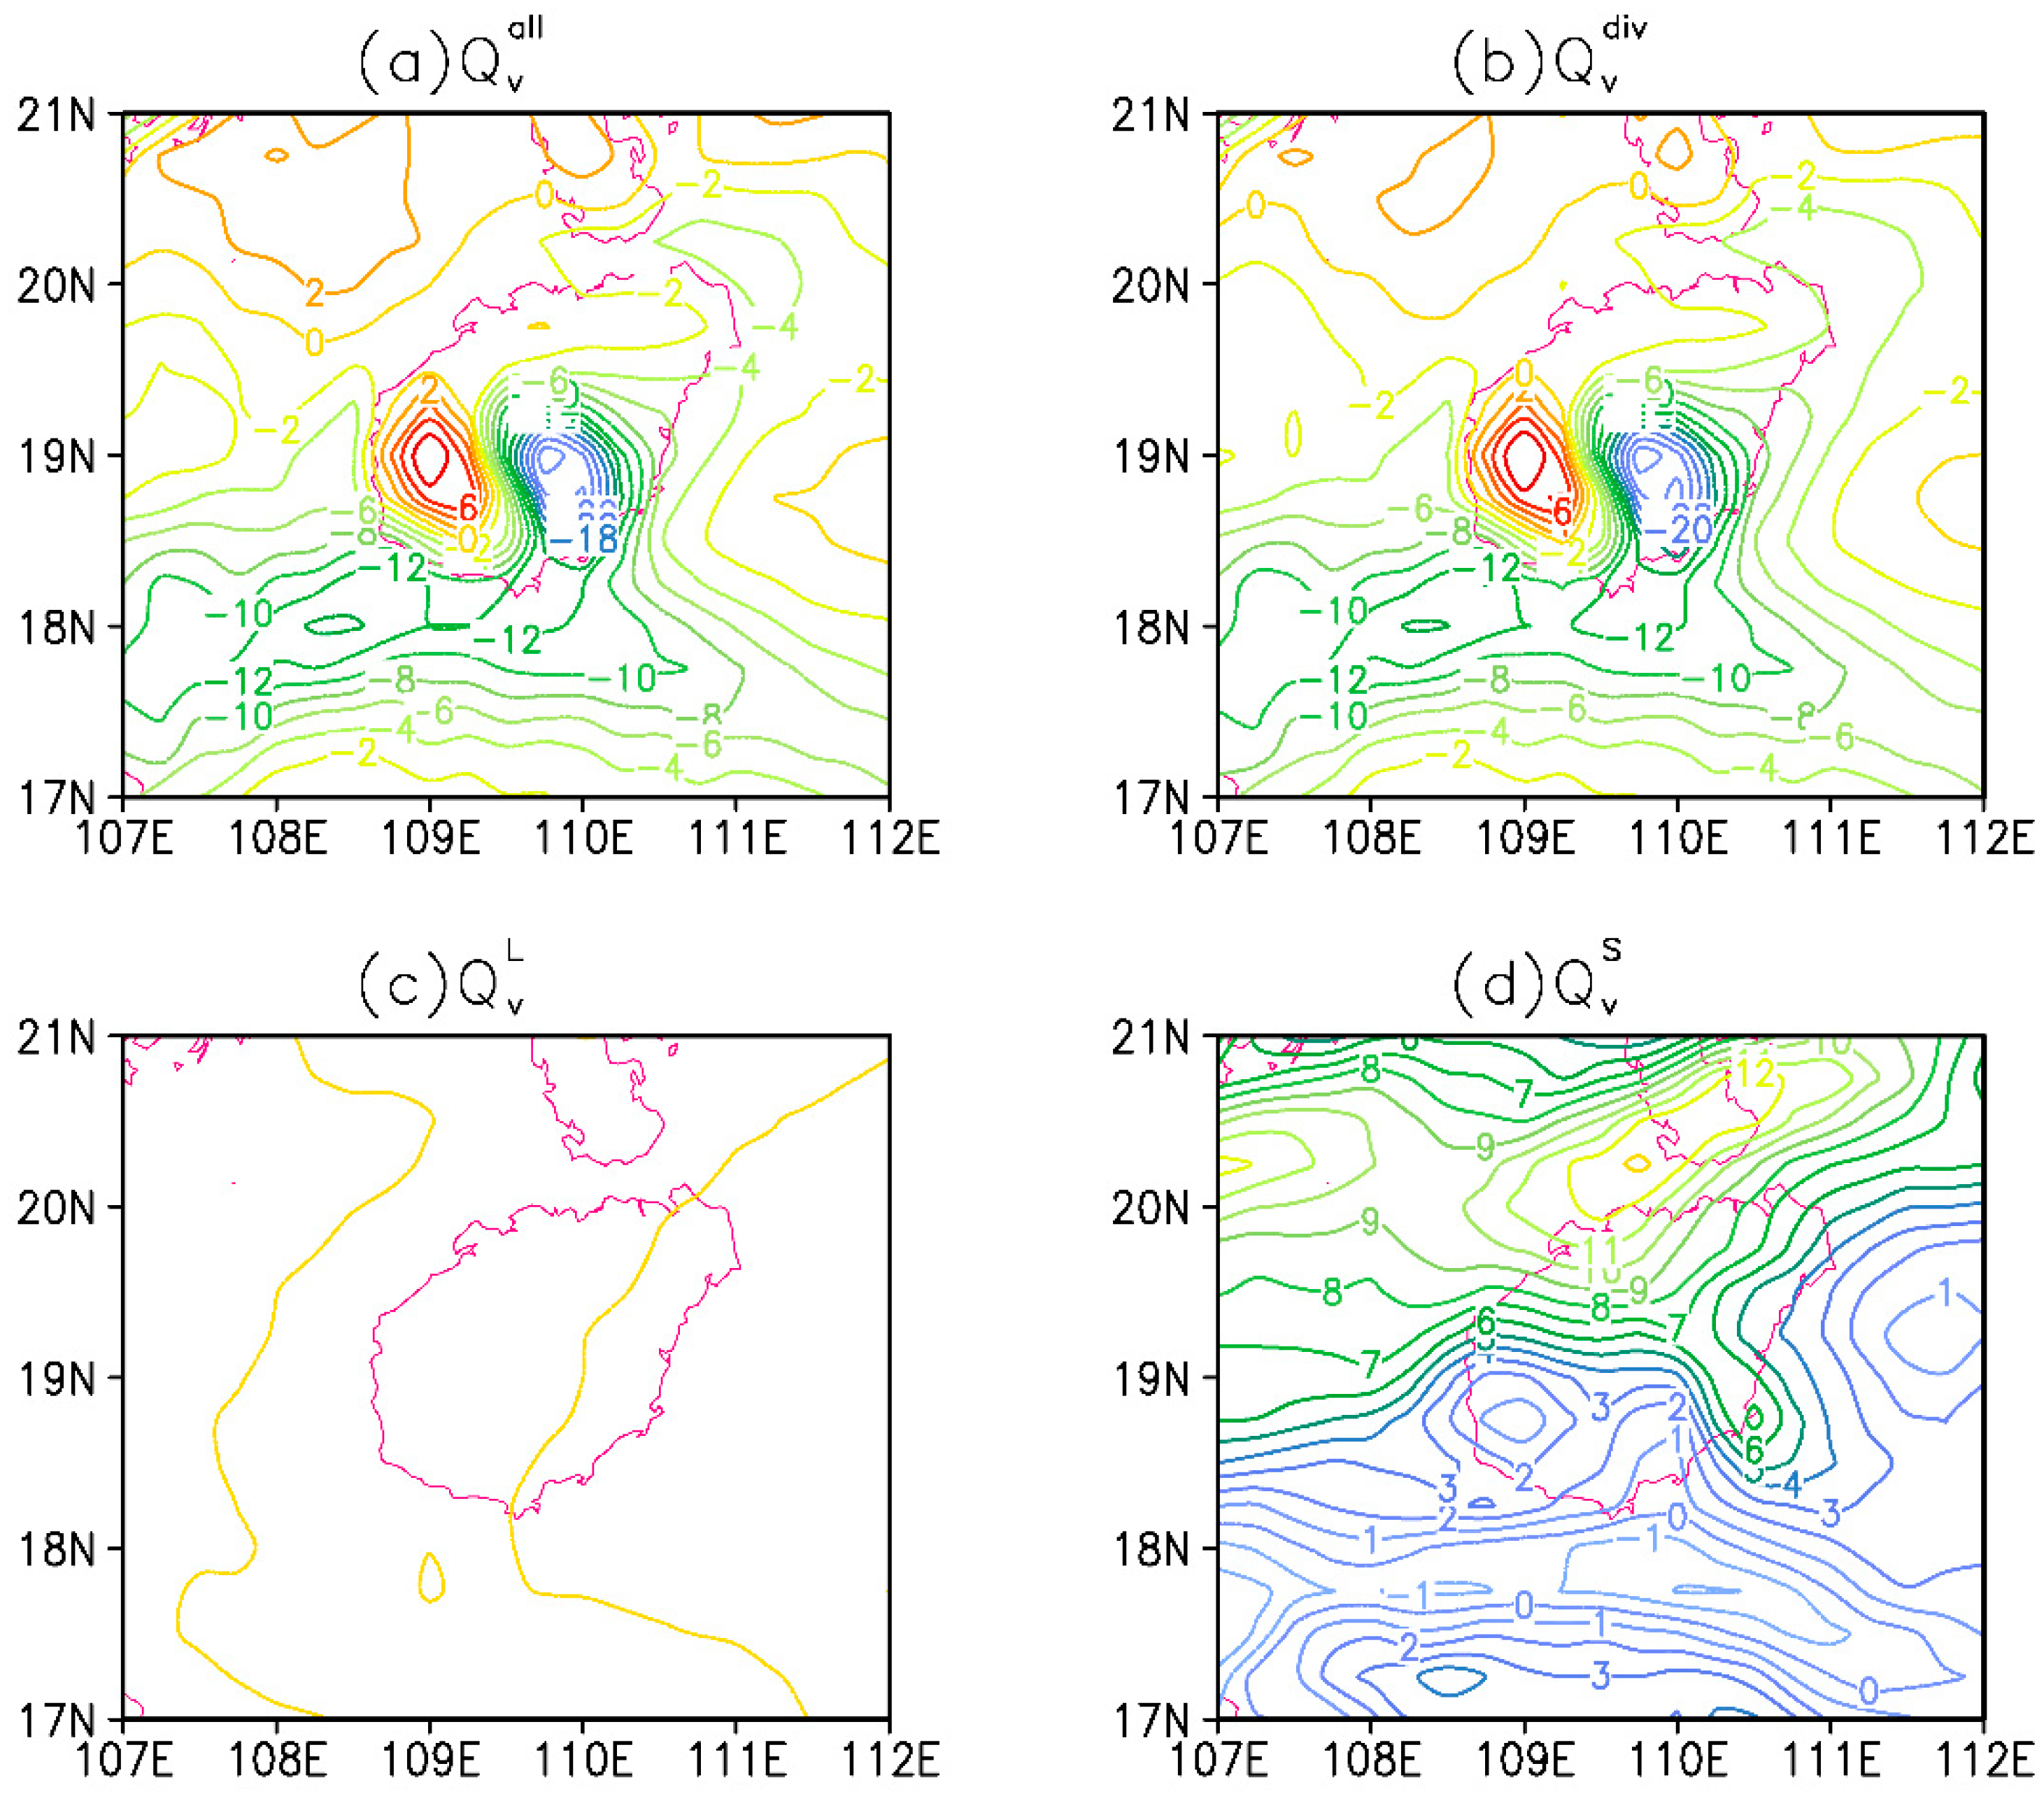
Figure 8 indicates 24 h averaged moisture convergence at 925 hPa at the later stage, showing weak QvL convergence (Figure 8c) and notable different patterns of QvS between the two areas concerned (Figure 8d). Despite the similar distribution of moisture convergence for Qvall and Qvdiv in both areas (Figure 8a,b), QvS suggests moisture divergence at the southeast coast and moisture convergence at the south coast (Figure 8d). It is worth noting that the moisture convergent belt of QvS in Figure 8d agrees well with the high CR belt and hourly convective precipitation shown in Figure 3d,f. Therefore, it is reasonable to assume that besides flow convergence denoted by Qvdiv, the decomposed QvS must be critical to the alternation of the rain pattern.
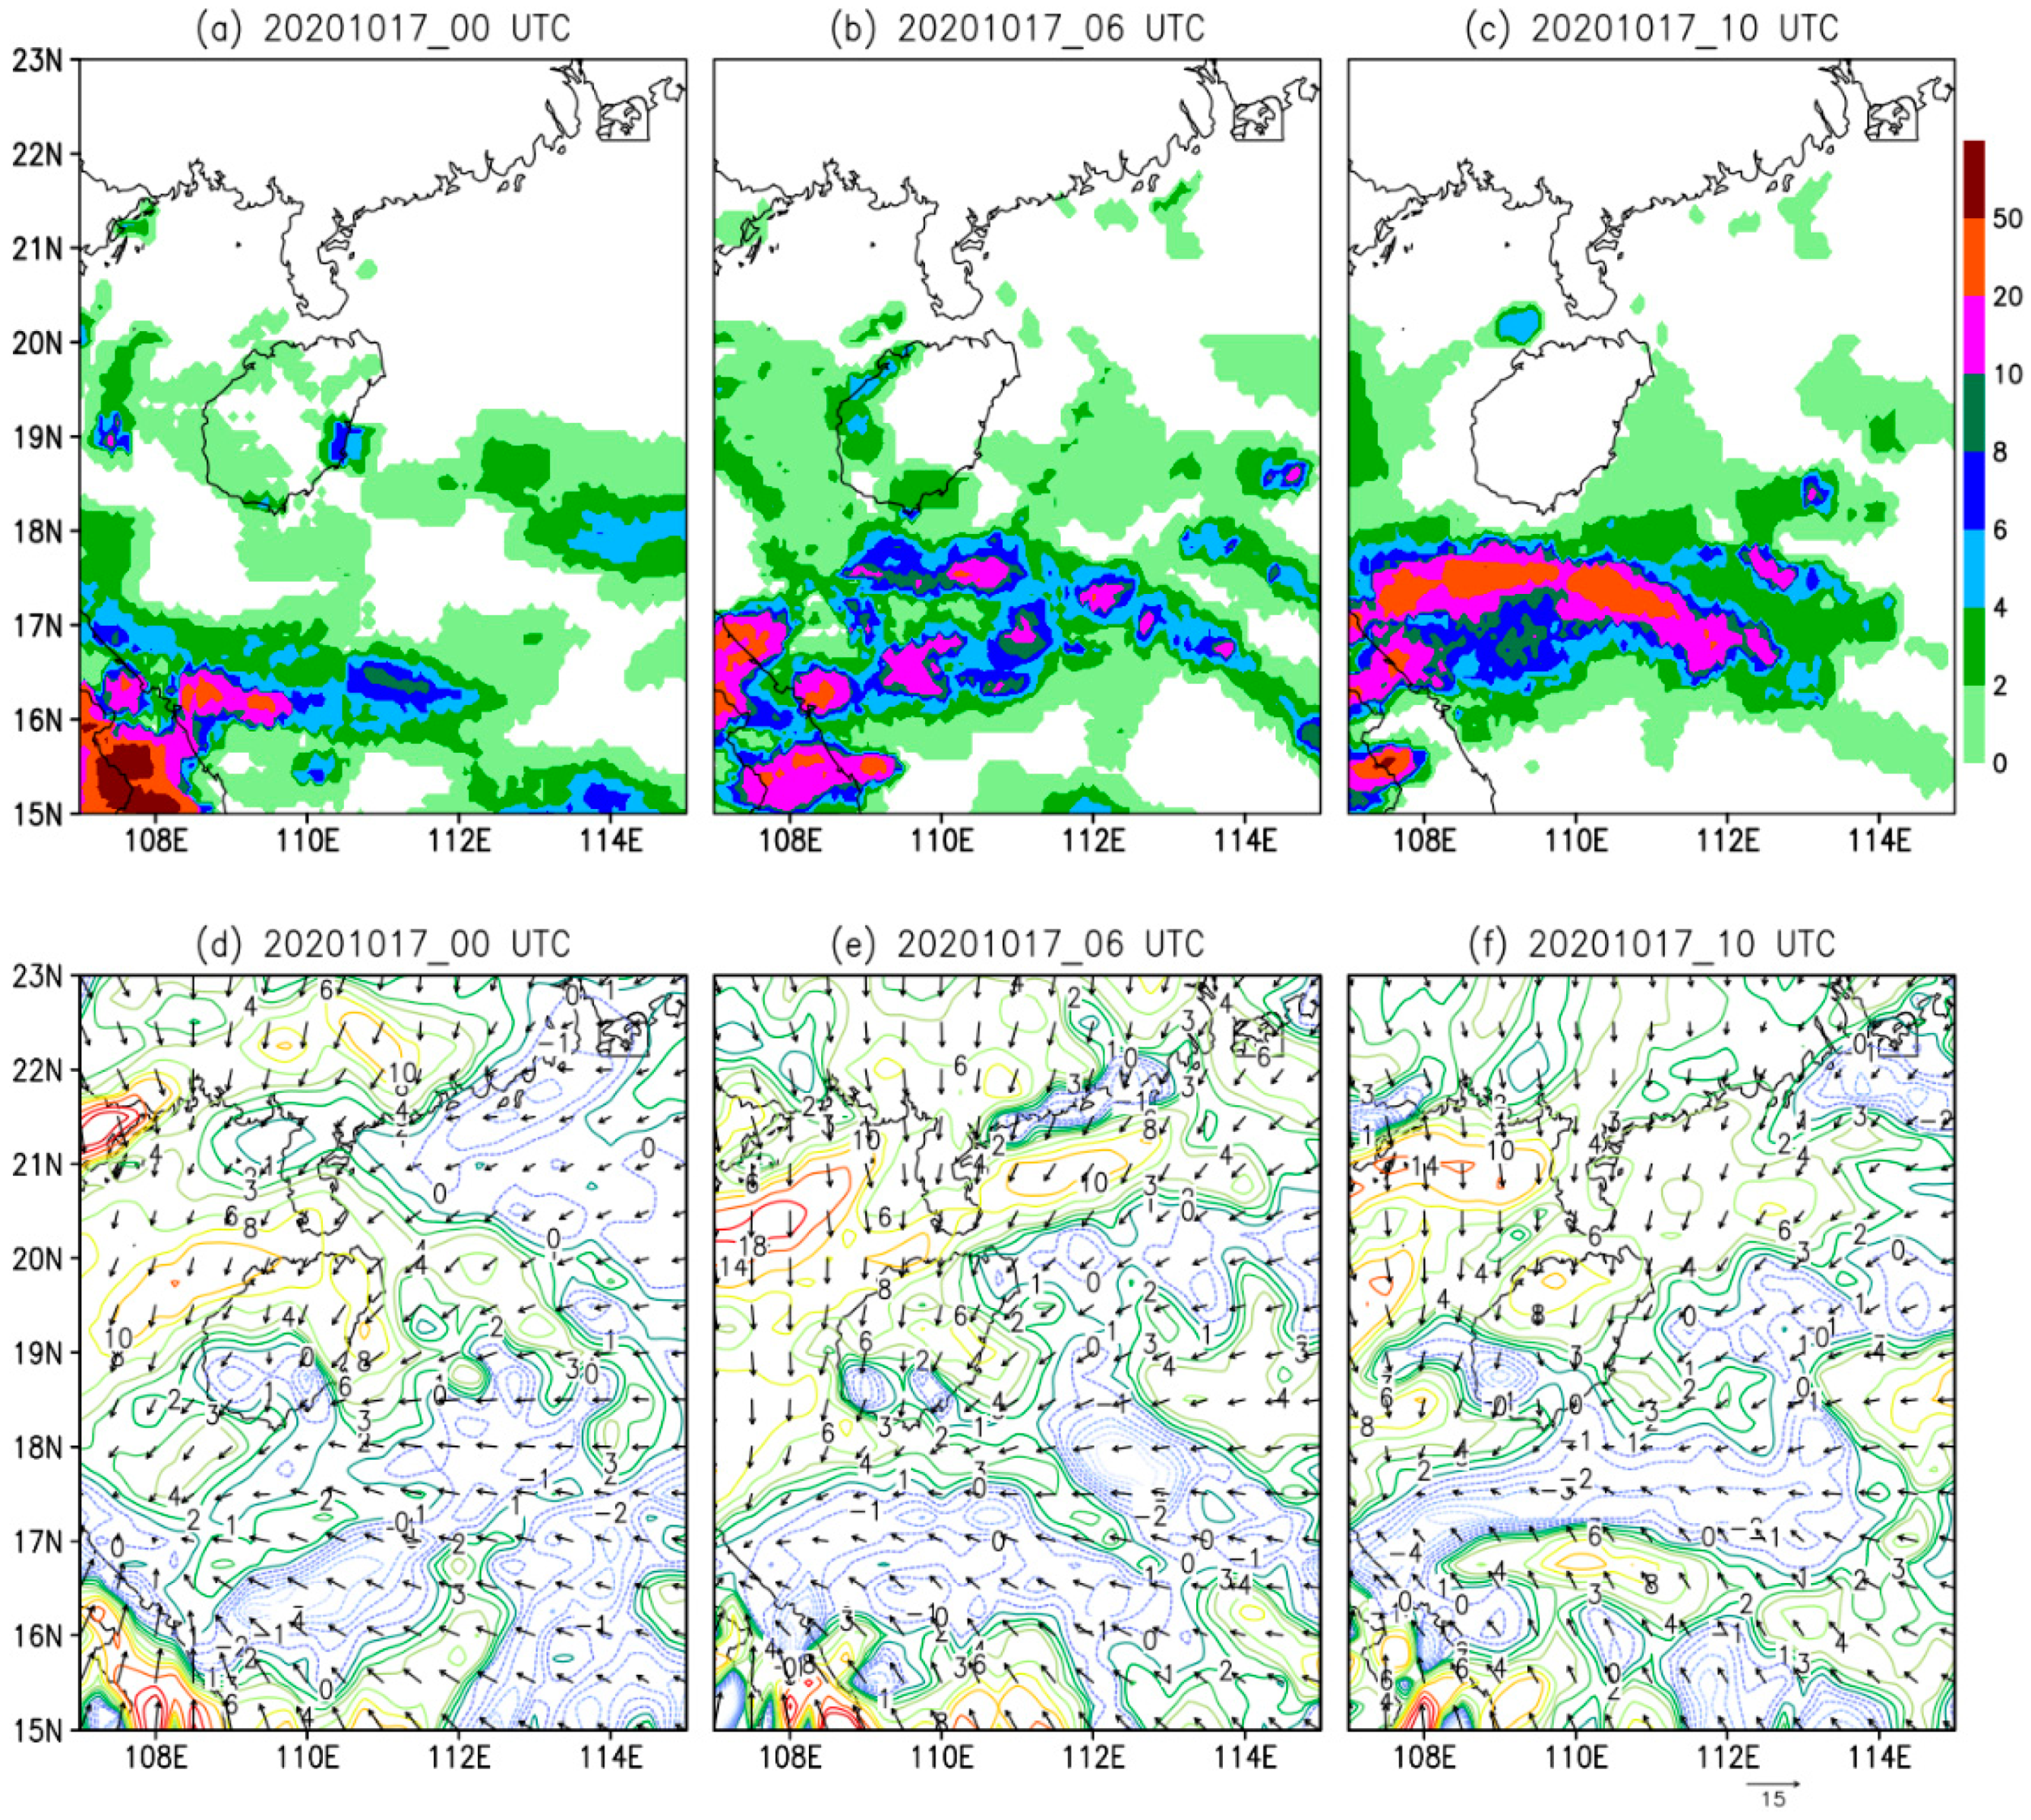
To demonstrate this point, we further investigated the distribution of the hourly amount of precipitation during the later stage, using CMORPH and QvS. As shown in Figure 9, at 0000 UTC 17 before the later stage (Figure 9a,d), QvS diverged to the south of the island at about 17–18° N. Note that the area of significant moisture convergence at 16–17° N (Figure 9d) corresponds well to the location of hourly rainfall exceeding 20 mm in Figure 9a. The rain belt moved northward as the QvS convergent zone moved northward (Figure 9b,e). At 1000 UTC 17, 2-h before the later stage, a western-eastern oriented sub-synoptic convergent zone characterized by negative value QvS can be seen to dominate the area from the south of the island to the southern sea (Figure 9f). Correspondingly, the intensified rain belt with maximum hourly rainfall exceeding 50 mm developed in this area (Figure 9c).
In brief conclusion, the torrential rainfall in the later stage over the south coast, which the model failed to predict, was triggered by the sub-synoptic moisture convergence and flow convergence under the background of ambient large-scale moisture supply. QvS gives clear signals of the alternation of rain pattern.
5. Conclusions and Discussions
Climatological studies on persistent extreme precipitation events (PEPs) reveal that as the planet warms, PEPs are increasing in frequency and variability, threatening human lives, infrastructures, and ecosystems. Intense and thorough research has been carried out into summertime PEPs over mainland China and other mid-latitude regions around the world, while research on PEPs in the post-flood season over tropical islands has been lacking.
In this study, decomposed water vapor divergence (Qvall) was applied to the analysis of a failure in forecasting two distinct stages of a PEP over Hainan Island, an important and fast-developing tropical region. Remote sensing data from multiple sources were used as evidence, together with local observation data. At the early stage when large-scale moisture convergence played a prevalent role in triggering the intense rainfall, the ECMWF model well depicted the large-scale circulation and also the precipitation locations. The high predictability at this stage is held to be related to the strong signal in the synoptic pattern. However, at the later stage when the rainfall was triggered by sub-synoptic moisture convergence and flow convergence, the model failed to predict the spatial evolution of the rain pattern.
The adoption of decomposed water vapor flux improves our understanding of this tropical PEP in the following aspects: (1) synoptic and sub-synoptic moisture convergence play different roles in triggering precipitation and influencing the evolution of rain bands during PEPs, (2) decomposed sub-synoptic component QvS gives more clues to the missed rainfall by well depicting the evolution of sub-synoptic scale moisture convergence and rain belt, (3) variations of large- and sub-synoptic scale moisture convergence in the PBL are important in the forecast of tropical PEPs.
The method of decomposed water vapor divergence was earlier used in torrential rainfall events over the Yangtze River [6], tropical storms [57], and an extreme blizzard event in central Asia [58], revealing that the decomposed components give signals of snowfall and rainfall. Considering the limited understanding of the multi-scale interactions and model deficiencies during PEPs in the post-flood season over Hainan Island, this method may aid our understanding of different scales of moisture aggregation, provide local forecasters in the tropics with different signals of large- and sub-synoptic scale moisture convergence especially in the boundary layer, and can be introduced in operational forecasting by post-processing with numerical products. The improvement of forecasting skills for such disastrous and high-impact events is beneficial to public safety, property, agriculture, and prevention of damage.
With rapid developments in remote sensing and numerical modeling technologies, the new diagnostic method developed in this study will have further applications for practical tropical PEP forecasting.
Author Contributions
Conceptualization, Z.W. and J.C.; methodology, J.C.; software, W.Z., X.L. and Y.K.; validation, Z.W., J.C. and Y.K.; formal analysis, Z.W.; investigation, Z.W. and J.C.; resources, J.C.; data curation, J.C.; writing—original draft preparation, Z.W. and J.C.; visualization, Z.W. and Y.K.; supervision, J.C.; project administration, J.C. and Z.W.; funding acquisition, J.C. and Z.W. All authors have read and agreed to the published version of the manuscript.
Funding
This research was funded by National Natural Science Foundation of China, grants number 91937301, 41875074 and U21A6001, Hainan Provincial Natural Science Foundation of China, grant number 421QN374 and 422RC803, and the National Key Scientific & Technological Infrastructure Project “EarthLab”.
Institutional Review Board Statement
Not applicable.
Informed Consent Statement
Not applicable.
Data Availability Statement
The rain gauge observation and radar mosaic maps are archived at Hainan Meteorological Observatory. CMORPH data presented in this study are openly available at https://www.ncei.noaa.gov/data/cmorph-high-resolution-global-precipitation-estimates/access/30min/8km/ (accessed on 6 January 2022). ERA5 data was obtained from https://cds.climate.copernicus.eu/cdsapp#!/dataset/reanalysis-era5-land?tab=overview (accessed on 5 January 2021) and https://cds.climate.copernicus.eu/cdsapp#!/dataset/reanalysis-era5-pressure-levels?tab=form (accessed on 4 December 2020).
Acknowledgments
The authors are thankful to the Supercomputing Center for Education & Research at the University of Oklahoma, USA. We also want to thank the four anonymous reviewers who greatly improved presentation of the results.
Conflicts of Interest
The authors declare no conflict of interest.
References
- IPCC. Climate Change 2021: The Physical Science Basis. Available online: https://www.ipcc.ch/report/ar6/wg1/downloads/report/IPCC_AR6_WGI_Full_Report.pdf (accessed on 1 August 2021).
- Zhou, T.; Zhang, W.; Zhang, L.; Clark, R.; Qian, C.; Zhang, Q.; Qiu, H.; Jiang, J.; Zhang, X. 2021: A year of unprecedented climate extremes in eastern Asia, North America, and Europe. Adv. Atmos. Sci. 2022. [Google Scholar] [CrossRef]
- Tao, S.Y.; Chen, L.X. A review of recent research on the East Asian summer monsoon in China. In Monsoon Meteorology; Oxford University Press: Oxford, UK, 1987; pp. 60–92. [Google Scholar]
- Zolina, O.; Simmer, C.; Belyaev, K.; Gulev, S.K.; Koltermann, P. Changes in the duration of European wet and dry spells during the last 60 years. J. Clim. 2013, 26, 2022–2047. [Google Scholar] [CrossRef]
- Kunkel, K.E.; Andsager, K.; Easterling, D.R. Longterm trends in extreme precipitation events over the conterminous United States and Canada. J. Clim. 1999, 12, 2515–2527. [Google Scholar] [CrossRef] [Green Version]
- Ding, Y.H. Study on the Persistent Heavy Rainfall over the Yangtze River Valley and Huaihe River Basin in 1991; China Meteorological Press: Beijing, China, 1993; 255p. [Google Scholar]
- Chen, Y.; Zhai, P.M. Two types of typical circulation pattern for persistent extreme precipitation in Central–Eastern China. Q. J. R. Meteorol. Soc. 2014, 140, 1467–1478. [Google Scholar] [CrossRef]
- Zou, X.K.; Ren, F.M. Changes in regional heavy rainfall events in China during 1961–2012. Adv. Atmos. Sci. 2015, 32, 704–714. [Google Scholar] [CrossRef]
- Sun, B.; Wang, H.J. Interannual variation of the spring and summer precipitation over the three river source region in China and the associated regimes. J. Clim. 2018, 31, 7441–7457. [Google Scholar] [CrossRef]
- Chen, Y.; Zhai, P.M.; Liao, Z.; Li, L. Persistent precipitation extremes in the Yangtze River Valley prolonged by opportune configuration among atmospheric teleconnections. Q. J. R. Meteorol. Soc. 2019, 145, 2603–2626. [Google Scholar] [CrossRef]
- Kang, Y.Z.; Peng, X.D.; Wang, S.G.; Dong, C.Q.; Shang, K.Z.; Zhao, Y. Statistical Characteristics and Synoptic Situations of Long-Duration Heavy Rainfall Events Over North China. Earth Space Sci. 2020, 7, e2019EA000923. [Google Scholar] [CrossRef] [Green Version]
- Wang, H.J.; Sun, J.H.; Fu, S.M.; Zhang, Y.C. Typical circulation patterns and associated mechanisms for persistent heavy rainfall events over Yangtze–Huaihe River Valley during 1981–2020. Adv. Atmos. Sci. 2021, 38, 2167–2182. [Google Scholar] [CrossRef]
- Du, H.; Alexander, L.V.; Donat, M.G.; Lippmann, T.; Srivastava, A.; Salinger, J.; Kruger, A.; Choi, G.; He, H.S.; Fujibe, F.; et al. Precipitation from persistent extremes is increasing in most regions and globally. Geophys. Res. Lett. 2019, 46, 6041–6049. [Google Scholar] [CrossRef] [Green Version]
- Zhang, W.X.; Furtado, K.; Wu, P.L.; Zhou, T.J.; Chadwich, R.; Marzin, C.; Rostron, J.; Sexton, D. Increasing precipitation variability on daily-to-multiyear time scales in a warmer world. Sci. Adv. 2021, 7, eabf2081. [Google Scholar] [CrossRef] [PubMed]
- Yu, R.; Zhai, P.M. Changes in summer persistent precipitation over the middle–lower reaches of the Yangtze River and associated atmospheric circulation patterns. J. Meteorol. Res. 2021, 35, 393–401. [Google Scholar] [CrossRef]
- Zhu, L.; Meng, Z.; Zhang, F.; Markowski, P.M. The influence of sea- and land-breeze circulations on the diurnal variability of precipitation over a tropical island. Atmos. Chem. Phys. 2017, 17, 13213–13232. [Google Scholar] [CrossRef] [Green Version]
- Zhu, L.; Chen, X.; Bai, L. Relative Roles of Low-Level Wind Speed and Moisture in the Diurnal Cycle of Rainfall over a Tropical Island Under Monsoonal Flows. Geophys. Res. Lett. 2020, 47, e2020GL087467. [Google Scholar] [CrossRef]
- Feng, W.; Fu, S.H.; Wu, Y. Distribution characteristics of low level jet in north-central South China Sea and its formation mechanism. J. Trop. Meteor. 2015, 31, 247–254. (In Chinese) [Google Scholar]
- Feng, W.; Fu, S.H.; Zhao, F.Z. Circulation of extreme rainstorm and its anomalous characteristics during post-flood period of the last decade in Hainan Island. Meteorol. Mon. 2015, 41, 143–152. (In Chinese) [Google Scholar]
- Feng, W.; Zhou, L.L.; Xiao, C.; Fu, S.H. The spatial and temporal characteristics of the autumn flood season rainfall in Hainan Island and its associated circulation features. J. Trop. Meteorol. 2016, 32, 533–545. (In Chinese) [Google Scholar]
- Ma, X.K.; Fu, J.L.; Cao, D.B. Study on physical mechanism of persistent heavy rainfall event in autumn 2008 over Hainan. Meteorol. Mon. 2012, 38, 795–803. (In Chinese) [Google Scholar]
- Trenberth, K.E.; Guiliemot, C.J. Evaluation of the global atmospheric moisture budget as seen from analyses. J. Clim. 1995, 8, 2255–2272. [Google Scholar] [CrossRef] [Green Version]
- Zhou, T.J.; Yu, R.C. Atmospheric water vapor transport associated with typical anomalous summer rainfall patterns in China. J. Geophys. Res. 2005, 110, D08104. [Google Scholar] [CrossRef] [Green Version]
- Ross, R.J.; Elliott, W.P. Radiosonde-based Northern Hemisphere tropospheric water vapor trends. J. Clim. 2001, 14, 1602–1611. [Google Scholar] [CrossRef]
- Trenberth, K.E.; Fasullo, J.; Smith, L. Trends and variability in column-integrated atmospheric water vapor. Clim. Dyn. 2005, 24, 741–758. [Google Scholar] [CrossRef]
- Zhai, P.; Eskridge, R.E. Atmospheric water vapor over China. J. Clim. 1997, 10, 2643–2652. [Google Scholar] [CrossRef]
- Jiang, Z.; Jiang, S.; Shi, Y.; Liu, Z.; Li, W.; Li, L. Impact of moisture source variation on decadal-scale changes of precipitation in North China from 1951 to 2010. J. Geophys. Res. Atmos. 2017, 122, 600–613. [Google Scholar] [CrossRef]
- Ross, R.J.; Elliott, W.P. Tropospheric water vapor climatology and trends over North America: 1973–1993. J. Clim. 1996, 9, 3561–3574. [Google Scholar] [CrossRef] [Green Version]
- Zveryaev, I.I.; Chu, P.S. Recent Climate Changes in Precipitable Water in the Global Tropics as Revealed in National Centers for Environmental Prediction/National Center for Atmospheric Research Reanalysis. J. Geophys. Res. Atmos. 2003, 108, 4311. [Google Scholar] [CrossRef]
- Gao, S.; Zhai, S.; Chen, B. Water budget and intensity change of tropical cyclones over the western North Pacific. Mon. Weather Rev. 2017, 145, 3009–3023. [Google Scholar] [CrossRef]
- Zhang, M.R.; Meng, Z.Y. Impact of synoptic-scale factors on rainfall forecast in different stages of a persistent heavy rainfall event in South China. J. Geophys. Res. Atmos. 2018, 123, 3574–3593. [Google Scholar] [CrossRef]
- Huang, W.; He, X.; Yang, Z.; Qiu, T.; Wright, J.S.; Wang, B.; Lin, D. Moisture sources for wintertime extreme precipitation events over South China during 1979–2013. J. Geophys. Res. Atmos. 2018, 123, 6690–6712. [Google Scholar] [CrossRef]
- Yuan, Z.; Zhuge, X.; Wang, Y. The forced secondary circulation of the Mei-yu front. Adv. Atmos. Sci. 2020, 37, 766–780. [Google Scholar] [CrossRef]
- Barnes, S.L. A technique for maximizing details in numerical weather map analysis. J. Appl. Meteorol. Climatol. 1964, 3, 396–409. [Google Scholar] [CrossRef] [Green Version]
- Xu, X.; Xue, M.; Wang, Y.; Huang, H. Mechanisms of secondary convection within a mei-yu frontal mesoscale convective system in eastern China. J. Geophys. Res. Atmos. 2017, 122, 47–64. [Google Scholar] [CrossRef]
- Xue, M.; Luo, X.; Zhu, K.; Sun, Z.; Fei, J. The controlling role of boundary layer inertial oscillations in Meiyu frontal precipitation and its diurnal cycles over China. J. Geophys. Res. Atmos. 2018, 123, 5090–5115. [Google Scholar] [CrossRef]
- Hoskins, B.J.; McIntyre, M.E.; Robertson, A.W. On the use and significance of isentropic potential vorticity maps. Q. J. R. Meteorol. Soc. 1985, 111, 877–946. [Google Scholar] [CrossRef]
- Hawkins, H.F.; Rosenthal, S.L. On the computation of stream functions from the wind field. Mon. Weather Rev. 1965, 93, 245–252. [Google Scholar] [CrossRef] [Green Version]
- Krishnamurti, T.N. A diagnostic balance model for studies of weather systems of low and high latitudes, Rossby number less than 1. Mon. Weather Rev. 1968, 96, 197–207. [Google Scholar] [CrossRef]
- Fu, S.M.; Cao, J.; Jiang, X.W.; Sun, J.H. On the variation of divergent flow: An eddy-flux form equation based on the quasi-geostrophic balance and its application. Adv. Atmos. Sci. 2017, 34, 599–612. [Google Scholar] [CrossRef]
- You, C.; Fung, J. Characteristics of the Sea-Breeze Circulation in the Pearl River Delta Region and Its Dynamical Diagnosis. J. Appl. Meteorol. Climatol. 2019, 58, 741–755. [Google Scholar] [CrossRef]
- Ullah, W.; Guojie, W.; Gao, Z.; Tawia Hagan, D.F.; Bhatti, A.S.; Zhua, C. Observed Linkage between Tibetan Plateau Soil Moisture and South Asian Summer Precipitation and the Possible Mechanism. J. Clim. 2020, 34, 361–377. [Google Scholar] [CrossRef]
- Ullah, W.; Wang, G.; Lou, D.; Ullah, S.; Bhatti, A.S.; Ullah, S.; Karim, A.; Hagan, D.F.T.; Ali, G. Large-scale atmospheric circulation patterns associated with extreme monsoon precipitation in Pakistan during 1981–2018. Atmos. Res. 2021, 232, 105489. [Google Scholar] [CrossRef]
- Daley, R. Atmospheric Data Analysis; Cambridge University Press: Cambridge, UK, 1991; p. 457. [Google Scholar]
- Parrish, D.F.; Derber, J.C. The National Meteorological Center’s spectral statistical interpolation analysis system. Mon. Weather Rev. 1992, 20, 1747–1763. [Google Scholar] [CrossRef]
- Xu, Q.; Liu, S.; Xue, M. Background error covariance functions for vector wind analyses using Doppler radar radial-velocity observations. Q. J. R. Meteorol. Soc. 2006, 132, 2887–2904. [Google Scholar] [CrossRef]
- Xu, Q.; Nai, K.; Wei, L. An innovation method for estimating radar radial-velocity observation error and background wind error covariances. Q. J. R. Meteorol. Soc. 2007, 133, 407–415. [Google Scholar] [CrossRef]
- Joyce, R.J.; Janowiak, J.E.; Arkin, P.A.; Xie, P.P. CMORPH: A method that produces global precipitation estimates from passive microwave and infrared data at high spatial and temporal resolution. J. Hydrometeorol. 2004, 5, 487–503. [Google Scholar] [CrossRef]
- Hersbach, H.; Bell, B.; Berrisford, P.; Biavati, G.; Horányi, A.; Muñoz Sabater, J.; Nicolas, J.; Peubey, C.; Radu, R.; Rozum, I.; et al. ERA5 Hourly Data on Pressure Levels from 1979 to Present. 2018. Available online: https://cds.climate.copernicus.eu/cdsapp#!/dataset/reanalysis-era5-pressure-levels?tab=overview (accessed on 16 December 2021).
- Dee, D.P.; Uppala, S.M.; Simmons, A.J.; Berrisford, P.; Poli, P.; Kobayashi, S.; Andrae, U.; Balmaseda, M.A.; Balsamo, G.; Bauer, D.P.; et al. The ERA-interim reanalysis: Configuration and performance of the data assimilation system. Q. J. R. Meteorol. Soc. 2011, 137, 553–597. [Google Scholar] [CrossRef]
- Yanai, M.; Esbensen, S.; Chu, J.H. Determination of bulk properties of tropical cloud clusters from large-scale heat and moisture budgets. J. Atmos. Sci. 1973, 30, 611–627. [Google Scholar] [CrossRef]
- Ninomiya, K.; Kobayashi, C. Precipitation and moisture balance of the Asian summer monsoon in 1991. Part 2: Moisture transport and moisture balance. J. Meteorol. Soc. Jpn. 1999, 77, 77–99. [Google Scholar] [CrossRef] [Green Version]
- Murakami, T. The general circulation and water-vapor balance over the Far East during the rainy season. Geophys. Mag. 1959, 29, 131–171. [Google Scholar]
- Ninomiya, K.; Akiyama, T. The development of the medium-scale disturbance in the Baiu front. J. Meteorol. Soc. Jpn. 1971, 49, 663–672. [Google Scholar] [CrossRef]
- Fairall, C.W.; Bradley, E.F.; Hare, J.E.; Grachev, A.A.; Edson, J.B. Bulk parameterization of air-sea fluxes: Updates and verification for theCOARE3.0 algorithm. J. Clim. 2003, 16, 571–591. [Google Scholar] [CrossRef]
- Cao, J.; Xu, Q.; Ma, S.; Chen, H. Hybrid Methods for Computing Streamfunction and Velocity Potential for Complex Flow Fields over Mesoscale Domains. Adv. Atmos. Sci. 2021; in press. [Google Scholar] [CrossRef]
- Dimego, G.; Bosart, L. The transformation of tropical storm Agnes into an extratropical cyclone. Part II: Moisture, vorticity and kinetic energy budgets. Mon. Weather Rev. 1982, 110, 412–433. [Google Scholar] [CrossRef] [Green Version]
- Ma, S.; Cao, J.; Zhao, H.; Zhou, X.; Ran, L. Decomposition of water vapor flux divergence and its application to a blizzard event over Ili Valley in Central Asia during 30 Nov to 1 Dec 2018. Atmos. Res. 2022, 270, 106079. [Google Scholar] [CrossRef]
Figure 1.
(a) ERA5 reanalysis of the 500-hPa geopotential height (contours, units: dagpm) and precipitable water (shading, units: mm) averaged over 144 h from 0000 UTC 14 to 2300 UTC 19, with the red box indicating the domain for (d). (b) 925-hPa stream field and equivalent potential temperature (shading, units: K), and horizontal wind with speed above 16 m s−1 (a full bar represents 4 m s−1) at 0400 UTC 18. (c) Time series of horizontal wind speed (unit: m s−1) from 1200 UTC 15 to 0000 UTC 20 October at (110.5° E, 18.5° N), with blue and red bars at the bottom indicating early and later stages respectively. (d) Observed 60-h accumulated precipitation (color dots, units: mm) ending 1200 UTC 18 October, topography of Hainan Island (shading, units: m) with green and blue triangles denoting the locations of Wanning and Sanya, green and blue rectangles denoting the southeast and south coasts respectively, and red pins denoting locations of Doppler radar stations as listed in Table 1.

Figure 2.
(a) Comparision of the 24 h accumulated rainfall (mm) that was initialized at 0000 UTC 16, ending 1200 UTC 17, between the observed (shaded) and the simulation (contoured) generated by the ECMWF model. (b) as (a) but ending 1200 UTC 18, initialized at 0000 UTC 17.
Figure 2.
(a) Comparision of the 24 h accumulated rainfall (mm) that was initialized at 0000 UTC 16, ending 1200 UTC 17, between the observed (shaded) and the simulation (contoured) generated by the ECMWF model. (b) as (a) but ending 1200 UTC 18, initialized at 0000 UTC 17.

Figure 3.
Composite radar reflectivity images (a,d; units: dBZ, shaded; blue and red arrows denote MCS1 and MCS 2 respectively) of 6 Doppler Radars (locations denoted in Figure 1d), hourly large-scale precipitation (b,e, shaded, units: mm) and convective precipitation (c,f, shaded, units: mm) at 1500 UTC 16 October and 0100 UTC 18 October 2020.


Figure 4.
Pressure-time profile of horizontal wind (vectors, units: m·s−1) overlaid with hourly precipitation (units: mm·h−1) at Wanning (denoted by green triangle in Figure 1d).
Figure 4.
Pressure-time profile of horizontal wind (vectors, units: m·s−1) overlaid with hourly precipitation (units: mm·h−1) at Wanning (denoted by green triangle in Figure 1d).

Figure 5.
Pressure-time cross sections of domain averaged (a) Qvall, (b) Qvdiv, (c) QvL (shaded, units: 10−7 g·hPa−1·cm−2·s−1), and (d) QvS (d, shaded, units: 10−8 g·hPa−1·cm−2·s−1) over the southeast coast (green rectangle in Figure 1d) superimposed with hourly precipitation (units: mm·h−1), for Wanning (green triangle in Figure 1d).

Figure 6.
Pressure-time profile of horizontal wind (units: m·s−1) overlaid with hourly precipitation (units: mm·h−1) at Sanya (denoted by blue triangle in Figure 1d).
Figure 6.
Pressure-time profile of horizontal wind (units: m·s−1) overlaid with hourly precipitation (units: mm·h−1) at Sanya (denoted by blue triangle in Figure 1d).

Figure 7.
Pressure-time cross sections of domain averaged (a) Qvall, (b) Qvdiv, (c) QvL (shaded, units: 10−7 g·hPa−1·cm−2·s−1), and (d) QvS (d, shaded, units: 10−8 g·hPa−1·cm−2·s−1) over the south coast (blue rectangle in Figure 1d) superimposed with hourly precipitation (units: mm·h−1), for Sanya (blue triangle in Figure 1d).

Figure 8.
(a) Qvall, (b) Qvdiv, (c) QvL (shaded, units: 10−7 g·hPa−1·cm−2·s−1), and (d) QvS (shaded, units: 10−8 g·hPa−1·cm−2·s−1) at 925 hPa averaged over the later stage.
Figure 8.
(a) Qvall, (b) Qvdiv, (c) QvL (shaded, units: 10−7 g·hPa−1·cm−2·s−1), and (d) QvS (shaded, units: 10−8 g·hPa−1·cm−2·s−1) at 925 hPa averaged over the later stage.

Figure 9.
(a–c): Hourly precipitation (units: mm) using the CMORPH data set, and (d–f) QvS (contours at interval of 1 × 10⁻⁸ g·hPa−1·cm−2·s−1) superimposed with divergent wind vectors (units: m·s−1) at 925 hPa at 0000, 0600 and 1000 UTC 17 October 2020.
Figure 9.
(a–c): Hourly precipitation (units: mm) using the CMORPH data set, and (d–f) QvS (contours at interval of 1 × 10⁻⁸ g·hPa−1·cm−2·s−1) superimposed with divergent wind vectors (units: m·s−1) at 925 hPa at 0000, 0600 and 1000 UTC 17 October 2020.


Table 1.
Details of adopted ERA reanalysis data and surface observation data.
| ERA5 (0.25° × 0.25°) | S-Band Doppler Radar Stations | Key Rain Gauge Stations and Areas | ||||
|---|---|---|---|---|---|---|
| Variable Name in Product | Temporal Resolution | Name | Location | Name | Location/Domain | |
| Precipitation | LSP (Large scale precipitation) | 1 h | Haikou | 110.245° E, 19.9960° N | Haikou | 109.59° E, 18.22° N |
| CP (convective precipitation) | 1 h | Sanya | 109.5910° E, 18.228° N | Sanya | 109.59° E, 18.22° N | |
| Divergence | d | 1 h | Dongfang | 108.731° E, 19.215° N | the southeast coast | 110–111° E, 18.0–19.0° N |
| Geopotential | z | 1 h | Xisha | 112.333° E, 16.833° N | ||
| Specific humidity | q | 1 h | Zhanjiang | 110.526° E, 21.012° N | the south coast | 109.5–110° E, 17.5–18.5° N |
| Temperature | t | 1 h | Yangjiang | 111.979° E, 105.7656° N | ||
| U component of wind | u | 1 h | ||||
| V component of wind | V | 1 h | ||||
Publisher’s Note: MDPI stays neutral with regard to jurisdictional claims in published maps and institutional affiliations. |
© 2022 by the authors. Licensee MDPI, Basel, Switzerland. This article is an open access article distributed under the terms and conditions of the Creative Commons Attribution (CC BY) license (https://creativecommons.org/licenses/by/4.0/).
Share and Cite
MDPI and ACS Style
Wu, Z.; Cao, J.; Zhao, W.; Ke, Y.; Li, X. An Observational Analysis of a Persistent Extreme Precipitation Event in the Post-Flood Season over a Tropical Island in China. Atmosphere 2022, 13, 679. https://doi.org/10.3390/atmos13050679
AMA Style
Wu Z, Cao J, Zhao W, Ke Y, Li X. An Observational Analysis of a Persistent Extreme Precipitation Event in the Post-Flood Season over a Tropical Island in China. Atmosphere. 2022; 13(5):679. https://doi.org/10.3390/atmos13050679
Chicago/Turabian StyleWu, Zhiyan, Jie Cao, Wei Zhao, Yuanhui Ke, and Xun Li. 2022. "An Observational Analysis of a Persistent Extreme Precipitation Event in the Post-Flood Season over a Tropical Island in China" Atmosphere 13, no. 5: 679. https://doi.org/10.3390/atmos13050679
Note that from the first issue of 2016, this journal uses article numbers instead of page numbers. See further details here.