Article

A Numerical Simulation of the Development Process of a Mesoscale Convection Complex Causing Severe Rainstorm in the Yangtze River Delta Region behind a Northward Moving Typhoon

1
National Meteorological Centre, Beijing 100081, China
2
Shanghai Central Meteorological Observatory, Shanghai 200030, China
*
Author to whom correspondence should be addressed.
Atmosphere 2022, 13(3), 473; https://doi.org/10.3390/atmos13030473
Submission received: 19 January 2022 / Revised: 3 March 2022 / Accepted: 10 March 2022 / Published: 14 March 2022
(This article belongs to the Special Issue Meteorological Extremes in China)

Abstract

:
In recent years, due to the influence of global warming, extreme weather events occur frequently, such as the continuous heavy precipitation, regional high temperature, super typhoon, etc. Tropical cyclones make frequent landfall, heavy rains and flood disasters caused by landfall typhoons have a huge impact, and typhoon rainstorms are often closely related to mesoscale and small-scale system activities. The application 2020 NCEP (National Centers for Environmental Prediction) final operational global analysis data and WRF (Weather Research and Forecasting model, version 3.9) mesoscale numerical prediction model successfully simulates the evolution characteristics of the mesoscale convective complex (MCC) that caused an extreme rainstorm in the Yangtze River delta region behind a northwards typhoon in this article. The results show that a meso-β-scale vortex existed in the mid- to upper troposphere in the region where the MCC occurred; accompanied by the occurrence of the meso-β-scale vortex, the convective cloud clusters developed violently, and its shape is a typical vortex structure. The simulation-sensitive experiment shows that the development of the meso-β-scale cyclonic vortex is the main reason for the enhancement of MCC. The occurrence and development of the MCC is manifested as a vertical positive vorticity column and a strong vertical ascending motion region in the dynamic field. In the development and maturity stage of the MCC, the vorticity and vertical rising velocity in the MCC area are significantly greater than those in the weakened typhoon circulation, which shows significant mesoscale convective system characteristics. The diagnostic analysis of the vorticity equation shows that the positive vorticity advection caused by the meso-β-scale cyclonic vortex in the mid- to upper troposphere plays important roles in the development of the MCC. Enhanced low-level convergence enhances vertical ascending motion. The convective latent heat release also plays an important role on the development of the MCC, changes the atmospheric instability by heating, enhances the upward movement, and delivers positive vorticity to the upper level, making the convection develop higher, forming a positive feedback mechanism between low-level convergence and high-level divergence. The simulation-sensitive experiment also shows that the meso-β-scale cyclonic vortex formation in this process is related to convective latent heat release.

1. Introduction

In recent years, due to the influence of global warming, continuous heavy precipitation, regional high temperature, super typhoons, extreme weather events, et al. occur frequently, and these will have a serious impact on economic activities and human activities. Among them, the most important impact of typhoons on China is the rainstorm and flood disasters caused by landfall typhoons. Several record-breaking rainstorm disasters in China’s history are all related to typhoons [1]. The study of heavy precipitation caused directly and indirectly by typhoons has always been a hot and difficult point for meteorologists. Tropical cyclones make frequent landfall, and the disaster losses caused are also very serious [2,3]. Recent studies have shown that almost all strong typhoons have experienced a rapid enhancement process [4].
Numerical weather forecasting is an important technical support for the modern weather forecast. At present, the National Center for Environmental Prediction from the US (NCEP) and the European Centre for Medium-Range Weather Forecasts (ECMWF) are two leading NWPs for medium-range weather forecasting at the global scale, widely used in modern weather forecasting. Although the horizontal resolution of the model has been significantly improved more than in the past, the forecasting ability for medium- and small-scale systems is still limited, and the ECMWF current horizontal resolution of global models (approximately 10 km) is still believed to limit the ability to predict intense cyclones due to the sharp gradient in the core [5]. The Weather Research and Forecasting (WRF) Model is an atmospheric model designed for both research and numerical weather prediction (NWP) [6]. WRF’s forte is resolving smaller-scale atmospheric and land surface processes better than the global models traditionally used for climate projections [7]. WRF research applications are the mesoscale processes associated with extratropical cyclones, fronts, organized convection and tropical cyclones, et al. [8,9,10,11,12]. WRF has become a true community model. WRF has grown to provide specialty capabilities for a range of Earth system prediction applications [7], such as air chemistry, hydrology, wildland fires, hurricanes, and regional climate [13,14,15,16,17,18,19].
Landing typhoons are an important weather system that causes heavy precipitation. There are many factors that affect the intensity and range of typhoons rainstorms, involving the vortex structure of the typhoon itself, the environmental field around the typhoon, the underlying surface, etc. [20,21,22,23]. The landing typhoon brings abundant water vapor and unstable energy and the mesoscale system caused by typhoons, which will affect the intensity and range of rainstorm. Recent research by Chen et al. [24] pointed out that typhoon precipitation can be divided into two categories: rainfall inside and outside the typhoon circulation. The heavy rainfall inside the typhoon circulation is summarized as five fall areas: eye wall heavy rain, spiral rain belt heavy rain, small vortex, inverted trough rainstorms, and shear rainstorms. The heavy rainfall outside the typhoon is summarized as pre-typhoon squall line rainstorms, long-distance rainstorms, and downstream transition effect rainstorms. Wang et al. [25] also point out that a typhoon can produce tremendous rainfall in its eyewall and in both its inner and outer spiral rain bands [26,27,28,29]. This is generally referred to as direct effect of a typhoon on precipitation, or precipitation induced by the typhoon itself. On the other hand, when a strong interaction with other synoptic systems, such as upper-level trough and cold frontal systems in the mid-latitude, occurs, a typhoon can induce heavy rainfall far away; such an effect of a typhoon on precipitation in a remote area is generally referred to as an indirect or remote effect of a typhoon on precipitation [30,31].
Typhoon rainstorms are often closely related to mesoscale and small-scale system activities. Typhoon rain consists of a convective regime in the eyewall and both stratiform and convective rain in the outer region [32,33,34]. The shear or convergence lines in the intensified typhoon often lead to development of strong convection forming rain clusters; when the rain clusters move to these intermediate-scale convergence or shear lines, them all will be strengthened [35]. Li et al. [36] also pointed out that mesoscale systems such as mesoscale convergence lines are the direct cause of strong convections, which not only generate heavy rain convective cloud clusters, but also contribute to the maintenance of tropical cyclones, which can lead to the continuous occurrence of heavy rainfall by landing typhoons. A midlevel mesoscale convective vortex (MCV) is often generated in MCS (s) with severe convection [37]. Once formed, the MCV often continues to exist after its initiating parent MCS has weakened or even dissipated. Zehr [38] finds that low-level vortex intensification sometimes follows bursts of intense deep convection. Montgomery et al. [39] suggested that this deep convective, low-level vortex enhancement is taking place within the MCSs well before the system-scale vortex becomes self-sustainable. The vortical hot towers (VHTs) with spatial scales of 10–20 km play an important role during the process [39,40,41,42].
From the night of 4 August to the morning of 5 August 2020 (Beijing time, same for the rest of the paper), heavy rainfall occurred in Shanghai and northern Zhejiang. The rainfall in northern Zhejiang and most parts of Shanghai reached torrential rain; it was a local extraordinary rainstorm. This precipitation process was caused by a MCC that gradually developed and strengthened within the shear line on the southern side of typhoon “Hagupit”. By studying the occurrence and development mechanism of the MCC, it has an important reference value for improving the forecasting ability of rainstorms caused by multi-scale weather systems under the typhoon situation.

2. Materials and Methods

2.1. Materials

The following data are used in this study. (1) The typhoon track data provided by the National Meteorological Center, including the location and intensity of the typhoon. (2) The hour-by-hour infrared satellite cloud image of fy-4A provided by the National Satellite Meteorological Center is used to identify the mesoscale convective complex (MCC). (3) The air pressure, wind field, and rainfall data every 3 h are from the national surface meteorological observation station to analyze the mesoscale characteristics of surface precipitation. (4) Simulations are performed using the mesoscale model WRF of the National Institute of Atmospheric Research (NCAR).

2.2. Methods

The method used in this paper is a numerical simulation experiment and diagnostic analysis. The ARW-WRF (version 3.9) mesoscale model of the National Center for Atmospheric Research (NCAR) is used to simulate this process (Skamarock et al. [6]). The model adapts a two-layer nested grid, and the outer coarse grid is 299 × 299 × 50 with horizontal resolution of 9 km. The inner fine grid is 375 × 375 × 50 with horizontal resolution of 3 km. The initial integration time is 4 August at 08:00, integrating 36 h and ending at 20:00 on 5 August, using Lin microphysics scheme, YSU boundary layer parameterization, PRTM longwave, and Dudhia shortwave radiation schemes. The initial field of the outer grid and boundary conditions is obtained by interpolation from the 0.5° reanalysis data of the NCEP global model.

3. The Overview of the Weather Process

3.1. The Observed Precipitation

The No. 4 typhoon “Hagupit” in 2020 formed on the ocean east of Taiwan at 20:00 on 1 August, and intensified into a strong typhoon (STY) in the East China Sea at 14:00 on the on 3 August (the maximum wind speed near the center of the typhoon was 42 m   s 1 ), and at 03:30 on the 4th, it landed on the coast of Yueqing, Zhejiang Province, with a maximum wind speed of 38 m   s 1 near the typhoon center when it landed. After landing, the typhoon moved northward in a northerly path. It passed through Taihu Lake at night on the 4th, turned northeastward in the early morning of the 5th, and entered the Yellow Sea. The reports ended at 02:00 on the 6th (Figure 1a). Typhoon “Hagupit” affected 1.88 million people in thirty counties (cities and districts) of five cities, in Zhejiang and Shanghai, with direct economic losses of 10.46 billion yuan [43].
After the landing typhoon “Hagupit” moved northward, severe rainstorm occurred in the Yangtze River Delta region on the 24-h rainfall distribution map from 20:00 on the 4th to 20:00 on the 5th (Figure 1b). The rainstorms mainly occurred in northern Zhejiang, Shanghai, and southern Jiangsu. In particular, heavy rainstorms generally occurred in Shanghai and northern Zhejiang. The largest 24-h precipitation amount was 314 mm, measured in Zhejiang Pinghu Station, followed by Shanghai Jinshan with 264 mm.
From the 3-h interval time sequence diagram of the ground air pressure and precipitation of the above-mentioned Jinshan and Pinghu ground-based automatic weather stations with the largest rainfall in 24 h (Figure 2), it was consistent with the typhoon path in Figure 1a. The typhoon center arrived in northern Zhejiang at around 17:00 on the 4th. At this time, the ground air pressure of Jinshan and Pinghu was the lowest; after 20:00, the typhoon center gradually moved away from the north, and the ground pressure of the two stations rose significantly (Figure 2b). Shen et al. [44] studied the characteristics of tropical cyclone rainstorms in East China and the forecast of its fall area, pointing out that 68% of tropical cyclone rainstorms occurred within 4–6 latitudes in front of tropical cyclones, while they occur less in the 2 latitude distances behind and in the center of tropical cyclones. However, judging from the time distribution of rainfall in this process (Figure 2a), before the approach of the typhoon, the two stations only rained sporadically, and the rainfall did not exceed 10 mm in 3 h; as the typhoon crossed the same latitude and moved northward, the rainfall increased significantly. From 20:00 on the 4th to 08:00 on the 5th, the cumulative rainfall of Jinshan and Pinghu stations exceeded 250 mm, reaching the level of heavy rain. From 05:00 to 08:00 on the August 5th, the rainfall reached 95 mm and 99 mm, respectively. It is thus clear that the heavy rainstorms occurred after the typhoon center moved northward, and the rainfall amount and intensity were greater than the typhoon’s main body rainfall after it landed. The forecasting was difficult, which was an important cause of serious meteorological disasters and economic losses.

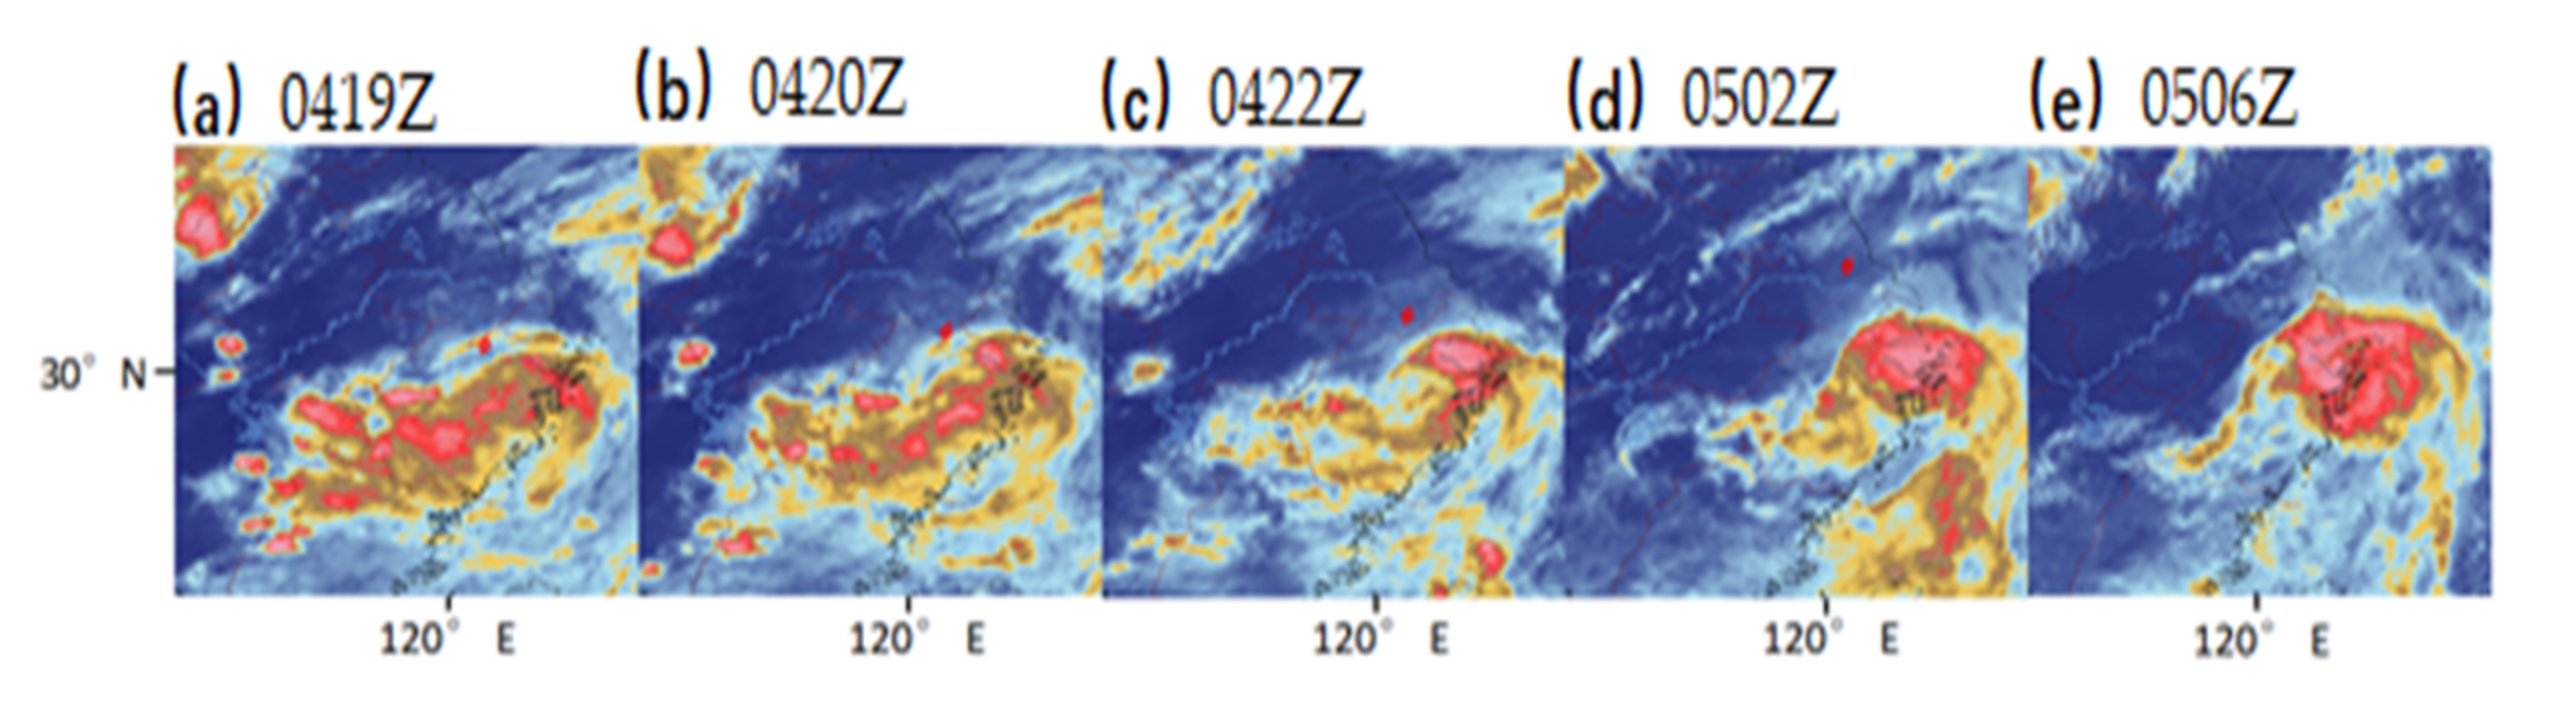
3.2. Occurrence and Development of MCC

Further analysis was performed on the characteristics of the FY-4A infrared satellite cloud image when rainstorms occur (Figure 3). It can be found from the maps at 19:00 and 20:00 on the 4th (Figure 3a,b) that a convective cloud cluster formed at the eastern end of the spiral rain belt surrounding the typhoon in the west of Hangzhou Bay, Zhejiang, which is the initial stage of MCC development. After that, the convective cloud cluster developed and strengthened rapidly, mainly to the easterly direction to develop and strengthen, while other convective cloud clusters on the spiral rain belt weakened rapidly (Figure 3c). By 02:00 on the 5th (Figure 3d), the spiral rain belt basically dissipated, but the convective cloud cluster continued to increase, and its range covered the entire Hangzhou Bay. At this time, the cloud top TBB value was less than −32 °C and the area had reached 1.05 ×   10 5   km 2 , less than −52 °C with the area which had reached 5.13 ×   10 4   km 2   (Figure 4). It reached Maddox’s [45,46] definition criteria for MCC (cold cloud cover area ≥ 10 ×   10 4   km 2 at −32 °C, cold cloud cover area ≥ 5 × 10 4   km 2 at −52 °C, duration should be ≥ 6 h, elliptical eccentricity ≤0.7). By 06:00 on the 5th (Figure 3e), the MCC continued to strengthen, extending northward to the north of Shanghai and southward to the northeast of Zhejiang. Its center was located in Hangzhou Bay, and the location was basically moving less, the shape closer to a circle and the structure denser. At 08:00 on the 5th (figure omitted), the MCC began to weaken significantly, and the shape became irregular. At 10:00 on the 5th, the area of TBB value of the cloud top less than −32 °C was 1.25 ×   10 5   km 2 , and the cloud top TBB value less than −52 °C was 4.45 × 10 4   km 2 , which no longer has the characteristics described by Maddox.
In the development process of the MCC, from the generation stage to the dissipation stage, the life history met the MCC conditions from 02:00 to 10:00 on August 5 (Figure 4), lasting about 8 h. With the MCC is stable and with less movement in its life history process, its center position only moves southward by less than 0.5 latitude, which belongs to a typical meso-β-scale MCC. It can be seen that during the process of the MCC, the typhoon “Hagupit” moved rapidly northward, the spiral rain belt surrounding the typhoon did not move with the typhoon, but gradually weakened and dissipated; however, the convective cloud clusters at the easternmost position of the spiral rain belt over Hangzhou Bay gradually developed into MCC, the MCC lasted for a long time, and it was stable and seldom moved, which caused the extremely heavy rains in Shanghai and northern Zhejiang.

4. Numerical Simulation Diagnostic Analysis

4.1. Precipitation Simulation Results

From the comparison of the 24-h accumulated rainfall (Figure 5a) simulated by the fine model and the observed precipitation (Figure 1b), the rainfall distribution simulated by the model is basically consistent with the observed precipitation distribution. The rainstorm (≥50 mm) mainly occurs in northern Zhejiang, Shanghai, and southern Jiangsu, but the range of heavy rainfall simulated by the model is slightly larger. While in terms of rainfall magnitude, the models can simulate the heavy rainstorm and extra-heavy rainstorm areas well, which are basically consistent with the observation. In addition, in the simulation (Figure 5b), after closing the latent heat release of the inner 3 km grid, the rainfall is very small, and in most areas is less than 25 mm.
To further compare 3-h cumulative rainfall simulated by the fine grid model (Figure 6a–d) and the observed rainfall distribution (Figure 6e–h) at the same time period from 20:00 on 4 August 2020 to 08:00 to 5 August 2020, it is found that in this main rainfall period, the 3-h rainfall distribution simulated by the model is relatively close to the actual rainfall, especially in the strongest rainfall period from 05:00 to 08:00 on the 5th, the precipitation distribution and magnitude are very close, only before 02:00 on the 5th, and the rainfall magnitude simulated by the model was much larger than the actual rainfall, indicating that the MCC simulated by the model developed faster. In general, the model can simulate quite well the severe rainstorm caused by the MCC, and the simulated data can be used to further analyze the occurrence and development mechanism of the MCC in detail.

4.2. The Development of MCC

Through analyzing the results of the wind barbs and radar combined reflectivity factor simulated by the ARW-WRF mesoscale model with a horizontal resolution of 3 km in the inner fine grid, it is found that (figure omitted), although the low-level centers of typhoon “Hagupit” move northward rapidly, in the mid–higher level between 600 hPa~300 hPa, the typhoon vortex center moves slowly northward and gradually separates from the lower-level typhoon center. In the strong development stage of the MCC, from 03:00 to 06:00 5 August (Figure 7), a mesoscale cyclonic vortex is visible on the south side of the typhoon center circulation at 500 hPa. At 03:00 on the 5th (Figure 7a), the position of the black arrow is the center of the 500 hPa typhoon vortex, which is near the cs (Changshu City, Jiangsu), and the typhoon center on the ground was far away. On the south side of the 500 hPa typhoon center, the radar combined reflectivity above 55 dBz, which affects Shanghai and northern Zhejiang. At 04:00 to 06:00 on the 5th (Figure 7b–d), the 500 hPa typhoon vortex center has been moved over to the sea surface (black solid line arrow), but at the black dotted line arrow position there is still a mesoscale cyclonic vortex center, which is still located near the cs and nt (Nantong City, Jiangsu), the mesoscale cyclonic vortex scale is up to meso-β-scale, and the meso-β-scale cyclonic vortex center extends upwards to 300 hPa. Comparing with the radar combined reflectivity factors and analyzing, it can be found that the convective echoes show an obvious vortex-like structure, and with the occurrence of the meso-β-scale cyclonic vortex, the development of convective cloud clusters is also more intense. Many studies have shown that the more prominent midlevel vortices are believed to develop in association with the stratiform components of the mesoscale convective systems that constitute the broader disturbance [47,48,49]. Raymond et al. [50,51] think the midlevel vortex in approximate thermal wind balance may provide conditions that are especially conducive to a mode of convection that enhances lower-tropospheric convergence and spin up of low-level winds.
It is obvious that the development of the MCC is closely related to the development and strengthening of the meso-β-scale cyclonic vortex in the mid- to upper troposphere. In addition, in the simulation (Figure 7e–h), after closing the latent heat release of the inner 3 km grid, the meso-β-scale cyclonic vortex does not exist in Figure 7b–d.
In the vorticity field, divergence field, and vertical velocity field simulated by the model, the MCC occurs in the obvious large vorticity region and the strong vertical velocity rising region. In the initial occurrence stage of the MCC at 20:00 on the 4th (Figure 8a,e), the MCC is located near the east of the typhoon center, the positive vorticity maximum exceeds 48 × 10 5   s 1 , the positive vorticity column extends from the ground to about 400 hPa, and the maximum positive vorticity center is between 850–500 hPa, corresponding to the divergence field and vertical velocity field. At the same time, the convergence zone is below 850 hPa, the divergence zone is between 850–500 hPa, and there is a weak upward movement between 850 hPa and 500 hPa; the maximum value of the vertical rise velocity is about 12 Pa·   s 1 .
In the MCC development stage at 02:00 on the 5th (Figure 8b,f), the positive vorticity is significantly weakened between 850 hPa and 700 hPa in the low layers, but the range of the positive vorticity region above 700 hPa expanded, reaching 300 hPa, and the intensity is slightly strengthened. In the divergence field and vertical velocity field at the corresponding time, the low-level convergence and high-level divergence are significantly strengthened, and the high-level divergence area expands significantly upward to between 200–300 hPa; the vertical upward motion is also obviously enhanced, reaching about 25 Pa· s 1 .
In the strong development stage of MCC at 04:00 on the 5th (Figure 8c,g), not only is the positive vorticity in the mid- to upper troposphere enhanced, but also the positive vorticity in the lower troposphere develops and strengthens again, maintaining a positive vorticity column from 925 hPa to 200 hPa. The maximum vorticity value is above 48 × 10 5   s 1 . In the corresponding to the divergence field and vertical velocity field, the corresponding low-level convergence zone and high-level divergence zone are also obviously strengthened, The convergence area of the low level extends high-level sloping expansion and strengthens in the downward wind direction. The intensity of the divergence at the high-level exceeds 60 10 5     s 1 , the effect of the high-level divergent pumping at the high-level, which is beneficial to low-level convergence and vertical motion enhancement. The maximum vertical velocity exceeds 50 Pa· s 1 near 500 hPa. The convective updrafts in larger areas of moderately enhanced vorticity may cause mesoscale vortices’ generation with stronger signatures near the surface [52,53]. The rotational convergence and strong vertical ascending motion of the whole layer are favorable for the strong development of MCC.
In the weakening stage of the MCC at 08:00 on the 5th (Figure 8d,h), the large vorticity in the MCC region moves eastward and is weakened significantly. Especially in the low-level below 500 hPa, the large vorticity region is significantly weakened, and the corresponding divergence field and vertical velocity field also show that the low-level convergence and high-level divergence are obviously weakened, the vertical upward movement is obviously reduced, and the maximum vertical upward velocity is reduced to below 10 Pa·   s 1 .
It is thus clear that in the occurrence and development stage of MCC, the convergence and the vertical ascending motion are strong developments in the dynamic field. In the strong development and maturity stage of MCC, a strong vertical positive vorticity column and a strong vertical rising motion region are maintained, and the positive vorticity and vertical rising velocity are significantly larger than those at the moment of weakened typhoon circulation, showing a significant mesoscale convective system characteristic. The rotational convergence and strong vertical ascending motion of the whole layer are favorable for the development and maintenance of MCC.
To further analyze the vertical profile of the pseudo-equivalent potential temperature, which is near the MCC center (30.5° N) at the beginning of the MCC development stage (Figure 9a) and affected by the low-pressure circulation after the typhoon “Hagupit” weakening, there is a high-value area of θse over the MCC occurrence area, and on both sides of the MCC are the low-value areas of θse in the continental high pressure and the coastal subtropical high-pressure regions. The high value area of θse over the MCC area is mainly located below 700 hPa, the maximum can reach 358 K, and the area above the 700 hPa is the low value area of θse. By 02:00 and 04:00 on the 5th, in the MCC from the strongly developed (Figure 9b) to the mature stage (Figure 9c), the warm and humid air in the middle and lower level of the troposphere is further strengthened, the maximum wind speed can reach 28 m s 1 , and the warm and humid air rises obliquely to the higher-level. The high value of θse is thus extended to 500 hPa over the MCC, and the maximum value of θse exceeded 358 K. At the MCC’s weakening stage (Figure 9d), with the weakening of the subtropical high and moving eastward, the area over the MCC is mainly controlled by the westerly airflow of the north side of the continental high pressure, the low-level warm and humid airflow is significantly weakened, and the maximum value of θse is lower than 350 K. It can be seen that, influenced by the southwest warm and humid air flow, the middle and lower level of the troposphere in the region of MCC is the high value region of θse, in the high-level θse is relatively small. This strong potential unstable stratification is very beneficial to the occurrence and development of mesoscale convective systems [54].
Overall, the model not only simulates quite well the precipitation characteristics of this rainstorm process, but also reproduces the vortex-like structure of the heavy precipitation and the meso-β-scale cyclonic vortex circulation in the mid-level. Further dynamic diagnosis science also reveals the dynamic characteristics of the occurrence and development of MCCs, such as a strong vertical vorticity column where heavy precipitation occurs, strong updraft, and potential unstable stratification, which provides an important basis for analyzing the occurrence and development of MCCs.

5. MCC Occurrence and Development Mechanism

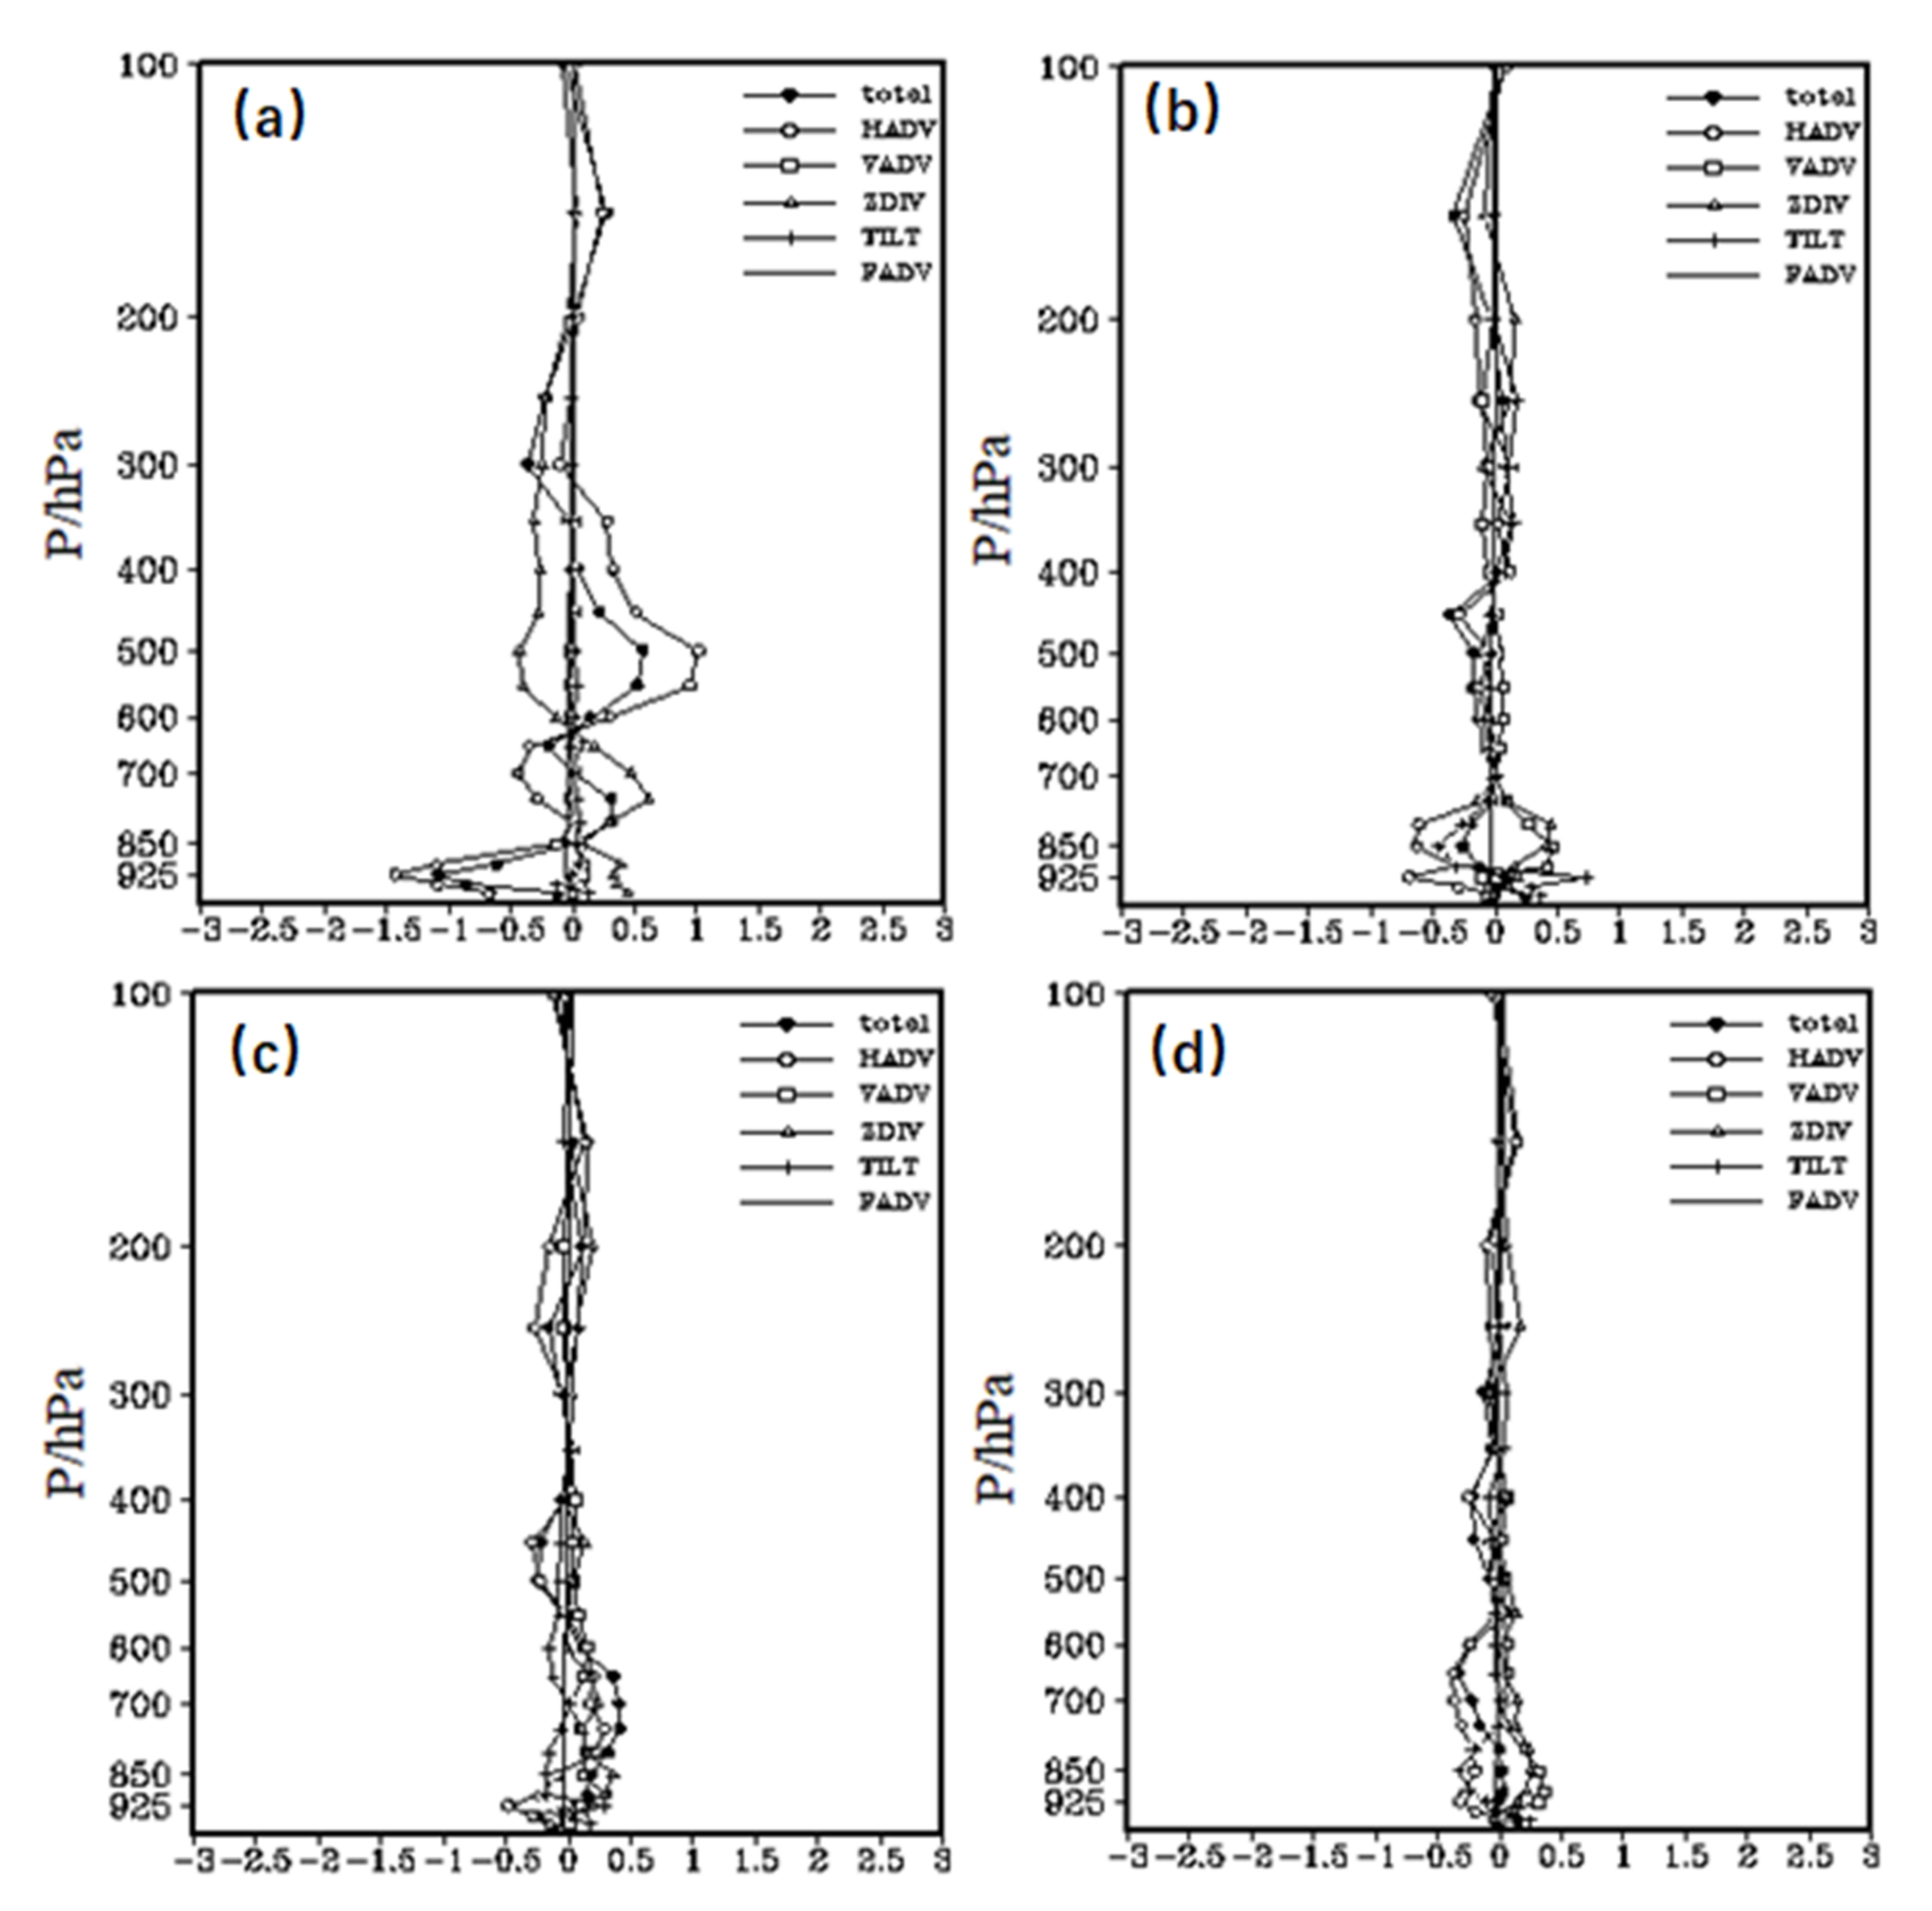
5.1. Diagnostic Analysis of Vorticity Equation

The above analysis shows that the MCC was caused by the convective cells gradually developed and strengthened east near the center of the typhoon. The convective cells developed in an original location eastward and southward to strengthen, and did not move northward with the typhoon. To explore the development mechanism of MCC when the typhoon gradually moves away, a diagnostic analysis is carried out on each calculation of the vertical vorticity equation based on the model fine grid simulation results. The vertical vorticity equation derived from the horizontal motion equation of the P coordinate system is:
  ζ   t   = ( u     ζ   x + v     ζ   y   ) ω     ζ   p v     f   y ( ζ + f )   (     u   x +   v   y   ) (     ω   x     v   Ρ   ω   y     u   Ρ   )
The vertical vorticity equation includes: −(u     ζ   x + v     ζ   y ) is a horizontal advection term of relative vorticity (HADV), −ω   ζ   p is a vertical advection term of relative vorticity (VADV), − v     f   y is a planetary vorticity advection term (FADV), −(ζ + f) (     u   x +     v   y ) is a manufacturing term of relative vorticity divergence (ZDIV), −(     ω   x     v   Ρ   ω   y     u   Ρ   ) is a inclined term (TILT), and total vorticity (total).
The analyzed area is the main area where the MCC (29–31° N, 121–124° E) generates and develops, and in this area the vertical profiles of the vorticity budget are analyzed. From the analysis of contribution factors, the advection term of planetary vorticity (FADV) is smaller than other magnitudes, and its contribution to local vorticity can be ignored as well. This paper does not analyze it, and other terms characteristics are as follows.
At the initial occurrence stage of MCC at 20:00 on the 4th (Figure 10a), the local positive vorticity tends to be above 850 hPa, and the maximum value is between 600 hPa and 500 hPa. The divergence manufacturing term, the horizontal advection term and the vertical advection term contribute positively, and the tilt term contributes negatively. Among them, the horizontal advection term contributes most in the mid- to higher level between 700 hPa and 400 hPa, the divergence production term is the largest in the lower between 850 hPa and 700 hPa, followed by the vertical advection term. All in all, in the initial development stage of MCC, since the MCC disturbance center is located about 90 km southeast of the typhoon center, in the large positive vorticity area near the typhoon center, the increase in the mid- to upper troposphere vorticity depends mainly on the horizontal advection transport of positive vorticity caused by the typhoon, while in the lower troposphere, the positive vorticity contribution is attributed to the convergence effect caused by the convective cloud clusters’ enhancement around the typhoon center, which conveys positive vorticity upwards.
In the development stage of MCC, at 02:00 on the 5th (Figure 10b), the local positive vorticity tendency is mainly located at around 700–550 hPa and below 925 hPa. The maximum positive vorticity tendency is at 500 hPa, and the other layers all have negative vorticity tendency. Likewise, the horizontal advection term is the dominant contribution of the positive vorticity trends. In any case, in this stage, the positive vorticity horizontal advection produced by the typhoon is still the main dynamic reason for the development of MCC.
In the development and the mature stage of MCC at 05:00 on the 5th (Figure 10c), below 400 hPa are mainly positive vorticity tendencies. The areas of maximum positive vorticity tendency are mainly located between 700–600 hPa, between 500–400 hPa, and below 925 hPa. Similarly, the main contribution factor of the positive vorticity tendency above 600 hPa is the horizontal advection term, but the main contribution factor of the positive vorticity tendency below 600 hPa is the divergence term, followed by the vertical advection term. It shows that with the development of MCC, the convergence at the lower-level is strengthened, which produces positive vorticity, and at the same time, due to the enhancement of vertical motion, the horizontal vorticity of the lower-level is converted into the vertical vorticity and will be transported to the upper layer, which also plays an important role in the development of upper vorticity, and the deep positive vorticity column is conducive to the strong development of MCC.
At the dissipation stage of the MCC at 8:00 on the 5th (Figure 10d), the whole layer basically is a negative vorticity tendency. The largest negative contribution to vorticity is still the horizontal advection term, followed by the oblique term. The main reason is that after typhoon “Hagupit” moved eastward into the sea surface, the continental high pressure on the west side of the MCC also moved eastward. Mainly affected by the westerly airflow, and with the tendency of the vorticity turning negative, the MCC began to weaken.
Overall, the horizontal advection term is the main contributor to the positive vorticity tendency in the mid- to upper troposphere, which indicates that due to the existence of the cyclone vortex in the mid- to upper troposphere, the positive vorticity advection coming from the cyclone vortex is the main reason for the occurrence and development of MCC, while the manufacturing terms of divergence and vertical advection are the main contributors to the positive vorticity tendency of the lower troposphere, and the more significant contributions in the mature stage. It shows that with the development of MCC, the convergence of the lower troposphere is enhanced, the area of the convergence region increases, the manufacturing term of divergence contributes significantly, and, under the action of vertical ascending motion, the horizontal vorticity in the lower layer is converted into the vertical vorticity and transported to the upper layer, which also in turn favors the development of the MCC.

5.2. Positive Feedback of Convective Latent Heat Release

Previous studies have shown that deep convection and its accompanying latent heat release play an important role in the formation and development of mesoscale vortices [55,56]. In this process, the development of MCC is the strongest moment of precipitation, and, obviously, there is a great connection between the two, according to the analysis of vorticity budget mentioned above (Figure 10). During the development and enhancement of MCC, the vortex columns are maintained below 300 hPa, the main contribution to the positive vorticity tendency has horizontal advection, manufacturing term of divergence and vertical advection terms.
In order to further study the vortex development, on the basis of the simulation experiments above mentioned, the ndown method is used. When 9 km grid simulation to 20:00 on 4 August, turn off the latent heat release of the inner 3 km grid and start the simulation to further observe the impact of convective latent heat release on the occurrence and development of MCC.
From simulated 24-h rainfall in the Figure 6b, simulated 500 hPa wind field, and radar reflectivity in Figure 7e–h after closing the latent heat release of the inner 3 km grid, it can be seen the 24-h rainfall is generally below 25 mm only in some mountainous areas and, in northern Zhejiang, more than 50 mm, which is a very big difference from the actual rainfall (Figure 1b); the meso-β-scale cyclonic vortex near the cs and nt on 500 hPa wind field was not simulated, nor the vortex-like convective echoes near Zhejiang and Shanghai on combined reflectivity field in the strongest period of MCC development (from 03:00 to 06:00 on 5 August 2020).
To further analyze the various budgets of the vertical vorticity equation after closing the latent heat release of the inner 3 km grid (Figure 11), it can be found that at 20:00 on the 4th (Figure 11a), when the typhoon “Hagupit” and the MCC occurrence region are at the same latitude, there is still a positive vorticity trend in the mid- to upper troposphere between 850–400 hPa. The main contribution above 600 hPa is the horizontal advection term, and between 850–600 hPa, is mainly the divergence manufacturing term. This result is basically consistent with the normal simulation conclusion that the latent heat release is not turned off. However, at 02:00–08:00 on the 5th (Figure 11b–d), the vorticity tendency of each layer changed very little, all within the range of plus or minus 0.5 × 10 8   s 2 , and the main contribution to the positive vorticity tendency is manufacturing term of divergence and vertical advection terms below 700 hPa. It can be seen that, despite the influence of typhoon positive vorticity advection, it still cannot lead to the occurrence and development of MCC without the influence of latent heat of convection. It is clear that the mesoscale vortices in the mid- to upper troposphere and latent heat release play important roles in the development of MCC.

6. Conclusions

The MCC that causing the severe rainstorm in the Yangtze River Delta Region gradually developed from the easternmost convective cloud clusters on the spiral rain belt of typhoon “Hagupit”. The MCC was stable and less moving; this along with its long life were the main causes of the rainstorm. The rainfall and rainfall intensity produced by the MCC were greater than that produced by the typhoon “Hagupit” after landfall. It is hard to predict and easy to cause meteorological disasters and economic losses.
Through the analysis of numerical simulation experiments, it is shown that with the typhoon “Hagupit” gradually moving northward far away, the warm and humid air in the mid- lower level of the troposphere continued to enhance, the vertical ascending motion also gradually enhanced, and the atmosphere became increasingly unstable. The strong potentially unstable stratification is very beneficial to the occurrence and development of mesoscale convective systems. By comparing with the simulation experiments of closing the latent heat release of the inner 3 km grid, it is found that the development and enhancement of the MCC are closely related to the strengthening of the meso-β-scale cyclonic vortex in the mid- to upper troposphere. The meso-β-scale cyclonic vortex enhances the vorticity in the mid-level. That is beneficial to enhancing the convergence of the lower level atmosphere and ascending motion, therefore forming a strong vertical positive vorticity column extending from the ground to 200 hPa and a strong vertical rising motion region; the rotational convergence and strong vertical ascending motion of the whole layer make the MCC develop strongly. In the divergence field, the coupling effect of low-level convergence and high-level divergence is also beneficial to the strong development of MCC.
In the process of the MCC’s development and enhancement, the terms in the local vorticity budget equation have different effects. The horizontal advection term is the main contributor to the positive vorticity tendency in the mid- to upper troposphere, which is indicated due to the existence of meso-β-scale cyclonic vortex in the mid-level. The manufacturing term of divergence and vertical advection term are the main contributors to the positive vorticity tendency of the lower troposphere. In the mature stage of the MCC, the stronger the above contribution. It shows that with the development of MCC, the convergence of the low-level is enhanced, the manufacturing term of the divergence contributes significantly, and, under the action of vertical ascending motion, the horizontal vorticity of the lower layer is converted into the vertical vorticity and transported to the upper layer, which also in turn favors the development of the MCC. The simulation experiments of closing the latent heat release of the inner 3 km grid the main contribution to the positive vorticity tendency is manufacturing terms of divergence and vertical advection terms below 700 hPa, and the contribution of the horizontal advection term is very little in mid- to higher level. That indicates that meso-β-scale cyclonic vortex in the mid- to upper troposphere plays important roles in the development of MCC.
The convective latent heat release plays an important role on the development of the MCC. It changes the atmospheric instability by heating above the lower layer, enhances the upward movement, and the convection develops higher, which is beneficial to vertical advection terms transported the vorticity of the low-level to the upper level, that increases the upper level vorticity. The role of convergent decompression is conducive to the generation of local vortex circulation. The meso-β-scale cyclonic vortex formation in this process is related to convective latent heat release; the meso-β-scale cyclonic vortex does not exist because the simulation after closing the latent heat release. Conversely, the convergence and uplift of the meso-β-scale cyclonic vortex is beneficial to the convergence of the lower-level atmospheric and the enhancement of the ascending motion. The meso-β-scale cyclonic vortex and the convective latent heat release are the main cause of strengthening and maintenance of MCC.
WRF mesoscale model provides a good reflection on the simulation of this precipitation process, especially in the strong stage of the MCC enhancement (02:00–08:00 on the 5th). The simulated rainfall shape and rainfall maximum are close to the actual rainfall, but the rainstorm area is larger than the actual rainfall. The model also simulates meso-β-scale vortex structure in the mid-level, revealing the developmental mechanism of the MCC. Some data obtained through the model cannot be obtained through routine observations. In recent years, in the context of global warming, extreme rainstorms have frequently occurred, that are often produced by mesoscale and small-scale systems. WRF’s ability to predict medium and small-scale systems is better than the global models traditionally used for climate projections, However, ways in which to describe the organization and development mechanism of convection of mesoscale convective systems, and how to deal with the “gray zone resolution” of the convective parameterization scheme in the model, still need careful consideration.

Author Contributions

Conceptualization and methodology, X.L. and J.S.; numerical simulation, H.C.; formal analysis, W.Z. and Q.M. All authors have read and agreed to the published version of the manuscript.

Funding

Precipitation forecast test and forecast technology research in mid-term process of Meiyu season (402605). This research was supported by the the Science and Technology Foundation of State Grid Corporation of China [grant number 5200-201955490A-0-0-00]. Forecast Project of National Meteorological Center (Y202108).

Institutional Review Board Statement

Not applicable.

Informed Consent Statement

Informed consent was obtained from all subjects involved in the study.

Data Availability Statement

The authors thank the mesoscale model WRF of the National Institute of Atmospheric Research (NCAR); The typhoon track data, China station precipitation and sea-level pressure data, and infrared satellite cloud image provided by the National Meteorological Center.

Acknowledgments

All individuals included in this section have consented to the acknowledgement.

Conflicts of Interest

The authors declare no conflict of interest.

References

  1. Chen, L.S.; Li, Y.; Cheng, Z.Q. An overview of research and forecasting on rainfall associated with landfalling tropical cyclones. Adv. Atmos. Sci. 2010, 27, 967–976. [Google Scholar] [CrossRef]
  2. Peduzzi, P.; Chatenoux, B.; Dao, Q.-H.; De Bono, A.; Herold, C.; Kossin, J.; Mouton, F.; Nordbeck, O. Global trends in tropical cyclone risk. Nat. Clim. Chang. 2012, 2, 289–294. [Google Scholar] [CrossRef]
  3. Li, R.C.Y.; Zhou, W.; Shun, C.M.; Lee, T.C. Change in Destructiveness of Landfalling Tropical Cyclones over China in Recent Decades. J. Clim. 2017, 30, 3367–3379. [Google Scholar] [CrossRef]
  4. Lee, C.-Y.; Tippett, M.K.; Sobel, A.H.; Camargo, S.J. Rapid intensification and the bimodal distribution of tropical cyclone intensity. Nat. Commun. 2016, 7, 10625. [Google Scholar] [CrossRef]
  5. Cangialosi, J.P.; Latto, A.S.; Berg, R. Hurricane Irma. National Hurricane Center Tropical Cyclone Rep. 2018. Available online: www.nhc.noaa.gov/data/tcr/AL112017_Irma.pdf (accessed on 18 January 2022).
  6. Skamarock, W.C.; Klemp, J.; Dudhia, J.; Gill, D.; Barker, D.M.; Duda, M.G.; Huang, X.Y.; Wang, W.; Powers, J.G. A Description of the Advanced Research WRF Version 3; National Center for Atmospheric Research: Boulder, CO, USA, 2008; p. 113, NCAR Tech. Note TN-4751STR.
  7. Powers, J.G.; Klemp, J.B.; Skamarock, W.C.; Davis, C.A.; Dudhia, J.; Gill, D.O.; Coen, J.L.; Gochis, D.J.; Ahmadov, R.; Peckham, S.E.; et al. The Weather Research and Forecasting Model: Overview, System Efforts, and Future Directions. Bull. Am. Meteorol. Soc. 2017, 98, 1717–1737. [Google Scholar] [CrossRef]
  8. Booth, J.F.; Naud, C.M.; Willison, J. Evaluation of Extratropical Cyclone Precipitation in the North Atlantic Basin: An Analysis of ERA-Interim, WRF, and Two CMIP5 Models. J. Clim. 2018, 31, 2345–2360. [Google Scholar] [CrossRef] [PubMed]
  9. Lamraoui, F.; Booth, J.F.; Naud, C.M. WRF Hindcasts of Cold Front Passages over the ARM Eastern North At-lantic Site: A Sensitivity Study. Mon. Weather Rev. 2018, 146, 2417–2432. [Google Scholar] [CrossRef]
  10. Squitieri, B.J.; Gallus, W.A. WRF Forecasts of Great Plains Nocturnal Low-Level Jet-Driven MCSs. Part I: Correlation between Low-Level Jet Forecast Accuracy and MCS Precipitation Forecast Skill. Weather Forecast. 2016, 31, 1301–1323. [Google Scholar] [CrossRef]
  11. Letson, F.; Shepherd, T.J.; Barthelmie, R.J.; Pryor, S.C. WRF Modeling of Deep Convection and Hail for Wind Power Applications. J. Appl. Meteorol. Clim. 2020, 59, 1717–1733. [Google Scholar] [CrossRef]
  12. Sun, J.; He, H.; Hu, X.; Wang, D.; Gao, C.; Song, J. Numerical Simulations of Typhoon Hagupit (2008) Using WRF. Weather Forecast. 2019, 34, 999–1015. [Google Scholar] [CrossRef]
  13. Peace, M.; Mattner, T.; Mills, G.; Kepert, J.; McCaw, L. Coupled Fire—Atmosphere Simulations of the Rocky River Fire Using WRF-SFIRE. J. Appl. Meteorol. Clim. 2016, 55, 1151–1168. [Google Scholar] [CrossRef]
  14. Archer, C.L.; Wu, S.; Ma, Y.; Jiménez, P.A. Two Corrections for Turbulent Kinetic Energy Generated by Wind Farms in the WRF Model. Mon. Weather Rev. 2020, 148, 4823–4835. [Google Scholar] [CrossRef]
  15. Strobach, E.; Bel, G. Regional Decadal Climate Predictions Using an Ensemble of WRF Parameterizations Driven by the MIROC5 GCM. J. Appl. Meteorol. Clim. 2019, 58, 527–549. [Google Scholar] [CrossRef]
  16. Jing, X.; Xue, L.; Yin, Y.; Yang, J.; Steinhoff, D.F.; Monaghan, A.; Yates, D.; Liu, C.; Rasmussen, R.; Taraphdar, S.; et al. Convection-Permitting Regional Climate Simulations in the Arabian Gulf Region Using WRF Driven by Bias-Corrected GCM Data. J. Clim. 2020, 33, 7787–7815. [Google Scholar] [CrossRef]
  17. Kowaleski, A.M.; Morss, R.E.; Ahijevych, D.; Fossell, K.R. Using a WRF-ADCIRC Ensemble and Track Clustering to Investigate Storm Surge Hazards and Inundation Scenarios Associated with Hurricane Irma. Weather Forecast. 2020, 35, 1289–1315. [Google Scholar] [CrossRef]
  18. Piersante, J.O.; Schumacher, R.S.; Rasmussen, K.L. Comparison of Biases in Warm-Season WRF Forecasts in North and South America. Weather Forecast. 2021, 36, 979–1001. [Google Scholar] [CrossRef]
  19. Pal, S.; Dominguez, F.; Dillon, M.E.; Alvarez, J.; Garcia, C.M.; Nesbitt, S.W.; Gochis, D. Hydrometeorological Observations and Modeling of an Extreme Rainfall Event Using WRF and WRF-Hydro during the RELAMPAGO Field Campaign in Argentina. J. Hydrometeorol. 2021, 22, 331–351. [Google Scholar] [CrossRef]
  20. Wu, C.-C.; Chen, S.-G.; Lin, S.-C.; Yen, T.-H.; Chen, T.-C. Uncertainty and Predictability of Tropical Cyclone Rainfall Based on Ensemble Simulations of Typhoon Sinlaku (2008). Mon. Weather Rev. 2013, 141, 3517–3538. [Google Scholar] [CrossRef]
  21. Li, R.C.Y.; Zhou, W. Interdecadal Changes in Summertime Tropical Cyclone Precipitation over Southeast China during 1960–2009. J. Clim. 2015, 28, 1494–1509. [Google Scholar] [CrossRef]
  22. Huang, Y.-H.; Wu, C.-C.; Wang, Y. The Influence of Island Topography on Typhoon Track Deflection. Mon. Weather Rev. 2011, 139, 1708–1727. [Google Scholar] [CrossRef]
  23. Chen, T.-C.; Wu, C.-C. The Remote Effect of Typhoon Megi (2010) on the Heavy Rainfall over Northeastern Taiwan. Mon. Weather Rev. 2016, 144, 3109–3131. [Google Scholar] [CrossRef]
  24. Chen, L.S.; Meng, Z.Y.; Cong, C.H. An overview on the research of typhoon rainfall distribution. J. Mar. Meteor. 2017, 37, 1–7. (In Chinese) [Google Scholar]
  25. Wang, Y.; Wang, Y.; Fudeyasu, H. The Role of Typhoon Songda (2004) in Producing Distantly Located Heavy Rainfall in Japan. Mon. Weather Rev. 2009, 137, 3699–3716. [Google Scholar] [CrossRef]
  26. Lonfat, M.; Rogers, R.; Marchok, T.; Marks, F. A Parametric Model for Predicting Hurricane Rainfall. Mon. Weather Rev. 2007, 135, 3086–3097. [Google Scholar] [CrossRef]
  27. Kimball, S.K. Structure and Evolution of Rainfall in Numerically Simulated Landfalling Hurricanes. Mon. Weather Rev. 2008, 136, 3822–3847. [Google Scholar] [CrossRef]
  28. Yokoyama, C.; Takayabu, Y.N. A Statistical Study on Rain Characteristics of Tropical Cyclones Using TRMM Satellite Data. Mon. Weather Rev. 2008, 136, 3848–3862. [Google Scholar] [CrossRef] [Green Version]
  29. Meng, Z.; Zhang, Y. On the Squall Lines Preceding Landfalling Tropical Cyclones in China. Mon. Weather Rev. 2012, 140, 445–470. [Google Scholar] [CrossRef]
  30. Ross, R.J.; Kurihara, Y. A Numerical Study on Influences of Hurricane Gloria (1985) on the Environment. Mon. Weather Rev. 1995, 123, 332–346. [Google Scholar] [CrossRef] [Green Version]
  31. Smith, R.B.; Schafer, P.; Kirshbaum, D.; Regina, E. Orographic Enhancement of Precipitation inside Hurricane Dean. J. Hydrometeorol. 2009, 10, 820–831. [Google Scholar] [CrossRef]
  32. Jorgensen, D.P. Mesoscale and convective-scale characteristics of mature hurricanes. Part I: General observa-tions by research aircraft. J. Atmos. Sci. 1984, 41, 1268–1286. [Google Scholar] [CrossRef] [Green Version]
  33. Jorgensen, D.P. Mesoscale and convective-scale characteristics of mature hurricanes. Part II: Inner core structure of Hurricane Allen (1980). J. Atmos. Sci. 1984, 41, 1287–1311. [Google Scholar] [CrossRef]
  34. Marks, F.D., Jr. Evolution of the structure of precipitation in Hurricane Allen (1980). Mon. Weather Rev. 1985, 113, 909–930. [Google Scholar] [CrossRef] [Green Version]
  35. Chen, L.S. Causes of the torrential rainfalls associated with landfalling typhoons (in Chinese). Meteor Mon. 1977, 3, 10–13. [Google Scholar]
  36. Li, Y.; Chen, L.S.; Qian, C.H.; Yang, J.K. A study of the formation and development of a mesoscale convergence line within Typhoon Rananim (0414). Acta. Meteor. Sin. 2010, 68, 640–651. (In Chinese) [Google Scholar]
  37. Bartels, D.L.; Maddox, R.A. Midlevel cyclonic vortices generated by mesoscale convective systems. Mon. Weather Rev. 1991, 119, 104–118. [Google Scholar] [CrossRef] [Green Version]
  38. Zehr, R.M. Tropical cyclogenesis in the western North Pacific. NOAA Tech. Rep. NESDIS 1992, 61, 181. [Google Scholar]
  39. Montgomery, M.T.; Nicholls, M.E.; Cram, T.; Saunders, A.B. A Vortical Hot Tower Route to Tropical Cyclogenesis. J. Atmos. Sci. 2006, 63, 355–386. [Google Scholar] [CrossRef] [Green Version]
  40. Hendricks, E.A.; Montgomery, M.T. Rapid Scan Views of Convectively Generated Mesovortices in Sheared Tropical Cyclone Gustav (2002). Weather Forecast. 2006, 21, 1041–1050. [Google Scholar] [CrossRef] [Green Version]
  41. Tory, K.J.; Montgomery, M.T.; Davidson, N.E. Prediction and Diagnosis of Tropical Cyclone Formation in an NWP System. Part I: The Critical Role of Vortex Enhancement in Deep Convection. J. Atmos. Sci. 2006, 63, 3077–3090. [Google Scholar] [CrossRef] [Green Version]
  42. Tory, K.J.; Montgomery, M.T.; Davidson, N.E.; Kepert, J.D. Prediction and Diagnosis of Tropical Cyclone Formation in an NWP System. Part II: A Diagnosis of Tropical Cyclone Chris Formation. J. Atmos. Sci. 2006, 63, 3091–3113. [Google Scholar] [CrossRef] [Green Version]
  43. 4China net, 2021. The Top Ten Natural Disasters in 2020 are Announced, and the Typhoon “Hagupit” Is Listed. China.com. Available online: https://news.china.com/domestic/945/20210102/39140848_all.html (accessed on 18 June 2021).
  44. Shen, S.Q.; Yu, B.; Zhang, J.F.; Li, X. The climate features of tropical cyclone heavy rain and falling area forecast in East China. Meteor. Mon. 1996, 22, 33–37. (In Chinese) [Google Scholar]
  45. Maddox, R.A. Large-scale meteorological conditions associated with midlatitude mesoscale convective complexes. Mon. Wea. Rev. 1983, 111, 1475–1493. [Google Scholar] [CrossRef] [Green Version]
  46. Maddox, R.A.; Howard, K.W.; Bartels, D.L.; Rodgers, D.M. Mesoscale Convective Complexes in the Middle Latitudes; American Meteorological Society: Boston, MA, USA, 1986; pp. 390–413. [Google Scholar] [CrossRef]
  47. Hertenstein, R.F.A.; Schubert, W.H. Potential Vorticity Anomalies Associated with Squall Lines. Mon. Weather Rev. 1991, 119, 1663–1672. [Google Scholar] [CrossRef] [Green Version]
  48. Chen, S.S.; Frank, W.M. A Numerical Study of the Genesis of Extratropical Convective Mesovortices. Part I: Evolution and Dynamics. J. Atmos. Sci. 1993, 50, 2401–2426. [Google Scholar] [CrossRef] [Green Version]
  49. Bister, M.; Emanuel, K.A. The Genesis of Hurricane Guillermo: TEXMEX Analyses and a Modeling Study. Mon. Weather Rev. 1997, 125, 2662–2682. [Google Scholar] [CrossRef]
  50. Raymond, D.J.; Sessions, S.L.; Carrillo, C.L. Thermodynamics of tropical cyclogenesis in the northwest Pacific. J. Geophys. Res. Earth Surf. 2011, 116. D18101. [Google Scholar] [CrossRef] [Green Version]
  51. Raymond, D.J.; Gjorgjievska, S.; Sessions, S.; Fuchs, K. Tropical cyclogenesis and mid-level vorticity. Aust. Meteor. Oceanogr. Soc. J. 2014, 64, 11–25. [Google Scholar] [CrossRef]
  52. Bell, M.M.; Montgomery, M.T. Mesoscale Processes during the Genesis of Hurricane Karl (2010). J. Atmos. Sci. 2019, 76, 2235–2255. [Google Scholar] [CrossRef]
  53. Kilroy, G.; Smith, R.K. A numerical study of rotating convection during tropical cyclogenesis. Q. J. R. Meteorol. Soc. 2012, 139, 1255–1269. [Google Scholar] [CrossRef]
  54. Ye, C.Z.; Pan, Z.X.; Cheng, R.; Xu, A.H. The numerical research of the primary mechanism of the offing rein-forcement of typhoon Rananim based on AREM. Acta. Meteor. Sinica. 2007, 65, 208–220. (In Chinese) [Google Scholar]
  55. Verlinde, J.; Cotton, W.R. A Mesoscale Vortex Couplet Observed in the Trailing Anvil of a Multicellular Convective Complex. Mon. Weather Rev. 1990, 118, 993–1010. [Google Scholar] [CrossRef] [Green Version]
  56. Wang, Z. Role of Cumulus Congestus in Tropical Cyclone Formation in a High-Resolution Numerical Model Simulation. J. Atmos. Sci. 2014, 71, 1681–1700. [Google Scholar] [CrossRef]
Figure 1. The tracks of Typhoon No. 4 “Hagupit” in 2020, the text in the picture indicates the Beijing time of the typhoon’s location (Figure 1a). The observed 24 h rainfall from 20:00 BT 4 to 20:00 BT 5 August 2020 (Figure 1b, shaded area, unit: mm).
Atmosphere 13 00473 g001
Figure 2. 3-h rainfall (a, column, unit: mm), sea level pressure (b, line, unit: hPa) at Jinshan Station in Shanghai and Pinghu Station in Zhejiang Province from 20:00 BT 3 to 20:00 BT 5 August 2020.
Atmosphere 13 00473 g002
Figure 3. FY-4A infrared satellite cloud image from 19:00 BT 4 to 06:00 BT 5 August 2020 (the red symbol in the figure is the position of the typhoon at the same time), (a) 19:00 BT 4, (b) 20:00 BT 4, (c) 22:00 BT 4, (d) 02:00 BT 5, (e) 06:00 BT 5.
Atmosphere 13 00473 g003
Figure 4. Hour-by-hour changes of the −32 °C and −52 °C areas of convective cloud cluster from 20:00 BT 4 to 12: 00 BT on 5 August 2020.
Atmosphere 13 00473 g004
Figure 5. Cumulative rainfall from 20:00 BT 4 to 20:00 BT on 5 August 2020, simulation of 3 km domain (shaded area, unit: mm). (a) Normal simulation, (b) Simulation after closing the latent heat release of the inner 3 km grid.
Atmosphere 13 00473 g005
Figure 6. Cumulative 3-h rainfall from 20:00 BT on 4 August to 08:00 BT 5 August 2020, simulation of 3 km domain (ad: unit: mm) and the observed 3-h rainfall of the corresponding period of time (eh: unit: mm). (a,e) 23:00 BT 4, (b,f) 02:00 BT 5, (c,g) 05:00 BT 5, (d,h) 08:00 BT 5.
Atmosphere 13 00473 g006
Figure 7. Simulated wind at 500 hPa (black barbs, unit: m   s 1 ) and composite reflectivity (shaded area, unit: dBz) from 03:00 BT to 06:00 BT 5 August 2020; the red symbol is the center position of the typhoon on the ground at the moment, black dot is the city location in China (nt, Nantong.; cs, Changshu), and the arrows are the vortex at 500 hPa (solid line: typhoon center, dotted line: mesoscale vortex) in the figure. (ad) normal simulation, (eh) the simulation after closing the latent heat release of the inner 3 km grid. (a,e) 03:00 BT 5, (b,f) 04:00 BT 5, (c,g) 05:00 BT 5, (d,h) 06:00 BT 5.
Atmosphere 13 00473 g007
Figure 8. Simulated section of relative vorticity (shaded area, ≥20, unit: 10 5   s 1 ) and wind (barbs, unit: m s 1 ) (ad), divergence (shaded area, unit:   10 5   s 1 ) and vertical velocity (black line, ≤−0.1, interval = 10, unit: Pa s 1 ) (eh) along the MCC center 30.5° N on 4–5 August 2020. (a,e) 20:00 BT 4, (b,f) 02:00 BT 5, (c,g) 04:00 BT 5, (d,h) 08:00 BT 5.
Atmosphere 13 00473 g008
Figure 9. Simulated section of equivalent potential temperature (blue line, unit: K) and wind (vectors, unit: m s 1 ) along the MCC center 30.5° N on 4 to 5 August 2020. The red triangle is the center longitude location of MCC. (a) 20:00 BT 4, (b) 02:00 BT 5, (c) 04:00 BT 5, (d).
Atmosphere 13 00473 g009
Figure 10. Simulated vertical distribution of each term of vorticity equation (unit: 10 8   s 2 ) averaged in the region (29–31° N, 121–124° E) on 4–5 August 2020. (a) 20:00 BT 4, (b) 02:00 BT 5, (c) 05:00 BT 5, (d) 08:00 BT 5.
Atmosphere 13 00473 g010
Figure 11. Simulated vertical distribution of each term of vorticity equation (unit: 10 8   s 2 ) averaged in the region (29–31° N, 121–124° E) after closing the latent heat release of the inner 3 km grid on 4–5 August 2020. (a) 20:00 BT 4, (b) 02:00 BT 5, (c) 05:00 BT 5, (d) 08:00 BT 5.
Atmosphere 13 00473 g011
Publisher’s Note: MDPI stays neutral with regard to jurisdictional claims in published maps and institutional affiliations.

