Article

Intraseasonal Oscillation of Summer Extreme High Temperature in Northeast China and Associated Atmospheric Circulation Anomalies

Key Laboratory of Meteorological Disaster of Ministry of Education (KLME), Collaborative Innovation Center on Forecast and Evaluation of Meteorological Disasters (CIC-FEMD), Nanjing University of Information Science and Technology, Nanjing 210044, China
*
Author to whom correspondence should be addressed.
Atmosphere 2022, 13(3), 387; https://doi.org/10.3390/atmos13030387
Submission received: 23 January 2022 / Revised: 20 February 2022 / Accepted: 23 February 2022 / Published: 25 February 2022
(This article belongs to the Special Issue Extreme Weather Events and Atmospheric Circulation)

Abstract

:
Previous studies have demonstrated the important effects of intraseasonal oscillations in the tropics on the occurrence of extreme-high-temperature events (EHTs), whereas the influence of intraseasonal oscillations in mid-high latitudes on EHTs has been less discussed. In this study, the intraseasonal oscillation of summer extreme high temperatures from 1981 to 2019 in northeast China and its associated atmospheric circulation were studied using conventional statistic methods. The results show that the summer extreme-high-temperature distribution in northeast China is consistent throughout the whole region, with a low-frequency oscillation period of 10–30 d. The low-frequency extreme-high-temperature events (LFEHTs) in northeast China account for 88.8% of all EHTs during the summer. The corresponding low-frequency circulation anomalies with 10–30 d oscillations exhibit a barotropic wave-train moving from west to east in the mid-high latitudes of Eurasia. A low-frequency wave-train index (LFWI) was defined to characterize the wave-train anomaly system in the mid-high latitudes of the Eurasian continent. The LFWI may be a potential precursor for forecasting LFEHTs about 7 days in advance. It could explain 15–30% of the summertime low-frequency daily maximum temperature variability in northeast China.

1. Introduction

With the continuous rise in global temperature, extreme-high-temperature events in northeast China are also increasing [1], posing more threats to society, including economic losses and an increase in health risks in this significant warming region [2,3,4,5,6,7]. However, those threats can be reduced by improving early forecasting of summer temperatures in northeast China, especially the extended weather forecasting, whose signal can be from the atmospheric intraseasonal oscillation (ISO) [8]. ISO usually refers to an oscillation phenomenon with a 10–90 d period that occurs in the atmosphere [9]. Madden and Julian first discovered the ISO during their study of tropical weather; hence, the tropical atmospheric ISO is also known as the MJO [10,11], and ISO activity in the north during the summer is often referred to as the boreal summer intraseasonal oscillation (BSISO) [12]. Moreover, the atmospheric intraseasonal oscillation signal is closely related to the occurrence of short-term climate anomalies and extreme weather events [13,14,15]. Consequently, investigating the relationship between extreme-high temperatures in northeast China and associated ISO is vital.
In the past decades, researchers have made a concerted effort to understand the influence of ISO on extreme temperature events. The results of Chen and Zhai’s research [16] showed that BSISO can lead to extreme precipitation in central and eastern China and extreme-high temperatures in south and southeast China. Diao et al. [17] also found that BSISO convection in the tropics impacts the frequency of extreme temperature events in mid-high latitudes. Chen et al. [18] found that extreme-high-temperature events in south China were influenced by two types of intra-seasonal oscillations from the tropical western Pacific propagating to the northwest, namely 5–25 and 30–90 d oscillations. Qi and Yang [19] found that tropical and extratropical ISOs were conducive to the formation of extreme-high-temperature events (EHTs) in the Yangtze River Basin, which was confirmed by numerical experiments [20]. In addition, Gao et al. [21] found that the extreme-high temperatures over the Yangtze River Basin correlated with quasi-biweekly ISOs. Hsu et al. suggested that the enhancement in MJO convection over the western Pacific warm pool could have had important effects on heatwaves in northeast Asia, including northeast China in 2018 [22]. In addition, the low-frequency oscillation in the tropical Indian Ocean and the northwest Pacific also influenced low-frequency precipitation in northeast China in the summer of 2016 [23]. Although the related studies on ISO have been mainly concentrated in the tropics, numerous studies have confirmed that ISO can also be found in the mid-high latitudes [9,24,25,26,27,28,29,30,31]. Previous studies found that the polar vortex, the Siberian high, the East Asia trough, the Aleutian low, the cold vortex in Northeast China and many other atmospheric systems in the mid-high latitude of the Northern Hemisphere all have low-frequency oscillations [32,33,34,35,36,37,38] and play an important role in the cold air process in China during winter. Recently, two kinds of intraseasonal wave-trains in mid-high latitudes have been discovered over the Eurasian continent in the Northern Hemisphere during summer, moving westward and eastward, separately, with a common significant period of 30–50 d [39].
For the formation of extreme-high temperatures in northeast China, on the interdecadal time scale, scholars found that the Silk Road Pattern can explain more than 40% of the interdecadal climate warming in northeast China [40] and how this interdecadal change has also led to the intensification of temperature warming in northeast China [41,42]. On the interannual time scale, a wave-train teleconnection associates the cold anomaly over the Nova Zembla-Ural Mountains (CNU) with the summer heat waves (HW) in northeast Asia (NEA) [43]. Zhang et al. [44] also found that the anomaly of the western Pacific subtropical high and the blocking high in the mid-high latitude jointly affected the extreme-high temperatures in northeast China during the summer. On the synoptic scale, Yang et al. [45] found that the intensity of CNU intensified rapidly about 6 days before the long-lived HWs. The analysis of the extreme-high temperatures in northeast China in 2018 by Tao et al. showed that the Pacific-Japan Pattern [46] and the South Asian high promoted the generation of extreme-high temperatures in northeast China synergistically during that year [47]. Nevertheless, there are few studies on the impact of the intraseasonal oscillation of these atmospheric circulation systems on the extreme-high-temperature events in northeast China.
Although extensive research has been conducted on the relationship between ISO in the tropics and EHTs in southern China, less attention has been paid to the impact of ISO on EHTs in the mid-high latitude, especially in northeast China. Therefore, the purpose of this study was to explore the intraseasonal oscillation characteristics of extreme-high temperatures during summers over northeast China and its related ISO in middle-high latitudes and find the low-frequency signals to provide a reference that can be used in forecasting EHTs in northeast China. The rest of this paper is organized as follows: Section 2 describes data and methods. In Section 3, the intraseasonal oscillation characteristics of extreme-high temperatures during summer in northeast China, its related ISO system, and the relationship between them are elaborated. Finally, the discussion and conclusions are presented in the last section.

2. Data and Methods

2.1. Data

The daily maximum temperature (Tmax) was obtained from the CN05.1 dataset produced by the National Climate Center in China with a horizontal resolution of 0.25° × 0.25° [48]. In addition, the daily atmospheric circulation fields were retrieved from the National Centers for Environmental Prediction–National Center for Atmospheric Research (NCEP–NCAR). Reanalysis I datasets had a 2.5° × 2.5° horizontal resolution from 1981 to 2019, including the zonal and meridional winds, and the geopotential increase in pressure levels from 100 to 1000 hPa [49].

2.2. Method

2.2.1. Identification of EHTs

(1)
Extreme-high-temperature day: Referring to the method of Li et al. [50] to identify extreme-high-temperature days according to the relative threshold, and the daily maximum temperature of each grid in northeast China (40°–55° N, 115°–135° E). The area of study from 1981 to 2019 was arranged in ascending order to obtain the highest temperature at the 90th percentile of the grid in each year, and the average of these 39 years’ values was recorded as the extreme-high-temperature threshold of the grid. If one in nine grids in the region exceeded its threshold on the same day, it was identified as an extreme-high-temperature day.
(2)
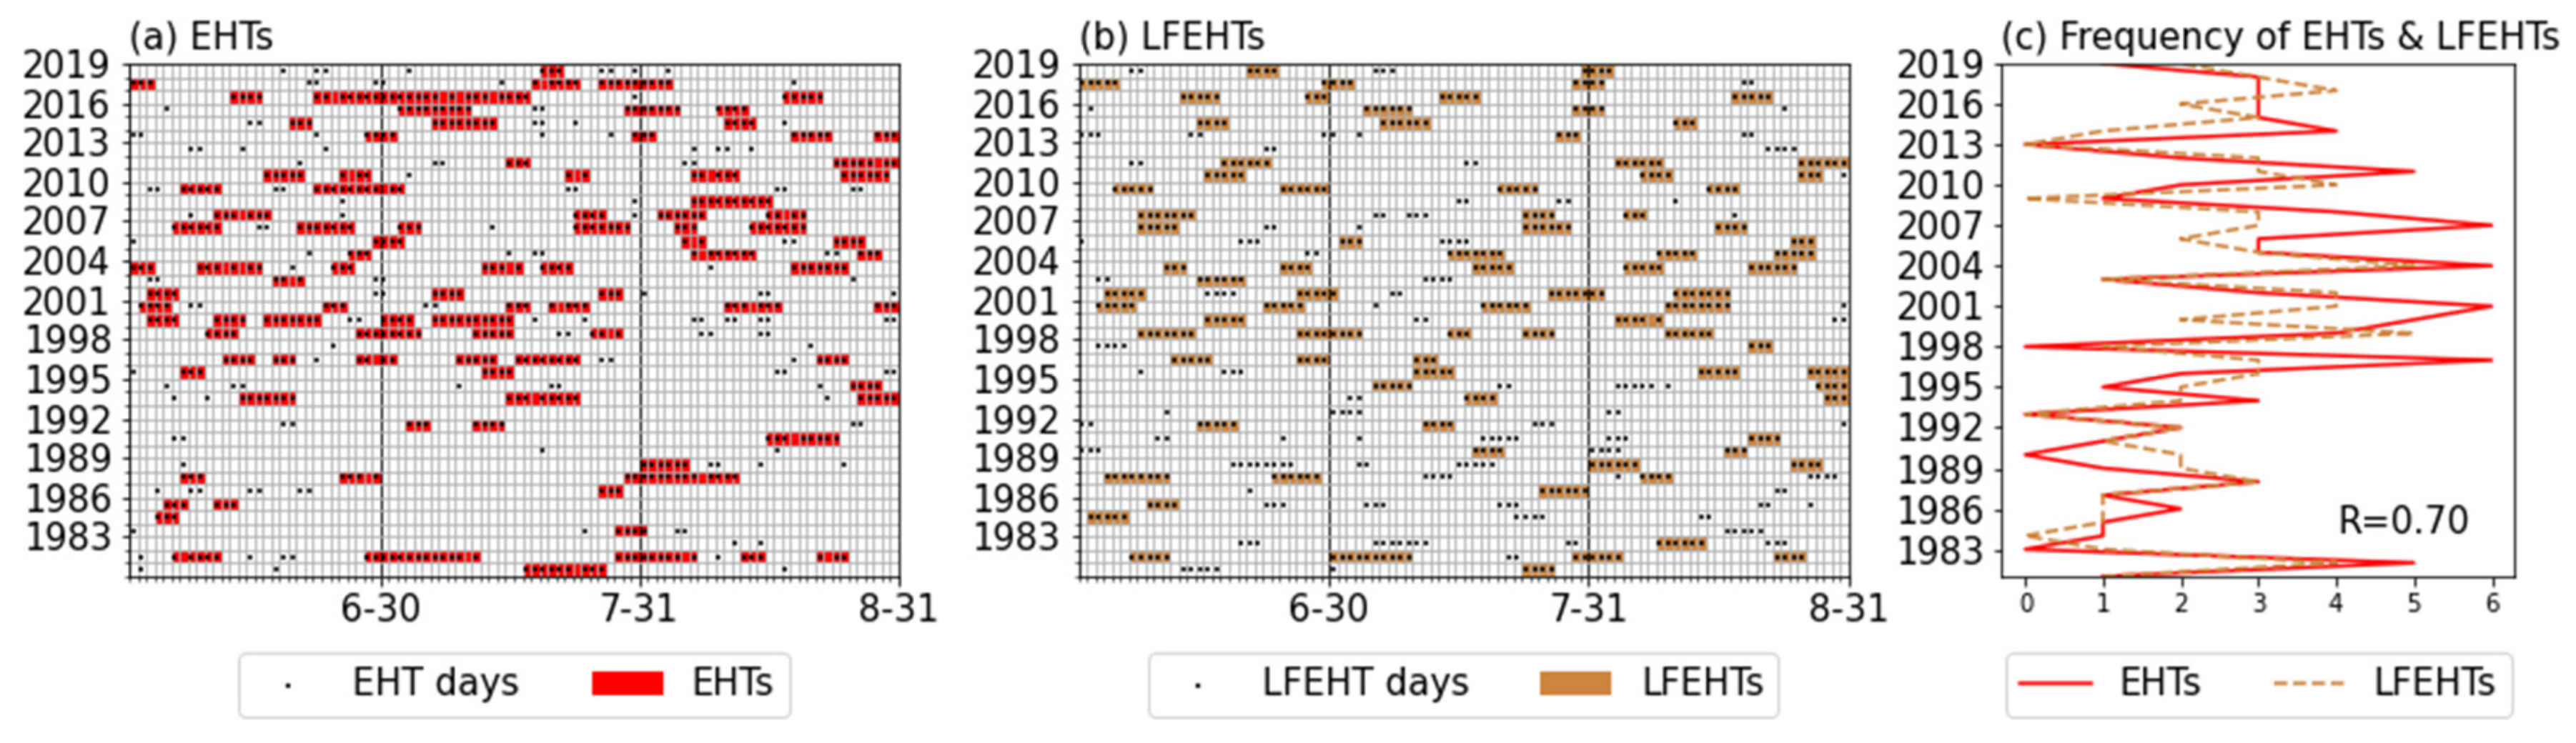
Extreme-high-temperature event: If an extreme-high-temperature day occurred for three days or more, and each interval of non-extreme-high-temperature days was no more than one day, it was recorded as an extreme-high-temperature event.
(3)
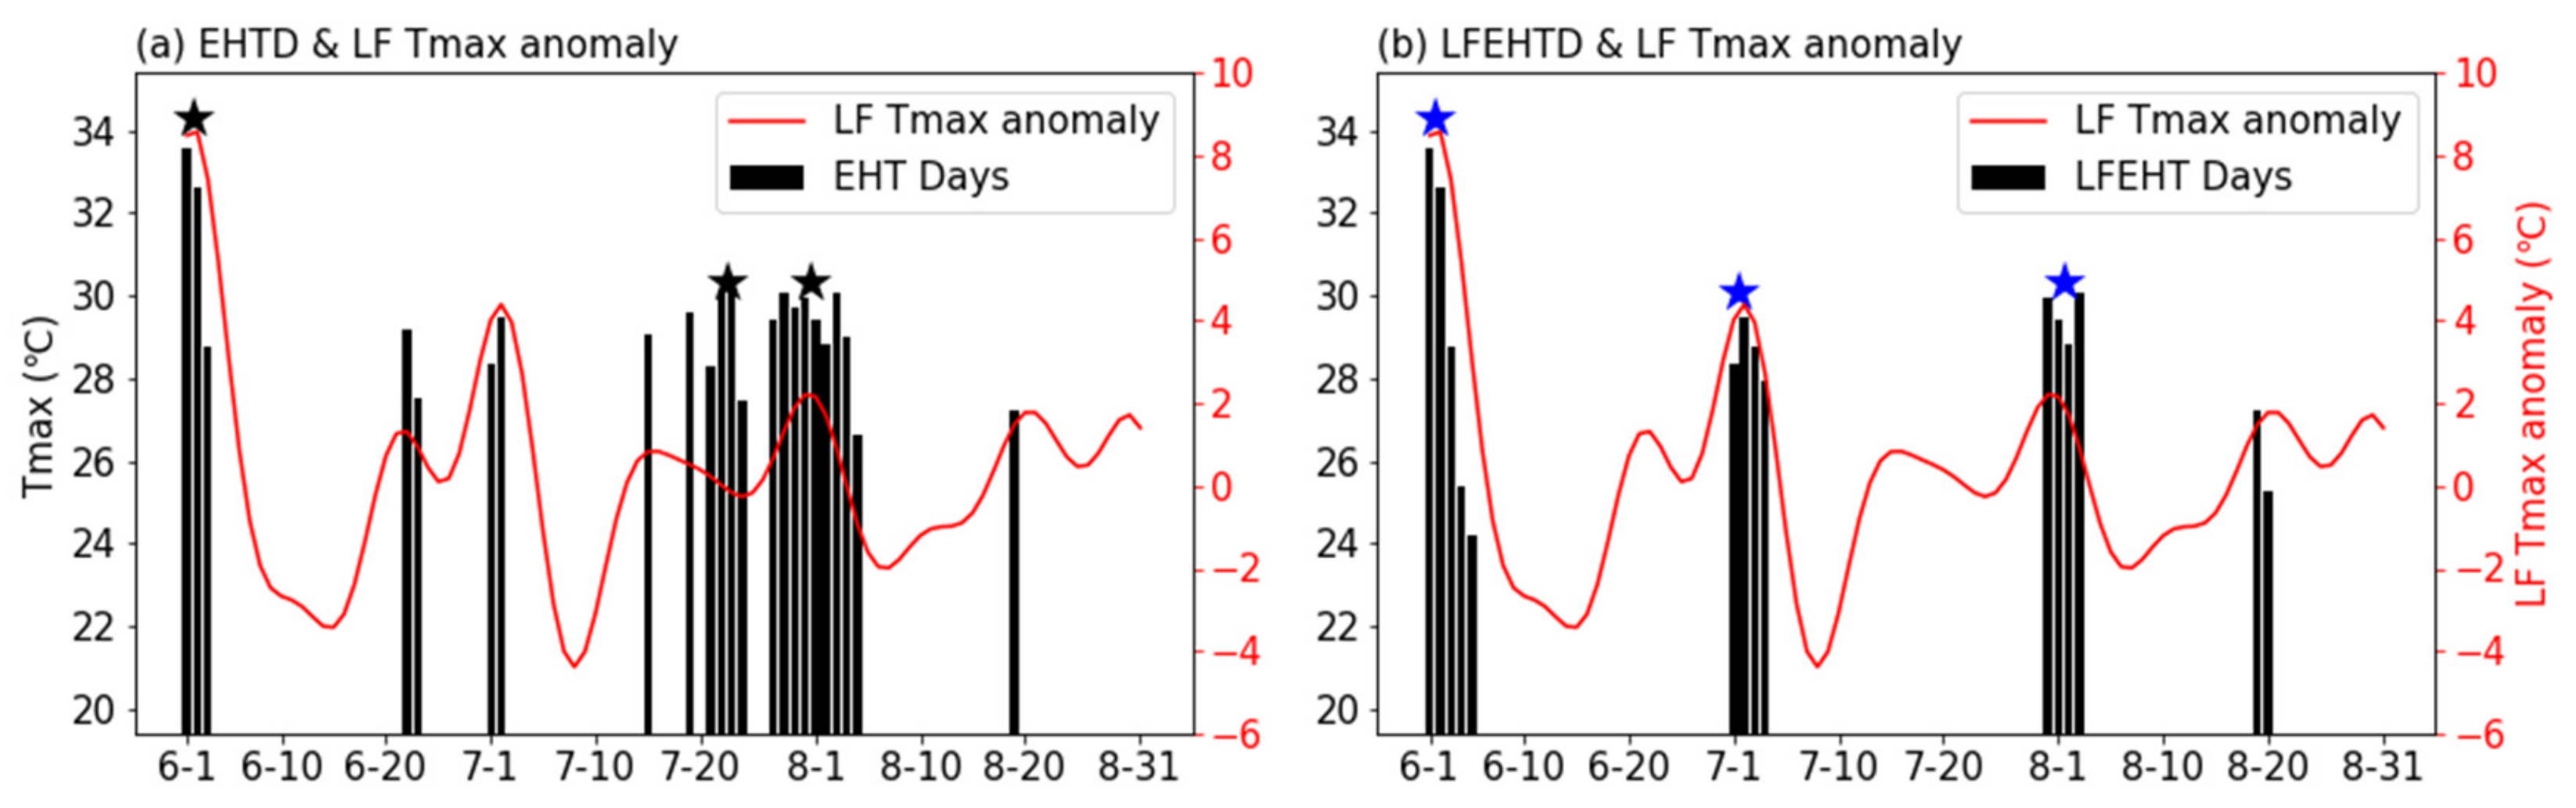
Low-frequency extreme-high-temperature event: The definition is the same as the extreme-high-temperature event, but the filtered daily maximum temperature sequence replaces the daily maximum temperature, and the extreme-high-temperature days must occur during the event in order for a low-frequency extreme-high-temperature event (LFEHT) to be identified.

2.2.2. T-N Wave Activity Flux

In this study, the T-N wave activity flux proposed by Takaya and Nakamura [51] was used to diagnose the propagation characteristics of Rossby waves. The meridional component of the T-N wave activity flux is stronger than that of the Plumb wave activity flux, which can better describe the Rossby long-wave disturbances in the westerly zone with larger amplitude in the non-uniform zonal airflow. The formula is as follows:
W = p cos φ 2 U U a 2 c o s 2 φ ψ λ ψ 2 ψ λ 2 + V a 2 c o s φ ψ ψ λ φ ψ 2 ψ λ φ U a 2 c o s φ ψ ψ λ φ ψ 2 ψ λ φ + V a 2 ψ φ 2 ψ 2 ψ φ 2
where ψ = Φ f is the disturbance of the quasi-geostrophic function relative to the climate field ;   φ ,   λ , and Φ   denote latitude, longitude, and geopotential, respectively; f = 2 Ω s i n φ represents the Coriolis parameter a and Ω represent the Earth’s radius and rotation rate, respectively; p = p p 0 ,   p0 = 1000 hPa, and p represent various pressure levels used in this study; and basic flow field U = U , V represents the climate field.
Many other methods were also applied in this study, such as empirical orthogonal function (EOF), power spectrum analysis [52], and the Butterworth bandpass filter [53].

3. Results

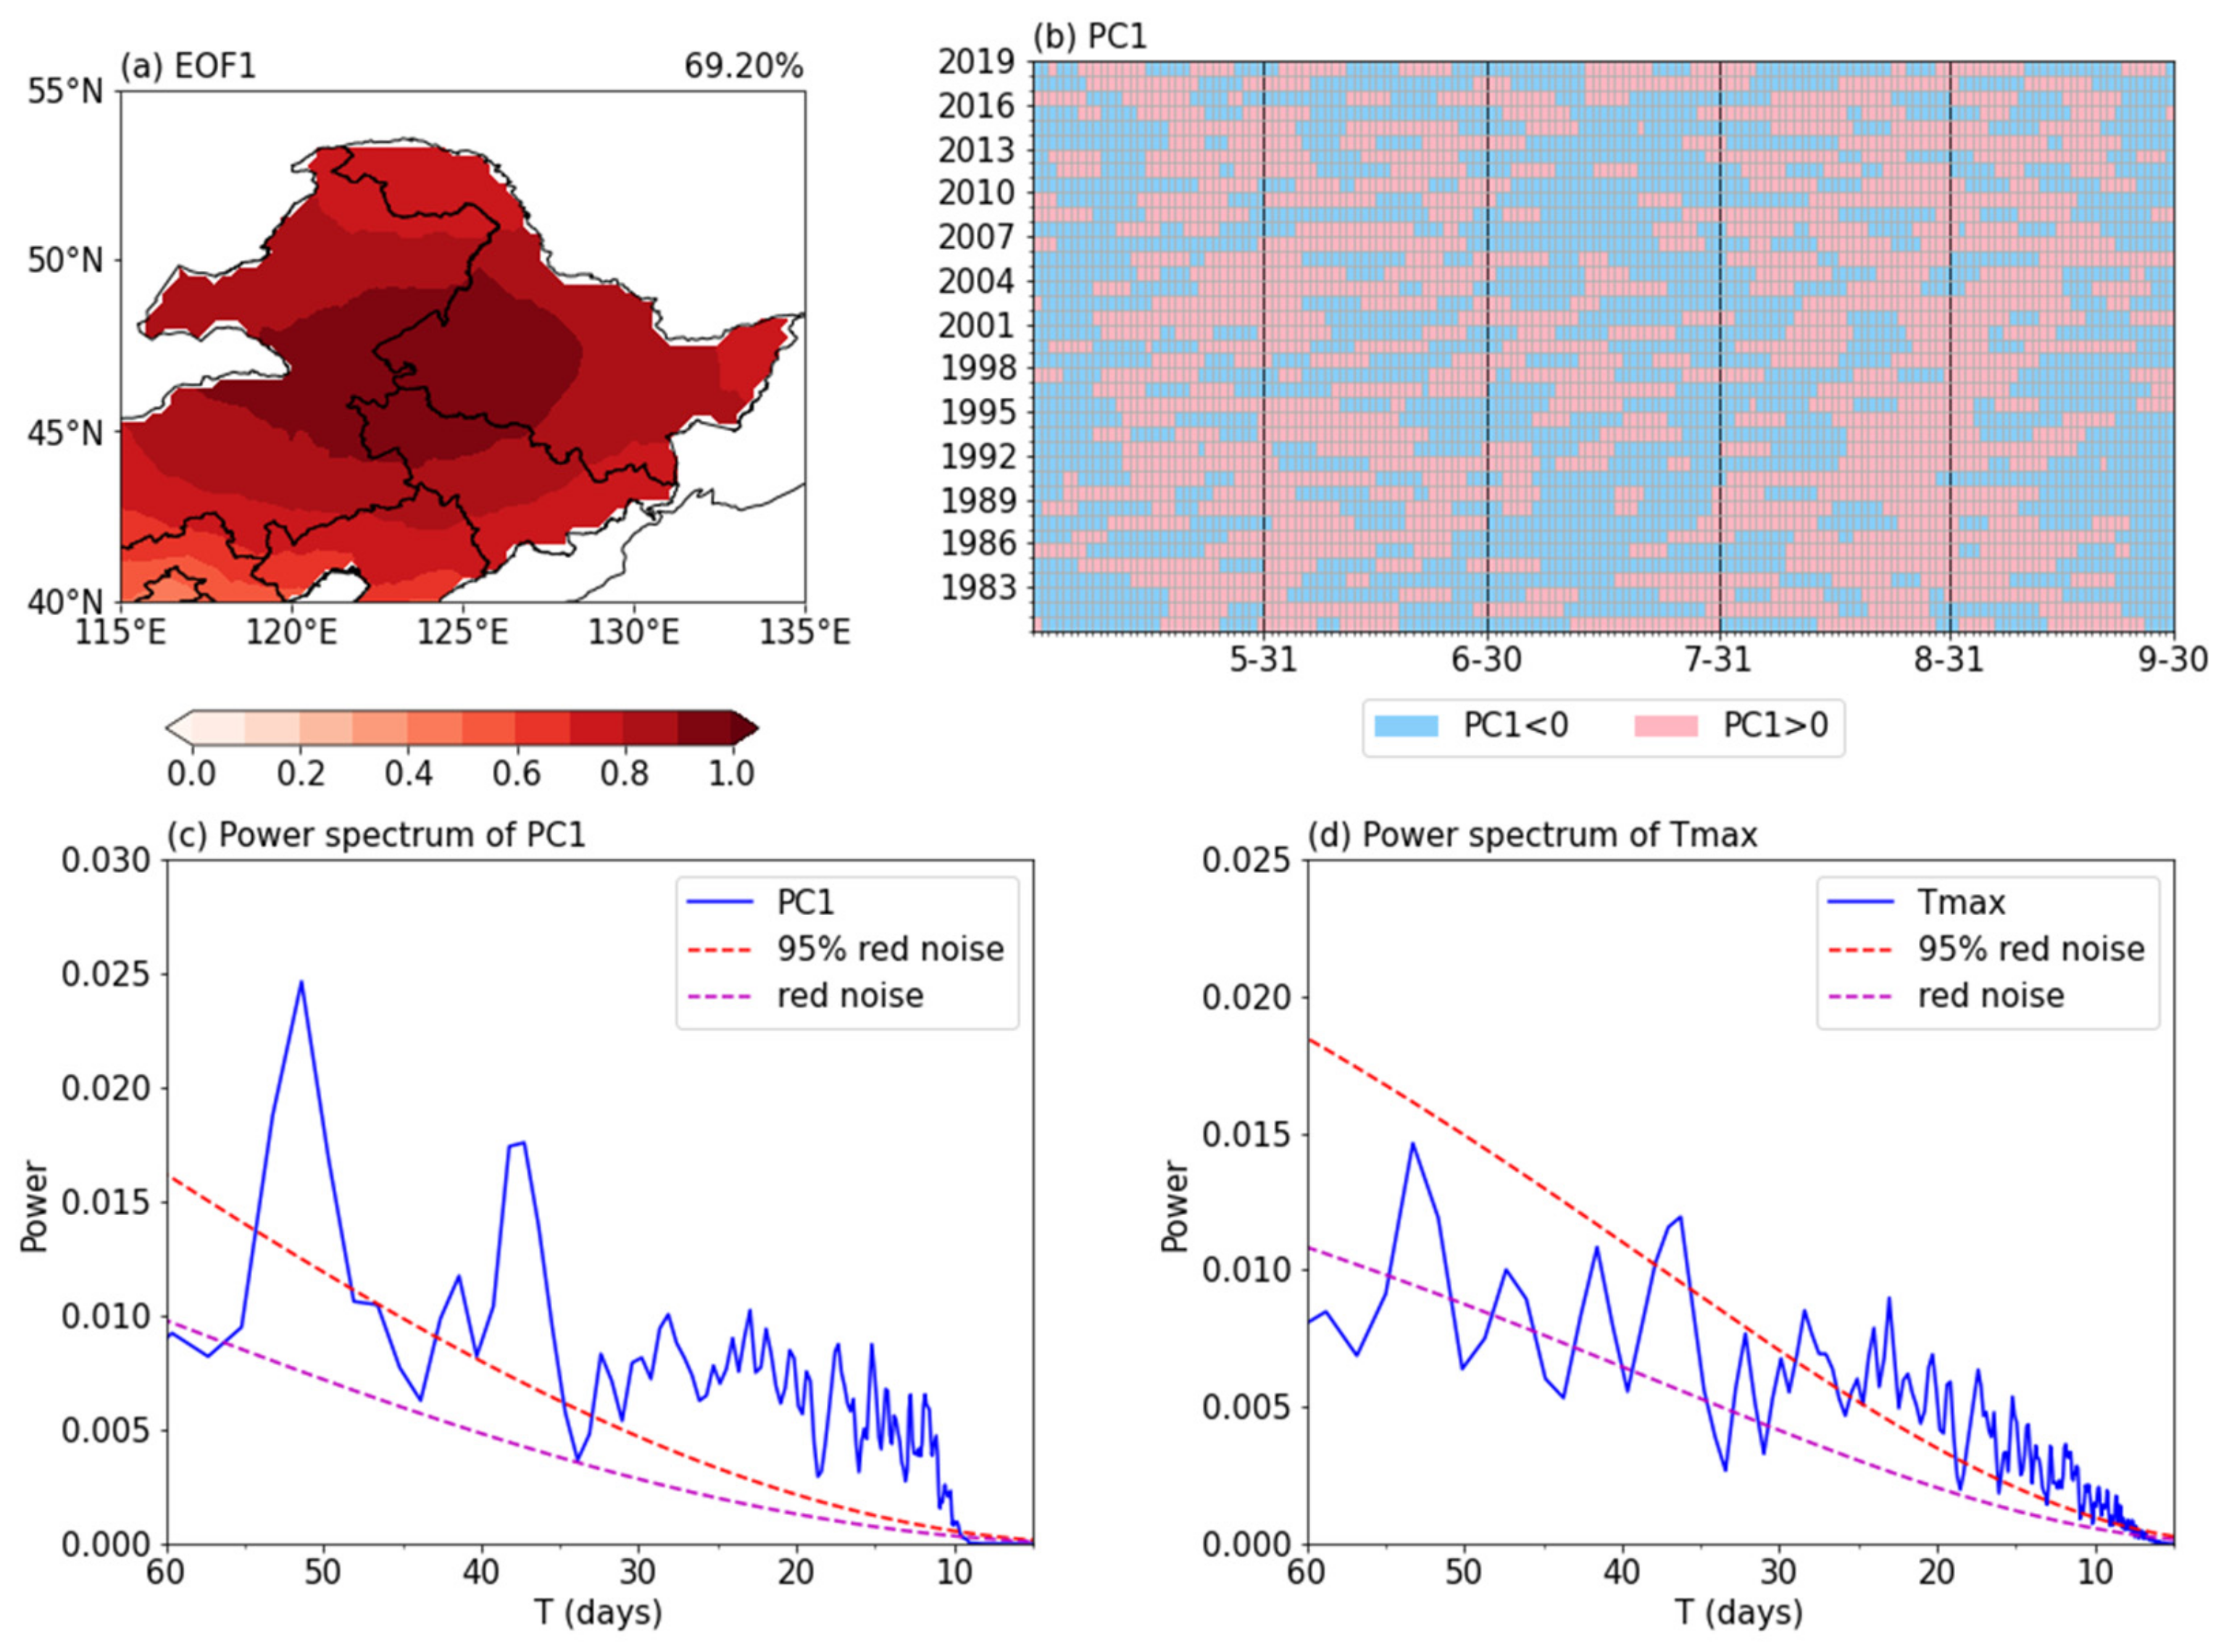
3.1. Intraseasonal Oscillation of Extreme-High Temperature

In order to investigate the variation of extreme-high temperatures in Northeast China, the extreme-high-temperature threshold in each grid based on the method in Section 2 was subtracted from the daily maximum temperature of each grid in northeast China during summer (May–September) from 1981–2019. The grid with a value greater than zero indicated an extreme-high-temperature day. After standardizing the results, the 10–90 d period component of the results via Butterworth bandpass filtering was obtained to represent intraseasonal components and to explore the intraseasonal oscillation features of extreme-high temperatures in northeast China during summer using EOF analysis. The first mode of EOF (EOF1) accounted for 69.2% of the total variance and showed that the extreme-high temperatures during the summer in northeast China exhibited a consistent variation in the whole region (Figure 1a), which is similar to the results of previous studies [54,55]. Furthermore, it can be seen from the time coefficient of the first mode (PC1) that the extreme-high-temperature in northeast China was characterized by obvious intraseasonal changes with a short cycle (Figure 1b), which was confirmed in the power spectrum analysis of PC1 with a significant 10–30 d period (Figure 1c).
Due to the extreme-high temperatures in northeast China presenting a consistent distribution feature throughout the region, we made a regional average of the daily maximum temperatures in northeast China from May to September of 1981–2019 and conducted a power spectrum analysis (Figure 1d). Before this, we first subtracted the climatological mean and the first three harmonics of Fourier decomposition from the daily data to remove the seasonal cycle. Then, the 5 d moving average was used to remove the synoptic-scale changes. The result of this method was consistent with the results of the power spectrum analysis of the data after 10–90 d filtering. Figure 1d shows a low-frequency oscillation period of 10–30 days for the daily maximum temperature in northeast China.

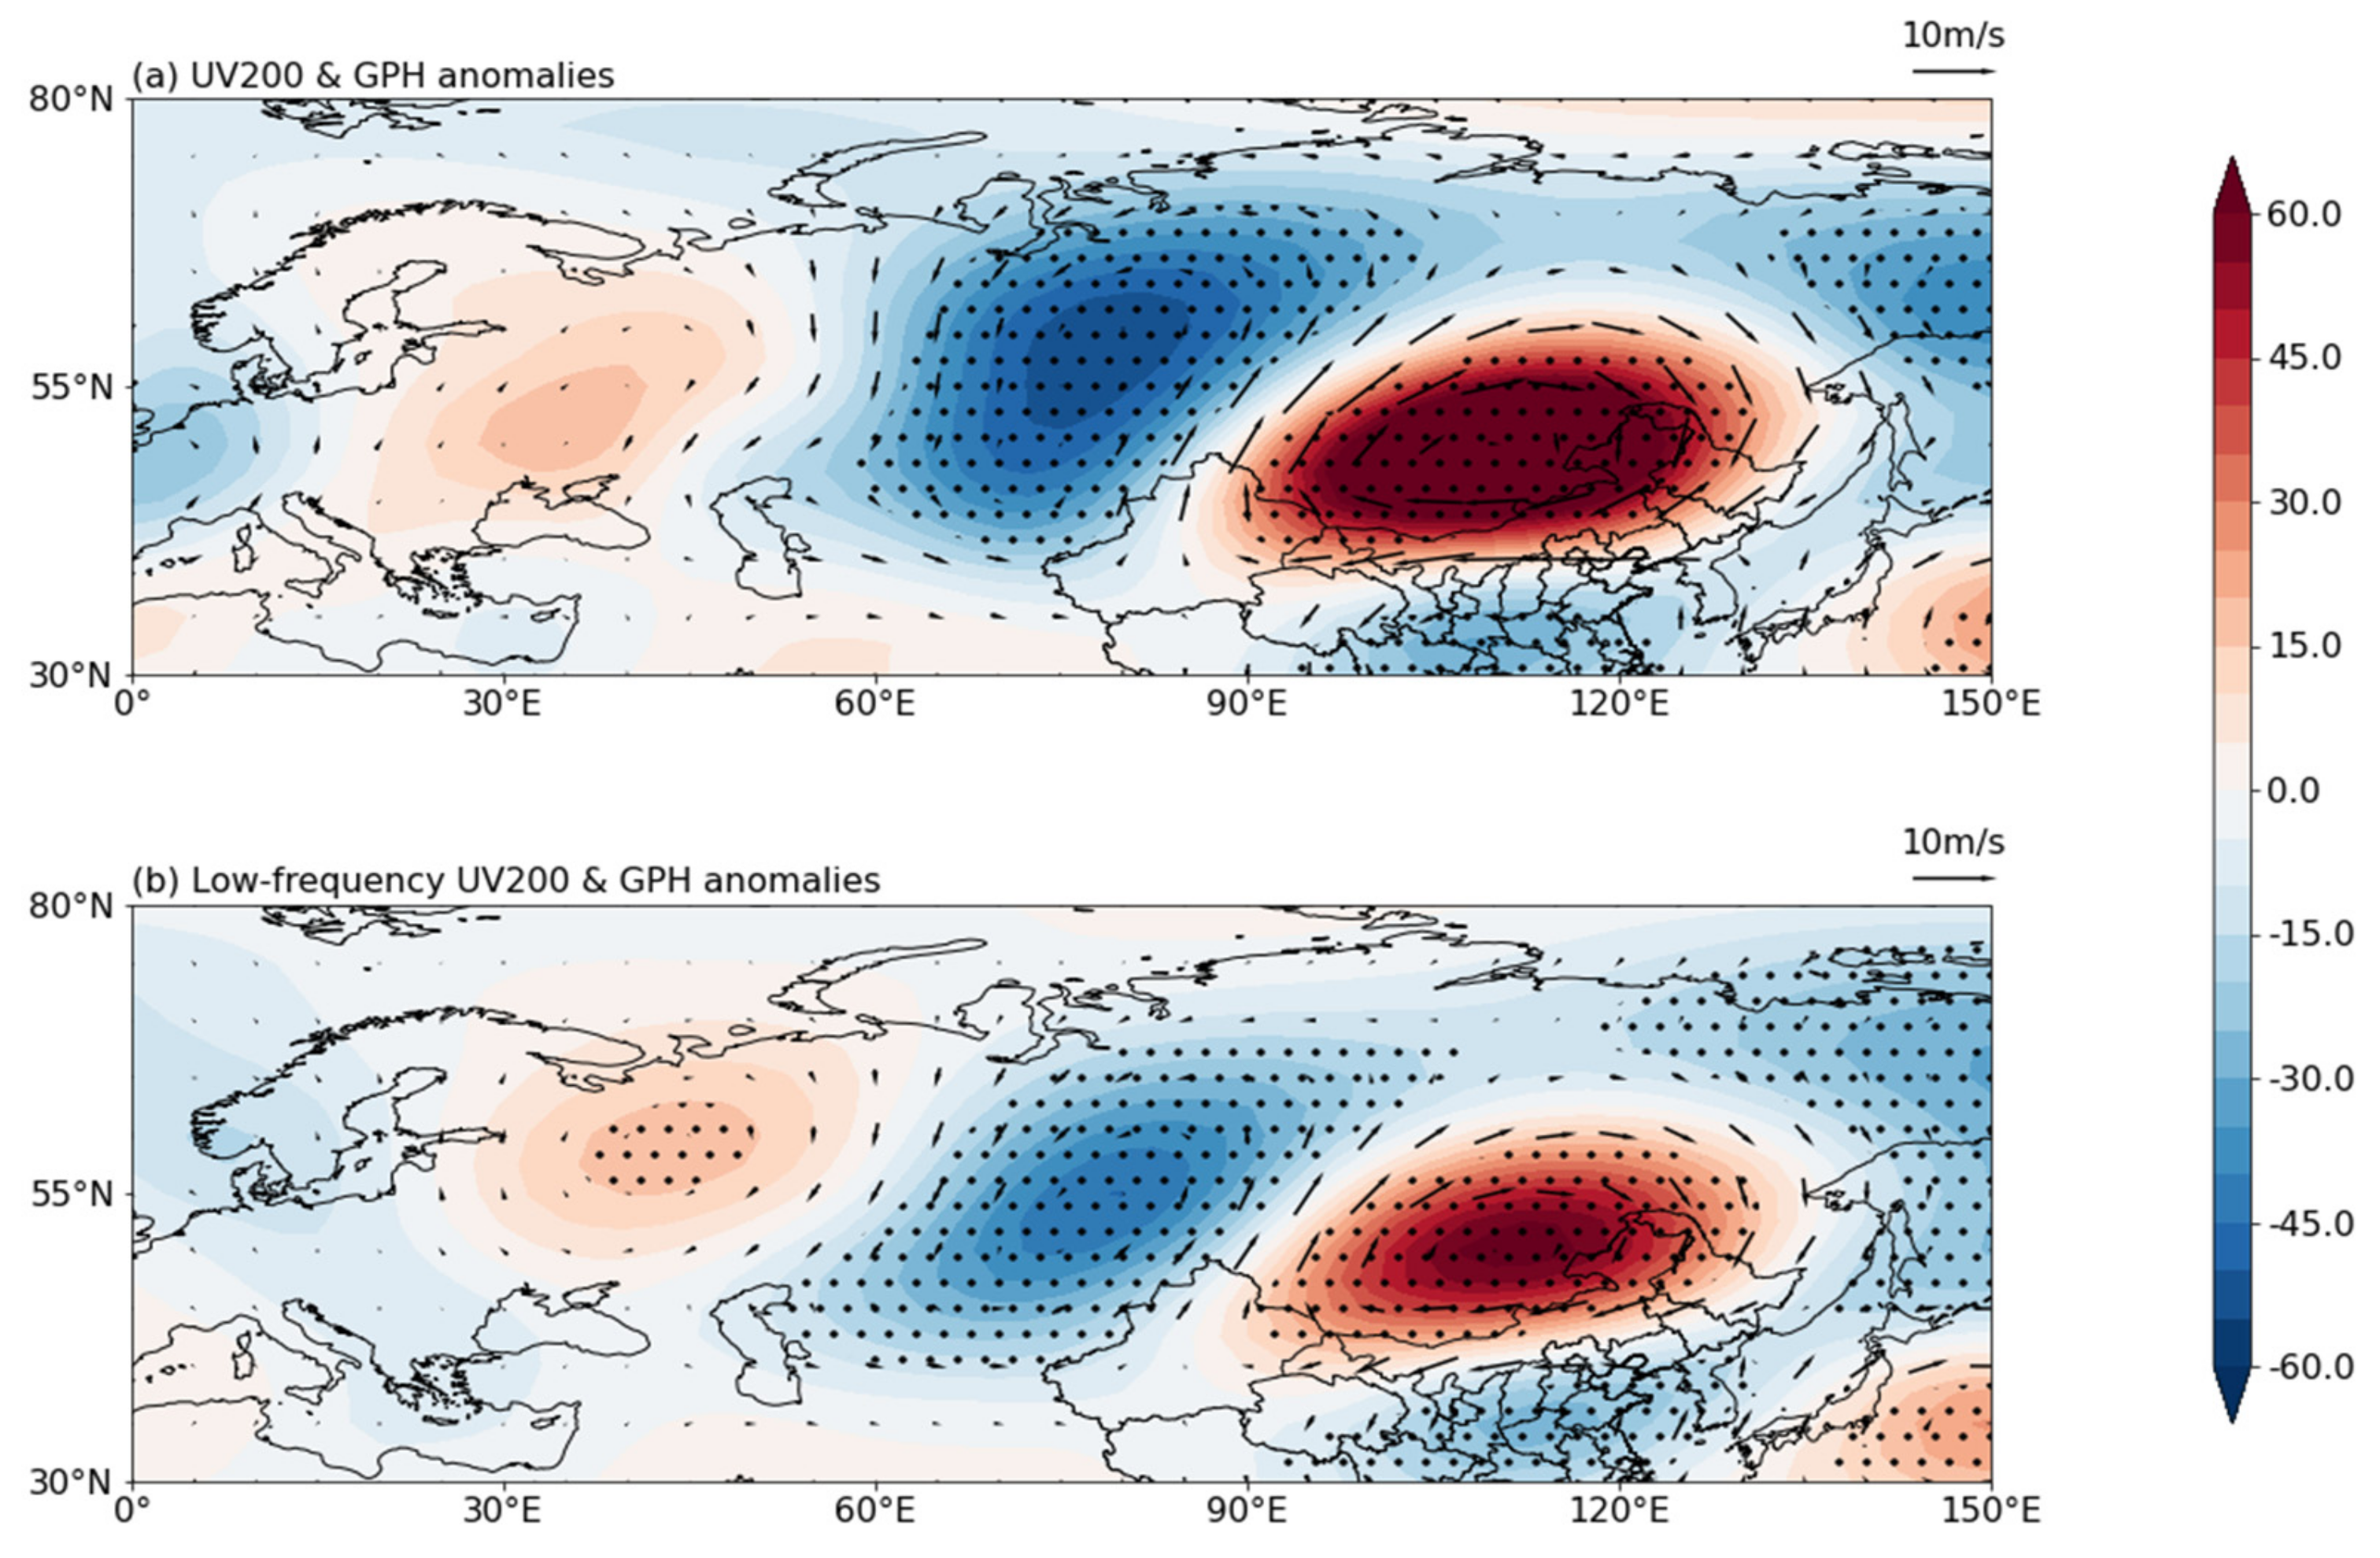
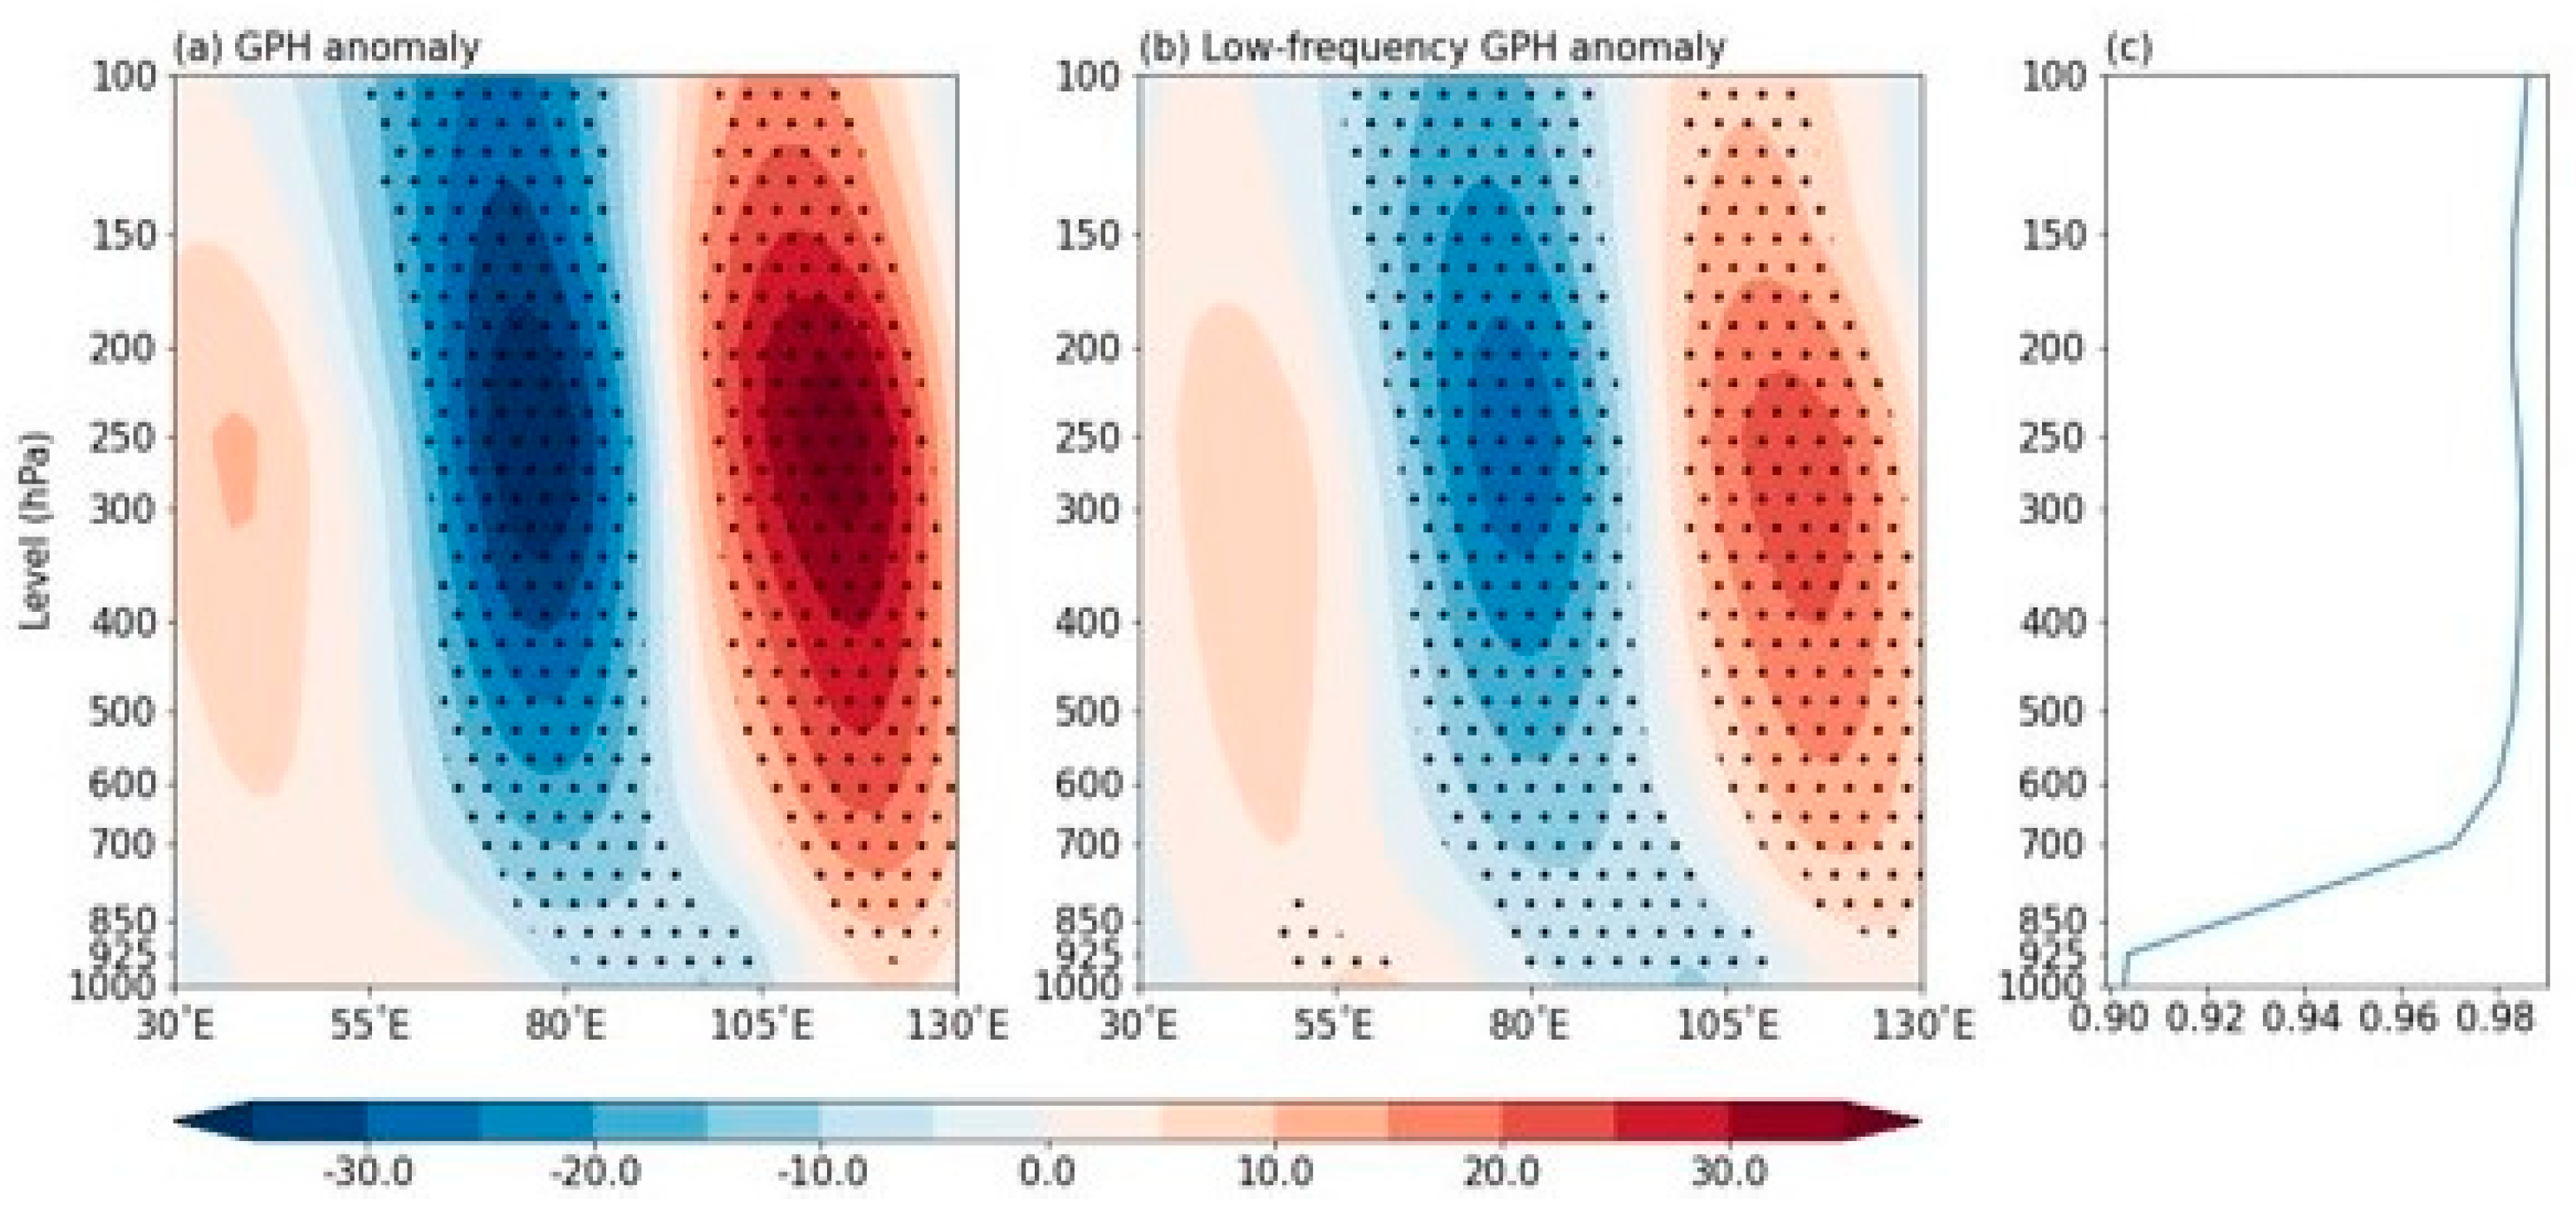
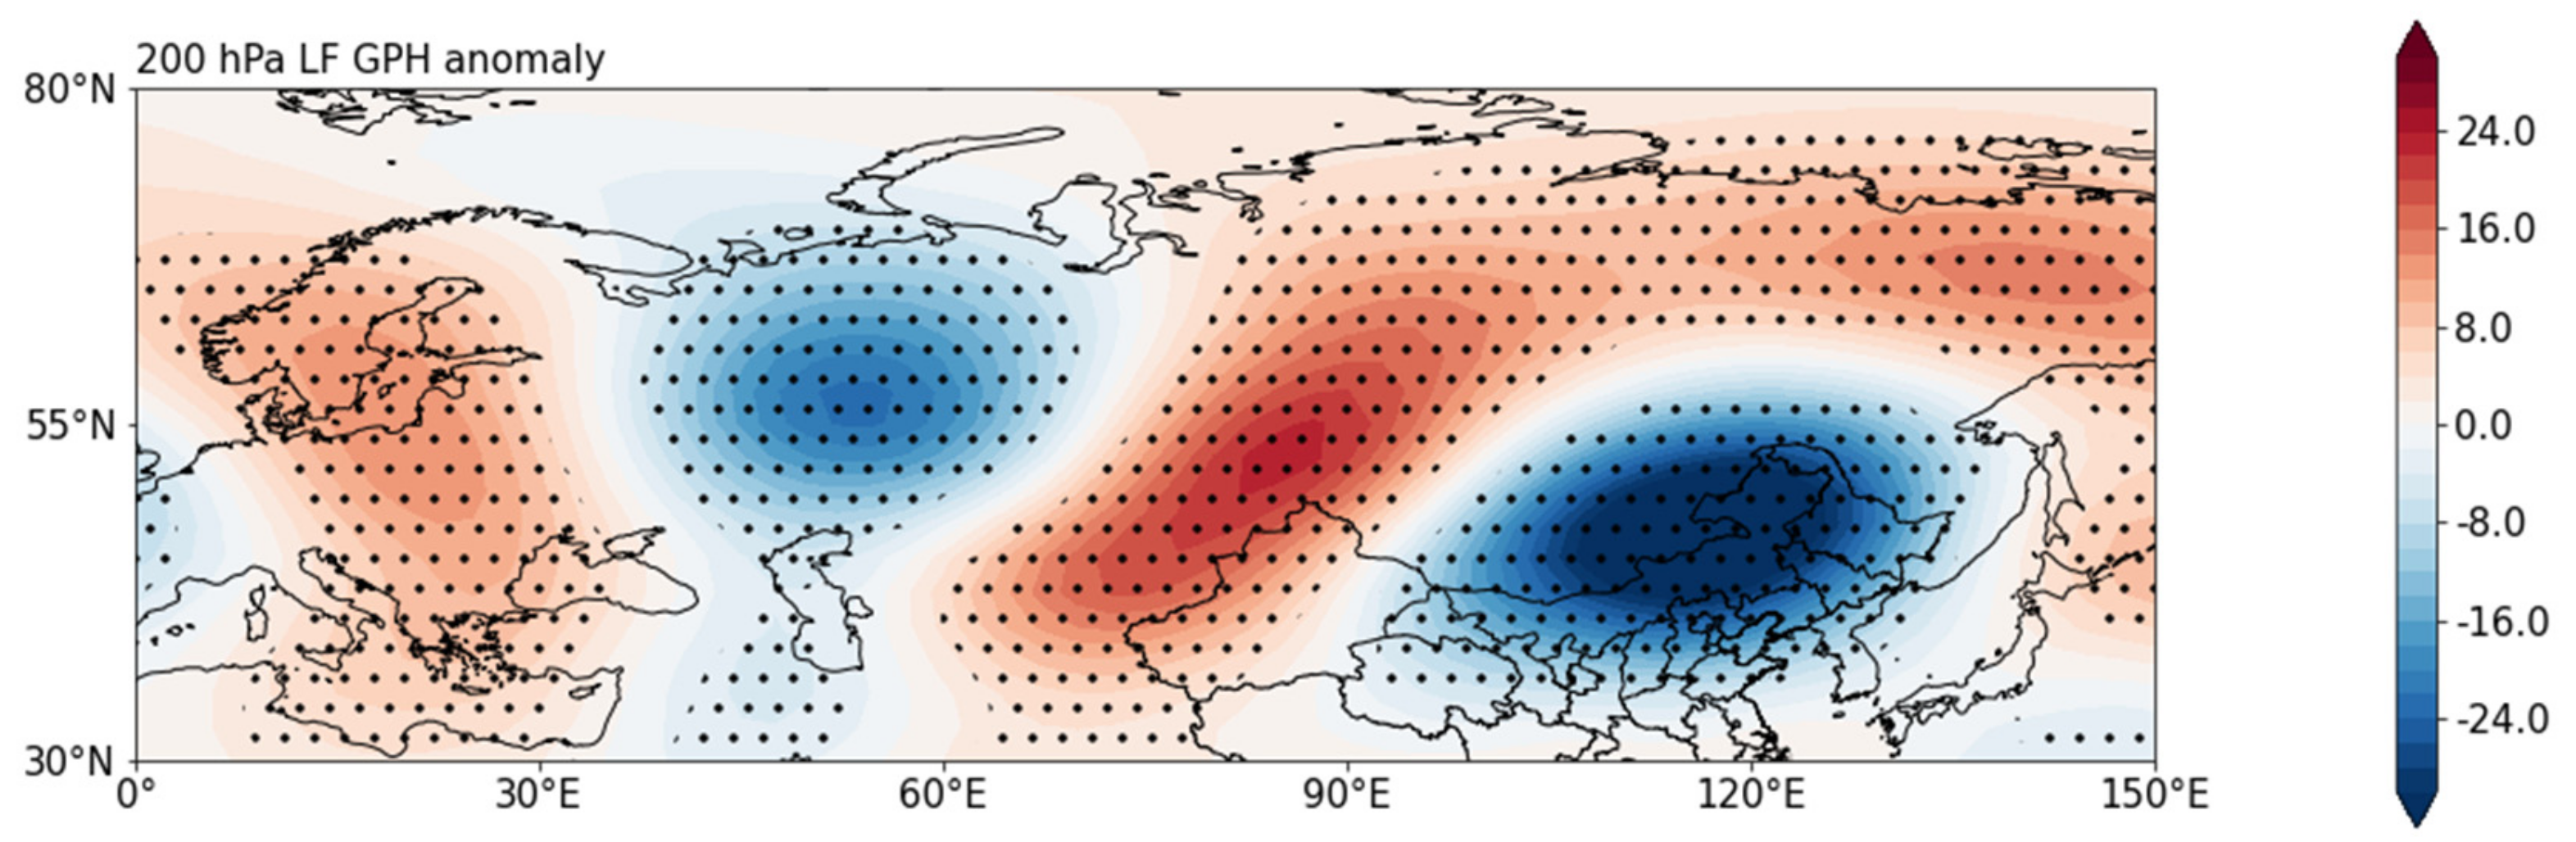
3.2. Low-Frequency Atmospheric Circulation Associated with LFEHTs

In the previous section, we found that the daily maximum temperature in northeast China had a low-frequency oscillation period of 10–30 d. Therefore, to find how the extreme-high-temperature events (EHTs) related to the low-frequency oscillation of 10–30 d, we adopted the method in Section 2 to identify low-frequency extreme-high-temperature events (LFEHTs) after filtering out the 10–30 d period component of daily maximum temperatures in northeast China from 1 May to 30 September during 1981–2019. Thus, a total of 87 LFEHTs in northeast China from 1981 to 2019 (Figure 2b) were identified, accounting for 88.8% of all 98 EHTs (Figure 2a). The correlation coefficient between LFEHTs and EHTs was 0.70 (Figure 2c), which indicated that LFEHTs dominated EHTs. Here, we provide an example of EHTs and LFEHTs in 2018 in northeast China (Figure 3) because the maximum temperature anomaly in late July and early August of this year exceeded 6 °C, which drew the attention of scholars. As shown in Figure 3, the number of LFEHTs was three, which was the same as that of the EHTs, among which the LFEHTs captured the two EHTs that occurred in early June and early August. The LFEHT around July 1 was identified due to its strong low-frequency signal but was not identified as an EHT due to its duration of only two days. The EHT around 20 July was not captured by LFEHT due to its weak low-frequency signal. In addition, extreme-high-temperature days occurred near almost every peak of low-frequency Tmax anomalies, such as the peaks near 20 June, 1 July and 20 August, but they did not develop into EHTs due to their lack of persistence, which indicates that the oscillation with the period of 10–30 d was highly reliable for extreme-high temperatures in northeast China.
To investigate the ISO of atmospheric circulation related to LFEHTs in northeast China, the 200 hPa geopotential height anomalies and horizontal wind anomalies, as well as their low-frequency features corresponding to 87 LFEHTs in summers from 1981 to 2019, are composited in Figure 4a,b, respectively. The atmospheric circulation anomalies corresponding to the LFEHTs were very similar to their low-frequency anomalies except for being a little eastward in the latter. In addition, there is an obvious zonal low-frequency teleconnection wave-train at the mid-high latitude in the Eurasian continent, with two positive anomaly centers located in the north of the Caspian Sea and near Lake Baikal and a negative anomaly center in Lake Balkhash.
To further investigate the vertical structure of the wave-train, the vertical profiles of the GPH and its low-frequency of 10–30 d oscillation averaged along 35°–65° N and the spatial correlation coefficient between them are given in Figure 5. The low-frequency GPH and the vertical profiles of GPH showed similar vertical barotropic structures, and the anomalous centers were all located between 250 and 300 hPa. The spatial correlation coefficients of the two were also extremely large and became more remarkable with their increase in height. This indicates that low-frequency circulation contributed greatly to the anomalous circulation associated with LFEHTs; the spatial distribution of the low-frequency anomaly field and how the anomaly fields became more and more similar as their heights increased, indicating that the LFEHTs were more closely associated with the mid-high latitude circulation at the upper level.
To further illustrate the propagation feature of the low-frequency wave-train related to summer LFEHTs in northeast China, the evolution of composited T-N wave activity flux (WAF) and stream function anomalies from 15 days before the onset day of the LFEHTs to 10 days after it are presented in Figure 6. As seen from Figure 6a–f, there was a wave-train that propagated eastward from western Europe to northeast China. The wave energy inflow strengthened suddenly around 5–10 days before the occurrence of these events. In addition, the WAF converged over northeast China and enhanced during the onset day of the LFEHTs, suggesting that the wave-train may be one of the reasons for triggering LFEHTs. The signal over northeast China was persistent for about 5 days (Figure 6d,e), which was similar to the period of atmospheric blocking events [56]. Thus, a future study may further calculate the blocking index to investigate their relationship.
To further explore the propagation characteristics of the low-frequency wave-train associated with the LFEHTs, the longitude-time profile of the low-frequency GPH at 200 hPa averaged over 35°–65° N where the active centers of the wave-train located is given in Figure 7. It can be found that the wave-train exhibited a noticeable eastward propagation with time and was enhanced 5–10 days before the onset of LFEHTs.

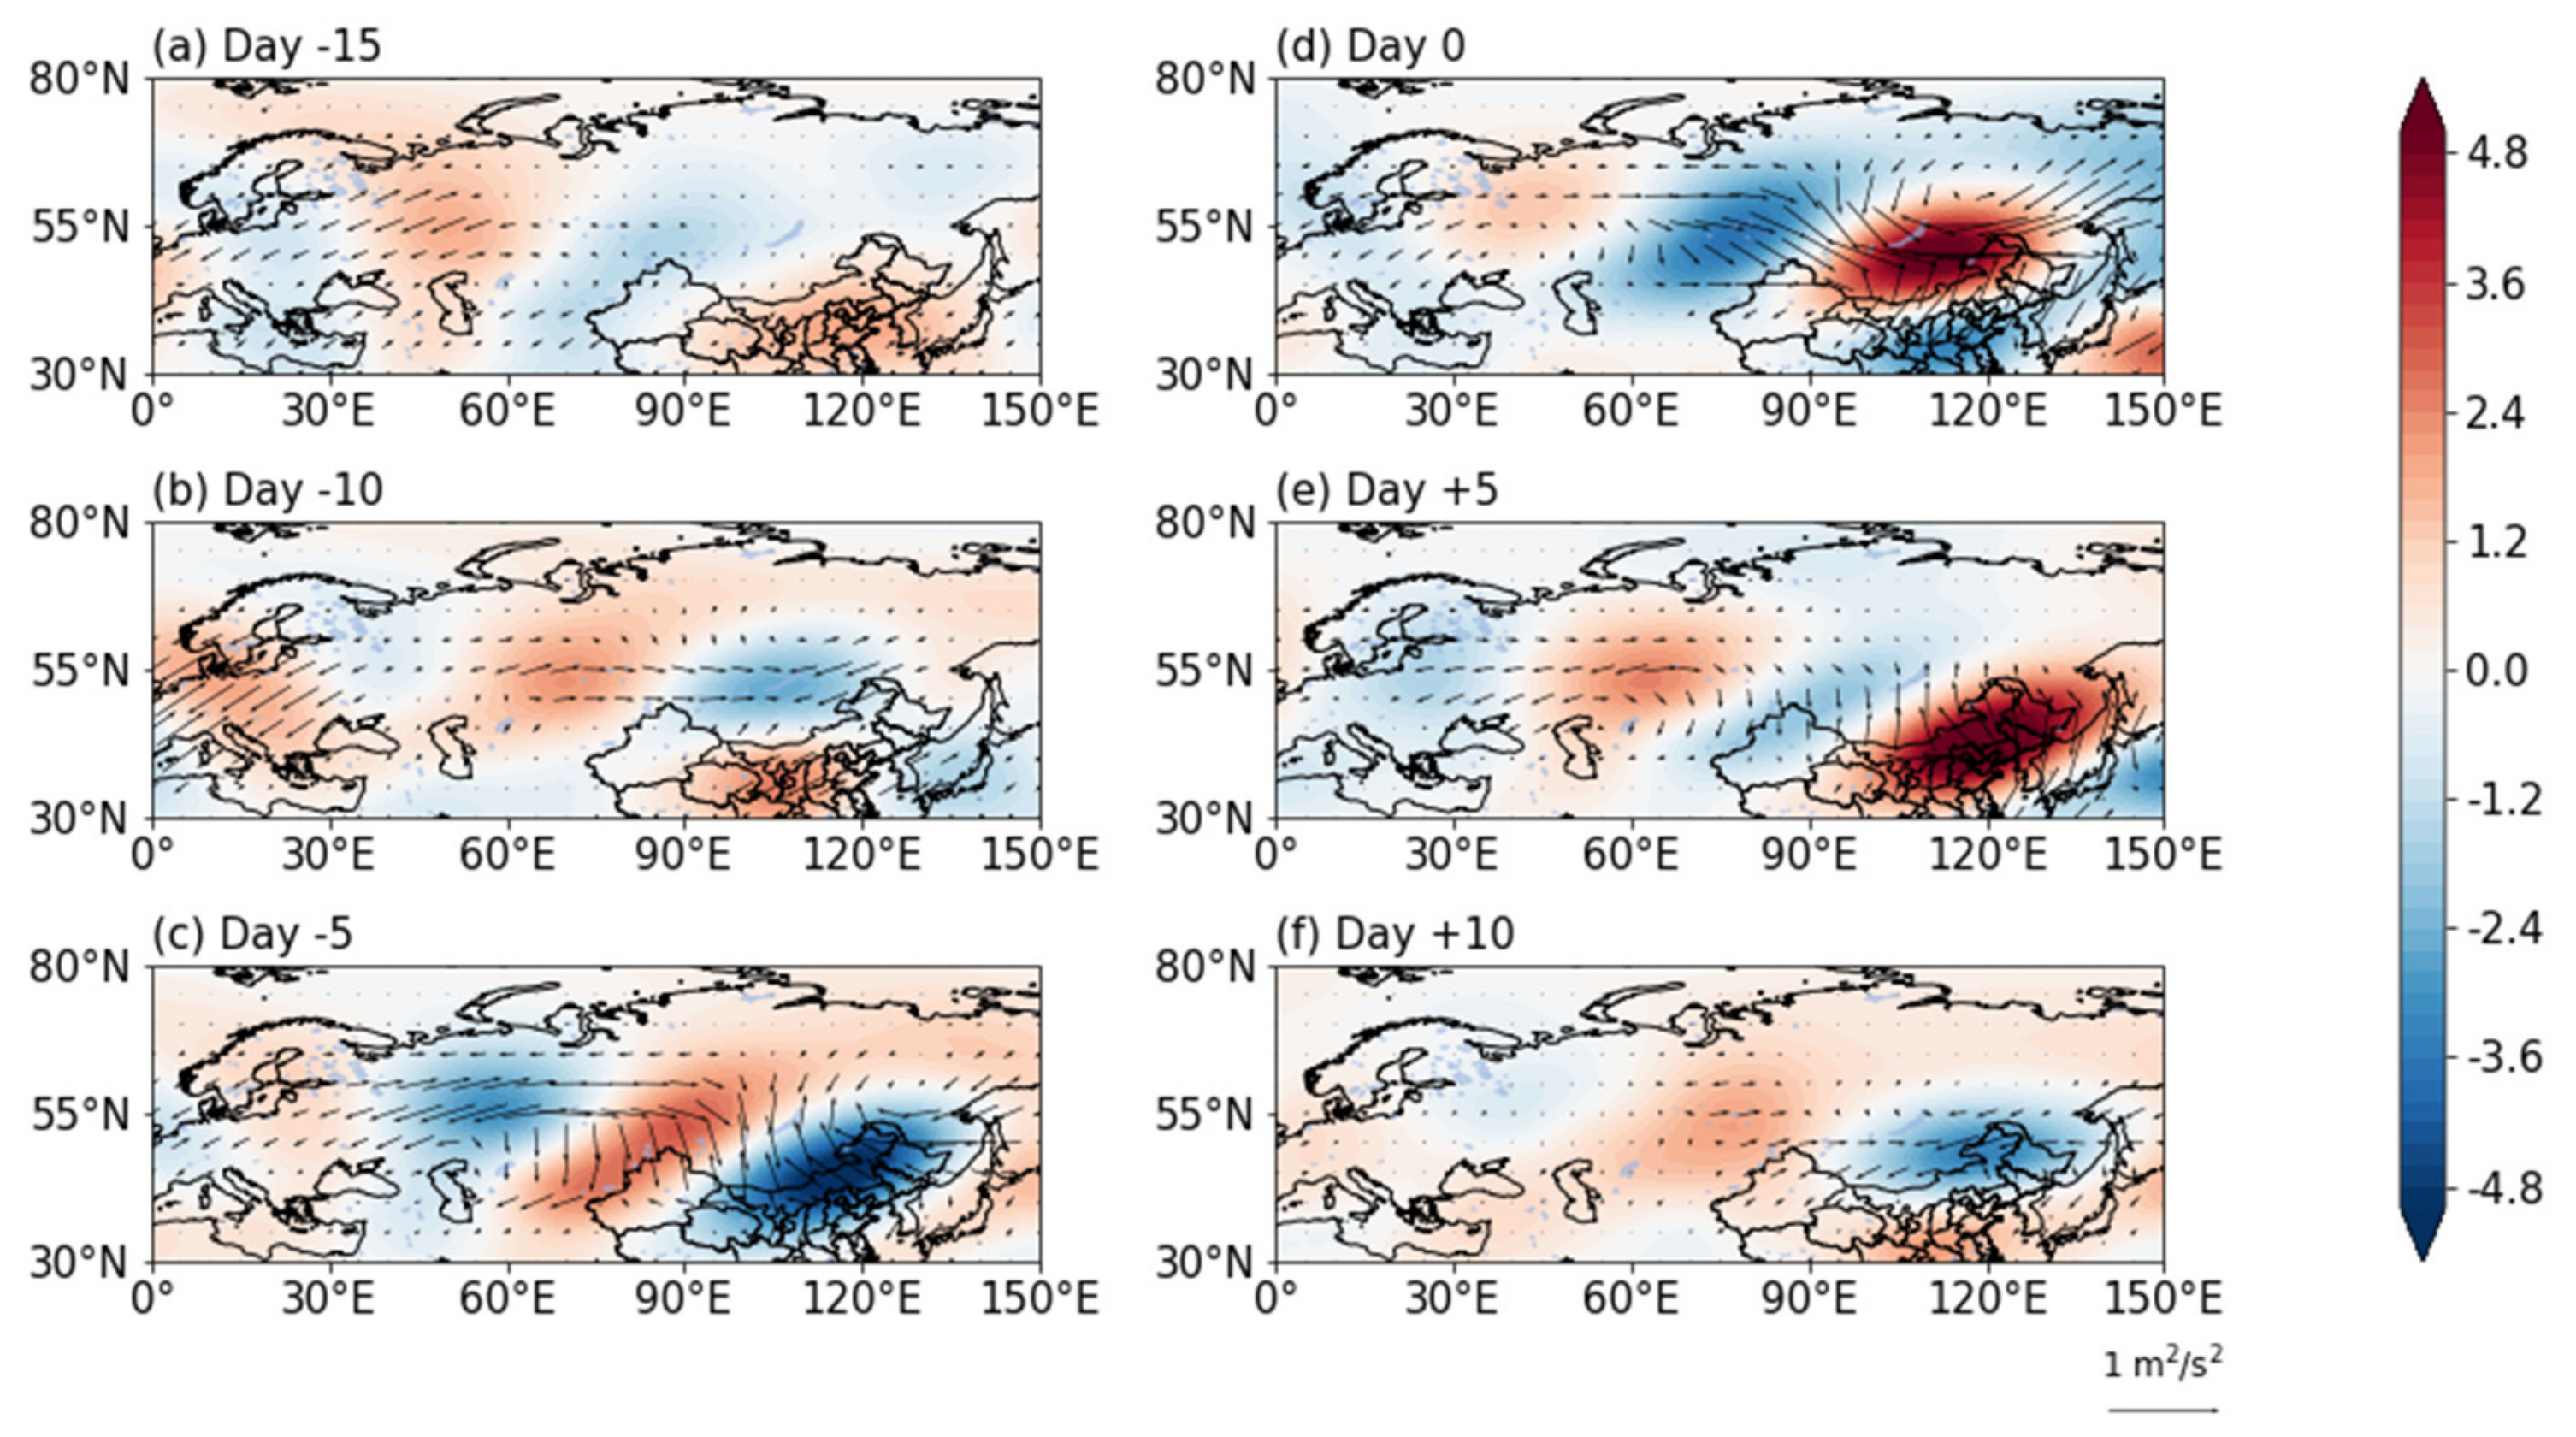
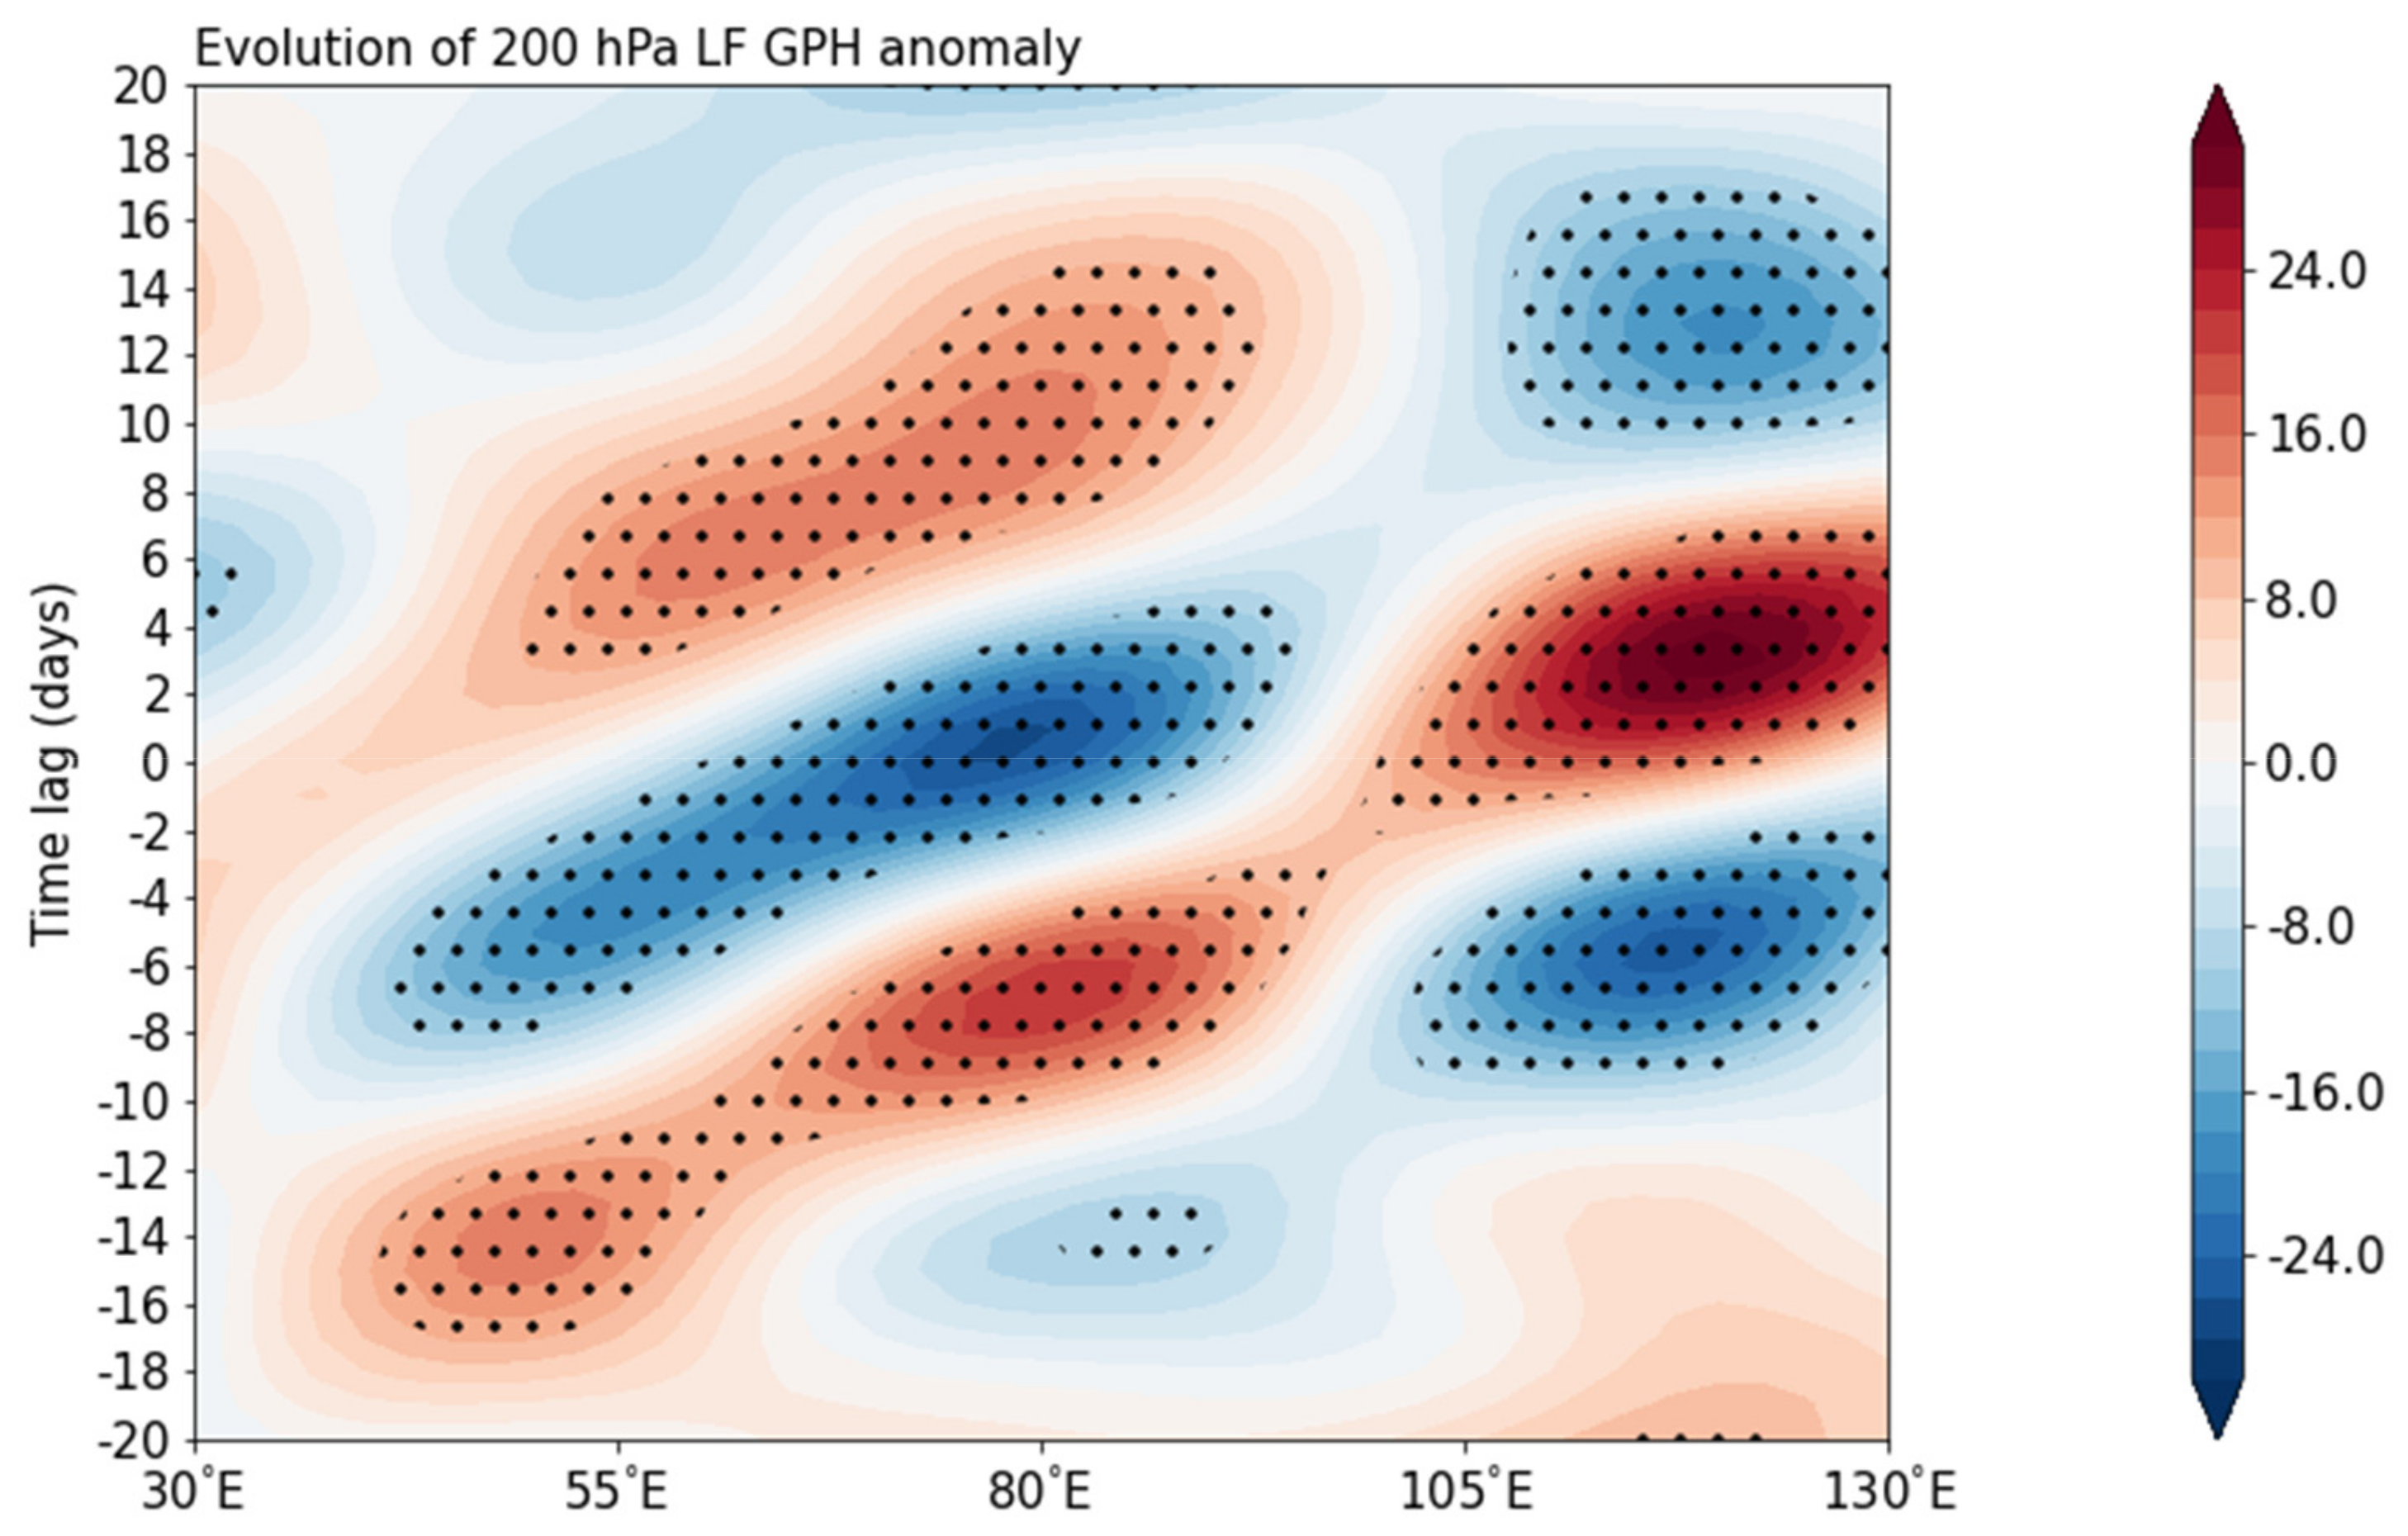
3.3. Influence of Low-Frequency Wave-Train on LFEHTs

In Section 3.2, a wave-train at mid-high latitudes related to the summer LFEHTs in northeast China was discussed. Thus, it was necessary to investigate its influence on the LFEHTs by quantifying an index for this wave-train. We composited 200 hPa low-frequency GPH anomalies 5–10 days before the occurrence of LFEHTs, considering the sudden enhancement in the wave-train around 7 days before. In Figure 8, the wave-train has two significant positive centers located near the Baltic Sea (20° E, 52.5° N) and around Lake Balkhash (80° E, 52.5° N), and two significant negative centers located in the north of the Caspian Sea (47.5° E, 57.5° N) and near Lake Baikal (115° E, 45° N). Thus, a low-frequency wave-train index (LFWI) is defined by the following formula based on the GPH anomalies of the four centers:
LFWI = 1 4 H   20 ° E , 52.5 ° N     H   47.5 ° E , 57.5 ° N   +   H   80 ° E , 52.5 ° N     H 115 ° E , 45 ° N
where H denotes the low-frequency GPH.
To investigate the relationship between LFWI and LFEHTs, the evolutions of the LFWI and the low-frequency regional average Tmax anomaly in northeast China from 30 days before to 10 days after the occurrence of the LFEHTs are presented in Figure 9a. The variations in the two are nearly out of phase. The LFWI reached its peak about 5–10 days before the occurrence of LFEHTs and then decreased, while the low-frequency Tmax anomaly changed inversely to it, indicating that the LFWI lead the low-frequency Tmax anomaly by about 5–10 days. Subsequently, we calculated the leading correlation coefficient between the LFWI and the LF Tmax anomaly when the LFEHTs occurred (Figure 9b), suggesting that the LFWI had a significant positive correlation within the leading 5–10 days with the highest value on day 7 before the low-frequency Tmax anomaly, indicating that the intensity of LFWI in northeast China influenced the intensity of the LFEHTs. We further calculated the contribution of the LFWI 7 days ahead of the summer low-frequency Tmax variability in northeast China (Figure 9c), revealing that LFWI can explain about 15% to 30% of the summer low-frequency Tmax variability in northeast China.

4. Discussion and Conclusions

Based on the CN05.1 daily temperature dataset and NCEP/NCAR reanalysis dataset from 1981 to 2019, we found that the distribution of summers extreme-high temperatures in northeast China were consistent throughout the region, with a low-frequency oscillation period of 10–30 d. After counting the summers EHTs in Northeast China from 1981 to 2019, we found that among all the 97 EHTs, the number of LFEHTs of 10–30 d oscillations was 87, accounting for 89.7% of total summer EHTs. In the composited low-frequency atmospheric circulation anomalies of the LFEHTs, a zonal barotropic Rossby wave-train over the mid-high latitude of the Eurasian continent moving from west to east was found to be the most significant low-frequency circulation characteristic accompanying the LFEHTs. An index for this low-frequency Rossby wave-train (LFWI) was defined to quantify this change. The intensity of LFWI reached its peak about 5–10 days before the occurrence of LFEHTs and then decreased, while the low-frequency Tmax changed inversely to it. The LFWI 7 days ahead could explain around 15% to 30% of the summer’s low-frequency Tmax variability in northeast China, indicating that this LFWI may be a potential precursor for forecasting summer LFEHTs in northeast China.
Though the above Rossby wave-train is closely associated with the LFEHTs, the possible mechanisms leading to its formation are still unclear. However, very few efforts have been made. For instance, Wang and Tan [57] used energetics analysis to investigate the formation and maintenance mechanism of subseasonal atmospheric patterns over the eastern Pacific Ocean. This method can be used in our future study. The possible sources of energy for the wave-train may include but are not limited to SST anomalies [58,59,60,61,62], Arctic Sea ice [63] and soil moisture [64]. Those factors can induce atmospheric responses and trigger Rossby waves. The interaction between flow and terrain can also influence the development of the wave-train [65,66,67]. Moreover, Matsueda et al. [68] and Wang et al. [69] showed that there was an association between the MJO in the tropics and the oscillation of the mid-high latitude. We also found that the period of the wave-train in this study is similar to that in the second mode of BSISO [12], indicating that a possible relationship between them exists and should be investigated further in a future study. Nabizadeh et al. [56] suggested that adiabatic warming in blocking events due to subsidence is the main driver of the positive temperature anomaly, which is similar to the mechanism of EHT [50,70,71,72]. Yang et al. [45] indicated that an enhanced and slow-moving cold anomaly over the Nova Zembla-Ural Mountains can stimulate and maintain the anticyclonic anomalies over northeast Asia including northeast China by strengthening the atmospheric blocking and the amplitude of the wave-train resulting in a longer EHT. Thus, EHTs in northeast China are possibly related to atmospheric blocking and it is necessary to explore their association. In addition, previous studies on EHTs in northeast China found that during the EHTs in 2018, northeast China was influenced by a meridional wave-train called the Pacific-Japan Pattern (PJ) [46]. Hence, except for the influence of low-frequency wave-trains at mid-high latitudes found in this study, it is worthwhile to further investigate whether there are also meridional low-frequency wave-trains that affect LFEHTs in northeast China, such as the low-frequency modes of the PJ [73], and their effects on extreme-high temperatures in northeast China.

Author Contributions

Formal analysis, Y.T. and G.Z.; Writing—original draft, Y.T. and G.Z.; Writing—review & editing, Y.T., G.Z., V.I., X.Y. and Z.L. All authors have read and agreed to the published version of the manuscript.

Funding

This research was supported by the National Natural Science Foundations of China (42175035; 42175034) and the National Key Research and Development Program of China (2017YFA0603804).

Acknowledgments

The authors thank the two anonymous reviewers for their very helpful comments and suggestions.

Conflicts of Interest

The authors declare no conflict of interest.

References

  1. Wang, L.; Wu, Z.F.; Wang, F.X.; Du, H.B.; Zong, S.W. Comparative analysis of the extreme temperature event change over Northeast China and Hokkaido, Japan from 1951 to 2011. Theor. Appl. Climatol. 2016, 124, 284–375. [Google Scholar] [CrossRef]
  2. He, Y.; Dong, W.J.; Guo, X.Y.; Dan, L. The terrestrial growth and its relationship with climate in China based on the MODIS data. Acta Ecol. Sin. 2007, 27, 5086–5092. [Google Scholar] [CrossRef]
  3. Yao, F.M.; Zhang, J.H. Change of relative extreme high temperature events and climate risk in rice growing period in China from 1981 to 2000. J. Nat. Disasters 2009, 18, 37–42. (In Chinese) [Google Scholar]
  4. Huang, R.H.; Du, Z.C. Evolution characteristics and trend of droughts and floods in China under the background of global warming. Chin. J. Nat. 2010, 32, 187–195. (In Chinese) [Google Scholar]
  5. Zhang, K.H.; Li, Z.T.; Liu, J.F.; Liu, F.Y.; Bai, J. Temporal-spatial feature analysis on the high-temperature and heatwaves in Hebei and its influence on industry and transportation. Geogr. Geo Inf. Sci. 2011, 27, 90–95. (In Chinese) [Google Scholar]
  6. Wang, M.Z.; Zhen, S.; Wang, S.G.; Shang, K.Z. Research progress of influence of high temperature and heat wave on human health. J. Environ. Health 2012, 29, 662–664. (In Chinese) [Google Scholar]
  7. Xie, P.; Wang, Y.L.; Peng, J.; Liu, Y.X. Health related urban heat wave vulnerability assessment: Research progress and framework. Prog. Geogr. 2015, 34, 165–174. (In Chinese) [Google Scholar]
  8. Zhang, D.Q.; Zhen, Z.H.; Chen, L.J.; Zhang, B.Q. Advances on the predictability and prediction methods of 10-30d extended range forecast. J. Appl. Meteorol. Sci. 2019, 30, 416–430. (In Chinese) [Google Scholar]
  9. Madden, R.A.; Julian, P.R. Detection of a 40–50 day oscillation in the zonal wind in the tropical Pacific. J. Atmos. Sci. 1971, 28, 702–708. [Google Scholar] [CrossRef]
  10. Kemball-Cook, S.R.; Weare, B.C. The Onset of Convection in the Madden–Julian Oscillation. J. Clim. 2001, 14, 780–793. [Google Scholar] [CrossRef]
  11. Wheeler, M.C.; Hendon, H.H. An all-season real-time multivariate MJO index: Development of an index for monitoring and prediction. Mon. Weather Rev. 2004, 132, 1917–1932. [Google Scholar] [CrossRef]
  12. Lee, J.Y.; Wang, B.; Wheeler, M.C.; Fu, X.H.; Waliser, D.E.; Kang, I.S. Real-time multivariate indices for the boreal summer intraseasonal oscillation over the Asian summer monsoon region. Clim. Dyn. 2013, 40, 493–509. [Google Scholar] [CrossRef] [Green Version]
  13. Jacques, C.M.; Broennimann, S.; Martius, O.; Vera, C.; Cerne, B. Summer heat waves in southeastern Patagonia: An analysis of the intraseasonal timescale. Int. J. Climatol. 2016, 36, 1359–1374. [Google Scholar] [CrossRef]
  14. Gao, M.N.; Wang, B.; Yang, J.; Dong, W.J. Are Peak Summer Sultry Heat Wave Days over the Yangtze–Huaihe River Basin Predictable? J. Clim. 2018, 31, 2185–2196. [Google Scholar] [CrossRef]
  15. Mei, S.L.; Li, Y.; Ma, J. Review of the application of MJO in the extended range forecast. Adv. Earth Sci. 2020, 35, 1222–1231. (In Chinese) [Google Scholar]
  16. Chen, Y.; Zhai, P. Simultaneous modulations of precipitation and temperature extremes in Southern parts of China by the boreal summer intraseasonal oscillation. Clim. Dyn. 2017, 49, 3363–3381. [Google Scholar] [CrossRef] [Green Version]
  17. Diao, Y.F.; Li, T.; Hsu, P.C. Influence of the boreal summer intraseasonal oscillation on extreme temperature events in the northern hemisphere. J. Meteorol. Res. 2018, 32, 534–547. [Google Scholar] [CrossRef]
  18. Chen, R.D.; Wen, Z.P.; Lu, R.Y. Large-scale circulation anomalies and intraseasonal oscillations associated with long-lived extreme heat events in South China. J. Clim. 2018, 31, 213–232. [Google Scholar] [CrossRef]
  19. Qi, X.; Yang, J. Extended-range prediction of a heat wave event over the Yangtze River Valley: Role of intraseasonal signals. Atmos. Ocean. Sci. Lett. 2019, 12, 451–457. [Google Scholar] [CrossRef] [Green Version]
  20. Qi, X.; Yang, J.; Gao, M.N.; Yang, H.W.; Liu, H.B. Roles of the tropical/extratropical intraseasonal oscillations on generating the heat wave over Yangtze River Valley: A numerical study. J. Geophys. Res. Atmos. 2019, 124, 3110–3123. [Google Scholar] [CrossRef] [Green Version]
  21. Gao, M.N.; Yang, J.; Wang, B. How are heat waves over Yangtze River valley associated with atmospheric quasi-biweekly oscillation? Clim. Dyn. 2018, 51, 4421–4437. [Google Scholar] [CrossRef]
  22. Hsu, P.C.; Qian, Y.T.; Liu, Y.; Murakami, H.; Gao, Y. Role of abnormally enhanced MJO over the western Pacific in the formation and subseasonal predictability of the record-breaking Northeast Asian heatwave in the summer of 2018. J. Clim. 2020, 33, 3333–3349. [Google Scholar] [CrossRef]
  23. Wang, Z.S.; Gong, Y.F. The low-frequency oscillation characteristics of precipitation in China and its relation to the low-frequency oscillation of tropical ocean in summer 2016. J. Chengdu Univ. Inf. Technol. 2020, 35, 439–446. (In Chinese) [Google Scholar]
  24. Anderson, J.R.; Rosen, R.D. The latitude-height structure of 40–50 day variations in atmospheric angular momentum. J. Atmos. Sci. 1983, 40, 1584–1591. [Google Scholar] [CrossRef] [Green Version]
  25. Zhang, K.S. The 40-50 day low-frequency oscillation of the zonal men flow and its destabilizing effect. Chin. J. Atmos. Sci. 1987, 11, 227–236. (In Chinese) [Google Scholar]
  26. Li, C.Y. Intraseasonal oscillations in the atmosphere. Chin. J. Atmos. Sci. 1990, 14, 32–45. (In Chinese) [Google Scholar]
  27. Li, C.Y. Global characteristics of 30–60 day atmospheric oscillation. Chin. J. Atmos. Sci. 1991, 15, 66–76. (In Chinese) [Google Scholar]
  28. Li, C.Y.; Cao, W.Z.; Li, G.L. Influences of basic flow on unstable excitation of intraseasonal oscillation in mid-high latitudes. Sci. China 1995, 38, 1135–1145. [Google Scholar]
  29. Li, C.Y.; Long, Z.X.; Mu, M.Q. Atmospheric intraseasonal oscillation and its important effect. Chin. J. Atmos. Sci. 2003, 27, 518–535. (In Chinese) [Google Scholar]
  30. Yang, J.; Wang, B.; Bao, Q. Biweekly and 21–30-Day Variations of the Subtropical Summer Monsoon Rainfall over the Lower Reach of the Yangtze River Basin. J. Clim. 2010, 23, 1146–1159. [Google Scholar] [CrossRef]
  31. Yang, S.Y.; Wu, B.Y.; Zhang, R.H.; Zhou, S.W. Propagation of low-frequency oscillation over Eurasian mid–high latitude in winter and its association with the Eurasian teleconnection pattern. Chin. J. Atmos. Sci. 2014, 38, 121–132. (In Chinese) [Google Scholar]
  32. Yang, S.; Zhu, Q.G. Oscillation and its relation to cold air activities in Asian winter. Trans. Atmos. Sci. 1990, 13, 339–347. (In Chinese) [Google Scholar]
  33. Tang, D.S.; Wang, J.D. Three-dimension vertical circulation LFO features of eastern Asian winter monsoon. Trans. Atmos. Sci. 1994, 17, 351–355. (In Chinese) [Google Scholar]
  34. Jin, Z.H.; Sun, S.Q. The characteristics of low frequency oscillations in winter monsoon over the Eastern Asia. Chin. J. Atmos. Sci. 1996, 20, 101–111. (In Chinese) [Google Scholar]
  35. Takaya, K.; Nakamura, H. Geographical dependence of upper-level blocking formation associated with intraseasonal amplification of the Siberian high. Am. Meteorol. Soc. 2005, 62, 4441–4449. [Google Scholar] [CrossRef]
  36. Takaya, K.; Nakamura, H. Mechanisms of intraseasonal amplification of the cold Siberian high. Am. Meteorol. Soc. 2005, 62, 4423–4440. [Google Scholar] [CrossRef]
  37. Ma, X.Q.; Ding, Y.H.; Xu, H.M.; He, J.H. The relation between strong cold waves and low-frequency waves during the winter of 2004/2005. Chin. J. Atmos. Sci. 2008, 32, 380–394. (In Chinese) [Google Scholar]
  38. Liu, H.B.; Wen, M.; He, J.H.; Zhang, R.H. Characteristics of the Northeast cold vortex at intraseasonal time scale and its impact. Chin. J. Atmos. Sci. 2012, 36, 959–973. (In Chinese) [Google Scholar]
  39. Zhu, T.; Yang, J. Two types of mid-high-latitude low-frequency intraseasonal oscillations near the Ural mountains during boreal summer. J. Clim. 2021, 34, 1–56. [Google Scholar] [CrossRef]
  40. Lu, R.Y.; Oh, J.H.; Kim, B.J. A teleconnection pattern in upper-level meridional wind over the North African and Eurasian continent in summer. Dyn. Meteorol. Oceanogr. 2002, 54, 44–55. [Google Scholar] [CrossRef]
  41. Wang, L.; Xu, P.Q.; Chen, W.; Liu, Y. Interdecadal variations of the Silk Road Pattern. J. Clim. 2017, 30, 9915–9932. [Google Scholar] [CrossRef]
  42. Hong, X.W.; Lu, R.Y.; Li, S.L. Amplified summer warming in Europe–West Asia and northeast Asia after the mid-1990s. Environ. Res. Lett. 2017, 12, 094007. [Google Scholar] [CrossRef] [Green Version]
  43. Li, H.X.; Chen, H.P.; Wang, H.J.; Sun, J.Q.; Ma, J.H. Can Barents Sea Ice Decline in Spring Enhance Summer Hot Drought Events over Northeastern China? J. Clim. 2018, 31, 4725. [Google Scholar] [CrossRef]
  44. Zhang, Y.H.; Li, Y.; Li, D.S.; Shang, K.Z.; Zheng, F.K. Study on the space distribution and circulation pattern of extreme high temperature over eastern China in summer. Plateau Meteorol. 2016, 35, 469–483. (In Chinese) [Google Scholar]
  45. Yang, X.Y.; Zeng, G.; Zhang, S.Y.; Wang, W.C.; Iyakaremye, V. Cold Anomaly Over Nova Zembla–Ural Mountains: A Precursor for the Summer Long-Lived Heat Wave in Northeast Asia? Geophys. Res. Lett. 2021, 48, e2021GL095563. [Google Scholar] [CrossRef]
  46. Nitta, T.S. Convective activities in the tropical western Pacific and their impact on the Northern Hemisphere summer circulation. J. Meteorol. Soc. Jpn. 1987, 65, 373–390. [Google Scholar] [CrossRef] [Green Version]
  47. Tao, P.H.; Zhang, Y.C. Large-scale circulation features associated with the heat wave over Northeast China in summer 2018. Atmos. Ocean. Sci. Lett. 2019, 12, 254–260. [Google Scholar] [CrossRef] [Green Version]
  48. Wu, J.; Gao, X.J. A gridded daily observation dataset over China region and comparison with the other datasets. Chin. J. Geophys. 2013, 56, 1102–1111. (In Chinese) [Google Scholar]
  49. Kalnay, E.; Kanamitsu, M.; Kistler, R.; Collins, W.; Woollen, J. The NCEP/NCAR reanalysis 40-year project. Bull. Am. Meteorol. Soc. 1996, 77, 437–471. [Google Scholar] [CrossRef] [Green Version]
  50. Li, Z.H.; Li, C.Y.; Song, J.; Tan, Y.K.; Liang, X. An analysis of the characteristics and causes of extremely high temperature days in the Yangtze–Huaihe River Basins in summer 1960–2011. Clim. Environ. Res. 2015, 20, 511–522. (In Chinese) [Google Scholar]
  51. Takaya, K.; Nakamura, H. A formulation of a phase-independent wave-activity flux for stationary and migratory quasigeostrophic eddies on a zonally varying basic flow. J. Atmos. Sci. 2001, 58, 607–627. (In Chinese) [Google Scholar] [CrossRef]
  52. Zangvil, A. On the presentation and interpretation of spectra of large-scale disturbances. Mon. Weather. Rev. 1977, 105, 1469–1472. [Google Scholar] [CrossRef] [Green Version]
  53. Wei, F.Y. Progresses on climatological statistical diagnosis and prediction methods in commemoration of the 50 anniversaries of CAMS establishment. J. Appl. Meteorol. Sci. 2006, 17, 736–742. (In Chinese) [Google Scholar]
  54. Qin, Y.L.; Sun, Z.B.; Ni, D.H. Variation features of summer extreme high temperature over Northeast China and its relations with atmospheric circulation anomaly. Meteorol. Disaster Reduct. Res. 2012, 35, 7–16. (In Chinese) [Google Scholar]
  55. Hou, Y.L.; Liu, M.Y.; Zhang, H.N.; Zhao, C.Y. Climatic characteristics of spatial-temporal variations of maximum and minimum temperature in Northeast China during 1961–2015. J. Meteorol. Environ. 2018, 34, 93–99. (In Chinese) [Google Scholar]
  56. Nabizadeh, E.; Lubis, S.W.; Hassanzadeh, P. The 3D structure of Northern Hemisphere blocking events: Climatology, role of moisture, and response to climate change. J. Clim. 2021, 34, 9837–9860. [Google Scholar] [CrossRef]
  57. Wang, M.; Tan, B.K. Formation and maintenance mechanisms of the subseasonal Eastern Pacific Pattern: Energetics analysis. Earth Space Sci. 2021, 8, e2021EA001851. [Google Scholar] [CrossRef]
  58. Wu, R.G.; Yang, S.; Liu, S.; Su, L. Northeast China summer temperature and North Atlantic SST. J. Geophys. Res. 2011, 116, e2011JD015779. [Google Scholar] [CrossRef]
  59. Zhou, M.Z.; Wang, H.J.; Yang, S.; Fang, K. Influence of springtime North Atlantic Oscillation on crops yields in Northeast China. Clim. Dyn. 2013, 41, 3317–3324. [Google Scholar] [CrossRef]
  60. Ding, T.; Yuan, Y.; Gao, H.; Li, W.J. Impact of the North Atlantic sea surface temperature on the summer high temperature in northern China. Int. J. Climatol. 2019, 40, 2296–2309. [Google Scholar] [CrossRef]
  61. Zhang, G.W.; Zeng, G.; Li, C.; Yang, X.Y. Impact of PDO and AMO on interdecadal variability in extreme high temperatures in North China over the most recent forty-year period. Clim. Dyn. 2020, 54, 3003–3020. [Google Scholar] [CrossRef]
  62. Li, J.W.; Zeng, G.; Yang, X.Y.; Zhang, G.W. Classification of summer extreme high temperature events in Northeast China and their relationships with sea surface temperature anomalies in North Atlantic. Trans. Atmos. Sci. 2021, 44, 302–313. (In Chinese) [Google Scholar]
  63. Fang, R.; Yang, X.Q. Summer maximum air temperature variability in China and its association with the Artic sea ice concentration. Meteorol. Mon. 2009, 35, 81–86. (In Chinese) [Google Scholar]
  64. Song, Y.M.; Zou, Y.C.; Wang, Z.F. Assessment of the summer extreme temperature predicting abilities in China for the previous soil moisture and sea surface temperature. Trans. Atmos. Sci. 2019, 42, 790–800. (In Chinese) [Google Scholar]
  65. Charney, J.G.; DeVore, J.G. Multiple flow equilibria in the atmosphere and blocking. J. Atmos. Sci. 1979, 36, 1205–1216. [Google Scholar] [CrossRef] [Green Version]
  66. Ghil, M.; Kondrashov, D.; Lott, F.; Robertson, A.W. Intraseasonal oscillations in the mid-latitudes: Observations, theory, and GCM results. In Proceedings of the ECMWF/CLIVAR Workshop on Simulation and Prediction of Intra-Seasonal Variability with emphasis on the MJO, ECMWF, Reading, UK, 3–6 November 2003; pp. 35–53. [Google Scholar]
  67. Orlanski, I.; Sheldon, J.P. Stages in the energetics of baroclinic systems. Tellus 1995, 47A, 605–628. [Google Scholar] [CrossRef]
  68. Matsueda, S.; Takaya, Y. The global influence of the Madden-Julian Oscillation on extreme temperature events. J. Clim. 2015, 28, 4141–4151. [Google Scholar] [CrossRef]
  69. Wang, F.; Tian, W.; Xie, F.; Zhang, J.; Han, Y. Effect of Madden–Julian oscillation occurrence frequency on the interannual variability of Northern Hemisphere stratospheric wave activity in winter. J. Clim. 2018, 31, 5031–5049. [Google Scholar] [CrossRef]
  70. Chen, W.; Lu, R.Y.; Chen, W.; Lu, R. The interannual variation in monthly temperature over Northeast China during summer. Adv. Atmos. Sci. 2014, 31, 515–524. [Google Scholar] [CrossRef]
  71. Chen, R.D.; Lu, R.Y. Comparisons of the Circulation Anomalies Associated with Extreme Heat in Different Regions of Eastern China. J. Clim. 2015, 28, 150417113249008. [Google Scholar] [CrossRef]
  72. Ren, L.W.; Zhou, T.J.; Zhang, W.X. Attribution of the record-breaking heat event over Northeast Asia in summer 2018: The role of circulation. Environ. Res. Lett. 2020, 15, 054018. [Google Scholar] [CrossRef]
  73. Li, N.; Xiao, Z.N.; Zhao, L. Analysis on the mechanism of the 2018 summer extreme high temperature event in Northeast China. Clim. Environ. Res. 2020, 25, 469–482. (In Chinese) [Google Scholar]
Figure 1. The first EOF mode of the 10–90 d oscillation component of daily Tmax subtracting thresholds from 1 May to 30 September during 1981–2019 (a) and its corresponding time coefficient PC1 (b), power spectrums of PC1 (c), and daily Tmax in northeast China after removing its seasonal cycle and synoptic signal (d).
Atmosphere 13 00387 g001
Figure 2. EHTs (a) and LFEHTs (b) in summer from 1981 to 2019 in northeast China and their frequencies (c). R in (c) is the correlation coefficient.
Atmosphere 13 00387 g002
Figure 3. Extreme-high-temperature days (EHTD) (a), low-frequency extreme-high-temperature days (LFEHTD) (b), and daily low-frequency (10–30 d oscillation component) Tmax anomaly amplified 2 times during June to August in 2018 in Northeast China. Black and blue stars denote EHTs and LFEHTs, respectively.
Atmosphere 13 00387 g003
Figure 4. Composited geopotential height (GPH) and horizontal winds anomalies (a) and their low-frequency component (10–30 d oscillation) (b) at 200 hPa of the summer LFEHTs in northeast China from 1981 to 2019. Dotted areas are significant at a 95% confidence level.
Atmosphere 13 00387 g004
Figure 5. Composited vertical-zonal geopotential height (GPH) (a) and its low-frequency (10–30 d oscillation) (b) anomalies averaged over 35°–65° N for the onset of LFEHTs in northeast China. (c) (Cor.((a) and (b)) is the distribution of their spatial correlation coefficient at every level. Dotted areas are significant at a 95% confidence level.
Atmosphere 13 00387 g005
Figure 6. Composite low-frequency stream function (shadings; unit: 106 m2/s) and wave activity flux (vector; units: m2/s2) anomalies at 200 hPa for Day −15 to Day +10 relative to LFEHT occurrences (af).
Atmosphere 13 00387 g006
Figure 7. Evolution of 200 hPa low-frequency GPH anomaly field averaged along 35°–65° N for LFEHTs in northeast China during summer (units: gpm). Dotted areas are significant at a 95% confidence level.
Atmosphere 13 00387 g007
Figure 8. Composited 200 hPa low-frequency GPH anomalies of LFEHTs from 5 to 10 days before their occurrences (the dotted areas are significant at a 95% confidence level).
Atmosphere 13 00387 g008
Figure 9. The daily lag composites of LFWI and low-frequency regional average daily Tmax anomaly (a), the leading correlation coefficient between LFWI and the low-frequency Tmax anomaly in northeast China relative to the occurrences of the LFEHTs (b) (dotted lines are significant at a 95% confidence level), and the low-frequency Tmax variability variance explained by the LFWI 7 days ahead (%) (c).
Atmosphere 13 00387 g009
Publisher’s Note: MDPI stays neutral with regard to jurisdictional claims in published maps and institutional affiliations.

