Article

Evaluation and Application of Reanalyzed Combined Data under Extreme Climate Conditions: A Case Study of a Typical Flood Event in the Jinsha River

1
School of Architecture and Civil Engineering, Xihua University, Chengdu 610039, China
2
Sichuan Branch of Henan Water Conservancy Survey, Design and Research Co., Ltd., Chengdu 610031, China
3
State Key Laboratory of Simulation and Regulation of Water Cycle in River Basin, China Institute of Water Resources and Hydropower Research, Beijing 100038, China
*
Author to whom correspondence should be addressed.
Atmosphere 2022, 13(2), 263; https://doi.org/10.3390/atmos13020263
Submission received: 23 November 2021 / Revised: 17 January 2022 / Accepted: 2 February 2022 / Published: 4 February 2022

Abstract

:
From 15 to 20 September 2016, precipitation extremes occurred in the middle and lower reaches of the Jinsha River, causing immense direct economic losses due to floods. The current research on extreme climate characteristics and the relationship between climate extremes and runoff extremes are based on a single data source. This is due to the uneven distribution of precipitation and temperature stations, which make it difficult to fully capture extreme climate events. In this paper, various internationally popular reanalysis datasets were introduced. Extreme climate indexes were computed using the merged datasets versus the meteorological station observations. The results showed that: (1) Comparative analysis of the extreme climate indexes of the reanalysis dataset and the data of traditional meteorological observation stations showed that most of the extreme precipitation indexes calculated by the various reanalysis of combined data exhibited good performances. Among the reanalyzed combined products, CMPA-H, CMADS, and GPM (IMERG) exhibited good performance while the performance of TRMM (TMPA) was slightly worse. The extreme temperature indexes, TXx and TNn, calculated based on the reanalysis of combined data showed a better consistency than the indexes calculated based on the observational data of meteorological stations. The CMADS temperature dataset exhibited a higher consistency with the data obtained from meteorological stations as well as the best accuracy (84% of the stations with the error value of TXx calculated from the CMADS dataset and observed data less than 3 °C). (2) The response of typical flood events to precipitation extremes were analyzed and evaluated; the spatial distribution of the precipitation in the combined dataset was used to quantitatively analyze the response of occurrence of typical flood events to precipitation extremes, and the typical flood events were found to be mainly caused by certain factors, such as lagging flood propagation in the upstream of the basin outlet. This study indicates that it is feasible to use the reanalyzed combined data products to calculate the extreme climate indexes of the Jinsha River Basin, especially in the upper reaches of the Yangtze River where there is a lack of meteorological observation stations.

1. Introduction

A rainfall event lasting from 15 to 20 September 2016, occurred in the west portion of the upper reaches of the Yangtze River. The event consisted of moderate-to-heavy rain while local torrential rain occurred in the middle and lower reaches of the Jinsha River. As of 22 September, the rain had caused disasters in two provinces (Sichuan and Yunnan) and 26 counties (cities and districts). A total of 160,800 people were affected by the disasters. The direct economic loss caused by the floods was 789 million yuan, of which the direct economic loss from agriculture was 336 million yuan [1]. Due to its severity, this disaster was released by researchers of the Yangtze River Water Resources Commission in the study of typical events of flood disasters in the Yangtze River Basin in 2016, which aroused attention. Referring to the percentile threshold method [2], the 90th percentile flow in the study basin as the reference threshold for typical flood events in the past decade is 10,600 m3/s (the daily average discharge at the outlet of the basin during the rainy season in the last decade is composed of discontinuous runoff data series, which are arranged from large to small, and the 90th percentile value is selected as the reference threshold of typical flood events). The maximum daily average flow rate recorded in 2016 at the basin outlet was on 22 September 2016 with a value of 127,000 m3/s. The average daily traffic is greater than the reference threshold. Therefore, the paper studies this flood event as a “typical flood event”, the analysis of the weather system, precipitation extremes, and temperature conditions associated with this flood disaster provides an important reference for trying to make full use of the Jinsha River water resources.
Many studies have been conducted on the identification, evaluation, impact, trends, and prediction of extreme climate events, and numerous research results have been obtained. In China, Cai [3] used the data from 756 national meteorological stations to analyze and study extreme precipitation and temperature events across the country and explored the patterns of their spatial characteristics and distribution. Using daily precipitation and temperature data from the Tanggu meteorological station recorded from 1951 to 2013, Wang et al. [4] analyzed and explored trends in the changes of temperature and precipitation extremes in Tianjin by identifying characteristic temperature and precipitation values. The research showed that the main impacts of climate change on Tianjin were the increase in temperature and the decrease in snowfall. Within the Yangtze River basin, Wang [5] used precipitation and temperature data of meteorological stations in the Yangtze River Basin from 1960 to 2011 to calculate the annual trend rate distribution of extreme precipitation and extreme temperature of meteorological stations in the Yangtze River Basin, and calculated the inter-annual variation trend of extreme precipitation and extreme temperature index. Shi et al. [6] analyzed the spatial distribution of extreme precipitation and extreme temperature in the whole Yangtze River Basin by using data from ground stations from 1970 to 2014, and studied the variation characteristics of 14 extreme precipitation indexes and extreme temperature indexes in the whole Yangtze River Basin. Zhang et al. [7] selected years of observation data from five meteorological stations to analyze the extreme maximum temperature in the dry-hot valley of Jinshajiang River and conducted a comparative analysis with the dry-hot valley of the upper reaches of the Minjiang River, providing a scientific basis for the comparative analysis of the climatic characteristics of the dry-hot valley. Tao et al. [8] used daily precipitation data from 1960 to 2019 to analyze the spatial distribution and temporal variation characteristics of extreme precipitation at Baihetan Hydropower Station in the lower Reaches of the Jinsha River, examined the trend of extreme precipitation in the Ningnan and Qiaojia counties, and analyzed the characteristics of various climatic factors in the rainstorm process. Zhang et al. [9] divided the whole basin into 15 sub-regions based on meteorological station data and surface rainfall transformed by Tyson polygon in the Yangtze River Basin and studied the extreme rainfall time and temporal variation characteristics of surface rainfall in each sub-region. Guo et al. [10] used the daily precipitation data from June to August in summer of the Yangtze River Basin from 1960 to 2017. They divided the whole Yangtze River Basin into nine sub-basins and analyzed the spatial distribution of summer extreme precipitation and characteristics of summer precipitation changes over time in each sub-basin. Taking other regions at home and abroad and the Yangtze River Basin as the research object, many researchers have used data from weather stations or converted point precipitation into surface precipitation in recent decades. Extreme precipitation and temperature have been studied extensively [11,12,13,14,15,16,17].
Some researchers have also proven that flood risk is closely related to the precipitation extremes that cause runoff [18,19]. Cheng et al. [20] studied the response of extreme hydrological events in the Shule River Basin to extreme climate using daily temperature, precipitation, and evaporation data from ground-based meteorological stations, and the results showed that extreme precipitation events were the dominant factor in causing extreme flood events. Ma et al. [21] studied the relationship between the characteristics of extreme flow variations and climate characteristics based on long-term observational data in four typical watersheds in the central Tianshan Mountains, and the results showed that the accelerated melting of glaciers caused by rising temperatures was the main factor leading to the increase in the magnitude and frequency of extreme floods in the northern slopes of the Tianshan Mountains; meanwhile, intensified and frequent precipitation extremes were the main driving factor leading to flood events in the watersheds of the southern slopes.
A large number of researchers have conducted relevant studies on the characteristics of climate extremes, and the relationship between climate extremes and runoff are typically based on a single data source (such as data from meteorological stations). Ground-based meteorological station data can effectively reflect the actual ground precipitation information at a certain point but, due to the uneven spatial distribution of the stations, it is difficult to obtain an accurate temporal and spatial distribution of the precipitation.
Therefore, ground-based station data can achieve good results in studying extreme weather in a local area with high-density station data, but its accuracy is poor in a basin with a large coverage area and sparsely distributed stations. In addition, due to the uneven distribution of precipitation and temperature stations, it is difficult to fully detect extreme climate events, and it is also difficult to determine the factors affecting runoff changes. Therefore, if the extreme climate characteristic indexes are calculated based on combined data and the combined data are used to analyze their relationship with runoff, the extreme climate characteristic indexes and the response of runoff to precipitation extremes can be comprehensively and accurately revealed.
Located at the source of the Yangtze River, the Jinsha River is the river with the largest runoff and sediment load in the upper reaches of the Yangtze River [22], and it is the largest hydropower base in China [23]. Basin research has important strategic significance for future hydropower development and eco-environmental protection [24,25,26,27]. The Jinsha River Basin has a large area and complex underlying conditions and is a relatively sensitive area to climate change [28], and the distribution of meteorological stations within the basin is relatively sparse. In this paper, multiple types of internationally popular re-analysis fusion data were used to study the extreme climates of the Jinsha River Basin in the upper reaches of the Yangtze River. The precipitation products (CMPA-H, CMADS, GPM (IMERG), and TRMM (TMPA)) and temperature products (CMADS, and a 0.5°-resolution gridded temperature dataset) of various re-analyzed fusion datasets were compared to investigate the applicability of the products in the study of extreme climates in the basin, and to evaluate the spatial performance of the combined datasets for identifying precipitation extremes when the flood disaster of 2016 occurred in the upper reaches of the Yangtze River.
The objectives of this study were as follows: (1) Use the observed precipitation and temperature data of 31 ground-based meteorological stations in the Jinsha River Basin as reference true values to evaluate the accuracy of CMADS, GPM (IMERG), TRMM (TMPA), and 0.5° × 0.5° grid temperature dataset products in calculating extreme climate indexes in a large-scale and complex basin, and to evaluate the performance of each precipitation and temperature combined dataset. (2) Analyze the response of typical flood events to precipitation and temperature extremes within the large Jinsha River Basin where research stations are sparsely distributed, based on different reanalyzed combined precipitation datasets. This paper is organized into the following sections: Section 2 introduces the research basin and the data used in this paper; Section 3 presents the accuracy analysis and evaluation of the reanalysis precipitation combined datasets on the extreme climate indexes; Section 4 presents the accuracy analysis and evaluation of the reanalysis temperature combined datasets on the extreme climate indexes; Section 5 presents the analysis of typical flood events based on the reanalysis of combined datasets; and Section 6 provides a discussion and summary.

2. Study Area and Data
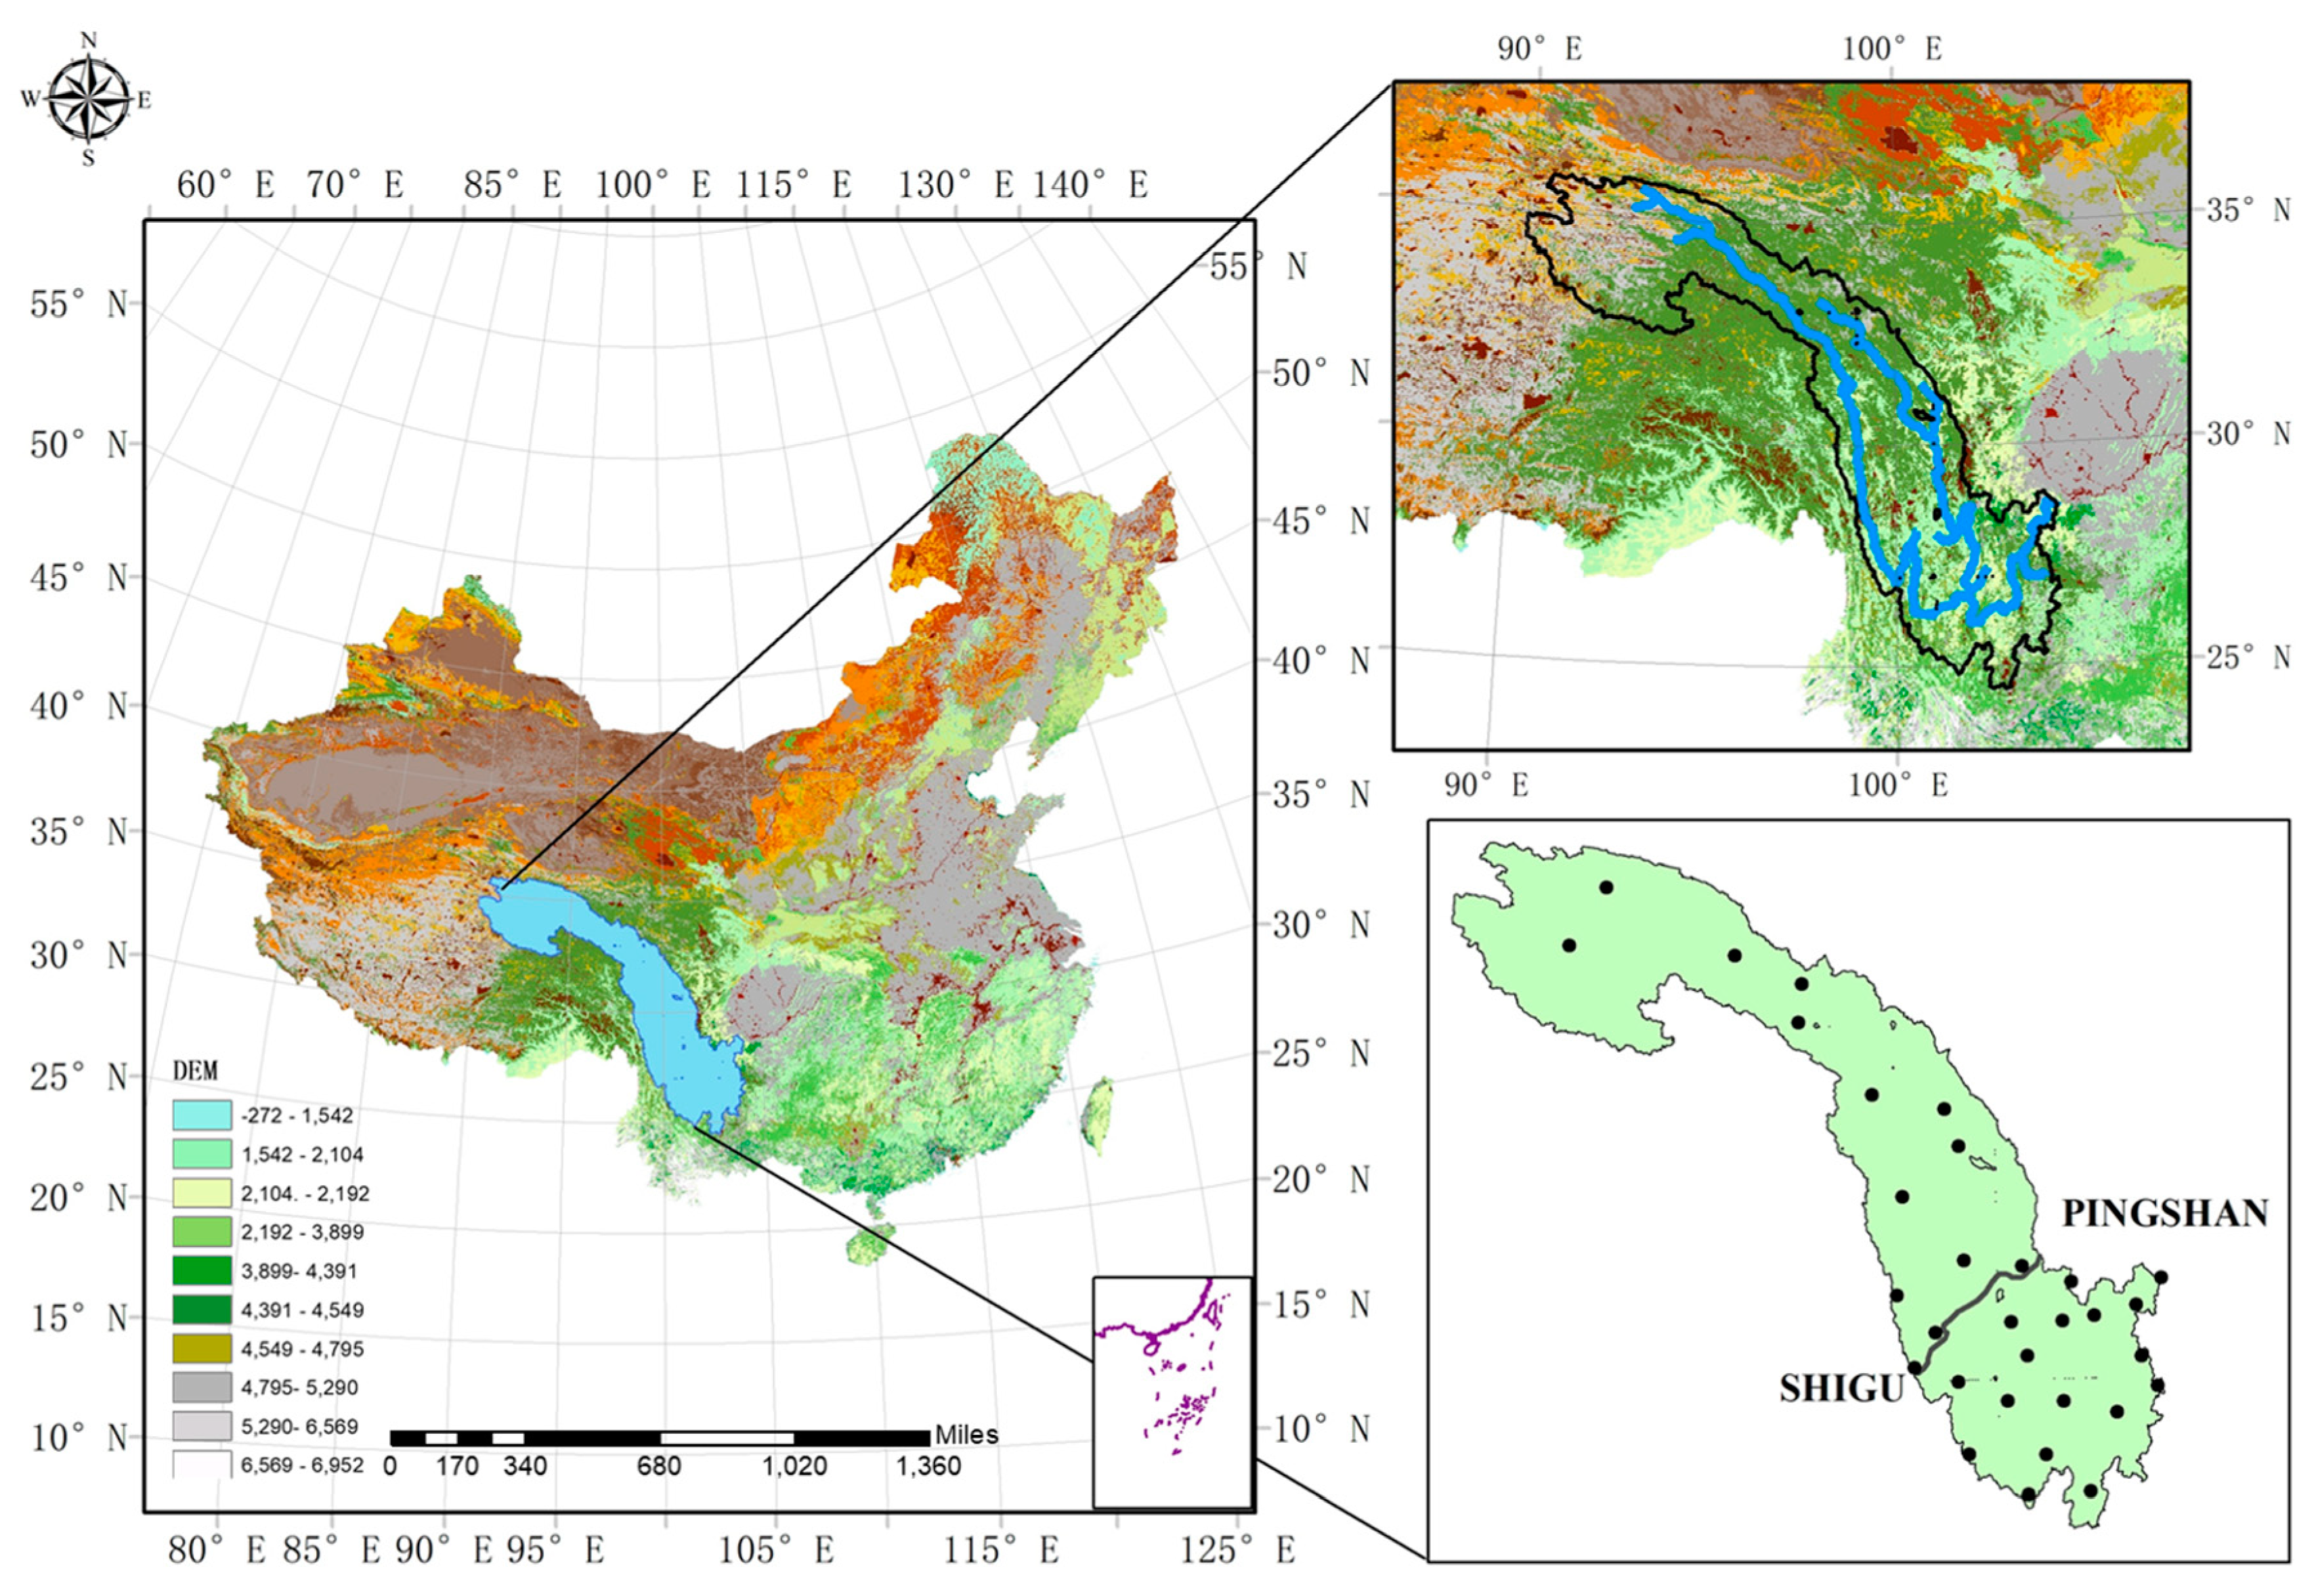
2.1. Study Area

The Jinsha River Basin is located in the upper reaches of the Yangtze River. The Jinsha River originates from the Qinghai-Tibet Plateau and is one of the largest rivers in southwest China. It is distributed between 90–105° E and 24–36° N, the total length is 2316 km, and the drainage area is 340,000 km2. Starting from Yushu County in Qinghai Province, the Jinsha River flows through five major topographic and geomorphological units: the Qinghai-Tibet Plateau, the Western Sichuan Plateau, the Hengduan Mountains, the Yunnan-Guizhou Plateau, and the mountain area of Southwestern Sichuan, and it belongs to Qinghai, Tibet, Yunnan, and Sichuan. Plateaus, canyons, basins, and hills are crisscrossed. The basin is covered with plateau alpine meadows, mountain temperate arid valley shrubs, mountain subtropical semi-arid shrubs, subtropical arid shrubs, and subtropical semi-humid evergreen broad-leaved forest plant communities. The climate distribution within the Jinsha River Basin has regional characteristics. The upper and middle reaches belong to the southwest monsoon climate zone; the dry and wet seasons are distinct, the rainy season is from May to October, and the dry season is from November to April of the following year. The vertical difference in climate is obvious. The lower reaches belong to the mid-subtropical zone and the southeast monsoon climate zone; the rainfall is seasonal and intense, and the dry and hot valleys in the lower reaches of the basin have long summers and no winters [29,30,31,32,33]. The ranges of the study area and main water systems are shown in Figure 1.

2.2. Study Area Data and Extreme Precipitation Indexes

2.2.1. Observational Data from Ground-Based Meteorological Stations

The Jinsha River Basin was the focus of this research study. A total of 31 national-level ground-based meteorological observation reference stations and basic stations are located within the basin. Available observation data from these stations include daily average precipitation and temperature data spanning the period from 1960 to the present day.
The portion of the Jinsha River Basin occurring above Shigu station (hereinafter referred to as the upstream basin) includes 15 ground-based meteorological observation stations from the Wudaoliang and Tuotuohe stations in Qinghai Province to the Yuexi station in Yunnan Province. The portion of the basin below Shigu station (hereinafter referred to as the downstream basin) includes 16 ground-based meteorological observation stations from the Muli station to the Kunming station.

2.2.2. Hourly Precipitation Grid Dataset Resulting from the Combination of Automatic Weather Station Data from China and the Climate Prediction Center (CPC) Morphing Technique (CMPA-H)

The CMORPH satellite retrieval precipitation product is a global precipitation product developed by the Climate Prediction Center of the National Oceanic and Atmospheric Administration of the United States. It has many advantages, such as good real-time performance, wide coverage, and complete time series [34,35]. The probability density matching method [36] was used to correct the error of the CMORPH satellite retrieval precipitation product. The Climatic Data Office of the National Meteorological Information Center released a 0.1° hourly precipitation grid dataset from the combination of automatic weather stations in China and CMORPH—China Ground and CMORPH combined hourly precipitation product (CMPA-Hourly) [37,38]. The spatial coverage of the product is 70–104° E and 15–60° N, with a spatial resolution of 0.1° and a time resolution of 1 h. The available data time range is from 1 January 2008 to the present day.

2.2.3. CMADS Dataset

The CMADS series datasets are public datasets developed by Professor Xianyong MENG that introduce the Local Analysis and Prediction System/Space-Time Multiscale Analysis System (LAPS/STMAS) assimilation algorithm, which-after strict quality control is established via various technical means, such as data-nested-loop calculation. The spatial coverage of the dataset is 0–65°N and 60–160°E, the spatial resolutions are 0.33°, 0.25°, 0.125°, and 0.0625°, and the time resolution is daily. The dataset includes the CMADSV1.0, CMADSV1.1, CMADSV1.2, and CMADS-L series containing precipitation, temperature, air pressure, specific humidity, wind speed and other data, and has two data formats—.dbf and .txt—making it convenient for researchers in various fields to analyze and access the data [39,40,41,42].
In this study, CMADSV1.1 data were used as the main analysis data and were downloaded from http://www.cmads.org (accessed on 1 December 2018). The data have a resolution of 0.25° and a time span from 2008–2016.

2.2.4. TMPA and IMERG Satellite Precipitation Products

In the TMPA algorithm, the calibrated microwave retrieval data are first combined with infrared data and then combined with ground rain gauge observation data to obtain the TMPA precipitation data product, which is based on TRMM satellites with a spatial coverage of 50° N–50° S around the world [43]. The TRMM satellite crashed into the atmosphere over the South Indian Ocean in June 2015, and the TMPA precipitation products were continuously updated until 2019 [44]. IMERG combines the GPM Microwave Imager (GMI), multi-satellite radiometer, and microwave-calibrated infrared (IR) in order to obtain more accurate spatial scale precipitation estimates, and its coverage extends to the north and south poles. The IMERG series precipitation products have been continuously released since March 2014 [45].
In this paper, the post-real-time precipitation product 3B42-V7 of TMPA (spatial resolution of 0.25° and time resolution of 3 h (hereinafter referred to as the TRMM (TMPA) product) and the non-real-time post-processing satellite precipitation product corrected by ground-based stations, i.e., the IMERG-F product (spatial resolution of 0.1° and time resolution of half an hour) (hereinafter referred to as the GPM (IMERG) product), were used as the satellite precipitation research data for the Jinsha River Basin.

2.2.5. A 0.5° × 0.5° Grid Dataset of Daily Surface Temperature in China

The grid temperature dataset used in this paper was a 0.5° grid point dataset of daily surface temperature in China (hereinafter referred to as the 0.5° grid temperature dataset). This grid dataset has a time span from 1 January 1961 to the present day, with a spatial coverage of 72–136° E and 18–54° N. The dataset was subjected to cross-validation and error analysis, and the data quality was determined to be good [46].

2.2.6. Runoff Data

The Pingshan hydrological station at the outlet of the Jinsha River Basin in the upper reaches of the Yangtze River is located in Gaoshiti, Jinping Township, Pingshan County (28 km upstream from the Xiangjiaba hydropower plant dam). The river section at Pingshan station that was tested is straight, with bends occurring 500 m upstream and 2000 m downstream of the flow measurement cross-section, with no major tributaries flowing into it upstream or downstream. The station was established in August 1937. Affected by the water storage and power generation of the Xiangjiaba hydropower plant, the Pingshan hydrological station was converted to a water level monitoring station on 20 June 2012, and the hydrological station was replaced by the Xiangjiaba hydrological station. The Xiangjiaba hydrological station is located at Lianhuachi campsite, Anbian Town, Yibin County, Sichuan Province. The test section of the river is located approximately 2 km downstream of the Xiangjiaba hydropower plant dam (approximately 30 km downstream of Pingshan station). This station was constructed in June 2008. The Bureau of Hydrology, Changjiang Water Resource Commission, is responsible for its operation and management. The maximum recorded daily average flow rate at the Xiangjiaba hydrological station in 2016 was observed on 22 September with a value of 127,000 m3/s.

2.2.7. Extreme Precipitation Indexes

This paper employs the commonly used indicators recommended by the Climate Committee of the World Meteorological Organization. These commonly used indicators are shown in Table 1 and Table 2.

3. Accuracy Analysis and Evaluation of Reanalyzed Combined Datasets in Calculating Extreme Precipitation Indexes

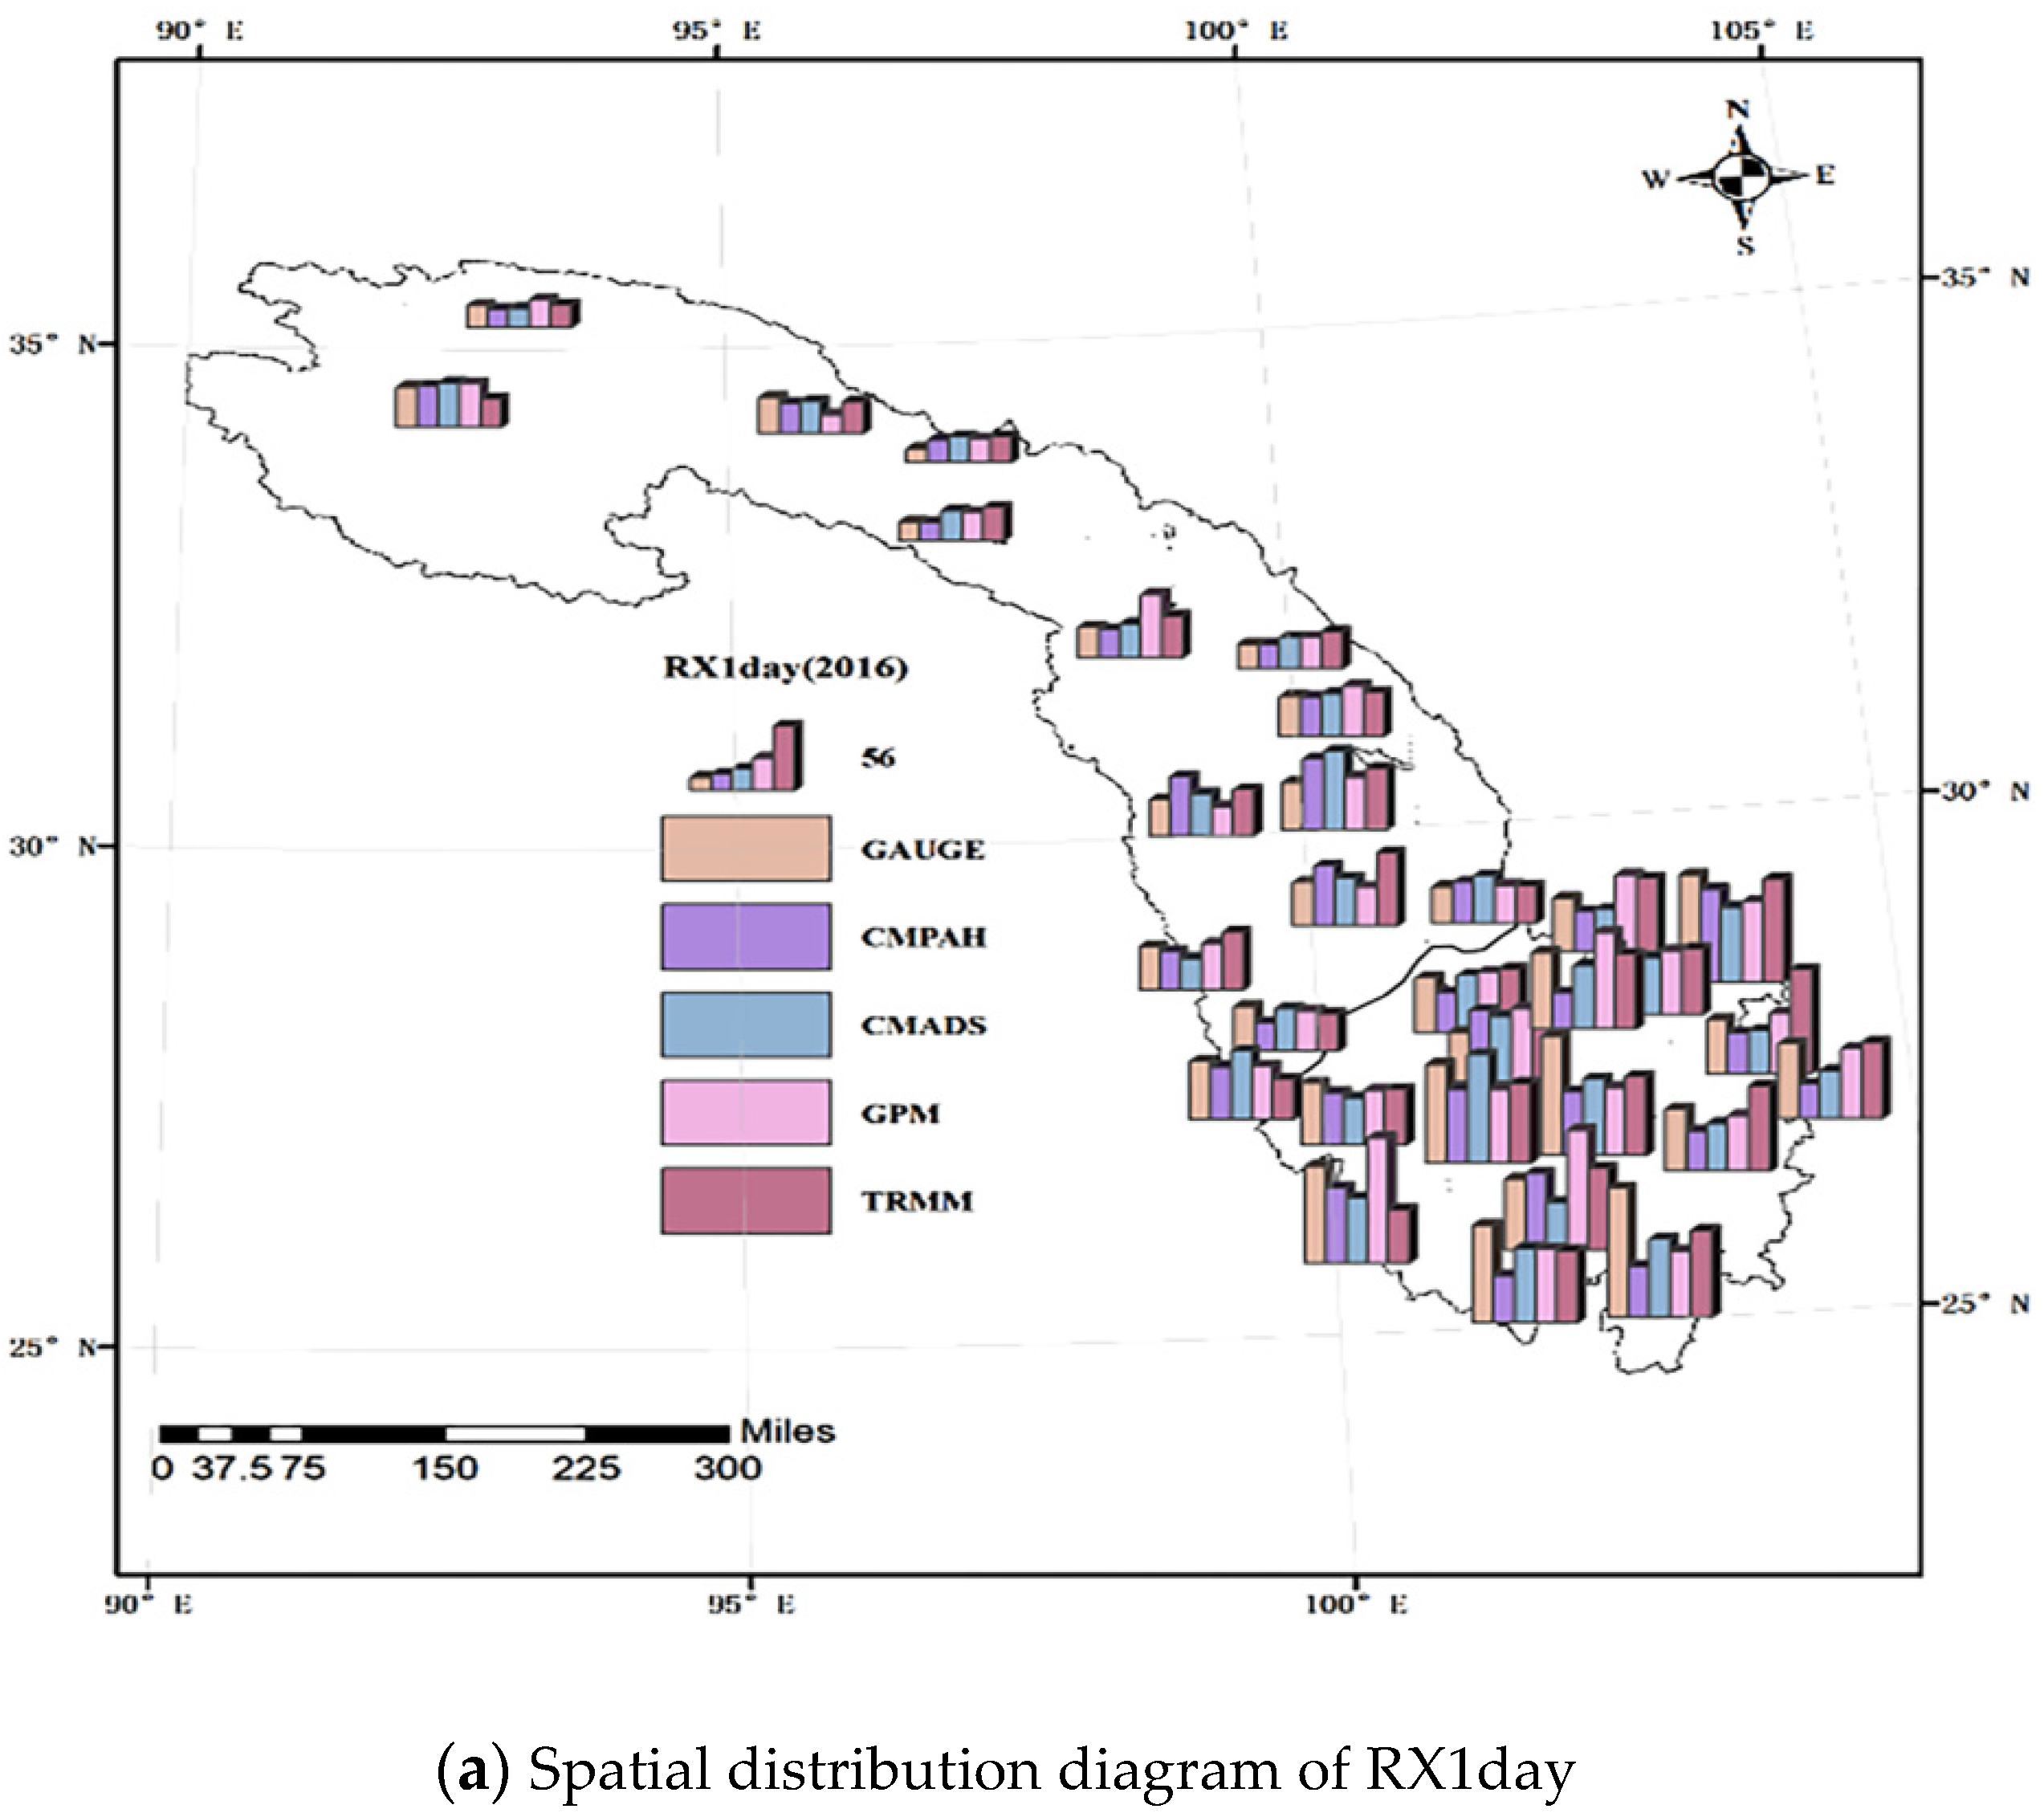
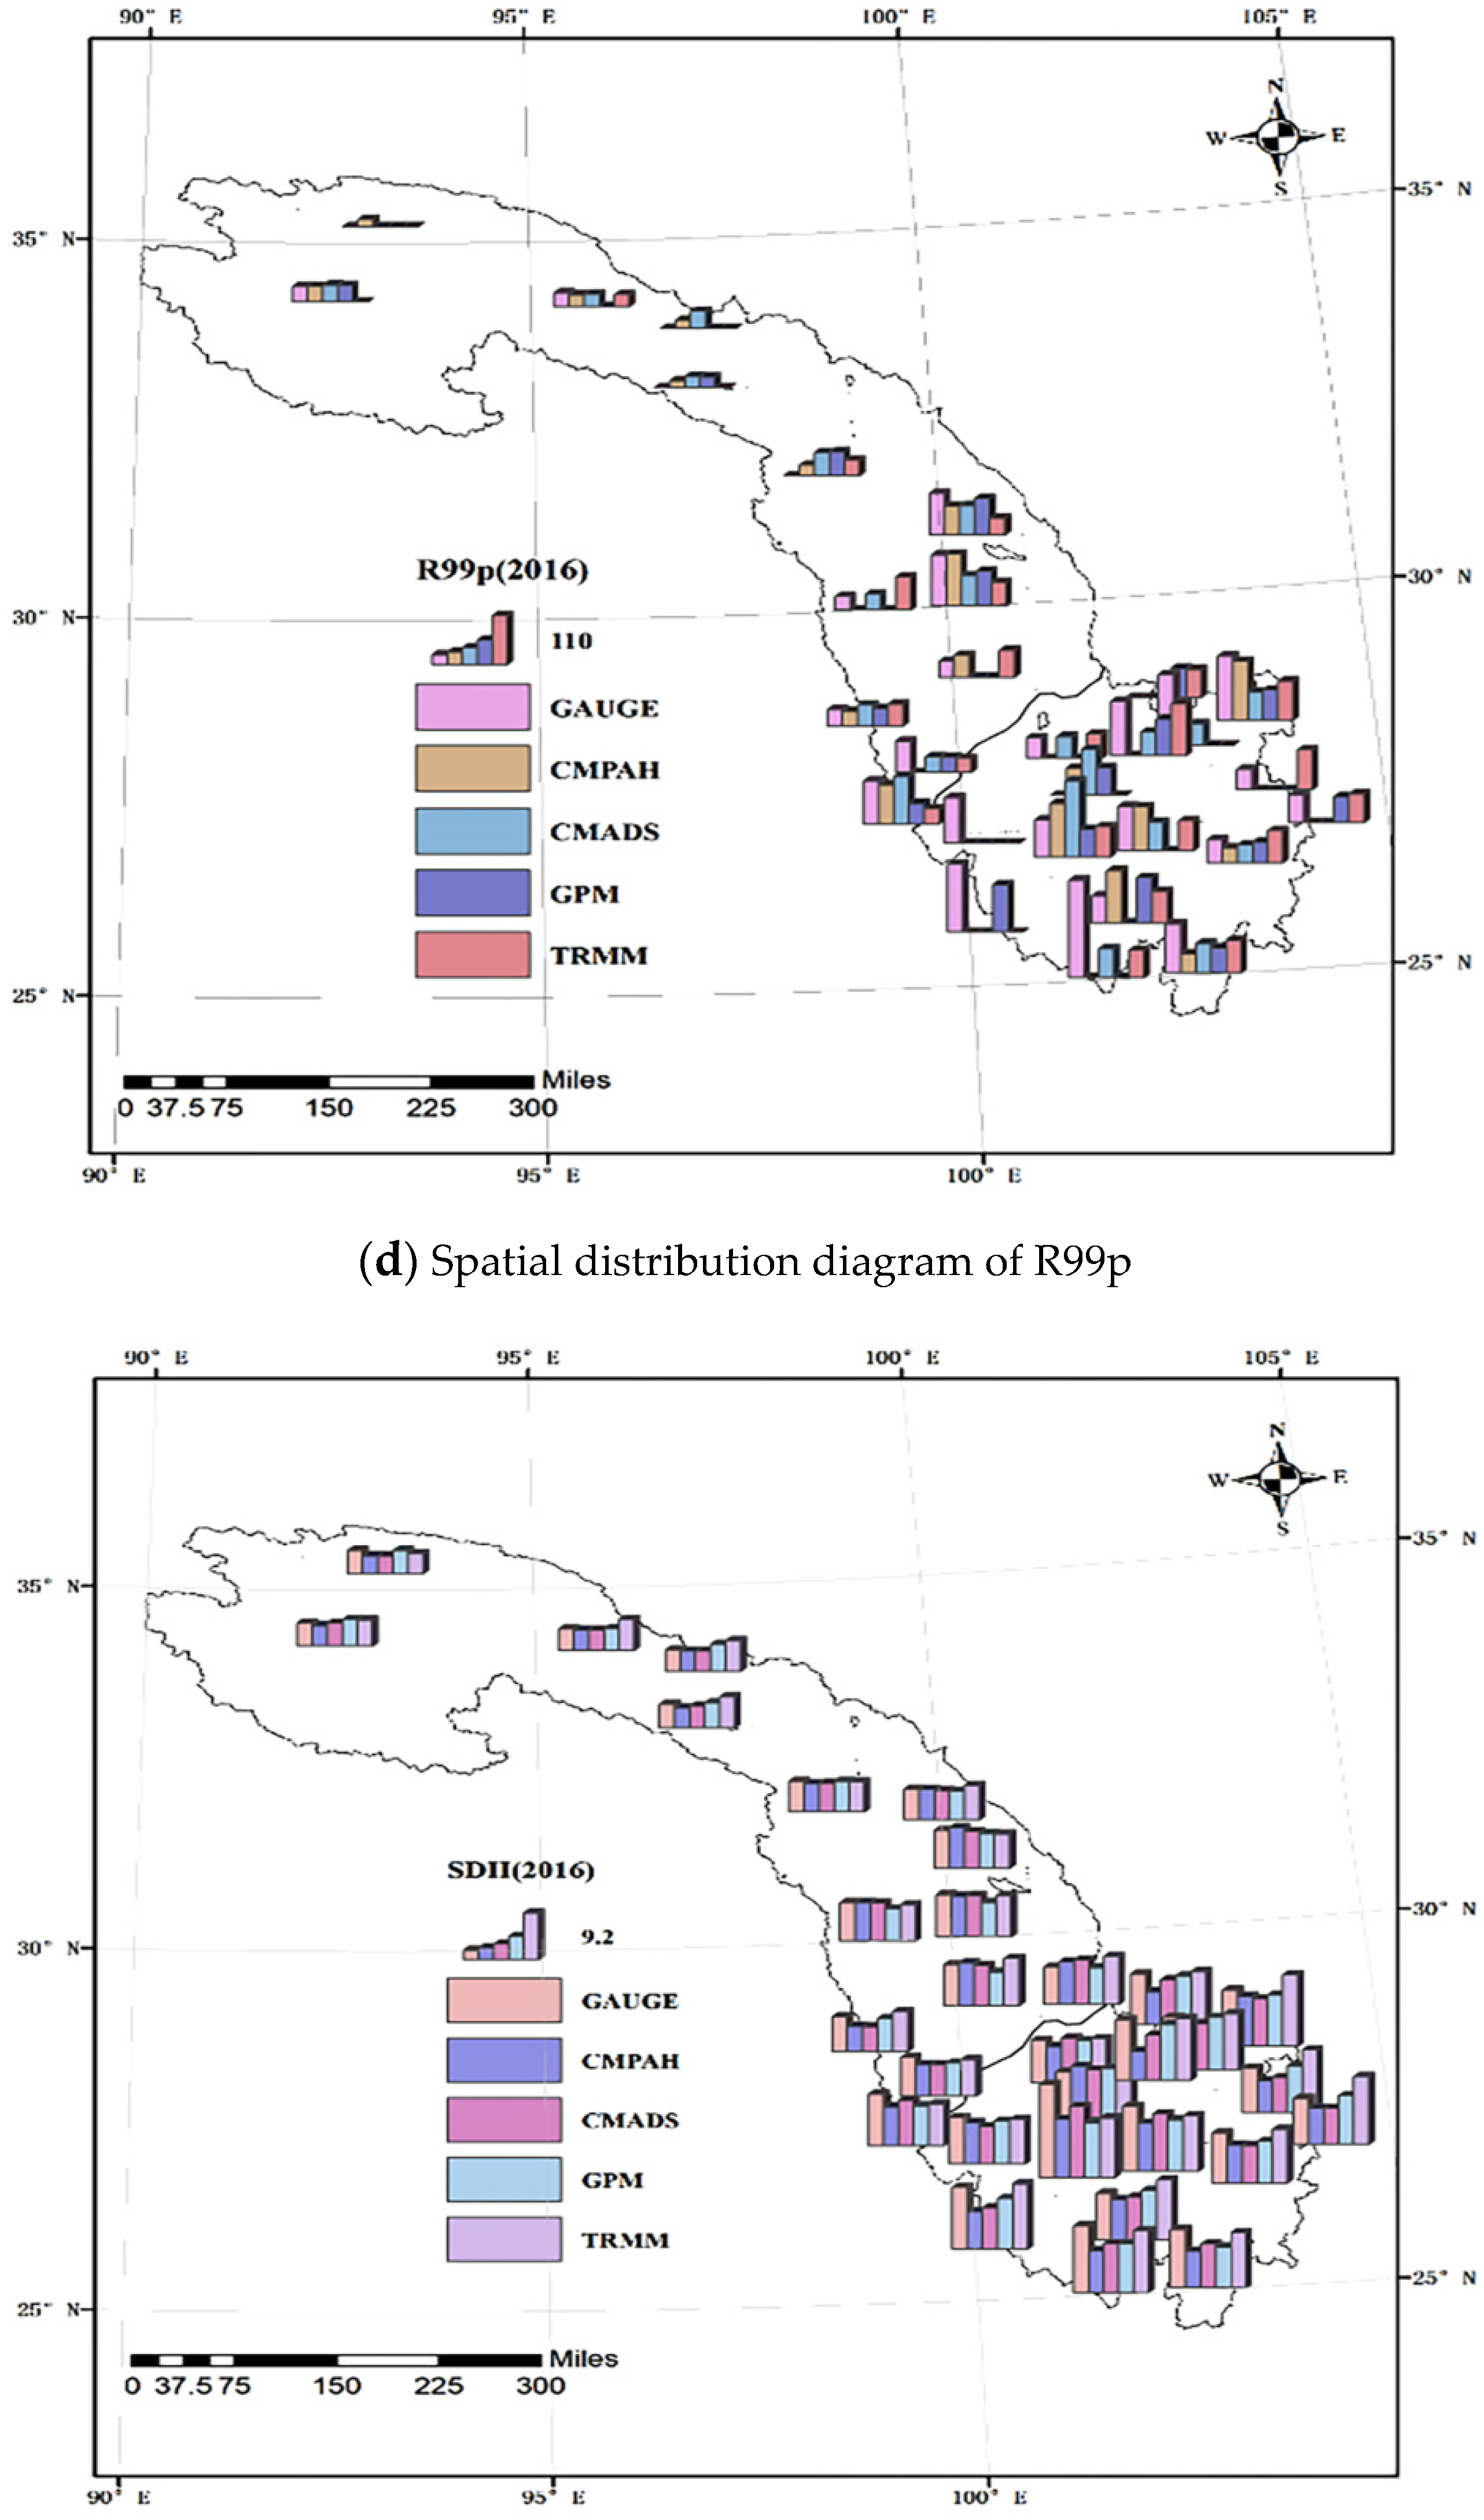
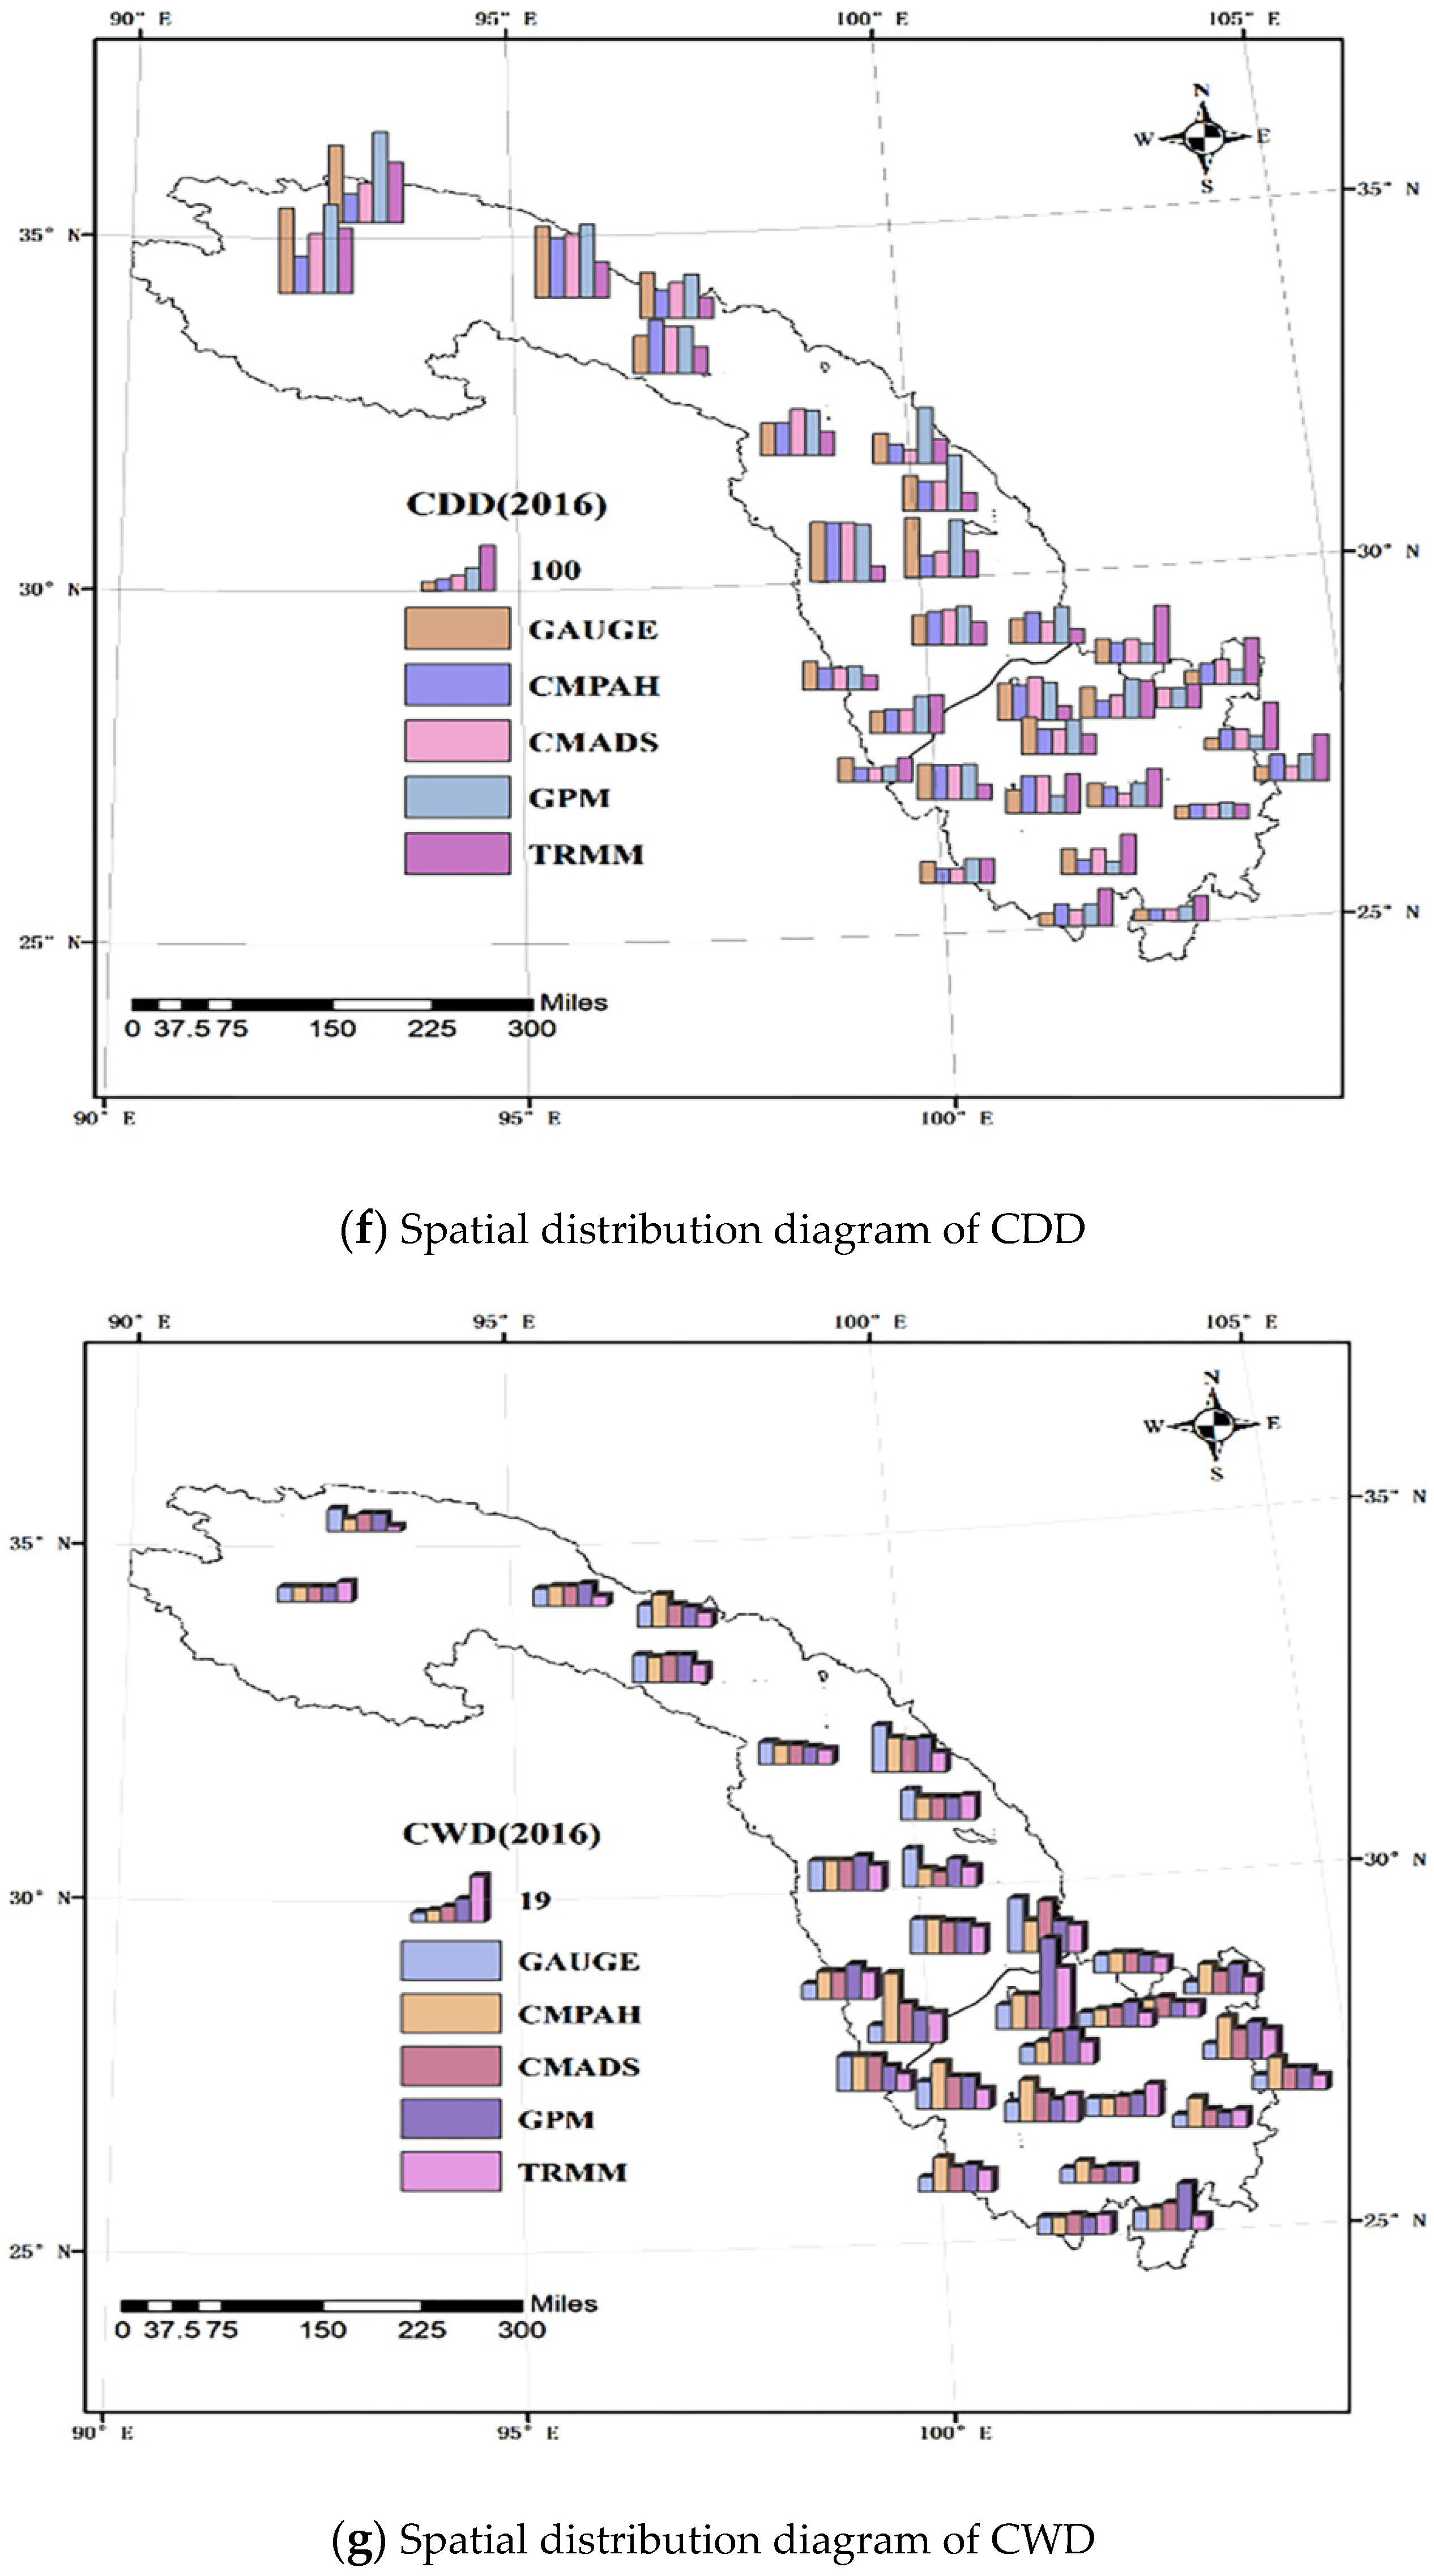
3.1. Comparative Analysis of the Spatial Distribution of Extreme Precipitation Indexes

The spatial distribution of extreme precipitation indexes calculated based on observational and combined data are shown in Figure 2. The distribution map includes 31 ground weather stations with five side-by-side histograms shown at each weather station, representing the calculated extreme weather indexes based on the observation data obtained from the ground-based meteorological stations and the combined data CMPA-H, CMADS, GPM (IMERG), and TRMM (TMPA).
It can be seen from Figure 2 that there are differences between the RX1day (one-day maximum precipitation) values calculated based on each of the four combined datasets and the value calculated based on the observation data from the 31 stations. Using Xinlong station in 2016 as an example, the RX1day value calculated based on the observation data was 34.7 mm, and the RX1day values calculated based on the combined data CMPA-H, CMADS, GPM (IMERG), and TRMM (TMPA) were 34.4, 37.1, 44.0, and 38.6 mm, respectively.
The RX5day (five-day maximum precipitation) values calculated based on the two types of data (observational and combined data) also showed differences at some stations. Using Zhaojue station in 2016 as an example, the RX5day values calculated based on the observation data was 104.1 mm, and the RX5day values calculated based on the combined data CMPA-H, CMADS, GPM (IMERG), and TRMM (TMPA) were 106.5, 107.4, 109.3, and 112.8 mm, respectively. The heavy rainfall (R95p) and extreme rainfall (R99p) values calculated based on the two types of data exhibited similar performance to the two indexes described above. Using Batang station in 2016 as an example, the R95p value calculated based on the observation data was 165.9 mm, and the R95p values calculated based on the combined data CMPA-H, CMADS, GPM (IMERG), and TRMM (TMPA) were 130.6, 164, 94.4, and 198.8 mm, respectively. From the spatial distribution map, it is evident that the performance of the extreme precipitation (R99p) index was poor.
As shown from the spatial distribution of precipitation intensity (Simple Daily Intensity Index (SDII) (2016), the column height of the 31 stations was the same. For this index, the difference between SDII values calculated based on grid combined data and SDII values calculated based on observation data was very small.
As shown from the spatial distribution of the consecutive dry day (CDD) and the consecutive wet day (CWD), there was a difference between the values of each index calculated based on the combined data compared to those calculated based on the observation data. Using the CWD at Weixi station in 2016 as an example, the CWD value calculated based on the observation data was 14 days, and the CWD values calculated based on the combined data CMPA-H, CMADS, GPM, and TRMM were 14, 14, 10, and 7 days, respectively.
A comprehensive analysis was conducted on the error of the extreme precipitation indexes calculated based on the combined data compared to using the observation data from the 31 stations. It can be seen from the tables that in 2016, for RX1day, the number of stations with an error value of less than 5 mm for CMPA-H, CMADS, GPM (IMERG), and TRMM was 10, 8, 9, and 8, respectively. For the RX5day values that were calculated based on the four combined datasets and the observational data, the highest number of stations (10) with an error of less than 10 mm corresponded to the values calculated based on the CMADS data (2016). During the test period, the number of stations with an error of less than 5 mm between the R99p values that was calculated based on CMPA-H, CMADS, GPM (IMERG), and TRMM and based on observation data from 2016 was 9, 9, 7, and 9, respectively. The performance of the different precipitation combined data types was also similar. Compared to the SDII value calculated based on the observational data, the SDII values from the combined datasets CMPA-H, CMADS, GPM (IMERG), and TRMM accounted for 58%, 65%, 77%, and 68% of the total in 2016, respectively. The SDII indexes calculated based on CMADS and GPM (IMERG) data had a relatively high accuracy. In 2016, the number of stations with an error of less than five days between the CWD indexes that were calculated based on the combined data CMPA-H, CMADS, GPM (IMERG), and TRMM and the index calculated based on the observation data accounted for 64%, 84%, 74%, and 74% of the total stations, respectively.
Performance was also evaluated over the entire test period by comparing the extreme precipitation index values calculated based on the combined data with the index value calculated based on the observation data. Although some index values were different between the two calculations and some indexes (such as R99p) showed poor performance, most of the indexes calculated by combined data showed good consistency. As shown from the overall performance, the datasets CMPA-H, CMADS, and GPM (IMERG) exhibited good performance, while TRMM (TMPA) performed slightly worse.

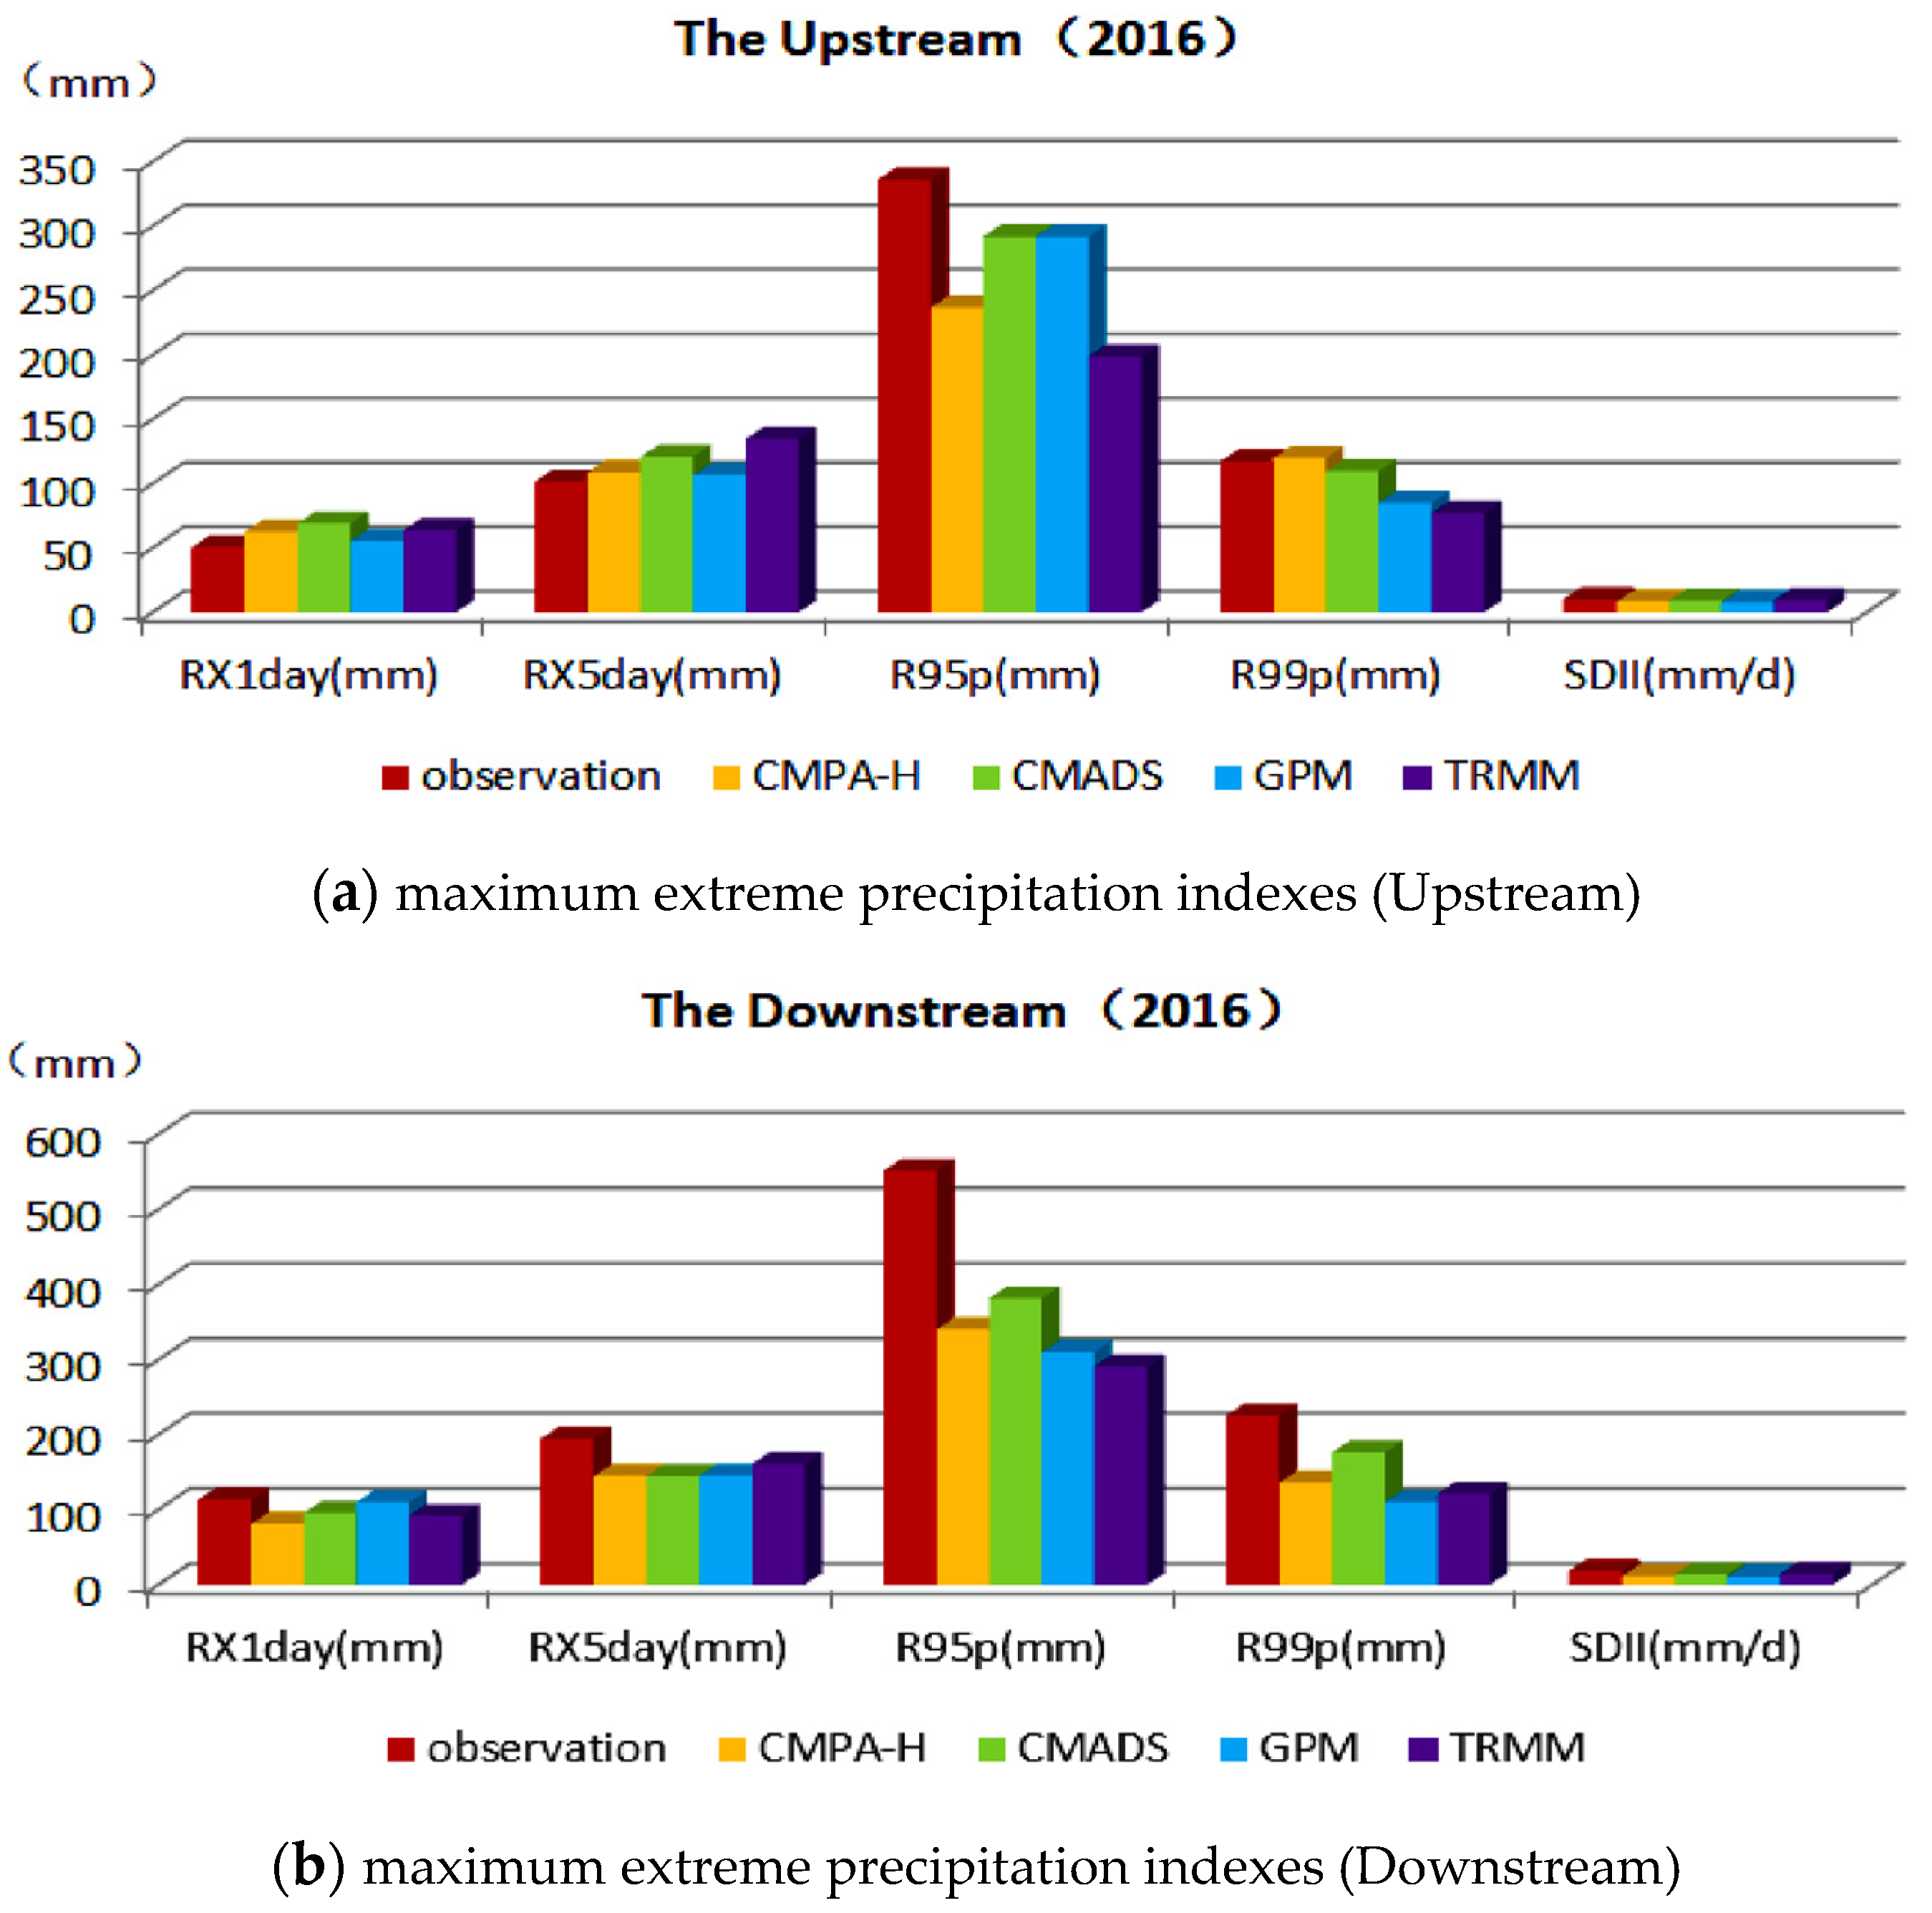
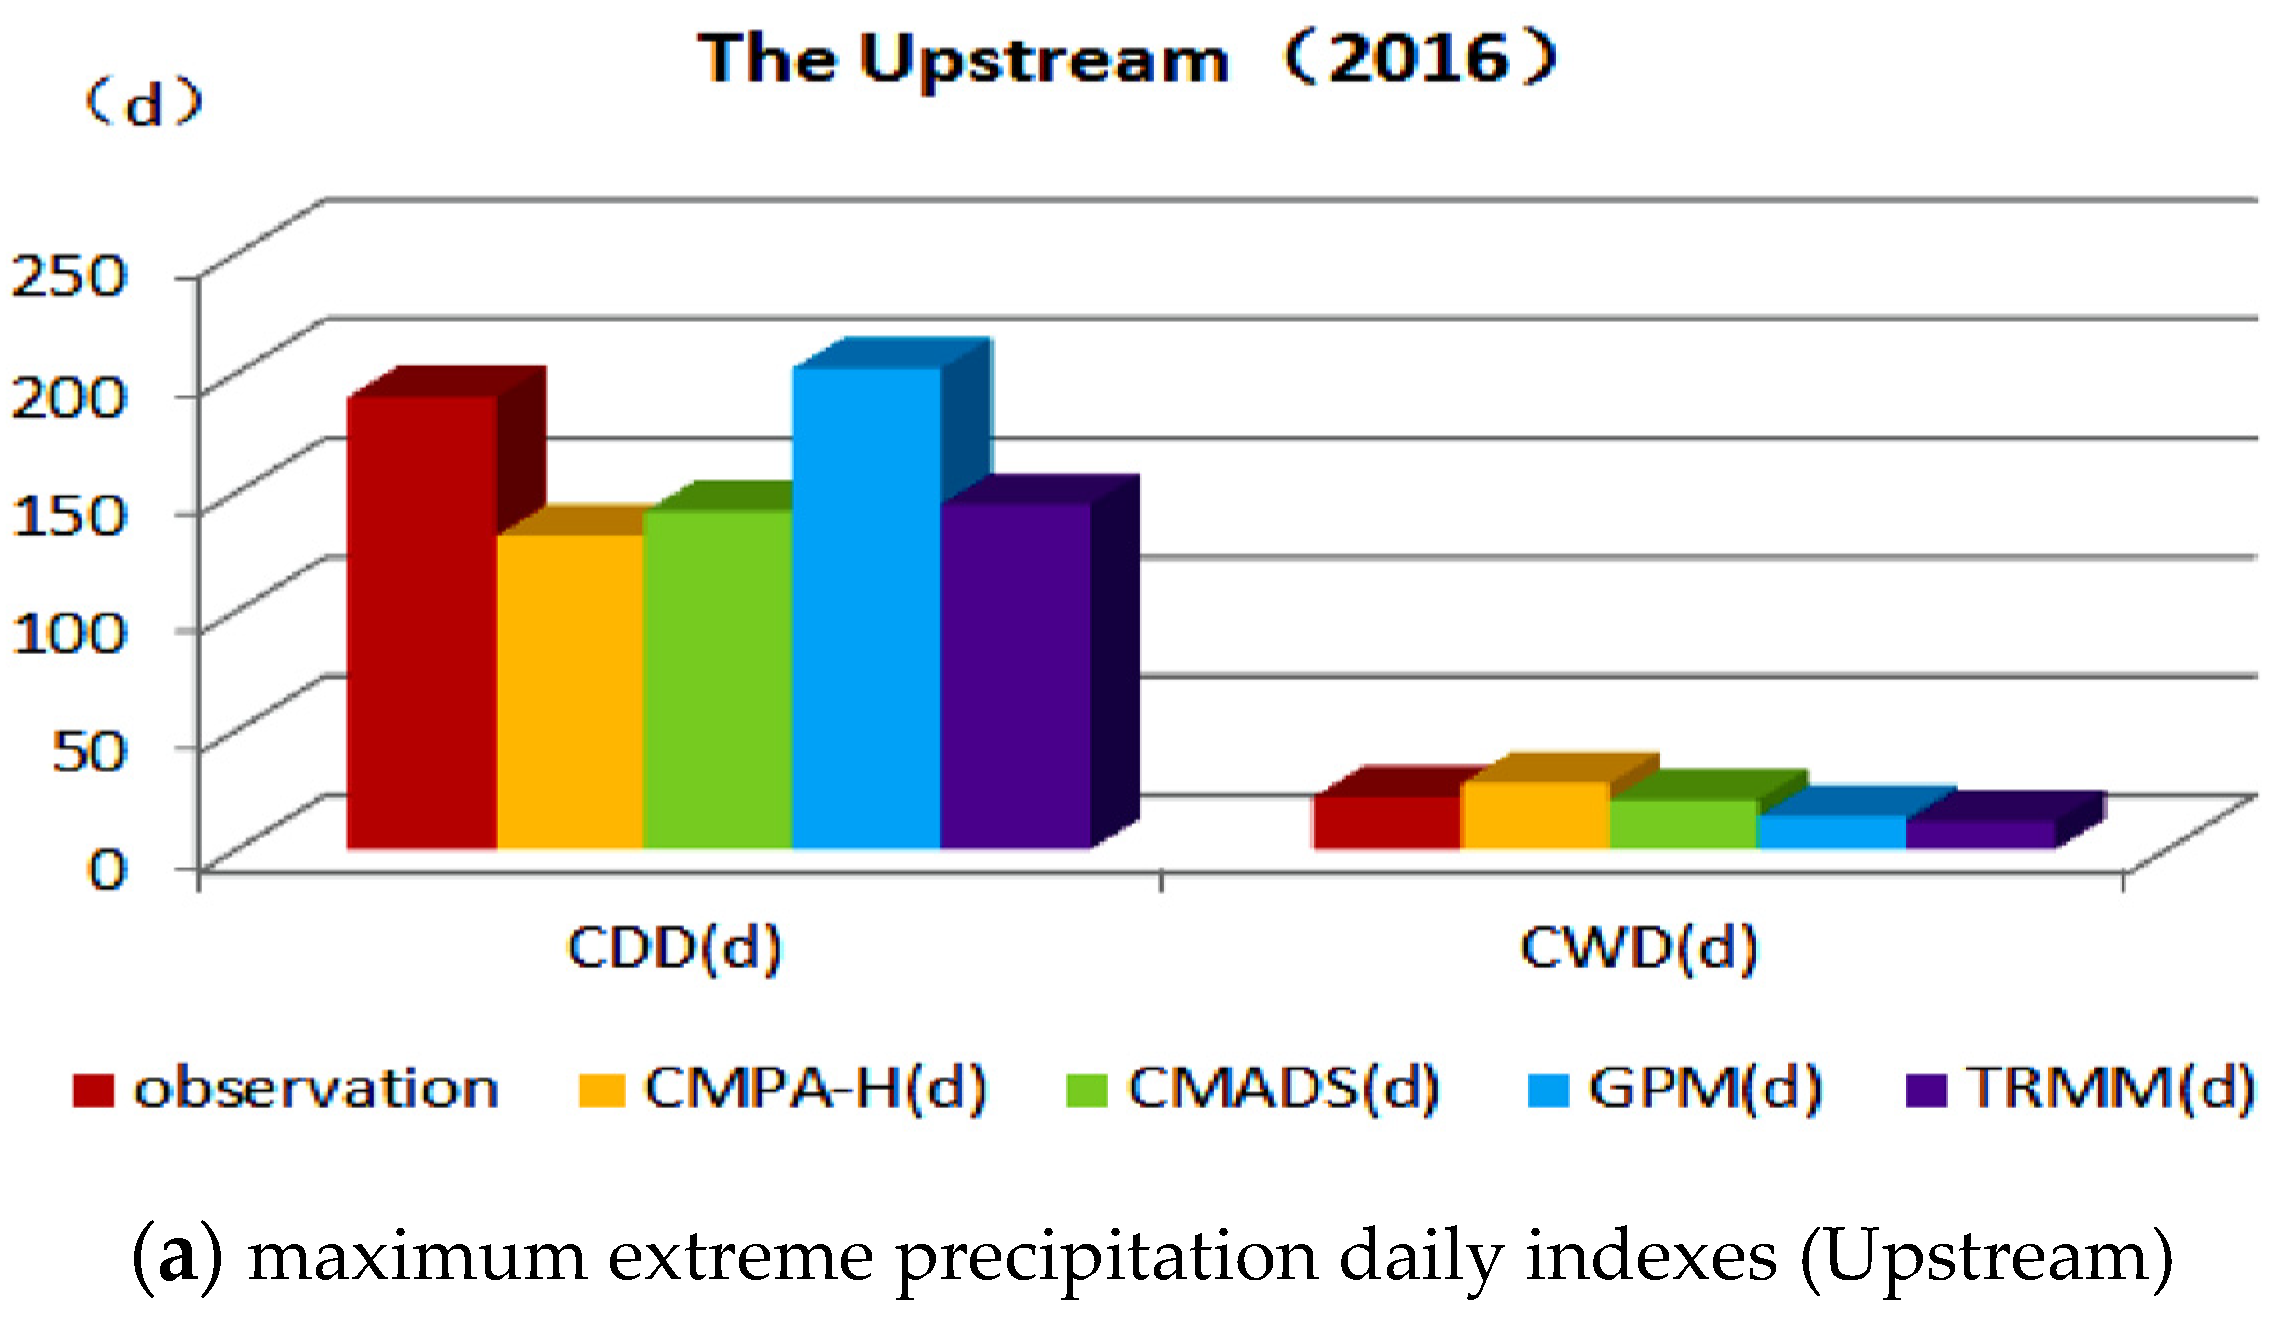
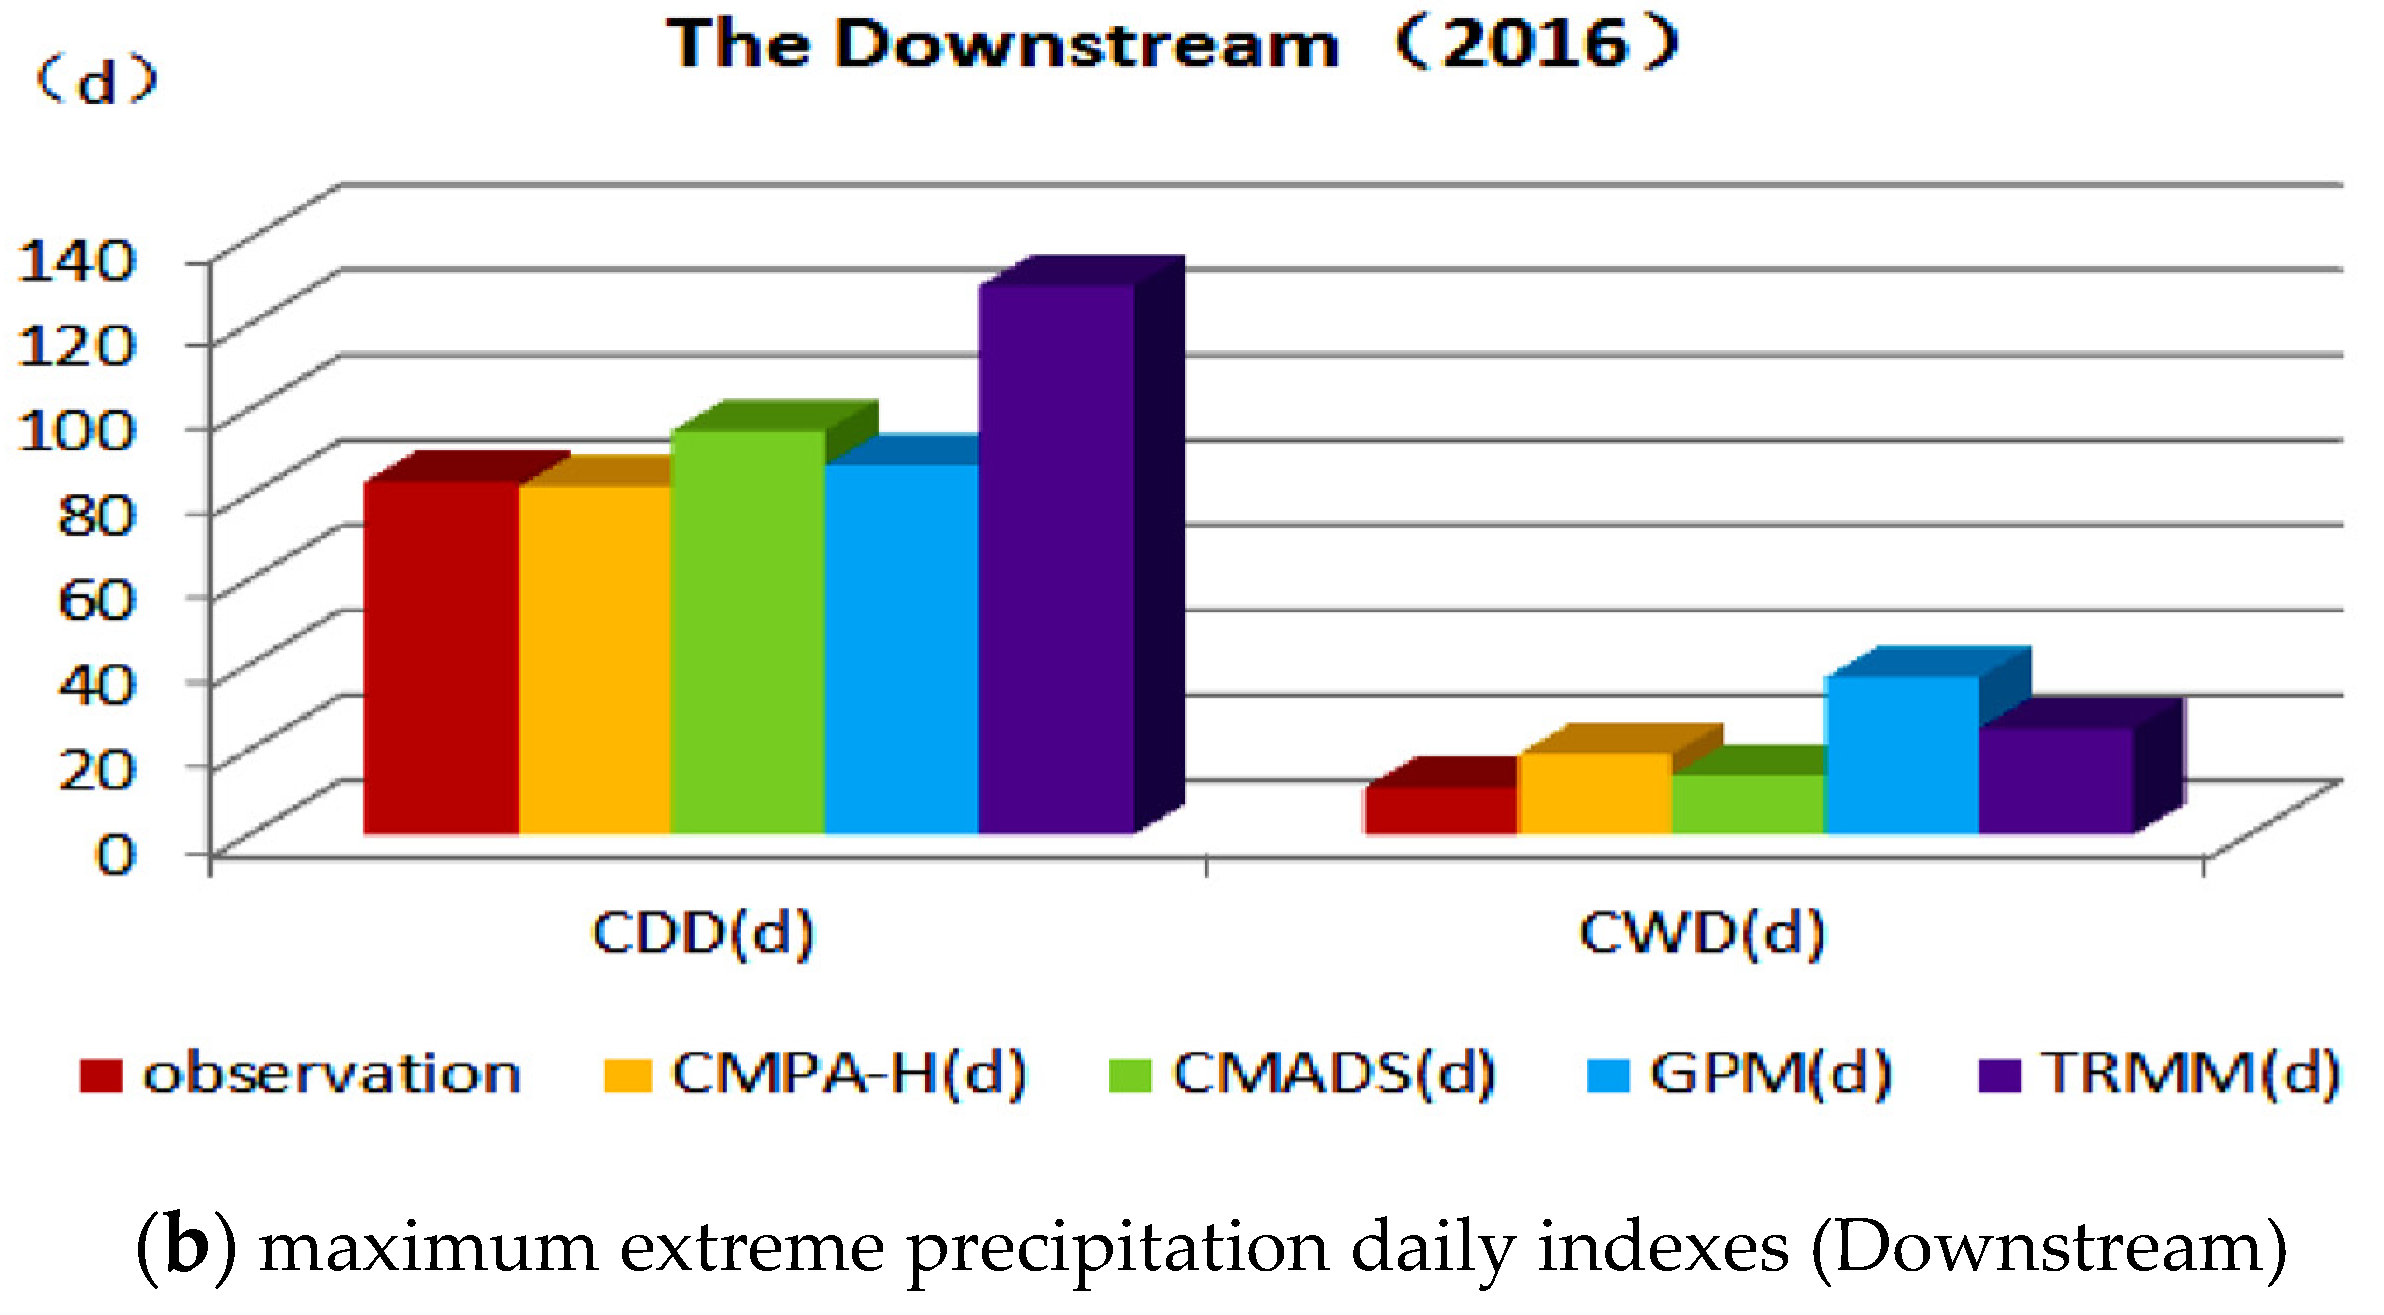
3.2. Analysis of Extreme Precipitation Indexes in the Basin

The maximum value of the extreme precipitation index calculated based on each combined dataset (including observation data) within the basin, the station with the maximum value, and the deviation of the calculated result from the maximum value of the observation data are shown in Table 3 and Table 4. Comparisons of the calculated results for each dataset are shown in Figure 3 and Figure 4.
In conjunction with the information presented in Table 3 and Table 4, it can be seen from the figures that the calculation results based on the combined datasets are consistent with the results calculated based on the observational data. For example, in 2016, the maximum value of RX5day calculated based on observational data in the upstream sub-basin appeared at Weixi station. The maximum values in the calculated results using CMPA-H, CMADS, GPM (IMERG), and TRMM appeared at Jiulong station, Weixi station, Deqin station, and Litang station, respectively. In 2016, the maximum CWD value calculated based on observational data in the upstream sub-basin appeared at Jiulong station. The stations with the maximum CWD values calculated based on CMADS were consistent with those stations determined based on the observational data. The error between the maximum value calculated based on each of the combined datasets CMPA-H, CMADS, GPM (IMERG), and TRMM and the value calculated based on the observational data was 6, 1, 8, and 10 days, respectively, and the errors were small.
Deviations also exist between the extreme precipitation indexes calculated based on the combined data and the results calculated based on the observational data. From Figure 3 and Figure 4, it can be seen that for the deviations of extreme precipitation calculated based on the combined data, most of the values in the upstream sub-basin were greater than the results calculated based on the observational data, and most of the values in the downstream sub-basin were less than those calculated based on the observational data. Using the extreme precipitation index plots in Figure 3a,b as an example, it can be seen that, with the exception of index values that are relatively close for combined and observational data, the deviations of the upstream and downstream sub-basin results that were calculated based on the combined data are mostly smaller than the results calculated based on the observational data. The above findings were further analyzed. First, there are only 31 ground-based meteorological stations located throughout the entire basin, and their layout density is relatively sparse. If more ground-based meteorological stations occurred within the research basin, perhaps as many as 910 stations to correspond to the grid combined data, a different result from the current values would be obtained when the spatial distribution of precipitation in the basin is expressed. Second, although the grid combined data are continuous within the basin, for grids that have not been calibrated by ground-based meteorological stations, errors in the combined dataset itself may occur causing the deviation of individual grid, and thus allowing for a certain error to occur in identifying extreme precipitation indexes. However, combined with the results of the applicability analysis in the first section of this paper, the extreme precipitation index values calculated based on the combined data showed good performance compared to the value calculated based on the observational data, and also had a certain accuracy. Considering the spatial distribution characteristics of the extreme precipitation indexes, the extreme precipitation indexes calculated based on the observational data may be underestimated in the relatively dry and humid upstream and downstream sub-basins.
Therefore, considering the accuracy of the combined data at the ground-based stations and the ability of the combined data to reflect the spatial distribution characteristics, the analysis of extreme climate characteristics throughout the entire study basin can be carried out using the characteristic indexes identified based on the combined data. Especially for local areas with no data or sparse data, it is feasible to use combined data to identify and calculate extreme climate characteristics.

4. Analysis and Evaluation of the Accuracy of Reanalyzed Combined Datasets in Calculating Extreme Temperature Indexes

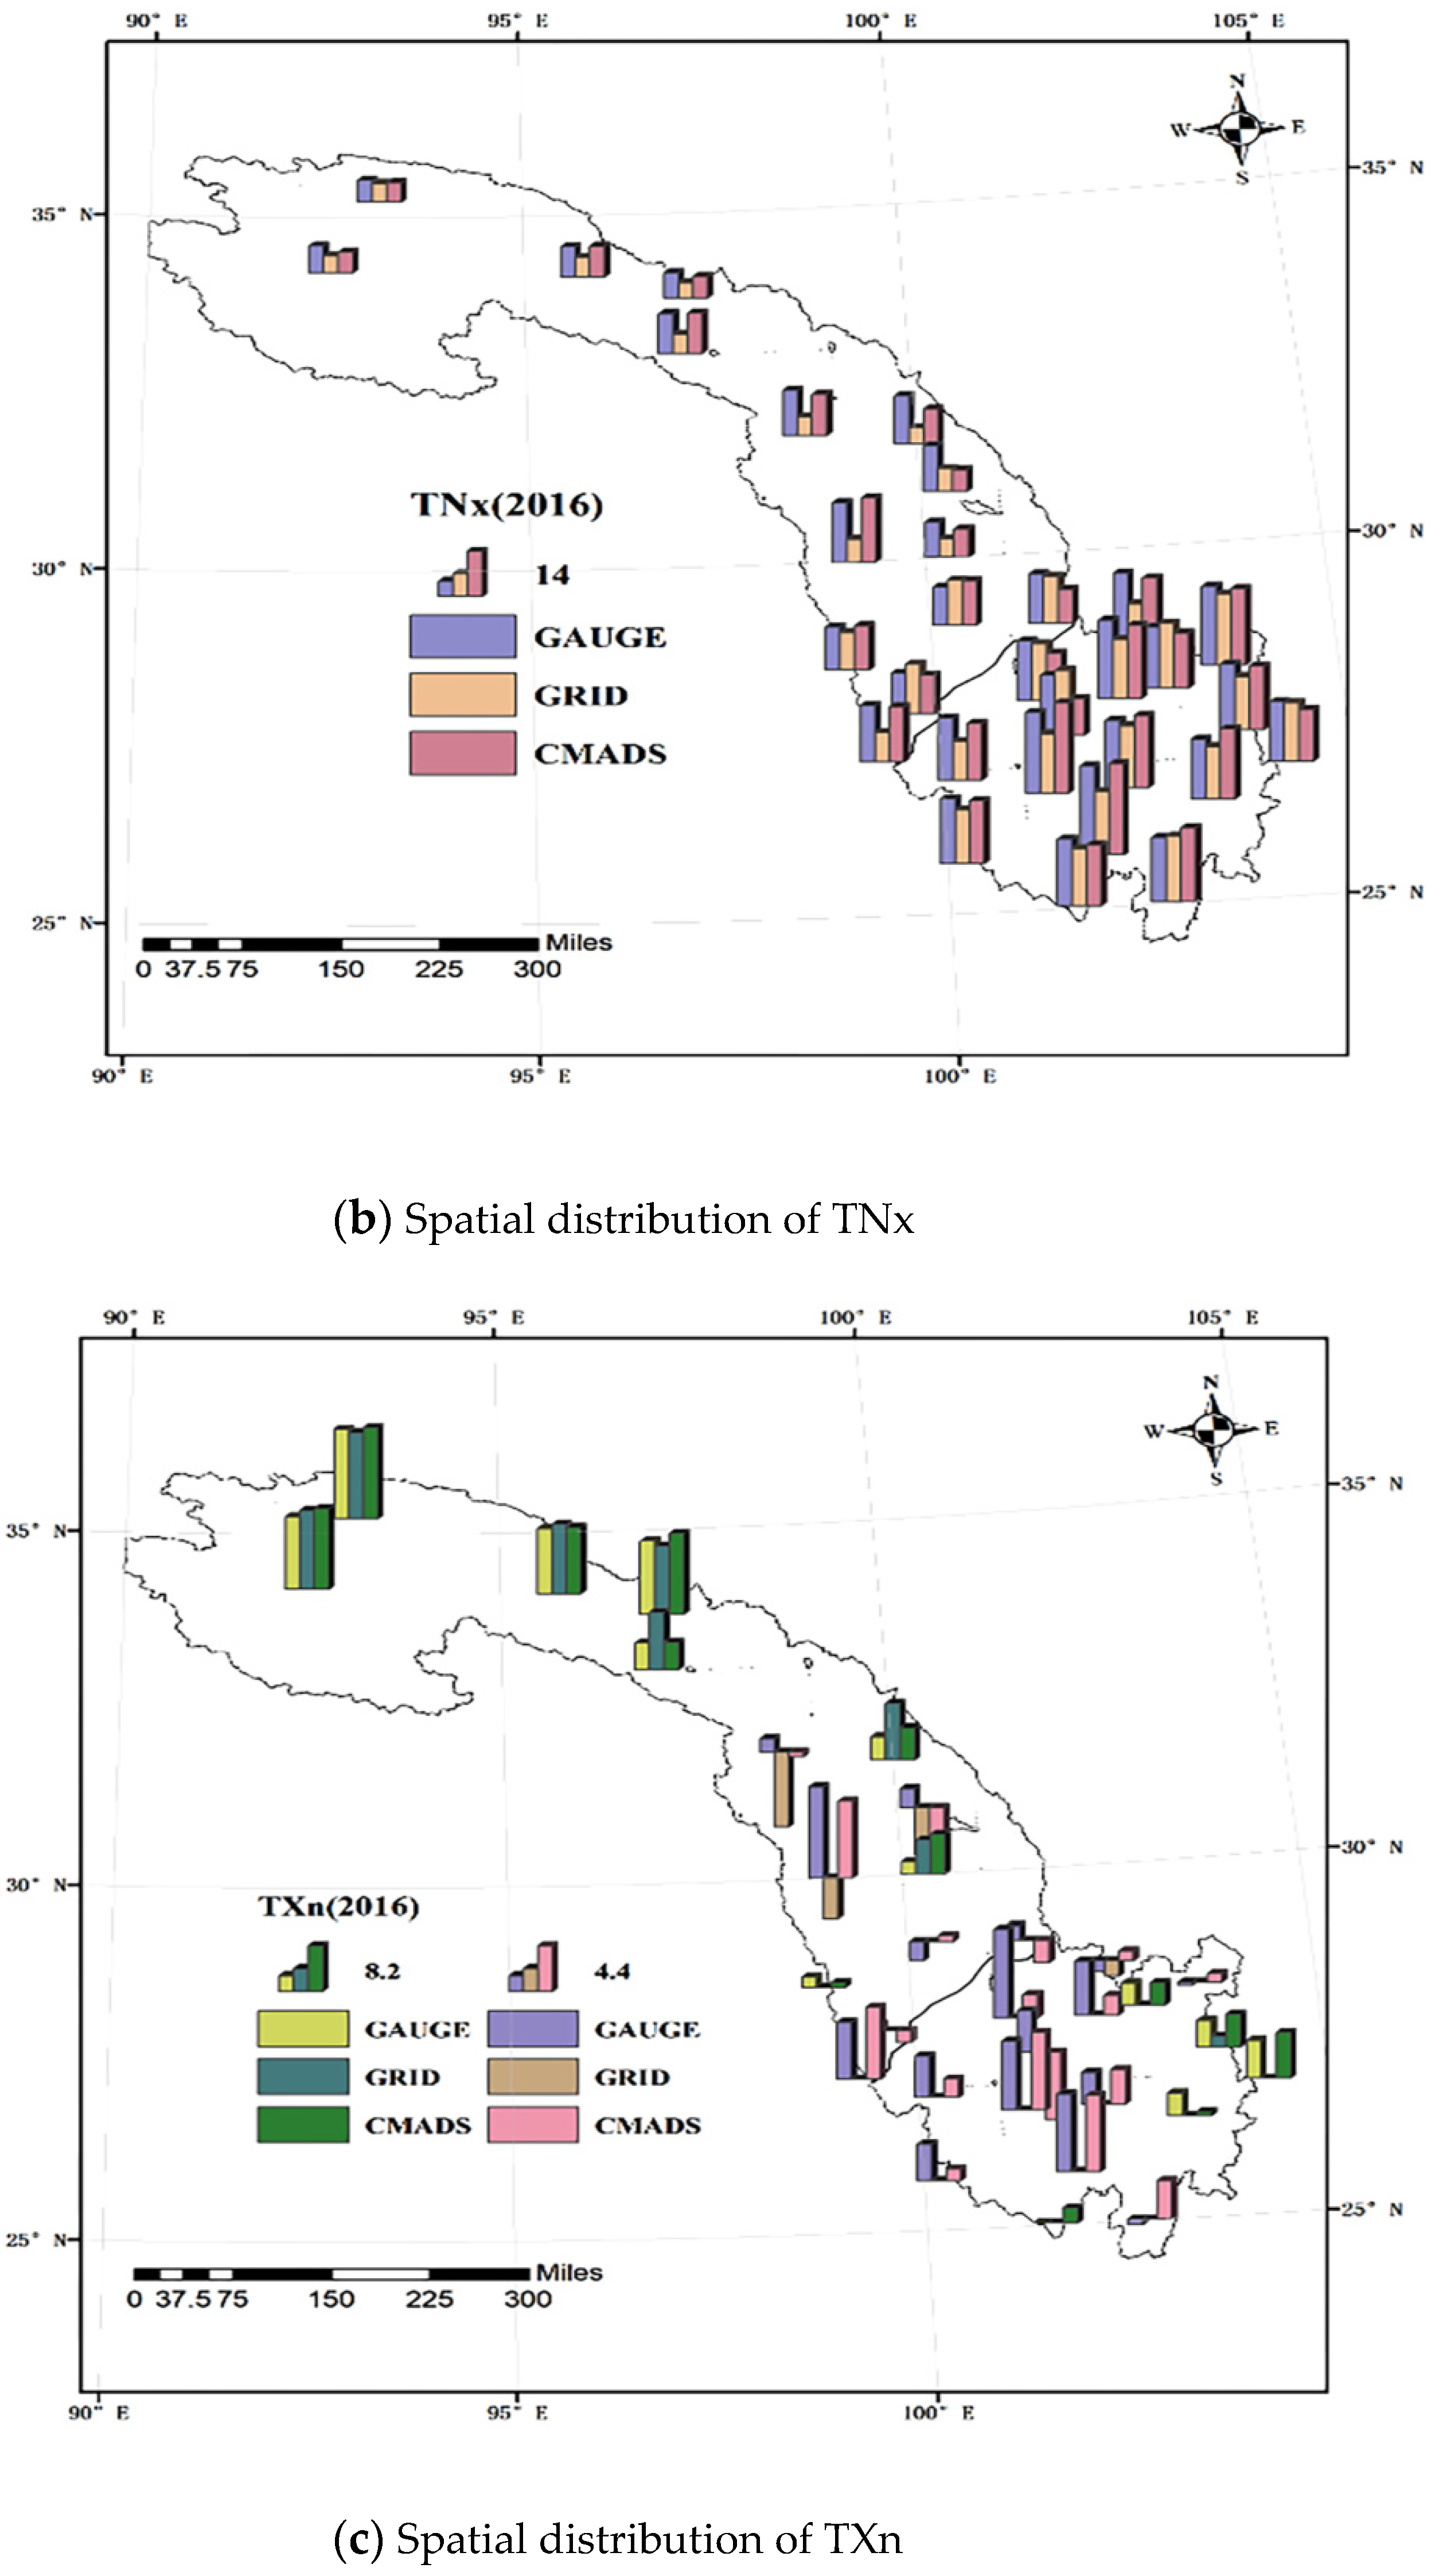
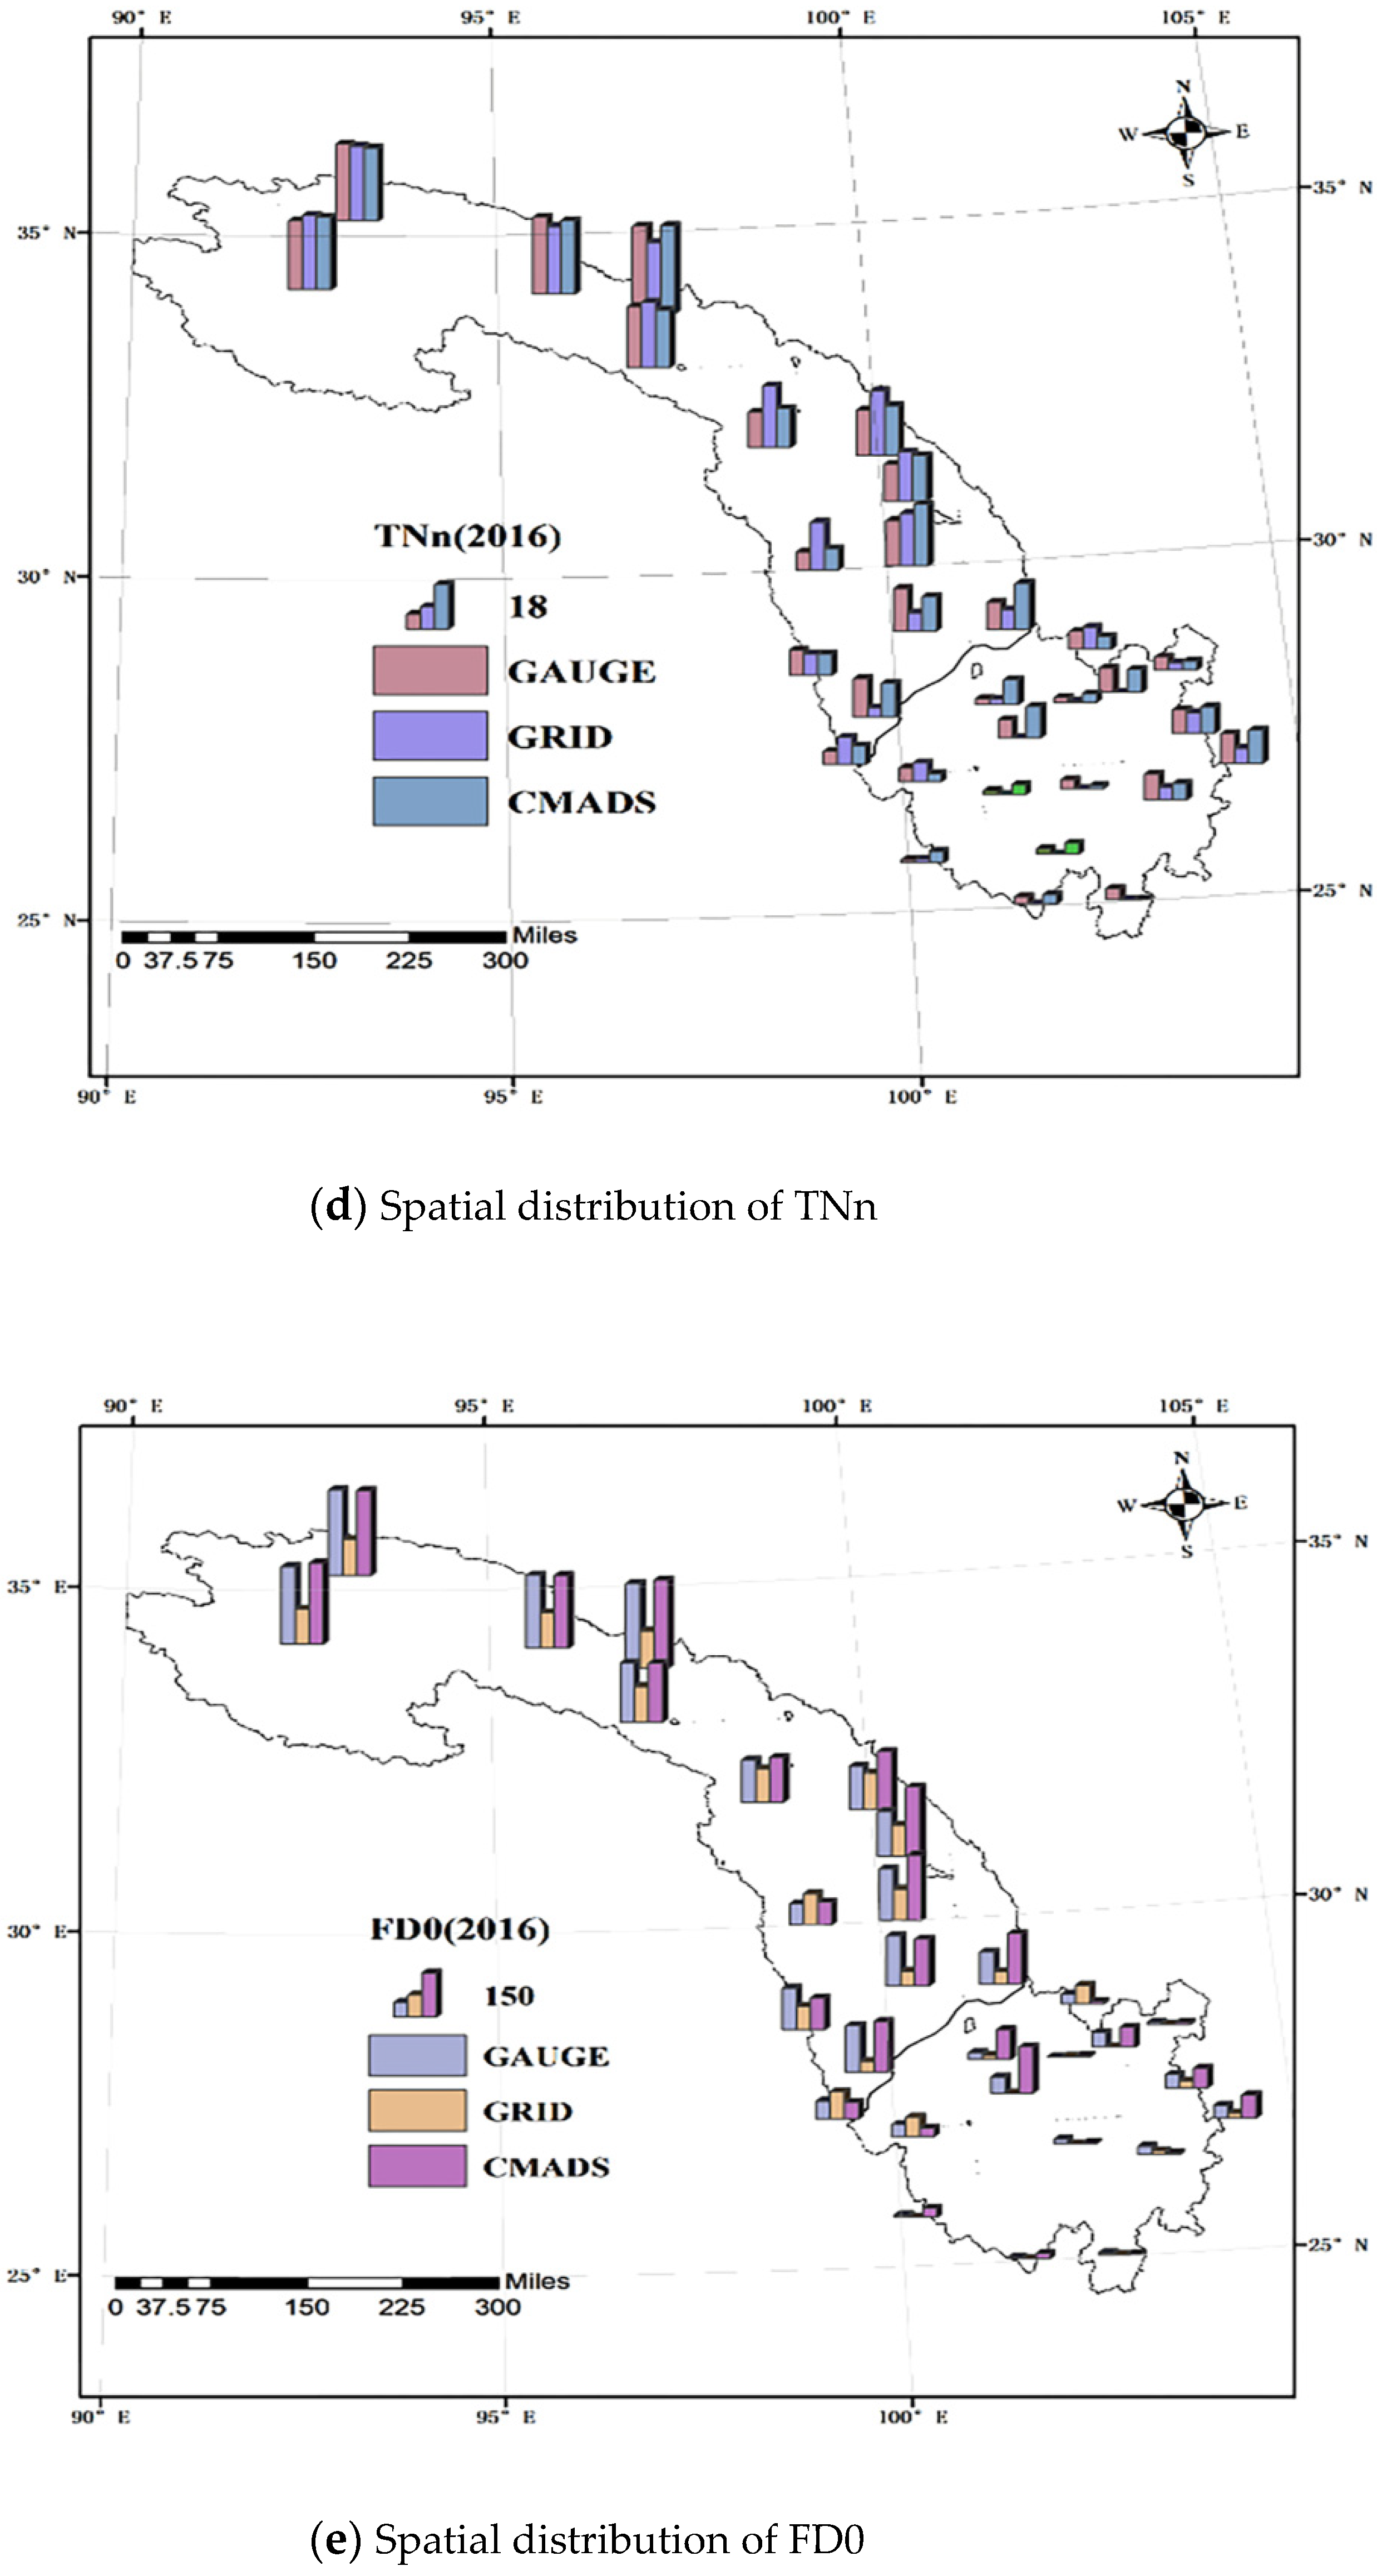
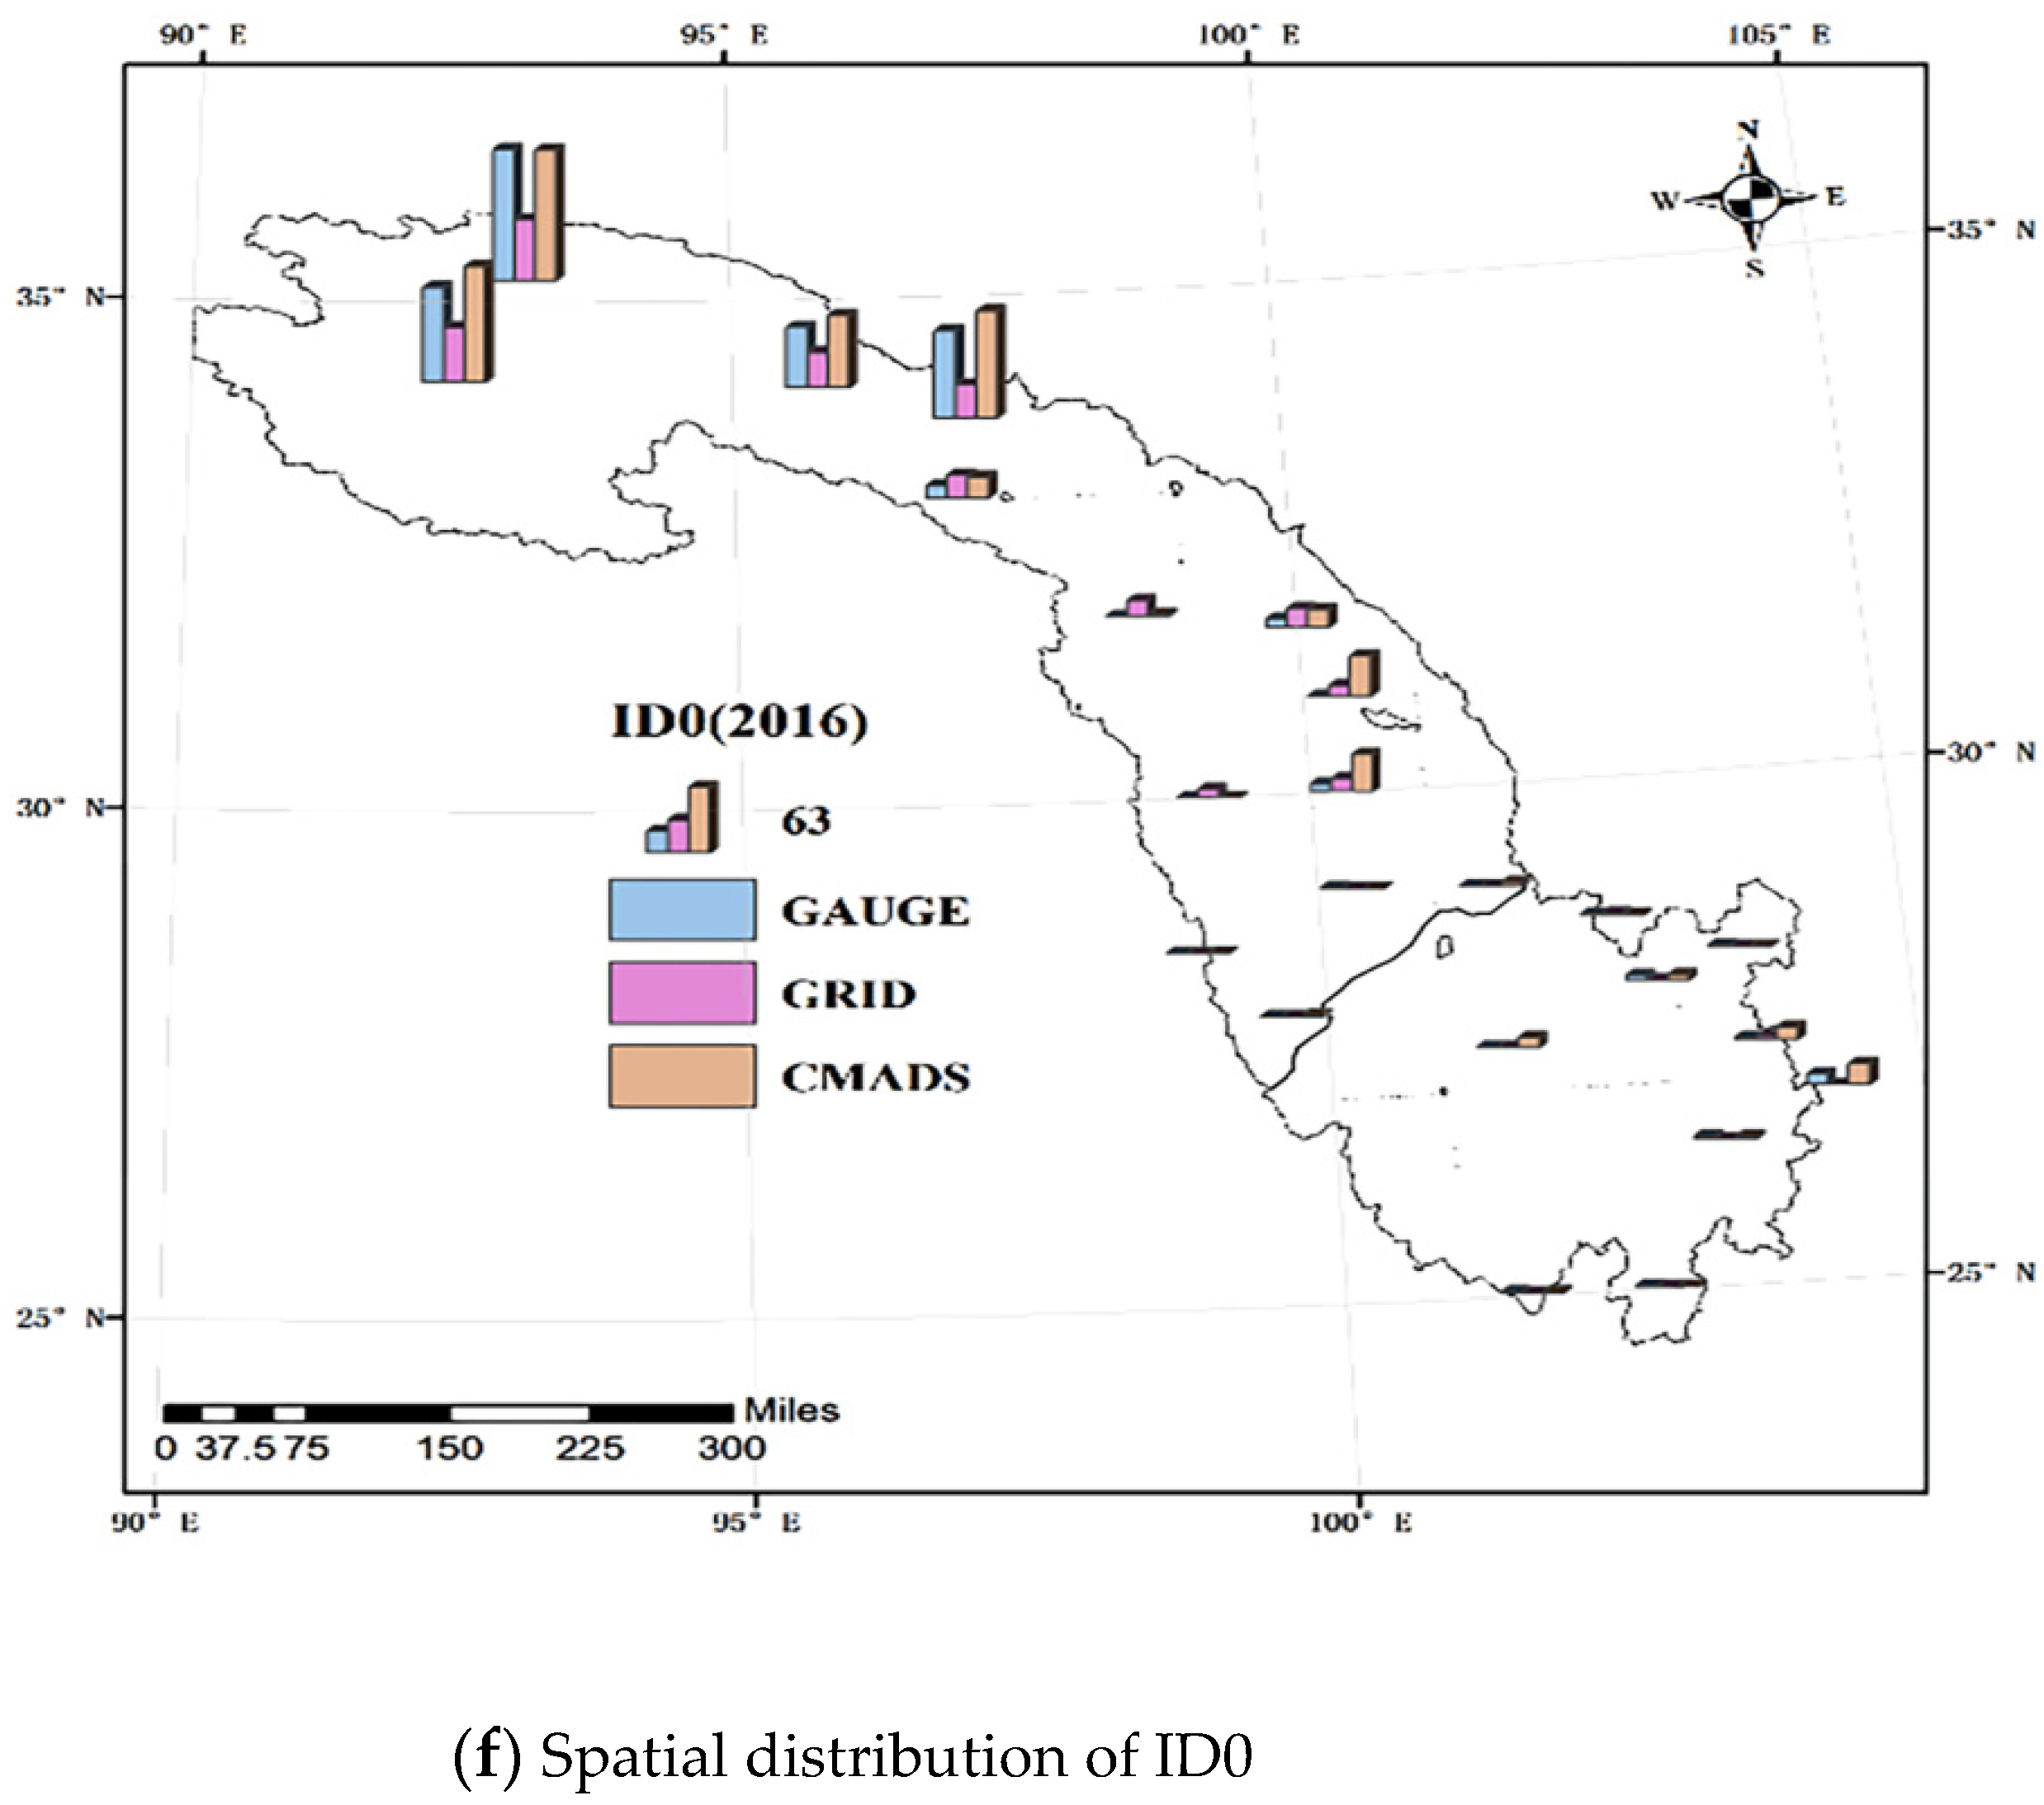
4.1. Comparative Analysis of the Spatial Distribution of Extreme Temperature Indexes

The differences between the extreme temperature index results calculated based on the observational data and the results based on the combined data are shown in Figure 5. In Figure 5, there are three side-by-side histograms at each station, representing the extreme temperature indexes based on observational data, 0.5° grid temperature combined data, and CMADS calculation.
Using the annual extreme low temperature index TNn of the Tuotuo River station in 2016 as an example, the TNn value calculated based on the observational data was −27.2 °C, and the TNn values calculated based on the combined 0.5° grid data and CMADS data were −29.5 and −28.75 °C, respectively. Using the number of frost days FD0 at Yushu station in 2016 as an example, the FD0 value calculated based on the observational data was 207 days, and the FD0 value calculated based on the combined 0.5° grid data and the CMADS data was 124 and 206 days, respectively.
A deviation analysis was performed on the extreme temperature indexes calculated based on the combined data of the 31 meteorological stations compared to the indexes calculated based on the observational data. The number of stations with an error of less than 5 °C between the TXx, TXn, TNx, and TNn values that were calculated based on the 0.5° grid temperature-combined data from 2016 and the value calculated based on the observational data was 20, 20, 19, and 20, respectively. The number of stations with an error of less than 5 °C between the TXx, TXn, TNx, and TNn values that were calculated based on the CMADS data and the value calculated based on the observation data was 29, 28, 29, and 27, respectively. For the duration of the test period, stations with an error of less than 3 °C between the TXx values that were calculated using the 0.5° grid temperature combined and CMADS datasets and the calculated result using the observational data accounted for 84% of the total stations. Stations that had an error of less than 3 °C between the TXn, TNx, and TNn values that were calculated based on combined data and the values calculated based on observational data accounted for 81%, 77%, and 77% of the total stations, respectively. The number of stations with an error of less than 10 days on ID0 (ice days) calculated based on each of the two combined temperature datasets was basically the same.
As shown from the performance of the representative stations throughout the entire study period, the temperature extreme index values corresponding to the ground-based weather stations and the indexes calculated based on the observational data, especially the TXx and TNn indexes, showed good consistency, and the applicability of the combined data in the calculation of the two indexes was acceptable. The daily temperature extremes index was the second best, and the other two indexes had poor calculation results. The temperature performance of the CMADS dataset showed better consistency with the weather station temperature data and the accuracy was greater.

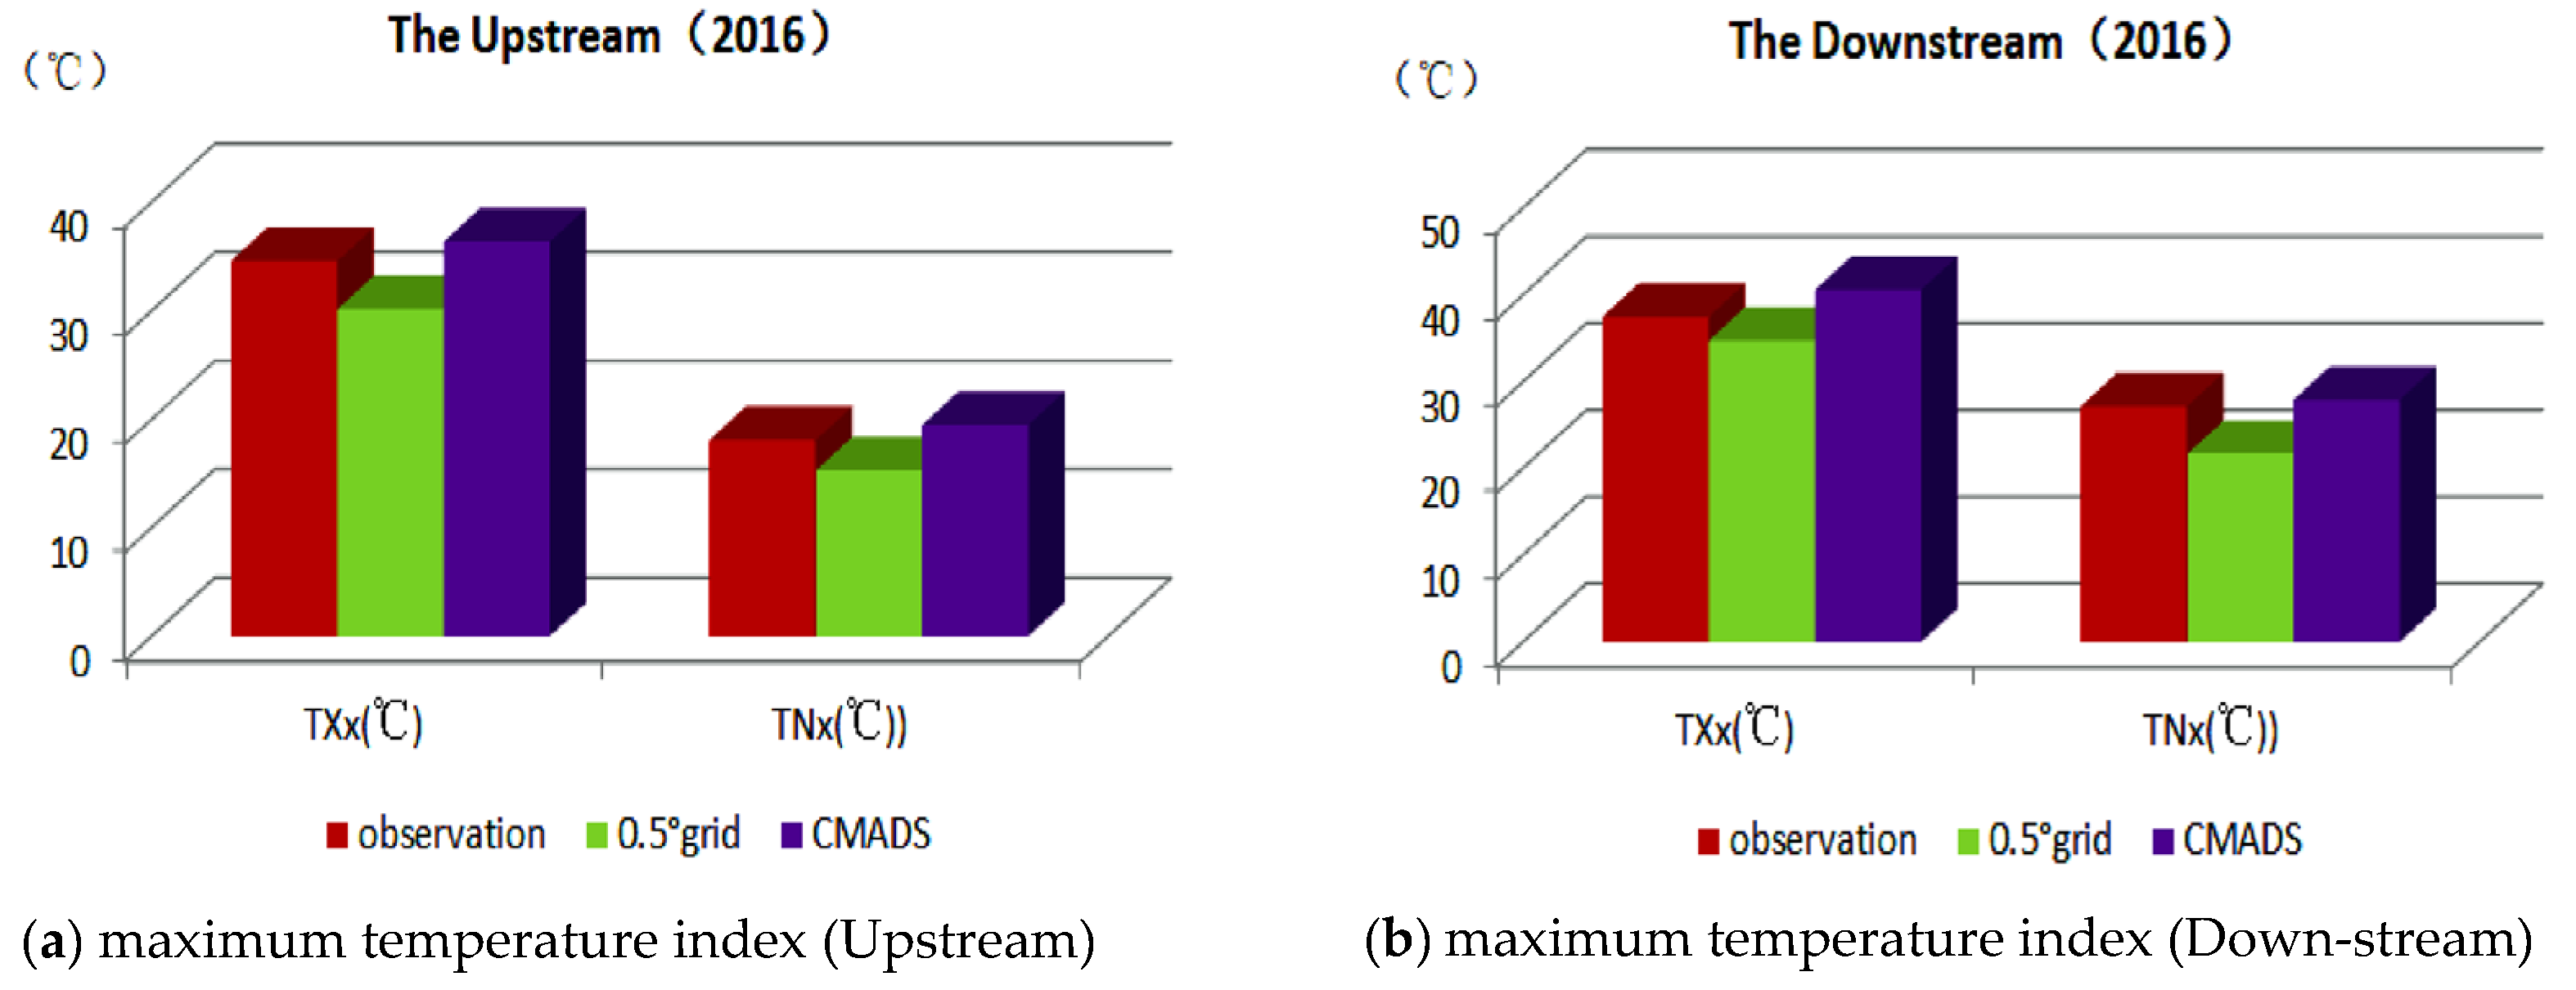
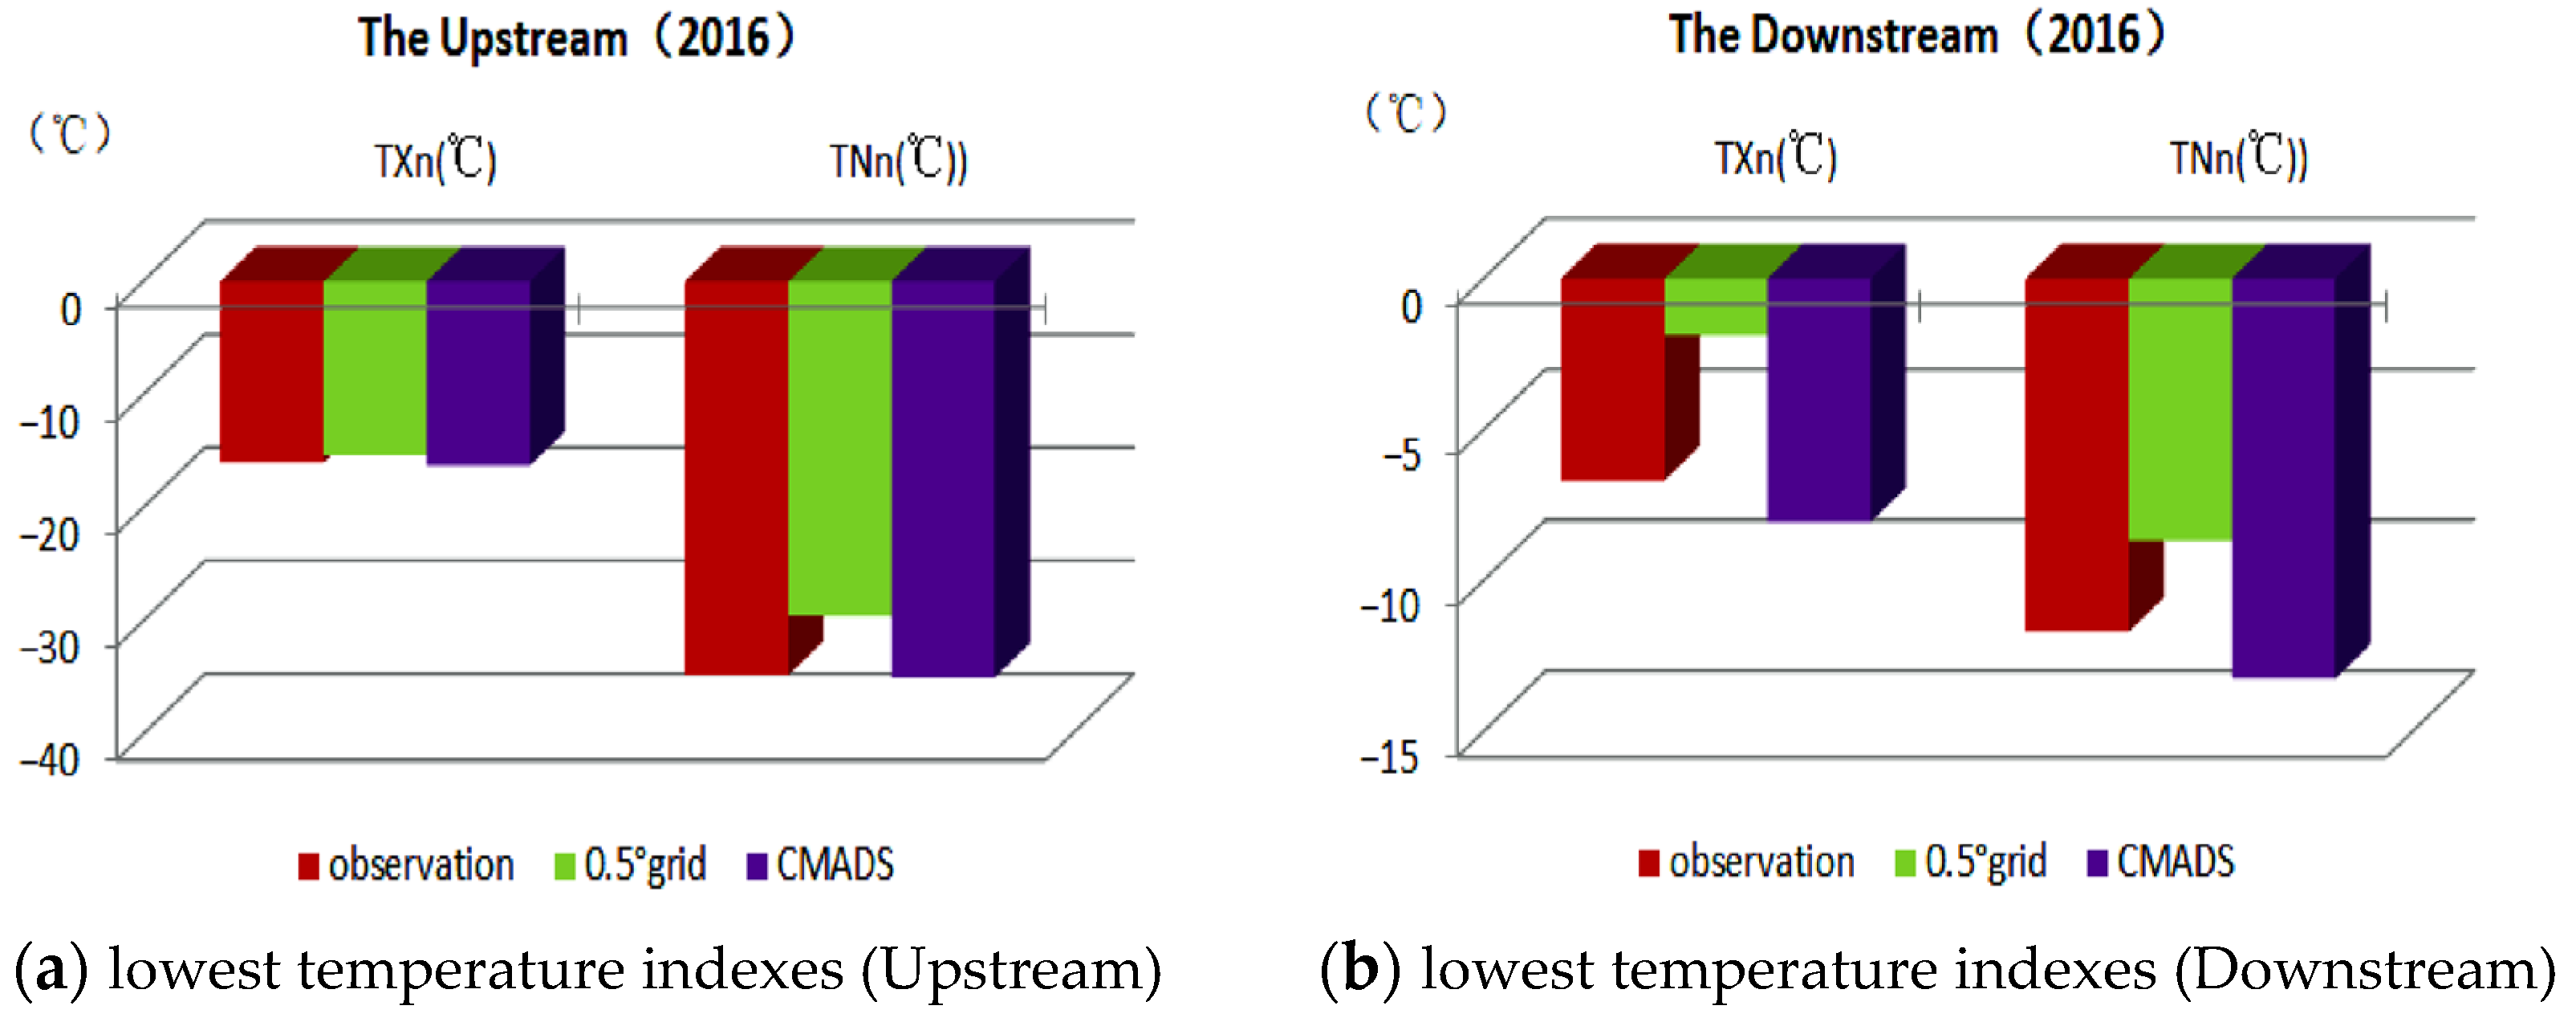
4.2. Analysis of the Extreme Temperature Indexes in the Basin

The maximum values of the extreme temperature indexes calculated based on each combined dataset (including observational data) within the basin, the stations with the maximum values, and the deviations from the calculated results of the maximum value of the observational data, as well as the minimum values of the extreme temperature indexes, the stations with the minimum values, and the deviations from the calculation results of the minimum value of the observational data are shown in Table 5 and Table 6, respectively. The comparison charts of the calculation results of each dataset are shown in Figure 6, Figure 7 and Figure 8.
It can be seen from Table 5 and Table 6 that the maximum extreme temperature index values calculated based on the CMADS combined dataset within the basin were consistent with the calculation results based on the observational data, and the maximum error was within 3 °C. Using the maximum highest temperature TXx as an example, the TXx calculated based on observational data in the upstream sub-basin in 2016 was 34.6 °C, which appeared at Batang station. The calculated result based on the CMADS combined dataset was 36.37 °C, and this maximum temperature also appeared at Batang station. The maximum TXx value calculated based on the 0.5° grid temperature dataset appeared at Daocheng station adjacent to Batang, and the difference between this result and the result calculated based on the observational data was 4.4 °C, exhibiting a greater deviation compared to the CMADS combined dataset. The maximum extreme temperature calculated on the basis of observational data in the downstream sub-basin appeared at Huaping station. The results calculated based on the CMADS combined dataset are consistent with the above results, and the difference between the calculated results was 3.1 °C. The CMADS combined dataset showed good performance in the calculation of the extreme temperature indexes in China. At the same time, as shown in Figure 6, Figure 7 and Figure 8, the minimum value of extreme temperature calculated based on the combined dataset CMADS within the basin showed a relatively high consistency with the result calculated based on the observational data. The daily temperature extreme index and the corresponding station determined based on the combined dataset were similar to the results calculated based on the observational data.

5. Analysis of the Typical Flood Events of 22 September Based on Reanalysis of Combined Data

On 22 September 2016, the average daily runoff at the outlet of the Jinsha River Basin reached the maximum value recorded in that year. The basic information is show in Table 7.

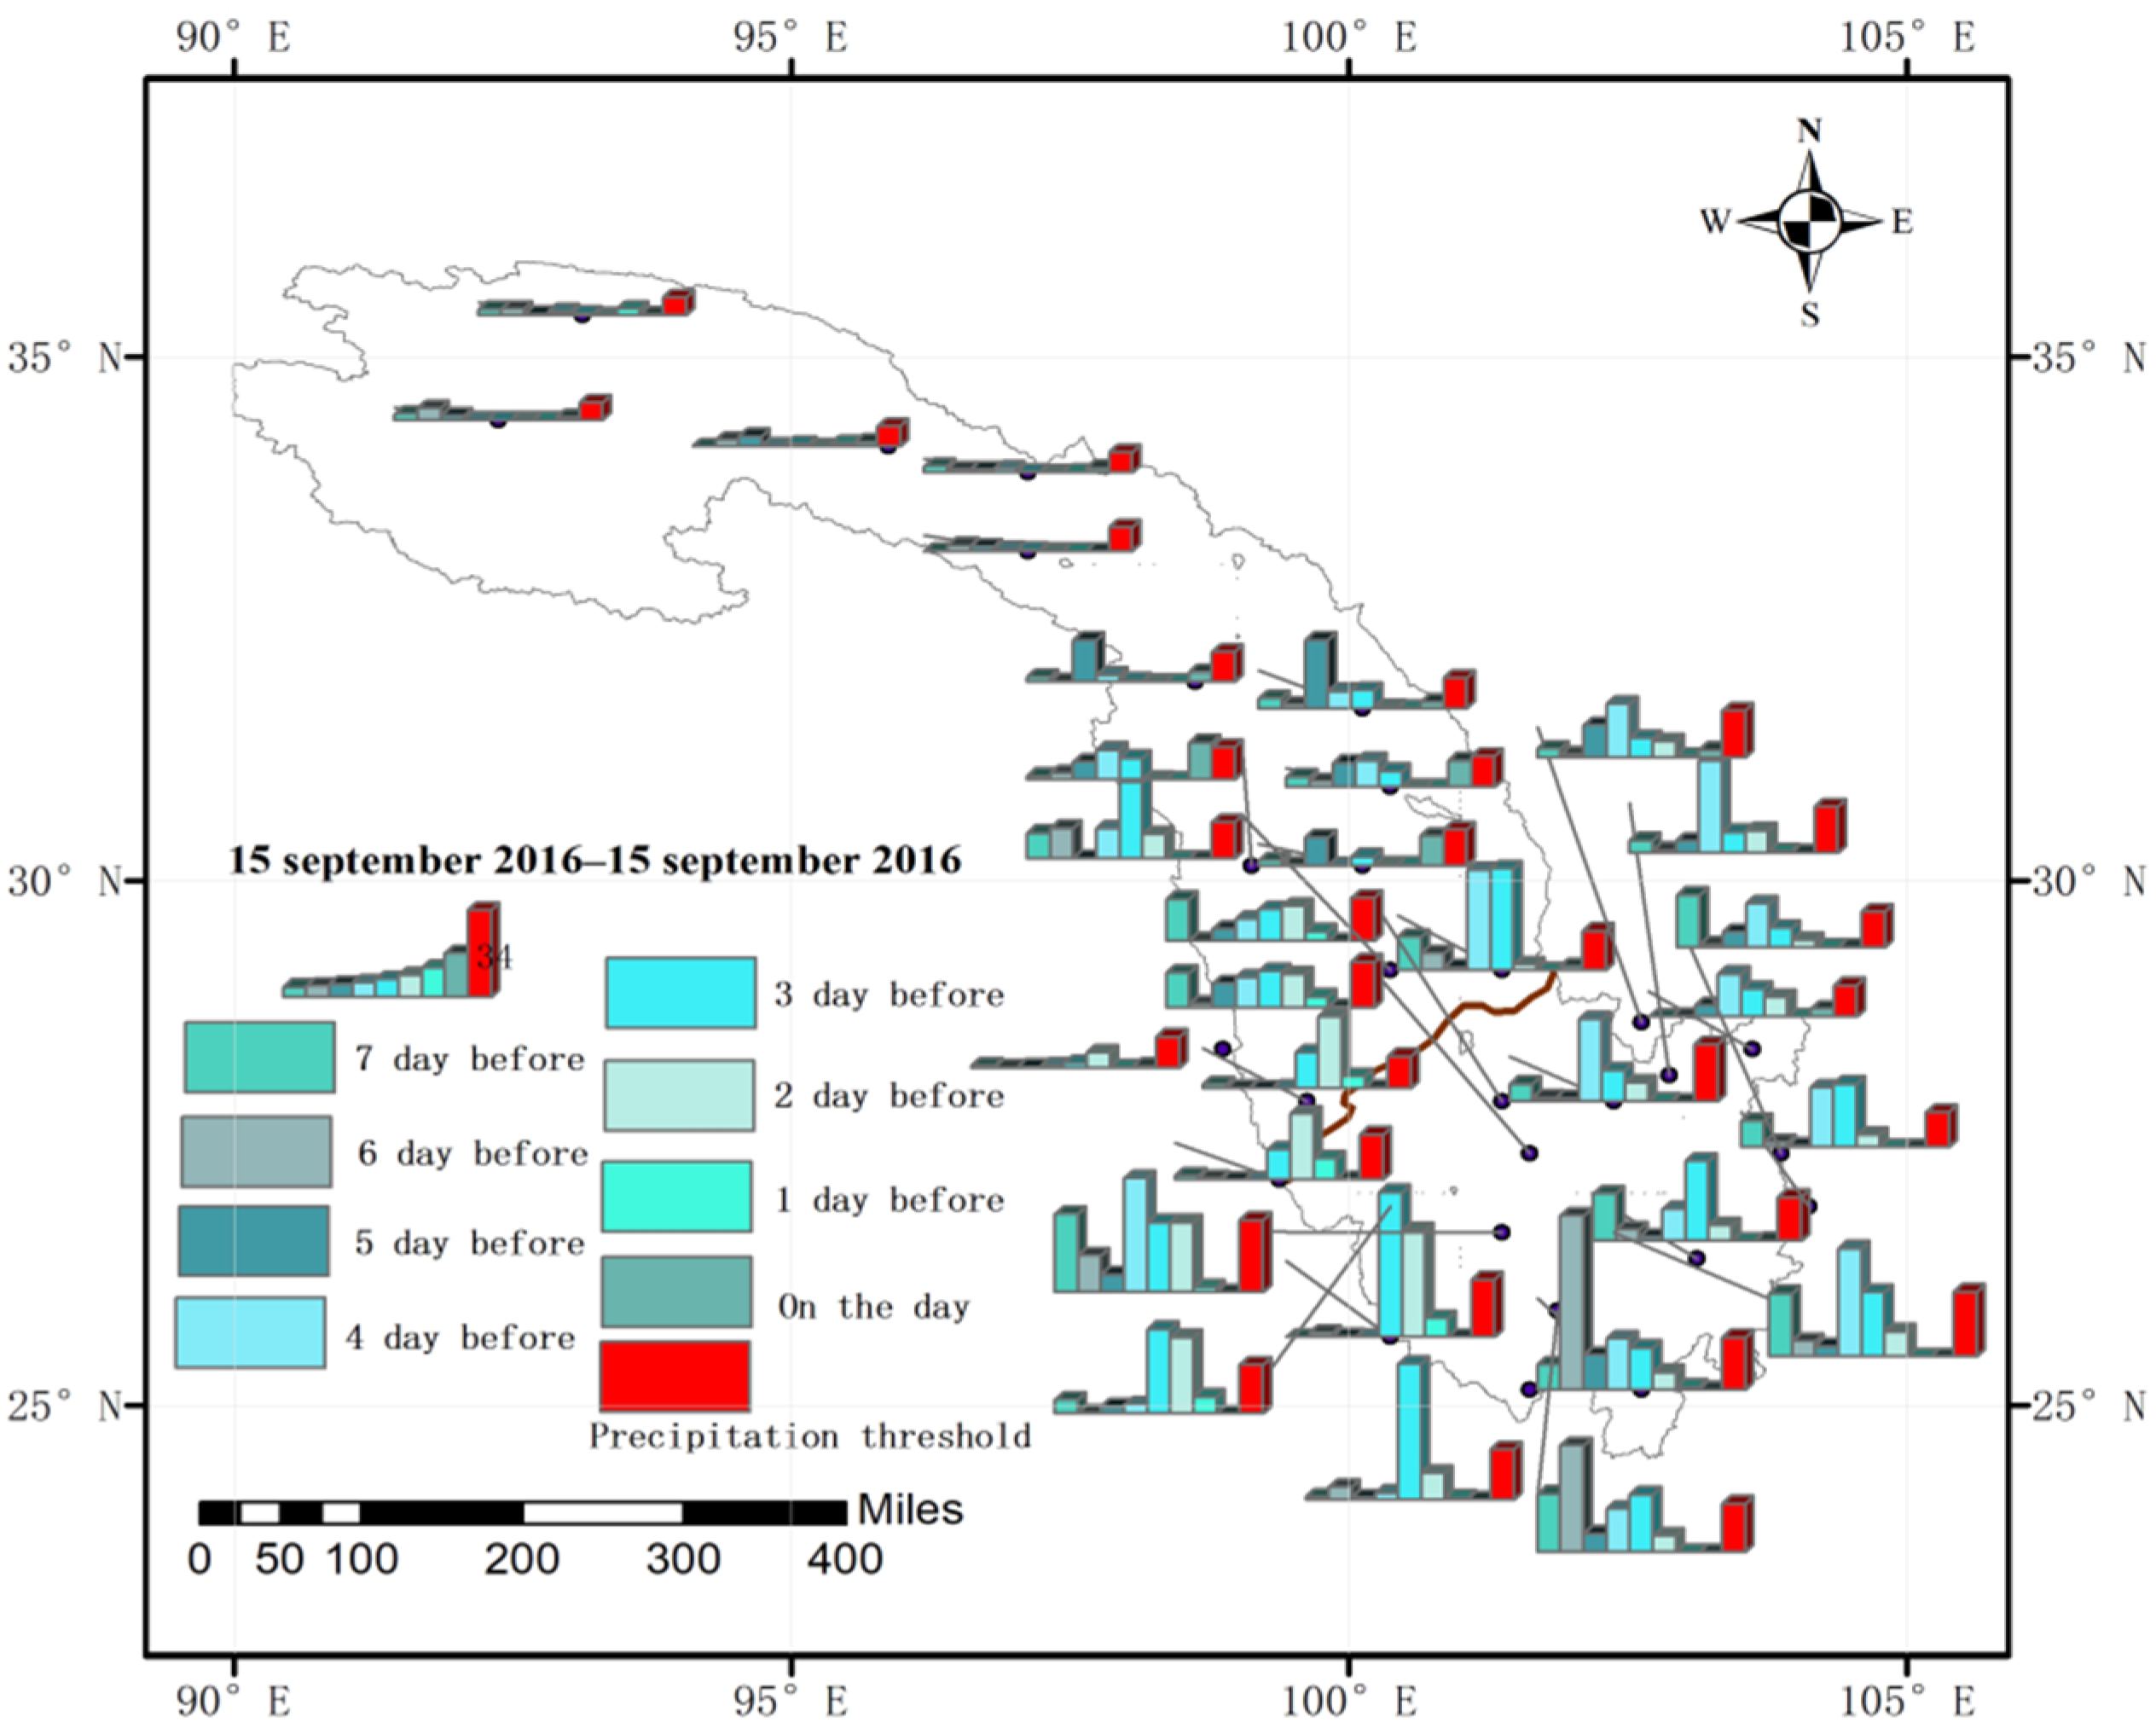
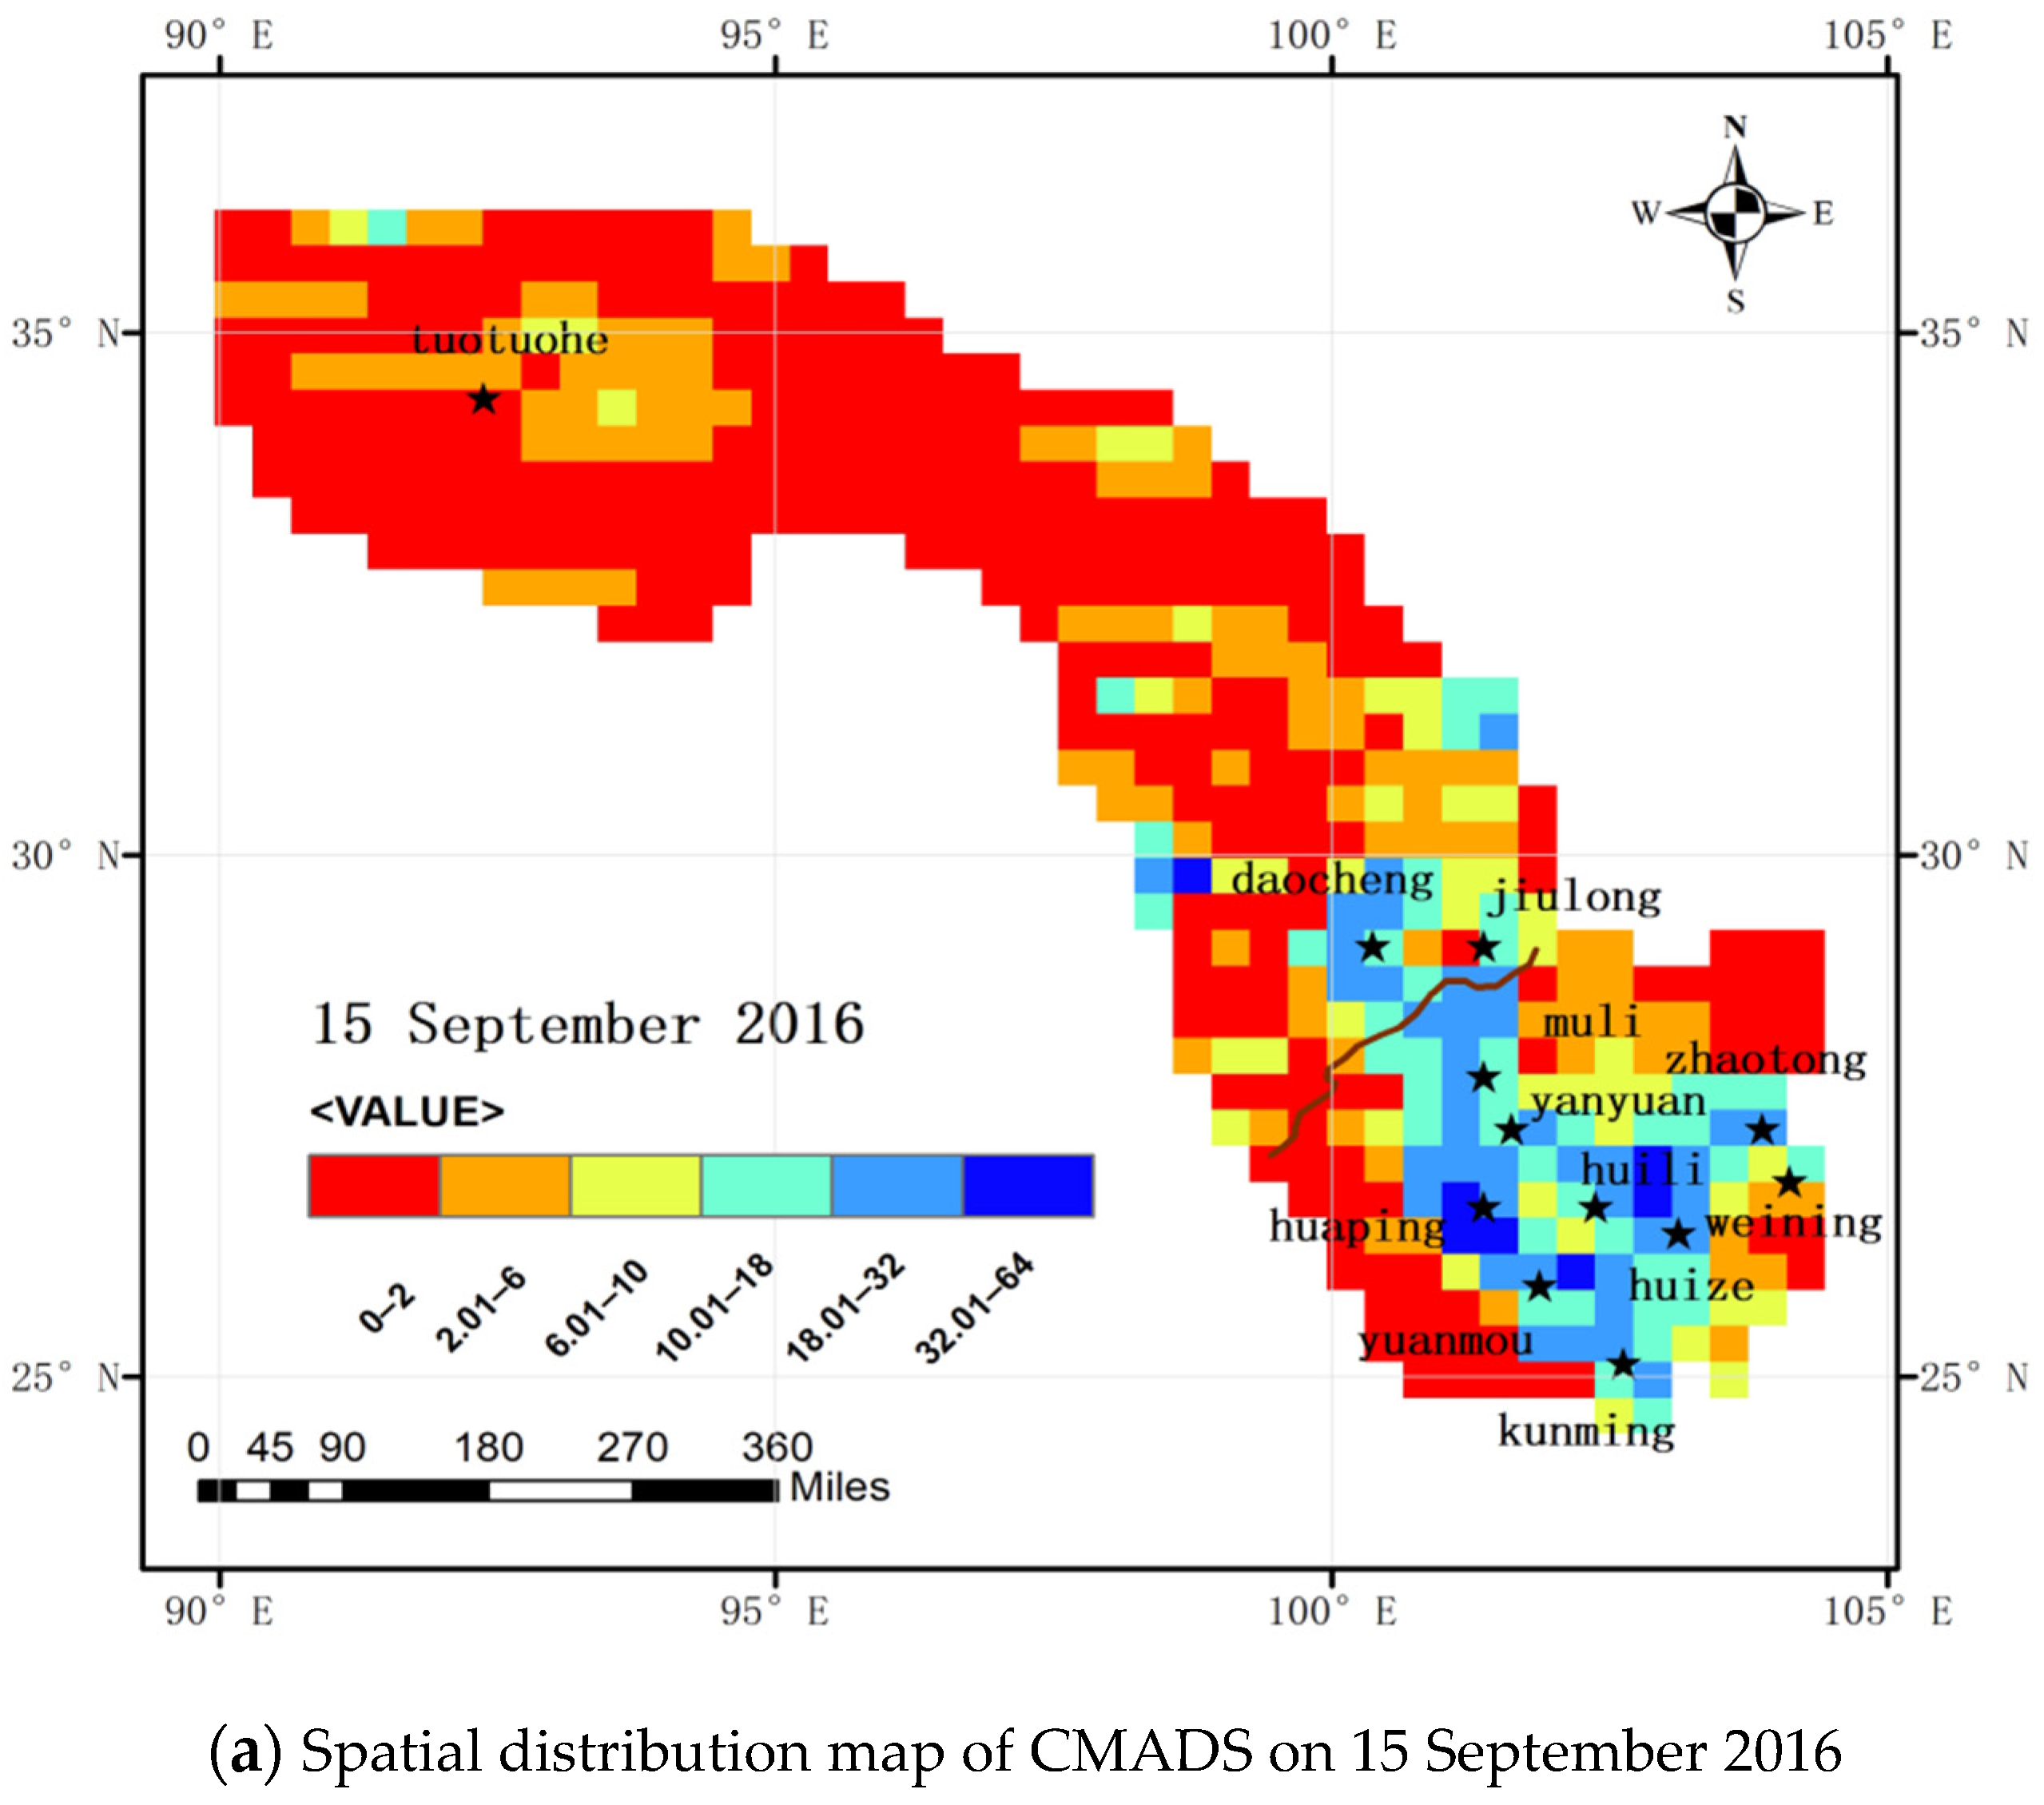
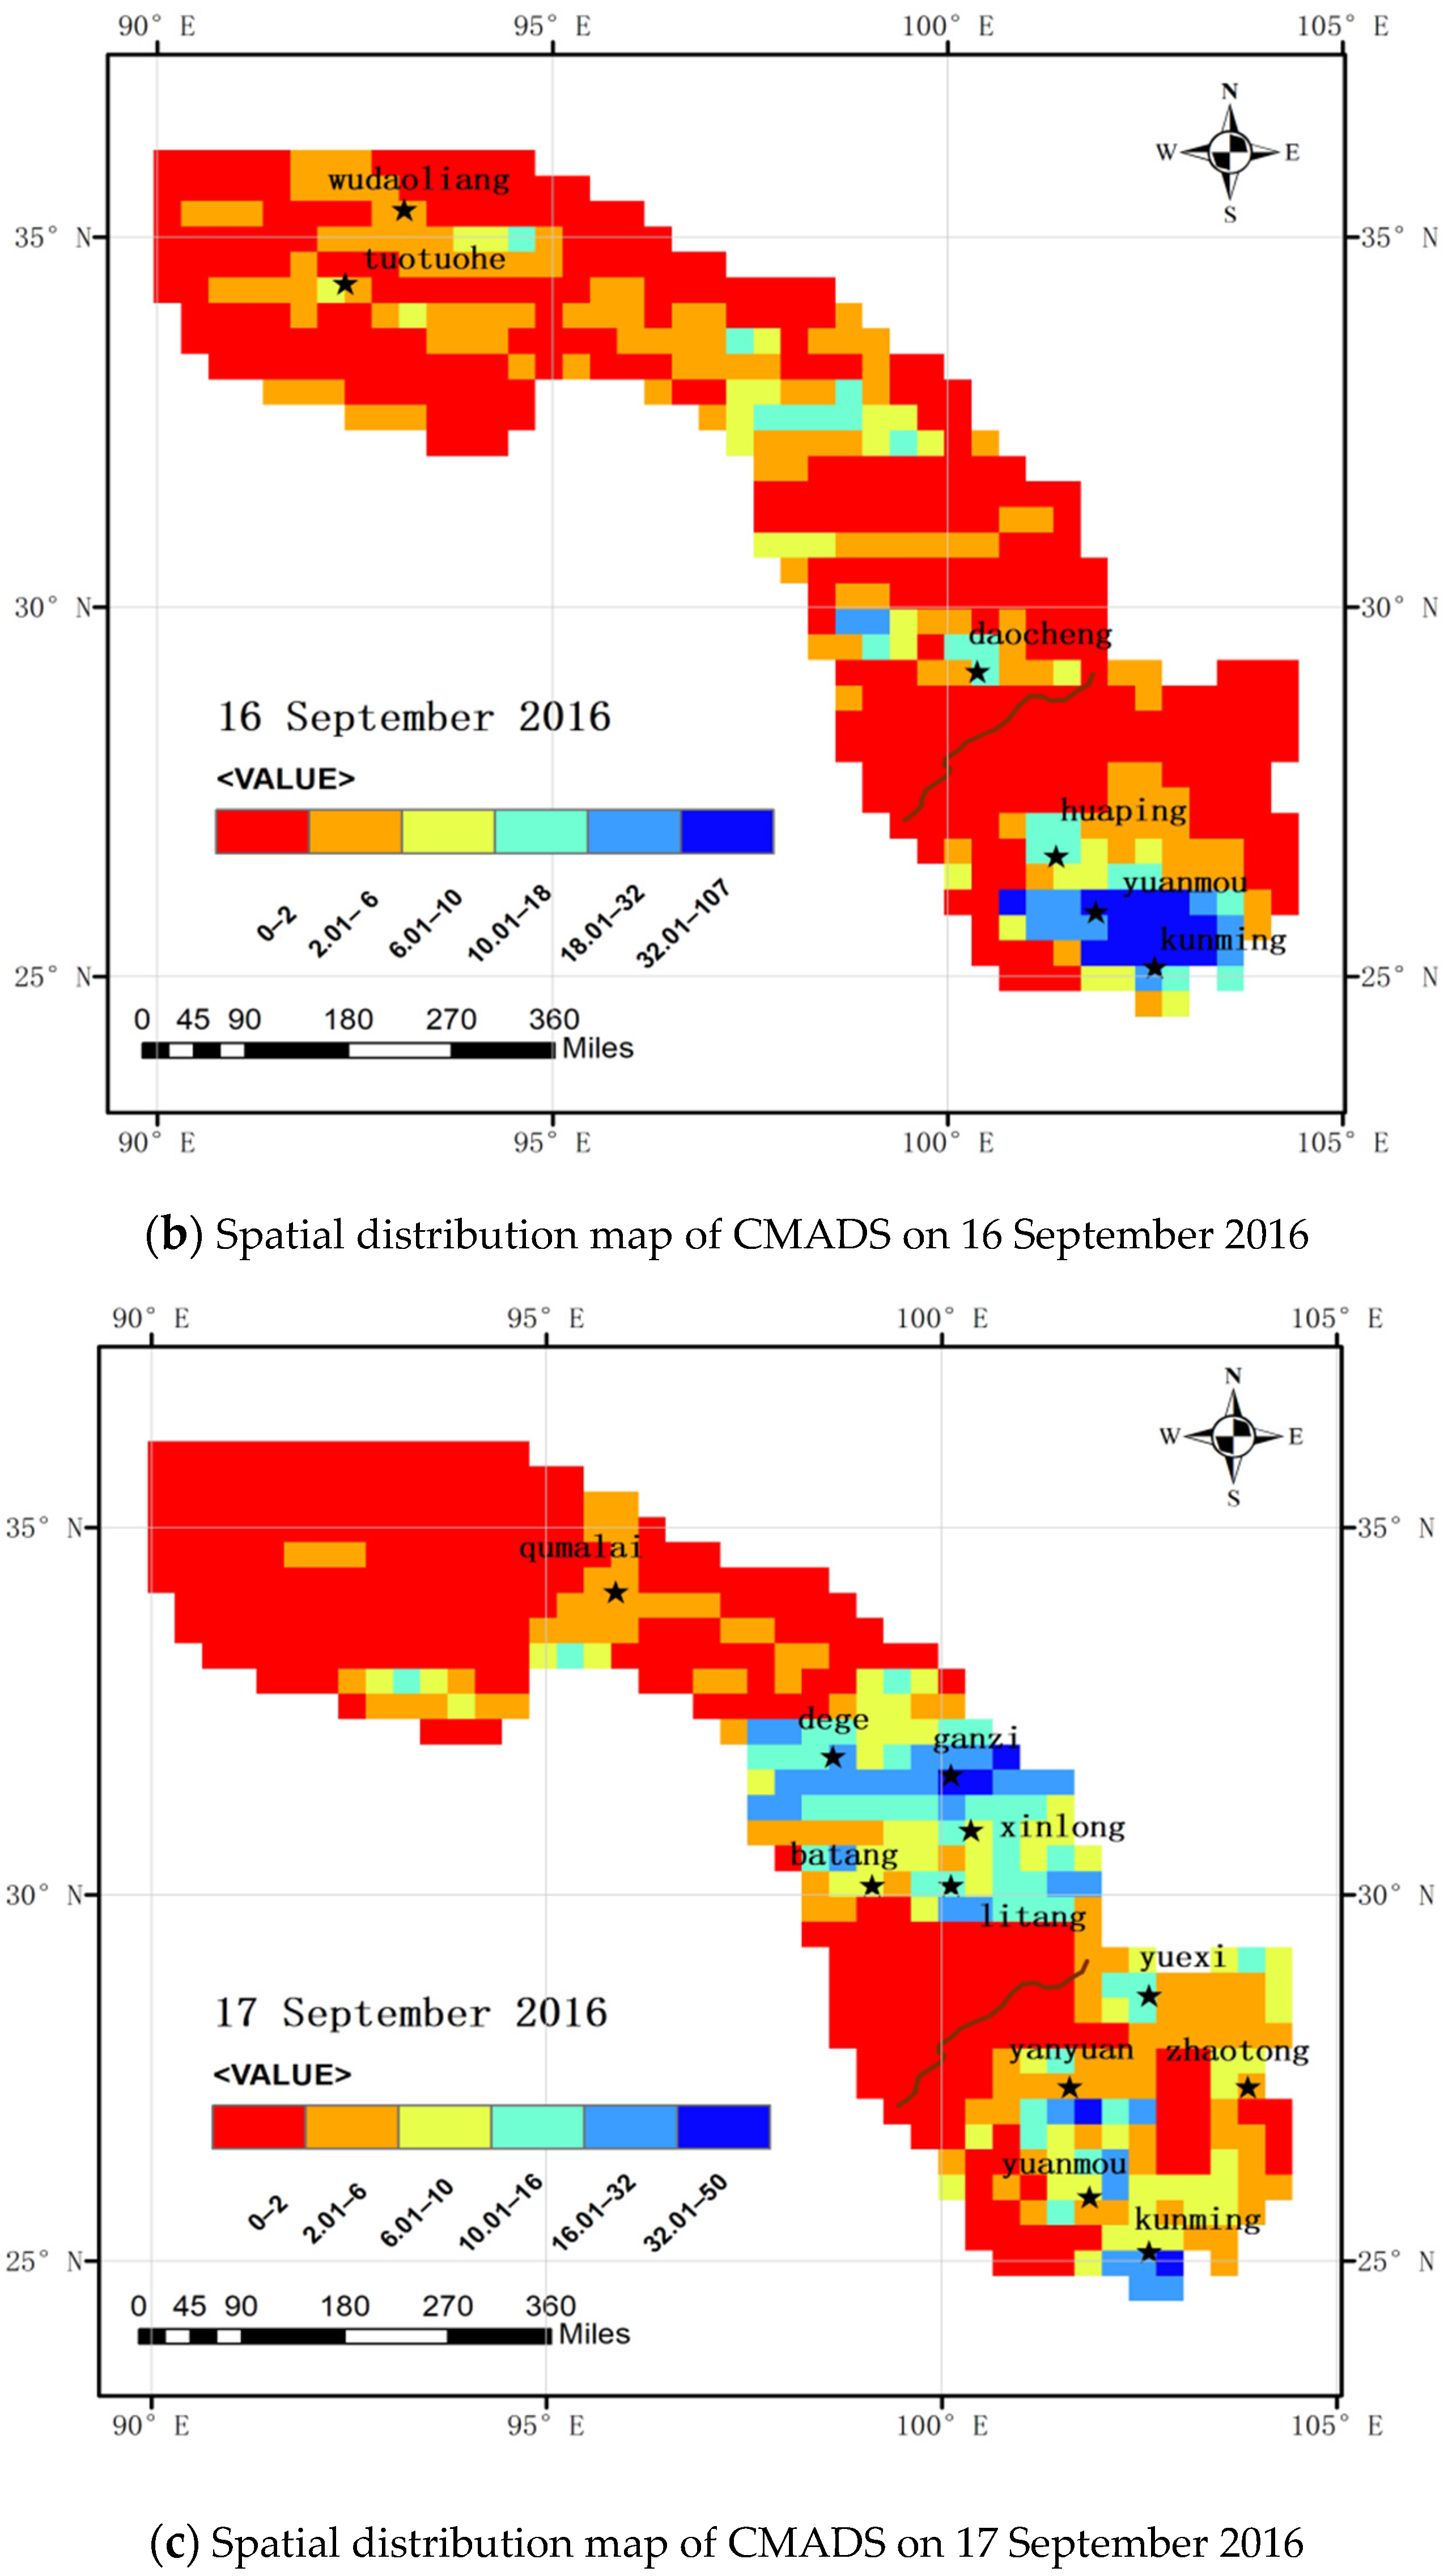
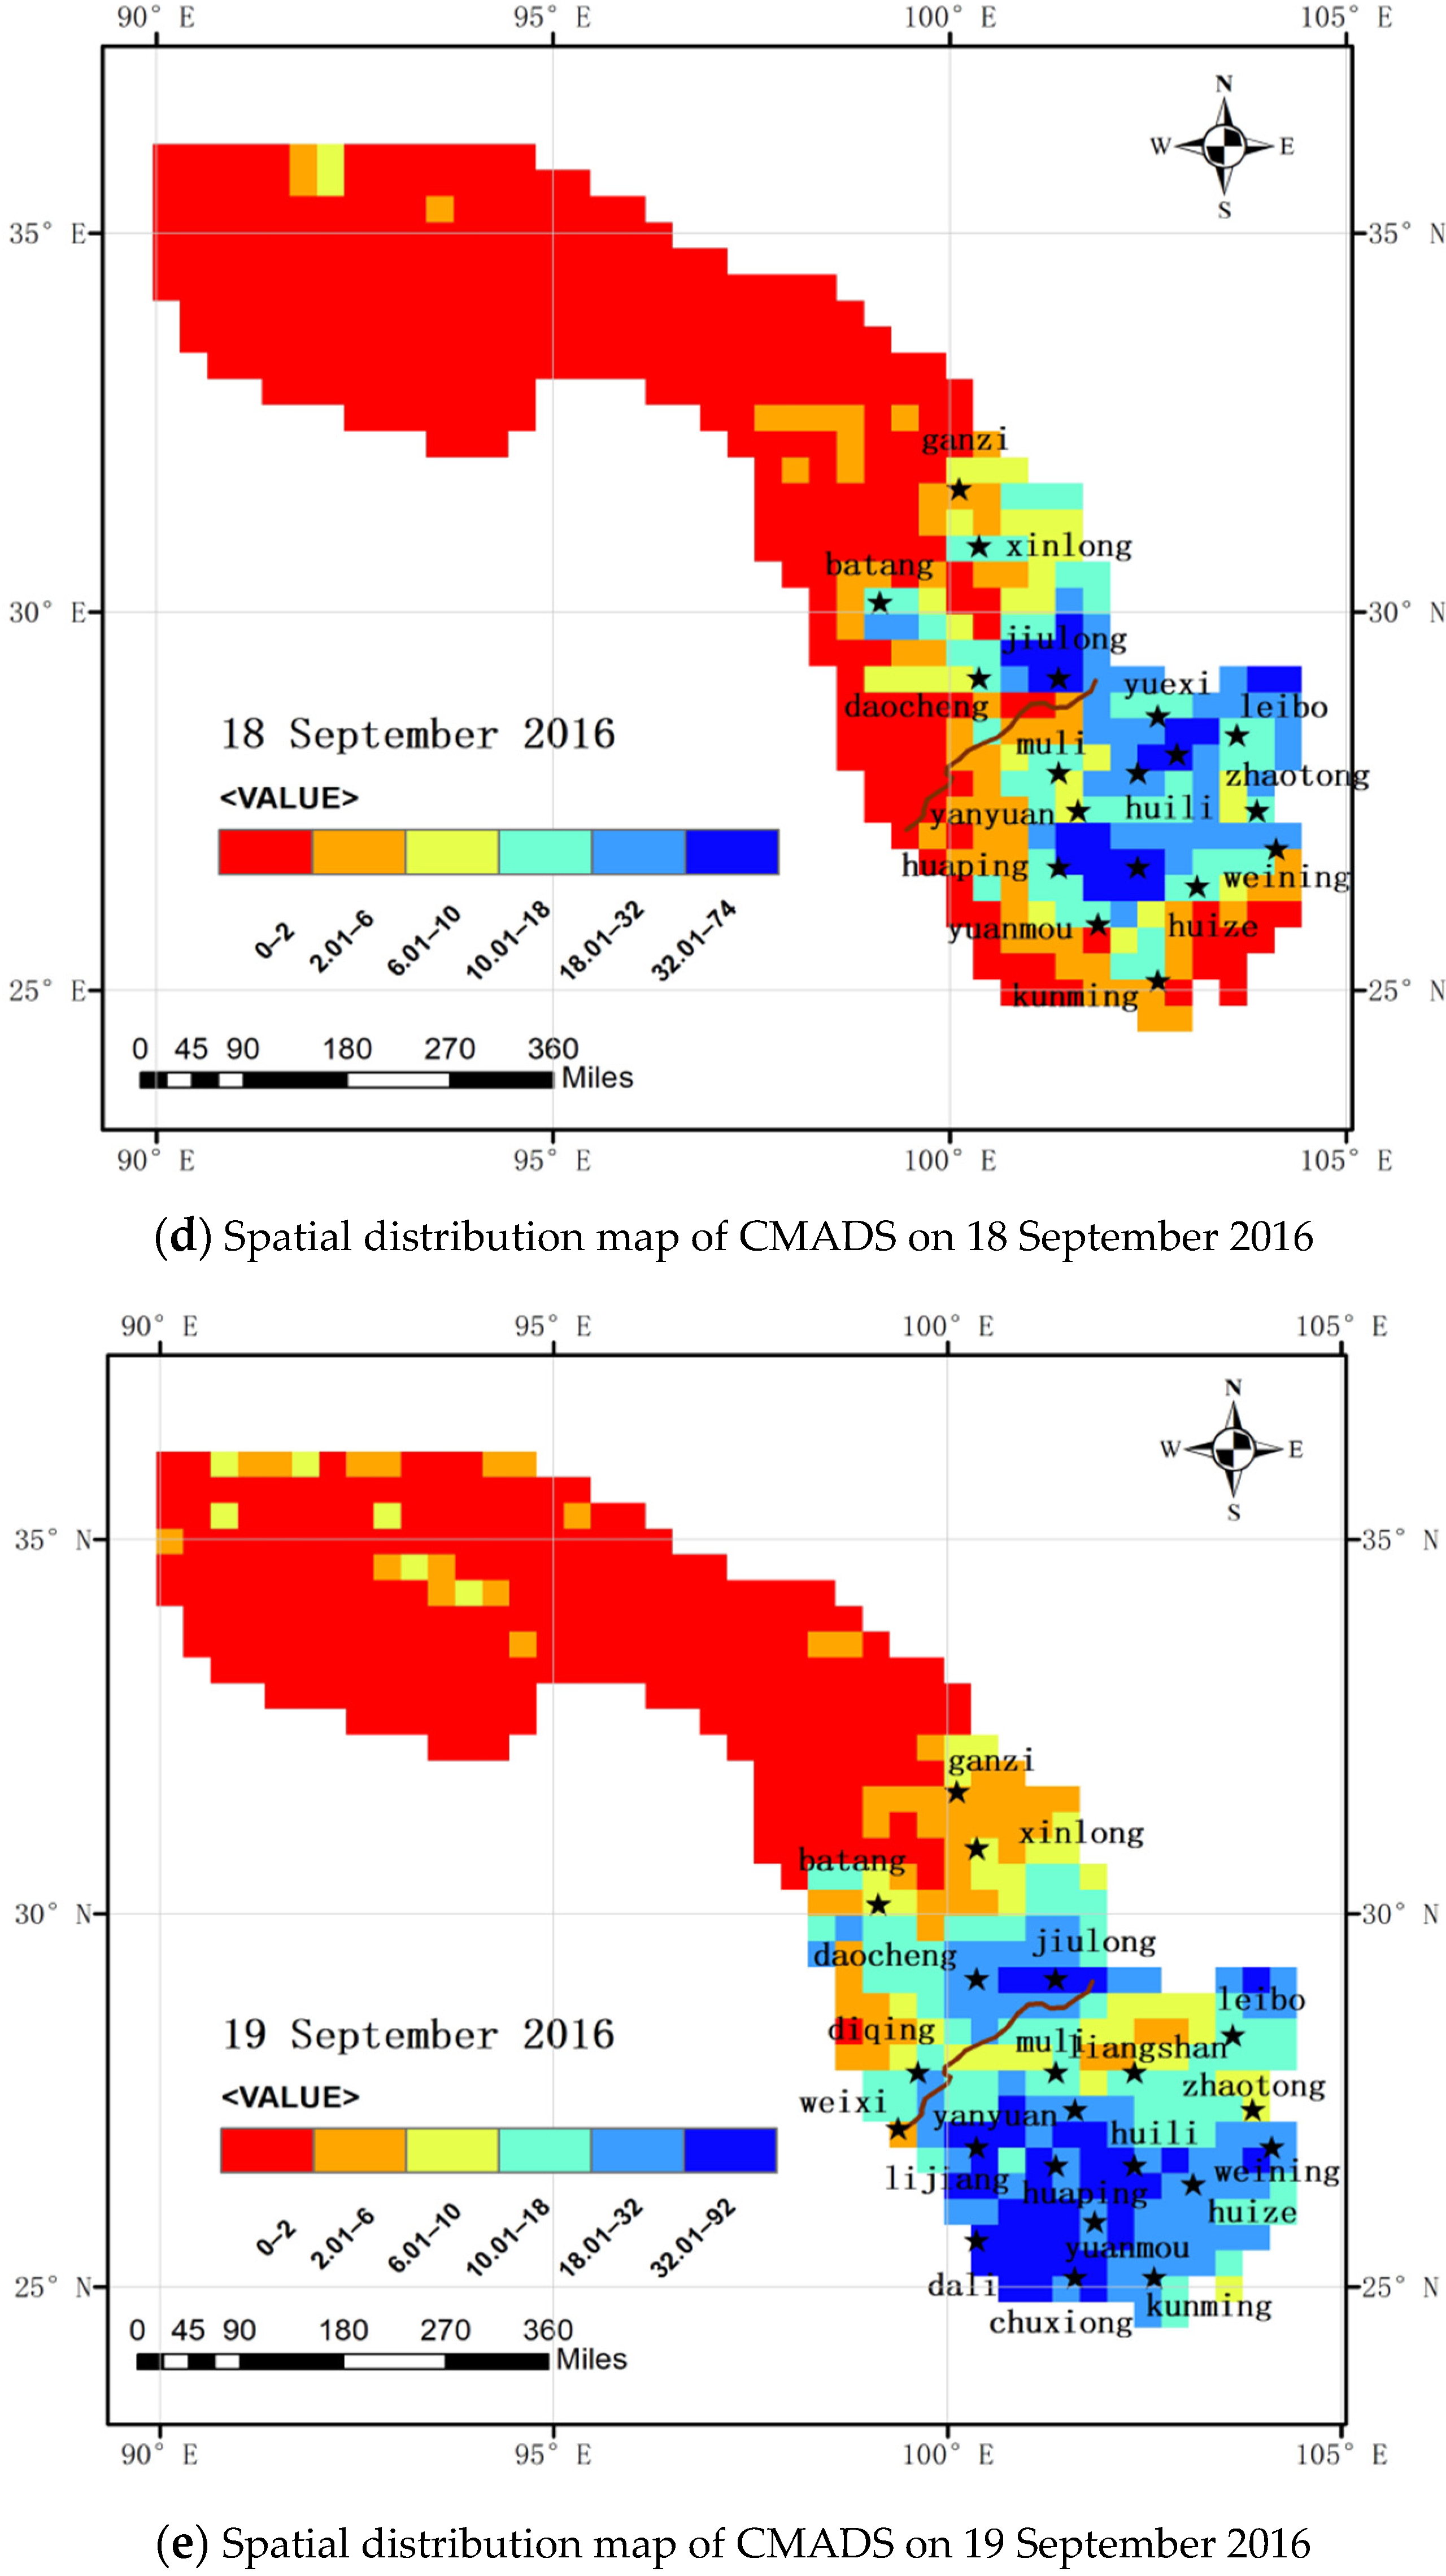
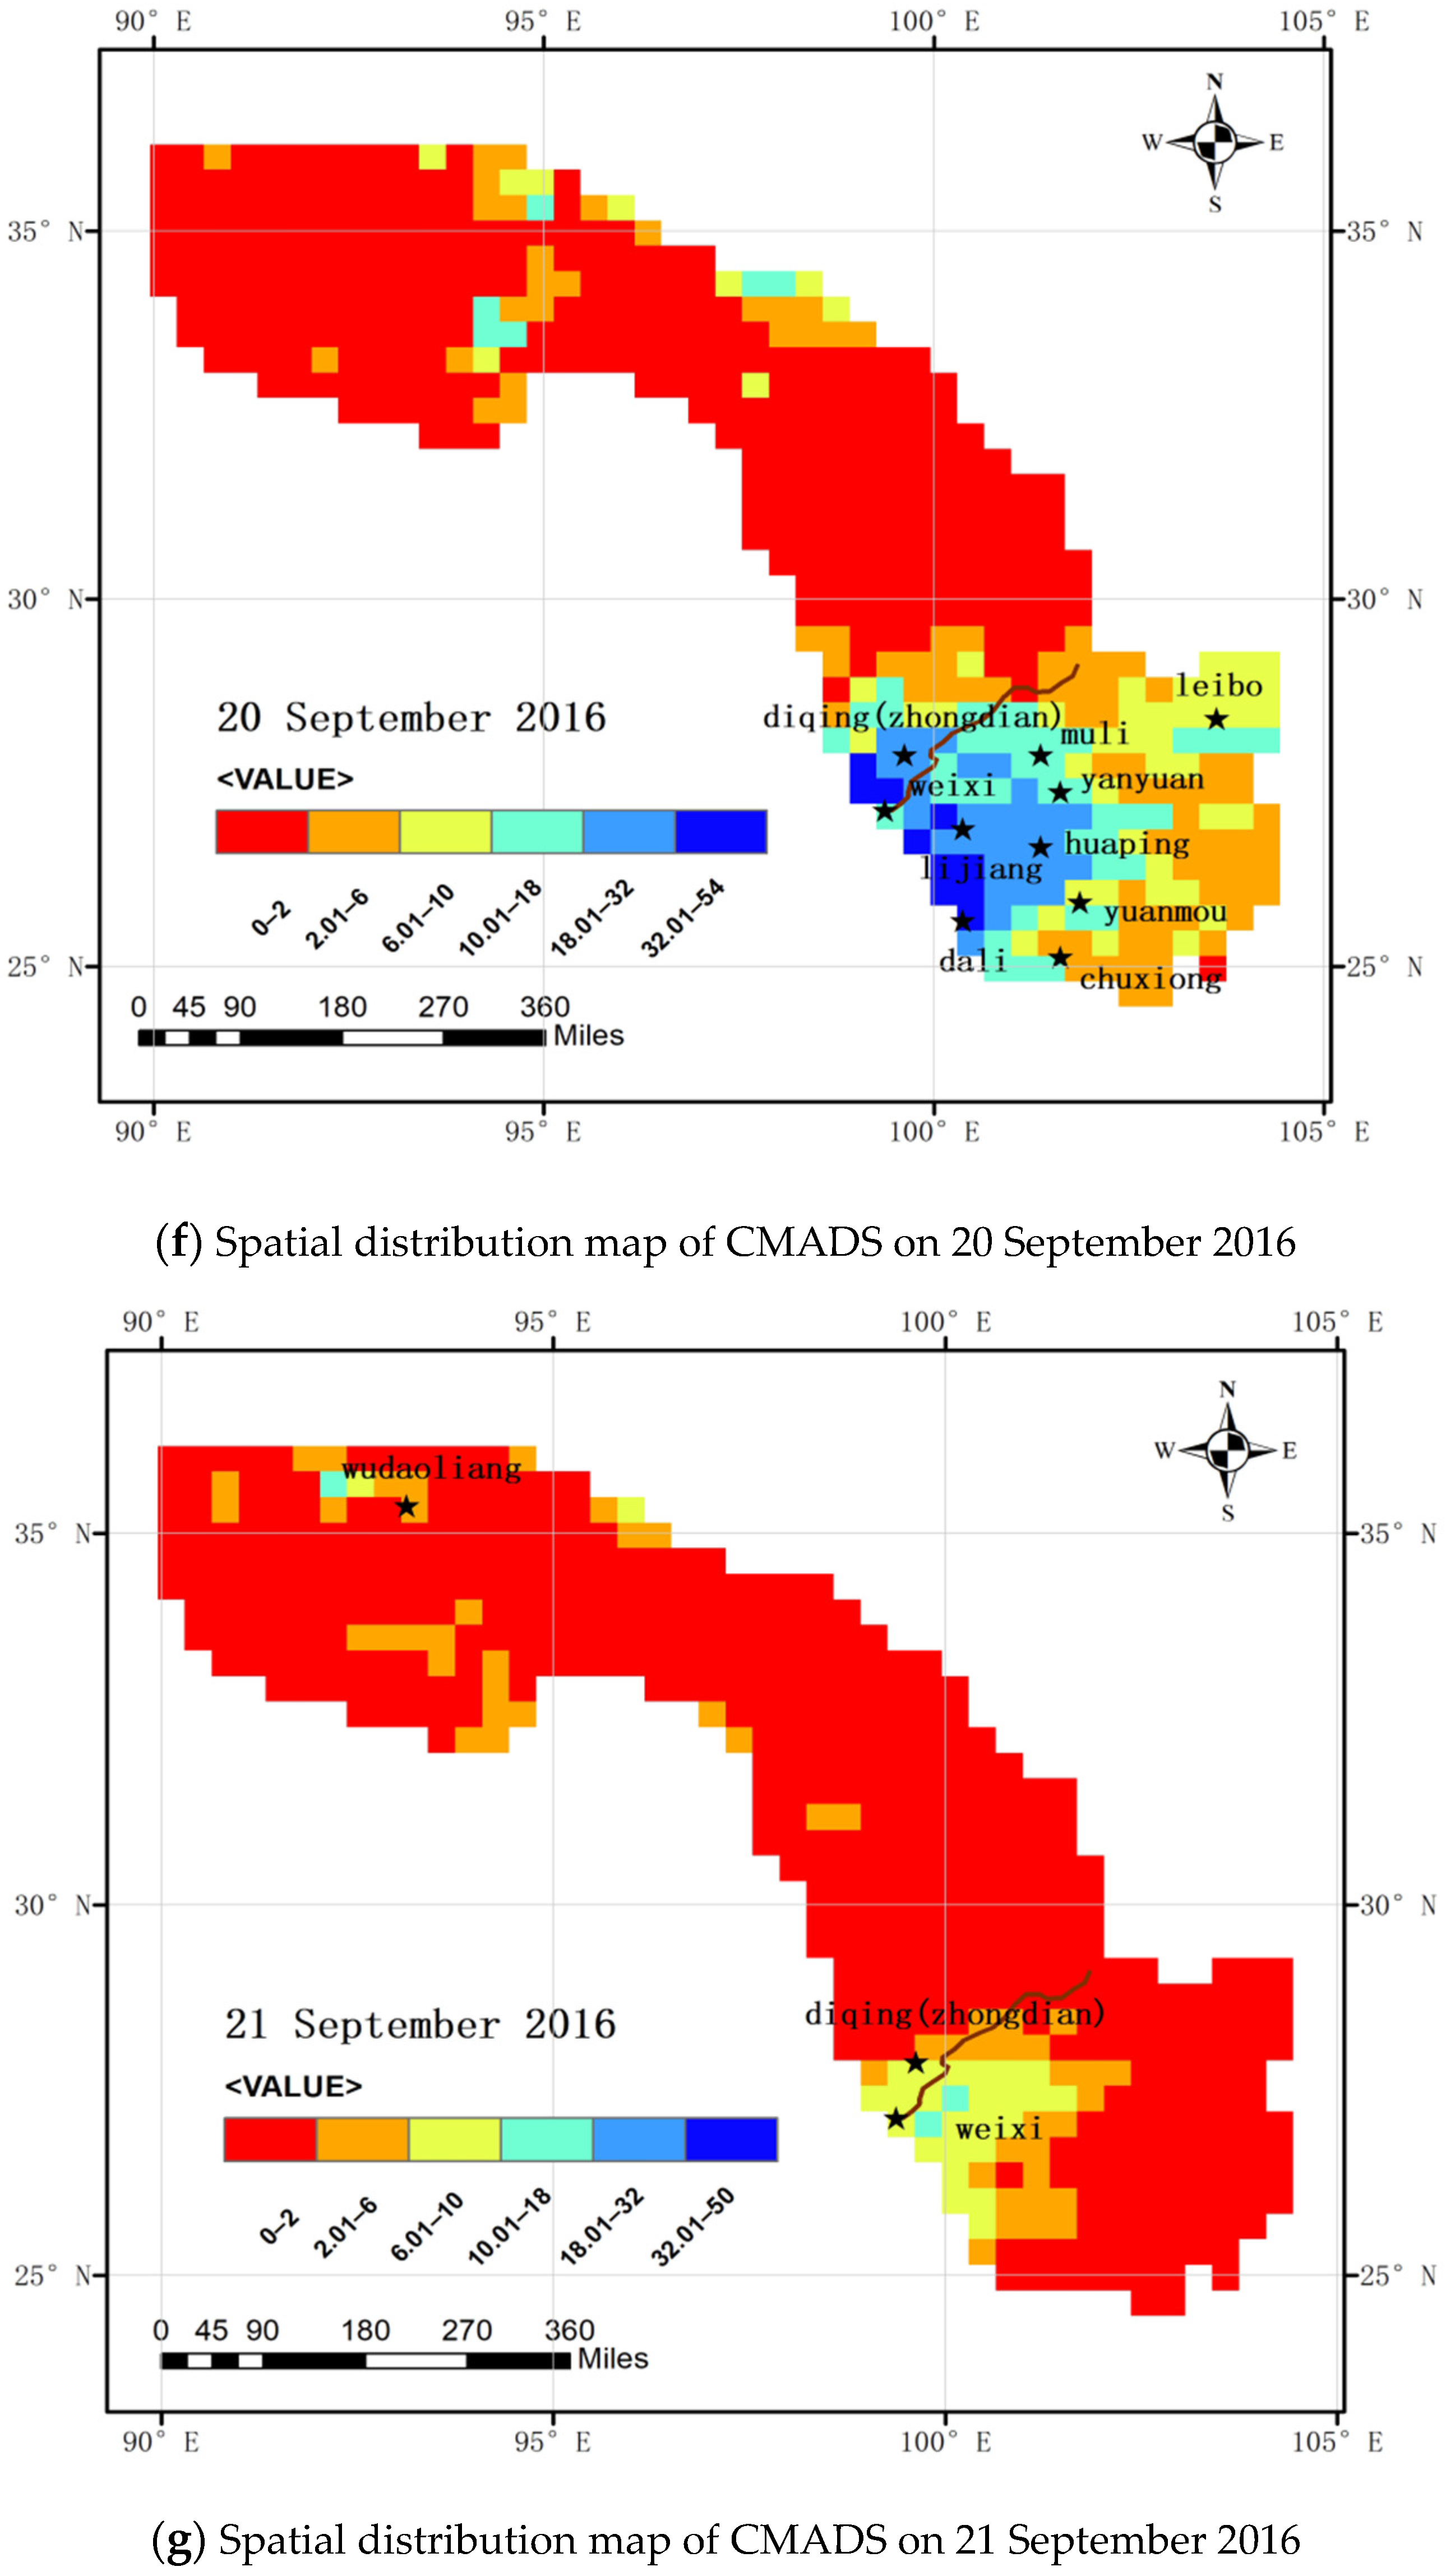
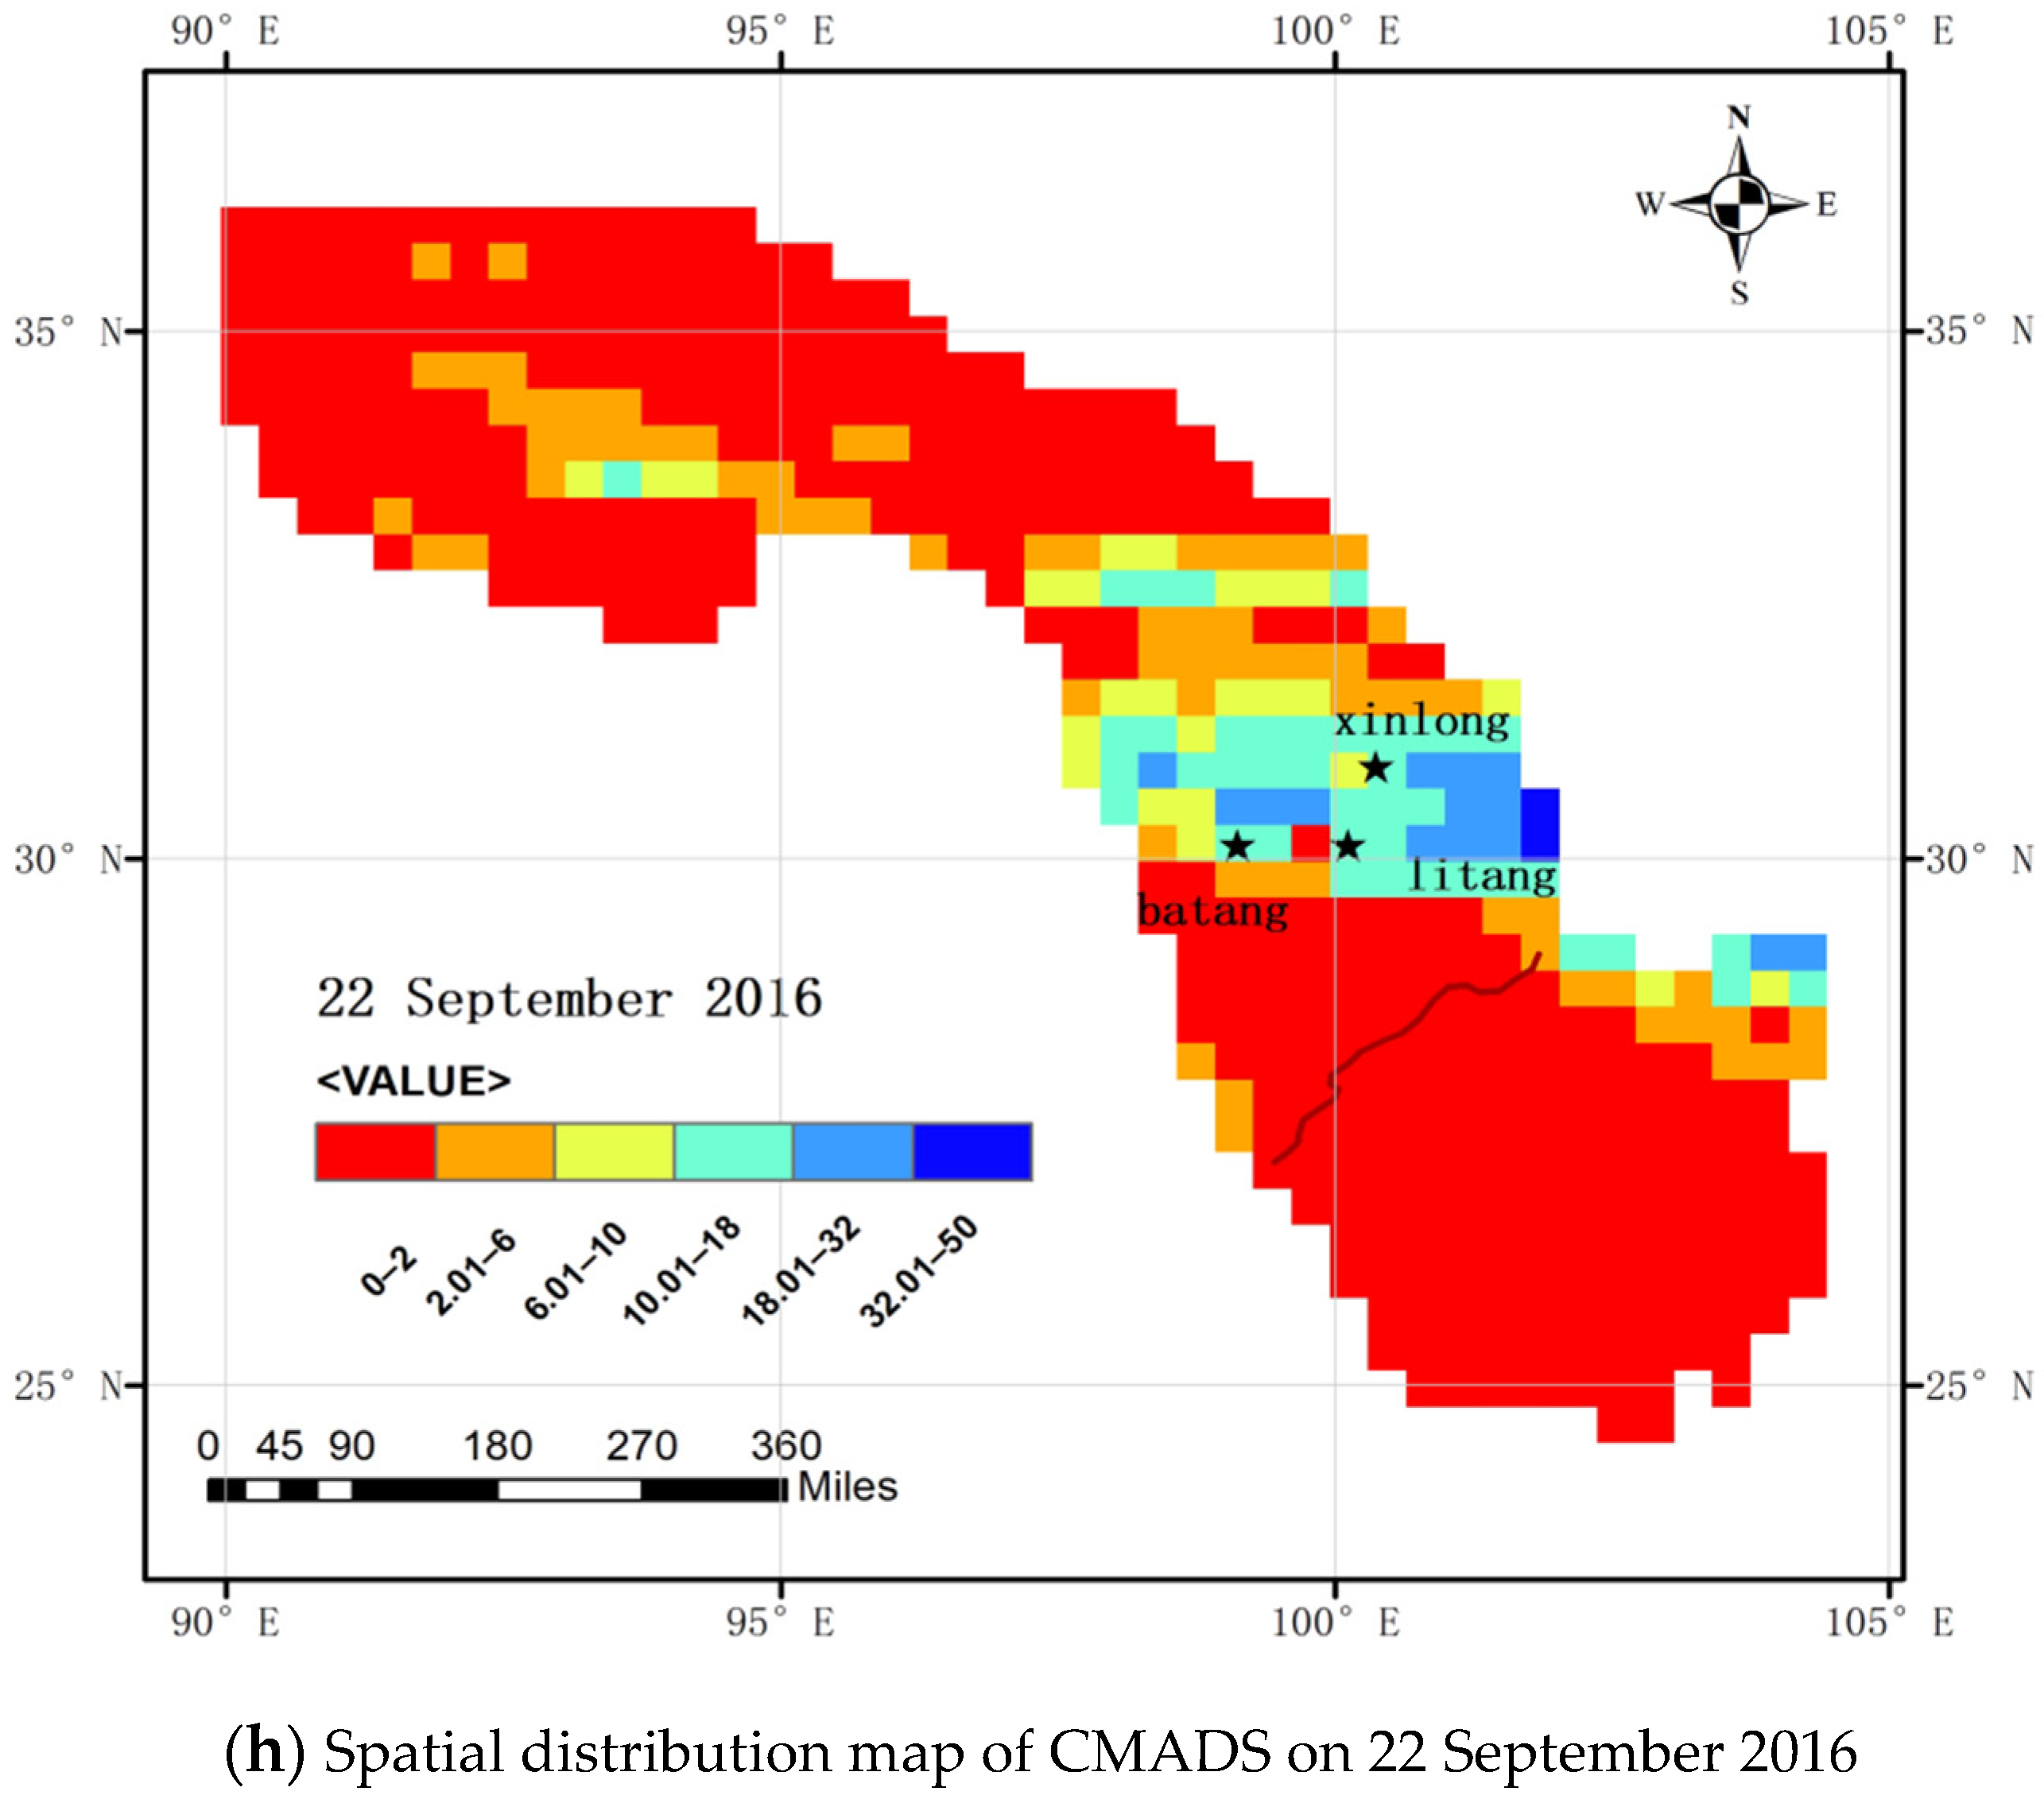
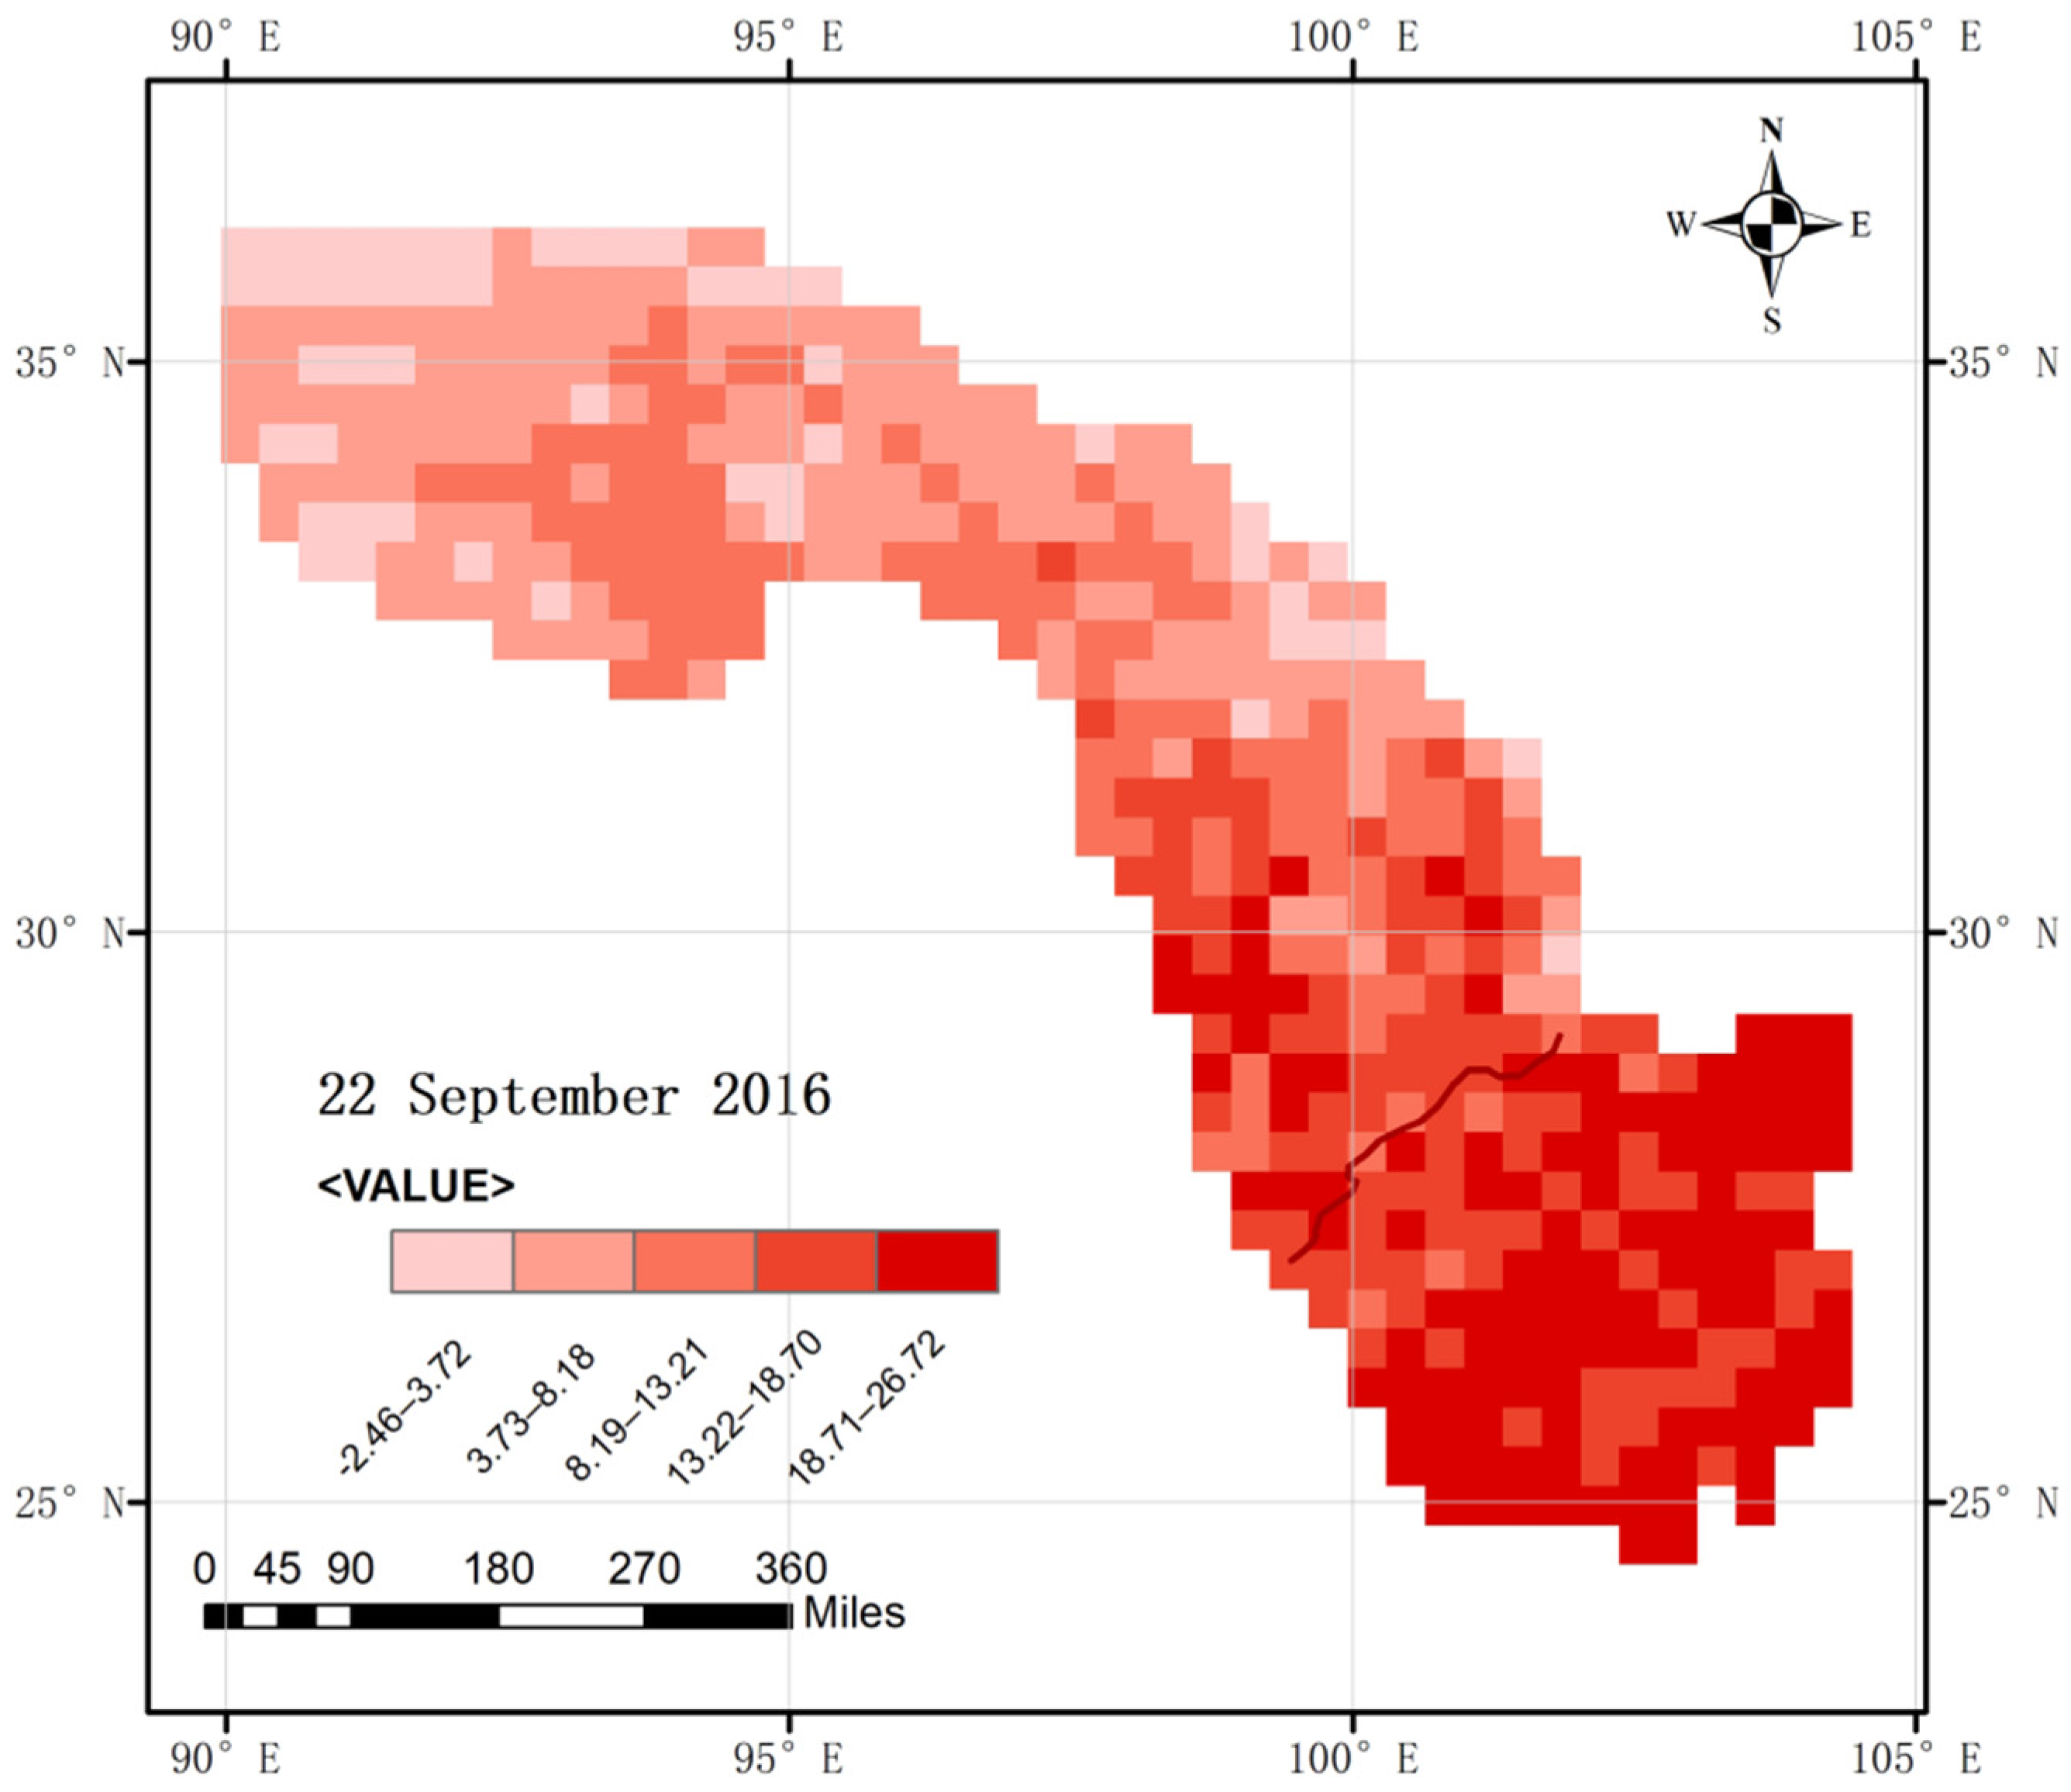
5.1. Analysis and Evaluation of the Typical Flood Event Response to Precipitation Extremes

A typical flood event occurred on 22 September 2016. Due to the large watershed area and the relatively long catchment transit time, the response to the precipitation that fell on the day of the flood event does not fully represent a typical flood event resulting from a precipitation extreme, and the lag in the response time of the flood to the precipitation should be considered [33,47,48,49,50,51,52,53]. In this section, the daily precipitation values from the CMADS grid occurring within eight days of the flood event (i.e., the day of the flood event and the previous seven days) and corresponding to the latitude and longitude of the 31 ground-based meteorological observation stations were extracted for use in the analysis and evaluation of the response of flood events to precipitation extremes, and a comparison to the 90th percentile precipitation threshold (arrange the daily precipitation of the year from large to small, and the daily precipitation is in the 90th percentile) of precipitation extremes that occurred at the stations in the same year is presented in Table 8. The spatial distribution of CMADS daily precipitation and extreme precipitation thresholds at each meteorological station within eight days of the occurrence of the typical flood event is shown in Figure 9. The spatial distribution map of precipitation in the basin within eight days of the typical flood event based on CMADS precipitation combined data and the meteorological stations where the daily precipitation exceeded the extreme precipitation threshold within the basin are shown in Figure 10.
The extreme precipitation thresholds calculated based on the observational data from the 31 meteorological stations in the basin ranged between 2.41 and 9.77 mm. From Table 8 and Figure 9 and Figure 10, it can be seen that when a typical flood event occurred, among the CMADS grid precipitation values corresponding to the latitude and longitude of the 31 ground-based meteorological observation stations in the study basin, the precipitation at the Xinlong, Batang, and Litang stations was greater than the extreme precipitation threshold. Most of the grids with a precipitation greater than 9.77 mm were located within the coordinate range of 29–32° N and 98–104° E. When this typical flood event occurred, the maximum grid precipitation was 41.31 mm, and the grids with a precipitation greater than 9.77 mm accounted for 10% of the total grids. It can also be seen that there was a large amount of precipitation at the basin outlet on the day of the flood event (22 September 2016). On 21 September 2016 (Figure 10g), the amount of rainfall in the basin was small. On 20 September 2016 (Figure 10f), a precipitation extreme occurred in the coordinate range of 25–30° N and 99–101° E. The precipitation of 10 meteorological stations, including Weixi, Lijiang, and Dali, occurring within this range exceeded the extreme precipitation threshold. On 19 September 2016 (Figure 10e), the precipitation extreme basically covered the entire range south of 29° N, and the precipitation at 21 meteorological stations, including Dali, Lijiang, and Chuxiong, exceeded the extreme precipitation threshold. On 18 September 2016 (Figure 10d), the precipitation extremes were mainly concentrated in the range east of 101°E and 26–30° N. Within this range, there were 18 stations with precipitation greater than the extreme precipitation threshold. The precipitation extremes basically occurred in the middle and lower part of the basin six to seven days before the occurrence of a typical flood event (Figure 10a,b), and there was no precipitation extreme near the basin outlet.
On the day of the typical flood event (22 September 2016), the precipitation extreme occurred at the basin outlet, but the precipitation at the basin outlet during the previous two days (21 and 20 September 2016) was low. From 18 to 20 September 2016, extreme precipitation centers were distributed throughout the middle and lower parts of the basin. On 21 September, the entire basin area received low precipitation. On 22 September the extreme precipitation area shifted northward. Comprehensive analysis revealed that typical flood events were mainly caused by the combined effects of precipitation extremes in the middle and lower parts of the basin, delayed flood propagation in the first five days, and heavy precipitation near the basin outlet on the day of the flood event.
Using the advantages of the continuous spatial distribution of the combined data, it is possible to quantitatively analyze the spatial characteristics of precipitation during typical flood events and the characteristics of precipitation changes over time. Based on this, the distribution of precipitation extremes in the basin during the occurrence of flood events can be better understood and analyzed, providing a variety of research methods for future evaluations of the impact of precipitation extremes on flood events in the basin.

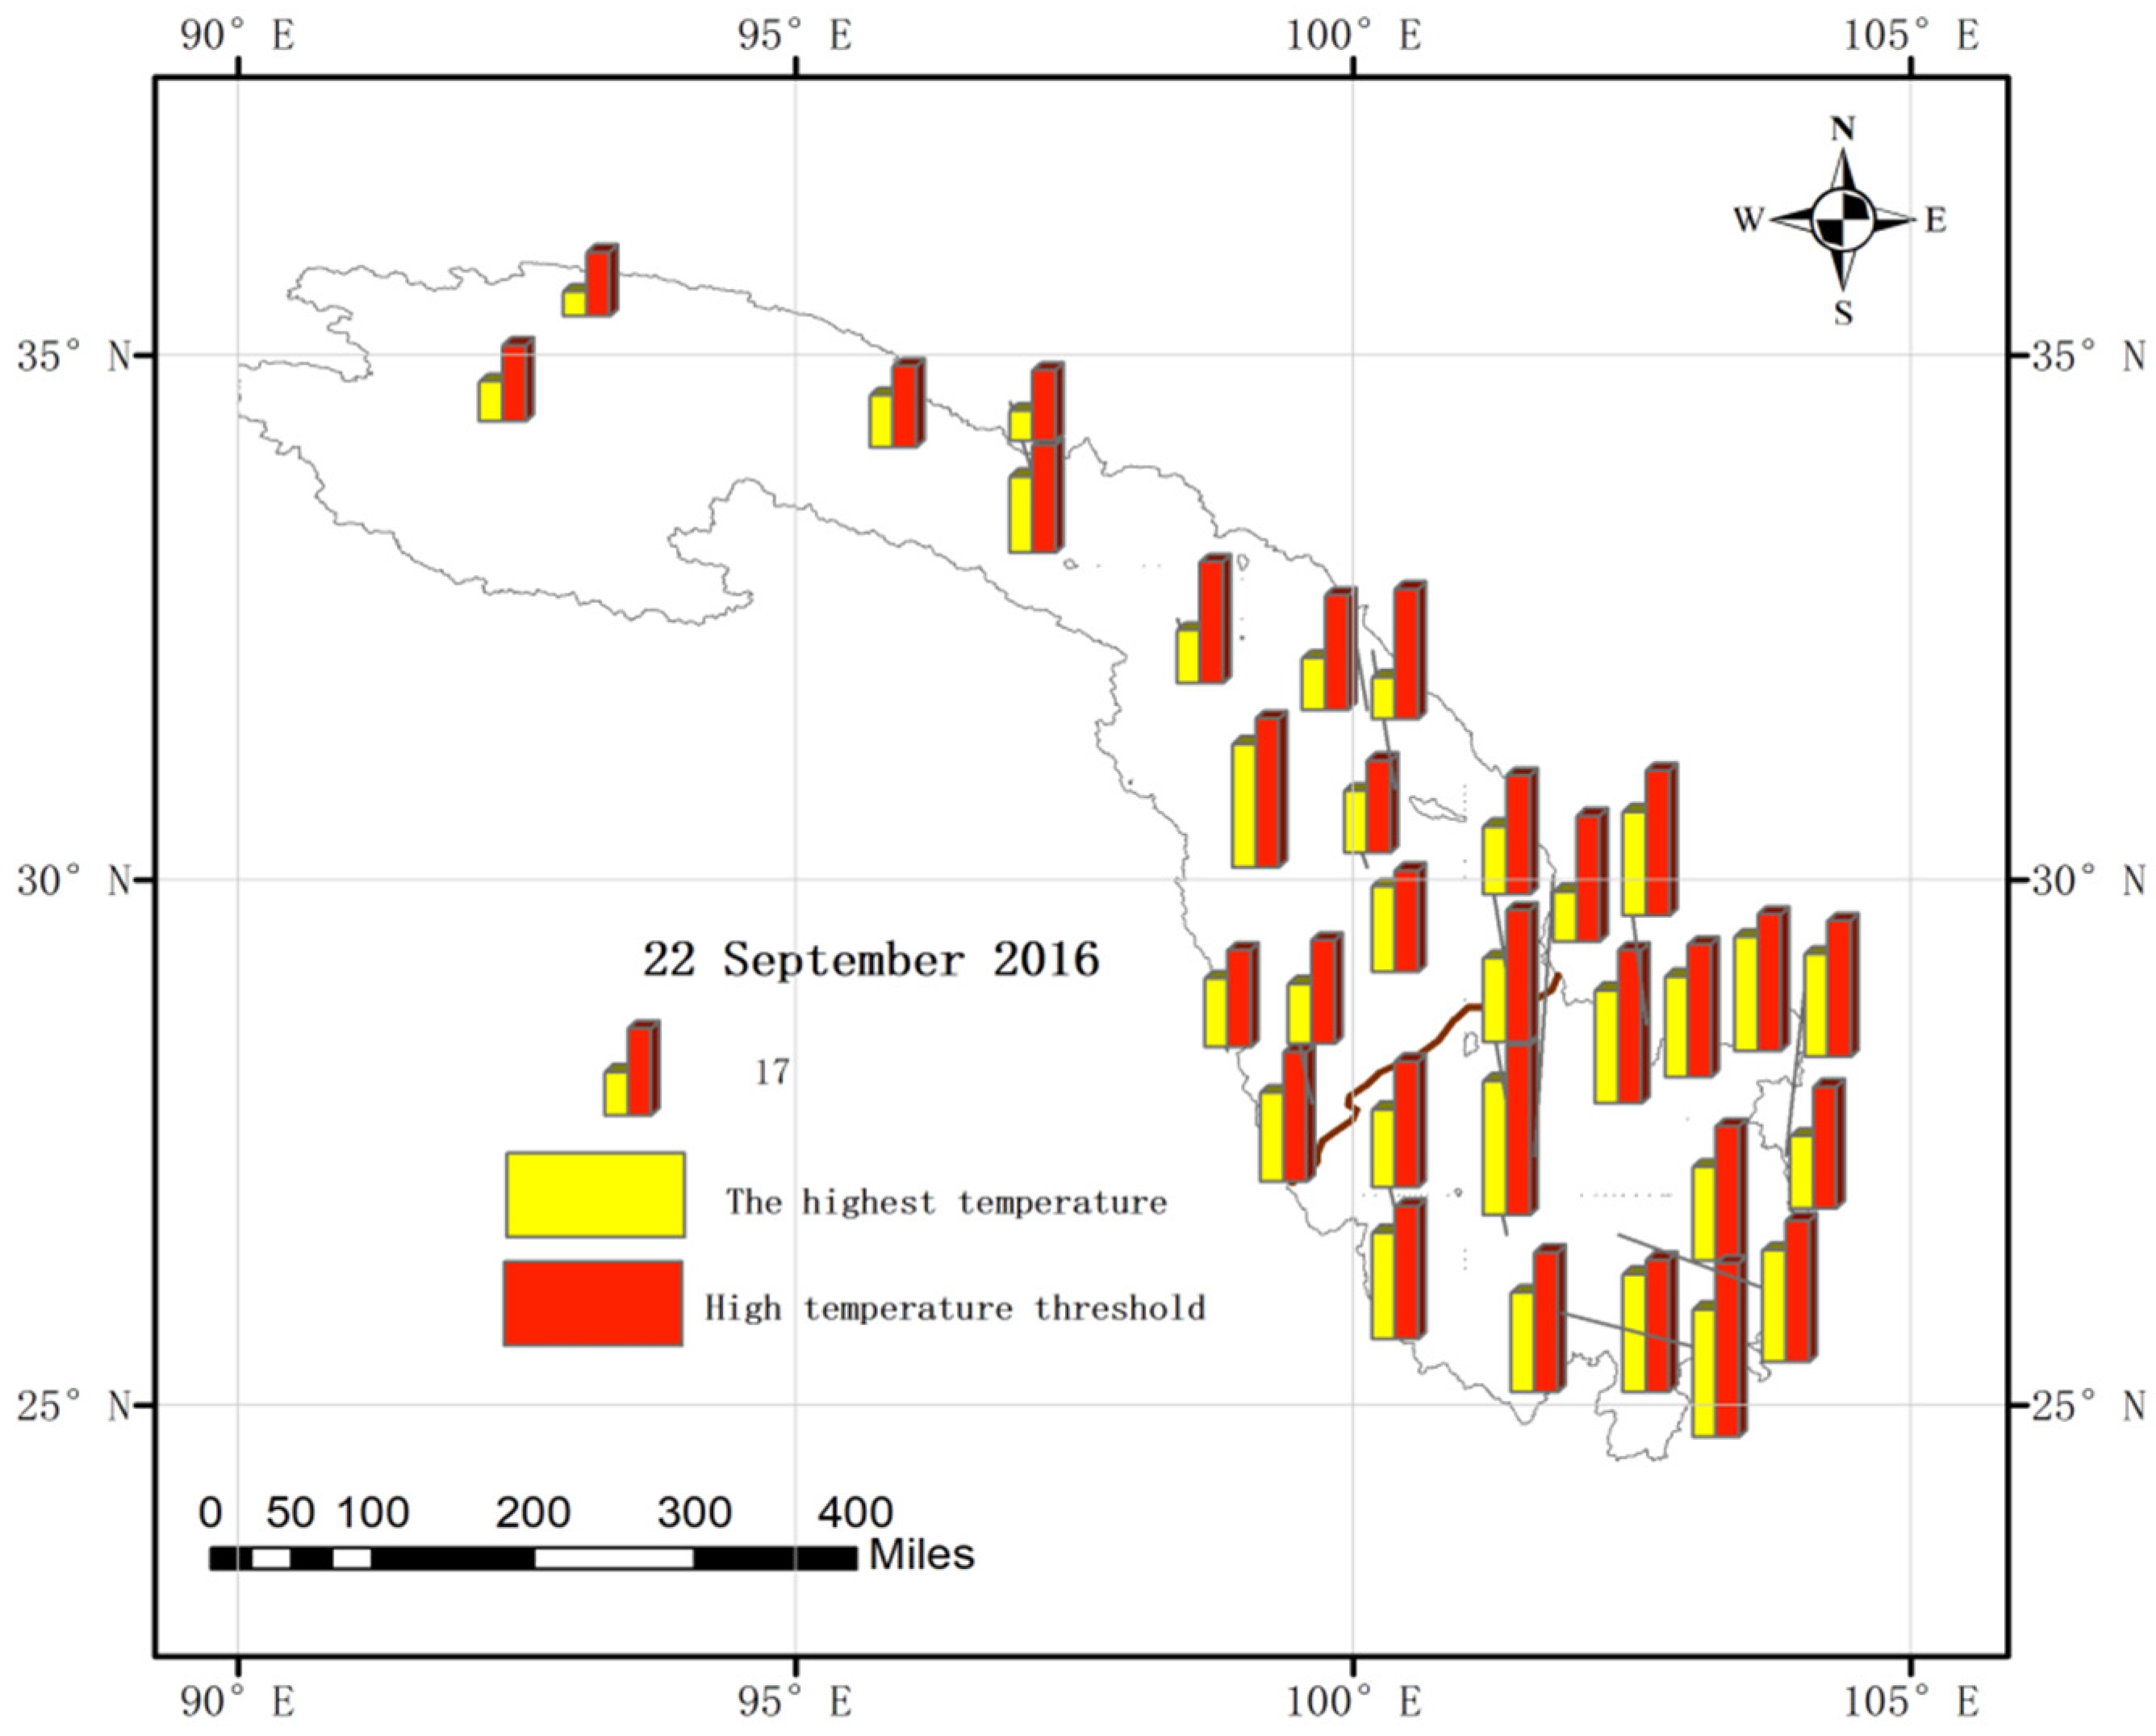
5.2. Analysis and Evaluation of the Response of Typical Flood Events to Temperature Extremes

The maximum temperature values of the CMADS grid on the day of the typical flood and corresponding to the latitude and longitude of the 31 ground-based meteorological observation stations in the study basin were extracted and studied, and a comparison between the average daily maximum temperature within eight days of the typical flood event and the extreme high temperature thresholds of the stations is shown in Table 9. A spatial distribution map of the CMADS maximum temperature at each meteorological station on the day of the typical flood event and the 90th percentile extreme high temperature threshold (arrange the daily temperature of the year from large to small, and the daily temperature is in the 90th percentile) for the year (2016) are shown in Figure 11, and a spatial distribution map of the basin maximum temperature based on CMADS temperature combined data is shown in Figure 12.
The extreme high temperature threshold within the basin, calculated based on the observational data of the meteorological stations, ranged between 12.76 °C and 34.37 °C. The maximum temperature on the day of the typical flood was also close to the average maximum temperature within eight days (the day of the flood event and the previous seven days), and the daily maximum temperature did not change considerably. From Table 9 and Figure 11 and Figure 12, it can be seen that the highest temperature on the day of the typical flood event was generally high, and the temperature of each individual station was relatively close to the extreme high temperature threshold of the station. For example, the highest temperature at Daocheng station on the day of the flood event was 17.12 °C, and the extreme high temperature threshold at this station was 20.65 °C; the highest temperature at Kunming on the day of the flood event was 23.43 °C, and the extreme high temperature threshold at this station was 26.85 °C. The maximum temperature at each station on the day of the typical flood event in the hydrological year 2016 reached 60–80% of the extreme high temperature threshold.
From the spatial distribution of the highest temperatures on the day of the typical flood event (Figure 12), it can be seen that the temperature in the downstream sub-basin on the day of the typical flood event was relatively high. The grids exceeding 13 °C accounted for 88% of the total downstream grids, the grids exceeding 20 °C accounted for 36% of the total grids in the downstream sub-basin, and the average temperature of the grids in the downstream sub-basin was 18.29 °C.
Watershed temperature plays an important role in flooding. Yin Jiabo et al. [54] mentioned in the thermodynamic response mechanism of extreme precipitation to climate change and flood effect in China that when the temperature is lower than Tpp (a certain limit value), extreme events continue to increase. When the temperature overheated (exceeding Tpp), both extreme precipitation and surface runoff showed a decreasing trend. The temperature at the time of a “typical flood” event was quantitatively analyzed by using fusion data. In this paper, the temperature at the time of a “typical flood event” was close to the highest temperature in history. Using grid data with densely distributed combined data, the spatial distribution characteristics of the maximum temperature of the entire basin when a typical flood event occurs can be analyzed, providing support for the study of the response of typical flood events to temperature extremes.

6. Conclusions

The extreme precipitation index values calculated based on the combined data were compared to those calculated based on the observational data. Although some index values were different and some indexes (such as R99p) exhibited poor performance, most of the indexes calculated based on the combined data did not show substantial deviations from the result calculated based on the observational data. In terms of overall performance, the datasets CMPA-H, CMADS, and GPM (IMERG) exhibited good performance, while TRMM (TMPA) performed slightly worse.
The extreme temperature indexes calculated based on the combined data were compared with those calculated based on the observational data. The calculated maximum monthly extreme high temperature TXx and minimum monthly extreme low temperature TNn index values are consistent with the results calculated by the observational data, and the use of combined data in calculating the two indexes is suitable. For the other three daily temperature extreme indexes, the results calculated based on the combined data showed the larger deviations than the previous index. Once again, the performance of the CMADS dataset was more consistent with the results calculated based on the observational data, and the accuracy was higher.
The extreme climate indexes, calculated based on the combined data and the observational data, were compared within the basin. Among these, for stations with maximum index values calculated based on the combined data, these values are consistent with the result calculated based on the observational data. However, some of the results showed regular deviations, which may be due to the spatial characteristics of the combined data or errors in the correction.
For stations within the basin with the maximum extreme temperature indexes calculated based on the CMADS combined dataset, these values are consistent with the results calculated based on the observational data, and the maximum error was within 3 °C; for stations with the calculated minimum extreme temperatures and stations with the maximum daily extreme temperature indexes, these values also show good consistency with the results calculated based on the observational data, and CMADS shows a relatively high accuracy.
The response of typical flood events to extreme precipitation was analyzed and evaluated, and the spatial distribution of the precipitation of the combined dataset was used to quantitatively analyze the response of typical flood events to the precipitation extremes. Typical flood events were mainly caused by factors such as lagging propagation of strong floods upstream of the basin.
In summary, it is feasible to use the combined data to calculate the extreme climate indexes in the Jinsha River Basin, especially in areas with no or sparse data.

Author Contributions

Conceptualization, D.G. and S.C.; methodology, D.G.; software, C.L.; validation, D.G., C.L. and J.X.; formal analysis, D.G.; investigation, C.L.; resources, S.C.; data curation, D.G.; writing—original draft preparation, D.G.; writing—review and editing, S.C.; visualization, D.G. All authors have read and agreed to the published version of the manuscript.

Funding

Supported by the open Research Fund of State Key Laboratory of Simulation and Regulation of Water Cycle in River Basin (China Institute of Water Resources and Hydropower Research), Grant NO: IWHR-SKL-KF202007.

Data Availability Statement

Data are available upon request to the authors.

Conflicts of Interest

The authors declare no conflict of interest.

References

  1. Yu, J.; Xu, T. Flood and waterlogging in the Yangtze River Basin in 2016. Yangtze River 2017, 48, 78–80. (In Chinese) [Google Scholar]
  2. Du, H. Probabilistic and Statistical Analysis of Extreme Flood in Huaihe River Basin under Climate Change. Ph.D. Thesis, Wuhan University, Wuhan, China, 2014. (In Chinese). [Google Scholar]
  3. Cai, W. Trend Characteristics and Extreme Distribution of Extreme Climatic Events in China. Ph.D. Thesis, University of International Business and Economics, Beijing, China, 2016. (In Chinese). [Google Scholar]
  4. Wang, L.; Liu, G.; Ren, Y. Analysis on the trend of extreme temperature and precipitation in tianjin. J. Irrig. Drain. 2016, 35, 100–104. (In Chinese) [Google Scholar]
  5. Wang, Q. Changes of Extreme Temperature and Precipitation Events over the Yangtze River Basin from 1962 to 2011. Ph.D. Thesis, Northwest Normal University, Gansu, China, 2014. [Google Scholar]
  6. Shi, G. Temporal and Spatial Characteristics of Climate Change in the Yangtze River Basin during 1970–2014; Jiangxi Normal University: Jiangxi, China, 2016. [Google Scholar]
  7. Zhang, C. Comparative study on climate characteristics of dry-hot valley of Jinsha River and dry-hot valley of upper Minjiang River; Chinese Academy of Forestry: Beijing, China, 2009. [Google Scholar]
  8. Tao, L. Study on the characteristics of extreme heavy rainfall on June 28 at Baihetan Hydropower Station in the lower jinsha River. Plateau Mt. Meteorol. Res. 2020, 40, 30–35. [Google Scholar]
  9. Zhang, J. Temporal and spatial distribution of extreme rainfall events in the Yangtze River Basin. Yangtze River 2019, 50, 81–86. [Google Scholar]
  10. Guo, G. Spatial and temporal distribution of extreme precipitation in summer over the Yangtze River Basin. J. Arid. Meteorol. 2021, 39, 235–243. [Google Scholar]
  11. Wang, C.; Liu, G.; Sun, R. Characteristics of extreme precipitation in Shandong Province from 1951 to 2013. Yellow River 2016, 38, 5–9. (In Chinese) [Google Scholar]
  12. O’brien, N.L.; Burn, D.H. A nonstationary peaks-over-threshold approach for modelling daily precipitation with covariate-dependent thresholds. Can. Water Resour. J. 2018, 43, 281–304. [Google Scholar] [CrossRef]
  13. Andelkovic, G.; Jovanovic, S.; Manojlovic, S.; Samardzic, I.; Zivkovic, L.; Sabic, D.; Gataric, D.; Dzinovic, M. Extreme Precipitation Events in Serbia: Defining the Threshold Criteria for Emergency Preparedness. Atmosphere 2018, 9, 188. [Google Scholar] [CrossRef] [Green Version]
  14. Biondi, D.; Greco, A.; De Luca, D.L. Fixed-area vs storm-centered Areal Reduction factors: A Mediterranean case study. J. Hydrol. 2021, 595, 125654. [Google Scholar] [CrossRef]
  15. Kim, J.; Lee, J.; Kim, D.; Kang, B. The role of rainfall spatial variability in estimating areal reduction factors. J. Hydrol. 2019, 568, 416–426. [Google Scholar] [CrossRef]
  16. Thorndahl, S.L.; Nielsen, J.E.; Rasmussen, M.R. Estimation of Storm-Centred Areal Reduction Factors from Radar Rainfall for Design in Urban Hydrology. Water 2019, 11, 1120. [Google Scholar] [CrossRef] [Green Version]
  17. De Luca, D.L.; Versace, P. Diversity of Rainfall Thresholds for early warning of hydro-geological disasters. Adv. Geosci. 2017, 44, 53–60. [Google Scholar] [CrossRef] [Green Version]
  18. Al, A.; Fox, J.; Snyder, M. Evaluation of climate modeling factors impacting the variance of streamflow. J. Hydrol. 2016, 542, 125–142. [Google Scholar]
  19. Yin, J.; Gentine, P.; Zhou, S. Large increase in global storm runoff extremes driven by climate and anthropogenic changes. Nat. Commun. 2018, 9, 1–20. [Google Scholar] [CrossRef] [Green Version]
  20. Chen, Y.; Cheng, W.; Hu, X. Response of extreme hydrological events to extreme climate in the Shule River Basin. Plateau Meteorol. 2019, 38, 583–592. (In Chinese) [Google Scholar]
  21. Ma, Y.; Huang, Y.; Liu, T. Change and Climatic Linkage for Extreme Flows in Typical Catchments of Middle Tianshan Mountain, Northwest China. Water 2018, 10, 1061. [Google Scholar] [CrossRef] [Green Version]
  22. Chen, J.; Xiang, T. Comparative analysis of precipitation and runoff response in Jinsha River basin before and after the impoundment of the Three Gorges Project. J. Yellow River Conserv. Tech. Inst. 2017, 29, 1–3. (In Chinese) [Google Scholar]
  23. Lu, L.; Wang, Q.; Wang, G. The relationship between climate change trend and runoff response in Jinsha River Basin in recent 60 years. J. North China Univ. Water Resour. Electr. Power 2016, 37, 16–21. (In Chinese) [Google Scholar]
  24. Li, J.; Chen, L.; Li, B. Analysis of Weather Characteristics of Heavy Precipitation in Jinshajiang River Basin. Yangtze River 2013, 44, 36–39. (In Chinese) [Google Scholar]
  25. Yang, L.; Mei, Y.; Ye, Y. Analysis on the evolution and response of hydrometeorological factors in the lower reaches of Jinsha River and the Three Gorges. Hydrology 2016, 36, 37–45. (In Chinese) [Google Scholar]
  26. Sun, S.; Chen, L.; Xiang, Y. Climatic characteristics of area rainfall in Jinsha river basin. Plateau Mt. Meteorol. Res. 2009, 1, 7–10. (In Chinese) [Google Scholar]
  27. Xia, J.; Yang, S.; Wan, Y. Spatial distribution characteristics of ecological potential in Jinshajiang River Basin (Yunnan Section) based on GIS. Resour. Environ. Yangtze Basin 2009, 18, 865–870. (In Chinese) [Google Scholar]
  28. Zeng, X.; Ye, L.; Zhai, J. Temporal and spatial evolution of precipitation in the Jinshajiang River Basin during 961 ~ 2010. Resour. Environ. Yangtze Basin 2015, 24, 402–407. (In Chinese) [Google Scholar]
  29. Ren, F.; Zhang, P.; Chen, X. Spatial heterogeneity of vegetation and its impact on ecological restoration in the main stream of Jinsha River. J. Yangtze River Sci. Res. Inst. 2016, 33, 24–30. (In Chinese) [Google Scholar]
  30. Deng, M.; Han, S. Study on healthy tourism development mode in jinsha river basin. Res. Tour. Manag. 2017, 2, 18–19. (In Chinese) [Google Scholar]
  31. Liu, X. A Preliminary Study on the Characteristics of Meteorological Factors and Runoffs in Jinsha River Basin. Ph.D. Thesis, Changjiang River Scientiffic Research Institute, Wuhan, China, 2016. (In Chinese). [Google Scholar]
  32. Chen, Y.; Wang, W.; Wang, G. Variation characteristics of temperature and precipitation in Jinsha River Basin. Plateau Mt. Meteorol. Res. 2010, 30, 51–56. (In Chinese) [Google Scholar]
  33. Cen, S.; Qin, N.; Li, Y. Climatic characteristics of runoff variation in flood season over Jinsha River Basin. Resour. Sci. 2012, 34, 1538–1545. (In Chinese) [Google Scholar]
  34. Shen, Y.; Pan, Y.; Yu, J. Quality assessment of regional hourly precipitation fusion products in China. Trans. Atmos. Sci. 2013, 36, 37–46. (In Chinese) [Google Scholar]
  35. Kuang, D.; Shen, Y.; Niu, Z. Analysis on the variation characteristics of precipitation product error spatial resolution and rainfall intensity in satellite inversion. Remote Sens. Inf. 2012, 75–81. (In Chinese) [Google Scholar]
  36. Yu, J.; Shen, Y.; Pan, Y. Improvement of the Probability Density Matching Method for Regional Satellite Precipitation Data in China. J. Appl. Meteorol. Sci. 2013, 24, 544–553. (In Chinese) [Google Scholar]
  37. Shen, Y.; Zhao, P.; Pan, Y. A high spatiotemporal gauge-satellite merged precipitation analysis over China. J. Geophys. Res. Atmos. 2014, 119, 3063–3075. [Google Scholar] [CrossRef]
  38. Pan, Y.; Shen, Y.; Yu, J. Fusion experiment of hourly precipitation from surface observation and satellite inversion in China based on the analysis of optimal interpolation method. Acta Meteorol. Sin. Acta Meteorol. Sin. 2012, 70, 1381–1389. (In Chinese) [Google Scholar]
  39. Meng, X.; Wang, H.; Chen, J.; Mingxiang, Y.; Zhihua, P. High-resolution simulation and validation of soil moisture in the arid region of Northwest China. Sci. Rep. 2019, 9, 17227. [Google Scholar] [CrossRef] [Green Version]
  40. Meng, X.; Wang, H. Significance of the China Meteorological Assimilation Driving Datasets for the SWAT Model (CMADS) of East Asia. Water 2017, 9, 765. [Google Scholar] [CrossRef]
  41. Meng, X.; Wang, H.; Shi, C.; Wu, Y.; Ji, X. Establishment and Evaluation of the China Meteorological Assimilation Driving Datasets for the SWAT Model (CMADS). Water 2018, 10, 1555. [Google Scholar] [CrossRef] [Green Version]
  42. Meng, X.; Shi, C.; Liu, S. CMADS data set and its driving role in watershed hydrological models: A case study of Heihe River Basin. Pearl River 2016, 37, 1–19. (In Chinese) [Google Scholar]
  43. Liu, Y.; Fu, Q.; Song, P. Review on satellite remote sensing inversion of precipitation. Adv. Earth Sci. 2011, 11, 1162–1172. (In Chinese) [Google Scholar]
  44. Zhang, X. Application of Satellite Precipitation Products in the Three Gorges Watershed. Ph.D. Thesis, Sichuan University, Chengdu, China, 2018. [Google Scholar]
  45. Chen, X.; Zhong, R.; Wang, Z. Accuracy and hydrological utility evaluation of new generation GPM IMERG satellite remote sensing data in southern China. J. Hydraul. Eng. 2017, 48, 1147–1156. (In Chinese) [Google Scholar]
  46. Shen, Y.; Feng, M.; Gao, F. Daily precipitation grainization in China. J. Appl. Meteorol. 2010, 21, 279–286. [Google Scholar]
  47. Yang, C.; Cheng, P.; Zou, F. Flood analysis of “05.8” in the middle and upper reaches of Jinsha River. Express Water Resour. Hydropower Inf. 2010, 31, 9–10. (In Chinese) [Google Scholar]
  48. Shi, B.; Shu, Y. Analysis and application of flood propagation time in the lower reaches of Jinsha River and main tributaries on the right bank. J. Water Resour. Res. 2014, 35, 33–35. (In Chinese) [Google Scholar]
  49. Hao, S. Characteristics of rainstorm flood in jinsha river basin. Cent. South China Water Power 1991, 3, 43–51. (In Chinese) [Google Scholar]
  50. Liu, Y.; Li, C.; Feng, B. Flood analysis of Jinsha River “05.8”. Yangtze River 2006, 37, 91–93. (In Chinese) [Google Scholar]
  51. Yu, J. The first measured flood of Jinsha River—Analysis of the rainstorm flood in August 1966. Des. Hydroelectr. Power Stn. 1994, 10, 20–24. (In Chinese) [Google Scholar]
  52. Hydrology General Station of Sichuan Water Conservancy and Electric Power Bureau. Sichuan Hydrology Handbook; Sichuan Water Resources and Electric Power Department: Chengdu, China, 1979. (In Chinese)
  53. Wang, F. Historical flood characteristics of jinsha river. Sichuan Water Resour. 1999, 20, 46–48. (In Chinese) [Google Scholar]
  54. Yin, J.; Guo, S.; Gu, L.; Yang, G.; Wang, J.; Yang, Y. Thermodynamic response mechanism of extreme precipitation to climate change and flood effect in China. Sci. China Press 2021, 33, 4315–4325. [Google Scholar]
Figure 1. Study area and distribution of the main sites.
Atmosphere 13 00263 g001
Figure 2. Spatial distribution diagram of the extreme precipitation indexes (RX1day, RX5day, R95p, and R99p unit: mm; SDII unit: mm/day; CDD and CWD unit: mm). Please note: gauge represents the extreme index values calculated by the observation data of the site, CMPA-H, CMADS, GPM, and TRMM represent the extreme index values calculated by the CMPA-H, CMADS, GPM, and TRMM data. The height of the bar chart represents the extreme index values.).
Atmosphere 13 00263 g002aAtmosphere 13 00263 g002bAtmosphere 13 00263 g002cAtmosphere 13 00263 g002d
Figure 3. Comparison chart of the maximum extreme precipitation indexes (please note, observation represents the extreme index values calculated by the observation data of the site, while CMPA-H, CMADS, GPM, and TRMM represent the extreme index values calculated by the CMPA-H, CMADS, GPM, and TRMM data. Same as below).
Atmosphere 13 00263 g003
Figure 4. Comparison chart of the maximum extreme precipitation daily indexes (the unit “d” represents “days”).
Atmosphere 13 00263 g004aAtmosphere 13 00263 g004b
Figure 5. Spatial distribution of extreme temperature index comparative analysis (TXx, TNx, TXn, and TNn unit: mm; FD0 and ID0 unit: days). Please note, gauge represents the extreme index values calculated by the observation data of the site, GRID and CMADS represent the extreme index values calculated by the 0.5° × 0.5° grid dataset of daily surface temperature in China and CMADS. The height of the bar chart represents the extreme index values.
Atmosphere 13 00263 g005aAtmosphere 13 00263 g005bAtmosphere 13 00263 g005cAtmosphere 13 00263 g005d
Figure 6. Comparison chart of the maximum temperature index. Please note, observation represents the extreme index values calculated by the observation data of the site, while 0.5° grid and CMADS represent the extreme index values calculated by the 0.5° × 0.5° grid dataset of daily surface temperature in China and CMADS. Same as below.
Atmosphere 13 00263 g006
Figure 7. Comparison chart of the lowest temperature indexes.
Atmosphere 13 00263 g007
Figure 8. Comparison chart of the maximum daily extreme temperature indexes.
Atmosphere 13 00263 g008
Figure 9. Spatial distribution of CMADS daily precipitation and extreme precipitation thresholds at each meteorological station within eight days of the occurrence of a typical flood event.
Atmosphere 13 00263 g009
Figure 10. Spatial distribution map of CMADS precipitation and extreme precipitation thresholds corresponding to meteorological stations within eight days after a typical flood event occurred (“value” represents “daily precipitation”). Please note, stars represent meteorological stations with daily precipitation close to or above the extreme precipitation threshold.
Atmosphere 13 00263 g010aAtmosphere 13 00263 g010bAtmosphere 13 00263 g010cAtmosphere 13 00263 g010dAtmosphere 13 00263 g010e
Figure 11. Spatial distribution map of CMADS maximum temperature and extreme high temperature thresholds corresponding to the meteorological stations.
Atmosphere 13 00263 g011
Figure 12. Spatial distribution of the maximum daily temperature of typical flood events (based on CMADS).
Atmosphere 13 00263 g012
Table 1. Extreme precipitation index table.
ClassificationIndicatorNameDefinitionsUnits
Precipitation indexRX1day (y)Max one-day precipitation amountMonthly maximum one-day precipitationmm
Rx5day (y)Max five-day precipitation amountMonthly maximum consecutive five-day precipitationmm
R95p (y)Very wet daysAnnual total precipitation when daily precipitation > 95th percentilemm
R99p (y)Extremely wet daysAnnual total precipitation when daily precipitation 99th percentilemm
SDII (y)Simple daily intensity indexAnnual total precipitation divided by the number of wet days (defined as precipitation ≥ 1.0mm) throughout the yearmm/d
Daily precipitation indexCDD (y)Consecutive dry daysMaximum number of consecutive days with daily precipitation < 1 mmd
CWD (y)Consecutive wet daysMaximum number of consecutive days with daily precipitation ≥ 1 mmd
Note: Y indicates annual change, same as below.
Table 2. Extreme temperature index table.
ClassificationIndicatorNameDefinitionsUnits
Extreme temperature indexTXx (y)Max TmaxMonthly maximum value of daily maximum temp.°C
TNx (y)Max TminMonthly maximum value of daily minimum temp.°C
TXn (y)Min TmaxMonthly minimum value of daily maximum temp.°C
TNn (y)Min TminMonthly minimum value of daily minimum temp.°C
Daily temperature indexFD0 (y)Frost daysAnnual count when TN (daily minimum) < 0 °Cd
ID0 (y)Ice daysAnnual count when TX (daily maximum) < 0 °Cd
Table 3. The maximum values of extreme precipitation indexes in the basin and its site.
Upstream Sub-BasinDownstream Sub-Basin
ObservationCMPA-HCMADSGPMTRMMObservationCMPA-HCMADSGPMTRMM
RX1day
(2016)
Maximum (mm)50.562.669.2255.263.6112.980.995.24109.591.4
SiteWeixiLitangLitangDegeDaochengKunmingLeiboHuapingDaliZhaotong
Deviation (mm)-12.118.724.713.1-−32−17.66−3.4−21.5
RX5day
(2016)
Maximum (mm)101.4108.8120.79106.4134.7194144.5144.43144.5160.5
SiteWeixiJiulongWeixiDeqinLitangKunmingYuanmouMuliYuanmouLeibo
Deviation (mm)-7.419.39533.3-−49.5−49.57−49.5−33.5
R95p (2016)Maximum (mm)336236.9291.9292198.8551.3340.3381.3309.6290.7
SiteWeixiLitangWeixiWeixiBatangHuiliHuapingHuapingLiangshan (Xichang)Chuxiong
Deviation (mm)-−99.1−44.1−44−137.2-−211−170−241.7−260.6
R99p (2016)Maximum (mm)117.1119.8109.584.977224.8135.8176109.5120.9
SiteLitangLitangWeixiXinlongBatangChuxiongLeiboHuapingDaliLiangshan (Xichang)
Deviation (mm)-2.7−7.6−32.2−40.1-−89−48.8−115.3−103.9
SDII (2016)Maximum (mm/days)10.18.48.97.89.418.311.413.910.714.1
SiteWeixiDaochengWeixiWeixiJiulongHuapingHuapingHuapingHuapingLeibo
Deviation (mm/day)-−1.7−1.2−2.3−0.7-−6.9−4.4−7.3−4.2
Table 4. The maximum daily index of extreme precipitation in the basin and its site.
Upstream Sub-BasinDownstream Sub-Basin
ObservationCMPA-HCMADSGPMTRMMObservationCMPA-HCMADSGPMTRMM
CDD
(2016)
Maximum (days)19013214220214583829587129
SiteTuotuoheQumalaiQumalaiWudaoliangTuotuoheYanyuanHuapingMuliLiangshan (Xichang)Yuexi
Deviation (days)-−58−4812−45-−112446
CWD
(2016)
Maximum (days)22282114121119143725
SiteJiulongDiqing (Zhongdian)JiulongDeqinDiqing (Zhongdian)LijiangLijiangMuliMuliMuli
Deviation (days)-6−1−8−10-832614
Table 5. The maximum (minimum) values of the extreme temperature index in the basin and its site.
Upstream Sub-BasinDownstream Sub-Basin
Observation0.5° GridCMADSObservation0.5° GridCMADS
TXx (2016)Maximum (°C)34.630.236.3737.534.840.6
SiteBatangDaochengBatangHuapingLeiboHuaping
Deviation (°C)-−4.41.77-−2.73.1
TXn (2016)Minimum (°C)−16−15.4−16.3−6.7−1.9−8.08
SiteWudaoliangWudaoliangWudaoliangWeiningZhaotongWeining
Deviation (°C)-0.6−0.3-4.8−1.38
TNx (2016)Maximum (°C)18.115.319.527.221.727.93
SiteBatangDiqing (Zhongdian)BatangYuanmouLeiboYuanmou
Deviation (°C)-−2.81.4-−5.50.73
TNn (2016)Minimum (°C)−34.8−29.6−35.02−11.7−8.7−13.27
SiteQingshuiheWudaoliangQingshuiheWeiningMuliWeining
Deviation (°C)-5.2−0.22-3−1.57
Table 6. The maximum daily extreme temperature index in the basin and its site.
Upstream Sub-BasinDownstream Sub-Basin
Observation0.5° GridCMADSObservation0.5° GridCMADS
FD0 (2016)Maximum (days)2991303095568161
SiteWudaoliangQingshuiheQingshuiheYanyuanLijiangYanyuan
Deviation (days)-−16910-13106
ID0 (2016)Maximum (days)1255712410320
SiteWudaoliangWudaoliangWudaoliangWeiningZhaotongWeining
Deviation (days)-−68−1-−710
Table 7. A brief account of 22 September 2016.
NO.NamePeak TimeAverage Daily Flow (Unit: m3/s)
19.22 flood events22 September 201613,100
Table 8. CMADS grid precipitation corresponding to the longitude and latitude of the 31 surface meteorological observation stations in the study basin (unit: mm).
NameDaily Precipitation of CMADSExtreme Precipitation Threshold
2016.9.152016.9.162016.9.172016.9.182016.9.192016.9.202016.9.212016.9.22
Wudaoliang2.372.470.461.450.5702.50.327.88
Tuotuohe2.454.741.7600001.147.15
Qumalai02.413.960.250.9501.21.697.3
Qingshuihe2.581.311.191.510.2800.181.787.27
Yushu0.052.181.690.570.440009.08
Dege1.910.1816.52.810.6700.023.8511.4
Ganzi3.921.3426.786.697.140.360.082.5112.32
Xinlong3.912.119.3910.376.2200.0310.2812.5
Batang1.372.477.0511.598.470.14014.5515.18
Litang1.930.2410.910.183.460.270.2211.6514.58
Deqin0.8100.290.761.825.960.110.713.02
Daocheng10.09120.1611.8130.139.70016.02
Jiulong13.056.771.1139.2539.882.2101.6713.66
Diqing (Zhongdian)1.660.220.070.0914.0528.34.810.2512.42
Weixi1.650.7300.0511.86268.310.4418.94
Muli16.390.184.748.5612.3313.663.61015.38
Yuexi3.581.2512.821.027.766.40.643.121.22
Lijiang5.380.282.613.5533.0329.876.560.0219.26
Yanyuan13.571.349.4211.714.1512.834.090.0818.7
Leibo00.174.4316.7710.847.590.013.1518.74
Zhaojue4.851.074.6536.118.068.650.520.0720.12
Zhaotong20.3715.9117.127.422.770016.62
Huaping30.7114.396.8444.6227.2827.371.99041.44
Huili24.786.14.0842.3425.259.810.13020.9
Weining10.291.930.623.3824.754.830017.52
Huize18.464.321.5312.431.185.9800.0416.44
Yuanmou22.7241.87.0916.9622.526.410.02019.34
Chuxiong1.024.910.742.4853.0910.350.67027.09
Kunming9.8368.113.5819.9916.276.70.97020.7
Liangshan (Xichang)6.81.291.2632.212.077.240.13026.3
Dali0.081.60.340.0956.7541.677.410.0717.45
Table 9. The maximum temperature and high temperature threshold of CMADS grid corresponding to the 31 surface meteorological observation stations in the study basin (unit: °C).
NameHighest Temperature (CMADS)Extreme High Temperature Threshold
Typical Flood Event (2016.9.22)Average Daily Maximum Temperature within 8 Days (2016.9.15–9.22)
Wudaoliang4.916.114.8
Tuotuohe7.938.3916.95
Qumalai10.341219.2
Qingshuihe6.028.4516.15
Yushu15.1417.5322.6
Dege10.6117.5525.9
Ganzi10.314.3123.65
Xinlong8.3110.9626.85
Batang24.5624.8929.5
Litang12.3211.4918.8
Deqin13.617.7220.4
Daocheng17.1216.9520.65
Jiulong13.5613.0525.1
Diqing (Zhongdian)11.8316.0820.2
Weixi17.8322.6626.45
Muli16.7416.427.55
Yuexi20.7520.4730.3
Lijiang15.5619.6325.4
Yanyuan9.9410.8325.3
Leibo22.7321.1228.95
Zhaojue20.0517.5527.7
Zhaotong20.5518.2327.55
Huaping26.7226.7133.5
Huili22.2522.328.95
Weining14.4114.1724.1
Huize18.6418.3625.75
Yuanmou25.5225.7334.5
Chuxiong19.8120.8927.5
Kunming23.4326.0526.85
Liangshan (Xichang)22.5321.4631.7
Dali21.3123.5927.15
Publisher’s Note: MDPI stays neutral with regard to jurisdictional claims in published maps and institutional affiliations.

