
Effect of Air Purification Systems on Particulate Matter and Airborne Bacteria in Public Buses


1
Gyeonggi Provincial Government, Suwon 16444, Korea
2
Department of Environmental & Safety Engineering, Ajou University, Suwon 16499, Korea
*
Author to whom correspondence should be addressed.
†
These authors contributed equally to this work.
Atmosphere 2022, 13(1), 55; https://doi.org/10.3390/atmos13010055
Submission received: 5 December 2021
/
Revised: 26 December 2021
/
Accepted: 29 December 2021
/
Published: 30 December 2021
(This article belongs to the Topic Assessing Indoor Pollution and Its Impacts on the Human Health)
Abstract
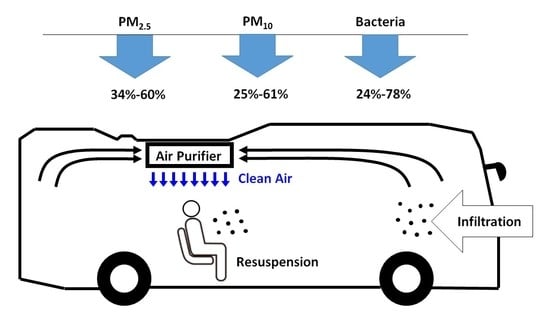
:The indoor air quality in public transport systems is a major concern in South Korea. Within this context, we investigated the effect of air purification systems on the indoor air quality of intercity buses, one of the most popular transport options in South Korea. Air purifiers were custom designed and equipped with high-efficiency particulate air (HEPA) filters to remove particulate matter and ultraviolet light-emitting diodes (UV-LEDs) to remove airborne bacteria. To investigate the effectiveness of the air purification systems, we compared concentrations of particulate matter (PM2.5 and PM10), airborne bacteria, and carbon dioxide (CO2) in six buses (three with air purification systems and three without) along three bus routes (BUS1, BUS2, BUS3) in Gyeonggi Province, South Korea, between 6 April and 4 May 2021. Compared to the buses without air purification, those with air purification systems showed 34–60% and 25–61% lower average concentrations of PM2.5 and PM10, respectively. In addition, buses with air purification systems had 24–78% lower average airborne bacteria concentrations compared to those without air purification systems (when measured after 30 min of initial purification).
1. Introduction
In modern times, humans spend more than 90% of the day indoors and are continuously exposed to indoor pollutants, such as fine dust (PM2.5, PM10) and airborne bacteria [1,2]. Fine dust, a common indoor pollutant, enters the respiratory and circulatory systems and negatively affects the human body by causing various diseases [3]. In addition, airborne bacteria, ubiquitous in the atmosphere, can cause infectious diseases in humans [4,5,6]. As a result, many researchers have investigated the air quality of various indoor environments, including public transport [7,8,9,10,11,12,13,14,15]. Among indoor environments, intercity buses, one of the most popular public transport options in South Korea, have a particular indoor environment [16,17]. Specifically, the windows of intercity buses are designed to remain closed, with the removal of indoor air pollutants resting solely on the default ventilation and filtration systems of the buses. These default filters often have a low filtration efficiency, with Lee and Zhu [18] reporting an average filtration efficiency of approximately 50% for ultrafine particles with diameters of less than 100 nm in passenger cars. The external air circulation mode (with exchange between indoor and outdoor air) allows on-road air pollutants (at a concentration much higher than the urban average [19]) to enter without sufficient filtration, while the internal air circulation mode (without exchange between indoor and outdoor air) results in the re-suspension of fine dust by passenger movement, representing a major source of indoor pollution [20]. Moreover, the absence of external ventilation may increase the concentration of airborne viruses and bacteria, which may pose a serious health risk [21]. Neither of the two options provides a satisfactory indoor environment for bus passengers.
The challenge of creating a hygienic and pollution-free indoor environment can only be solved by the installation of additional air purification systems inside buses. In a study on air purification in buses, the only previous study to the best of our knowledge, Lee et al. [22] investigated the effects of a ventilation system on school bus air quality [22]. Their results indicated that the filtration system reduced levels of ultrafine particles (diameter < 100 nm), black carbon, and PM2.5 by 88 ± 6%, 84 ± 5%, and 55 ± 22%, respectively. However, further studies are needed to demonstrate the effectiveness of such purification systems on various air pollutants across different vehicles and driving conditions.
Our study compares the indoor concentrations of PM2.5, PM10, and airborne bacteria in buses along three intercity routes in Gyeonggi Province, South Korea, using buses with and without air purification systems. This is the first study to demonstrate the effects of air purification systems on airborne bacteria and the related effects on air quality in intercity buses. The air purification systems installed in the buses were specifically designed and manufactured as part of a fine dust reduction project conducted in Gyeonggi Province. In addition to the air purification systems, we also analyze the effect of outdoor pollutant concentrations on the indoor air quality of buses. Furthermore, we calculate the carbon dioxide (CO2) levels per passenger as a proxy for the level of external circulation inside the buses.
2. Methods
2.1. Air Purification System
The air purification systems used in this study were designed and manufactured within a fine dust reduction project conducted in Gyeonggi Province. The systems include high-efficiency particulate air (HEPA) filters for the removal of fine and ultrafine dust along with ultraviolet light-emitting diodes (UV-LEDs) for the removal of airborne bacteria. The air purification systems were installed on the ceiling of buses near the center of the passenger area, which were about two-thirds of the bus length away from the front. The location of the system is graphically shown in Figure S1.
2.2. Air Pollutant Measuring Equipment
Particulate matter (PM2.5 and PM10) was measured in real time (every minute) using Dusttrack II Aerosol Monitors (TSI Incorporated, Shoreview, MN, USA) and Air Scan (Sensoronic, Bucheon, Korea). In addition, CO2, temperature, and relative humidity were measured in real time (every minute) using an IQ-610Xtra (Graywolf sensing solutions, Shelton, CT, USA). Airborne bacteria were measured at a flow rate of 1 cubic foot per minute (CFM) for 5 min using KAS-120 (KEMIK Corporation, Sungnam, Korea). The measurement systems were located at the end of the bus (see Figure S1), which is away from the air purification system (which was at the center of the passenger area). Such distance was intentionally placed for the measurement system to obtain the overall concentration inside the bus instead of the localized concentration near the air purification system.
2.3. Selection of Buses for Air Quality Investigation
We selected three popular intercity bus routes (BUS1, BUS2, BUS3) in Gyeonggi Province, South Korea. Figure S2 shows the map of Gyeonggi Province along with three selected routes. These bus routes were selected because they were one of the longest bus routes in the province. The travel times of these routes takes about 1 to 2 h. In each route, two buses were selected for air quality investigation (six buses in total)—one with an air purification system and one without. Table S1 shows the general information on the selected six intercity buses. The indoor air quality of the selected six buses was measured, and at each bus stop, the number of passengers getting on and off was recorded.
2.4. Investigation of External Air Quality and Climate
Outdoor PM2.5 and PM10 concentrations were obtained from the Korea Environment Corporation (https://www.airkorea.or.kr/ accessed on 5 December 2021). To estimate PM2.5 and PM10 concentrations in the external environment, we used concentration data obtained from the nearest air quality monitoring station (AQMS). Outdoor climate information, such as temperature and relative humidity, was obtained from the Korea Meteorological Administration (https://data.kma.go.kr/ accessed on 5 December 2021).
3. Results
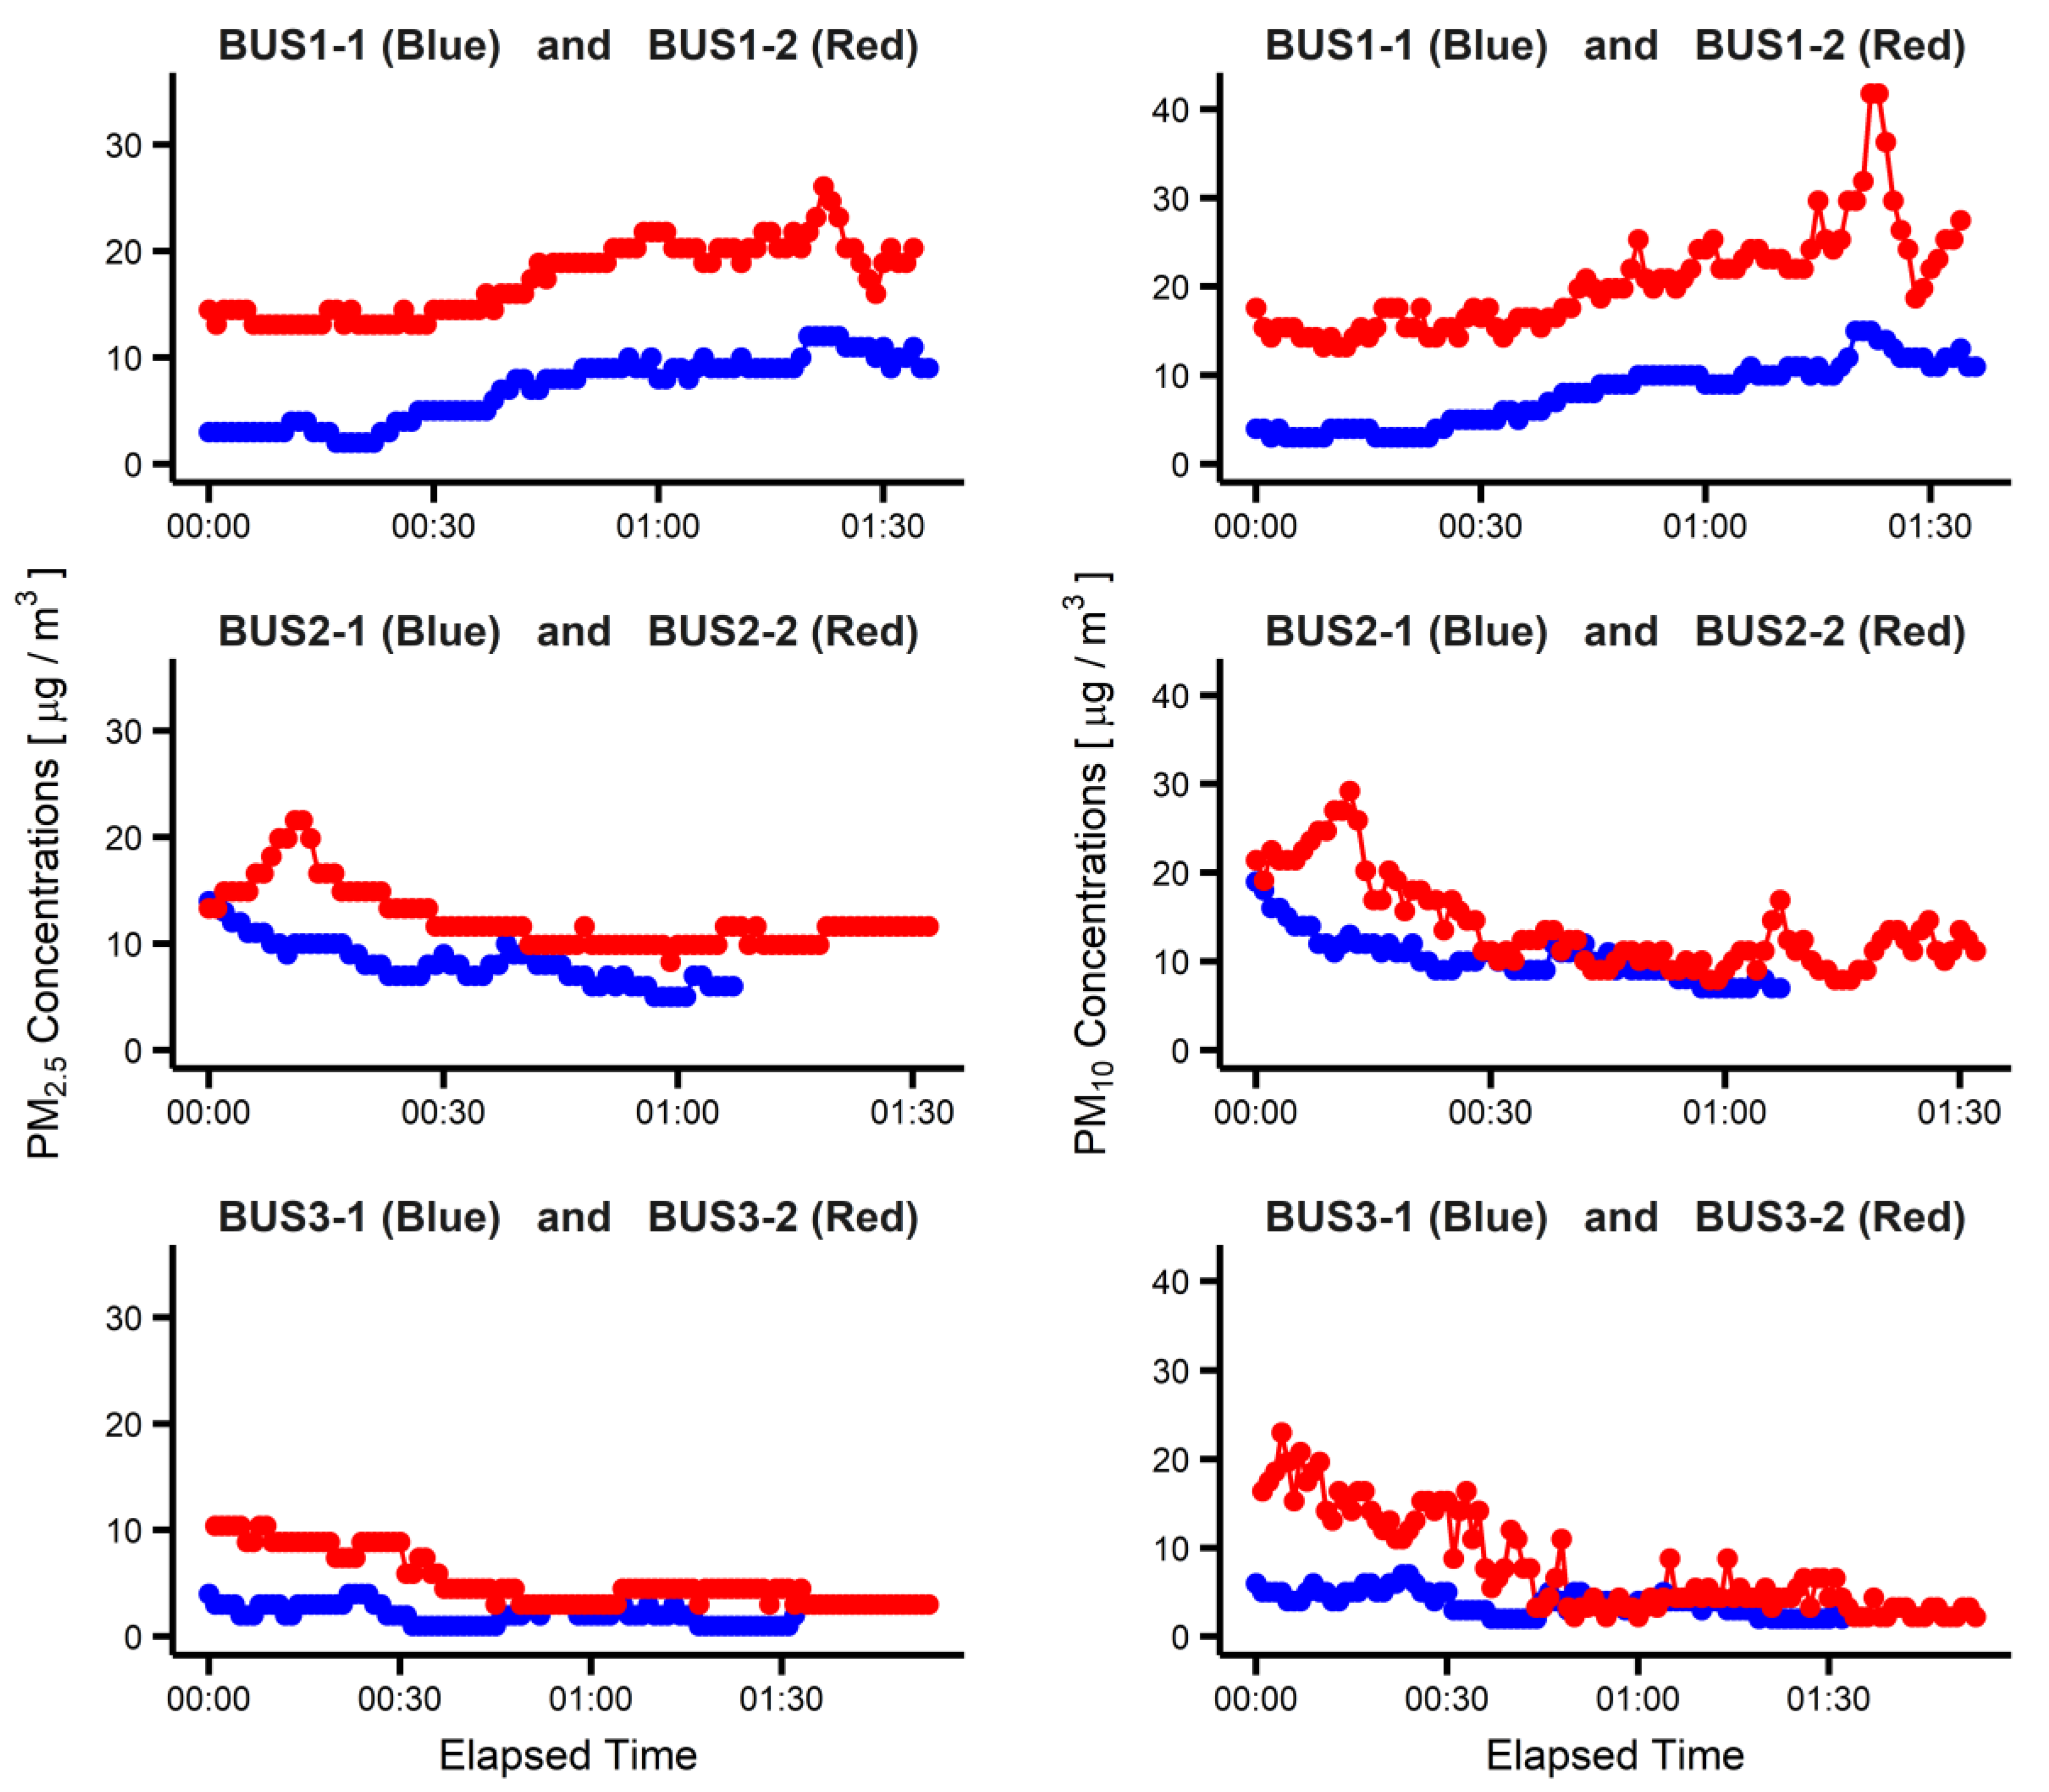
We measured the concentrations of PM2.5 and PM10 in six intercity buses (Figure 1, Table S1). Our results indicate that the buses with air purification systems had lower PM2.5 and PM10 concentrations across all three routes. Buses with air purification systems had 60%, 34%, and 60% lower average PM2.5 concentrations and 61%, 25%, and 51% lower average PM10 concentrations than those without purification systems across all three routes (BUS1, BUS2, BUS3), respectively (Table 1).
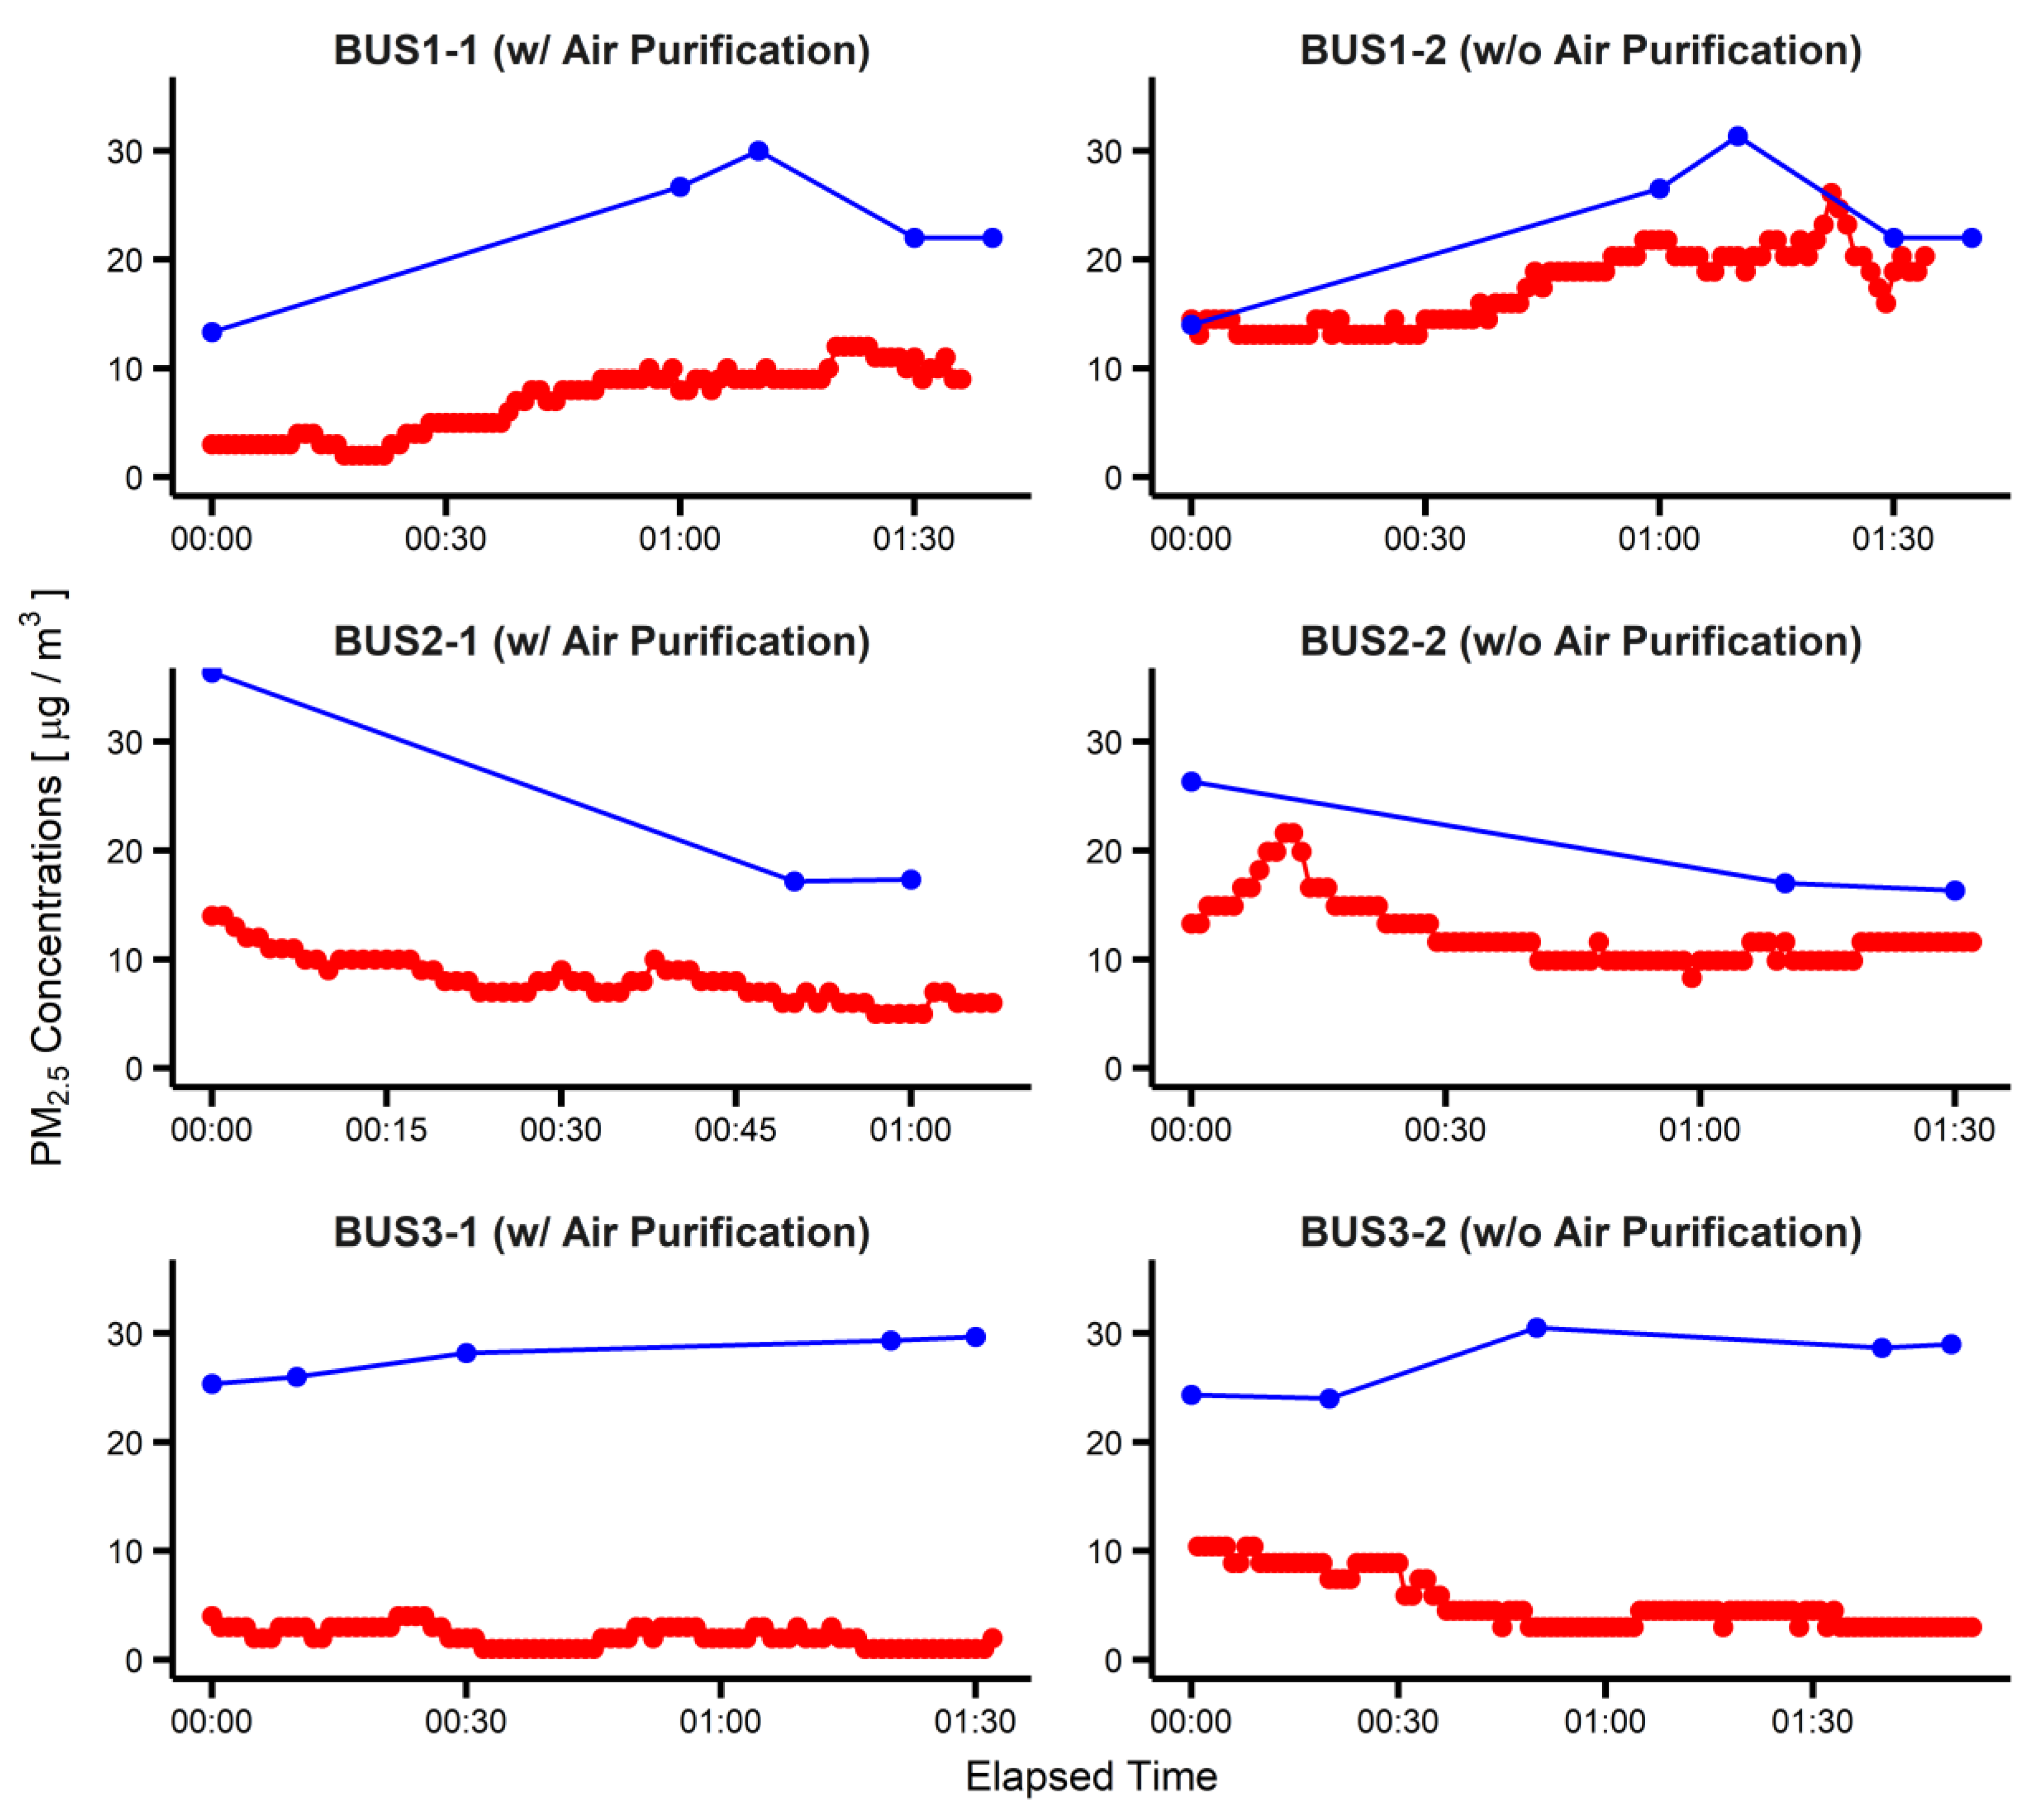
We investigated both the indoor concentration of PM2.5 in six buses and the corresponding outdoor concentrations, obtained from the nearest air quality monitoring stations (Figure 2). In BUS1-2 and BUS2-2 (without air purification), indoor PM2.5 concentrations corresponded to external concentrations. Notably, BUS1-1 and BUS2-1 (with air purification) showed a similar but much weaker relationship. The buses associated with the third route, BUS3-1 and BUS3-2, had indoor PM2.5 concentrations that did not correspond to the external concentrations. Owing to the low outdoor temperature, the buses on Route 3 (BUS3-1 and BUS3-2) were operated with the default heating system on (see Table 1 for comparing indoor and outdoor temperatures in BUS3-1 and 3-2). The heating system facilitated internal air circulation and filtration by default filters, thereby decoupling the relationship between indoor and outdoor concentrations.
Variation in the relationship between indoor and outdoor concentrations in buses without air purification systems may stem from differences in the filtration efficiency of the default filters along with the air circulation rate. However, regardless of the buses and driving conditions, buses with air purification systems showed a 44–59% lower indoor-to-outdoor concentration ratio (IOR) for PM2.5 than those without air purification systems (Table 1).
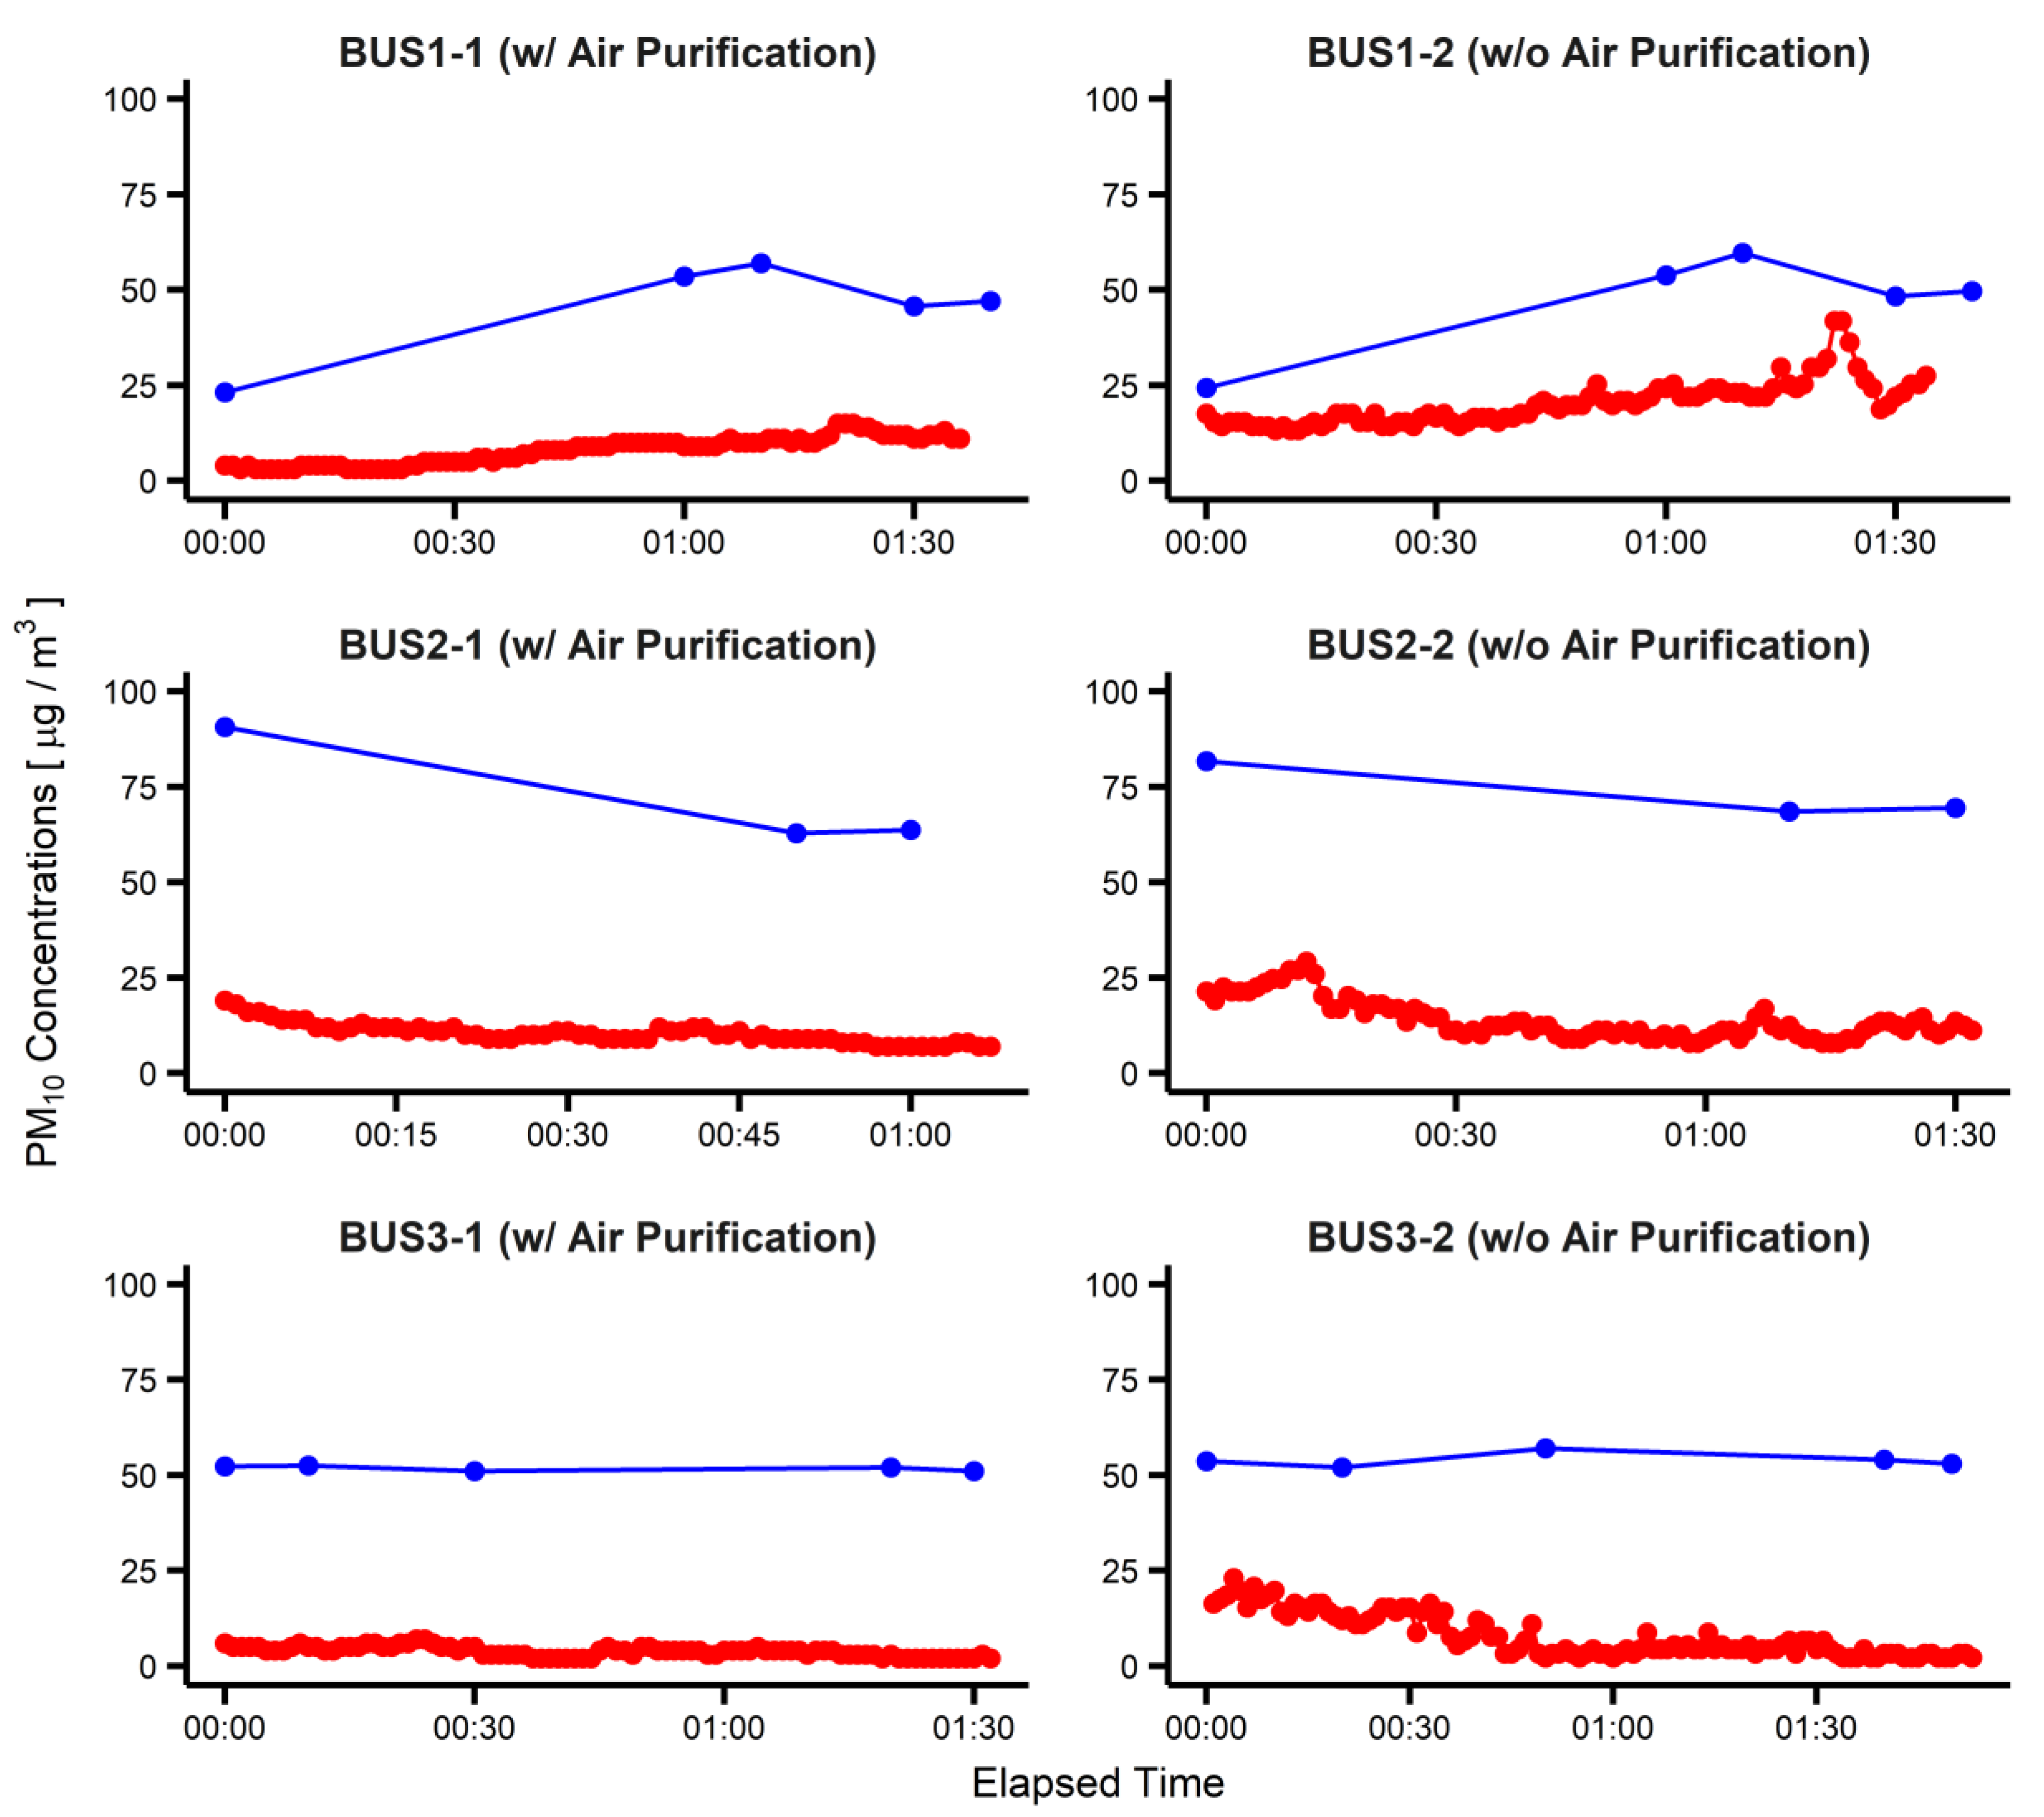
We investigated the concentration of PM10 in the six buses, along with the outdoor concentrations obtained from the nearest air quality monitoring stations (Figure 3). The relationship between indoor and outdoor PM10 concentrations was weaker than that of PM2.5, especially in BUS2-1 and BUS2-2. This may be partly due to the different filtration efficiencies for PM2.5 and PM10 [23]. Similar to PM2.5, buses with air purification systems had a 26–60% lower IOR for PM10 compared to those without air purification (Table 1).
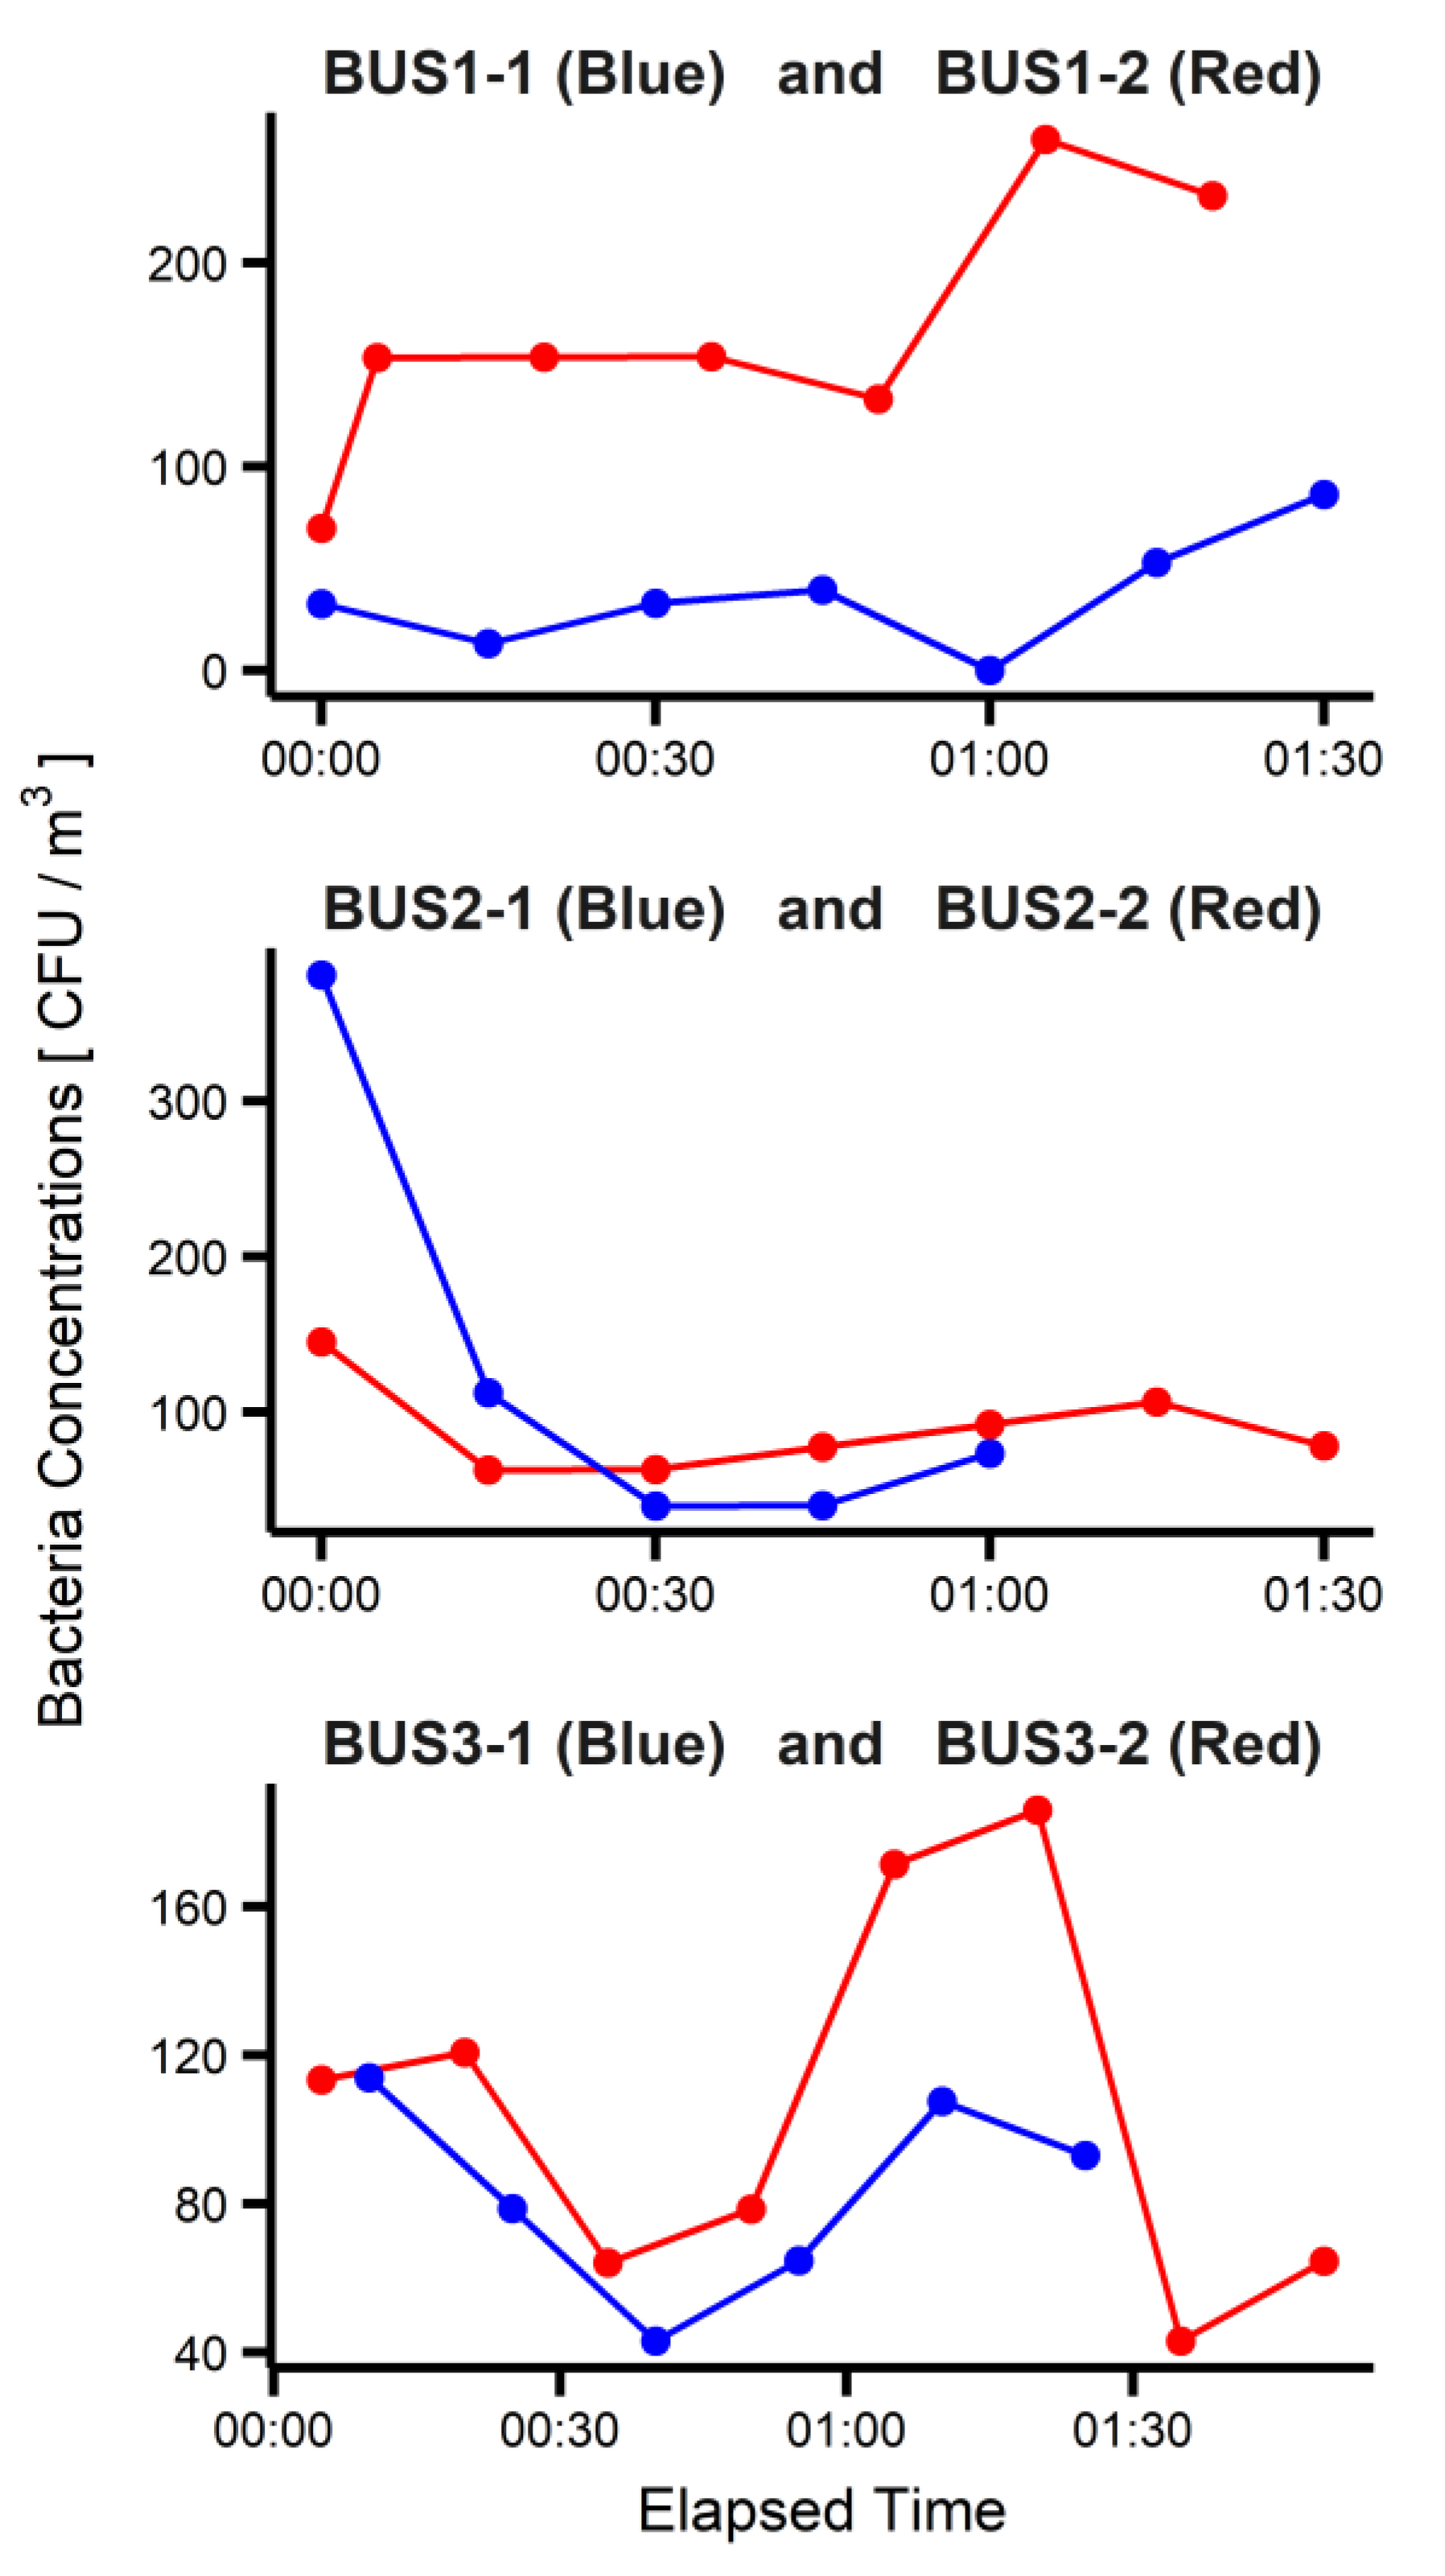
We also investigated the concentration of airborne bacterial concentrations in the six buses (Figure 4). Our results showed buses BUS1-1 and BUS3-1 had lower bacterial concentrations than buses BUS1-2 and BUS3-2 throughout the duration of the trips. However, at departure, BUS2-1 showed higher bacterial concentrations than BUS2-2. The high bacterial concentrations in BUS2-1 decreased rapidly during the first 30 min after departure, with the concentration levels remaining lower than those in BUS2-2 thereafter. We suggest that the high concentrations of bacteria in BUS2-1 and BUS2-2 are primarily related to the location of a park next to the bus terminal (Incheon Bus Terminal) [24]. Figure S2 shows the maps of three departing bus terminals (one for each route). As can be seen from the map of route 2, there is a large park called Jungang Park right next to Incheon Bus Terminal, whereas other bus terminals do not have such large parks in the vicinity.
Table 1 shows the average bacterial concentrations during the trip without the first 30 min and across the entire trip. Our results indicate that buses BUS1-1, 2-1, and 3-1 (with air purification systems) had 78%, 39%, and 24% lower average concentrations of airborne bacteria than buses BUS1-2, 2-2, and 3-2 (without air purification systems), respectively, during the trip without the first 30 min.
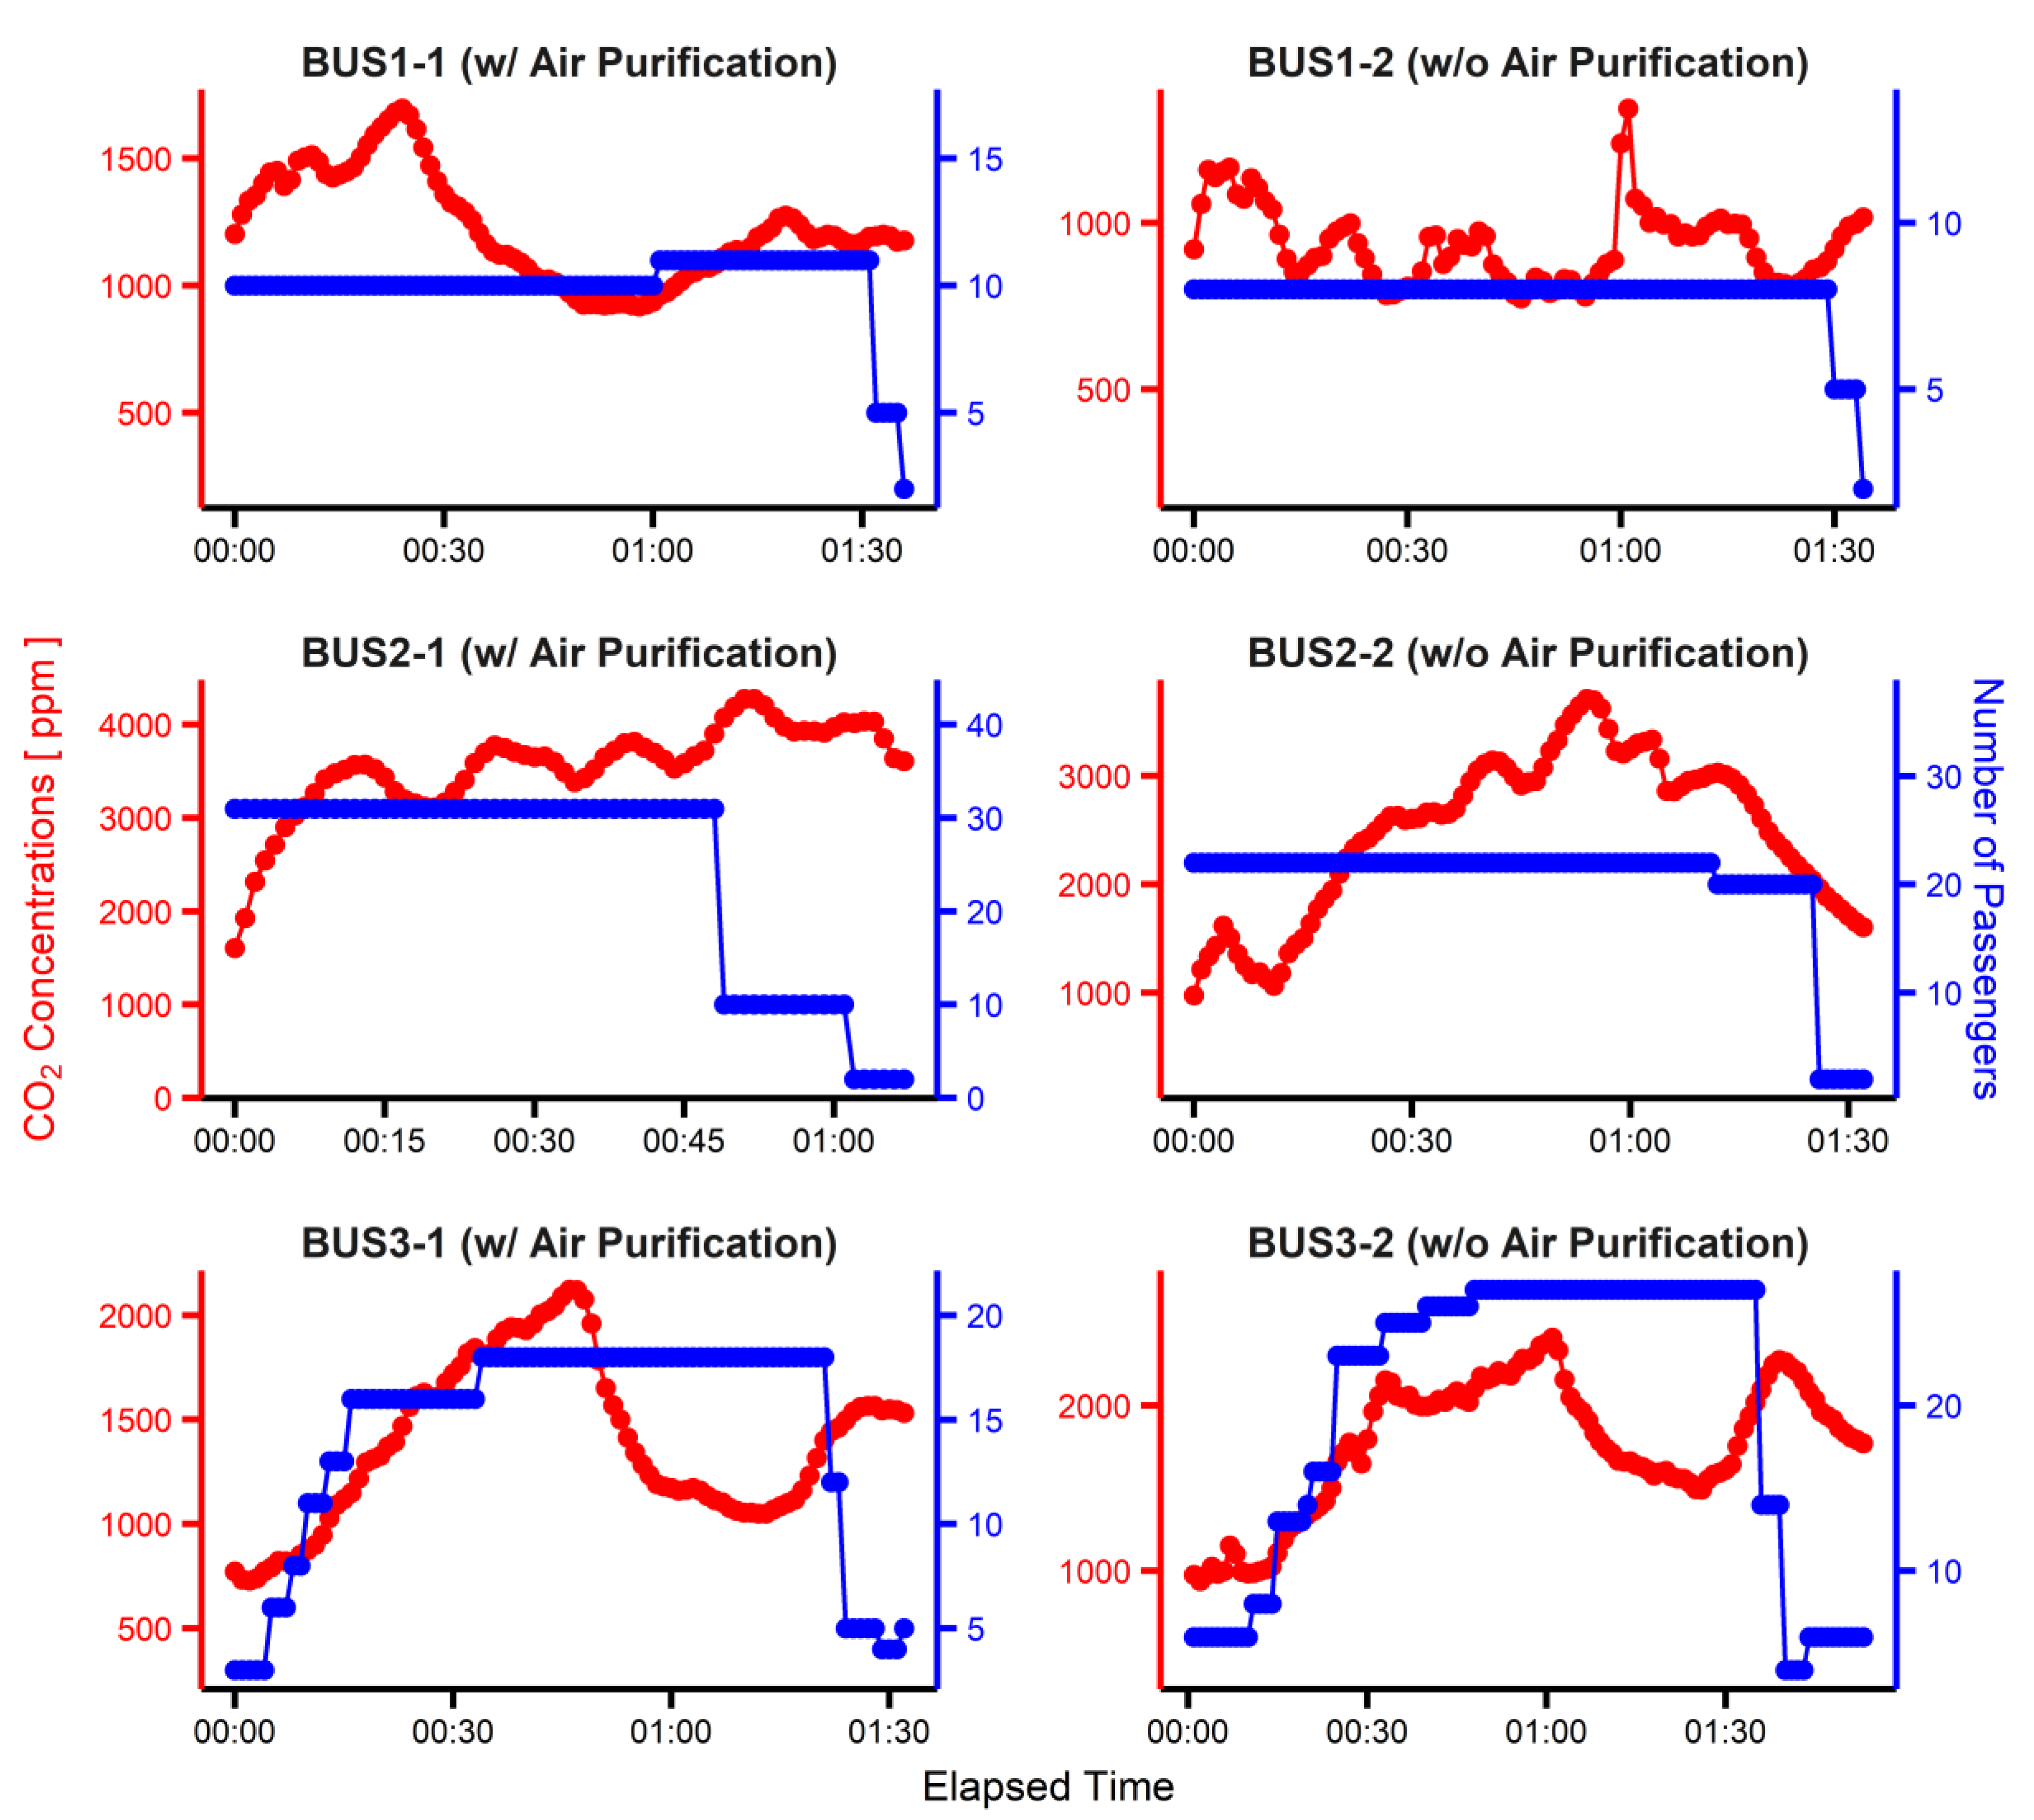
Furthermore, we investigated the CO2 concentrations inside the six buses (Figure 5). The higher the number of passengers, the higher the CO2 concentration inside the bus because of the exhalation of the passengers. The average CO2 levels per average number of passengers (CPP) ranged from 89.4 to 145.1 ppm/person (Table 1). Of the six buses, the CPP was lowest in BUS3-2 (89.4) and highest in BUS2-1 (145.1), which may indicate that the rate of exchange between indoor and outdoor air was highest in BUS3-2 and lowest in BUS2-1.
4. Discussion
To examine the effects of air purification systems on the indoor air quality of public intercity buses, we compared the indoor air quality of a bus with an air purification system to that of a bus without. For an ideal comparison, all factors other than the operation of air purification systems must be identical between two buses. For a successful comparison, we were able to select two public intercity buses of the same model, which were operated with an interval less than an hour. However, we were not able to control the operation of the HVAC (heating, ventilation, and air conditioning) system and passengers in public buses; therefore, they may have acted as confounding factors in the comparisons. For example, strong heating and air conditioning increase the mixing of internal air, and a strong ventilation increases the exchange between indoor and outdoor air. Additionally, the number of passengers and their activities may have affected the re-suspension rate of particulate matters. In addition, the efficiency of the default air filter, climate, and traffic conditions may have also acted as confounding factors in the comparison.
A possible effect of such confounding factors can be minimized by averaging the measurements from multiple buses. This study measured three bus pairs. However, measuring a greater number of bus pairs would be helpful to more accurately examine the effect of air purification systems.
There are some other limitations of the study. In calculating the indoor to outdoor concentration ratio (IOR), we used the outdoor concentration data measured from the closest air quality monitoring station (AQMS). However, there can be a deviation between the air pollutant concentrations at AQMS and right outside a bus. A measurement system capable of measuring the air quality outside a bus can improve the accuracy in IOR measurement, and this is left for a possible future research avenue.
In addition, the air quality measurements were performed at a single location (at the end of the bus), assuming the air quality of the bus was similar everywhere (except of the vicinity of the air purification system). By multiple measurements at various locations and averaging, researchers may obtain a better understanding of the air quality of a whole bus.
5. Conclusions
This study examined the effects of air purification systems on the indoor concentrations of PM2.5, PM10, and airborne bacteria based on measurements from six intercity buses. The buses with air purification systems showed 34–60%, 25–61%, and 24–78% lower average concentrations of PM2.5, PM10, and airborne bacteria (average after 30 min), respectively, than those without air purification systems. The concentration of PM2.5 and PM10 inside the buses was generally related to the concentration in the external environment. However, the IOR decreased with the use of air purification and air conditioning systems. To reduce indoor air pollutants and CO2 levels (related to increased numbers of passengers), we suggest the installation and use of air purification systems inside buses, along with the exchange between indoor and outdoor air.
Supplementary Materials
The following are available online at https://www.mdpi.com/article/10.3390/atmos13010055/s1, Figure S1: The location of the air purification system and air quality measurements in top and side views. Figure S2: The map of Gyeonggi Province, along with three selected intercity bus routes (from NAVER maps). Figure S3: The maps of departing bus terminals for each intercity bus route (from NAVER maps). Table S1: General information on the intercity buses selected for air quality measurement.
Author Contributions
Conceptualization, J.J.L. and J.Y.L.; methodology, J.J.L., H.H. and S.C.H.; investigation, J.J.L., H.H. and S.C.H.; writing—original draft preparation, J.J.L. and H.H.; writing—review and editing, J.Y.L.; supervision, J.Y.L.; funding acquisition, J.Y.L. All authors have read and agreed to the published version of the manuscript.
Funding
This study was supported by the National Research Foundation of Korea (grant number NRF-2021R1C1C1013350) and by the Korea Ministry of Environment (MOE) as a Graduate School specialized in Climate Change [grant number NRF-2017M1A2A2081253].
Institutional Review Board Statement
Not applicable.
Informed Consent Statement
Not applicable.
Data Availability Statement
The datasets used and/or analysed during the current study are available from the corresponding author on reasonable request.
Conflicts of Interest
The authors declare no conflict of interest.
References
- Wiley, J.A.; Robinson, J.P.; Piazza, T.; Garrett, K.; Cirksena, K.; Cheng, Y.-T.; Martin, G. Activity Patterns of California Residents; California Air Resources Board: Sacramento, CA, USA, 1991.
- Klepeis, N.E.; Nelson, W.C.; Ott, W.R.; Robinson, J.P.; Tsang, A.M.; Switzer, P.; Behar, J.V.; Hern, S.C.; Engelmann, W.H. The National Human Activity Pattern Survey (NHAPS): A Resource for Assessing Exposure to Environmental Pollutants. J. Expo. Anal. Environ. Epidemiol. 2001, 11, 231–252. [Google Scholar] [CrossRef] [PubMed] [Green Version]
- Sicard, P.; Khaniabadi, Y.O.; Perez, S.; Gualtieri, M.; De Marco, A. Effect of O3, PM10 and PM2.5 on cardiovascular and respiratory diseases in cities of France, Iran and Italy. Environ. Sci. pollut. Res. Int. 2019, 26, 32645–32665. [Google Scholar] [CrossRef] [PubMed]
- Burrows, S.M.; Elbert, W.; Lawrence, M.G.; Pöschl, U. Bacteria in the Global Atmosphere—Part 1: Review and Synthesis of Literature Data for Different Ecosystems. Atmos. Chem. Phys. 2009, 9, 9263–9280. [Google Scholar] [CrossRef] [Green Version]
- Burrows, S.M.; Butler, T.; Jöckel, P.; Tost, H.; Kerkweg, A.; Pöschl, U.; Lawrence, M.G. Bacteria in the Global Atmosphere—Part 2: Modeling of Emissions and Transport between Different Ecosystems. Atmos. Chem. Phys. 2009, 9, 9281–9297. [Google Scholar] [CrossRef] [Green Version]
- Lee, J.Y.; Park, E.H.; Lee, S.; Ko, G.; Honda, Y.; Hashizume, M.; Deng, F.; Yi, S.M.; Kim, H. Airborne Bacterial Communities in Three East Asian Cities of China, South Korea, and Japan. Sci. Rep. 2017, 7, 5545. [Google Scholar] [CrossRef] [PubMed] [Green Version]
- Adams, H.S.; Nieuwenhuijsen, M.J.; Colvile, R.N.; McMullen, M.A.S.; Khandelwal, P. Fine Particle (PM2.5) Personal Exposure Levels in Transport Microenvironments, London, UK. Sci. Total Environ. 2001, 279, 29–44. [Google Scholar] [CrossRef]
- Adams, H.S.; Nieuwenhuijsen, M.J.; Colvile, R.N. Determinants of Fine Particle (PM2.5) Personal Exposure Levels in Transport Microenvironments, London, UK. Atmos. Environ. 2001, 35, 4557–4566. [Google Scholar] [CrossRef]
- Chan, L.Y.; Lau, W.L.; Lee, S.C.; Chan, C.Y. Commuter Exposure to Particulate Matter in Public Transportation Modes in Hong Kong. Atmos. Environ. 2002, 36, 3363–3373. [Google Scholar] [CrossRef]
- Chan, L.Y.; Lau, W.L.; Zou, S.C.; Cao, Z.X.; Lai, S.C. Exposure Level of Carbon Monoxide and Respirable Suspended Particulate in Public Transportation Modes While Commuting in Urban Area of Guangzhou, China. Atmos. Environ. 2002, 36, 5831–5840. [Google Scholar] [CrossRef]
- Gómez-Perales, J.E.; Colvile, R.N.; Nieuwenhuijsen, M.J.; Fernández-Bremauntz, A.A.; Gutiérrez-Avedoy, V.J.; Páramo-Figueroa, V.H.; Blanco-Jiménez, S.; Bueno-López, E.; Mandujano, F.; Bernabé-Cabanillas, R.; et al. Commuters’ Exposure to PM2.5, CO, and Benzene in Public Transport in the Metropolitan Area of Mexico City. Atmos. Environ. 2004, 38, 1219–1229. [Google Scholar] [CrossRef]
- Gómez-Perales, J.E.; Colvile, R.N.; Fernández-Bremauntz, A.A.; Gutiérrez-Avedoy, V.; Páramo-Figueroa, V.H.; Blanco-Jiménez, S.; Bueno-López, E.; Bernabé-Cabanillas, R.; Mandujano, F.; Hidalgo-Navarro, M.; et al. Bus, Minibus, Metro Inter-Comparison of Commuters’ Exposure to Air Pollution in Mexico City. Atmos. Environ. 2007, 41, 890–901. [Google Scholar] [CrossRef]
- Huang, H.L.; Hsu, D.J. Exposure Levels of Particulate Matter in Long-Distance Buses in Taiwan. Indoor Air 2009, 19, 234–242. [Google Scholar] [CrossRef]
- Zhu, S.; Demokritou, P.; Spengler, J. Experimental and Numerical Investigation of Micro-Environmental Conditions in Public Transportation Buses. Build. Environ. 2010, 45, 2077–2088. [Google Scholar] [CrossRef]
- Keskin, S.S.; Dilmac, E. Indoor Air Particulate Matter Exposure of Commuter Bus Passengers in Istanbul, Turkey. Indoor Built Environ. 2017, 26, 337–346. [Google Scholar] [CrossRef]
- Yoo, H.C.; Noh, K.H. The Assessing the HVAC System and Measurements of Indoor Air Quality of Highway Bus. In Proceedings of the KSES 2009 Spring Annual Conference; The Korean Solar Energy Society: Daegu, Korea, 2009; pp. 263–268. [Google Scholar]
- Yoo, H.C.; Noh, K.H. Natural Ventilation System of Express Bus for Indoor Air Quality and Energy Saving. J. Kor. Soc. Living Environ. Syst. 2010, 17, 21–30, (In Korean with English abstract). [Google Scholar]
- Lee, E.S.; Zhu, Y. Application of a High-Efficiency Cabin Air Filter for Simultaneous Mitigation of Ultrafine Particle and Carbon Dioxide Exposures inside Passenger Vehicles. Environ. Sci. Technol. 2014, 48, 2328–2335. [Google Scholar] [CrossRef]
- Morawska, L.; Ristovski, Z.; Jayaratne, E.R.; Keogh, D.U.; Ling, X. Ambient Nano and Ultrafine Particles from Motor Vehicle Emissions: Characteristics, Ambient Processing and Implications on Human Exposure. Atmos. Environ. 2008, 42, 8113–8138. [Google Scholar] [CrossRef] [Green Version]
- Song, W.W.; Ashmore, M.R.; Terry, A.C. The Influence of Passenger Activities on Exposure to Particles inside Buses. Atmos. Environ. 2009, 43, 6271–6278. [Google Scholar] [CrossRef]
- Goldman, E. Exaggerated Risk of Transmission of COVID-19 by Fomites. Lancet Infect. Dis. 2020, 20, 892–893. [Google Scholar] [CrossRef]
- Lee, E.S.; Fung, C.-C.D.; Zhu, Y. Evaluation of a High Efficiency Cabin Air (HECA) Filtration System for Reducing Particulate Pollutants Inside School Buses. Environ. Sci. Technol. 2015, 49, 3358–3365. [Google Scholar] [CrossRef]
- Chen, S.C.; Chang, D.Q.; Pei, C.; Tsai, C.J.; Pui, D.Y. Removal Efficiency of bimodal PM2.5 and PM10 by electret respirators and mechanical engine intake filters. Aerosol Air Qual. Res. 2016, 16, 1722–1729. [Google Scholar] [CrossRef] [Green Version]
- Bovallius, A.K.E.; Bucht, B.; Roffey, R.; Anäs, P. Three-year investigation of the natural airborne bacterial flora at four localities in Sweden. Appl. Environ. Microbiol. 1978, 35, 847–852. [Google Scholar] [CrossRef] [Green Version]
Figure 1.
Particulate matter (PM2.5 and PM10) concentrations measured in six buses along three routes (BUS1, BUS2, BUS3). Blue lines indicate buses with air purification systems, while red lines represent buses without these systems. The x-axis shows time after departure.
Figure 1.
Particulate matter (PM2.5 and PM10) concentrations measured in six buses along three routes (BUS1, BUS2, BUS3). Blue lines indicate buses with air purification systems, while red lines represent buses without these systems. The x-axis shows time after departure.

Figure 2.
Particulate matter (PM2.5) concentration measured in six buses along three routes (BUS1, BUS2, BUS3). Blue lines indicate outdoor concentrations measured from the nearest air quality monitoring stations. Red lines represent PM2.5 concentrations inside selected buses. The x-axis shows elapsed time after departure.

Figure 3.
Particulate matter (PM10) concentrations measured in six buses along three different routes (BUS1, BUS2, BUS3). Blue lines indicate outdoor concentrations obtained from the nearest air quality monitoring stations, while red lines represent PM10 concentration inside the buses. The x-axis shows the time after the departure.

Figure 4.
Concentrations of airborne bacteria measured in six buses. Blue lines represent buses with air purification systems, while red lines represent those without air purification systems. The x-axis represents time since departure.
Figure 4.
Concentrations of airborne bacteria measured in six buses. Blue lines represent buses with air purification systems, while red lines represent those without air purification systems. The x-axis represents time since departure.

Figure 5.
Carbon dioxide (CO2) concentrations (red lines) measured in six buses along three routes (BUS1, BUS2, BUS3). Blue lines represent the number of passengers (including the driver and researcher). The x-axis shows time after departure. The left y-axis indicates CO2 concentrations and the right y-axis the number of passengers.


Table 1.
Average concentrations of particulate matter (PM2.5, PM10), carbon dioxide (CO2), and airborne bacteria indoors and outdoors, along with the indoor-to-outdoor ratio (IOR), and the average number of passengers, average temperature, and average relative humidity.
Table 1.
Average concentrations of particulate matter (PM2.5, PM10), carbon dioxide (CO2), and airborne bacteria indoors and outdoors, along with the indoor-to-outdoor ratio (IOR), and the average number of passengers, average temperature, and average relative humidity.
| Bus | BUS1 | BUS2 | BUS3 | |||||||
|---|---|---|---|---|---|---|---|---|---|---|
| Air Purification | On | Off | Ratio | On | Off | Ratio | On | Off | Ratio | |
| PM25 | Indoor [μg/m3] | 7.0 | 17.4 | 40% | 8.2 | 12.3 | 67% | 2.1 | 5.3 | 40% |
| Outdoor [μg/m3] | 22.8 | 23.2 | 98% | 23.6 | 19.9 | 119% | 27.7 | 27.3 | 101% | |
| IOR | 0.31 | 0.75 | 41% | 0.35 | 0.62 | 56% | 0.08 | 0.19 | 42% | |
| PM10 | Indoor [μg/m3] | 7.9 | 20.3 | 39% | 10.4 | 13.8 | 75% | 3.8 | 7.8 | 49% |
| Outdoor [μg/m3] | 45.3 | 47.2 | 96% | 72.4 | 73.2 | 99% | 51.8 | 53.9 | 96% | |
| IOR | 0.17 | 0.43 | 40% | 0.14 | 0.19 | 74% | 0.07 | 0.14 | 50% | |
| Bacteria [CFU/m3] | Whole trip | 36.8 | 165.4 | 22% | 129.4 | 89.4 | 145% | 83.5 | 105.2 | 79% |
| 30 min and after | 42.4 | 195.2 | 22% | 51.1 | 83.6 | 61% | 77.1 | 101.3 | 76% | |
| CO2 | CO2 [ppm] | 1223.5 | 931.4 | 131% | 3545.1 | 2478.2 | 143% | 1385.0 | 1763.5 | 79% |
| Passenger | 10.0 | 7.8 | 128% | 24.4 | 20.2 | 121% | 14.4 | 19.7 | 73% | |
| CO2/passengers | 122.0 | 119.3 | 102% | 145.1 | 122.7 | 118% | 96.2 | 89.4 | 108% | |
| Temperature | Indoor [°C] | 19.6 | 20.6 | 95% | 21.1 | 21.1 | 100% | 26.2 | 25.3 | 104% |
| Outdoor [°C] | 12.4 | 12.5 | 99% | 14.6 | 15.4 | 95% | 12.8 | 12.6 | 102% | |
| IOR | 1.58 | 1.65 | 96% | 1.45 | 1.37 | 105% | 2.05 | 2.01 | 102% | |
| Relative humidity | Indoor [%] | 47.2 | 48.7 | 97% | 56.3 | 43.9 | 128% | 30.0 | 31.0 | 97% |
| Outdoor [%] | 78.7 | 79.3 | 99% | 48.0 | 47.2 | 102% | 48.1 | 52.9 | 91% | |
| IOR | 0.60 | 0.61 | 98% | 1.17 | 0.93 | 126% | 0.62 | 0.59 | 106% | |
Publisher’s Note: MDPI stays neutral with regard to jurisdictional claims in published maps and institutional affiliations. |
© 2021 by the authors. Licensee MDPI, Basel, Switzerland. This article is an open access article distributed under the terms and conditions of the Creative Commons Attribution (CC BY) license (https://creativecommons.org/licenses/by/4.0/).
Share and Cite
MDPI and ACS Style
Lee, J.J.; Hwang, H.; Hong, S.C.; Lee, J.Y. Effect of Air Purification Systems on Particulate Matter and Airborne Bacteria in Public Buses. Atmosphere 2022, 13, 55. https://doi.org/10.3390/atmos13010055
AMA Style
Lee JJ, Hwang H, Hong SC, Lee JY. Effect of Air Purification Systems on Particulate Matter and Airborne Bacteria in Public Buses. Atmosphere. 2022; 13(1):55. https://doi.org/10.3390/atmos13010055
Chicago/Turabian StyleLee, Jae Jung, Hyemin Hwang, Suk Chan Hong, and Jae Young Lee. 2022. "Effect of Air Purification Systems on Particulate Matter and Airborne Bacteria in Public Buses" Atmosphere 13, no. 1: 55. https://doi.org/10.3390/atmos13010055
Note that from the first issue of 2016, this journal uses article numbers instead of page numbers. See further details here.