Article

Impact of Indoor-Outdoor Temperature Difference on Building Ventilation and Pollutant Dispersion within Urban Communities

1
State Environmental Protection Key Laboratory of Atmospheric Physical Modeling and Pollution Control, Nanjing 210031, China
2
Southern Marine Science and Engineering Guangdong Laboratory (Zhuhai), School of Atmospheric Sciences, Sun Yat-sen University, Zhuhai 519082, China
3
Department of Mechanical Engineering, The University of Hong Kong, Pokfulam Road, Hong Kong 999077, China
*
Author to whom correspondence should be addressed.
These authors contributed equally to this work.
Atmosphere 2022, 13(1), 28; https://doi.org/10.3390/atmos13010028
Submission received: 31 October 2021 / Revised: 20 December 2021 / Accepted: 21 December 2021 / Published: 25 December 2021
(This article belongs to the Special Issue Data-Driven Methods in Atmospheric Dispersion Modelling)

Abstract

:
Mechanical ventilation consumes a huge amount of global energy. Natural ventilation is a crucial solution for reducing energy consumption and enhancing the capacity of atmospheric self-purification. This paper evaluates the impacts of indoor-outdoor temperature differences on building ventilation and indoor-outdoor air pollutant dispersion in urban areas. The Computational Fluid Dynamics (CFD) method is employed to simulate the flow fields in the street canyon and indoor environment. Ventilation conditions of single-side ventilation mode and cross-ventilation mode are investigated. Air change rate, normalized concentration of traffic-related air pollutant (CO), intake fraction and exposure concentration are calculated to for ventilation efficiency investigation and exposure assessment. The results show that cross ventilation increases the air change rate for residential buildings under isothermal conditions. With the indoor-outdoor temperature difference, heating could increase the air change rate of the single-side ventilation mode but restrain the capability of the cross-ventilation mode in part of the floors. Heavier polluted areas appear in the upstream areas of single-side ventilation modes, and the pollutant can diffuse to middle-upper floors in cross-ventilation modes. Cross ventilation mitigates the environmental health stress for the indoor environment when indoor-outdoor temperature difference exits and the personal intake fraction is decreased by about 66% compared to the single-side ventilation. Moreover, the existence of indoor-outdoor temperature differences can clearly decrease the risk of indoor personal exposure under both two natural ventilation modes. The study numerically investigates the building ventilation and pollutant dispersion in the urban community with natural ventilation. The method and the results are helpful references for optimizing the building ventilation plan and improving indoor air quality.

1. Introduction

More than half of the current global population lives in urban areas. This proportion keeps increasing and could reach 68% by 2050 [1]. Rapid urbanization, deteriorating air quality, and air pollutants exposure increase the risks of respiratory and cardiovascular diseases on residents in urban areas [2,3]. However, pollutants dispersion and human exposure in urban areas are closely linked to urban ventilation and building ventilation [4,5], especially for the buildings that are naturally ventilated [6,7,8]. Indoor activities occupy about 90% of the majority of people’s lifetimes, and indoor air quality is affected by outdoor air pollutants via ventilation. Hence, the residents living in curb-side buildings are exposed to higher concentrated air pollutants from traffic emissions [3,9,10], and have a pressing need of optimizing ventilation plans to reduce exposure risks [11,12].
Mechanical ventilation consumes a huge amount of global energy. The expansion of an urban area magnifies the thermal capacity of the urban canopy during the day and the long wave radiation in the night [13,14]. This strongly enhances the urban heat island intensity (UHII), consequently enhances the human heat stress, and increases the energy consumption for cooling [15,16]. On the other hand, indoor heating also consumes huge amounts of energy in high-latitude areas or during cold weather. Previous studies found that about 26.46% of the annual energy consumption of residential buildings was used for indoor ventilation, heating, and air conditioning [17]. Natural ventilation based on the indoor-outdoor air mass exchange is a crucial solution for reducing energy consumption and enhancing the capacity of atmospheric self-purification, especially in tropical and sub-tropical areas, or during heat wave events. Natural ventilation with wind-driven mode can enhance the indoor-outdoor air flow. The difference of indoor-outdoor air temperature will produce thermal-driven ventilation. Favarolo et al. [18] studied the influence of indoor-outdoor air temperature difference (ΔT) on the building ventilation, and concluded that the ventilation was improved in the single-side ventilated building when ΔT > 6 K.
Researchers found that indoor air pollutants and aerosol transmission of infection can be transported for a long distance (>1 m) in the air [19]. Hence, the indoor-outdoor air mass exchange by natural ventilation could induce the diffusion of outdoor air pollutants into indoor environments, as well. Li et al. [20] studied 40 cases in different indoor environments and found the correlation between pathogenesis of infectious diseases and indoor ventilation. Moreover, the dynamic force of the wind could enhance the cascading effect and transport the air pollutants between different building floors. The phenomenon occurred in the outbreak of SARS (in Amoy Garden, 2003) and led to the airborne transmission of the virus between flats in high-rise residential buildings [21,22].
Due to the development of research techniques, field observations [23,24,25], scaled-model experiments [26,27,28,29], wind-tunnel experiments [30,31,32,33], and computational fluid dynamics (CFD) modelling [34,35,36,37,38,39,40,41] are widely used to study the flow and pollutants dispersion in idealized or real urban environments. Comparing to field observations and physical-model experiments [37,42,43], CFD modelling is an efficient tool with lower cost, higher temporal-spatial resolution, controllable boundary conditions and comprehensive investigations for multiple parameters [44,45,46]. The refined numerical modellings offer a complete and detailed structure of the flow, energy, and dispersion.
Numerical modelling with Large Eddy Simulations (LES) has better accuracy and performs perfectly in turbulence simulations compared to the Reynolds-Averaged Navier-Stokes (RANS) models [47,48,49,50]. Nevertheless, LES models require enormous computational resources, and have difficulty specifying better boundary conditions. Thus, RANS models are still widely employed for turbulence modelling [51,52,53,54,55]. One of the widely used RANS models is the RNG k-ε model. Previous studies concluded that it was one of the best approaches for exploring bluff body flows including heat transfer and studying pollutant dispersion [32,54,56,57,58,59]. Hence, in this work, the RNG k-ε model is employed to simulate the indoor and outdoor air flow and pollutants dispersion.
The health effects of the air pollutants are investigated by multiple parameters in this study. The parameter intake fraction (IF) is adopted in this work for the numerical investigation of the health effect induced by the alteration of ventilation efficiency. IF is the ratio of the inhaled air pollutant by a certain population and its total emission [60,61]. It is a useful index for exposure assessment, especially for numerically investigating the exposure of traffic-related pollutants on the residents [61,62,63]. Relevant parameters for exposure assessment such as the age group, the breathing rate, and the micro-environment are considered in the IF calculation.
According to the literature, further studies are still necessary to explore the impact factors on the efficiency of building ventilation, and the related pollutant exposure on residents, as well. In this study, indoor-outdoor air temperature differences and the alteration of building ventilation modes are considered for different scenarios. Air change rate, normalized concentration, and exposure concentration in different scenarios are analysed for numerical investigation of the pollutant dispersion and the related health effects. This work applies a useful method and helpful references for optimizing the program of building ventilation and improving indoor air quality.

2. Materials and Methods

2.1. Set Up for Numerical Modelling

2.1.1. CFD Model Description

In this paper, the Ansys FLUENT (version 15.0) with RNG k-ε model is applied for airflow simulations. The flow in the modelling is assumed to be an incompressible fluid along with the Boussinesq approximation [64].
Due to the inertness and the low background concentration in the atmosphere, CO is widely used as a tracer for the traffic emission in simulating the dispersion of near-ground vehicular pollutant and investigating related human exposure [5,61,63]. In this work, we also use CO as the indication for traffic-related air pollutants. The governing equation for CO dispersion is:
u j ¯ C x j x j [ ( D m + D t ) C x j ] = S
where C is the CO concentration (kg/m3). D m and D t are the molecular diffusivity and the turbulent diffusivity. D t = ν t / S C t , where ν t and S C t are the kinematic eddy viscosity and the turbulent Schmidt number. S C t = 0.7 is used in this work as we find it has the best performance in our preliminary work [65] comparing to the wind-tunnel experiment results [52]. S is the emission rate of CO and is set as 1.3 × 10⁻⁶ kg/m3/s referring to [12].

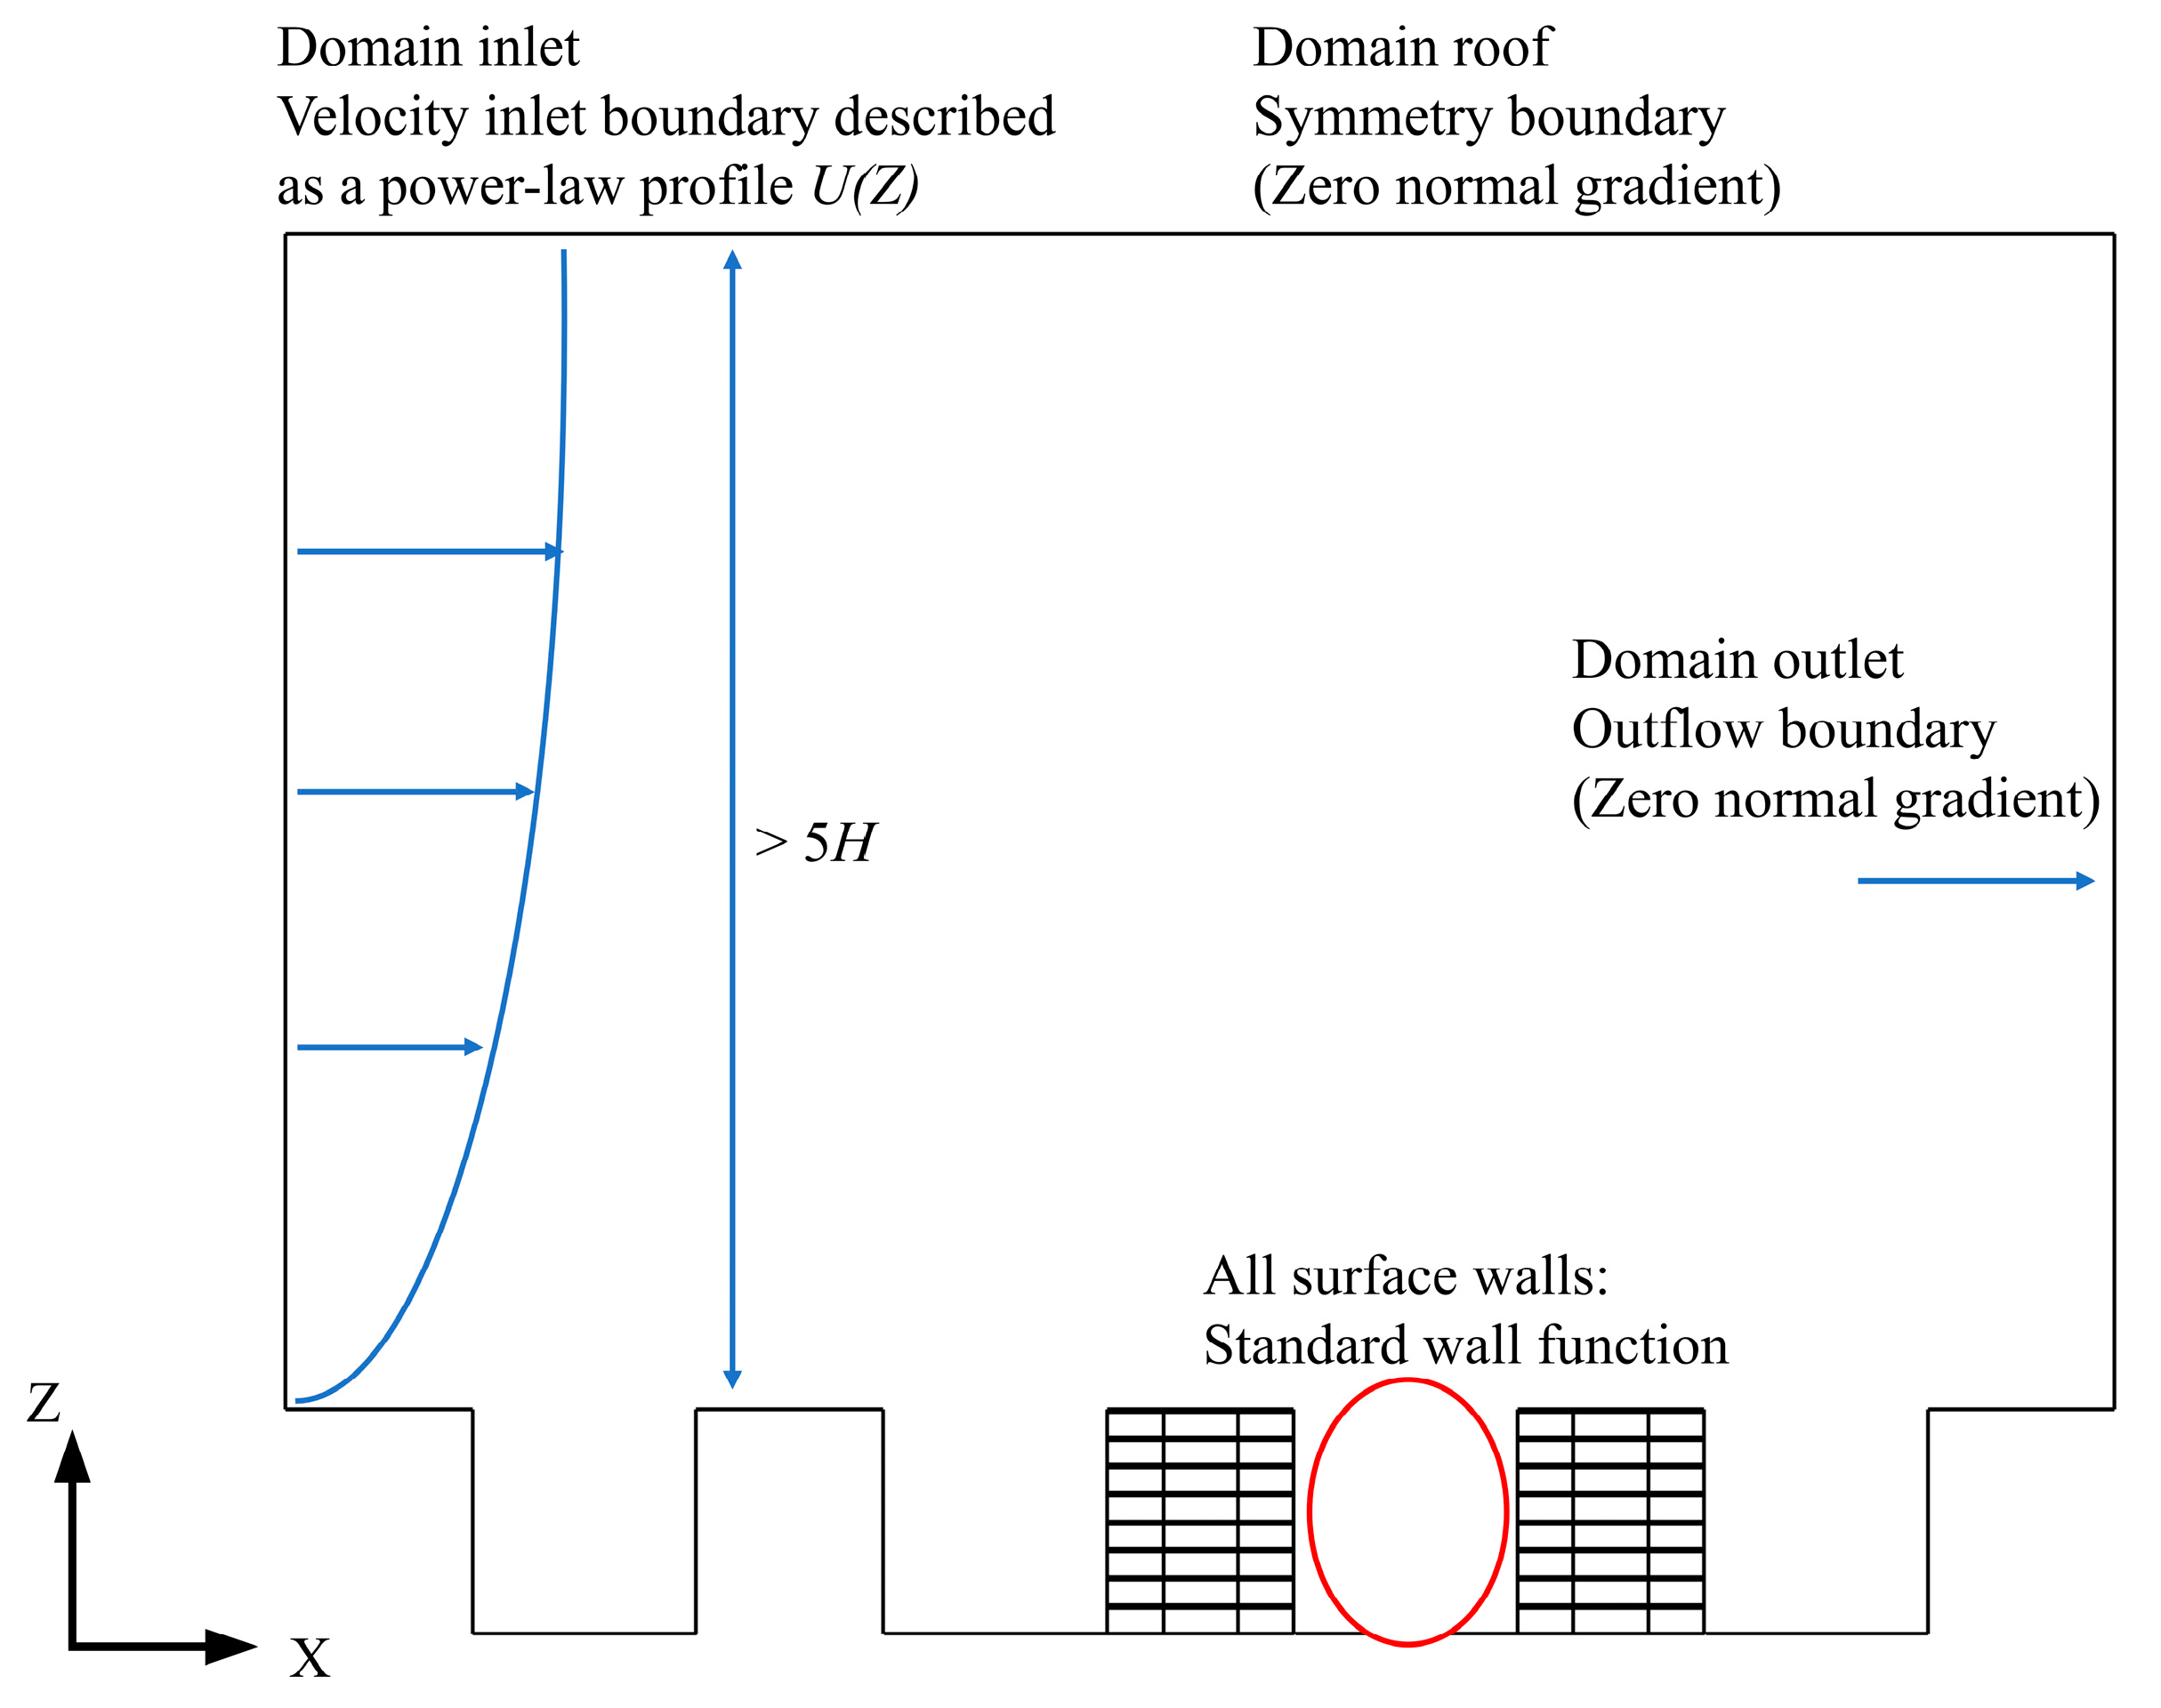
2.1.2. Boundary Conditions

The principles of AIJ (Architectural Institute of Japan) and COST (European Cooperation in Science and Technology) are followed in this study for the model set-up of the boundary condition [66,67]. Non-slip wall conditions and standard wall function are employed for near-wall and near-surface treatments (Figure 1). Zero normal gradient conditions are applied at two domain laterals (i.e., symmetry), domain top (i.e., symmetry), and the domain outlet (i.e., outflow).
The outdoor wind velocity above the ground surface increases with the rising height due to the existence of the surface friction. Hence the wind velocity under 300 m is defined by the mean gradient of the velocity. The profile of the wind velocity is described by Equation (2) [4,68].
U z = U g ( z / h ) α
where Uz is the wind velocity at the height of z; Ug is the wind velocity above the atmospheric boundary layer; h is the height of the ABL, and we use h = 270 m in this work; α is the underlying surface roughness, and in this work α = 0.22 is adopted to denote the moderate-dense urban area. The outdoor incoming flow at the domain inlet is set as the inlet velocity, and the temperature of the inlet flow is set as 295.15 K. The SIMPLE scheme is applied for coupling pressure and velocity.

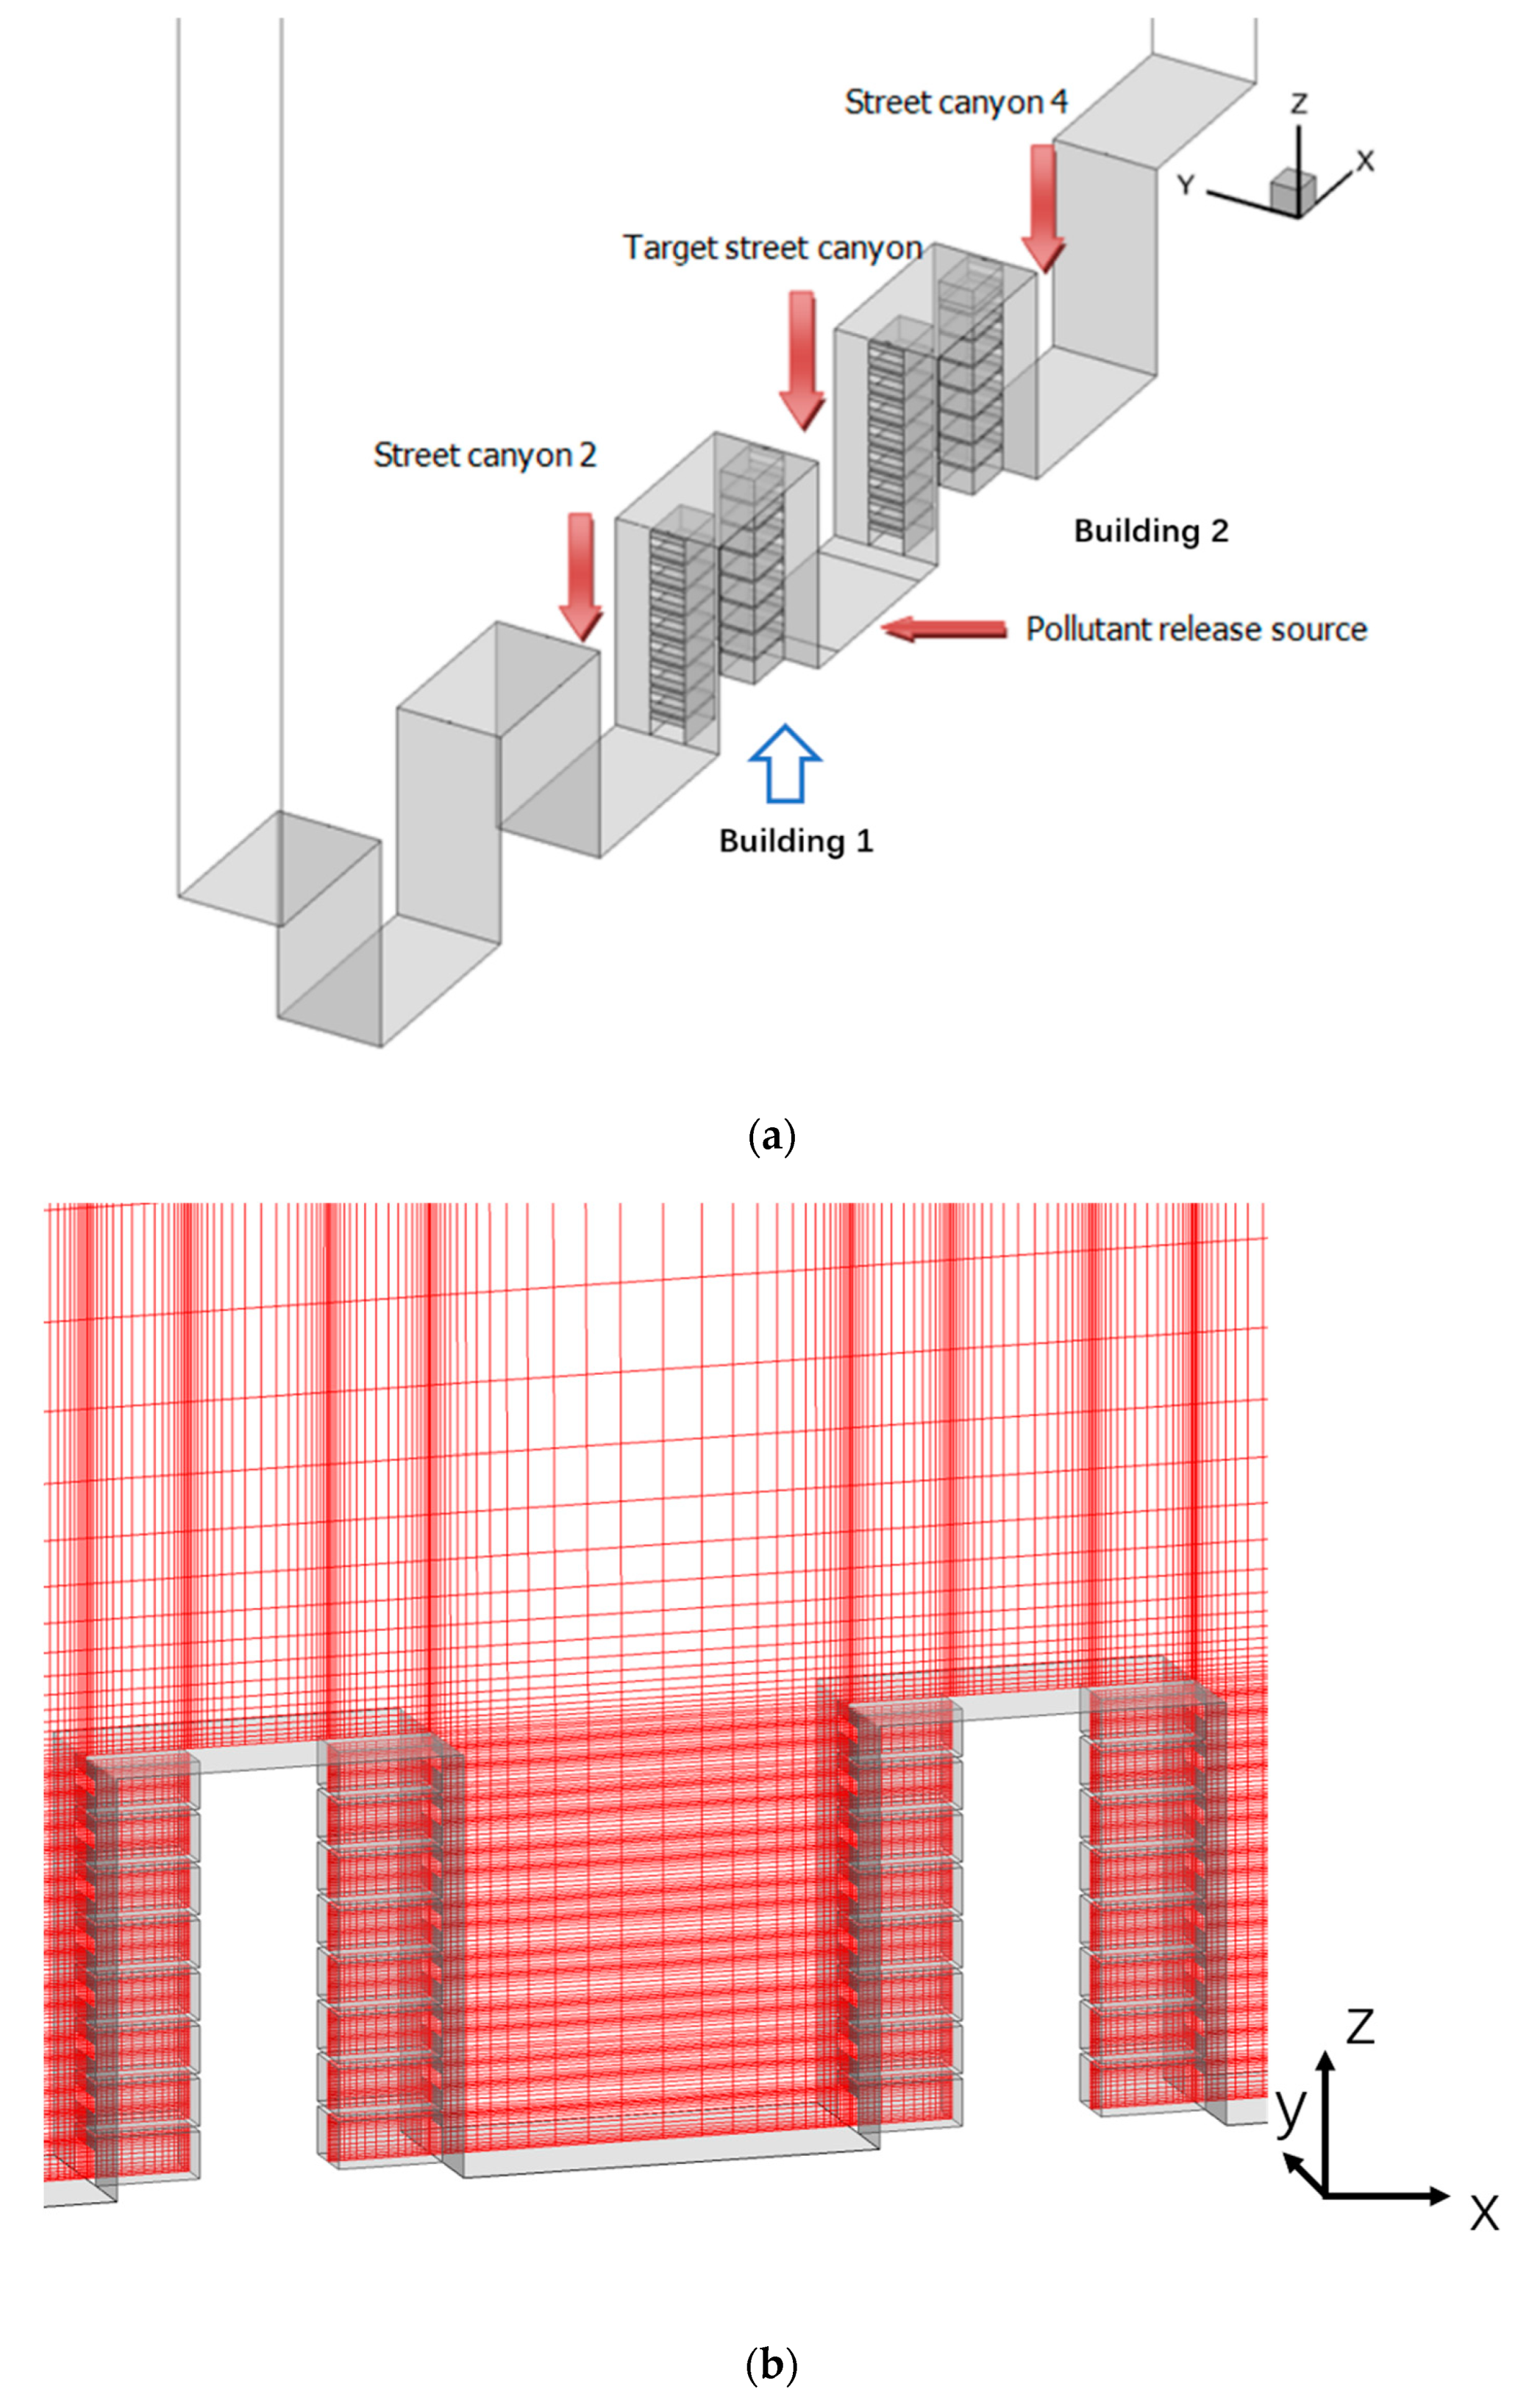
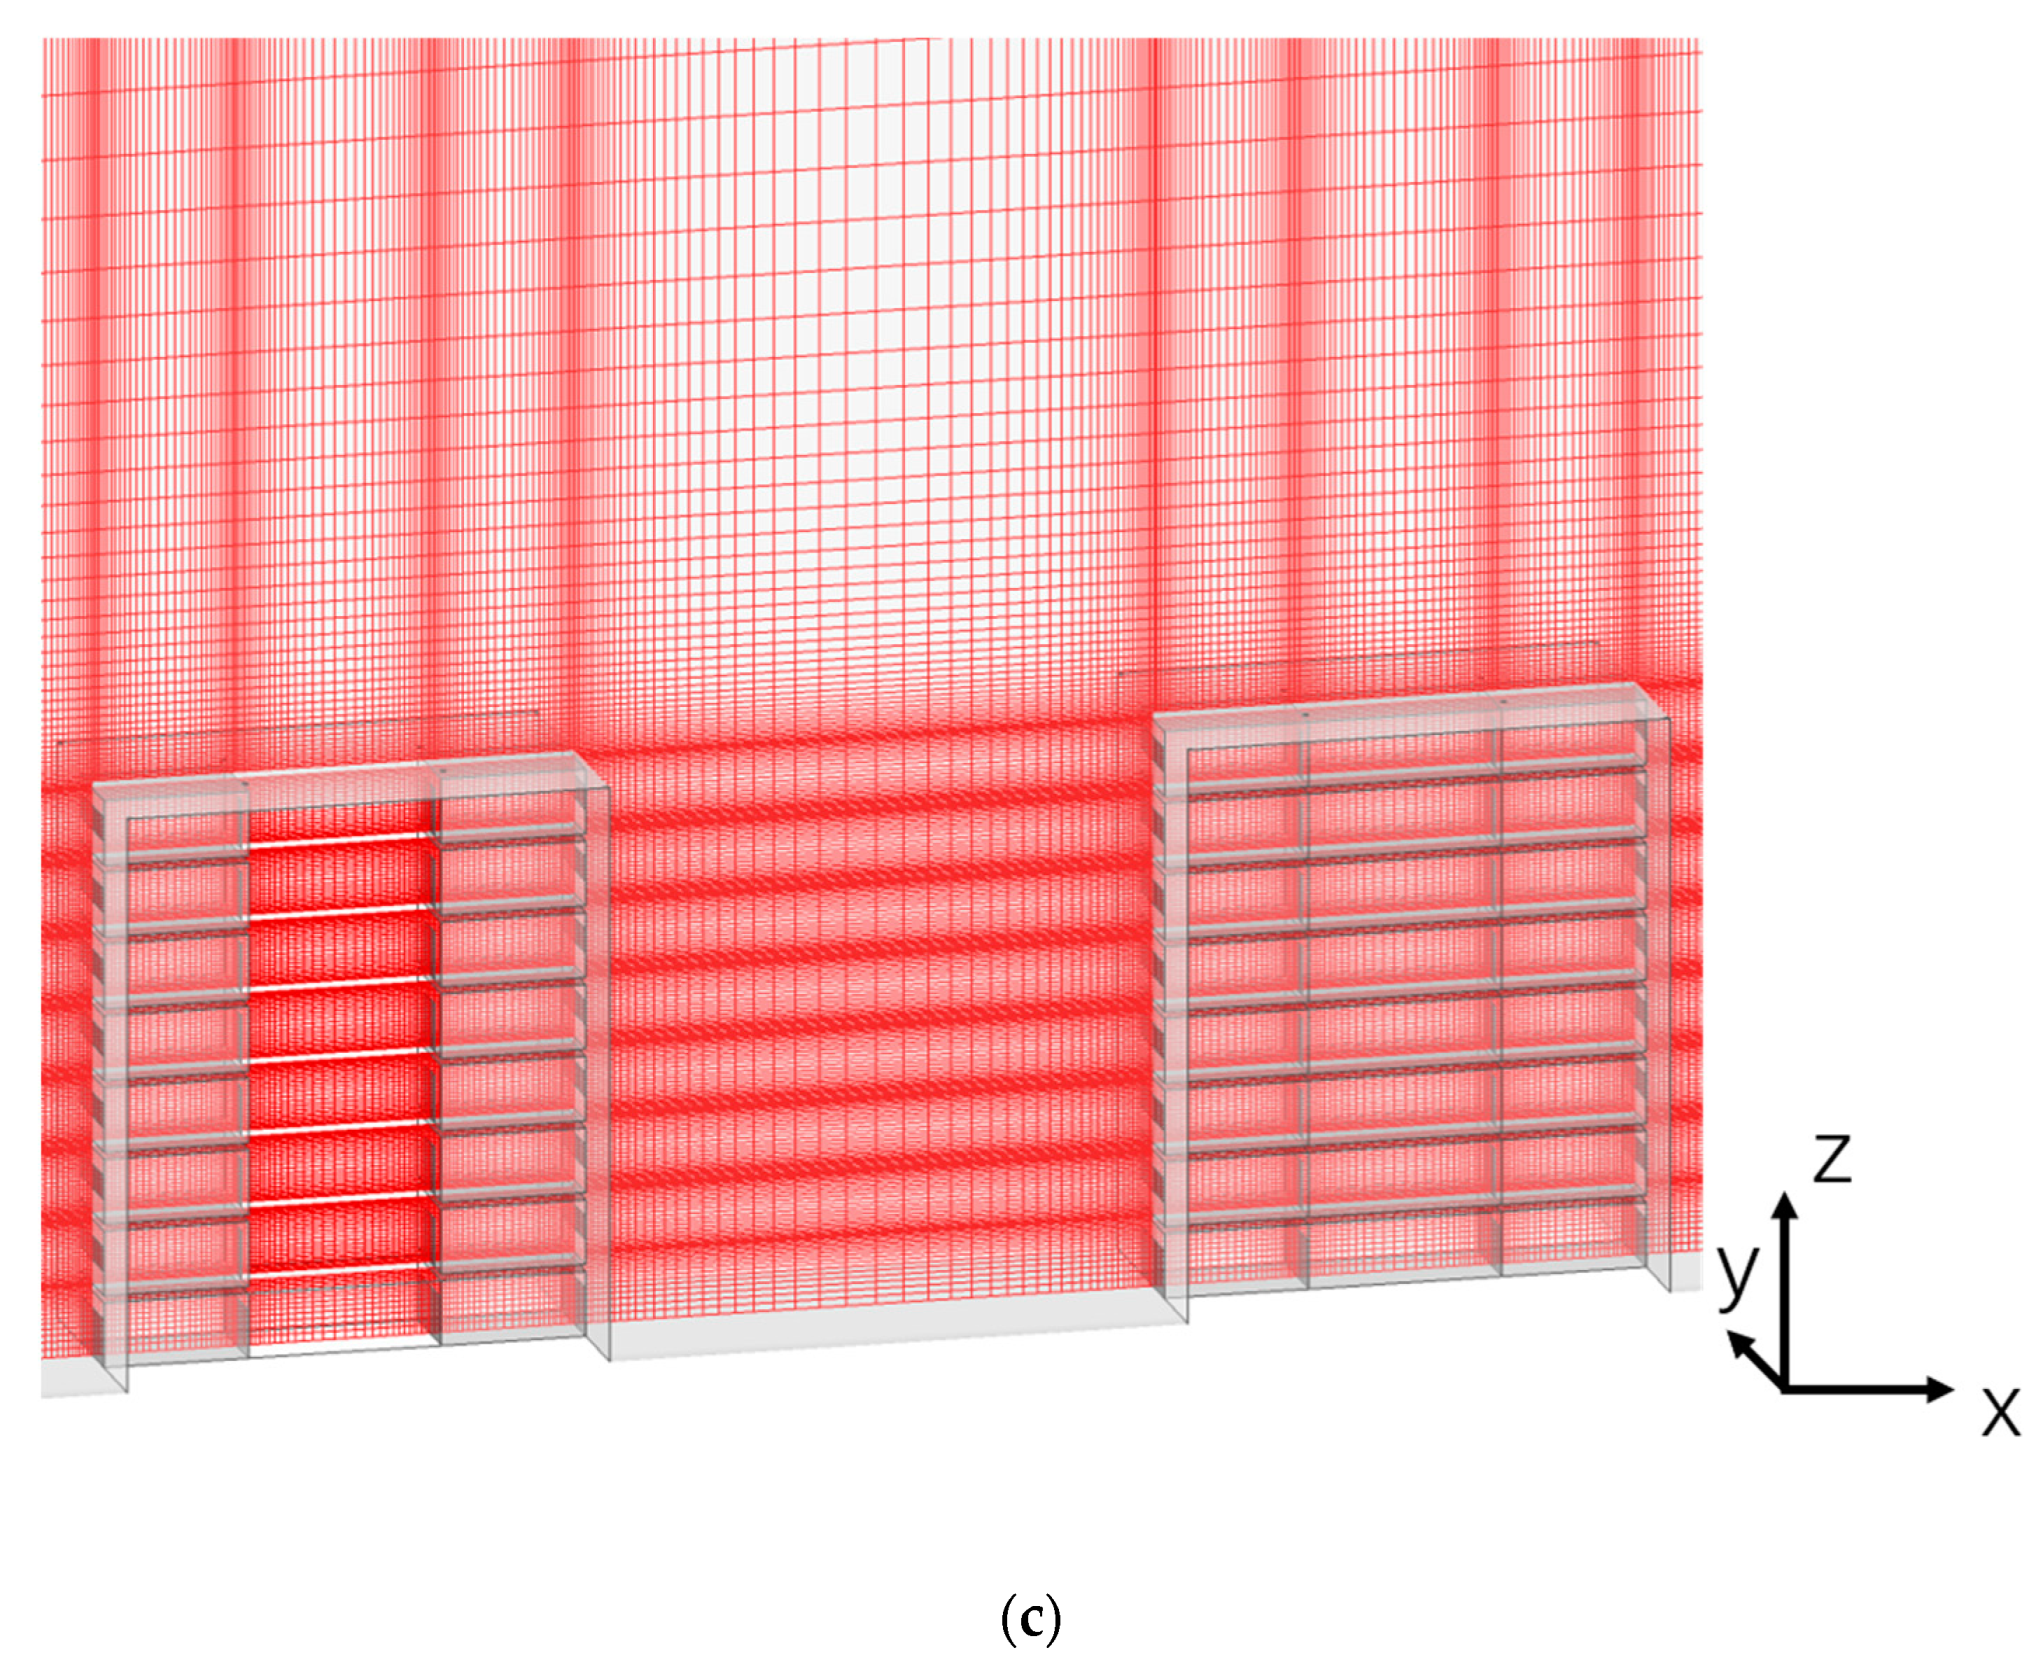
2.1.3. Model Set-Up and Mesh Arrangement

A single-side ventilation model and cross ventilation model are set up for studying their impacts on natural building ventilation as well as their influences on the diffusion of the outdoor air pollutants to indoor environments. Figure 2a illustrations the full-scale street canyon models employed in this study. The 2D street canyons consist of five uniform residential building models and four canyons, with the building height (H) = 24 m and the street width (W) = 24 m. The aspect ratio (AR = H/W) is 1. The target area is the third street canyon and the buildings on the two sides. The CO emission source is set in the target street canyon with 0.5 m in height and 16 m in width. The distances of the emission source to the buildings are set as 4 m on both sides. The two target buildings are named as Building 1 and Building 2, as shown in Figure 2a. Other buildings at the upstream and the downstream are employed for representing the impacts of the roughness elements and getting well-developed turbulence [54,55,56,69].
The dimension of the building model is 20 m (x) × 12 m (y) × 24 m (z). Each building has eight floors, and each floor has two rooms with the size of 6 m (x)× 4 m (y)× 2.7 m (z). Each room on the first floor (F1) has two doors (1.6 m × 2 m) on the facade and the opposite side. Each room on the second floor and above floors (F2–F8) has one window (4 m × 1 m) on the facade facing towards the street, and a door (1.6 m × 2 m) on the opposite side of the window. The space in the middle of each floor is the public corridor. In single-side ventilation scenarios, the doors or windows facing the street are open and the doors on the opposite side are closed. In cross-ventilation scenarios, all windows and doors are open. Simulation case series are named as listed in Table 1 according to the ventilation modes and indoor-outdoor air temperature differences (ΔT).
Non-slip wall conditions and standard wall functions are applied for all ground surfaces, building walls and indoor walls. In cases with ΔT ≠ 0, the indoor thermal source is supposed to be homogeneous on the six room walls for each room, and the heat flux is set as 100 W/m2. The dimension of the computational domain is 196 m × 12 m × 150 m (>>5H). Structured hexahedral mesh is applied in the whole computational domain, and dense mesh is adopted at each vent (Figure 2b,c). The total grid numbers produced for single-side ventilation and cross ventilation modes are 970,000 and 1,540,000, respectively.

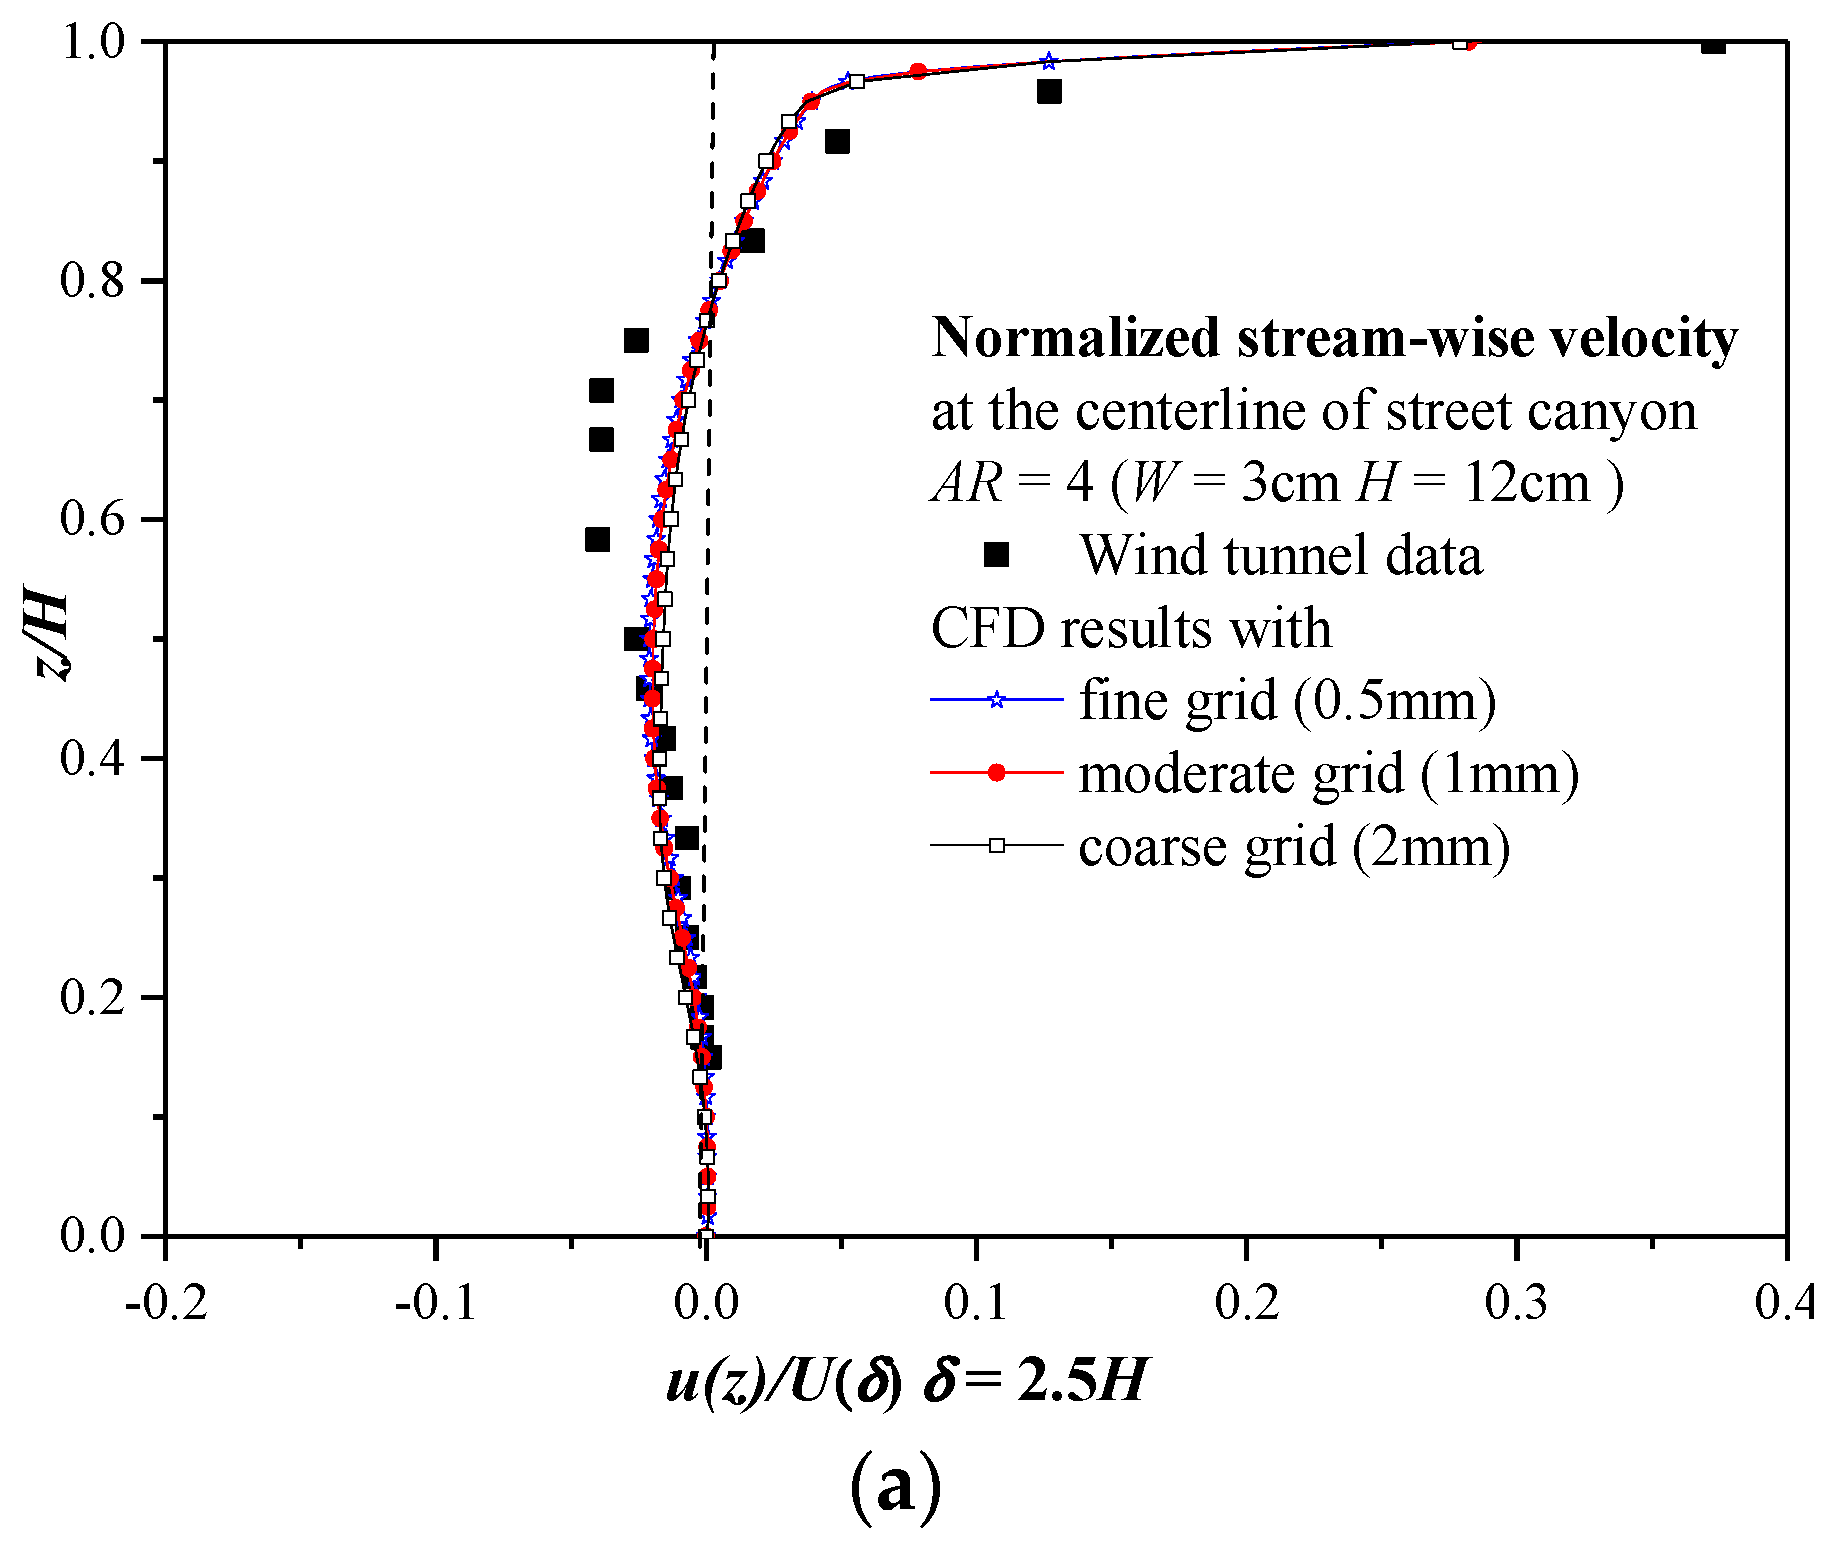
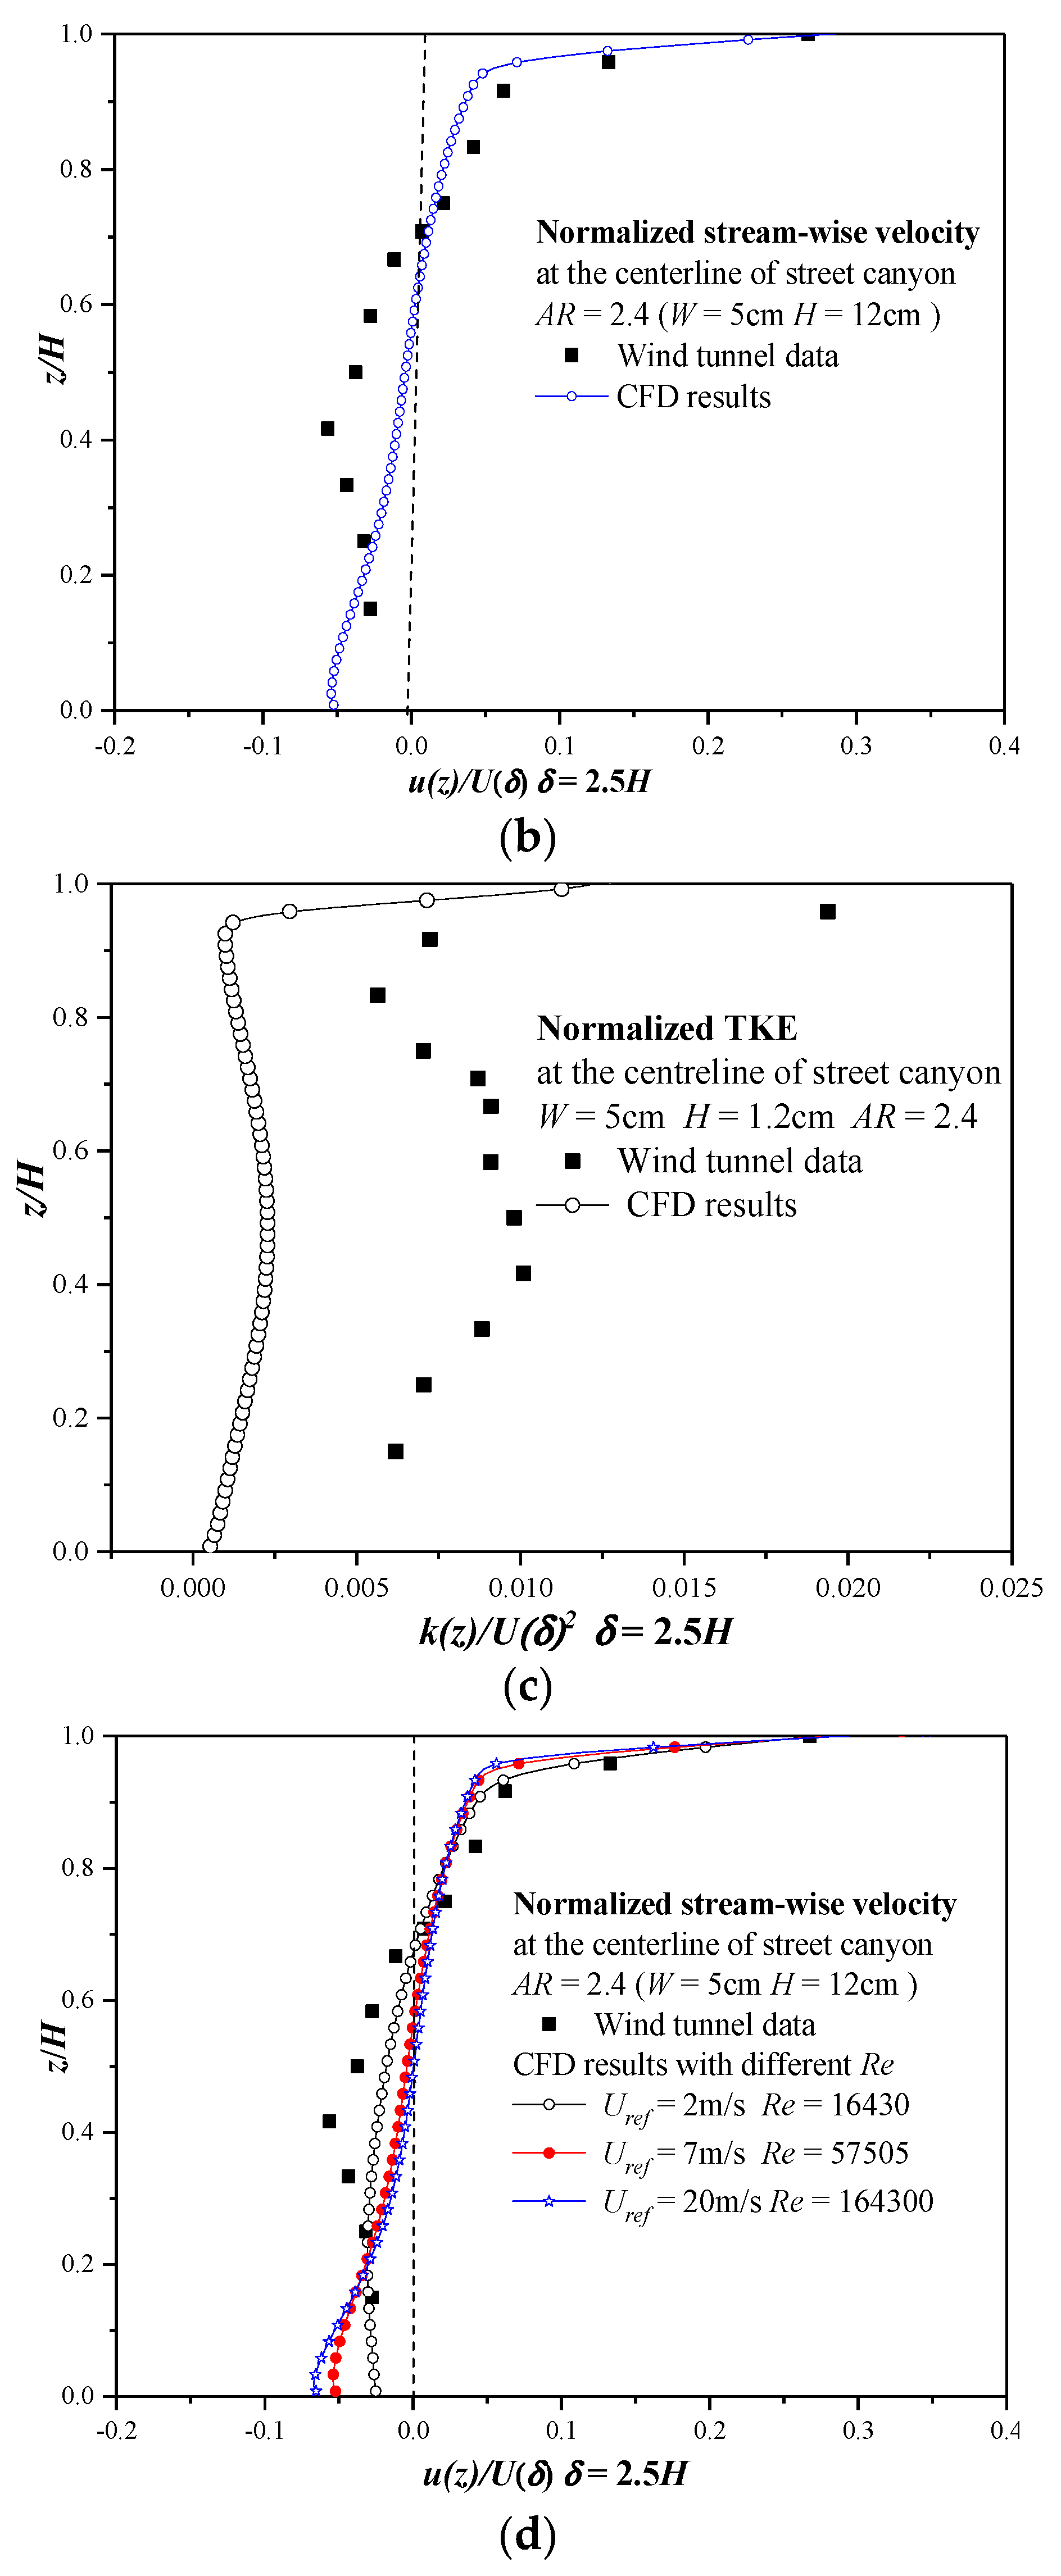
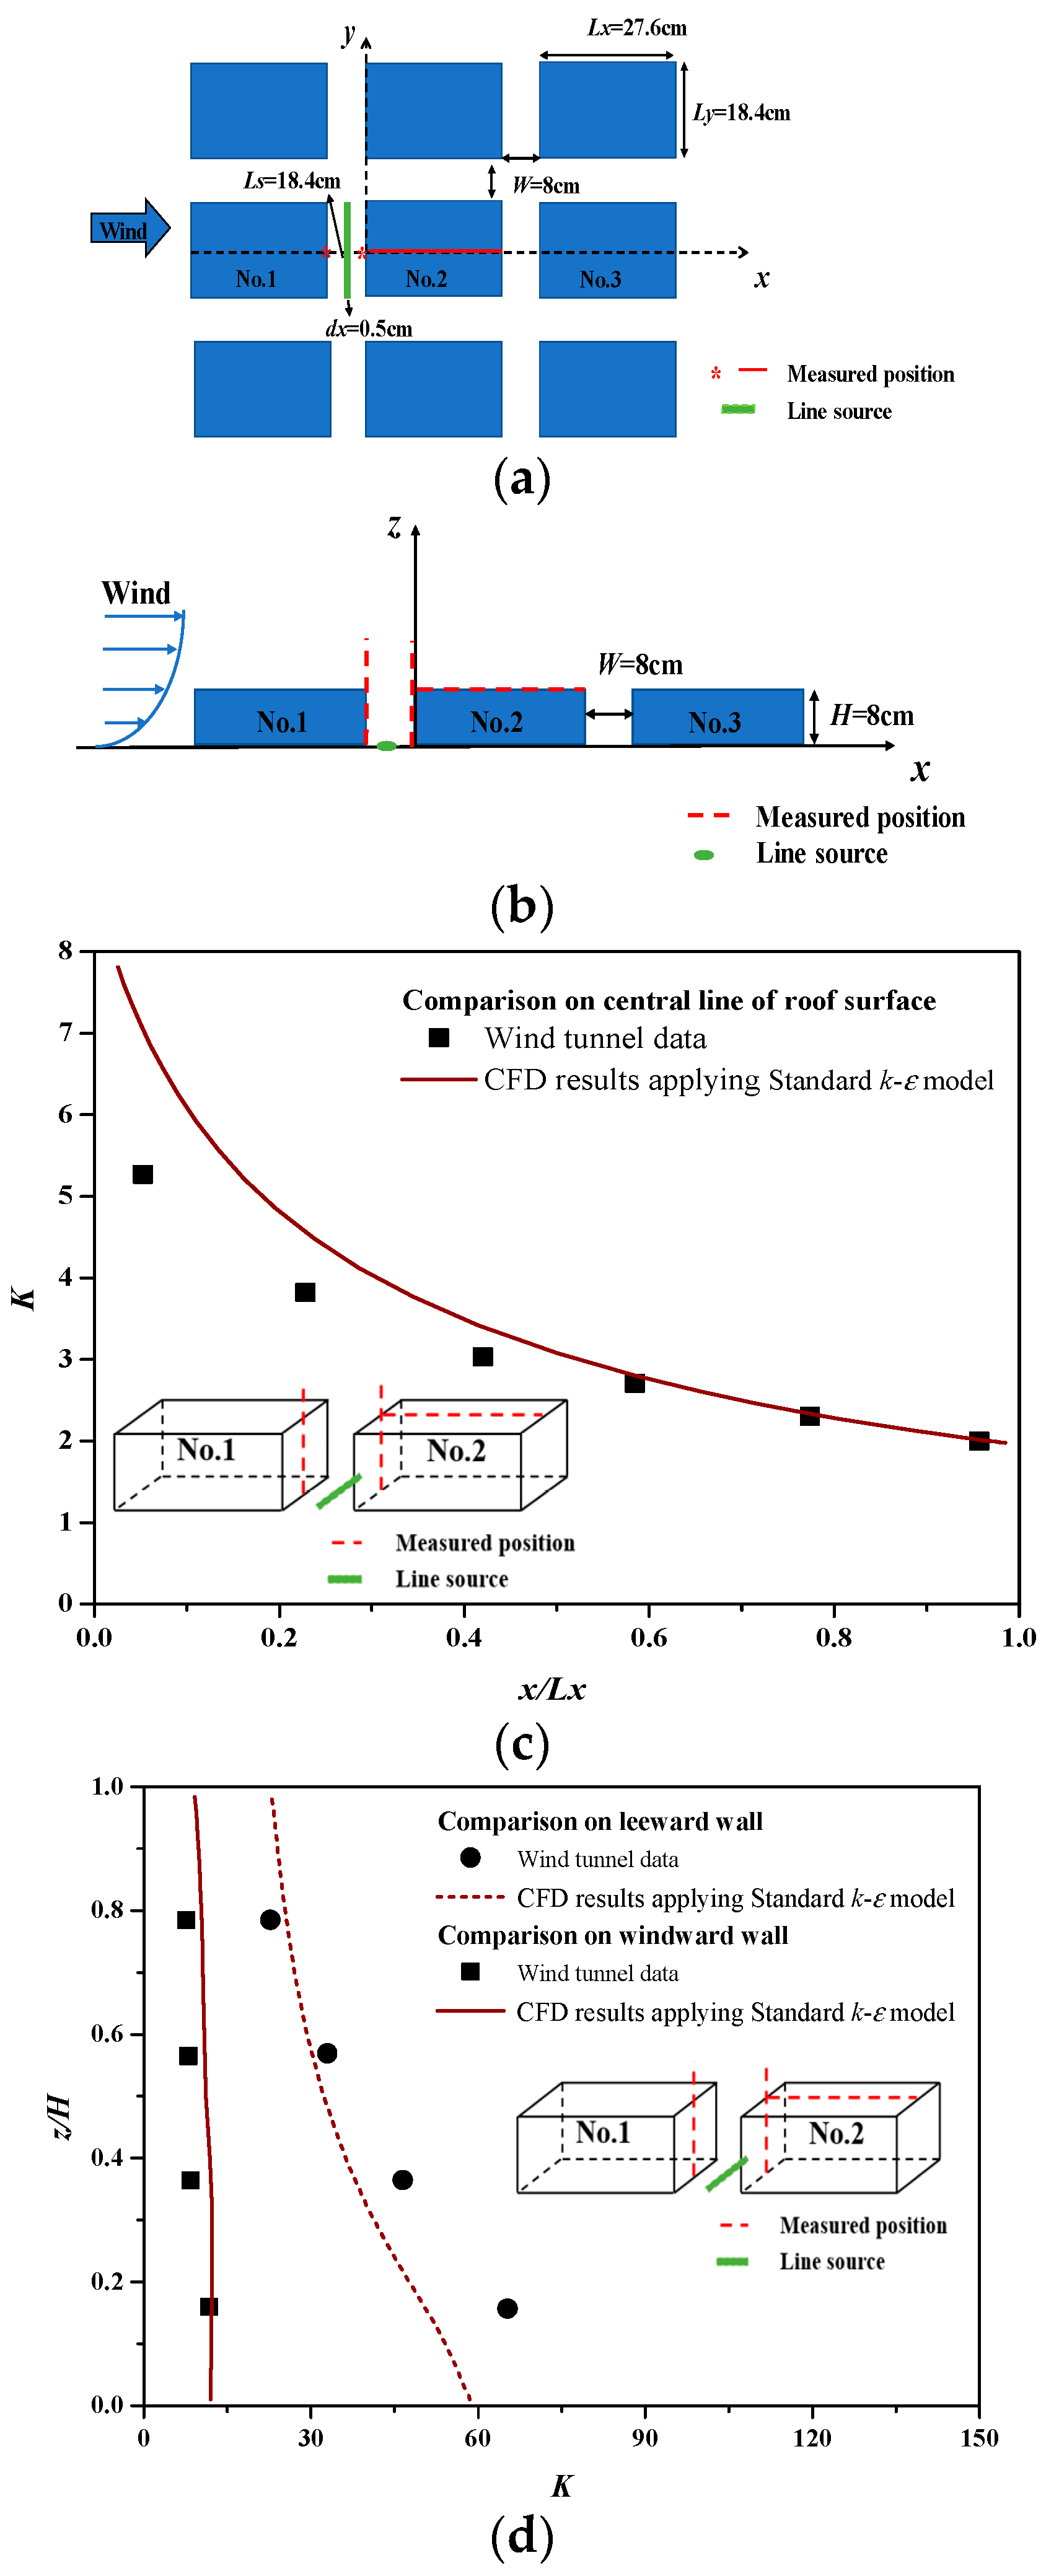
2.1.4. Comparison with the Wind-Tunnel Experiments for the Flow and Dispersion

As reviewed by Toparlar et al. [39], most CFD studies did not include a direct validation study since the high-quality observation data were very limited on both quantity and quality. Moreover, the uncontrolled or very limited controlled boundary conditions were big challenges for the repetition tests. Hence wind-tunnel experiments were widely employed for the comparison in CFD studies to verify the model reliability when the Reynolds number (Re) independence was satisfied (Re >> 11,000) [70,71,72]. In our preliminary work [73], we implemented a series of detailed comparisons for the RNG k-ε model employed in this work. The dispersion model applied was also validated in our earlier work [72]. Some important results are presented in Figure A1 and Figure A2 in Appendix A.

2.2. Definition of Critical Parameters for Ventilation and Exposure Assessment

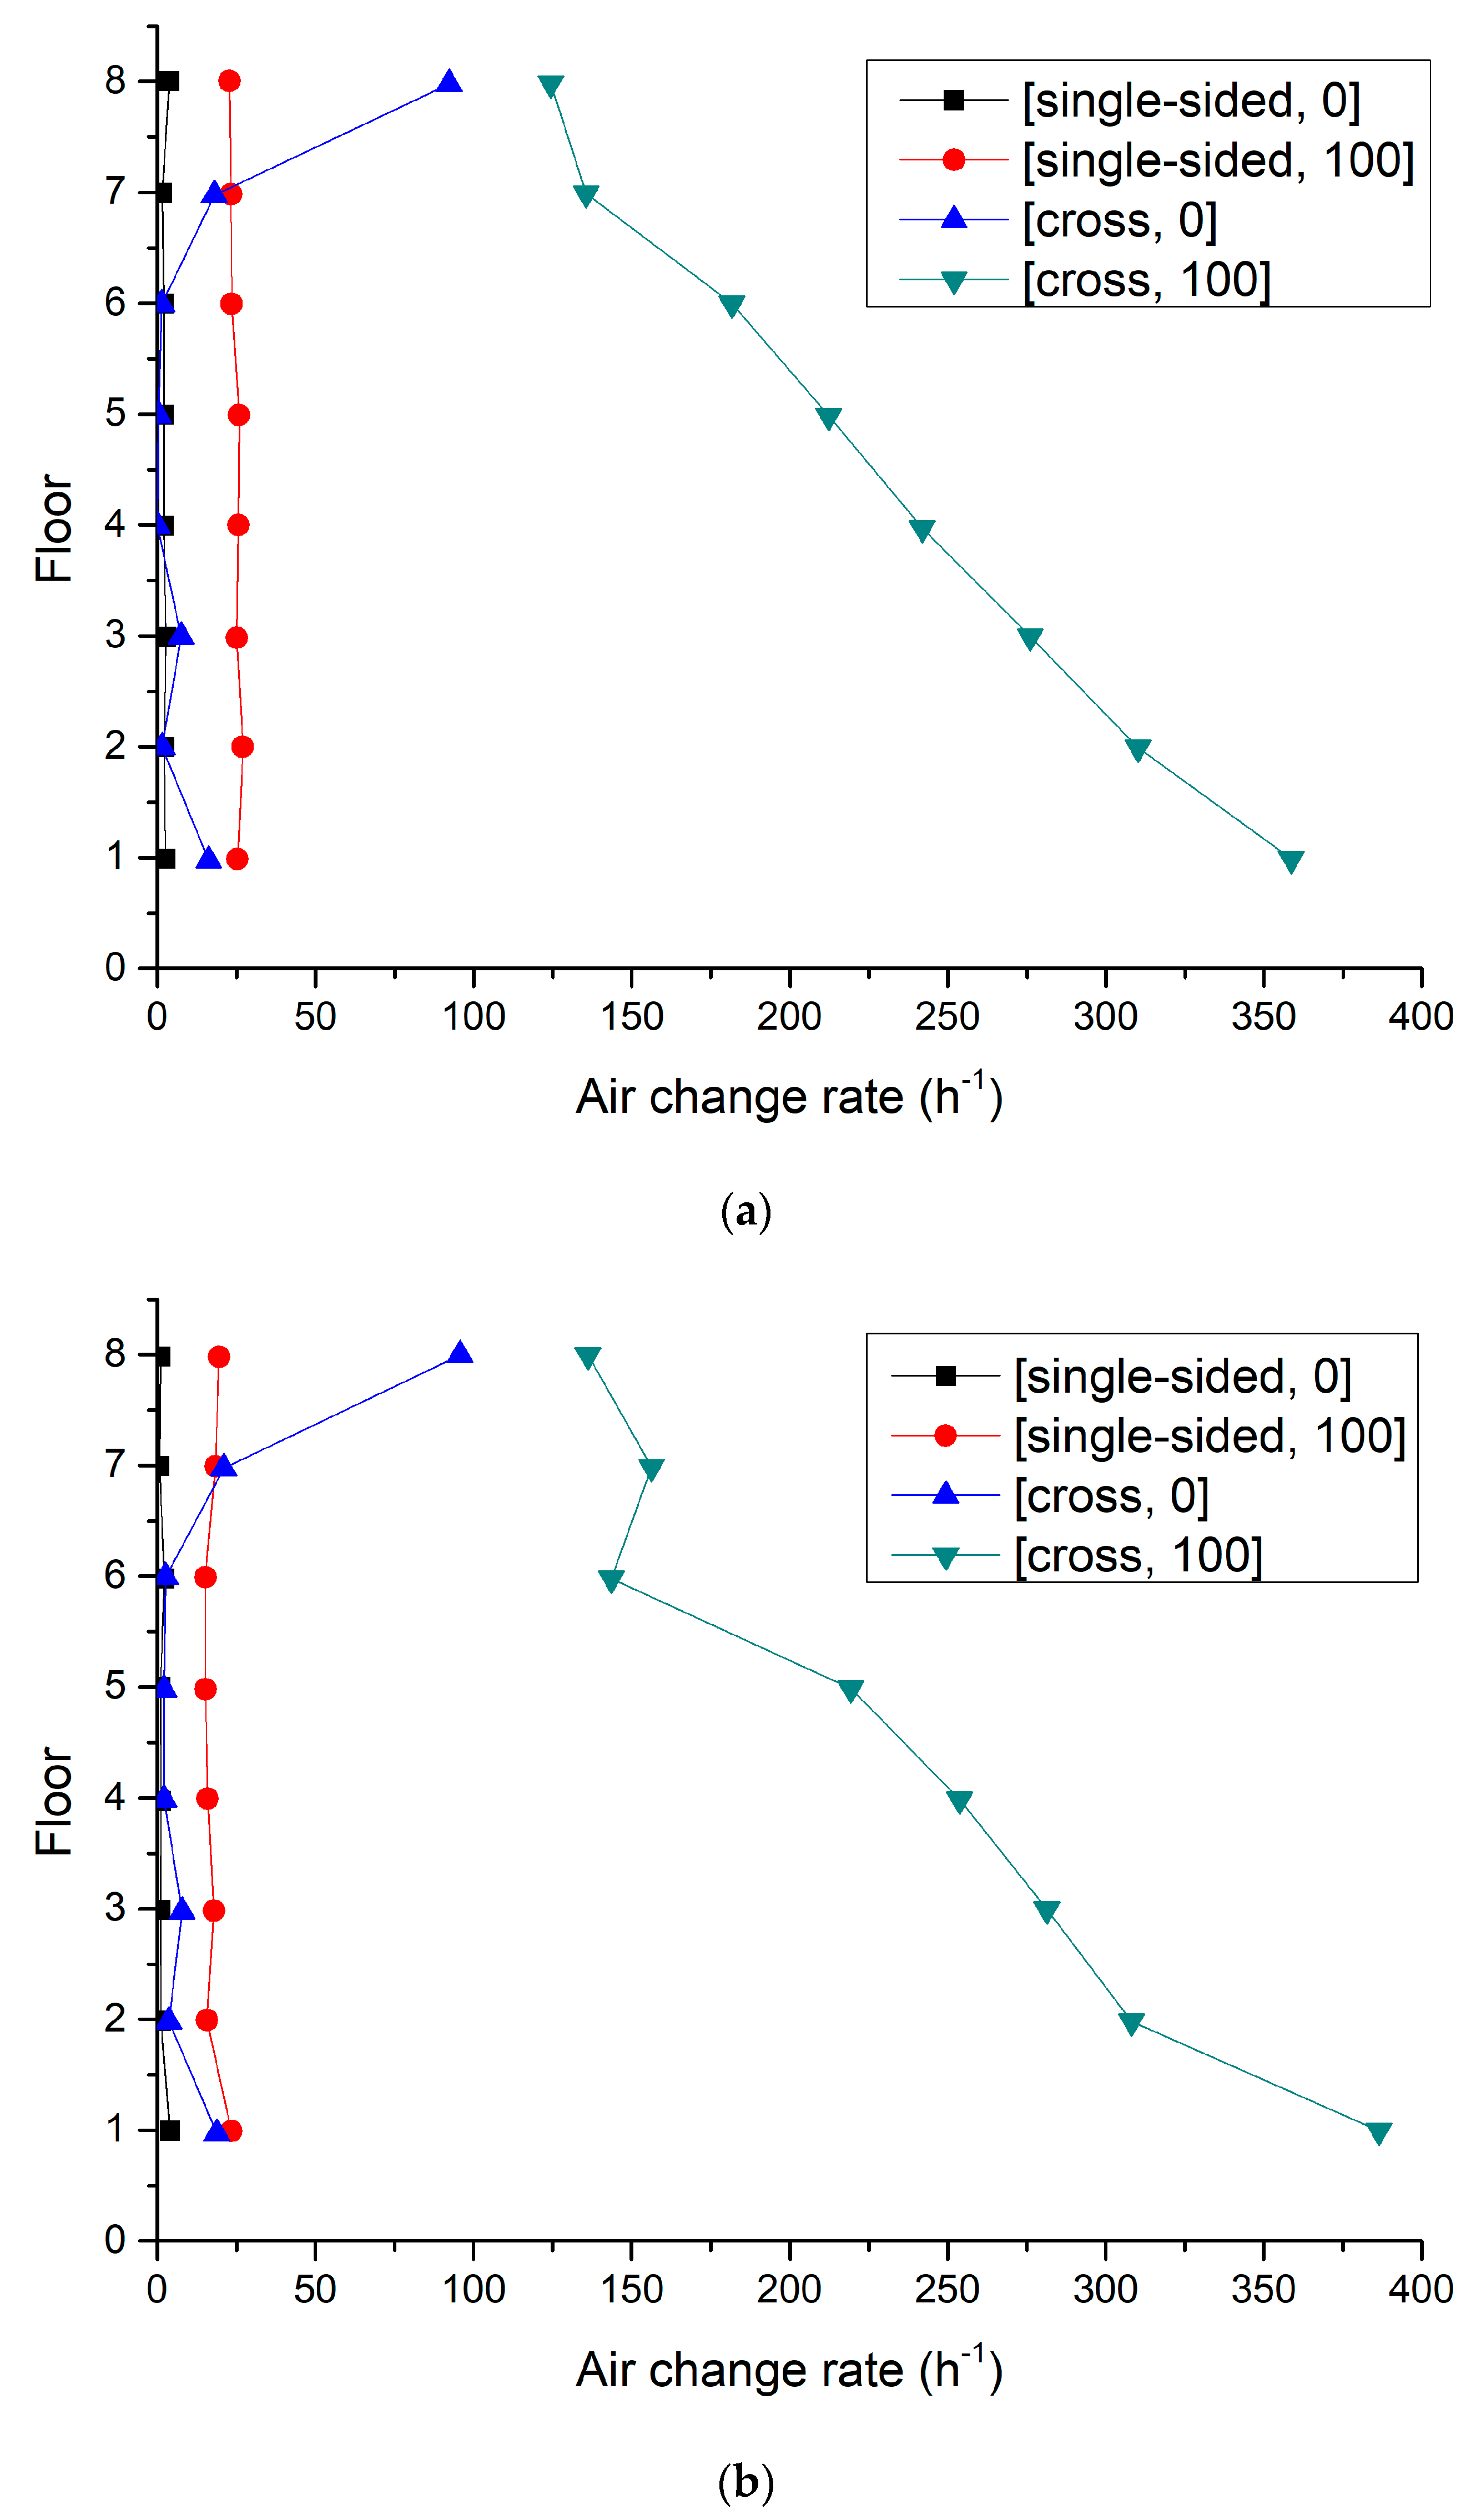
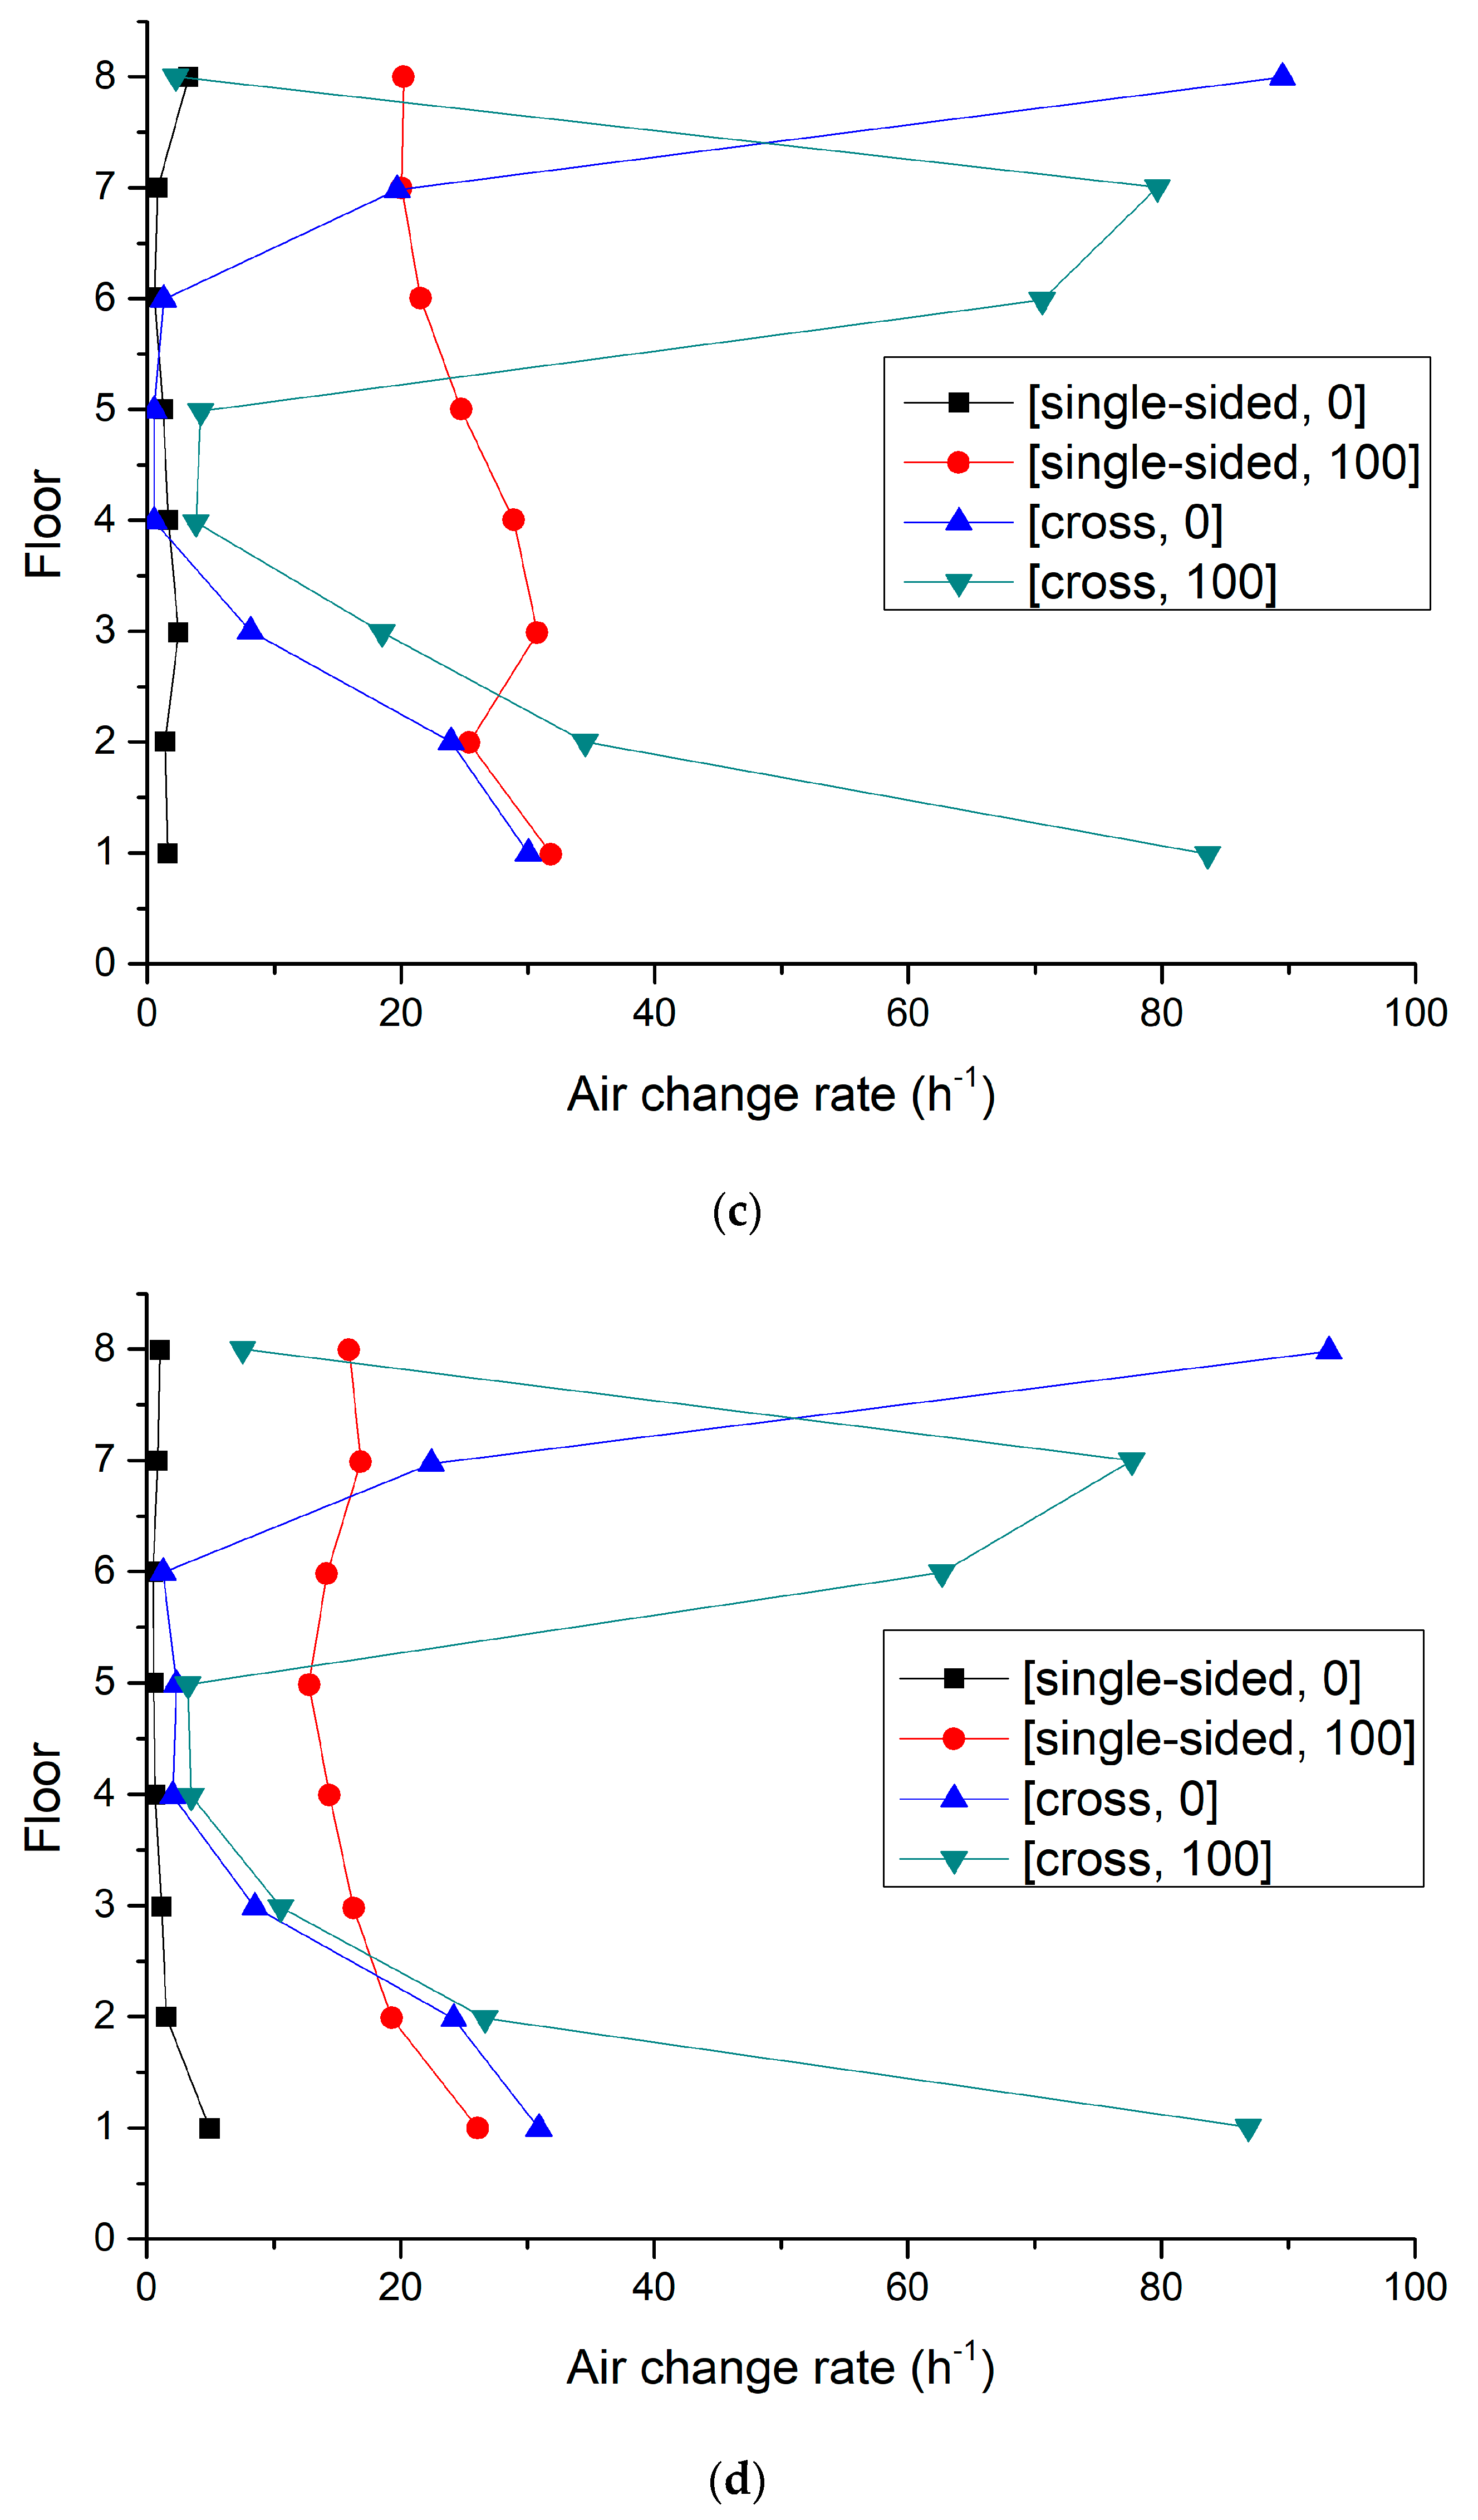
2.2.1. Air Change per Hour (ACH)

The parameter air change per hour (ACH) is applied to evaluate the effect of the natural ventilation in the room [29]. Equations (3) and (4) are the definition of ACH.
A C H = 3600 Q V
Q =   v   d S
Q is the airflow rate of the room in cubic meters per second. v is the airflow velocity perpendicular to the vent (i.e., windows and doors in this work). V denotes the bulk volume of the room, and S is the cross-section area of the vent (i.e., windows and doors in this work).

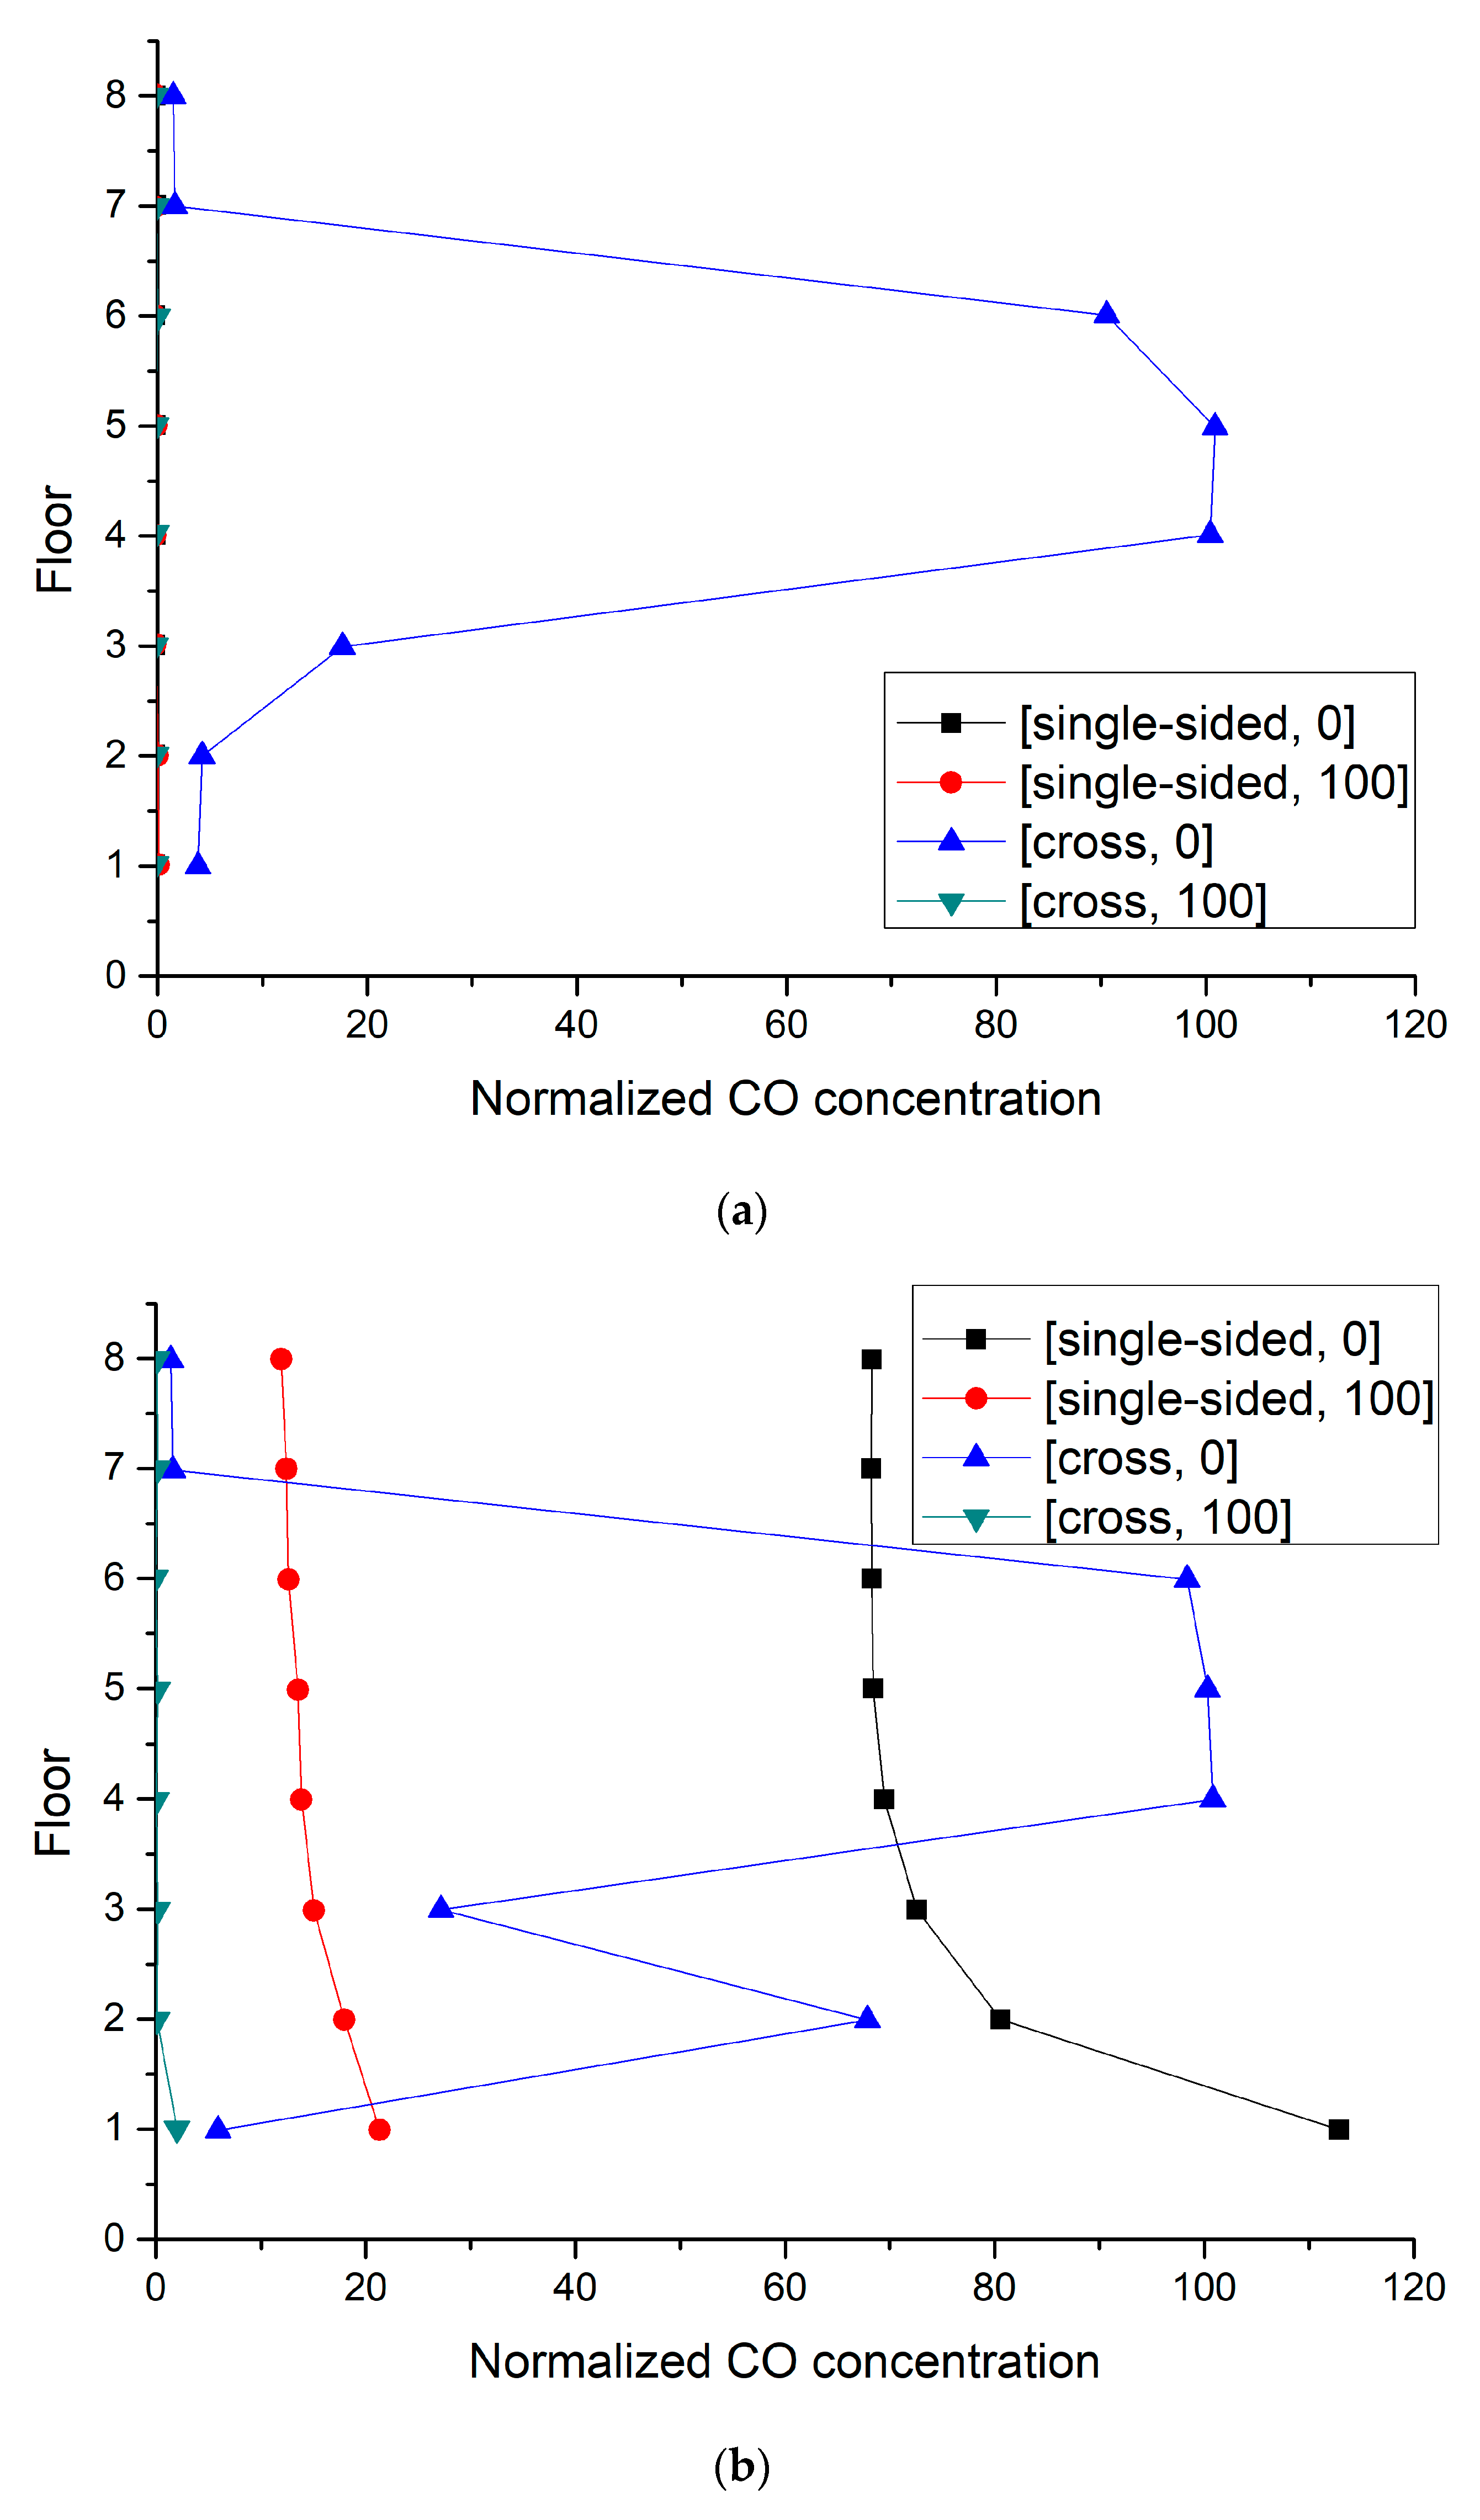
2.2.2. Normalized Concentration (K) and Exposure Concentration (E)

In the real world, the emission strengths of different sources are not the same and may even be at different orders in various kinds of street networks. For the purpose of setting up a universal methodology on pollutants and exposure assessment, the normalized concentration K is employed to better illustrate the deviation for the target research area. The influence caused by different orders of the emission strengths could be eliminated by using K [74]. K and the exposure concentration E are defined by Equations (5) and (6).
K = C × U r e f × H × L / S
E i , j = C j , k × Δ t j
K is the normalized CO concentration (kg/m). C is the CO concentration (kg/m3). Uref is the reference velocity (m/s). H is the building height (m). L is the length of the emission source (m). S is the emission rate of the source (m/s). E is the exposure concentration (kg∙s/m3). Δt is the exposure time (s). i, j, and k are age group, environment category and building room, respectively.

2.2.3. Intake Fraction (IF) and Personal Intake Fraction (P_IF)

Intake fraction (IF) is an important index to assess the inhalation exposure of air pollutants for a certain population [5,61]. Hang et al. [5] optimized it as personal intake fraction (P_IF) for setting up a universal evaluation method. This normalized exposure index P_IF is independent of the population size, density, and the air pollution level. It is widely used to quantitatively evaluate the exposure of traffic-related air pollutants for indoor environments or outdoor environments at street-scale (~100 m) [62,63,75].
I F = i N J M P i × B r i , j × Δ t i , j × C e j / m
P _ I F = I F / j M P i
Equations (7) and (8) define IF and P_IF, respectively. n is the number of age groups of the assessed population. M is the number of investigated micro-environment categories. Pi is the number of persons in the certain age group i. Bri,j (m3/s) denotes the breathing rate in volume mean for individuals of group i in environment j. ∆t is the exposure time of group i in environment j. Cej (kg/m3) is the temporal mean concentration of the certain pollutant in environment j. m (kg) is the total of the certain pollutant throughout the duration.

3. Results

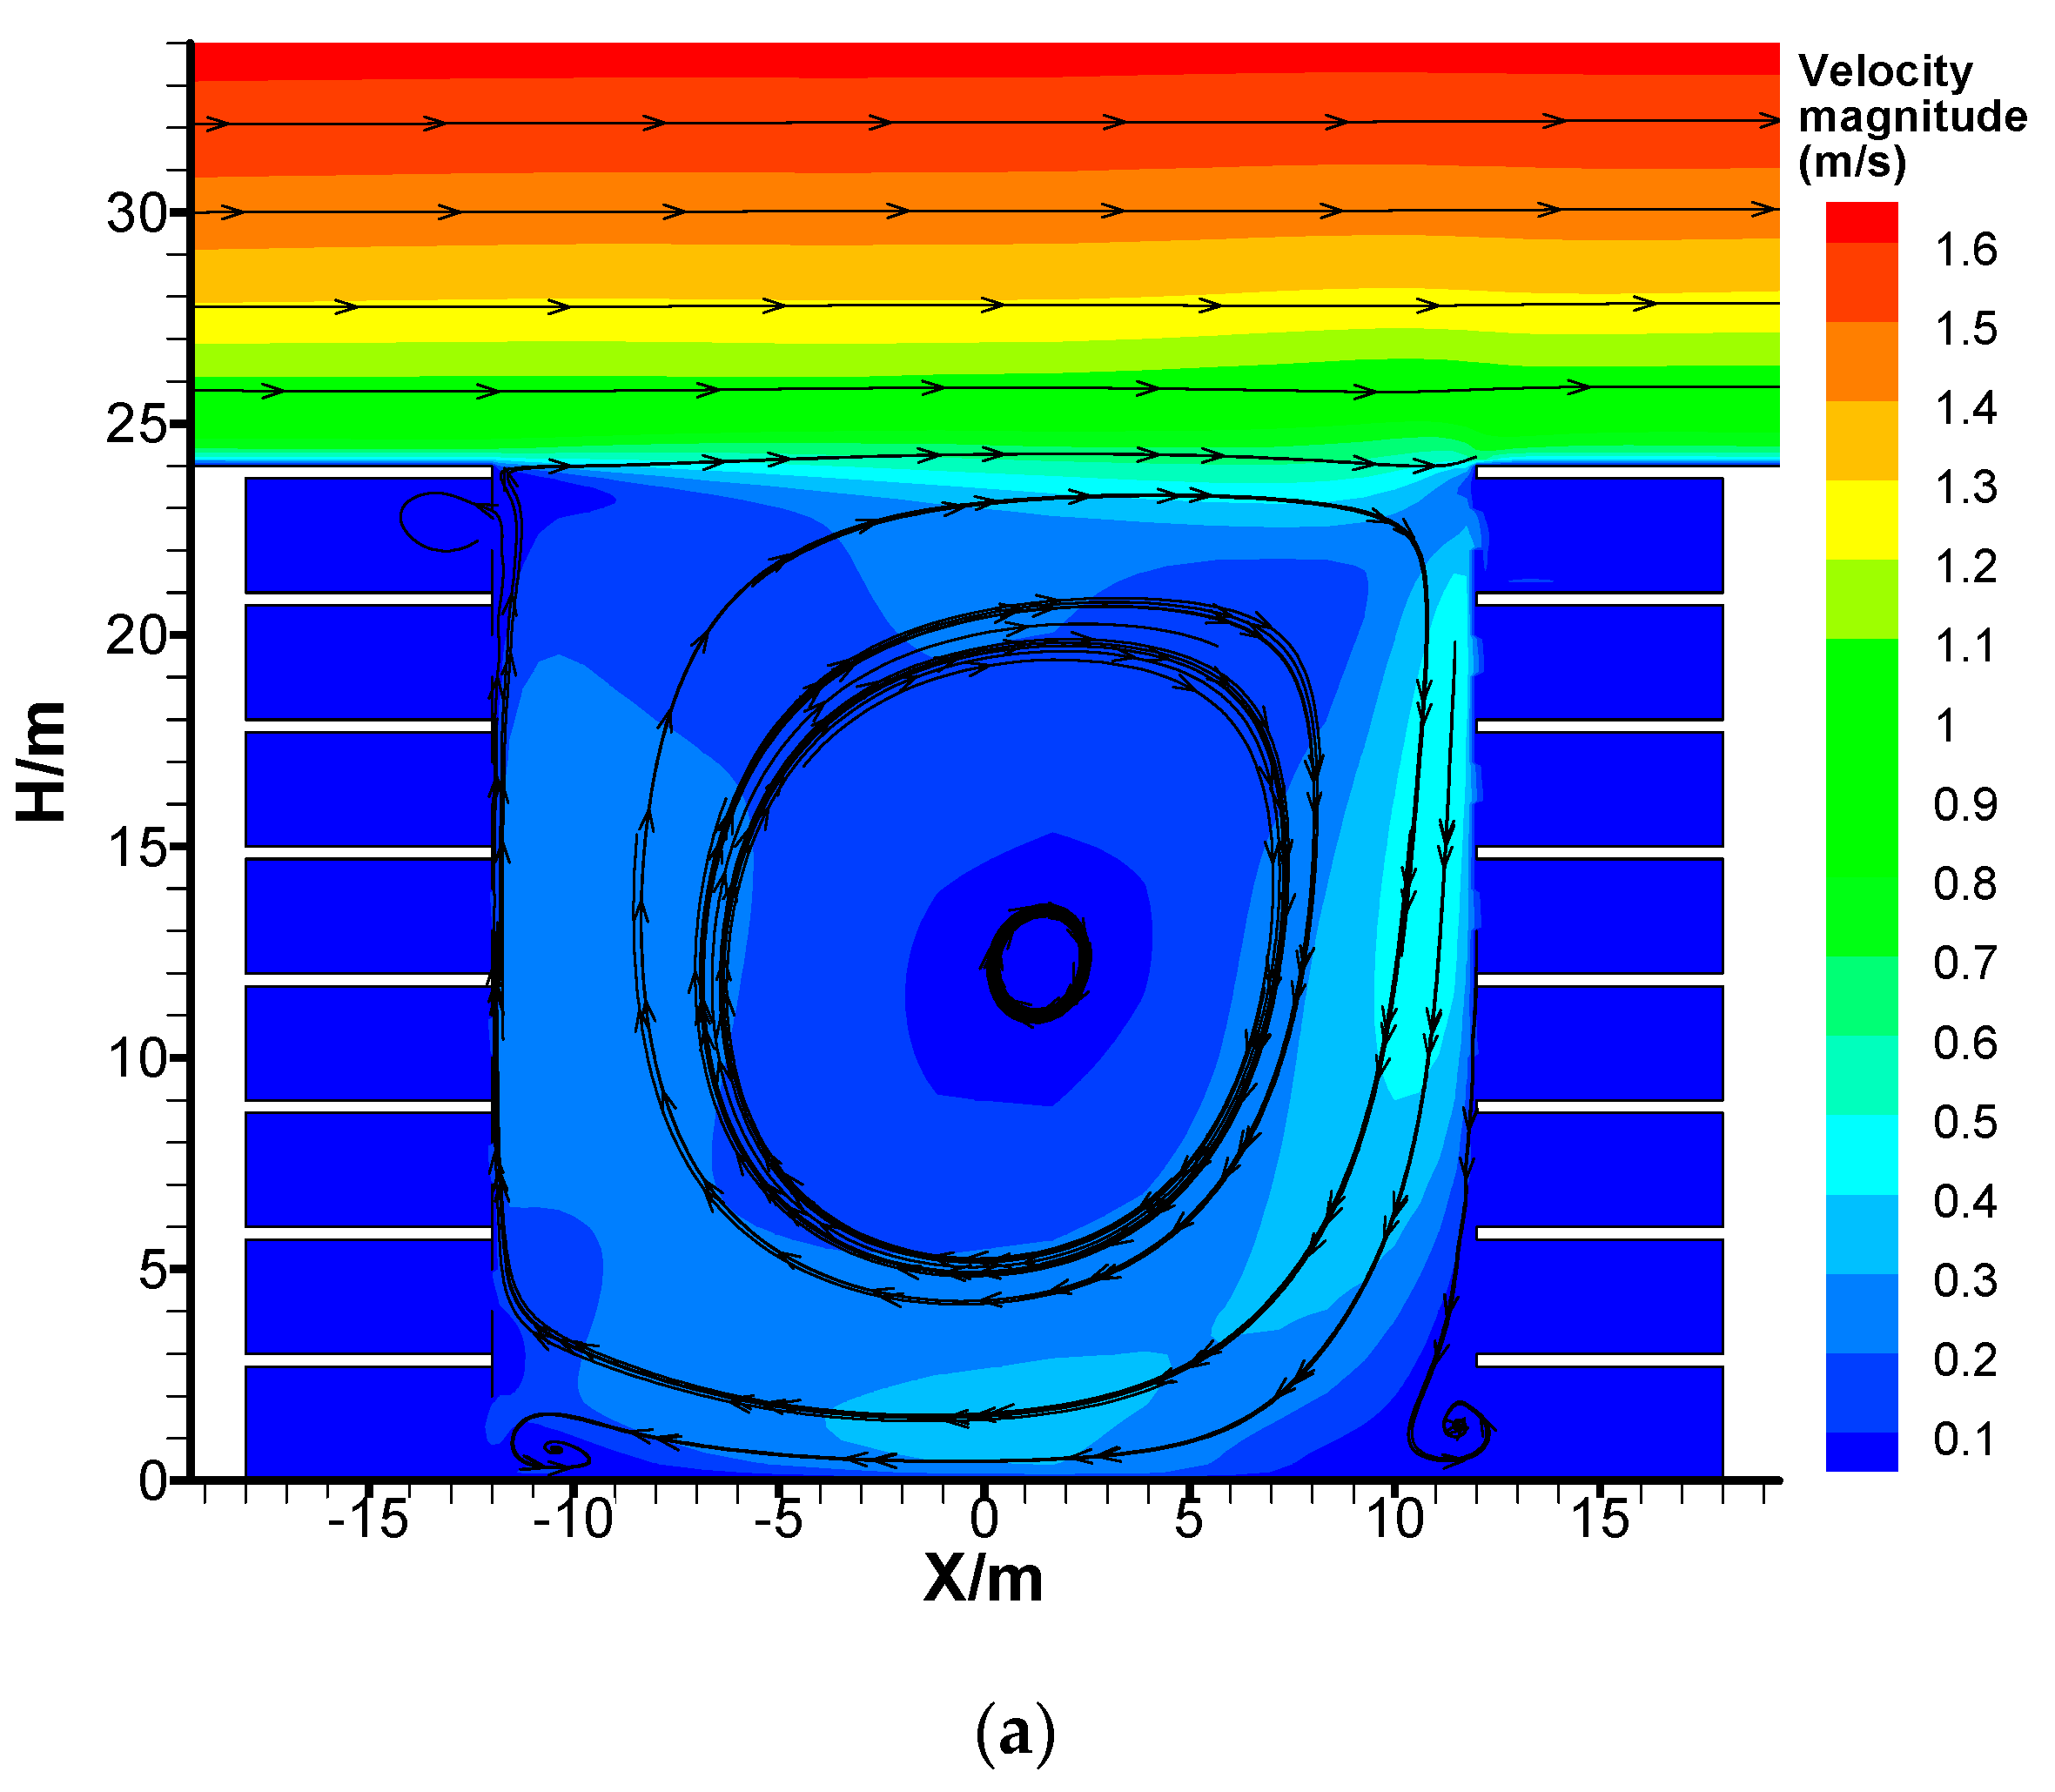
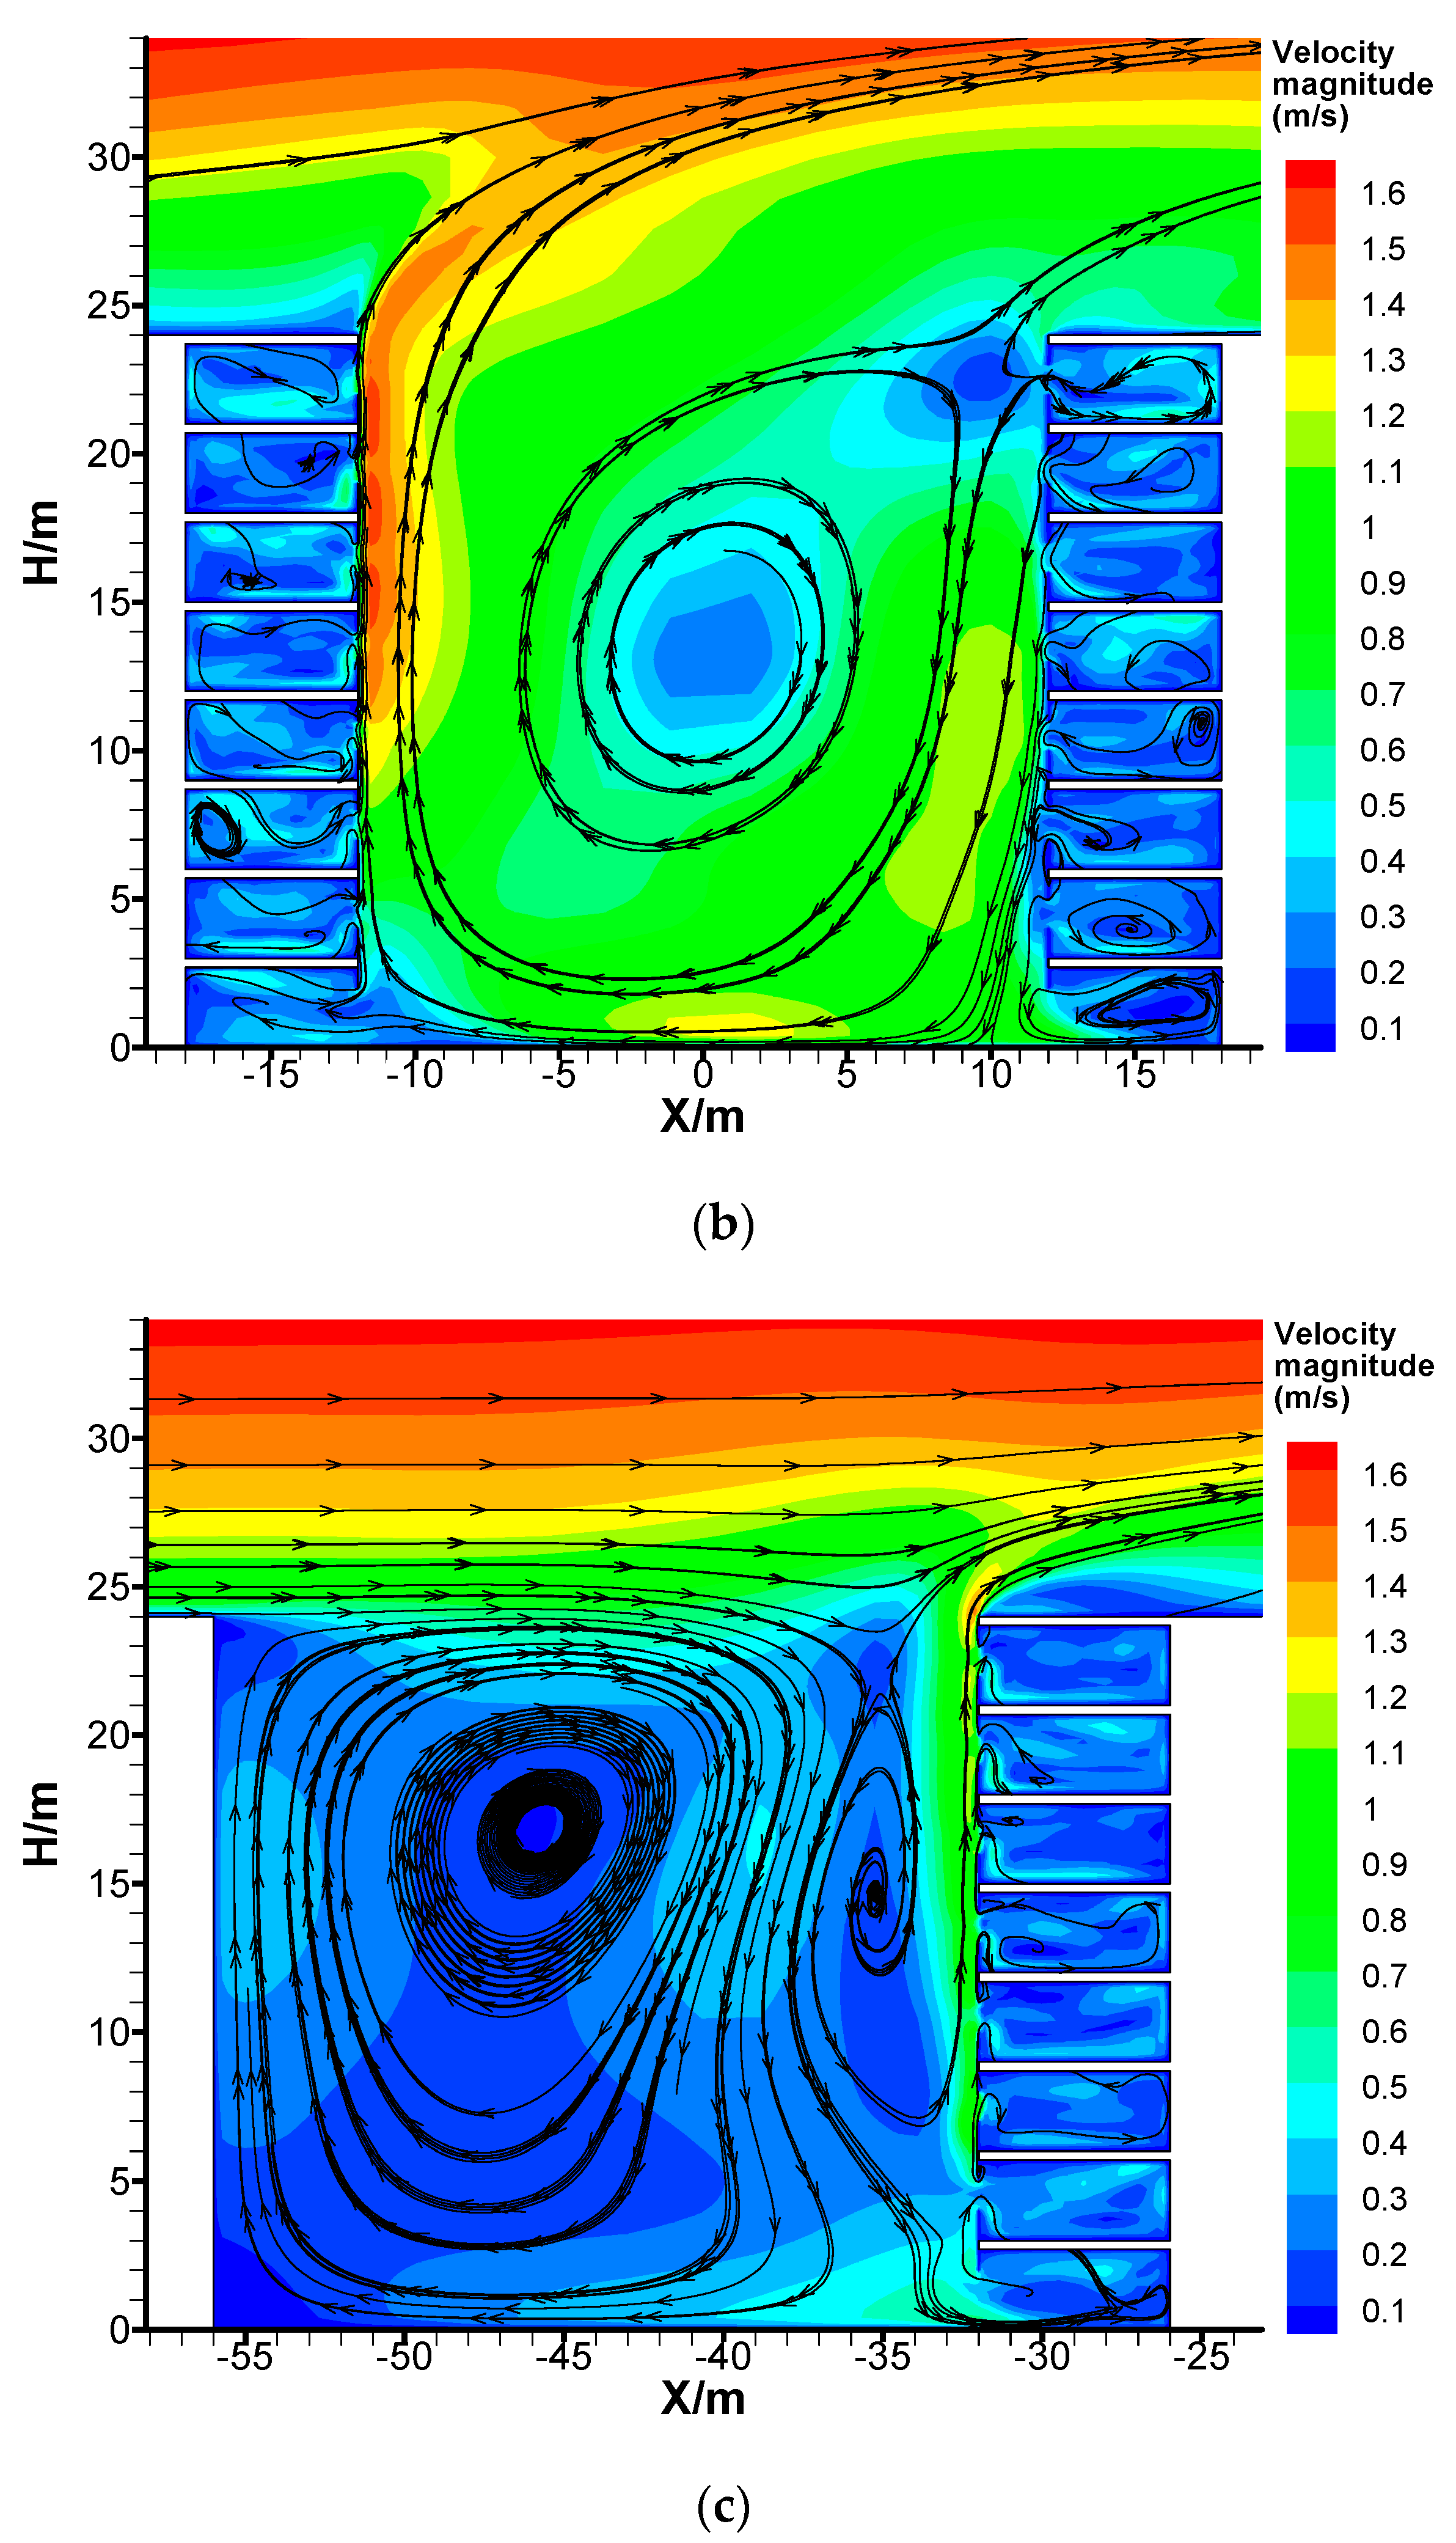
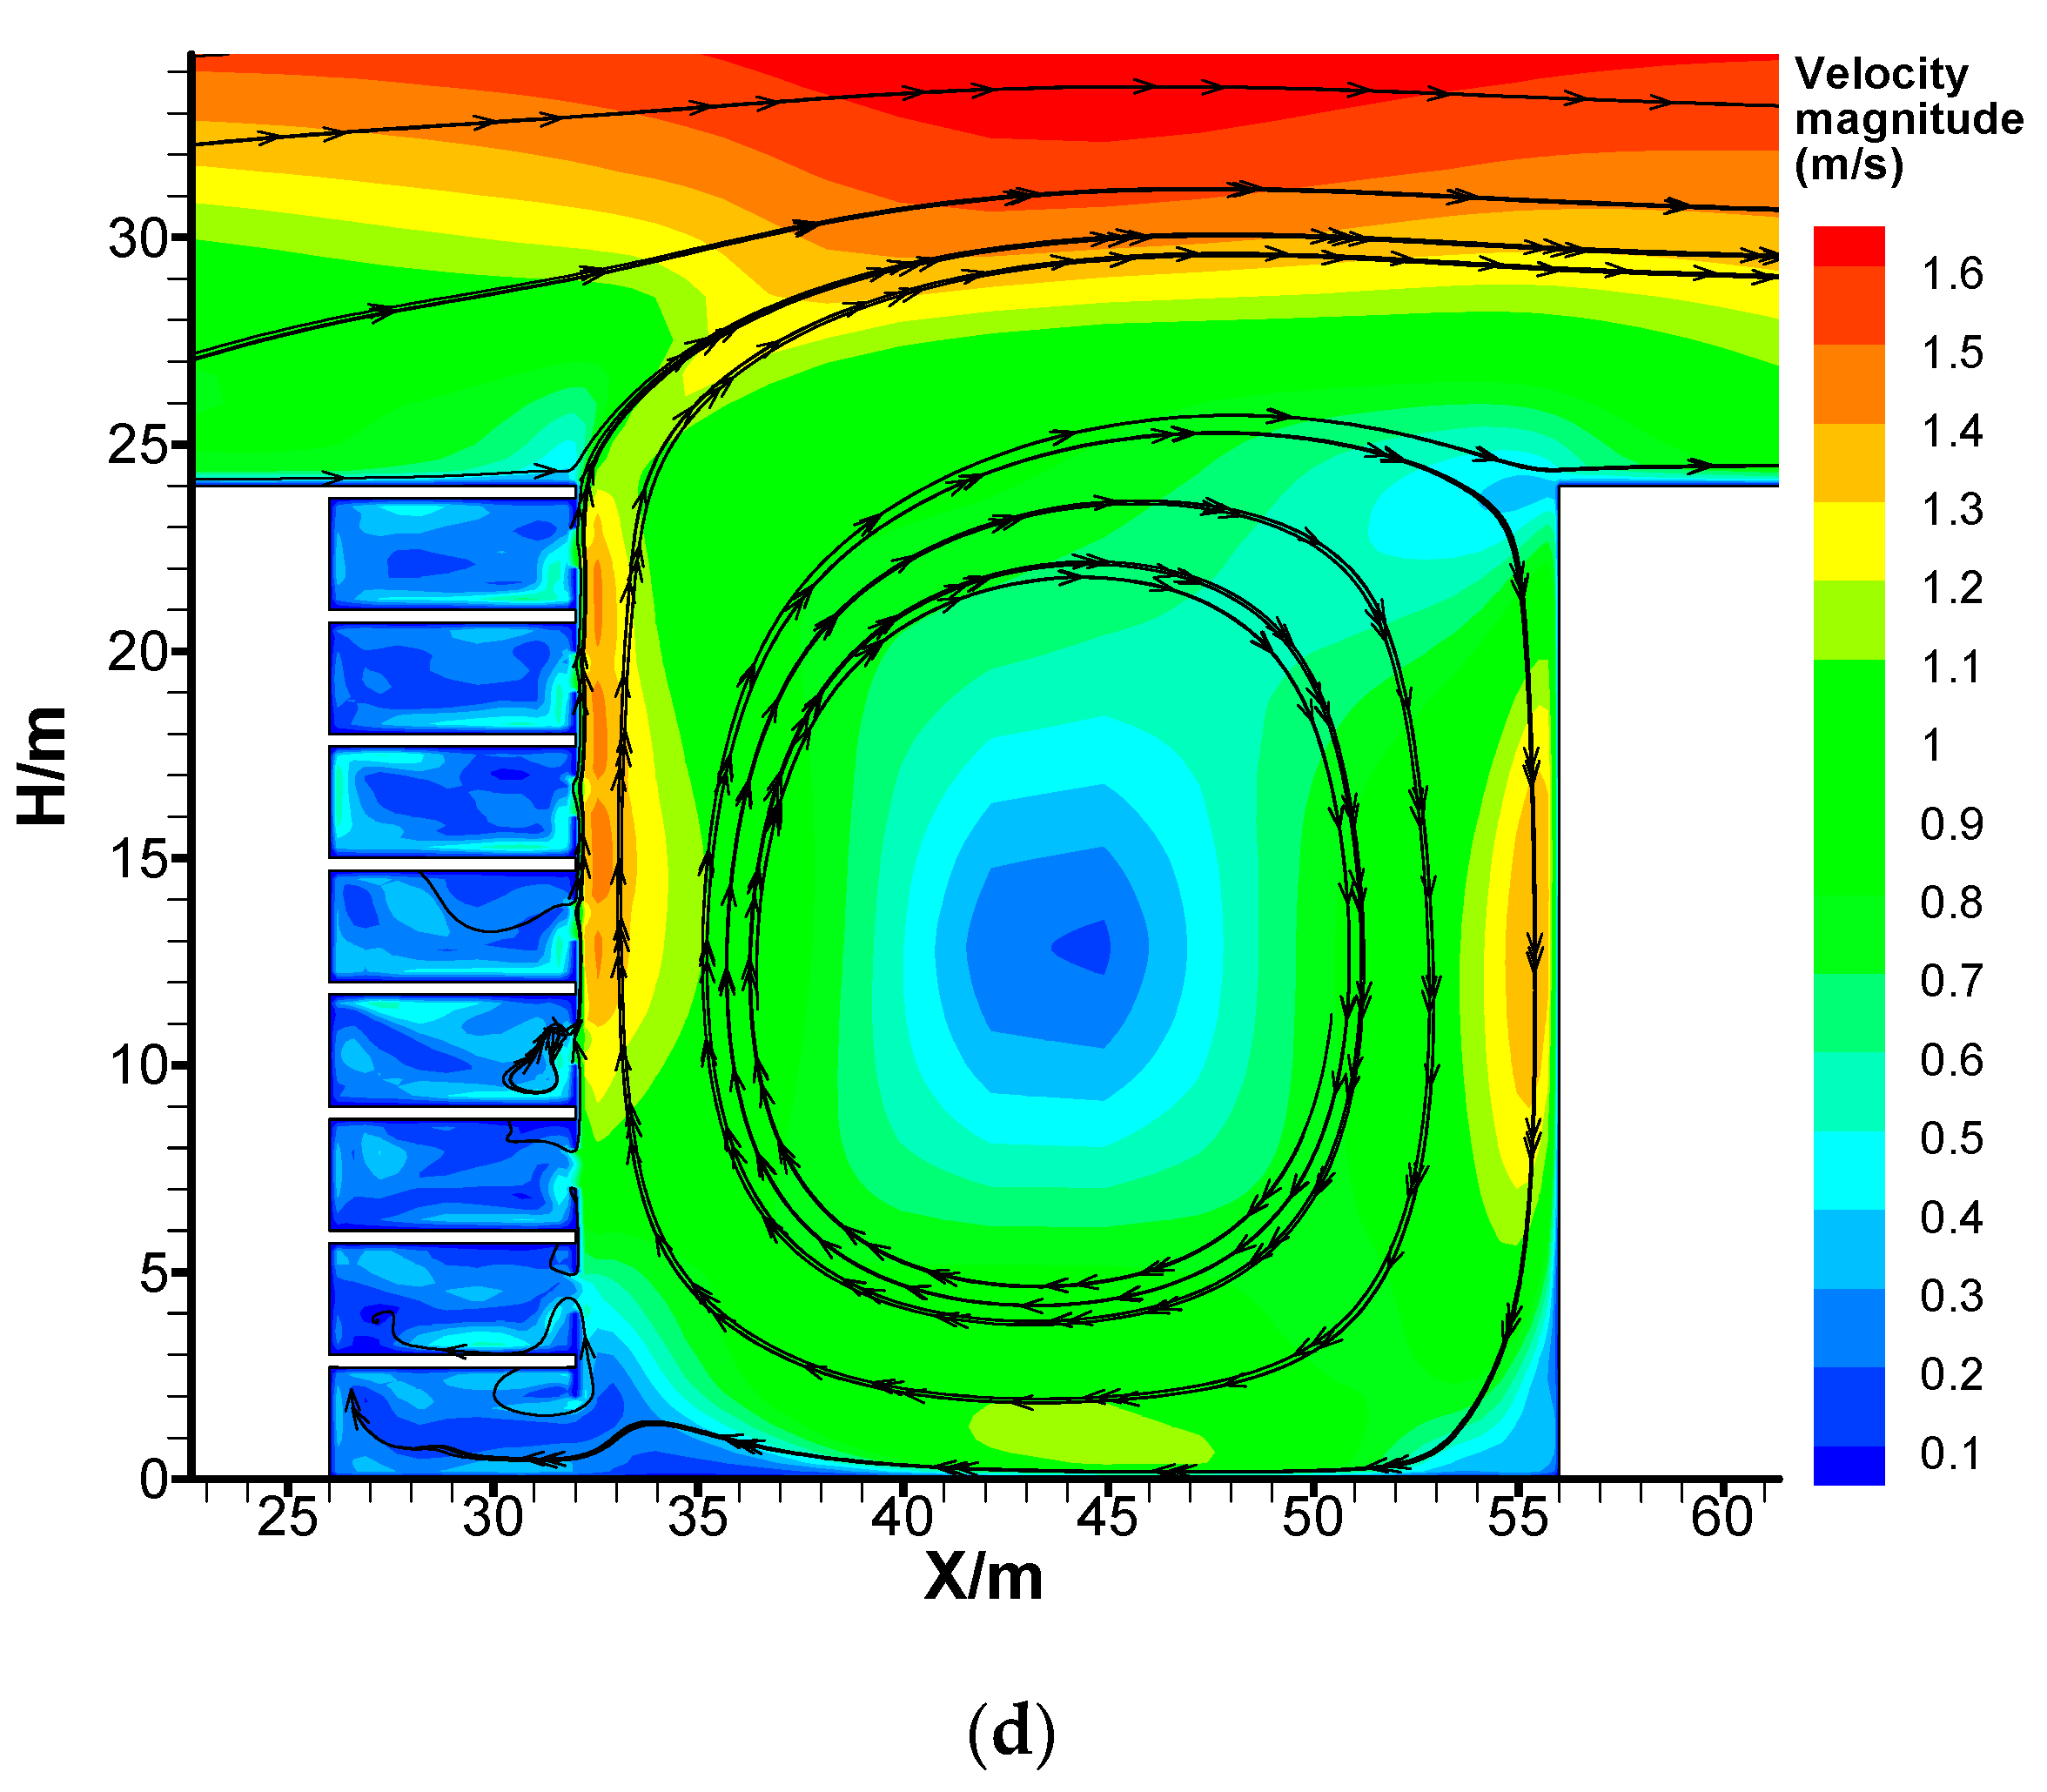
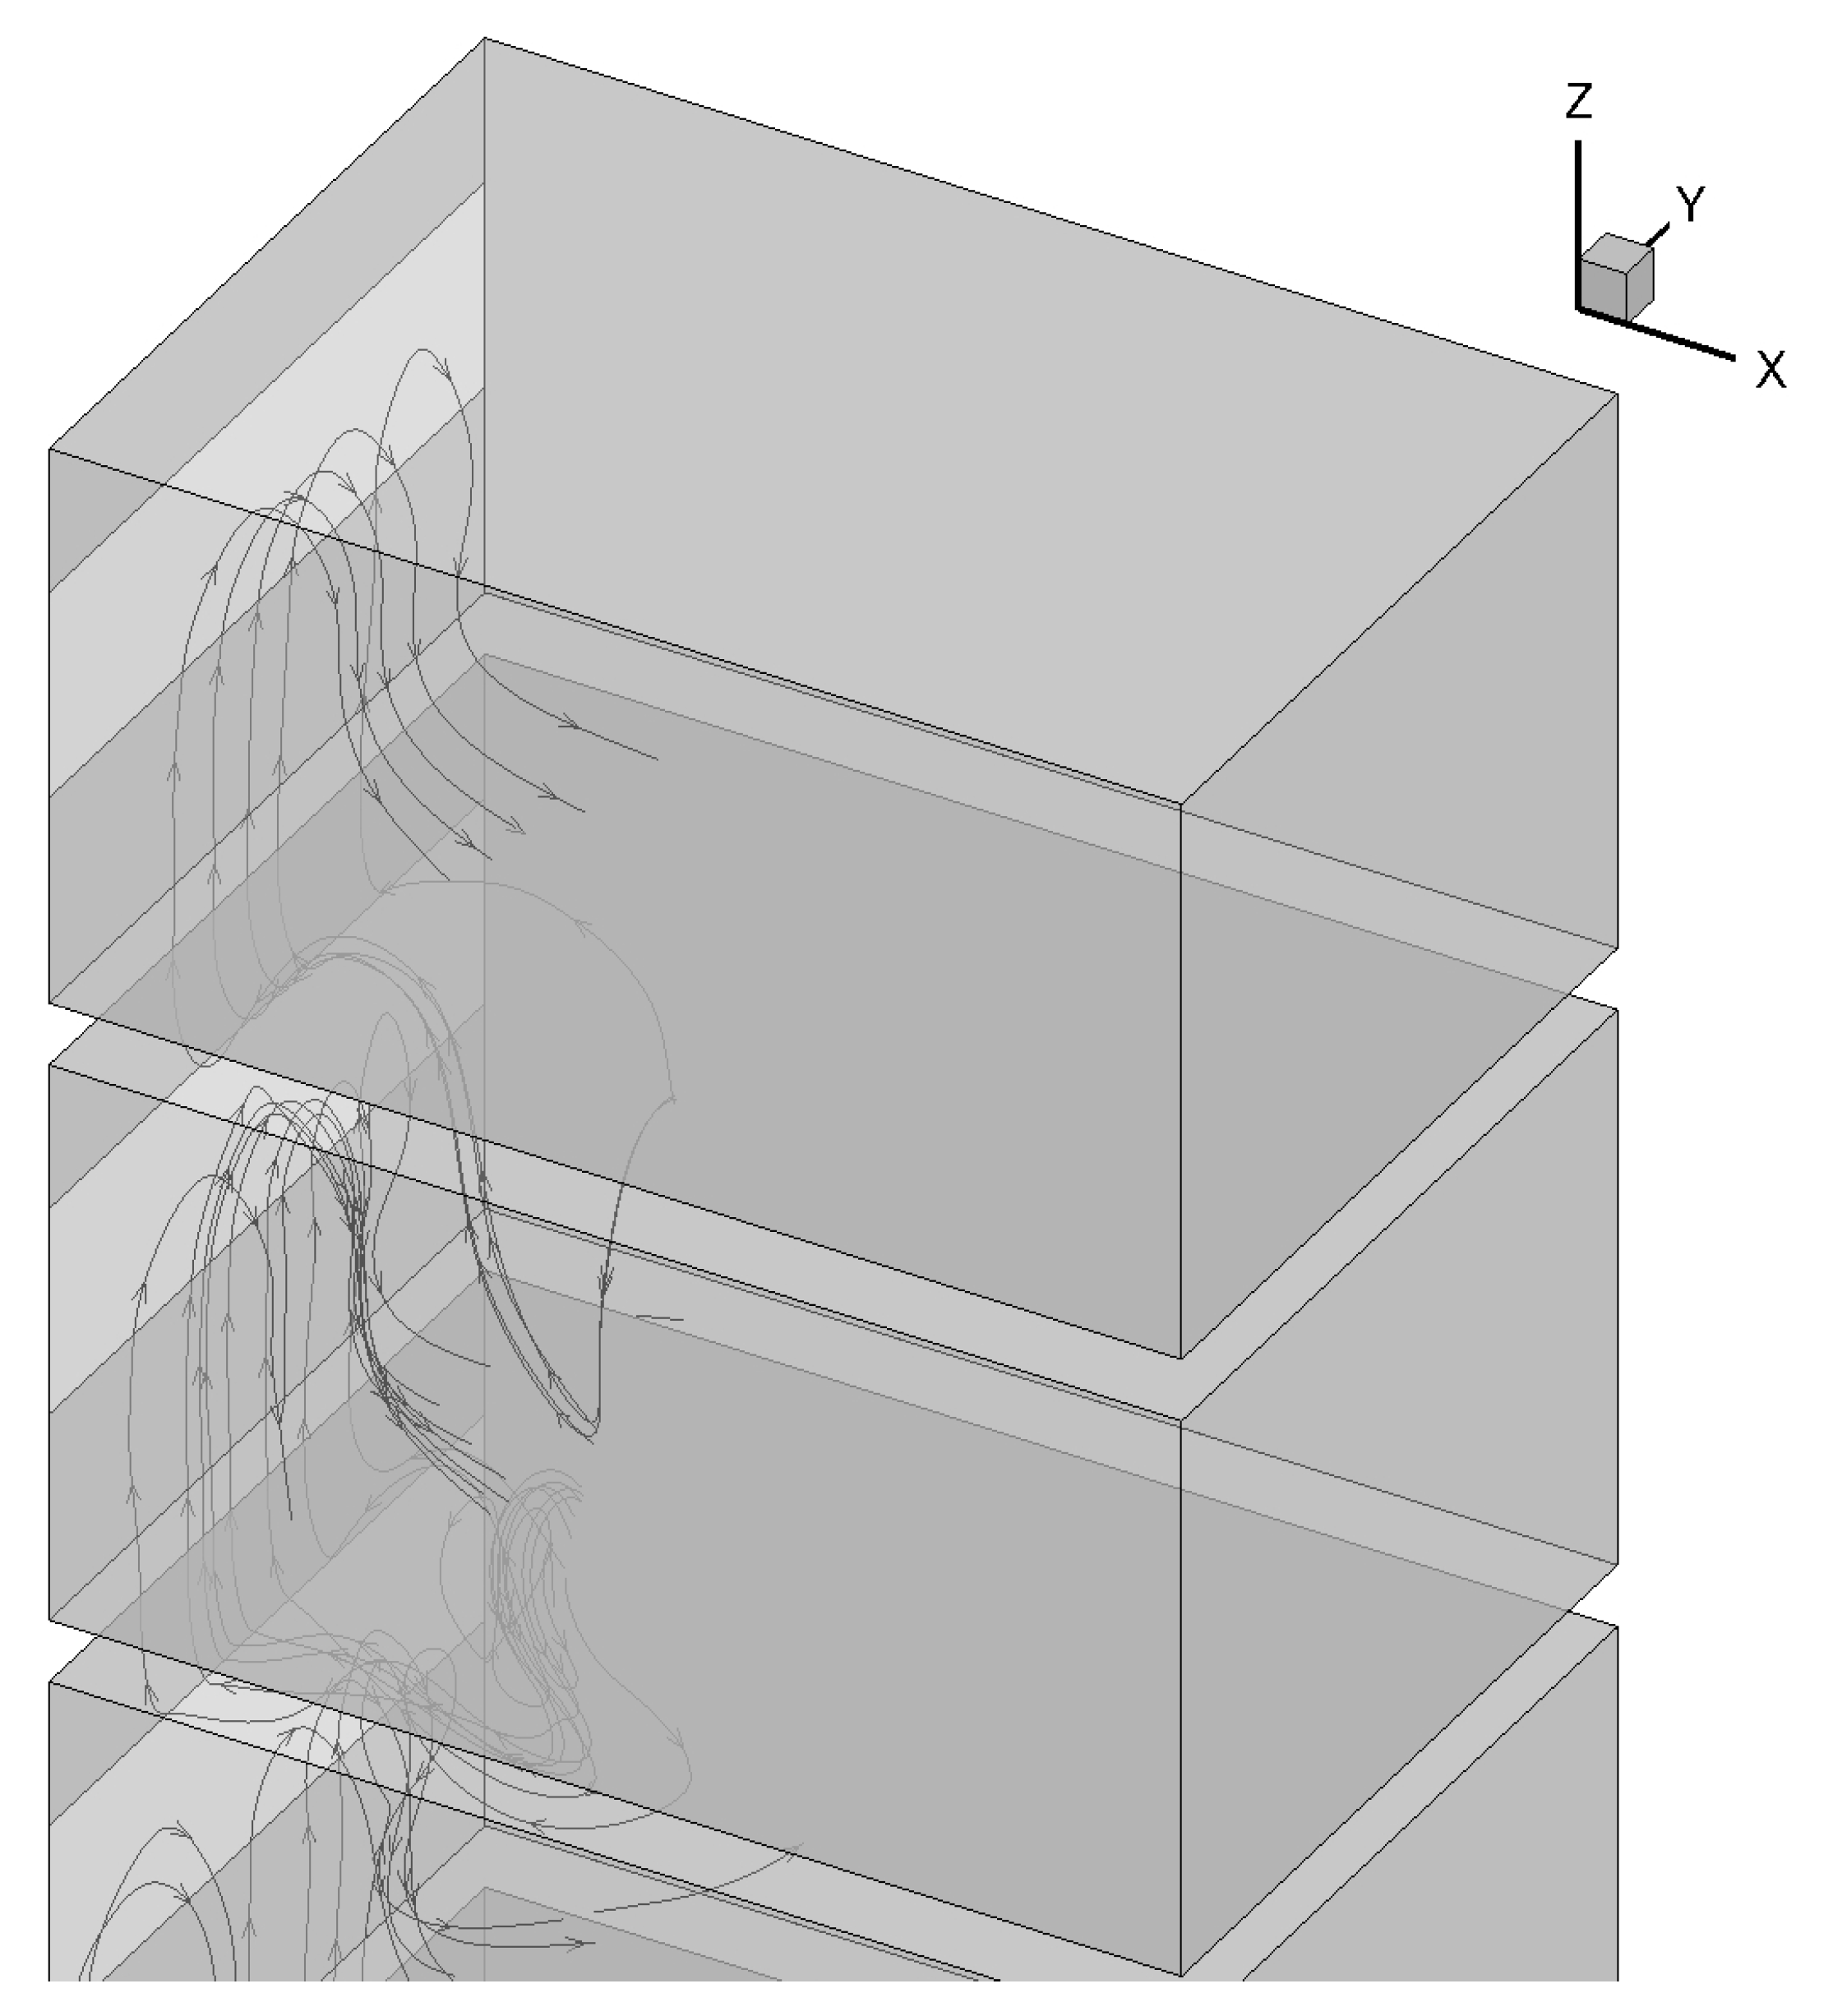
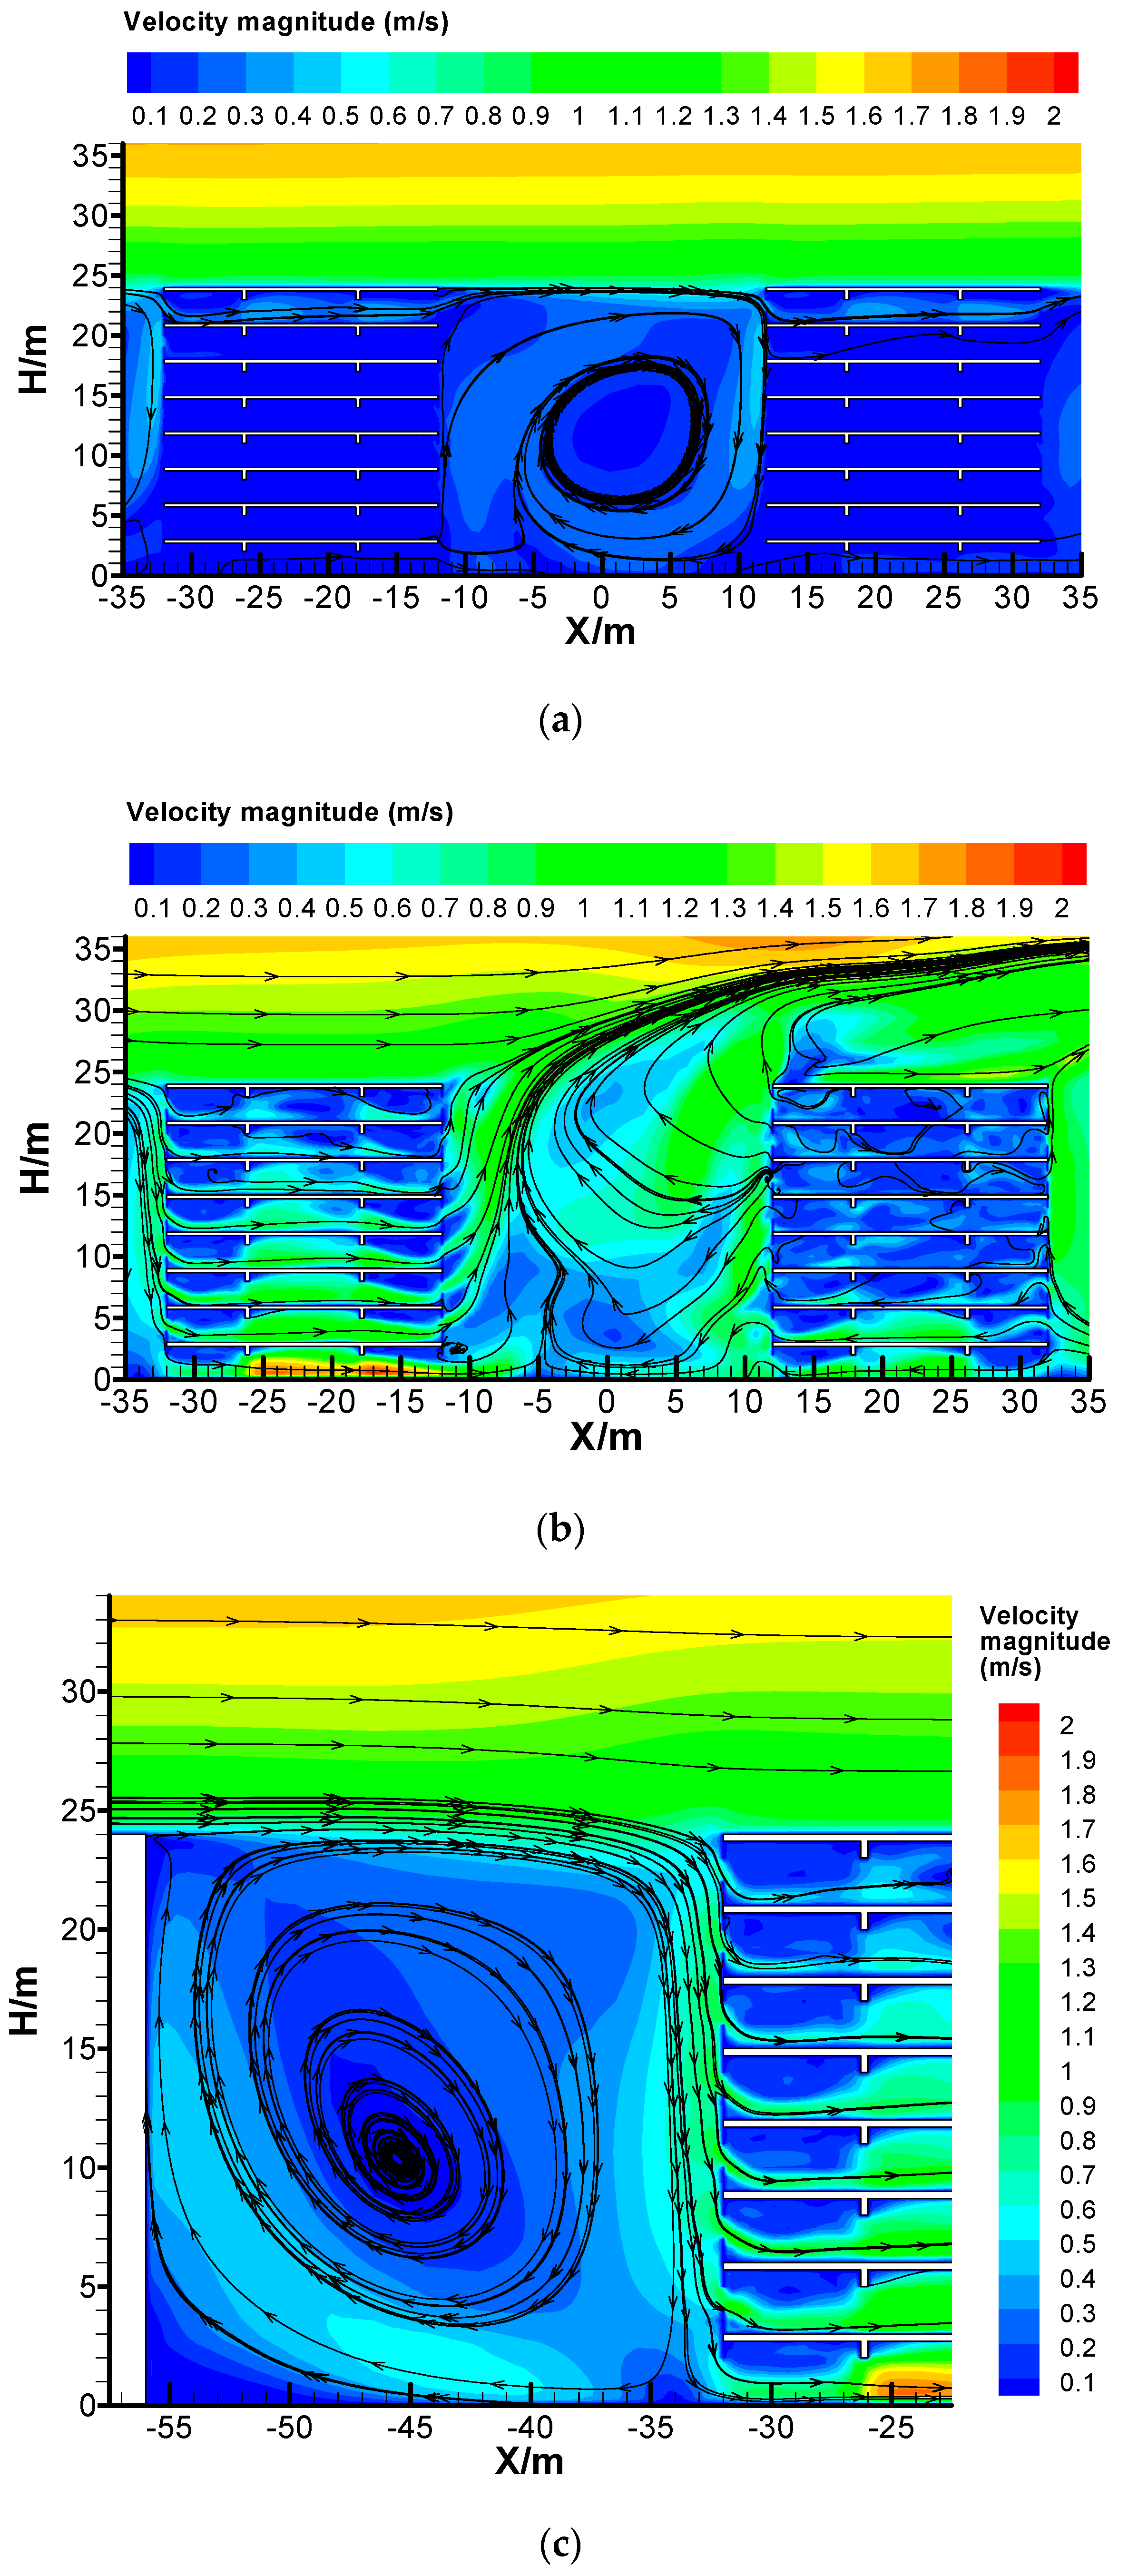
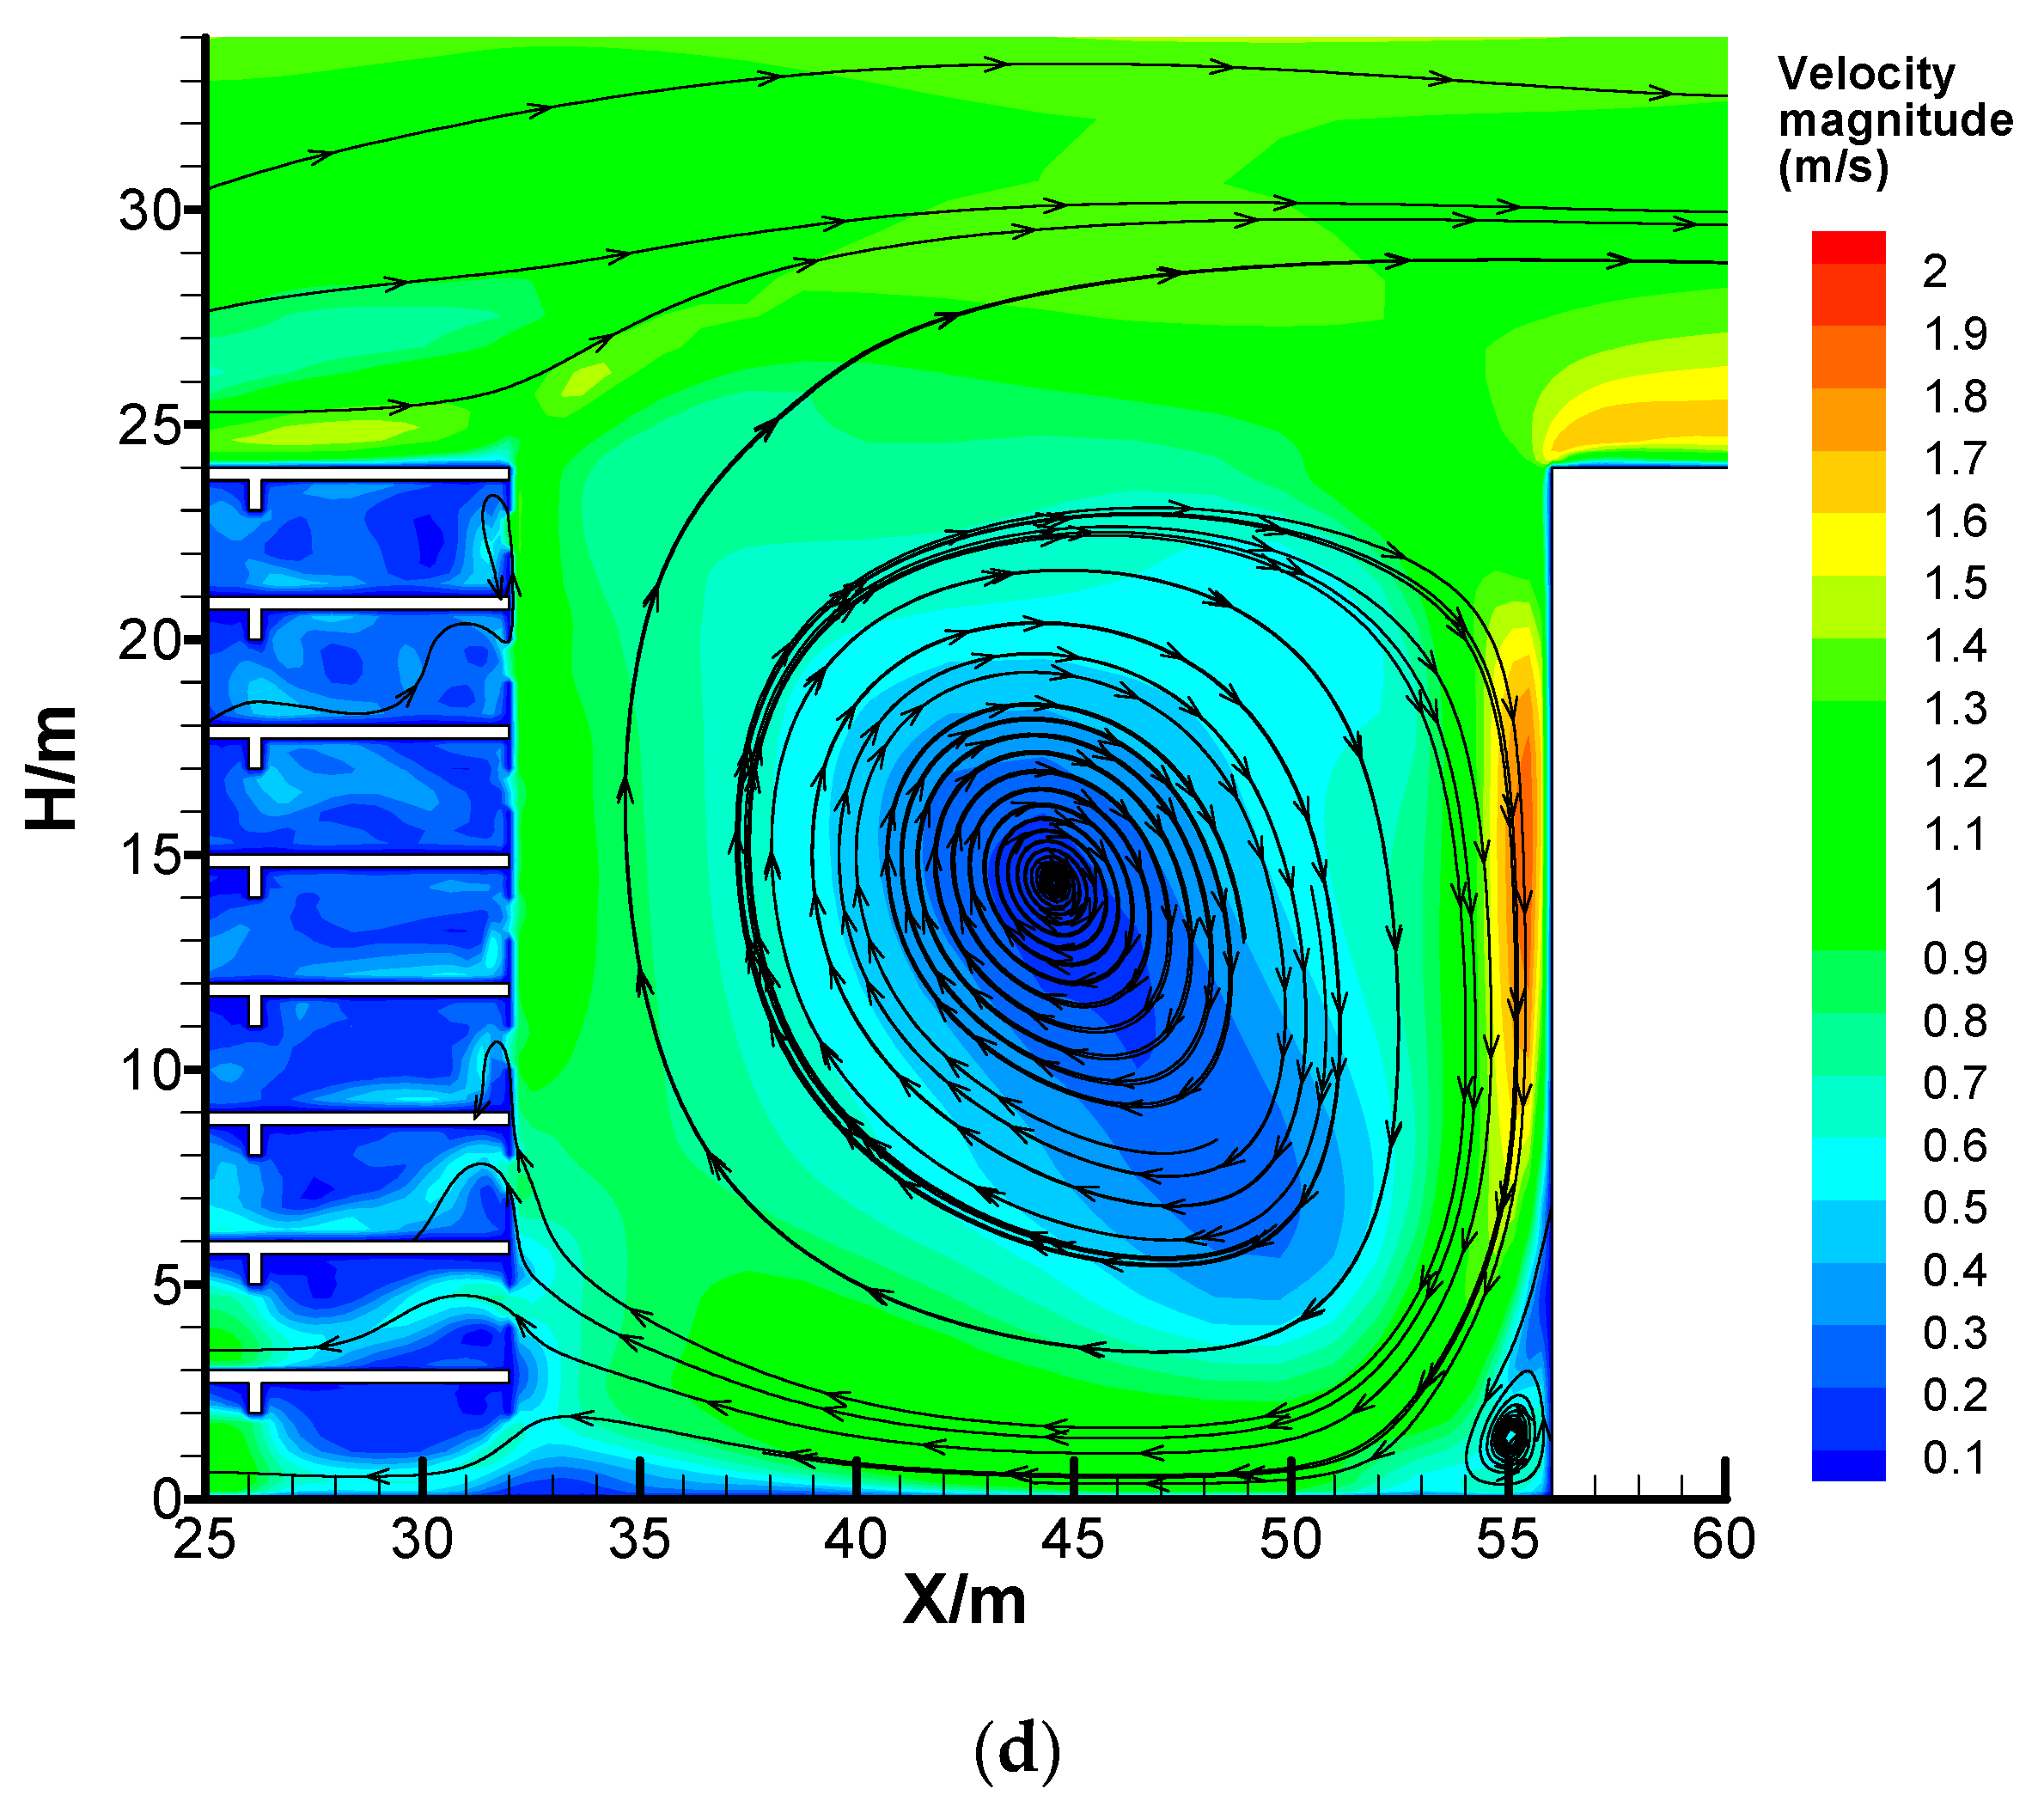
3.1. Velocity Field in Street Canyons with Different Building-Ventilation Modes

3.1.1. Single-Side Ventilation Scenario

Figure 3 presents the velocity in street canyons with single-side ventilated buildings. In certain cases [single-sided, 0] with an idealized isothermal condition (Figure 3a), the main vortex locates in the centre of the canyon, and the air mass is transported by mechanically driven flow from the top layer to the bottom of the canyon. On the surface layer, the air mass flowing to the leeward is raised to the main vortex owing to the obstruction of the leeward wall. Meanwhile, there are two small sub-vortices appearing on the first floor near the building walls.
When ΔT ≠ 0, the flow field in the target canyon is illustrated in Figure 3b. The expanded main vortex occupies the whole canyon. The air mass spills over the canyon edge and is transported downstream at the upper layer. Thermal-driven upstream enhances the updraft on the leeward side, and the largest velocity could reach 1.6 m/s. Accordingly, the downdraft on the windward side is enhanced, as well. Despite the sinking being partly offset by the thermal buoyancy, the sinking velocity is still lager than 0.8 m/s. Consequently, a downward cascading is generated to the windward building and an upward cascading is produced to the leeward building. Cascading effect describes the phenomenon that air mass flowing in between the neighbouring floors. Figure 4 displays the detailed flow of an upward cascading effect in the upstream building (canyon 2) as an example. Figure 3c,d depict the streamline and flow in the upstream canyon (canyon 2) and the downstream canyon (canyon 4). A significant upward cascading is observed in Figure 3c. Since the indoor heating of the right-side building, the indoor air mass slops over the room and flows into the room upstairs via the front windows. The velocity of this updraft is larger than 0.8 m/s. Functioning together with the downdraft of the main vortex is a sub vortex. The flow field in canyon 4 (Figure 3d) is similar as that in the target canyon. However, the absence of the indoor heating of the right-side building leads to a large velocity of the downdraft, which could reach 1.4 m/s. Comparing to the downdraft on the windward in Figure 3b, the thermal-driven upstream cases by the indoor-outdoor air temperature difference in case [single-sided, 100] reaches 0.6 m/s.

3.1.2. Cross Ventilation Scenario

The streamline and flow in street canyons with cross-ventilated buildings are illustrated in Figure 5. With idealized isothermal conditions (Figure 5a), the flow pattern in the target canyon is a single-vortex type. The vortex occupies the full canyon, and its upper edge is at the same height with the canyon top. The air mass can flow across neighbouring canyons through the top floors of buildings owing to the cross ventilation. The velocity of the indoor airflow in the top floors of the buildings is significantly increased. Nevertheless, the influence on the airflow in the lower floors is negligible. Figure 5b presents the streamline and flow in the target canyon. As the results of the cross-ventilation mode and the downdraft in canyon 2 displayed in Figure 5b,c, the air mass in canyon 2 can flow into the target canyon through each building floor. The spilling indoor air mass from each floor slops upwards on both buildings in the target canyon, converging to a main updraft and flowing to the lower reaches on the upper layer of the canyon. Owing to the large upward velocity on both sides, no downdraft forms in the target canyon. Therefore, the vortex in the target canyon fails to construct.
Figure 5c,d presents the streamline and flow in the canyons’ upstream (canyon 2) and downstream (canyon 4), respectively. The flow fields in these two canyons are both single-vortex patterns. The downdraft in canyon 2 flows into the indoor environment via the front windows, crosses the building horizontally via doors and corridors, and flows out via the opposite windows of the building. Corridors and the low layer in rooms are the areas with large velocity. Static wind areas are formed in each room above the height of the window. Though the flow pattern in canyon 4 is similar as that in canyon 2, the lack of heating on the windward wall increases the velocity of the downdraft. The biggest sinking velocity is larger than 1.8 m/s, and the velocity at the vortex edge is about 1.1 m/s.

3.2. Investigation for the Natural Ventilation Efficiency of the Canyon Buildings

The factor ACH as defined in Section 2.2.1 is used for investigating the efficiency of the target buildings with two ventilation modes. In the single-side ventilation mode, the proportion of the open windows is supposed to be at 100%, and all the doors in buildings are closed. In the assumption of the cross-ventilation mode, all the windows and doors are open. ACH with two ventilation modes, under idealized isothermal conditions or indoor heating conditions are calculated, and the results are plotted in Figure 6. Referring to the national standards, the accepted natural ventilation should have an ACH ≥ 1.5.
The ventilation conditions in both sides of Building 1 are presented in Figure 6a,b. ACH of different floors in Case [single-sided, 0], Case [single-sided, 100], Case [cross, 0] and Case [cross, 100] have good consistency. Indoor heating significantly increases ACH in all cases. The enhancement of the single-side ventilation is about 20 per hour, and the increased ACH at different floors have little differences. With a cross-ventilation mode and isothermal condition, similar ACH appears on Floor 1–6. While on Floor 7 and Floor 8, ACH increases rapidly. Indoor heating in the cross-ventilation scenario dramatically increases ACH even by two orders of magnitude. The enhancement is strengthened with the lower down floors.
Figure 6c,d illustrate the ventilation condition in two sides of Building 2. ACH at different floors in four cases have similar patterns at both building sides. Referring to the results in Figure 4, more air mass flows into the right-side rooms via windows by the downdraft than the left-side rooms. Thus, ACH in the windward side of Building 2 is higher than that in the leeward side. ACH in cross-ventilation scenarios has huge variations at different floors. Lower floors and upper floors have higher ACH and the lowest ACH exists on Floor 5 under both isothermal and indoor heating conditions. The parallel updraft to the plane of the window in canyon 4 may weaken the indoor-outdoor air exchange. Thermal-driven flow may be the only pathway for indoor-outdoor air mass exchange on Floor 5. Specially, ACH at Floor 8 performs exactly opposite in Case [cross, 0] and Case [cross, 100]. It has the largest value in isothermal scenarios, while having a very small value in indoor-heating scenarios. It is closely related to the flow field that is driven by wind or integrated, driven by wind and thermal.

3.3. Quantitatively Investigation for the Pollutant Dispersion and Human Exposure

3.3.1. Traffic Pollutants Diffused from Outdoor to Indoor Environment

The parameter normalized concentration K [74] as defined in the Section 2.2.2 is applied to investigate the dispersion of the traffic-related pollutants (i.e., CO in this work) in different floors. In the real world, the emission strength in different regions usually has a huge difference, even at different orders. The investigation in terms of K is a universal method for better illustrating the deviation in different research. The influence caused by different emission strengths could be eliminated.
K at different floors in two ventilation scenarios under idealized isothermal or indoor heating conditions are calculated, and the results are plotted in Figure 7. In single-side ventilation scenarios, large K value exists in the curb-side building sides of the target canyon. In the leeward side of the target canyon, K value decreases with the rising floors. In the windward side of the target canyon, K value also decreases with the increasing floor level with isothermal conditions. When the indoor wall is heated, the K value decreases rapidly in the middle floors (Floor 3–5), with the smallest K in Floor 5. Consequently, K increases on Floors 6–7, and decreases again on the top floor. In cross-ventilation scenarios, K under isothermal condition has significant vertical variations. In Building 1, the middle floors have large K values, while the lower floors and the top floor have small K values. The vertical profile of K in the leeward side of Building 2 has an opposite variation pattern with that in Building 1, while K variation in the windward side of Building 2 is negligible. The indoor heating condition significantly decreases the indoor CO concentration due to the thermal force and the changing flow field in street canyons. The corresponding K at different floors has almost no change in all four building sides.

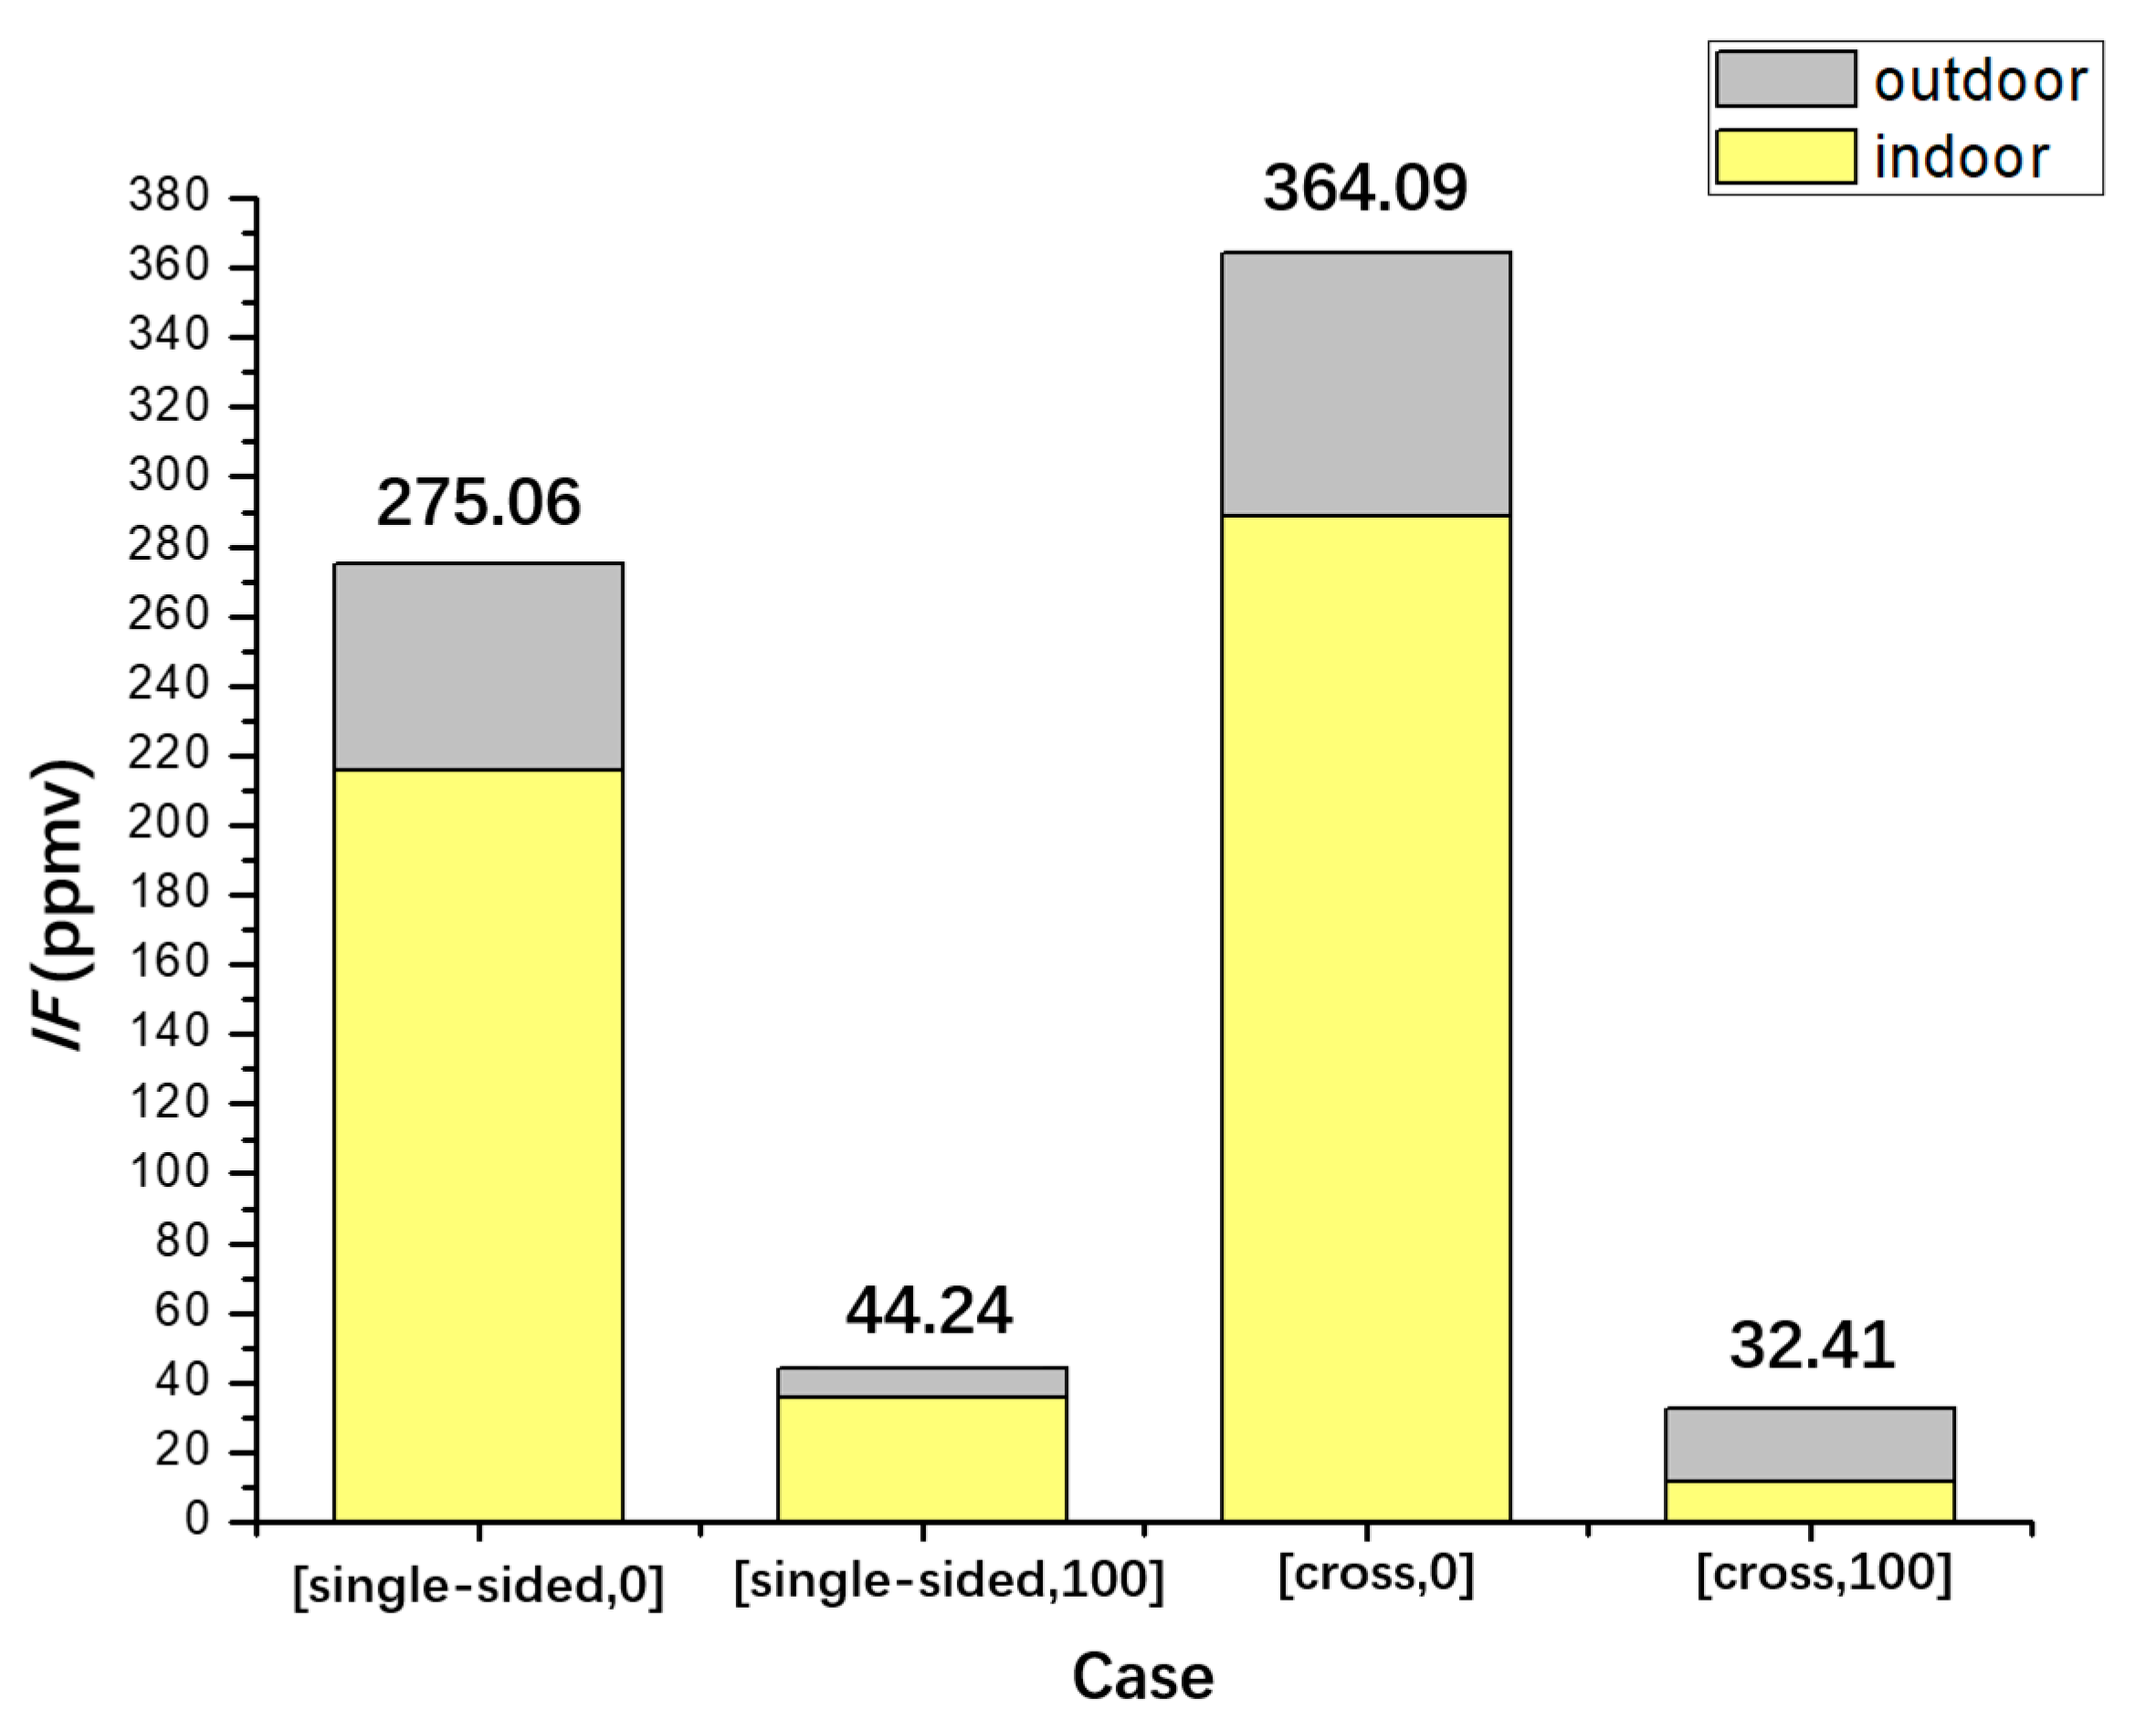
3.3.2. Quantitative Analysis of the Intake Fraction IF

The factor intake fraction IF as defined in the Section 2.2.3 is used to numerically investigate the inhalation exposure of traffic-related air pollutant (i.e., CO in this work) for the population living in the two target buildings. Assuming in each side of the two buildings, there are two families living in each building floor, and each family has 5 members. Thus, the total number of residents (P) in the two buildings are:
P = 5 (members) × 2 (families) × 8 (floors) × 4 (building sides) = 320.
The population composition and the environmental categories employed for IF calculation is based on a study in the real urban area of Hong Kong [61]. The population composition is referred to the census data of Hong Kong in 2004 [61]. Br data is derived from the survey conducted by Allen et al. [76]. Δt in different scenarios is obtained from telephone questionnaires to Hong Kong residents [77]. Table 2 presents the critical parametres for exposure assessment. It must be pointed out that, this work focuses on the difference of inhalation exposure between the indoor environment and outdoor environment by curb-side.
IF calculated for the four cases are plotted in Figure 8. IF of the target population ranges between 32.41–364.09 ppmv, corresponding to Case [cross, 0] and Case [single-sided, 100], respectively. Without considering the age groups, P_IF is ranges between 0.10–1.14 ppmv. In isothermal scenarios, if the ventilation mode of buildings was changed from a single-side ventilation to cross ventilation, IF would increase 1.3 times. In indoor heating scenarios, the alteration of the ventilation mode has a slight influence on IF. For the same ventilation mode, the indoor-outdoor air temperature difference produced by indoor heating could improve the dispersion of indoor air pollutants. The thermal force enhances the updraft with large velocity, contributing to dilute the air pollutants in the canyon and transport it out of the canyon. Furthermore, the ratio of indoor and outdoor IF ranges from 0.5 to 4.1, and the indoor heating has little influence on outdoor IF.

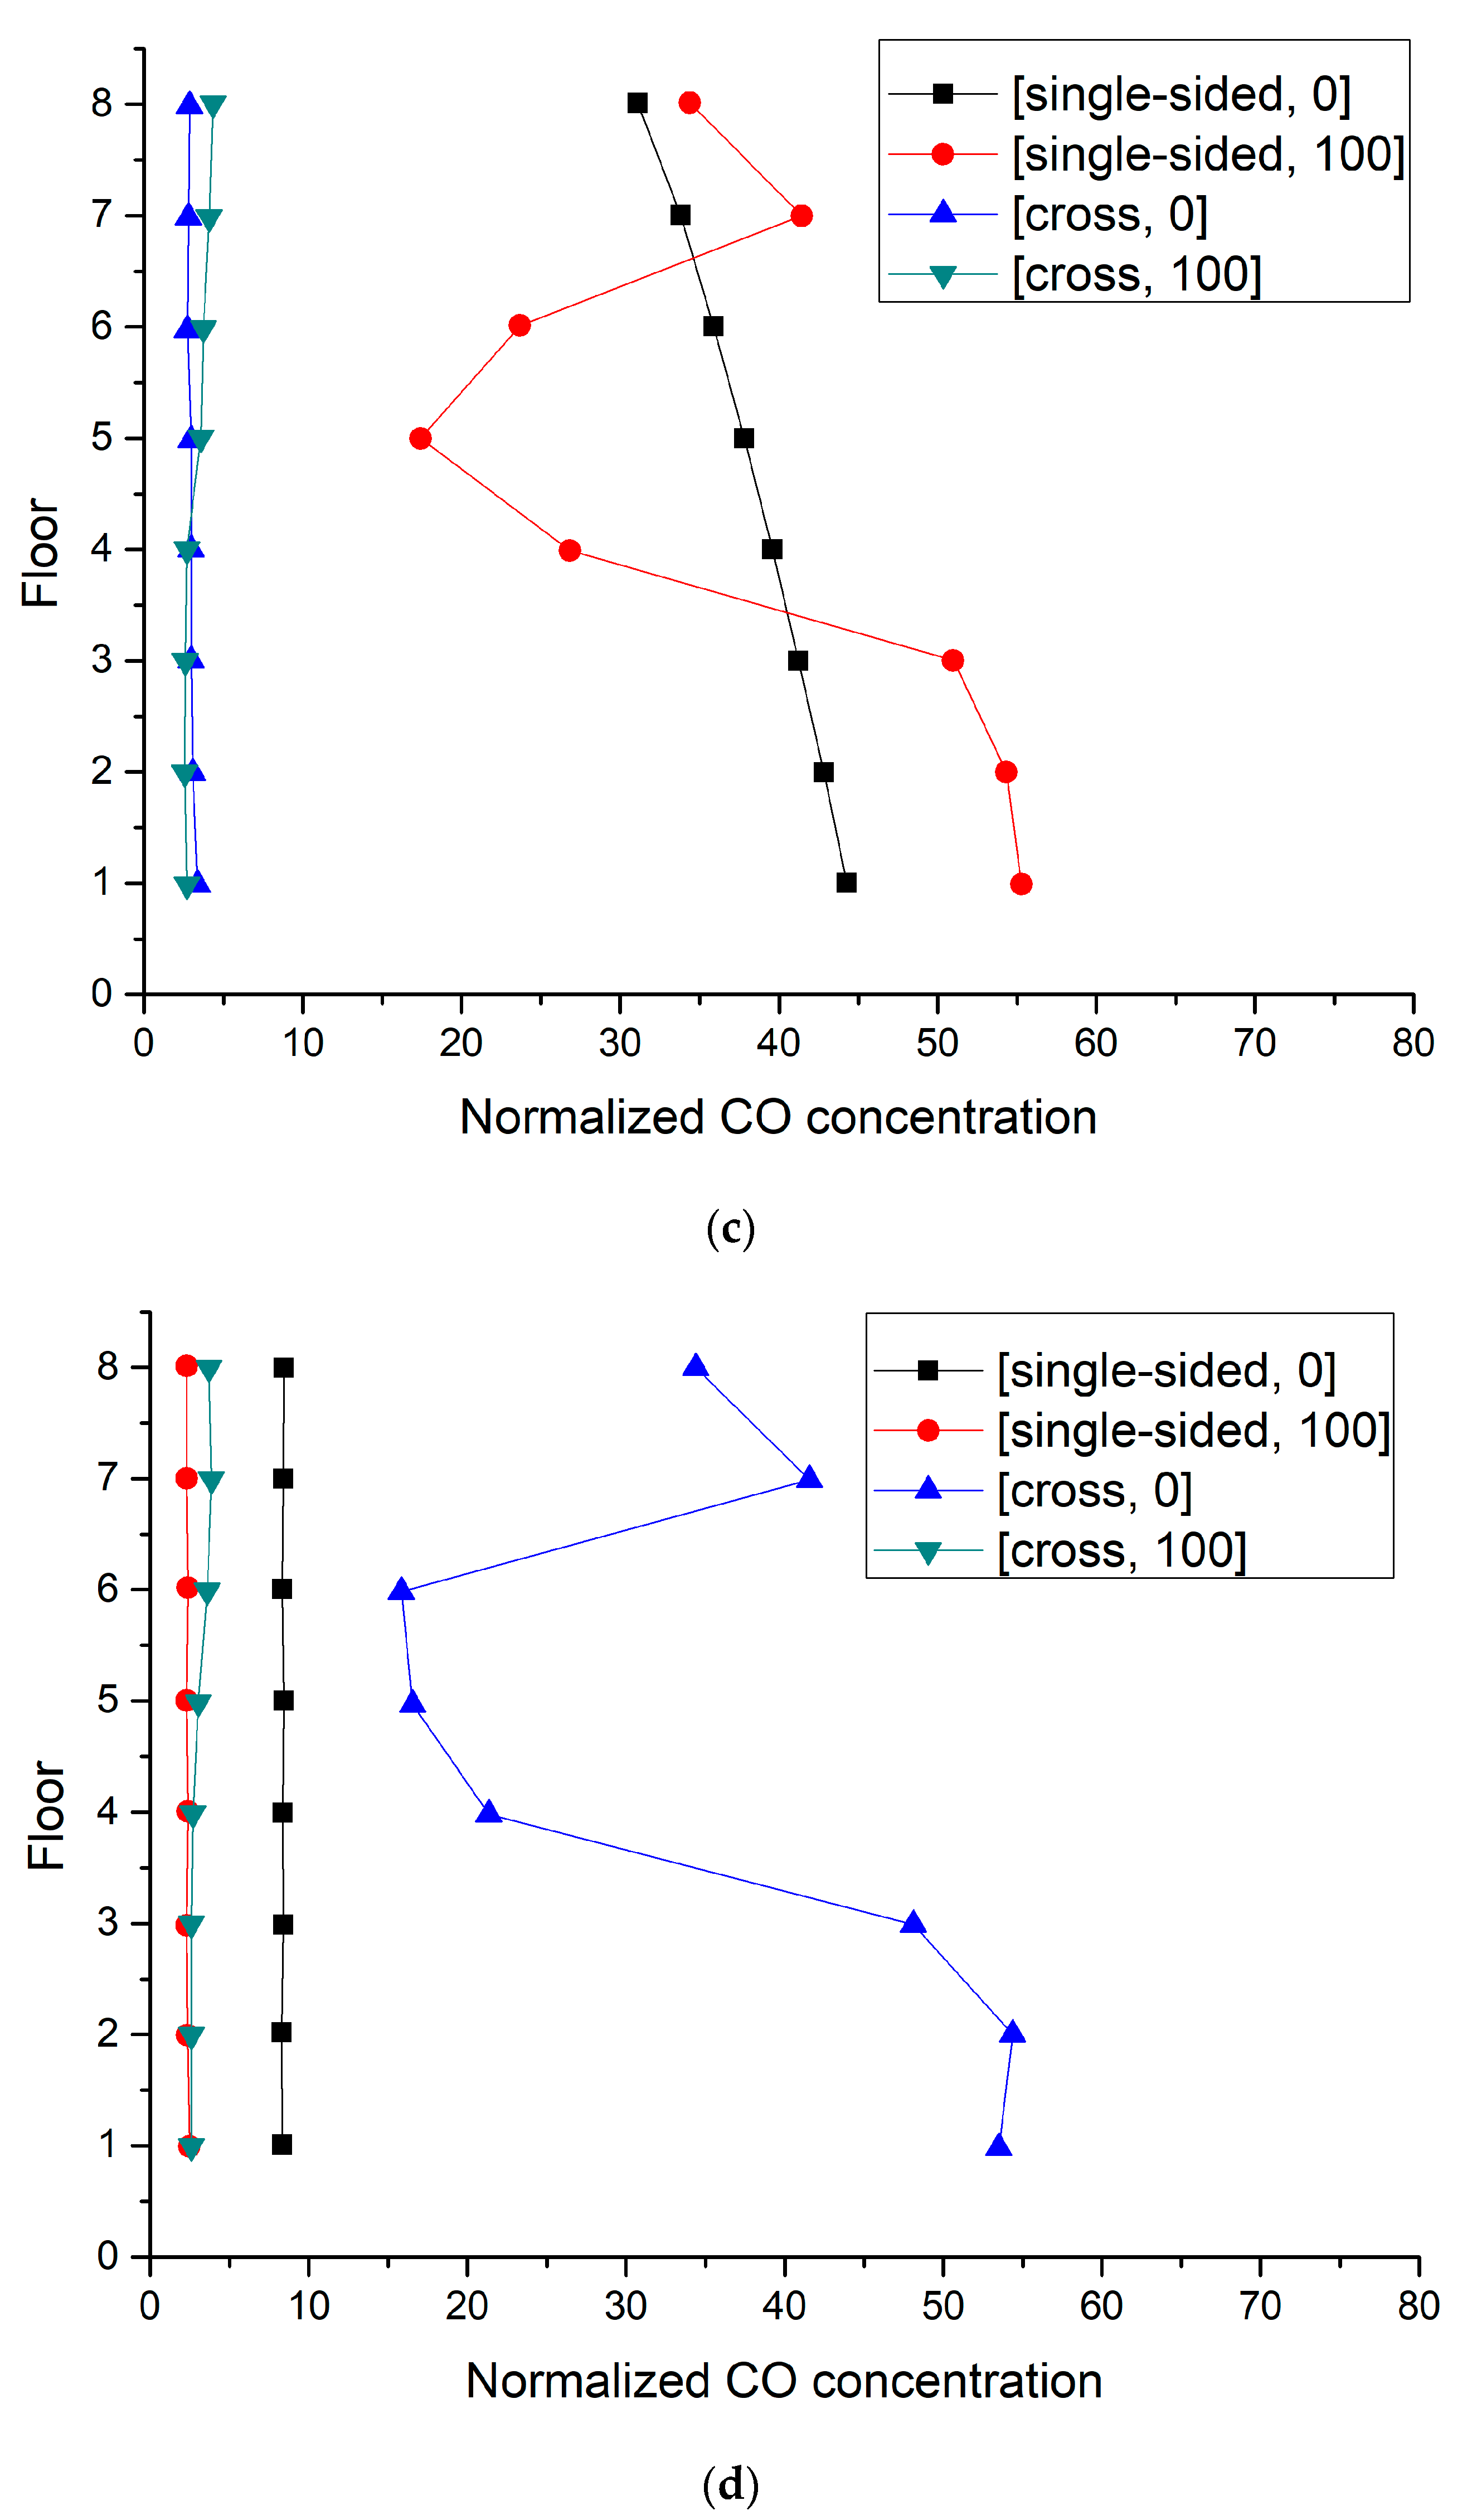
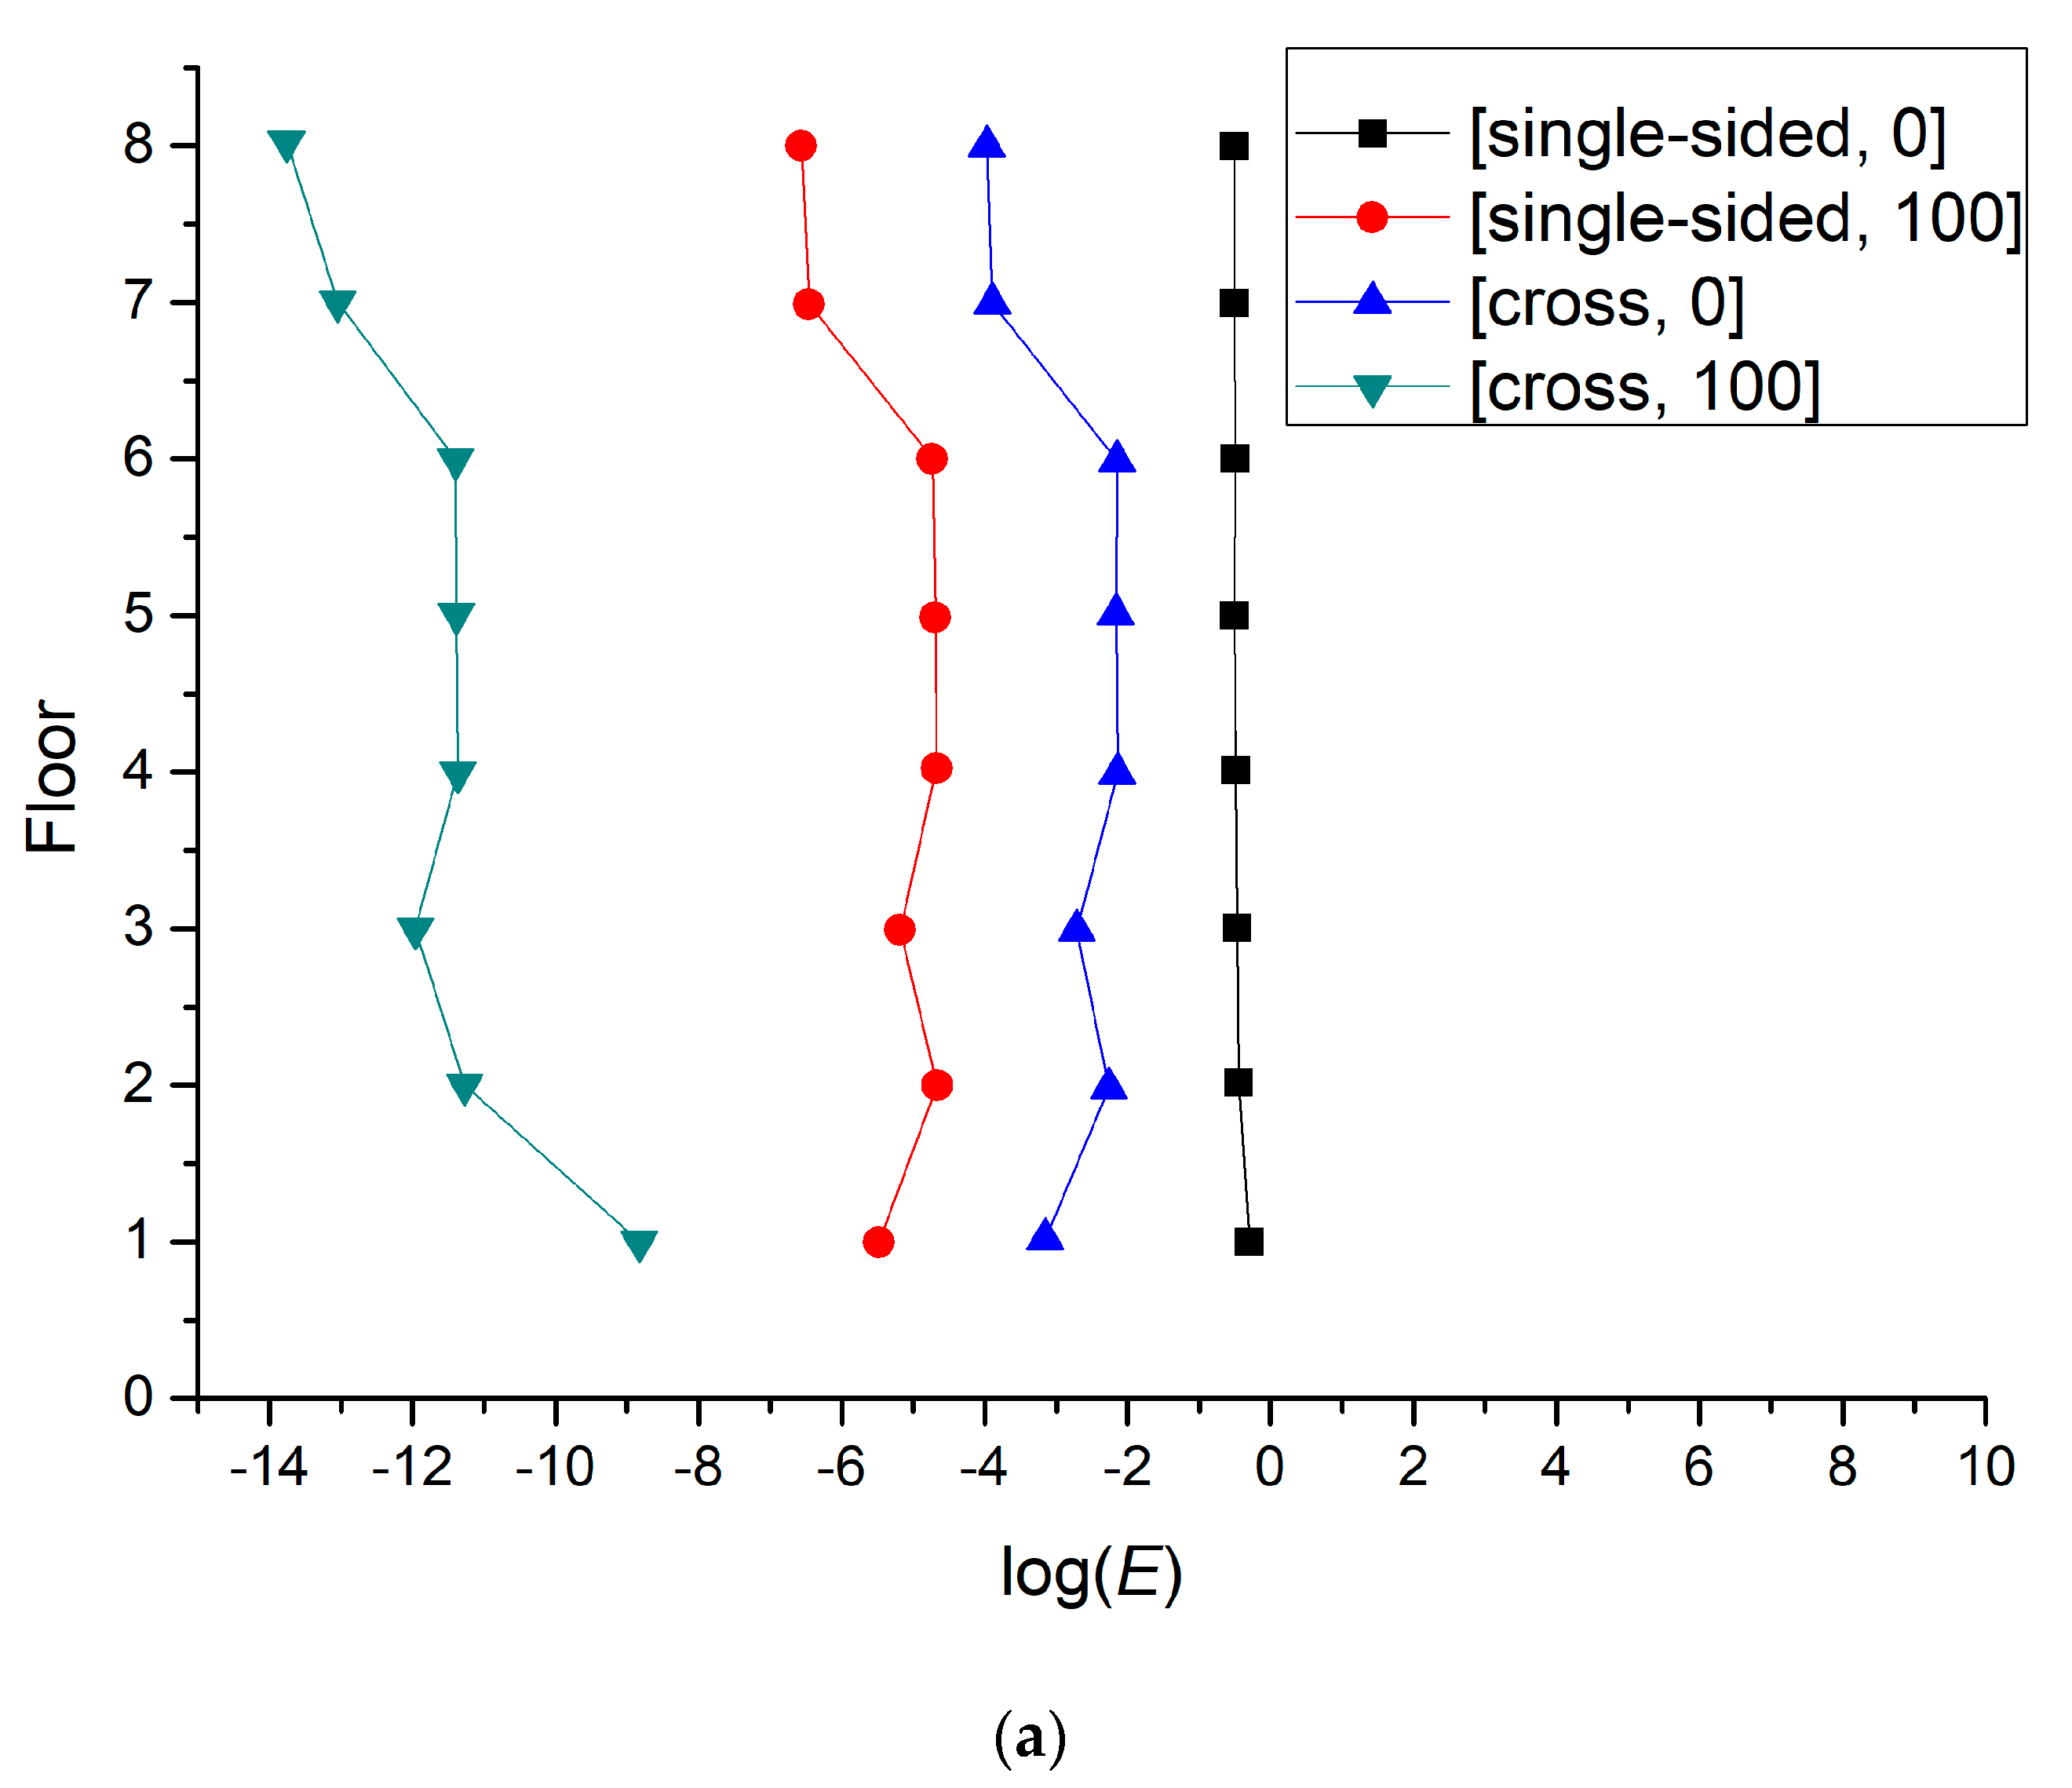
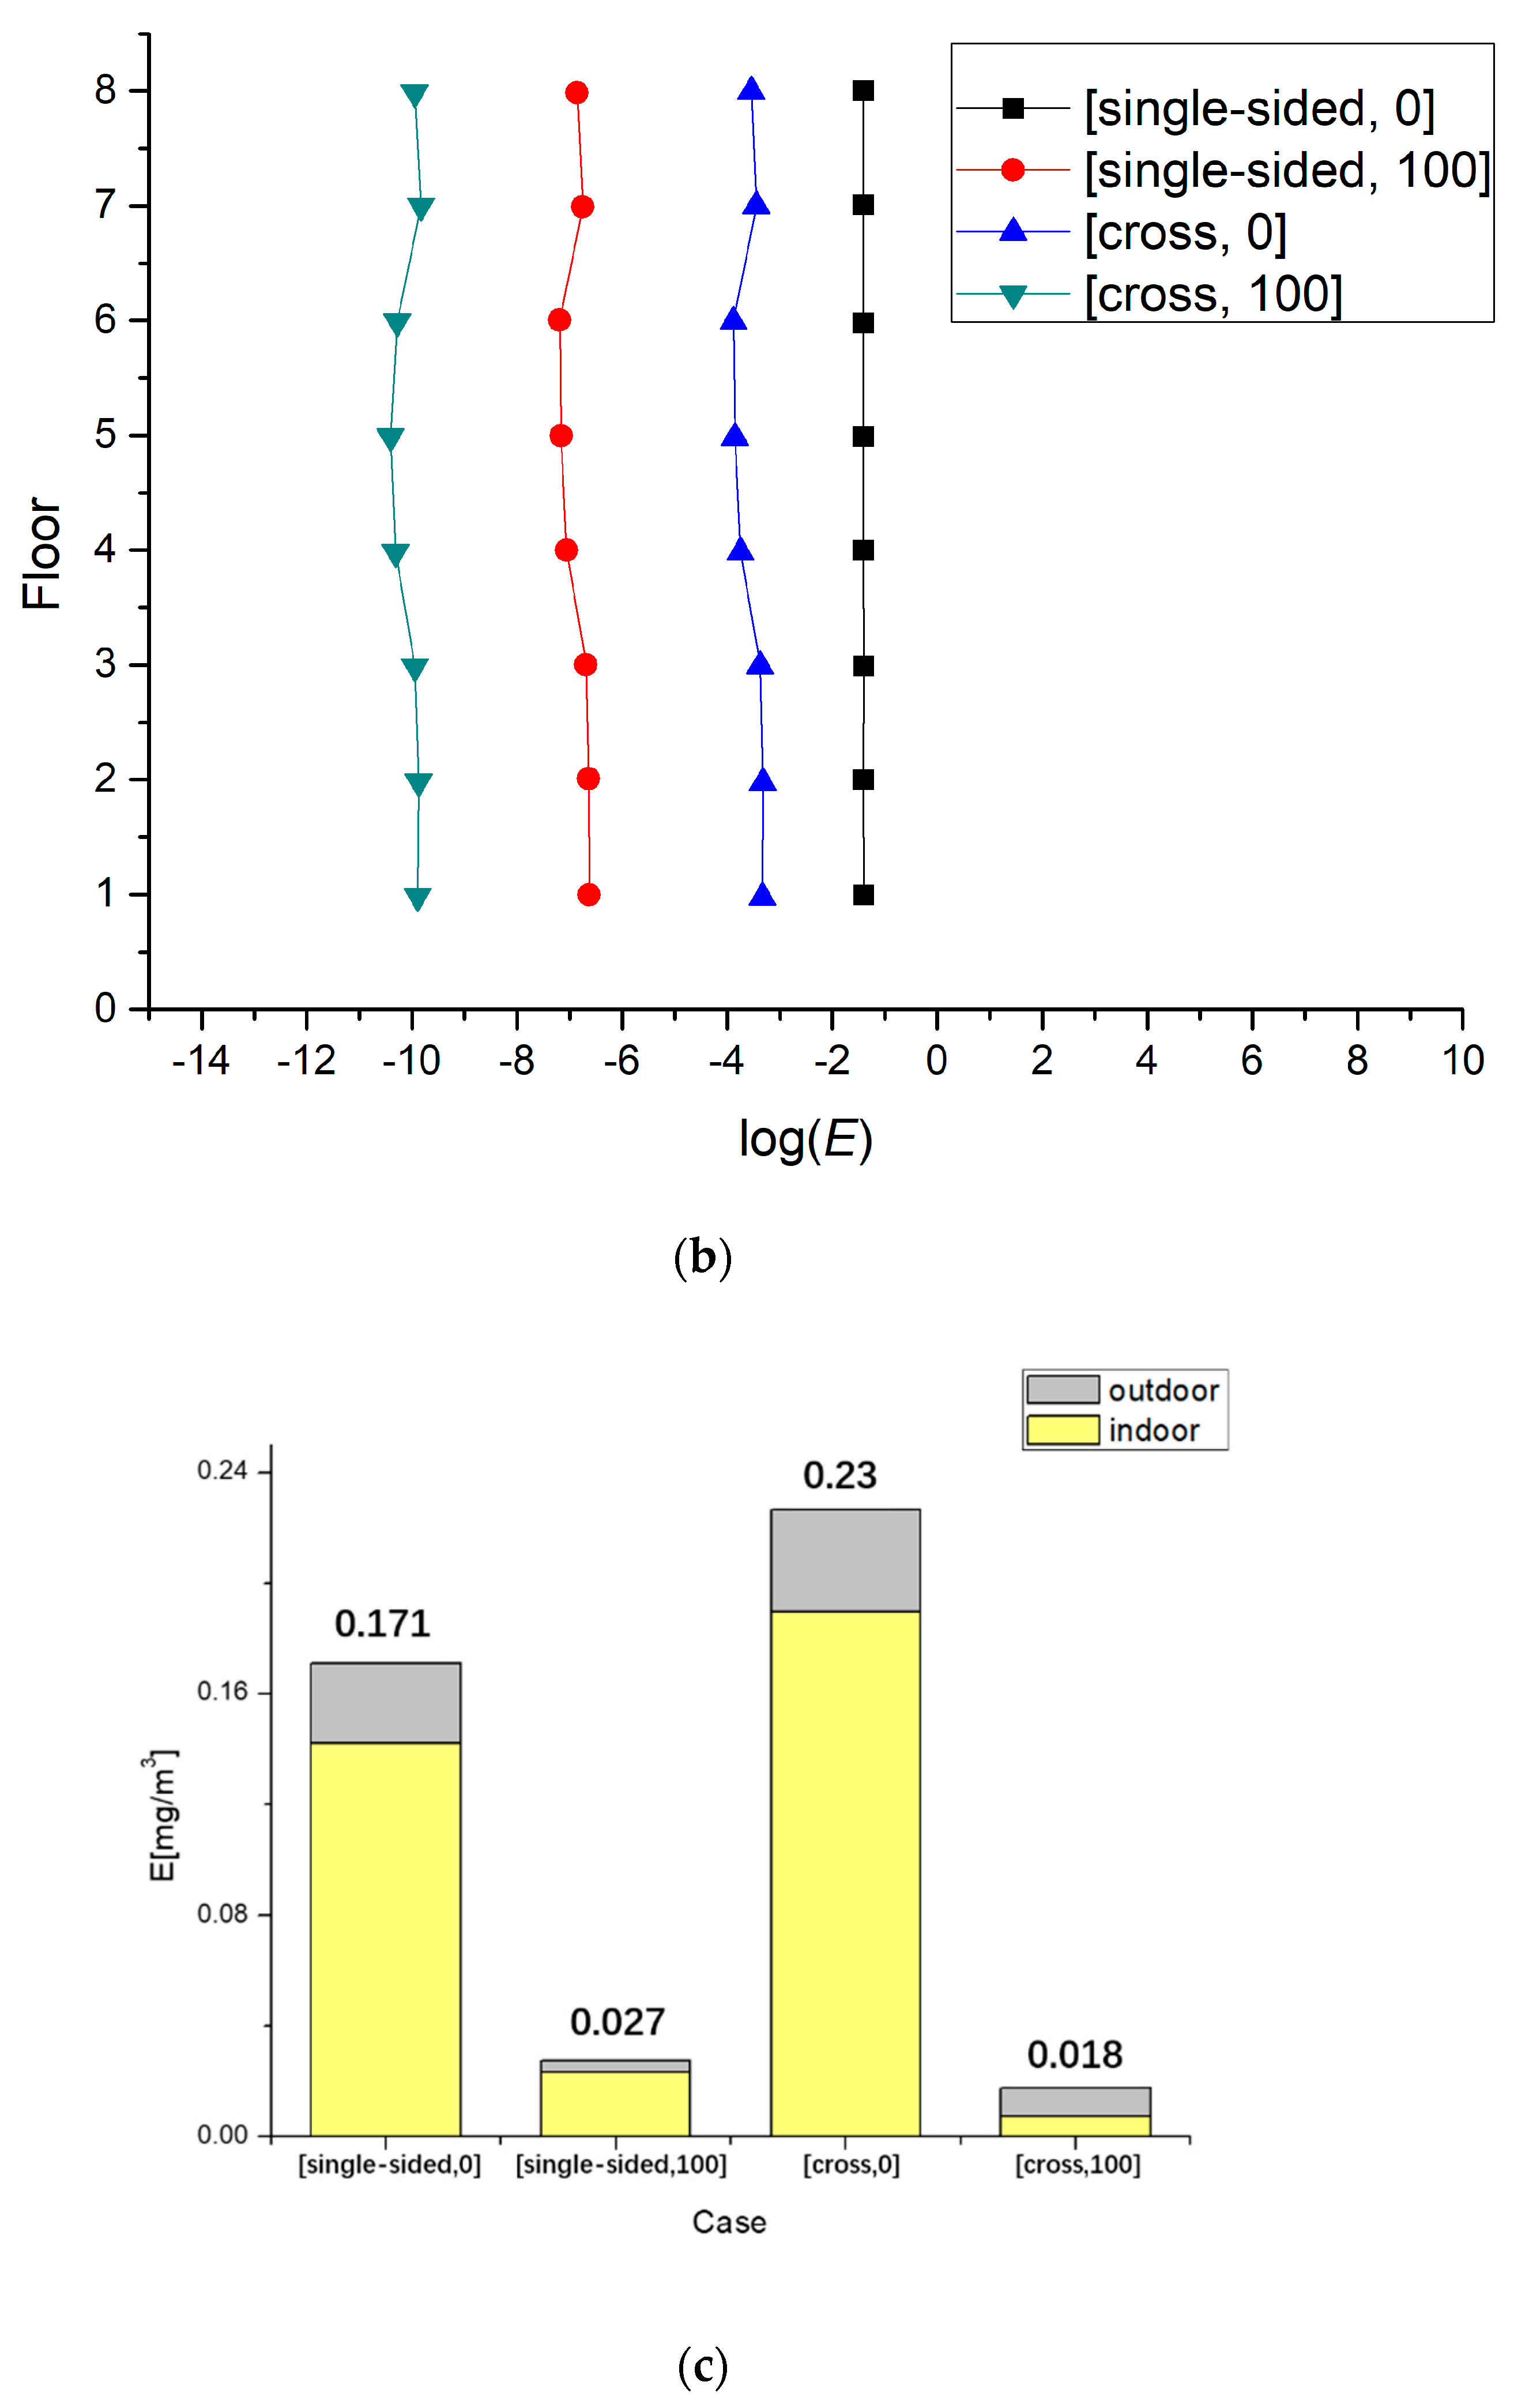
3.3.3. Exposure Concentration in the Target Street Canyon

Exposure concentration (E) defined in the Section 2.2.2 is adopted for the exposure assessment for the indoor and outdoor environment in the target canyon. As presented in Figure 9a,b, the middle floors of the leeward building side have larger E comparing to the lower and upper floors. In contrast, Middle floors of the windward building side have smaller E. With cross-ventilation, E of each floor is much smaller than that with single-side ventilation. It indicates that the cross-ventilation mode improves the indoor ventilation and the indoor air quality. Moreover, the thermal force is beneficial for diluting the indoor air pollutants. Indoor heating can decrease E in the indoor environment. Figure 9c summarizes the mean indoor and outdoor E in all four cases. Since the long duration time in the indoor environment (about 90% of the daily time), the indoor E is much higher than outdoor E, except in Case [cross, 100]. The largest value of indoor and outdoor ratio is 4.9. With isothermal conditions, the cross-ventilation mode has larger E. Furthermore, indoor heating is helpful to decrease the exposure concentration. The change of the ventilation mode only produces small E variations when indoor heating exists.

4. Discussion

Our previous work studied the outdoor wind and thermal environments in a 2D idealized street canyon at a reduced canyon scale and explored the impacts of various AR as well as solar wall heating [73,78,79]. A single-vortex flow pattern was found in the street canyon at AR ~ 1 under isothermal conditions. It is similar as the flow field structure in this work with isothermal conditions (Figure 3a). The two-vortices structure is found in canyon 2 with indoor wall heating in the windward building (Figure 3c). A similar structure was also found in the street canyon at AR ~ 1 with solar wall heating (15:00) on the windward wall [73]. Previous studies focus on the outdoor air flow and the urban ventilation. This work is a further study of the previous work, focusing on the indoor-outdoor flow field and air mass exchange, and extending the application of CFD modelling to the area of exposure and public health. The impacts of indoor-outdoor air temperature difference on the flow, pollutants dispersion, and exposure concentration are discussed based on the numerical simulation at full scale with AR = 1. The functions of different natural ventilation modes, isothermal conditions, and indoor wall heating conditions on the indoor and outdoor flow, traffic-related pollutant dispersion, and residents’ exposure are investigated. The results of the population intake fraction (IF) and personal intake fraction (P_IF) are similar with that of Hong Kong calculated by Luo et al. [61], the annual mean IF being ~270 ppmv.
Altering the ventilation mode from single-side ventilation to cross ventilation under isothermal conditions would deteriorate the indoor air quality due to the diffusion of outdoor air pollutants. However, the indoor-outdoor air temperature differences could greatly improve the dispersion condition, decrease the pollutants’ concentrations, and reduce indoor IF. Nevertheless, the cascading effect found in this work is an often-overlooked pathway of exposure. This effect was also found by many other previous research, both with numerical simulations [21,22] and scaled outdoor observations [29]. Furthermore, with cross ventilation, the flow from outdoor to indoor and the flow passing through the whole building could be another exposure pathway between different rooms or even different buildings, as concluded by [20]. Thus, the CFD modelling can provide a powerful tool of back trajectory for the air pollutants exposure or even for respiratory infectious diseases.
To simplify the calculation, the parameters used in this work are idealized and simplified. The idealized 2D street canyon model is employed in this work. Natural ventilation modes are adopted only for two buildings in the target street canyon. The inert gas CO is applied as the tracer gas for the traffic emission. Chemical and photochemical processes are not considered. Indoor-heating scenarios are designed for the possible ventilation scheme designed to balance energy consumption of indoor heating and indoor air quality in cold season. The heat flux setting for the indoor room wall of indoor-heating scenarios is also an idealized assumption for the cold season. Nevertheless, parameters in the real city are more complicated and are influenced by various environmental factors. One needs more consideration when applying the results to real urban communities. In ongoing work, more parameters are considered in the simulation, such as AR, outdoor solar wall heating, and urban layouts (e.g., building configurations and urban greening). Moreover, the planned work also includes model validation by our scaled outdoor experiments (H = 1.2 m) as reported by Chen et al. [78,79]. These works will be adopted in numerical studies for full-scale realistic or idealized urban models.

5. Conclusions

This work sets up a useful method to investigate the impacts of different building ventilation schemes and the indoor-out door air temperature differences on the flow field and the traffic-related pollutant dispersion. The application of the CFD modelling is extended to the area of exposure and consequently connected to public health, which is a novel approach. Ventilation efficiency and residents’ exposure with two types of natural ventilation schemes of single-side ventilation and cross ventilation are investigated, integrating with isothermal conditions and indoor wall heating conditions, respectively. The cross ventilation improved the indoor ventilation and pollutants’ dilution with isothermal conditions. The existence of the indoor-outdoor temperature difference increases the ventilation efficiency of the single-side ventilation scheme. However, it has negative impacts on the cross-ventilation mode in some floors. Moreover, the existence of indoor wall heating can clearly decrease the risk of indoor personal exposure under both natural ventilation modes. In general, cross ventilation mitigates the environmental health stress for indoor environments with indoor wall heating, and the personal intake fraction is decreased by about 66% compared to single-side ventilation. The study numerically investigates the building ventilation and pollutant dispersion in urban communities with natural ventilation.
The method and the results are helpful references for optimizing building ventilation plans and improving indoor air quality. Owing to the complex environmental in the real city, more parameters should be considered when applying the method for the real urban community. Next steps of the ongoing work are (1) coupling the radiation model in the simulation for analysing the impact of solar radiation, (2) applying the method in street canyons with various AR values, and (3) implementing scaled-model outdoor field observation campaign for further validations.

Author Contributions

Conceptualization, J.H.; methodology, J.H.; validation, J.H. and H.L.; data curation, Y.W.; Simulation, Y.W.; visualization, Y.W. and H.L.; writing—original draft preparation, H.L., Q.W., Q.L., J.L. and Y.H.; writing—review and editing, H.L., Q.W., X.Z., Q.L. and J.L. All authors have read and agreed to the published version of the manuscript.

Funding

This work was supported by the National Natural Science Foundation of China (NSFC, No. 41805102, 42175094, and 41875015), as well as Special Fund for Science and Technology Innovation Strategy of Guangdong Province (International cooperation) (China, No. 2019A050510021). The financial support from UK GCRF Rapid Response Grant on “Transmission of SARS-CoV-2 virus in crowded indoor environment” is also gratefully acknowledged. The authors are also grateful to the support of China Energy Science and Technology Research Institute (HB2020Y09).

Conflicts of Interest

The authors declare no conflict of interest.

Appendix A

Our previous works have implemented detailed validations for the flow and dispersion model applied in this work. Figure A1 presents the CFD validation with wind-tunnel experiment of RNG k-ε model [73]. The validation for the pollutant dispersion model is illustrated in Figure A2 [72].
Figure A1. CFD validations by wind-tunnel data (H ~0.1 m), with RNG k-ε model and scalable wall function. (a) Vertical profile of normalized velocity ratio with three grids, AR = 4. (b) Vertical profile of normalized stream-wise velocity ratio with moderate grid, AR = 2.4. (c) Vertical profile of normalized TKE with moderate grid, AR = 2.4. (d) Vertical profile of normalized velocity ratio with moderate grid and different Reynolds number, AR = 2.4.
Atmosphere 13 00028 g0a1aAtmosphere 13 00028 g0a1b
Figure A2. Validation for pollutants dispersion model. (a) Configurations of the wind-tunnel experiment with top view. (b) Configurations of the wind-tunnel experiment with lateral view. (c) Vertical profiles of normalized inert gas concentration K at the roof top of the model. (d) Vertical profiles of K at the leeward and windward wall.
Atmosphere 13 00028 g0a2

References

  1. United Nations. 2018 Revision of World Urbanization Prospects. 2018. Available online: https://www.un.org/development/desa/publications/2018-revision-of-world-urbanization-prospects.html (accessed on 20 December 2021).
  2. Peters, A.; Pope, C.A., III. Cardiopulmonary mortality and air pollution. Lancet 2002, 360, 1184–1185. [Google Scholar] [CrossRef]
  3. Ji, W.; Zhao, B. Estimating Mortality Derived from Indoor Exposure to Particles of Outdoor Origin. PLoS ONE 2015, 10, e0124238. [Google Scholar] [CrossRef] [PubMed] [Green Version]
  4. Lin, M.; Hang, J.; Li, Y.; Luo, Z.; Sandberg, M. Quantitative ventilation assessments of idealized urban canopy layers with various urban layouts and the same building packing density. Build. Environ. 2014, 79, 152–167. [Google Scholar] [CrossRef]
  5. Hang, J.; Luo, Z.; Wang, X.; He, L.; Wang, B.; Zhu, W. The influence of street layouts and viaduct settings on daily carbon monoxide exposure and intake fraction in idealized urban canyons. Environ. Pollut. 2016, 220, 72–86. [Google Scholar] [CrossRef] [PubMed]
  6. Kobayashi, T.; Sandberg, M.; Kotani, H.; Claesson, L. Experimental investigation and CFD analysis of cross-ventilated flow through single room detached house model. Build. Environ. 2010, 45, 2723–2734. [Google Scholar] [CrossRef]
  7. Van Hooff, T.; Blocken, B. Coupled urban wind flow and indoor natural ventilation modelling on a high-resolution grid: A case study for the Amsterdam ArenA stadium. Environ. Model. Softw. 2010, 25, 51–65. [Google Scholar] [CrossRef]
  8. Jin, R.Q.; Hang, J.; Liu, S.S.; Wei, J.J.; Liu, Y.; Xie, J.L.; Sandberg, M. Numerical investigation of wind-driven natural ventilation performance in a multi-storey hospital by coupling indoor and outdoor airflow. Indoor Built Environ. 2016, 25, 1226–1247. [Google Scholar] [CrossRef]
  9. Chen, C.; Zhao, B.; Zhou, W.; Jiang, X.; Tan, Z. A methodology for predicting particle penetration factor through cracks of windows and doors for actual engineering application. Build. Environ. 2012, 47, 339–348. [Google Scholar] [CrossRef]
  10. Quang, T.N.; He, C.; Morawska, L.; Knibbs, L.D.; Falk, M. Vertical particle concentration profiles around urban office buildings. Atmos. Chem. Phys. Discuss. 2012, 12, 5017–5030. [Google Scholar] [CrossRef] [Green Version]
  11. Bady, M.; Kato, S.; Huang, H. Towards the application of indoor ventilation efficiency indices to evaluate the air quality of urban areas. Build. Environ. 2008, 43, 1991–2004. [Google Scholar] [CrossRef]
  12. Ng, W.-Y.; Chau, C.-K. A modeling investigation of the impact of street and building configurations on personal air pollutant exposure in isolated deep urban canyons. Sci. Total Environ. 2014, 468–469, 429–448. [Google Scholar] [CrossRef] [PubMed]
  13. Oke, T.R. Boundary Layer Climates; Routledge: England, UK, 1987. [Google Scholar]
  14. Grimmond, C.; Roth, M.; Oke, T.R.; Au, Y.; Best, M.; Betts, R.; Carmichael, G.; Cleugh, H.; Dabberdt, W.; Emmanuel, R.; et al. Climate and More Sustainable Cities: Climate Information for Improved Planning and Management of Cities (Producers/Capabilities Perspective). Procedia Environ. Sci. 2010, 1, 247–274. [Google Scholar] [CrossRef] [Green Version]
  15. Kolokotroni, M.; Giannitsaris, I.; Watkins, R. The effect of the London urban heat island on building summer cooling demand and night ventilation strategies. Sol. Energy 2006, 80, 383–392. [Google Scholar] [CrossRef]
  16. Fung, W.Y.; Lam, K.S.; Hung, W.T.; Pang, S.W.; Lee, Y.L. Impact of urban temperature on energy consumption of Hong Kong. Energy 2006, 31, 2623–2637. [Google Scholar] [CrossRef]
  17. Orme, M. Estimates of the energy impact of ventilation and associated financial expenditures. Energy Build. 2001, 33, 199–205. [Google Scholar] [CrossRef]
  18. Favarolo, P.A.; Manz, H. Temperature-driven single-sided ventilation through a large rectangular opening. Build. Environ. 2005, 40, 689–699. [Google Scholar] [CrossRef]
  19. Tang, J.W.; Li, Y.; Eames, I.; Chan, P.K.S.; Ridgway, G.L. Factors involved in the aerosol transmission of infection and control of ventilation in healthcare premises. J. Hosp. Infect. 2006, 64, 100–114. [Google Scholar] [CrossRef]
  20. Li, Y.; Leung, G.M.; Tang, J.W.; Yang, X.; Chao, Y.H.C.; Lin, Z.; Lu, W.-Z.J.; Nielsen, P.V.; Niu, J.; Qian, H.; et al. Role of ventilation in airborne transmission of infectious agents in the built environment? A multidisciplinary systematic review. Indoor Air 2007, 17, 2–18. [Google Scholar] [CrossRef]
  21. Gao, N.P.; Niu, J.L.; Perino, M.; Heiselberg, P. The airborne transmission of infection between flats in high-rise residential buildings: Tracer gas simulation. Build. Environ. 2008, 43, 1805–1817. [Google Scholar] [CrossRef] [PubMed]
  22. Gao, N.P.; Niu, J.L.; Perino, M.; Heiselberg, P. The airborne transmission of infection between flats in high-rise residential buildings: Particle simulation. Build. Environ. 2009, 44, 402–410. [Google Scholar] [CrossRef] [PubMed]
  23. Niachou, K.; Livada, I.; Santamouris, M. Experimental study of temperature and airflow distribution inside an urban street canyon during hot summer weather conditions—Part I: Air and surface temperatures. Build. Environ. 2008, 43, 1383–1392. [Google Scholar] [CrossRef]
  24. Giannopoulou, K.; Santamouris, M.; Livada, I.; Georgakis, C.; Caouris, Y. The Impact of Canyon Geometry on Intra Urban and Urban: Suburban Night Temperature Differences Under Warm Weather Conditions. Pure Appl. Geophys. 2010, 167, 1433–1449. [Google Scholar] [CrossRef]
  25. Fan, Y.F.; Li, Y.G.; Hang, J.; Wang, K.; Yang, X.Y. Natural convection flows along a 16-storey high-rise building. Build. Environ. 2016, 107, 215–225. [Google Scholar] [CrossRef]
  26. Yee, E.; Biltoft, C.A. Concentration Fluctuation Measurements in a Plume Dispersing Through a Regular Array of Obstacles. Bound.-Layer Meteorol. 2004, 111, 363–415. [Google Scholar] [CrossRef]
  27. Kawai, T.; Kanda, M. Urban Energy Balance Obtained from the Comprehensive Outdoor Scale Model Experiment. Part I: Basic Features of the Surface Energy Balance. J. Appl. Meteorol. Clim. 2010, 49, 1341–1359. [Google Scholar] [CrossRef]
  28. Dallman, A.; Magnusson, S.; Britter, R.; Norford, L.; Entekhabi, D.; Fernando, H.J. Conditions for thermal circulation in urban street canyons. Build. Environ. 2014, 80, 184–191. [Google Scholar] [CrossRef]
  29. Dai, Y.W.; Mak, C.M.; Zhang, Y.; Cui, D.J.; Hang, J. Investigation of interunit dispersion in 2D street canyons: A scaled outdoor experiment. Build. Environ. 2020, 171, 106673. [Google Scholar] [CrossRef] [PubMed]
  30. Barlow, J.F.; Belcher, S.E. A Wind Tunnel Model for Quantifying Fluxes in the Urban Boundary Layer. Bound.-Layer Meteorol. 2002, 104, 131–150. [Google Scholar] [CrossRef]
  31. Cui, P.-Y.; Li, Z.; Tao, W.-Q. Wind-tunnel measurements for thermal effects on the air flow and pollutant dispersion through different scale urban areas. Build. Environ. 2016, 97, 137–151. [Google Scholar] [CrossRef]
  32. Allegrini, J.; Dorer, V.; Carmeliet, J. Buoyant flows in street canyons: Validation of CFD simulations with wind tunnel measurements. Build. Environ. 2013, 72, 63–74. [Google Scholar] [CrossRef]
  33. Allegrini, J. A wind tunnel study on three-dimensional buoyant flows in street canyons with different roof shapes and building lengths. Build. Environ. 2018, 143, 71–88. [Google Scholar] [CrossRef]
  34. Blocken, B.; Stathopoulos, T.; Carmeliet, J.; Hensen, J.L. Application of computational fluid dynamics in building performance simulation for the outdoor environment: An overview. J. Build. Perform. Simul. 2011, 4, 157–184. [Google Scholar] [CrossRef]
  35. Blocken, B.J.E. Computational Fluid Dynamics for urban physics: Importance, scales, possibilities, limitations and ten tips and tricks towards accurate and reliable simulations. Build. Environ. 2015, 91, 219–245. [Google Scholar] [CrossRef] [Green Version]
  36. Blocken, B. LES over RANS in building simulation for outdoor and indoor applications: A foregone conclusion? Build. Simul. 2018, 11, 821–870. [Google Scholar] [CrossRef] [Green Version]
  37. Tominaga, Y.; Stathopoulos, T. CFD simulation of near-field pollutant dispersion in the urban environment: A review of current modeling techniques. Atmos. Environ. 2013, 79, 716–730. [Google Scholar] [CrossRef] [Green Version]
  38. Toparlar, Y.; Blocken, B.; Vos, P.; van Heijst, G.; Janssen, W.; van Hooff, T.; Montazeri, H.; Timmermans, H. CFD simulation and validation of urban microclimate: A case study for Bergpolder Zuid, Rotterdam. Build. Environ. 2015, 83, 79–90. [Google Scholar] [CrossRef] [Green Version]
  39. Toparlar, Y.; Blocken, B.; Maiheu, B.; van Heijst, G.J.F. A review on the CFD analysis of urban microclimate. Renew. Sustain. Energy Rev. 2017, 80, 1613–1640. [Google Scholar] [CrossRef]
  40. Dai, Y.W.; Mak, C.M.; Ai, Z.T.; Hang, J. Evaluation of computational and physical parameters influencing CFD simulations of pollutant dispersion in building arrays. Build. Environ. 2018, 137, 90–107. [Google Scholar] [CrossRef]
  41. Liu, A.J.; Niu, J.; Mak, C.M.; Xia, Q. Detached eddy simulation of pedestrian-level wind and gust around an elevated building. Build. Environ. 2017, 125, 168–179. [Google Scholar] [CrossRef]
  42. Chew, L.W.; Aliabadi, A.A.; Norford, L.K. Flows across high aspect ratio street canyons: Reynolds number independence revisited. Environ. Fluid Mech. 2018, 18, 1275–1291. [Google Scholar] [CrossRef]
  43. Li, X.-X.; Liu, C.; Leung, D.; Lam, K.M. Recent progress in CFD modelling of wind field and pollutant transport in street canyons. Atmos. Environ. 2006, 40, 5640–5658. [Google Scholar] [CrossRef]
  44. Antoniou, N.; Montazeri, H.; Wigo, H.; Neophytou, M.K.-A.; Blocken, B.; Sandberg, M. CFD and wind-tunnel analysis of outdoor ventilation in a real compact heterogeneous urban area: Evaluation using “air delay”. Build. Environ. 2017, 126, 355–372. [Google Scholar] [CrossRef]
  45. Blocken, B.; Stathopoulos, T.; Carmeliet, J. CFD simulation of the atmospheric boundary layer: Wall function problems. Atmos. Environ. 2007, 41, 238–252. [Google Scholar] [CrossRef]
  46. Gromke, C. A vegetation modeling concept for Building and Environmental Aerodynamics wind tunnel tests and its application in pollutant dispersion studies. Environ. Pollut. 2011, 159, 2094–2099. [Google Scholar] [CrossRef]
  47. Li, Q.; Bou-Zeid, E.; Anderson, W.; Grimmond, S.; Hultmark, M. Quality and reliability of les of convective scalar transfer at high reynolds numbers. Int. J. Heat Mass Transf. 2016, 102, 959–970. [Google Scholar] [CrossRef] [Green Version]
  48. Cai, X. Effects of differential wall heating in street canyons on dispersion and ventilation characteristics of a passive scalar. Atmos. Environ. 2012, 51, 268–277. [Google Scholar] [CrossRef]
  49. Li, X.-X.; Liu, C.-H.; Leung, D.Y.C. Numerical investigation of pollutant transport characteristics inside deep urban street canyons. Atmos. Environ. 2009, 43, 2410–2418. [Google Scholar] [CrossRef]
  50. Chew, L.W.; Glicksman, L.R.; Norford, L.K. Buoyant flows in street canyons: Comparison of RANS and LES at reduced and full scales. Build. Environ. 2018, 146, 77–87. [Google Scholar] [CrossRef]
  51. Ashie, Y.; Kono, T. Urban-scale CFD analysis in support of a climate-sensitive design for the Tokyo Bay area. Int. J. Clim. 2010, 31, 174–188. [Google Scholar] [CrossRef]
  52. Gromke, C.; Blocken, B. Influence of avenue-trees on air quality at the urban neighborhood scale. Part I: Quality assurance studies and turbulent Schmidt number analysis for RANS CFD simulations. Environ. Pollut. 2015, 196, 214–223. [Google Scholar] [CrossRef] [PubMed] [Green Version]
  53. Panagiotou, I.; Neophytou, M.K.-A.; Hamlyn, D.; Britter, R.E. City breathability as quantified by the exchange velocity and its spatial variation in real inhomogeneous urban geometries: An example from central London urban area. Sci. Total Environ. 2013, 442, 466–477. [Google Scholar] [CrossRef] [PubMed]
  54. Xie, X.; Liu, C.-H.; Leung, D.Y.C. Impact of building facades and ground heating on wind flow and pollutant transport in street canyons. Atmos. Environ. 2007, 41, 9030–9049. [Google Scholar] [CrossRef]
  55. Zhang, K.; Chen, G.; Wang, X.; Liu, S.; Mak, C.M.; Fan, Y.; Hang, J. Numerical evaluations of urban design technique to reduce vehicular personal intake fraction in deep street canyons. Sci. Total Environ. 2018, 653, 968–994. [Google Scholar] [CrossRef] [PubMed]
  56. Lin, L.; Hang, J.; Wang, X.; Wang, X.; Fan, S.; Fan, Q.; Liu, Y. Integrated Effects of Street Layouts and Wall Heating on Vehicular Pollutant Dispersion and their Reentry Toward Downstream Canyons. Aerosol Air Qual. Res. 2016, 16, 3142–3163. [Google Scholar] [CrossRef]
  57. Hang, J.; Buccolieri, R.; Yang, X.; Yang, H.Y.; Quarta, F.; Wang, B.M. Impact of indoor-outdoor temperature differences on dispersion of gaseous pollutant and particles in idealized street canyons with and without viaduct settings. Build. Simul. 2018, 12, 285–297. [Google Scholar] [CrossRef]
  58. Elmaghraby, H.A.; Chiang, Y.W.; Aliabadi, A.A. Are aircraft acceleration-induced body forces effective on contaminant dispersion in passenger aircraft cabins? Sci. Technol. Built Environ. 2019, 25, 858–872. [Google Scholar] [CrossRef]
  59. Elmaghraby, H.A.; Chiang, Y.W.; Aliabadi, A.A. Ventilation strategies and air quality management in passenger aircraft cabins: A review of experimental approaches and numerical simulations. Sci. Technol. Built Environ. 2017, 24, 160–175. [Google Scholar] [CrossRef]
  60. Bennett, D.H.; Mckone, T.E.; Evans, J.S.; Nazaroff, W.W.; Margni, M.D.; Jolliet, O.; Smith, K.R. Defining intake fraction. Environ. Sci. Technol. 2002, 36. Available online: https://pubs.acs.org/doi/pdf/10.1021/es0222770 (accessed on 20 December 2021). [CrossRef] [Green Version]
  61. Luo, Z.; Li, Y.; Nazaroff, W.W. Intake fraction of nonreactive motor vehicle exhaust in Hong Kong. Atmos. Environ. 2010, 44, 1913–1918. [Google Scholar] [CrossRef]
  62. Nazaroff, W.W. Inhalation intake fraction of pollutants from episodic indoor emissions. Build. Environ. 2008, 43, 269–277. [Google Scholar] [CrossRef]
  63. Zhou, Y.; Levy, J.I. The impact of urban street canyons on population exposure to traffic-related primary pollutants. Atmos. Environ. 2008, 42, 3087–3098. [Google Scholar] [CrossRef]
  64. Fluent, Ansys Fluent, Theory Guide; ANSYS Inc.: Canonsburg, PA, USA, 2015.
  65. Yang, H.; Chen, T.; Lin, Y.; Buccolieri, R.; Mattsson, M.; Zhang, M.; Hang, J.; Wang, Q. Integrated impacts of tree planting and street aspect ratios on CO dispersion and personal exposure in full-scale street canyons. Build. Environ. 2019, 169, 106529. [Google Scholar] [CrossRef]
  66. Tominaga, Y.; Mochida, A.; Yoshie, R.; Kataoka, H.; Nozu, T.; Yoshikawa, M.; Shirasawa, T. AIJ guidelines for practical applications of CFD to pedestrian wind environment around buildings. J. Wind. Eng. Ind. Aerodyn. 2008, 96, 1749–1761. [Google Scholar] [CrossRef]
  67. Franke, J.; Hellsten, A.; Schlunzen, K.H.; Carissimo, B. The COST 732 Best Practice Guideline for CFD simulation of flows in the urban environment: A summary. Int. J. Environ. Pollut. 2011, 44, 419. [Google Scholar] [CrossRef]
  68. Lien, F.-S.; Yee, E. Numerical Modelling of the Turbulent Flow Developing Within and Over a 3-D Building Array, Part I: A High-Resolution Reynolds-Averaged Navier—Stokes Approach. Bound.-Layer Meteorol. 2004, 112, 427–466. [Google Scholar] [CrossRef]
  69. Liu, C.-H.; Ng, C.-T.; Wong, C.C. A theory of ventilation estimate over hypothetical urban areas. J. Hazard. Mater. 2015, 296, 9–16. [Google Scholar] [CrossRef]
  70. Brown, M.J.; Lawson, R.E.; Decroix, D.S.; Lee, R.L. Comparison of Centerline Velocity Measurements Obtained around 2d and 3d Building Arrays in a Wind Tunnel. 2001. Available online: https://digital.library.unt.edu/ark:/67531/metadc716934/m2/1/high_res_d/783425.pdf (accessed on 20 December 2021).
  71. Snyder, W.H. Similarity criteria for the application of fluid models to the study of air pollution meteorology. Bound.-Layer Meteorol. 1972, 3, 113–134. [Google Scholar] [CrossRef]
  72. Zhang, Y.; Yang, X.; Yang, H.Y.; Zhang, K.; Wang, X.M.; Luo, Z.W.; Hang, J.; Zhou, S.Z. Numerical investigations of reactive pollutant dispersion and personal exposure in 3D urban-like models. Build. Environ. 2019, 169, 106569. [Google Scholar] [CrossRef]
  73. Chen, L.; Hang, J.; Chen, G.W.; Liu, S.H.; Lin, Y.Y.; Mattsson, M.; Sandberg, M.; Ling, H. Numerical investigations of wind and thermal environment in 2D scaled street canyons with various aspect ratios and solar wall heating. Build. Environ. 2020, 190, 107525. [Google Scholar] [CrossRef]
  74. Chang, C.-H.; Meroney, R.N. Numerical and physical modeling of bluff body flow and dispersion in urban street canyons. J. Wind. Eng. Ind. Aerodyn. 2001, 89, 1325–1334. [Google Scholar] [CrossRef] [Green Version]
  75. Habilomatis, G.; Chaloulakou, A. A CFD modeling study in an urban street canyon for ultrafine particles and population exposure: The intake fraction approach. Sci. Total Environ. 2015, 530–531, 227–232. [Google Scholar] [CrossRef]
  76. Allan, M.; Richardson, G.M.; Jones-Otazo, H. Probability Density Functions Describing 24-Hour Inhalation Rates for Use in Human Health Risk Assessments: An Update and Comparison. Hum. Ecol. Risk Assess. Int. J. 2008, 14, 372–391. [Google Scholar] [CrossRef]
  77. Chau, C.K.; Tu, E.Y.; Chan, D.W.T.; Burnett, C.J. Estimating the total exposure to air pollutants for different population age groups in Hong Kong. Environ. Int. 2002, 27, 617–630. [Google Scholar] [CrossRef]
  78. Chen, G.W.; Wang, D.Y.; Wang, Q.; Li, Y.G.; Wang, X.M.; Hang, J.; Gao, P.; Ou, C.Y.; Wang, K. Scaled outdoor experimental studies of urban thermal environment in street canyon models with various aspect ratios and thermal storage. Sci. Total Environ. 2020, 726, 138147. [Google Scholar] [CrossRef]
  79. Chen, G.W.; Yang, X.; Yang, H.Y.; Hang, J.; Lin, Y.Y.; Wang, X.M.; Wang, Q.; Liu, Y.L. The influence of aspect ratios and solar heating on flow and ventilation in 2D street canyons by scaled outdoor experiments. Build. Environ. 2020, 185, 107159. [Google Scholar] [CrossRef]
Figure 1. The computational domain and the boundary condition of the 2D street canyon model.
Atmosphere 13 00028 g001
Figure 2. Street canyon models (a) and mesh arrangements. (b) is the mesh for single-side ventilation scenarios and (c) is the mesh for cross ventilation scenarios.
Atmosphere 13 00028 g002aAtmosphere 13 00028 g002b
Figure 3. Streamline and velocity in street canyons with single-side ventilation mode under isothermal condition in the target canyon (a); with an indoor wall-heating condition in (b) the target canyon, (c) canyon 2 and (d) canyon 4.
Atmosphere 13 00028 g003aAtmosphere 13 00028 g003bAtmosphere 13 00028 g003c
Figure 4. Cascading effect in the single-side ventilated building upstream (canyon 2).
Atmosphere 13 00028 g004
Figure 5. Streamline and velocity in street canyons with cross-ventilation mode under isothermal condition in the target canyon (a); with indoor wall-heating condition in (b) the target canyon, (c) canyon 2 and (d) canyon 4.
Atmosphere 13 00028 g005aAtmosphere 13 00028 g005b
Figure 6. Air change rate of different building floors in (a) windward side of Building 1, (b) leeward side of Building 1, (c) windward side of Building 2, and (d) leeward side of Building 2.
Atmosphere 13 00028 g006aAtmosphere 13 00028 g006b
Figure 7. Normalized CO concentration at different floors in (a) windward side of Building 1, (b) leeward side of Building 1, (c) windward side of Building 2, and (d) leeward side of Building 2.
Atmosphere 13 00028 g007aAtmosphere 13 00028 g007b
Figure 8. Intake fraction IF in four cases.
Atmosphere 13 00028 g008
Figure 9. Mean exposure concentration (E) at eight floors in the leeward building side (a) and windward building side (b) in the target street canyon; (c) is the mean E for the total population in four cases.
Atmosphere 13 00028 g009aAtmosphere 13 00028 g009b
Table 1. Scenarios tested with different ventilation modes and indoor-outdoor temperature differences.
Ventilation ModeIndoor-Outdoor Temperature Difference (ΔT)Case Name
single-side ventilationΔT = 0[single-sided, 0]
ΔT ≠ 0[single-sided, 100]
cross ventilationΔT = 0[cross, 0]
ΔT ≠ 0[cross, 100]
Table 2. Critical factors for exposure assessment.
ItemChildrenAdultsElderly
Percentage in total population (%)21.263.315.5
Br—indoor at home (m3/day)12.513.813.1
Br—other indoor environment (m3/day)14.015.514.8
Br—outdoor by kerbside (m3/day)14.015.514.8
Br—other outdoor environment (m3/day)18.720.519.5
Δt—indoor at home (%)61.759.571.6
Δt—other indoor environment (%)28.928.716.7
Δt—outdoor by kerbside (%)5.57.13.2
Δt—other outdoor environment (%)3.94.78.6
Δt—indoor (%)90.688.288.3
Publisher’s Note: MDPI stays neutral with regard to jurisdictional claims in published maps and institutional affiliations.

