
The Strong Precipitation of the Dry Warm Front Cyclone in Syria and Its Prediction by Data Mining Modeling
by
 , and
, and
Jianhong Wang
1,2,3,*, 
Nour Alakol
2,
Xing Wang
2,4,*,
Dongpo He
5,
Kanike Raghavendra Kumar
6 and
Chunsheng Miao
2,4 1
Collaborative Innovation Center on Forecast and Evaluation of Meteorological Disasters, Nanjing University of Information Science & Technology, Nanjing 210044, China
2
College of Atmospheric Sciences, Nanjing University of Information Science & Technology, Nanjing 210044, China
3
School of Marine Sciences, Nanjing University of Information Science & Technology, Nanjing 210044, China
4
Nanjing Xinda Institute of Meteorological Science & Technology, Nanjing 210044, China
5
Guizhou Meteorological Observatory, Guiyang 550000, China
6
Department of Physics, Koneru Lakshmaiah Education Foundation (KLEF), Vaddeswaram, Guntur 522502, India
*
Authors to whom correspondence should be addressed.
Atmosphere 2021, 12(12), 1667; https://doi.org/10.3390/atmos12121667
Submission received: 11 November 2021
/
Revised: 25 November 2021
/
Accepted: 29 November 2021
/
Published: 12 December 2021
(This article belongs to the Special Issue Atmosphere-Ocean Interactions)
Abstract
:The Eastern inland of Syria has a Mediterranean climate in the north and a tropical desert climate in the south, which results in a dry south and wet north climate feature, especially in winter. The circulation dynamics analysis of 16 winter strong precipitation events shows that the key system is the dry and warm front cyclone. In most cases (81–100% of the 16 cases), the moisture content in the northern part of the cyclone is higher than that in the southern part (influenced by the Mediterranean climate zone). The humidity in the middle layer is higher than that near the surface (uplifting of the dry warm front), and the thickness of the wet layer and the vertical ascending layer obviously expands upward (as shown by the satellite cloud top reflection). These characteristics lead to the moisture thermodynamic instability in the eastern part of the cyclone (dry and warm air at low level and wet and cold air at upper level). The cyclone flow transports momentum to the local humid layer of the Mediterranean climate belt and then causes unstable conditions and strong rainfall. Considering the limitations of the Syrian ground station network, the NCEP/CFSR global reanalysis data and MODIS aqua-3 cloud parameter data are used to build a multi-source factor index of winter precipitation from 2002 to 2016. A decision tree prediction model is then established and the factors index is constructed into tree shapes by the nodes and branches through calculating rules of information entropy. The suitable tree shape models are adjusted and selected by an automated training and testing process. The forecast model can classify rainfall with a forecast accuracy of more than 90% for strong rainfall over 30 mm.
1. Introduction
Syria is located in the central part of the Middle East and at the eastern end of the Mediterranean Sea. The water vapor from the Mediterranean is very important for precipitation in Syria. Due to the influence of the Mediterranean sea, the rainy season in Syria is in winter. In summer, the Mediterranean and its surrounding areas are controlled by high pressure, resulting in high temperatures and drought. In winter, the westerlies move southward, and there are more cyclones over the Mediterranean and its surrounding areas (Wallace et al. [1]). At this stage, more ocean currents from the Atlantic Ocean enter the Mediterranean Sea due to the effect of the density currents in both the Atlantic ocean and Mediterranean Sea (Feng Shizuo et al. [2]). Under the situation, the air–sea systems are more active in the area, the westerlies low pressure systems transfer more water vapor from the Mediterranean Sea to the eastern end of Mediterranean, and this gives a humid and cold season to the countries. During the Northern Hemisphere’s rainfall season, the cyclone with a warm front usually brings vapor from the warm south to meet cold, dry air at the north, causing rainfall. However, at the eastern end area of the Mediterranean, the air flows from the south, passing through the desert and becomes the dry, warm air mass that forms the dry warm front involved with the cyclone. This kind of cyclone can be called a dry warm front cyclone. Its dynamic and moisture thermodynamic instability structure features and their influence on the strong convective rainfall are worth being studied in detail.
In central and eastern Syria, the terrain is flat and the Euphrates River flows from north to south. The Al-Assad artificial lake is located in the middle of the river. The precipitation over the area is conducive to the water storage and irrigation. In this way, arid Syria has become one of the five main food-exporting countries in the Arab world. Therefore, the precipitation information and its trend is important for agriculture and water conservation (Alkhalaf et al. [3]; Zakhem et al. [4]). The impact of precipitation on farming and other sectors in this area has been studied for a long time (Al Charideh et al. [5]; Keatinge et al. [6]; Thomson et al. [7]). However, due to the desert in the south of this area with very low population and continuous wars, the ground weather station data and station network in Syria are incomplete. Thus, the precipitation forecast service is facing difficulties (Alsafadi et al. [8]). Hence, targeted precipitation forecast technology needs further research and development over the domain.
Satellite remote sensing products are one source of good reference information for precipitation prediction over the area, such as the work by Bilal et al. [9] and Bilal [10]. So far, most remote sensing studies have focused on land surface features, while remotely sensed precipitation studies need more exploration. For instance, cloud optical thickness or aerosol concentration provided by satellite can reflect the cloud drops and raindrop characteristics, and can present some microphysics features of precipitation (Duong et al. [11]; Cheng et al. [12]; Platnick et al. [13]). On the other hand, the satellite cloud parameters can provide more information on cloud bodies and reveal their developing features. Therefore, the effective application of satellite cloud parameters in precipitation prediction is one of the objectives of this research.
For an area lacking ground stations, combining the local satellite cloud parameters and reanalysis circulation data and establishing a suitable data mining model of precipitation prediction is worth attempting. A data mining model has at least two advantages. One is the direct introduction of the satellite cloud parameters into the model, and the other is the multi-source factors with different formats can be easily input into the model at the same time. But there are also two main problems. One is that the cloud may not be accompanied by rain. Hence, the relationship between the cloud parameter information and precipitation needs to be discussed. Another is the coordination between cloud parameter information and multi-source parameters, including dynamic circulations. Those need to be deeply explored.
There are different types of data mining models. The decision tree algorithms mainly recognize and predict the target elements by creating regulations and classification. It is different from the neural network machine deep learning that could run in endless operational loops. The decision tree algorithms include C4.5, C5.0, cart, public and SLIQ, among others, which can build prediction models for multi-source factors and provide multiple forms of factor combination, and can do factor feature analysis of model construction (Miao et al. [14], Zhang et al. [15]). They are based on a binary system that judges whether a given critical criterion is satisfied or not. The operation process does not involve the error adjustment of prediction value. They can also give the probability evaluation of the fitting and prediction effect of the model (Hertig et al. [16]; Nabavi et al. [17], Mishra et al. [18], Bhatkande et al. [19]; Olaiya et al. [20]). Therefore, it is significant to further study the effective integration of satellite cloud parameters and special circulation characteristics to analyze and predict local precipitation and its evolution. The decision tree algorithms are similar to the random forest algorithm but need fewer calculations and can make fast predictions (Talebi et al. [21], Binita et al. [22]). According to their principles, the decision tree uses all features and samples and the random forest uses partial features to build more decision trees and avoid over-fitting.
This paper analyzes the precipitation characteristics of dry warm front cyclones during the winter rainy season over Syria, under the influence of the Mediterranean, and investigates the key systems of strong precipitation and their moisture thermodynamic features. A comprehensive index dataset is then built, including MODIS satellite local cloud information and circulations elements. The decision tree forecast models are built with a group of regulations according to the index dataset. The adaptability of the prediction model is also tested.
2. Materials and Methods
2.1. Study Area
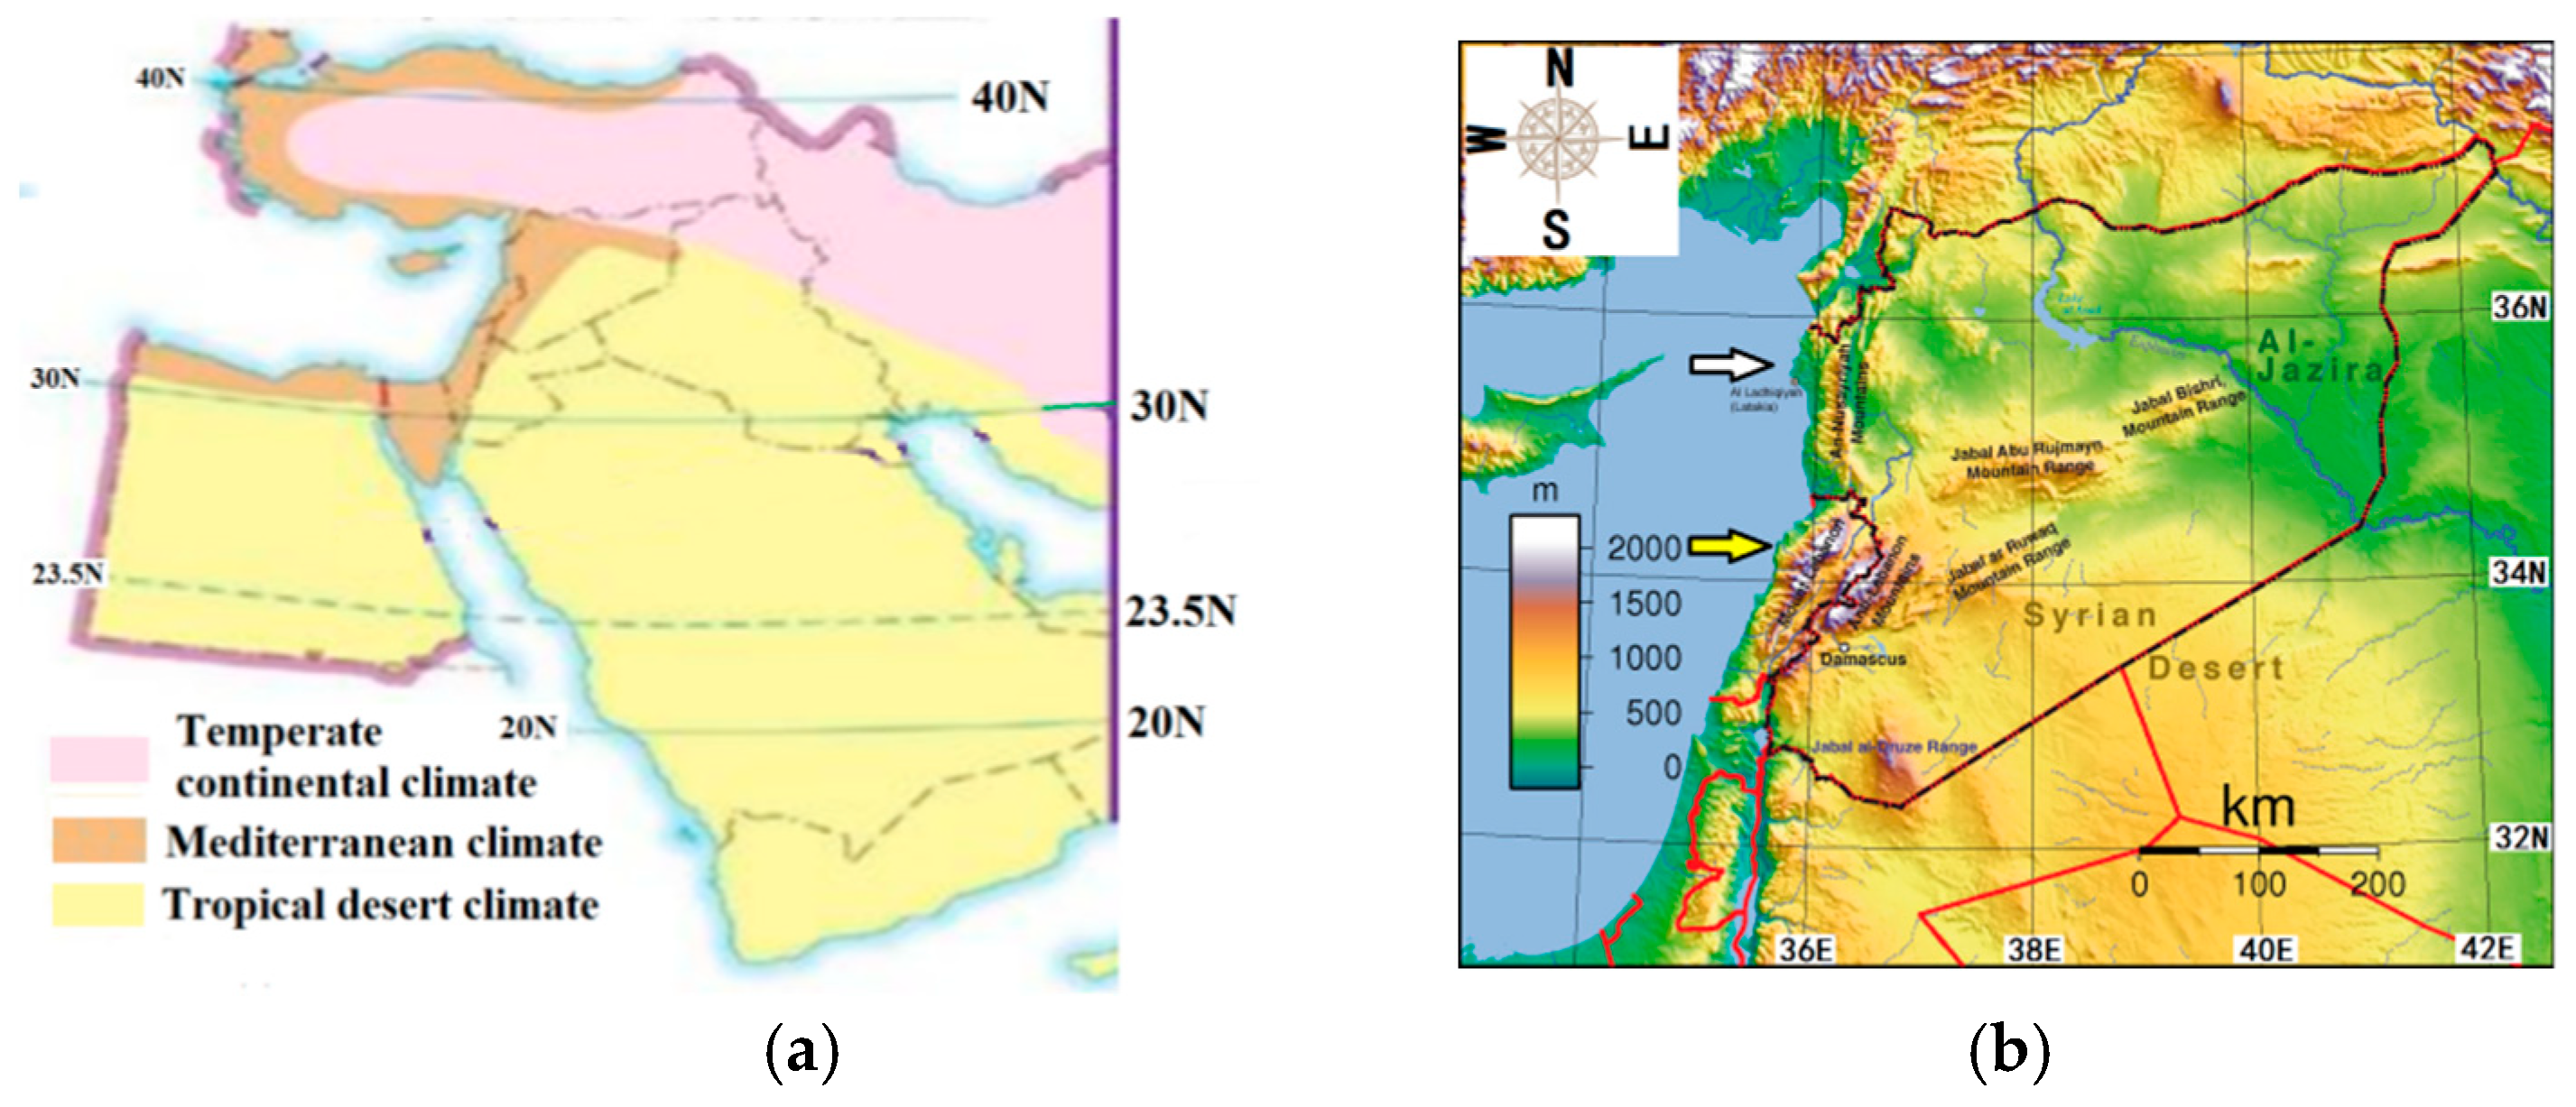
The study area is mainly the eastern Mediterranean region of the Middle East. The distribution of climate zones is shown in Figure 1a, with the Mediterranean climate zone shown in brown. The figure shows that the Mediterranean climate belt surrounds the Mediterranean Sea and extends into northern Syria. It should be an influence of coastal topography. Figure 1b shows the topography of the area. The mountains along the northern coastline of Syria are narrower and lower than the mountains along the southern coast. The northeast part of Syria is low plain land and is the lowest part of the country. The westerlies enable Mediterranean moisture to pass easily through the northern coastal mountains and to reach eastern Syria, which cause the Mediterranean climate zone to extend inland. The southern coastal mountains connect with the desert and cause a tropical desert climate over southern Syria. Thus, the Syrian climate is wet and cold in the north and dry and warm in the south, with more precipitation over the northeast part of the country.
The mountains around Syria are the An-Nusayriyah Mountains at the north coast of Syria; Mountain Lebanon and the Anti-Lebanon Mountains paralleling the south coast area; and other mountains such as Jabal ar Ruwaq Mountain Range, Jabal Abu Rujmayn Mountain Range and Jabal Bishri Mountain Range from west to east lying in the inland of Syria.
2.2. Numerical Data Sources
2.2.1. Precipitation Statistic Areas
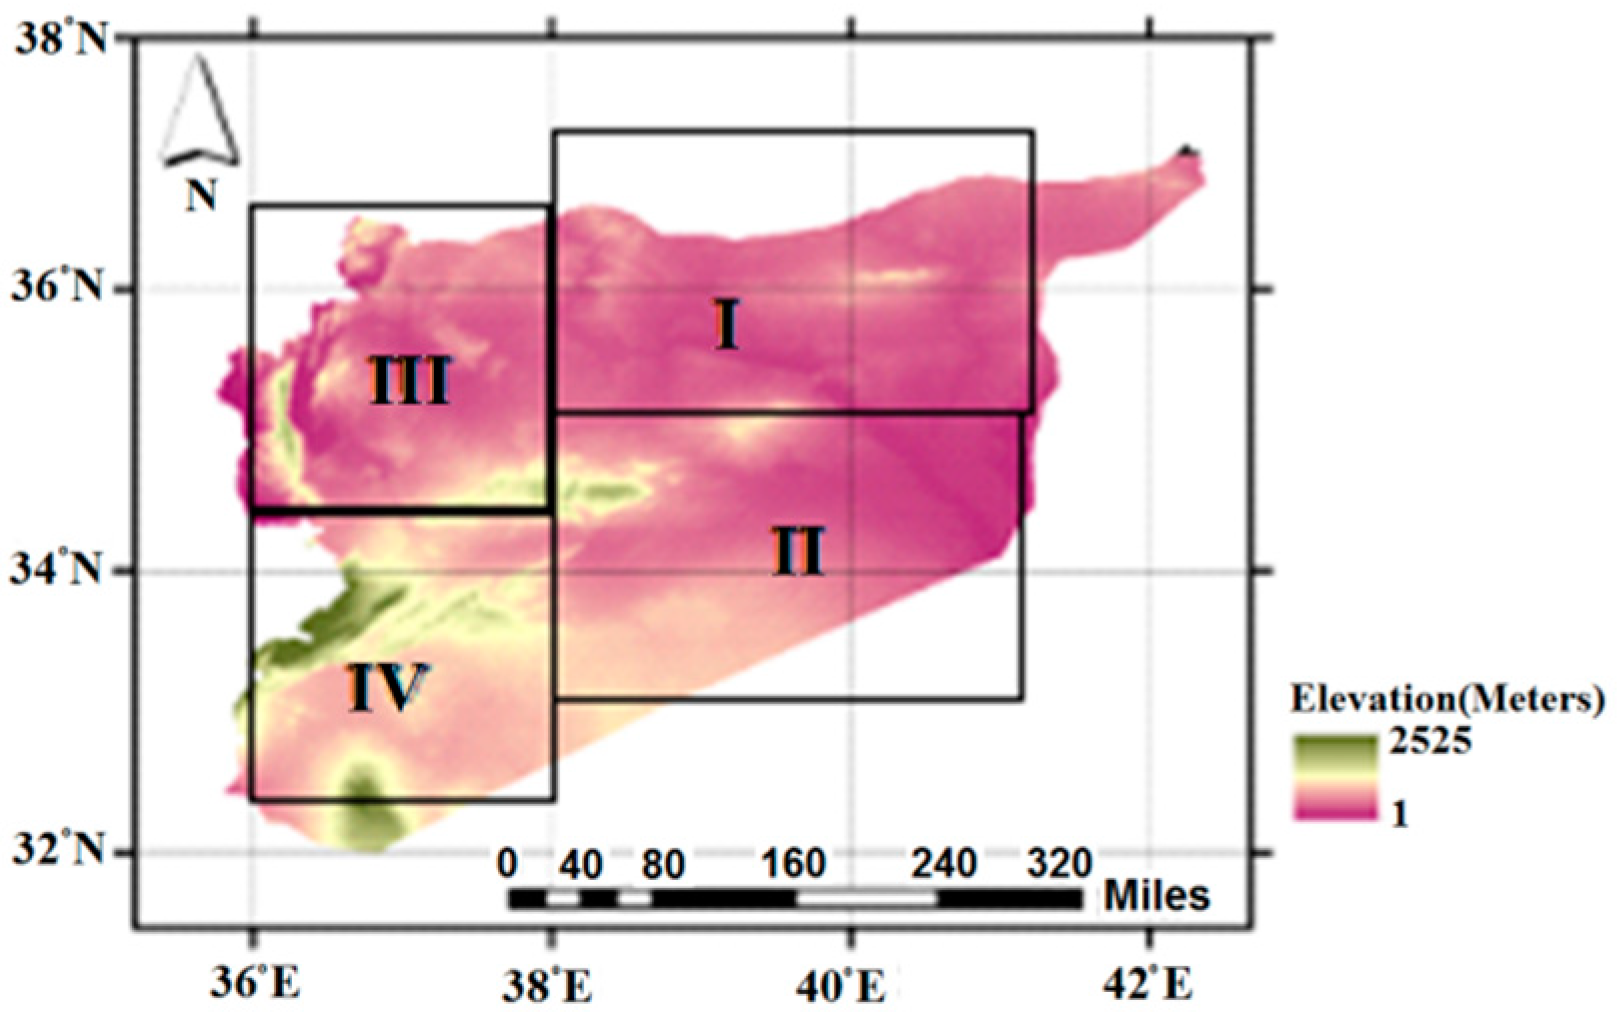
According to Syria’s topography and climate divisions, the Syrian territory is divided into four parts in the present research (Figure 2). Their partition ranges are:
Region I: 35° N–37° N, 38° E–41° E; Region II: 33° N–35° N, 38° E–41° E; Region III: 34.5° N–36.5° N, 36° E–38° E; and Region IV: 32.5° N–34.5° N, 36° E–38° E.
The terrain of Syria is high in the southwest coastal area and low in the northeast. The two regions in the east are lower than the two regions in the west. Furthermore, Region I is lower than Region II. As a result, Region I is a depression, which can effectively attract and retain the Mediterranean water vapor.
2.2.2. ECMWF ERA-Interim Data
ERA-Interim data (January 1979–August 2019) is used in this research. Its monthly average dataset includes precipitation, temperature, pressure, humidity and wind components. Its horizontal resolution is 0.75° × 0.75°, with 60 levels in the vertical (Berrisford, P. et al. [23]). The datasets are provided by the European Centre for Medium Range Weather Forecasting (ECMWF). The 37 years (1979–2016) of data are statistically analyzed to present the general climate features in the four regions of Syria.
2.2.3. MODIS Satellite Data
Daily MODIS Aqua Level-3 cloud parameter data (MYD08_D3) at spatial resolution of 1° × 1° are used. There are two MODIS Daily Global data product files: MOD08_D3, containing data collected from the Terra platform launched in 1999 and MYD08_D3, containing data collected from the Aqua platform launched in 2002. Unlike its predecessor, Aqua MODIS has shown improved performance over the Terra MODIS. On-orbit results showed that Aqua MODIS short-term radiometric stability is better than Terra MODIS for most RSB and TEB spectral bands (Kumar et al. [24]; Xiong et al. [25]). The Aqua MODIS parameters include cloud top pressure, cloud top height, cloud top temperature (brightness temperature) and cloud fraction.
2.2.4. NCEP/CFSR Reanalysis Data
January and February data from 2002–2016 are used. The daily data have a horizontal resolution of 0.312° × 0.312° with 64 levels. All variables used are for the precipitation days with satellite Aqua data, so that the background circulations and local cloud parameters for the same precipitation day are available.
2.3. Methodology
2.3.1. Satellite Data Pre-Processing
The pre-processing of data is very important, especially in image application (Igor Zurbenko et al. [26]). Aqua provides mainly four cloud top parameters, which are special digital variables of local cloud information. The data pre-processing for the variables in digital data format includes auto-checking, data interpolation, data field verification, data area average (according to Figure 2) and data gradient calculation. The data noise resistance is necessary for signal analysis. Thus, a separated average of the four areas is calculated, then the average values are used to represent the weather information in rainfall cases. Some methods used here are listed in Appendix A.
2.3.2. Moist Potential Vorticity (MPV)
According to the theory of moist potential vorticity (Miao et al. [27], Luhunga et al. [28]; Hardy et al. [29]; Qian et al. [30]), the moist potential vorticity is a comprehensive physical quantity that can simultaneously characterize the properties of atmospheric dynamics, thermodynamics and water vapor (moisture thermodynamics). Its unit is PVU (1 PVU = 10−6 M2 K S−1 kg−1). The expression of the moist potential vorticity on an isobaric surface is:
where the moist barotropic term represents the effect of inertial stability and convective stability . The wet baroclinic term includes the contribution of wet baroclinic () and vertical shear of horizontal wind, and when the atmospheric convection is stable, . The vertical vorticity increases only when , and the stronger the negative value of , the stronger the atmospheric baroclinicity. When the atmospheric convection is unstable, the vertical vorticity increases only when (Miao et al. [27]).
2.3.3. Data Mining C5.0 Decision Tree Algorithms
To comprehensively analyze the multi-source prediction factors of precipitation, the C5.0 algorithm is used to build the decision tree prediction model. C5.0 is a C4.5 classification algorithm and is applied to large datasets. It is mainly improved in execution efficiency and memory usage. It is a decision tree algorithm that mainly recognizes and predicts target elements by calculating information entropy of data and creating classifying regulations. The algorithm is different from the neural network machine deep learning, which may sometimes run in an operational endless loop. The C5.0 algorithm details are listed in Appendix B.
3. Results
3.1. Local Climate Characteristics and Precipitation Distribution
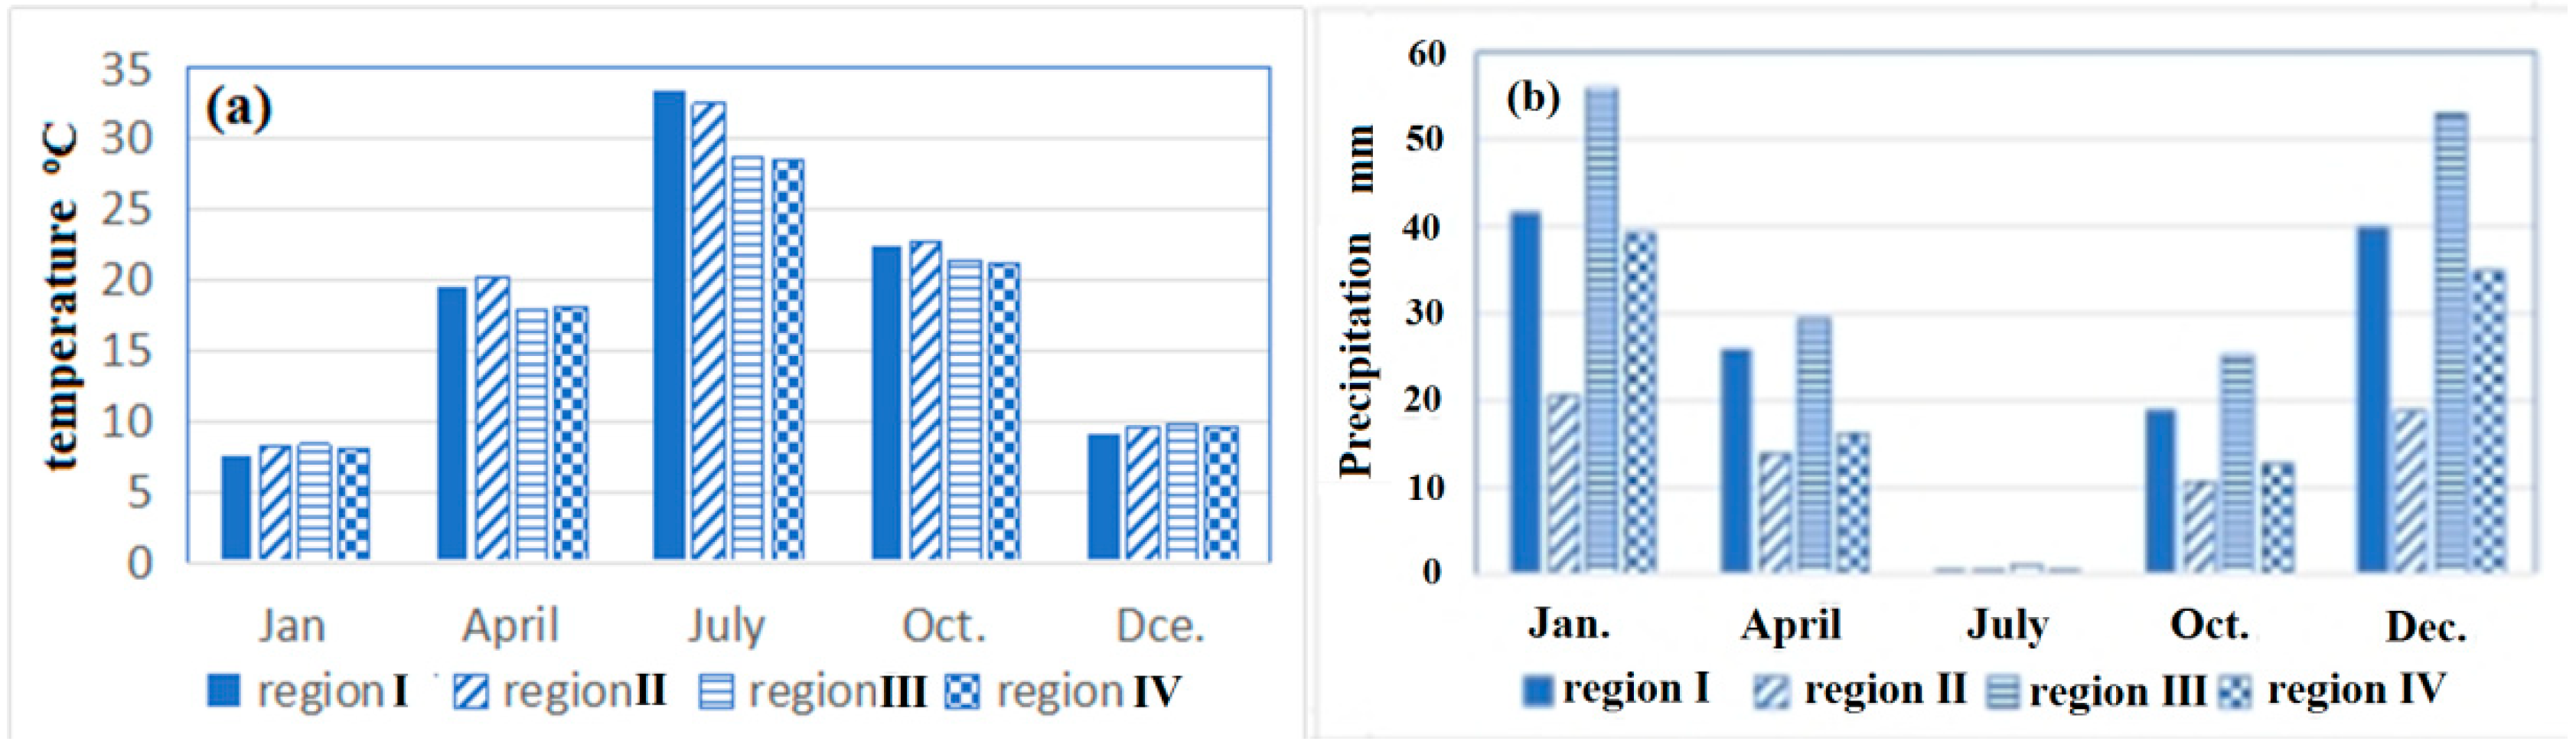
The temperature and precipitation climate characteristics of spring (April), summer (July), autumn (October) and winter (December and January) are obtained from the average temperature and precipitation statistics in the four seasons of the past 37 years (1979–2016, ECMWF ERA-Interim data) of the four regions (Figure 2). The four regions’ values are calculated by the grid average in the four regions. The 37 year average for the five seasonal months is then obtained. The results are shown in Figure 3. December and January are both investigated because winter is a rainy season.
Figure 3a shows the averaged monthly temperature in different seasons of the 37 years. For the four regions, they are warm in summer and cold in winter. However, the temperature in Region II is higher than in Region I in all seasons, except for summer. The temperature is slightly higher in Region I than in Region II during summer, and both are over 30 °C. During spring, summer and autumn, the temperature in the two inland regions is higher than that of Regions III and IV, which are close to the Mediterranean Sea. It shows that Region II experiences a warm climate during the whole year relative to other regions. The temperature in the four regions is colder in January than in December.
Figure 3b shows the 37 year averaged value of monthly precipitation. There is more precipitation in winter and it is dry in summer. However, the precipitation in Region II is the lowest in each season. Even in wet winter, it is less than 20 mm. Therefore, the climate characteristics (warm and dry) of the tropical desert Region II are remarkable. In the two Mediterranean coastal regions, the precipitation in Region III is the largest among the four regions, even during the hot and dry summer. In Region IV, there is a large coastal mountain. So, the Mediterranean vapor is rapidly consumed around the mountains due to the uplifted precipitation. The precipitation in Region IV is less than that of Regions I and III. The precipitation trend and amount of Regions I and III are similar, which shows the similar Mediterranean climate characteristics of the two regions. In general, Regions I, III and IV belong to the Mediterranean climate type. They are cold and wet in winter, and warm and dry in summer. It also shows that the rainfall in December and January is similar for the four regions. Hence, the rainy season in the present research is chosen as December and January, so that more strong rainfall events can be identified.
Due to the small land area of Syria (Figure 1), the scale of conventional winter precipitation weather systems, such as cyclones, is large and can completely cover Syria and the surrounding region. Therefore, how a single precipitation system affects the distribution of precipitation and how Mediterranean climate divisions affect the precipitation system structure and form a unique precipitation category and characteristics are worth exploring. This will also provide a meaningful reference for early warnings of local precipitation.
The following analysis will focus on the winter’s (December and January) strong precipitation process and key systems.
3.2. Main Systems of Winter Precipitation and Characteristic Information of Local Cloud
A total of 2356 days are used to investigate precipitation day from the four regions during December and January of 1979–2016. The maximum daily average precipitation for each region can reach 43 mm. Therefore, the daily precipitation of >30 mm is defined as a strong precipitation day in our research. Furthermore, the eastern inland Regions I and II are special concerns, as they are low plain areas without topography lift, so the mechanism of strong precipitation in the two regions needs to be deeply explored. The precipitation days with daily precipitation of more than 10 mm in Regions I and II are extracted and studied.
Since the Aqua satellite, which provides cloud parameter information, was launched in 2002, the data period of 2002–2016 is selected. In addtion, the satellite cloud parameters can reflect the local cloud characteristics, but they evolve fast. Therefore, they are not suitable for multi-sample composite analysis. Hence, the dynamic analysis is carried out based on each of the selected precipitation days. According to the investigation, the strong rainfall days in this arid area are few. After choosing the strong precipitation days, several more than 20 mm strong rainfall days are also selected. Thus, a total of 16 local strong rainfall days are selected for the key system analysis.
3.2.1. Main Circulation Systems and Dry Warm Front Cyclone
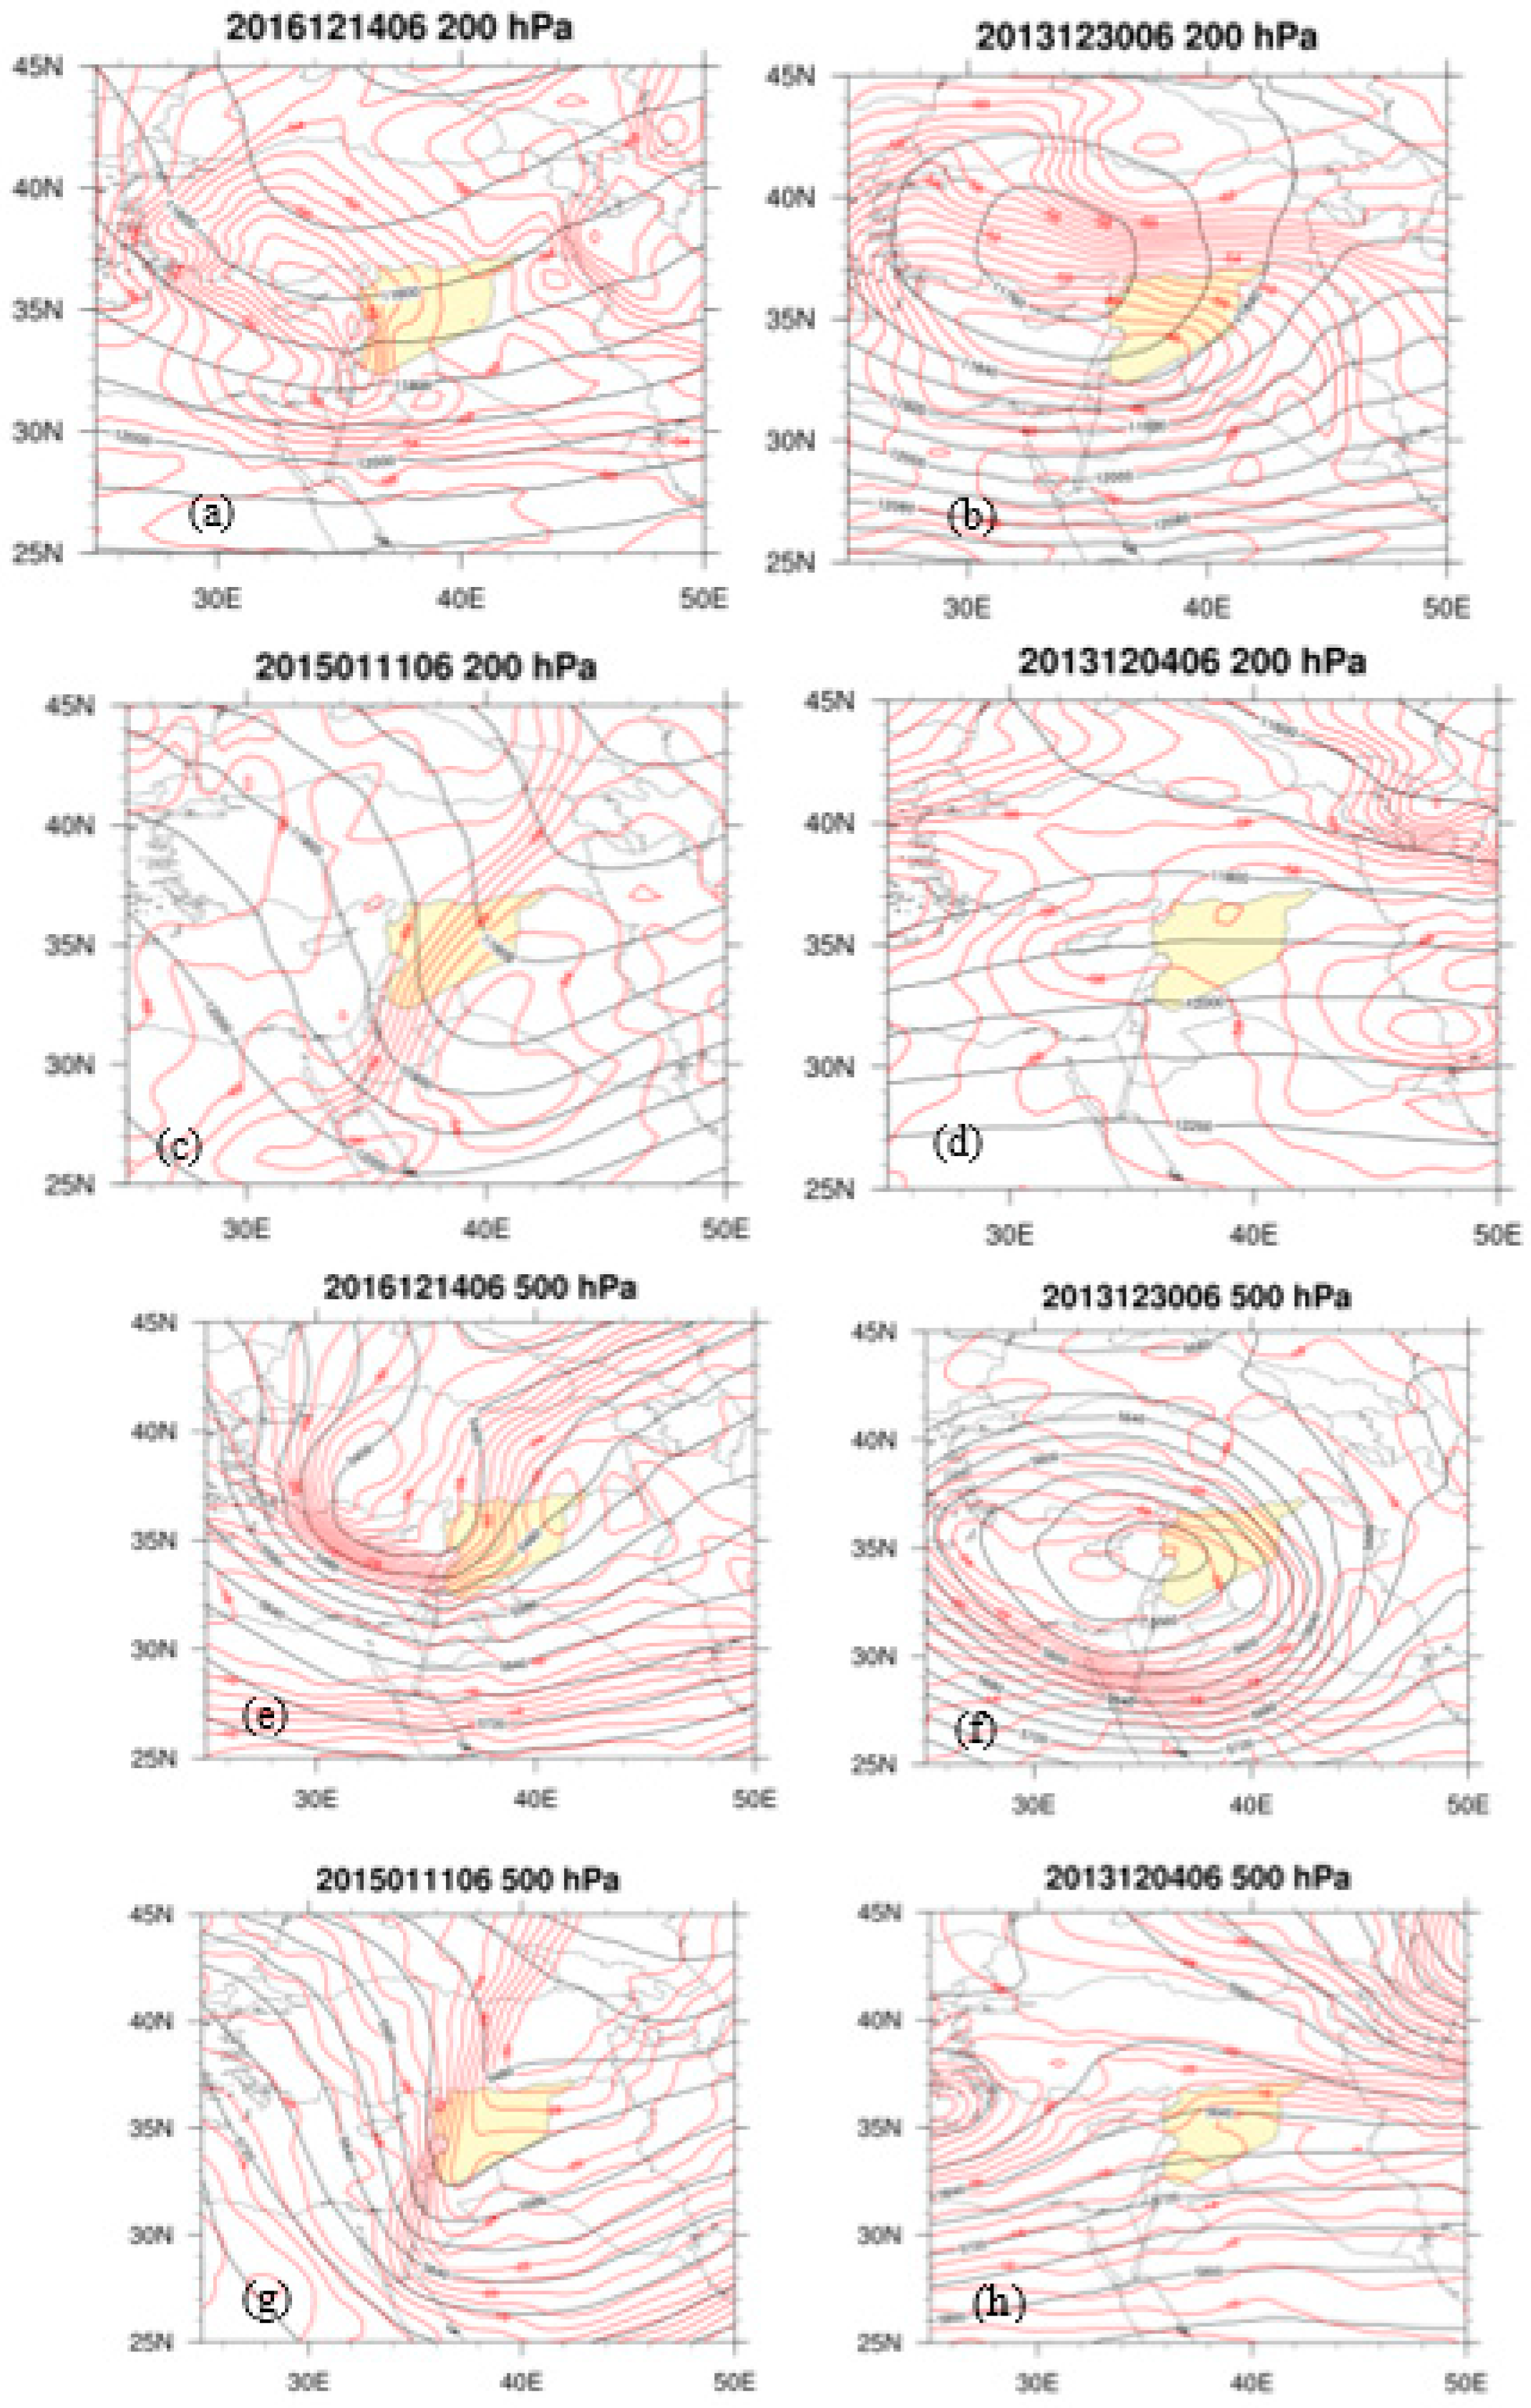
By analyzing the circulations of 16 strong precipitation days in winter, we can learn the similarities and differences between the circulation features. The dynamic characteristics of upper circulation, such as at 200 hPa, can help us understand the information of satellite cloud top parameters of strong precipitation. In the winter rainy season, the westerlies’ West Asian trough is mainly at its average position over the Mediterranean Sea. Syria is in the westerly, in the front part of the trough. Due to the much stronger cold air mass in winter, the position of the westerlies is moved southward. Thus, Syria is in the cyclonic shear flow on the left side of the westerly flow, as shown in Figure 4a (area shaded yellow). The cyclonic wind shear transmits its momentum downwards and is conducive to the activity, generation, enhancement and vertical extension of the regional and local low-pressure systems. This circulation situation accounts for 13 of the 16 strong rainfall cases analyzed (about 81%).
Except for the main circulation conditions (81%), there are only a few other circulation patterns. One is a low-pressure cyclone at 200 hPa, and Syria is located in the southeast of the cyclone. See Figure 4b, which also belongs to the cyclonic wind shear. This circulation is similar to the first situation. The other is also the westerly trough, but this time, Syria is located behind the trough close to the bottom of the trough (see Figure 4c). Another is the deformation field situation or Saddle point (Figure 4d), where there is a temperature front zone. Cases 1, 2 and 4 are warm advections over Syria, and Case 3 is a cold advection after the trough. The circulations at 500 hPa are similar to those at 200 hPa (Figure 4e–h). These situations showed that the precipitation systems have relatively thick vertical structures at the mid-high level.
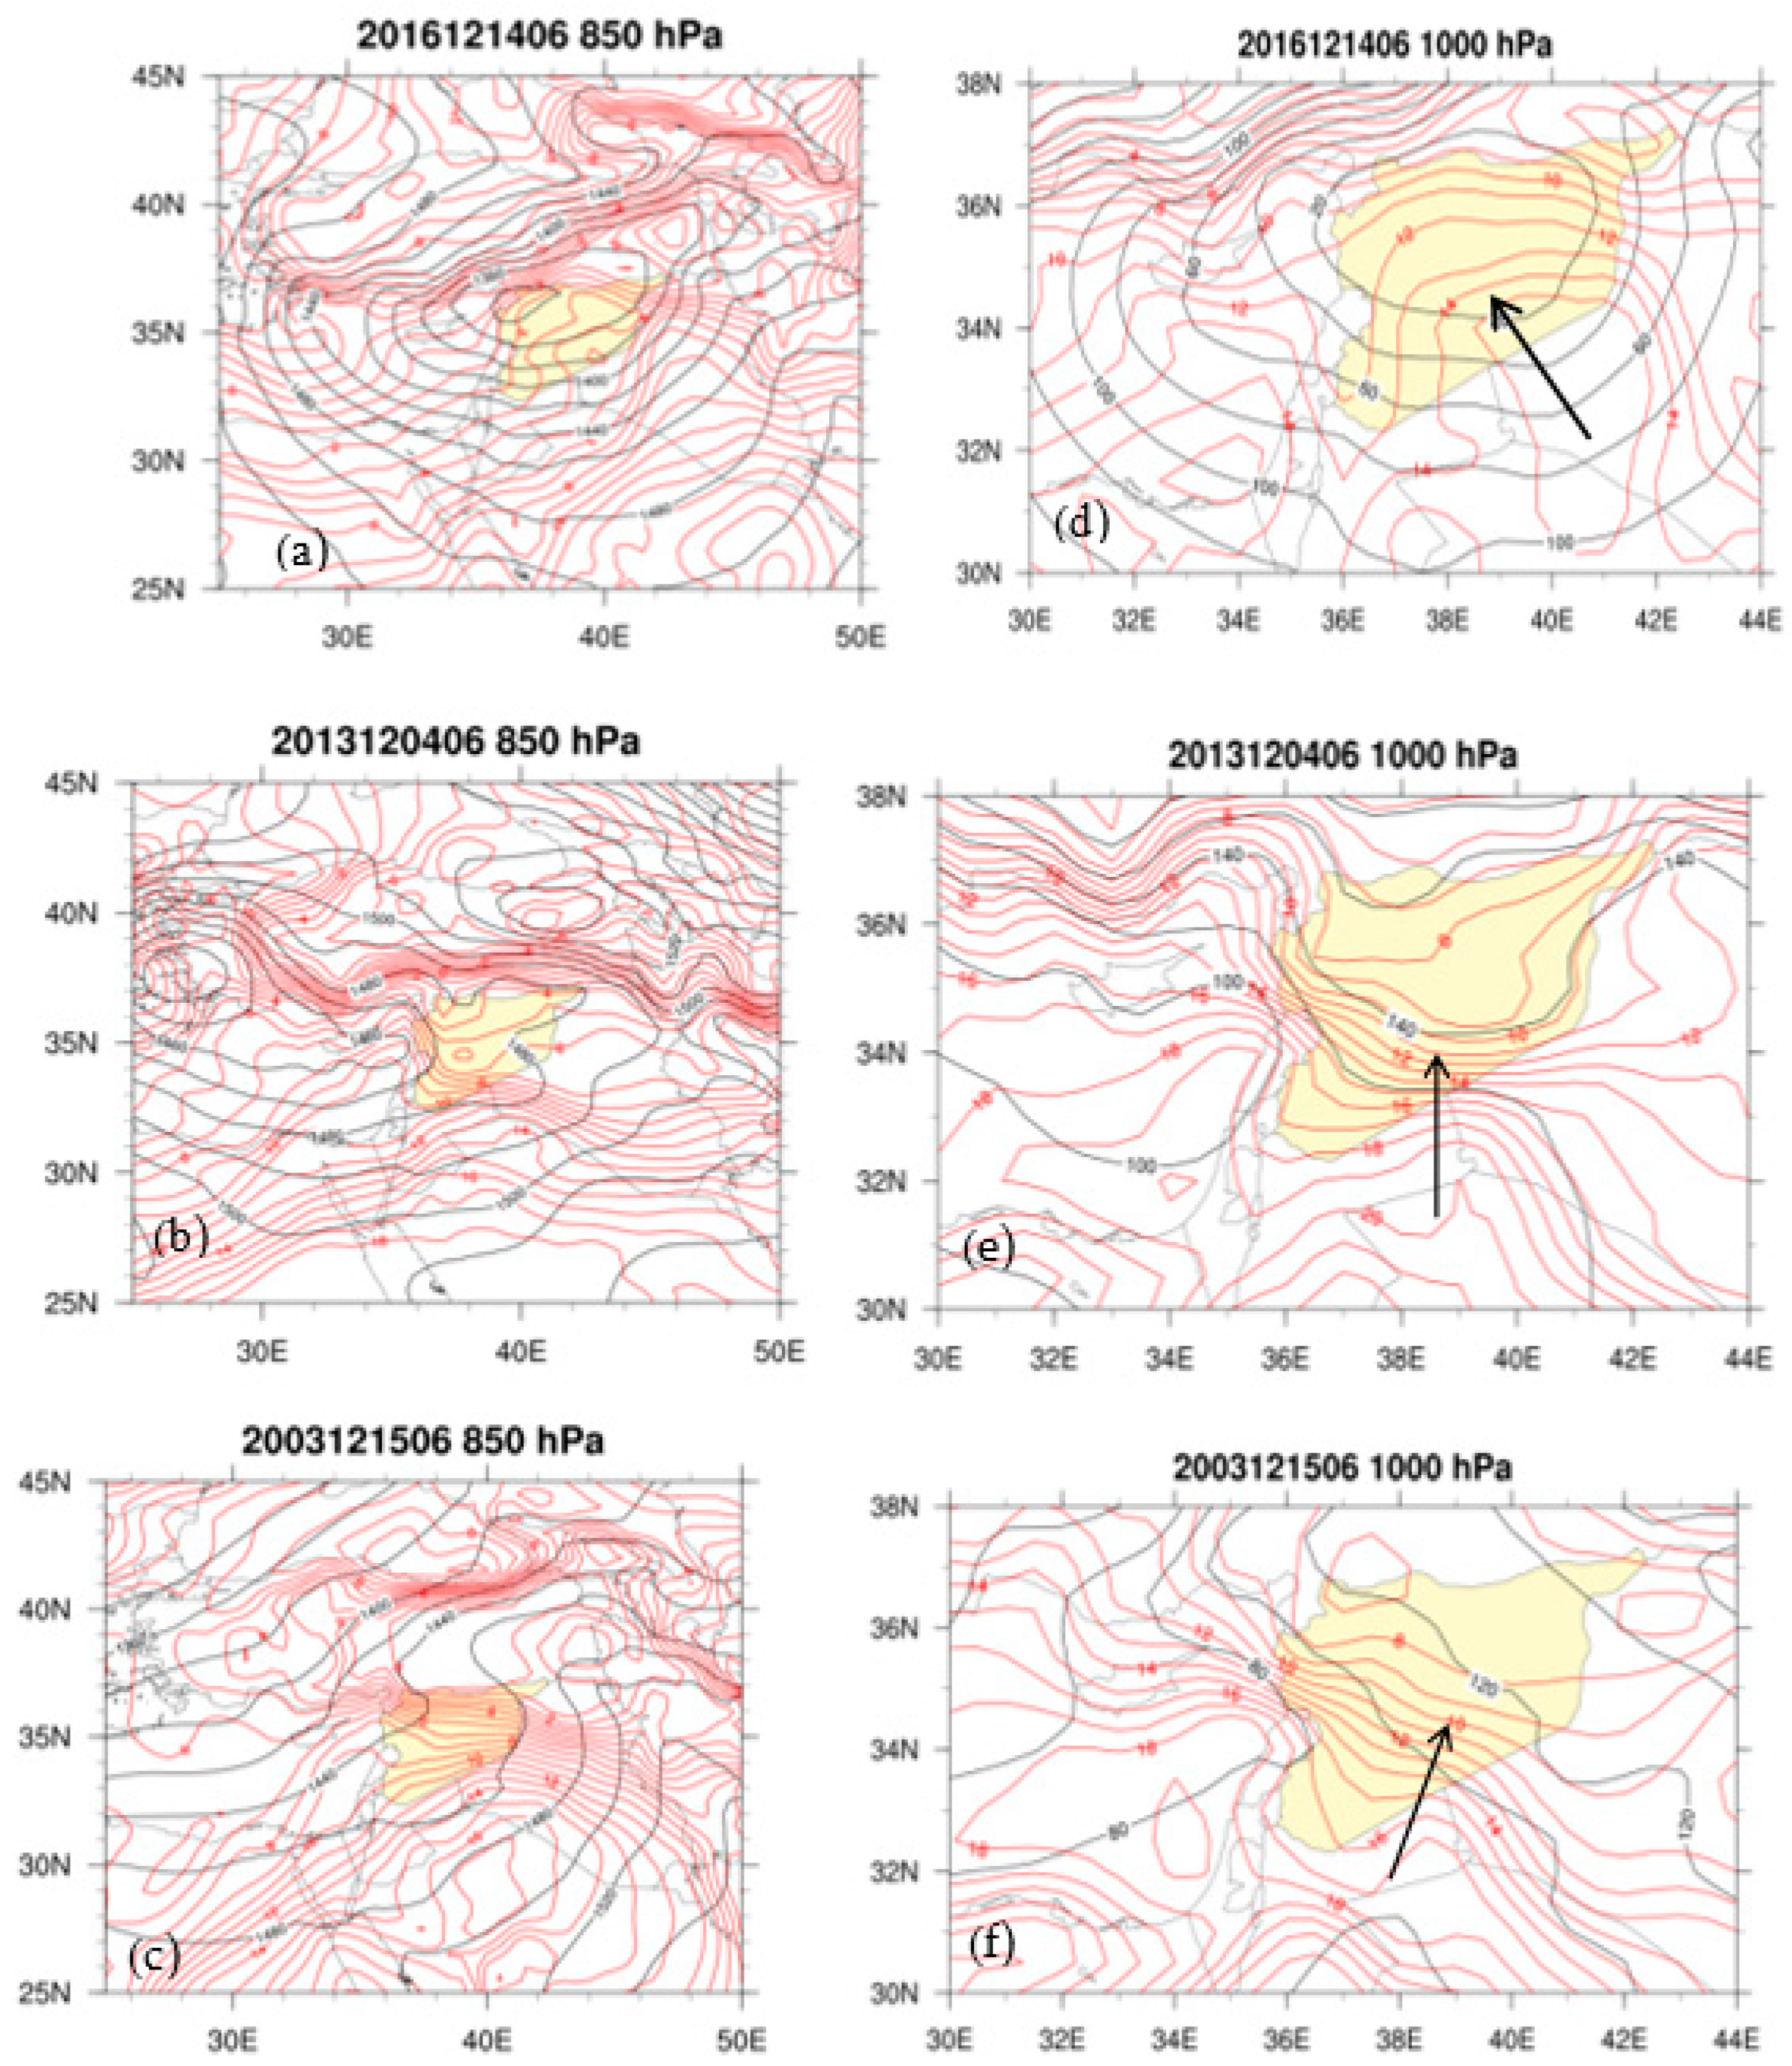
Figure 5 shows the systems of the middle and lower layers in the strong rainfall days. They are mainly a closed cyclone at 1000–850 hPa, accompanied by a warm front advancing from south to north. The cyclone can be called a dry warm front cyclone because it is different from the common warm front cyclone in mid-latitudes. The common warm front leads warm and wet air mass northward and evolves into a cyclone, but a dry, warm front brings warm, dry air mass into the cyclone. The dry, warm front is different from the foehn wind in principle and size. The typical dry, warm front cyclone is shown in Figure 5a,d. The black vectors in Figure 5d–f indicate the direction of the dry, warm front movement. Among the 16 strong precipitation cases, 14 cases have such cyclones, and Syria is in the east part of the cyclone (about 88% of the cases). Only two cases are low-pressure areas (shown in Figure 5b,c). For the remaining two cases, one also has a cyclone, but its center is at the west (Figure 5b). It is similar to the cyclone situation. Another is in the front part of a cyclone (Figure 5c).
From the systems dynamic structures in the mid-low layer (Figure 5), the southern part flow of the cyclone circulation at 850 hPa passes through the dry tropical desert and climbs across the dry, warm front. The north part of the cyclone is over the wet Mediterranean climate zone. The dry, warm flow mixes with the dry downhill flows of the inland Iran Plateau and Turkey Plateau, then disturbs the local retention of wet Mediterranean vapor. So, the cyclone brings more unstable vertical motion and forms unstable structures in the interior Mediterranean climate zone.
The airflow of the cyclone is anticlockwise. In the north of the cyclone, the circulation goes from inland toward the Mediterranean Sea. It is dry, but it passes the Mediterranean climate zone of northern Syria where the area is rich in moisture. The dry airflow from the south converges and disturbs the moisture-retaining area. It can cause unstable vertical ascending motion. When dry air is below a layer of wet air, it can form a moisture thermodynamic instability, then a strong rainfall.
3.2.2. Water Vapor Conditions during the Winter Regional Precipitation
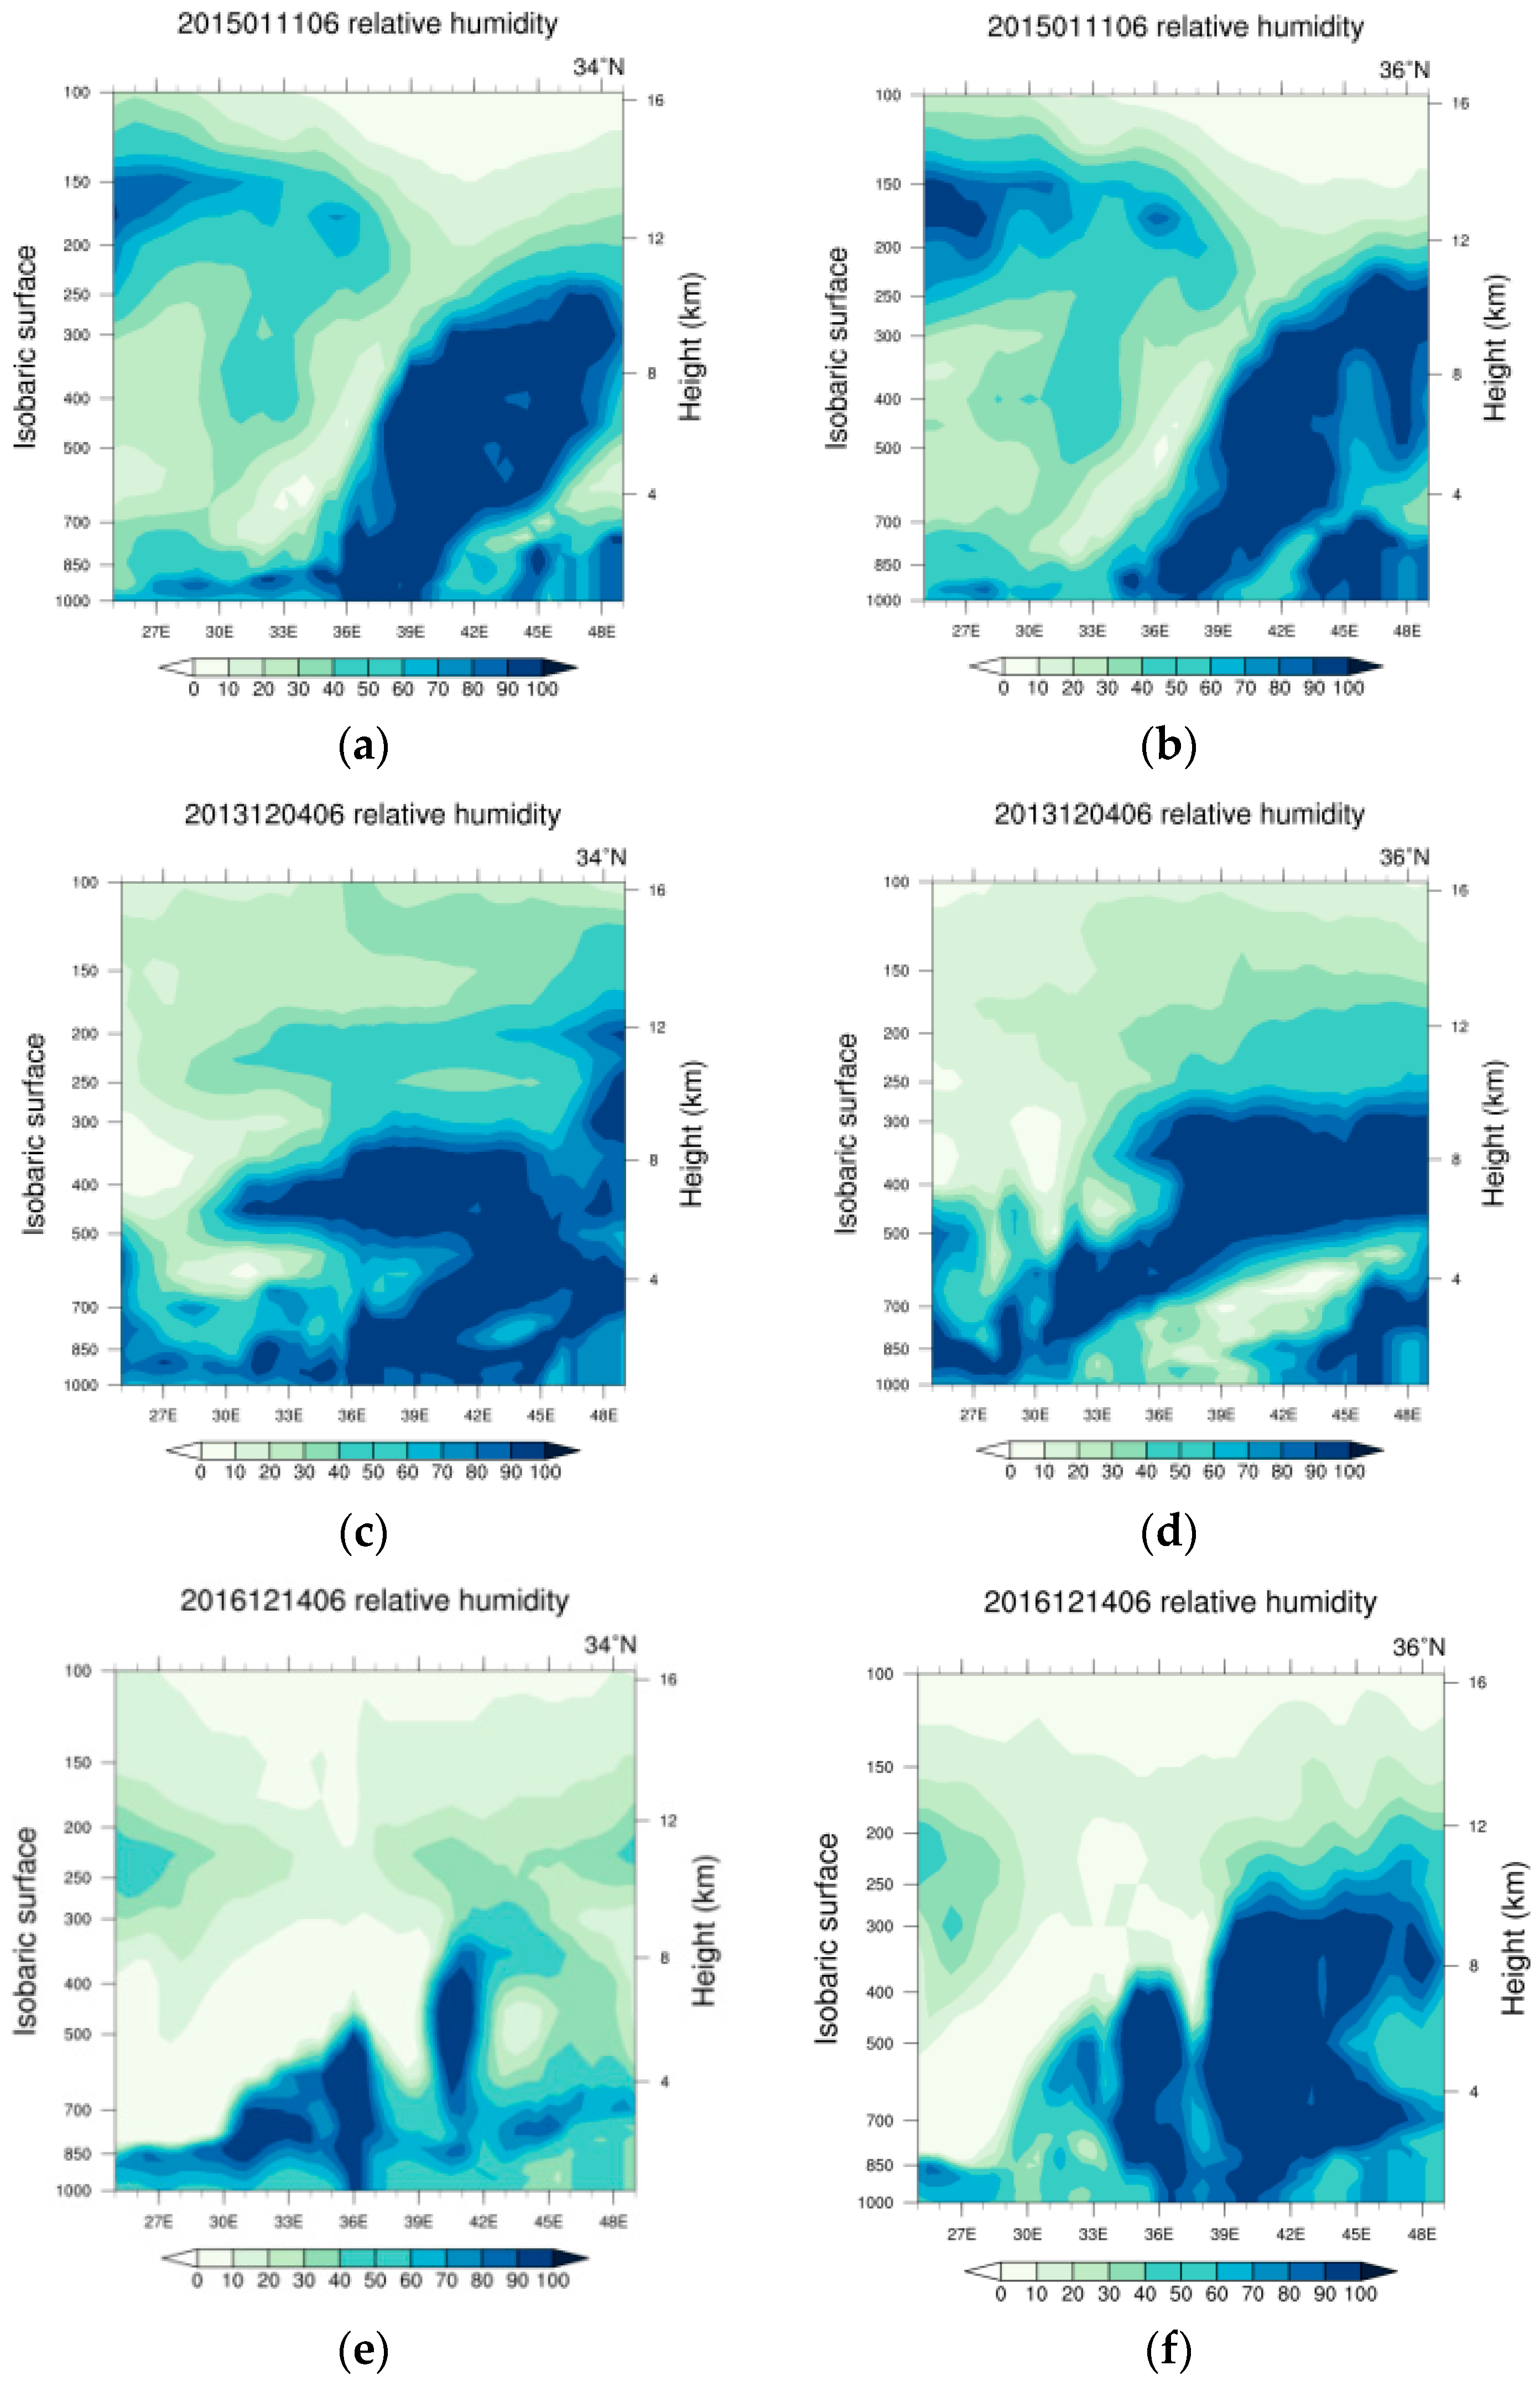
To further examine the moisture distribution in the cyclones, the moisture vertical profiles of the cyclone are analyzed. Figure 6 compares the vertical cross-sections of relative humidity distribution along 36° N and 34° N in the cyclones.
Figure 6a shows the water vapor conditions of the cyclone. The south of the cyclone (34° N, 36° E–41° E) is drier than the north (Figure 6b, 36° N, 36° E–41° E). Moisture is more abundant, and the size and height of high relative humidity in the north part are larger than that in the south, especially the relative humidity in the low layer. Out of 16 studied cases, 14 of them have such moisture distribution characteristics (88%, Figure 6a,b). As mentioned above, the northern part of Syria has higher relative humidity than the southern part.
Another feature is that a larger water vapor value area appears at the higher position, which should be a combined effect of the warm air mass climbing across the dry, warm front and the mixing of dry and wet air masses at high-level, which then convergence as ascending motion in the cyclone. Following the shallow cyclonic airflow at 1000–850 hPa (Figure 5), the moisture over the precipitation area mainly depends on the local storage of Mediterranean vapor. The moisture in the northern area from the Mediterranean meets the northern flow of the cyclone from east to west. The flow resists the extra vapor coming from the Mediterranean Sea during precipitation events. Thus, more than 30 mm rainfall is considered as a strong precipitation event in the arid area lacking continued vapor transport.
Figure 6c–f are vertical profiles of two water vapor distribution cases with different characteristics from 14/16 of the cases. The water vapor difference at low layers between the north and the south shows that the moisture is more abundant in the south.
3.2.3. Local Convective Characteristics of Precipitation in Winter
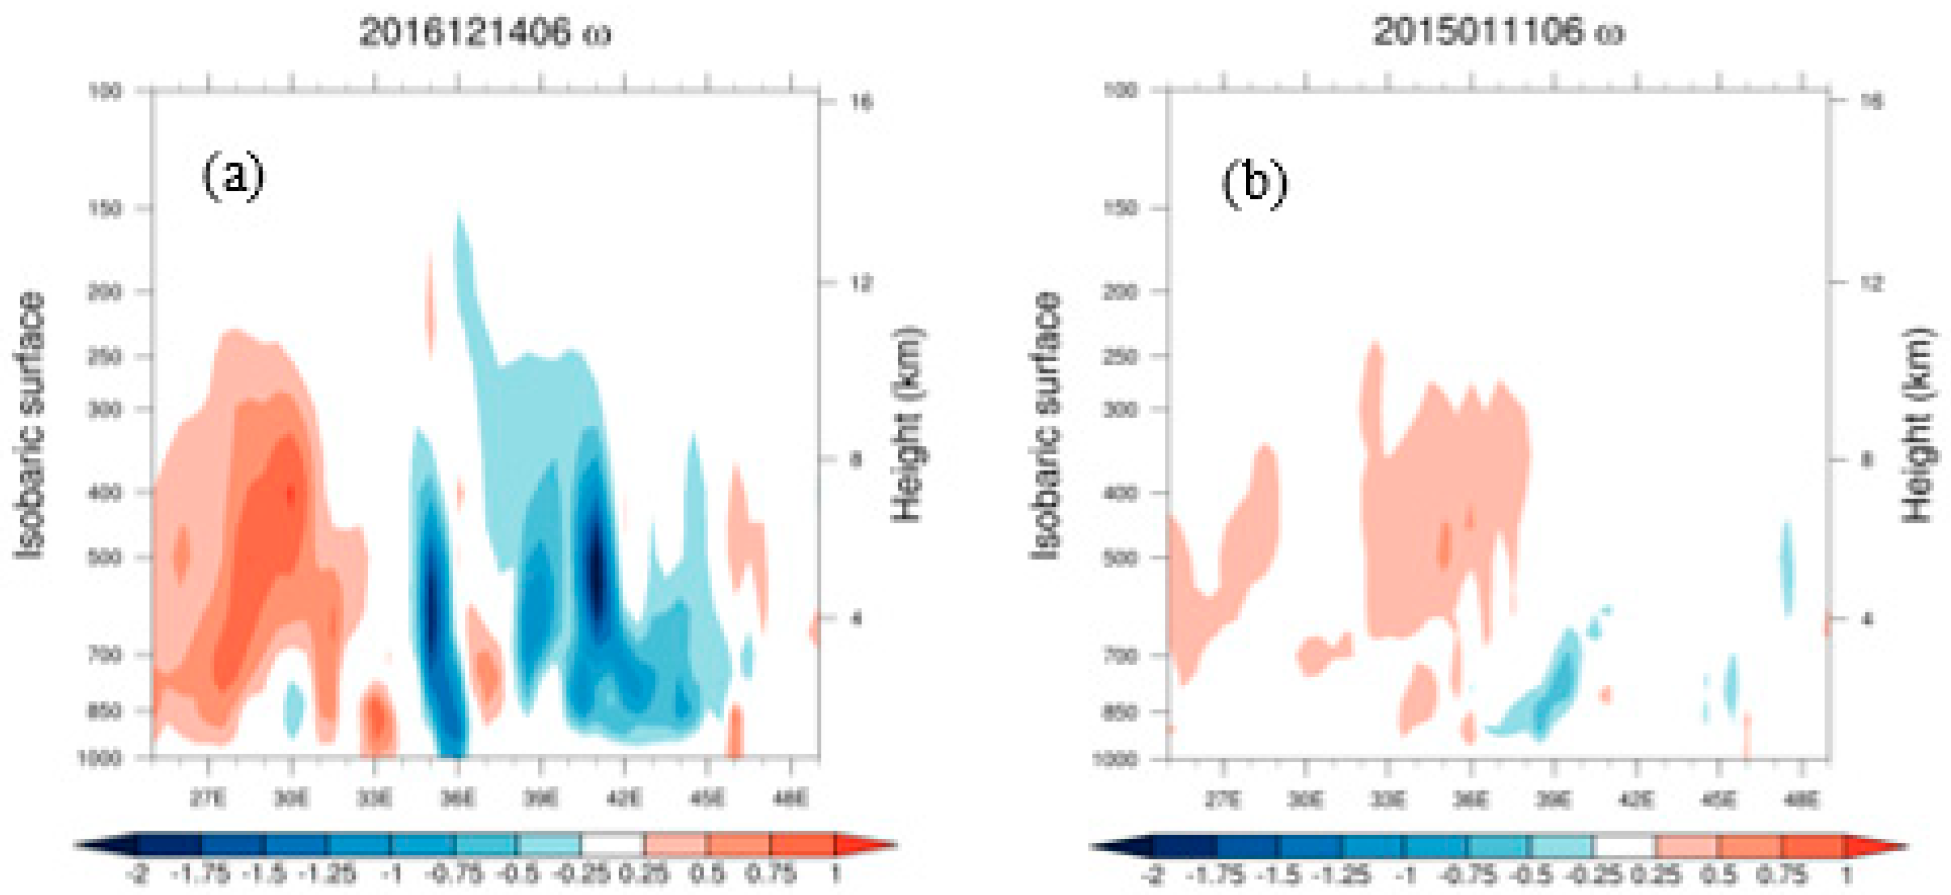
Figure 7a shows the vertical cross-section of average vertical velocity from 34° N to 36° N. A comparison of convective characteristics between the eastern and western parts of the vertical cross-section is also shown in Figure 7. Figure 7a presents the features of most cases (15/16 cases), while Figure 7b shows a weak convective situation (1/16).
Between 34° N to 36° N, the average vertical velocity in the range of 36° E–41° E in the east part of the cyclone is remarkably strong. The vertical updraft layer is relatively thick and can reach up to 200 hPa. The descending motion area between the coastal mountain (36° E) and the east part of the cyclone (38° E–41° E) reflects the mountain effect (leeward side of the coastal mountain).
As the warm front in the lower layer tilts from south to north, the starting height of the vertical ascending motion layer is near 950 hPa. In the 16 cases, 15 of them are of this type of dynamic structure (about 94%). Only one case has a weak updraft in the east part of the cyclone (see Figure 7b). The color bar in Figure 7 shows that white is a negative value, indicating a weak rising motion in the east of the cyclone.
3.2.4. Local Instability Characteristics
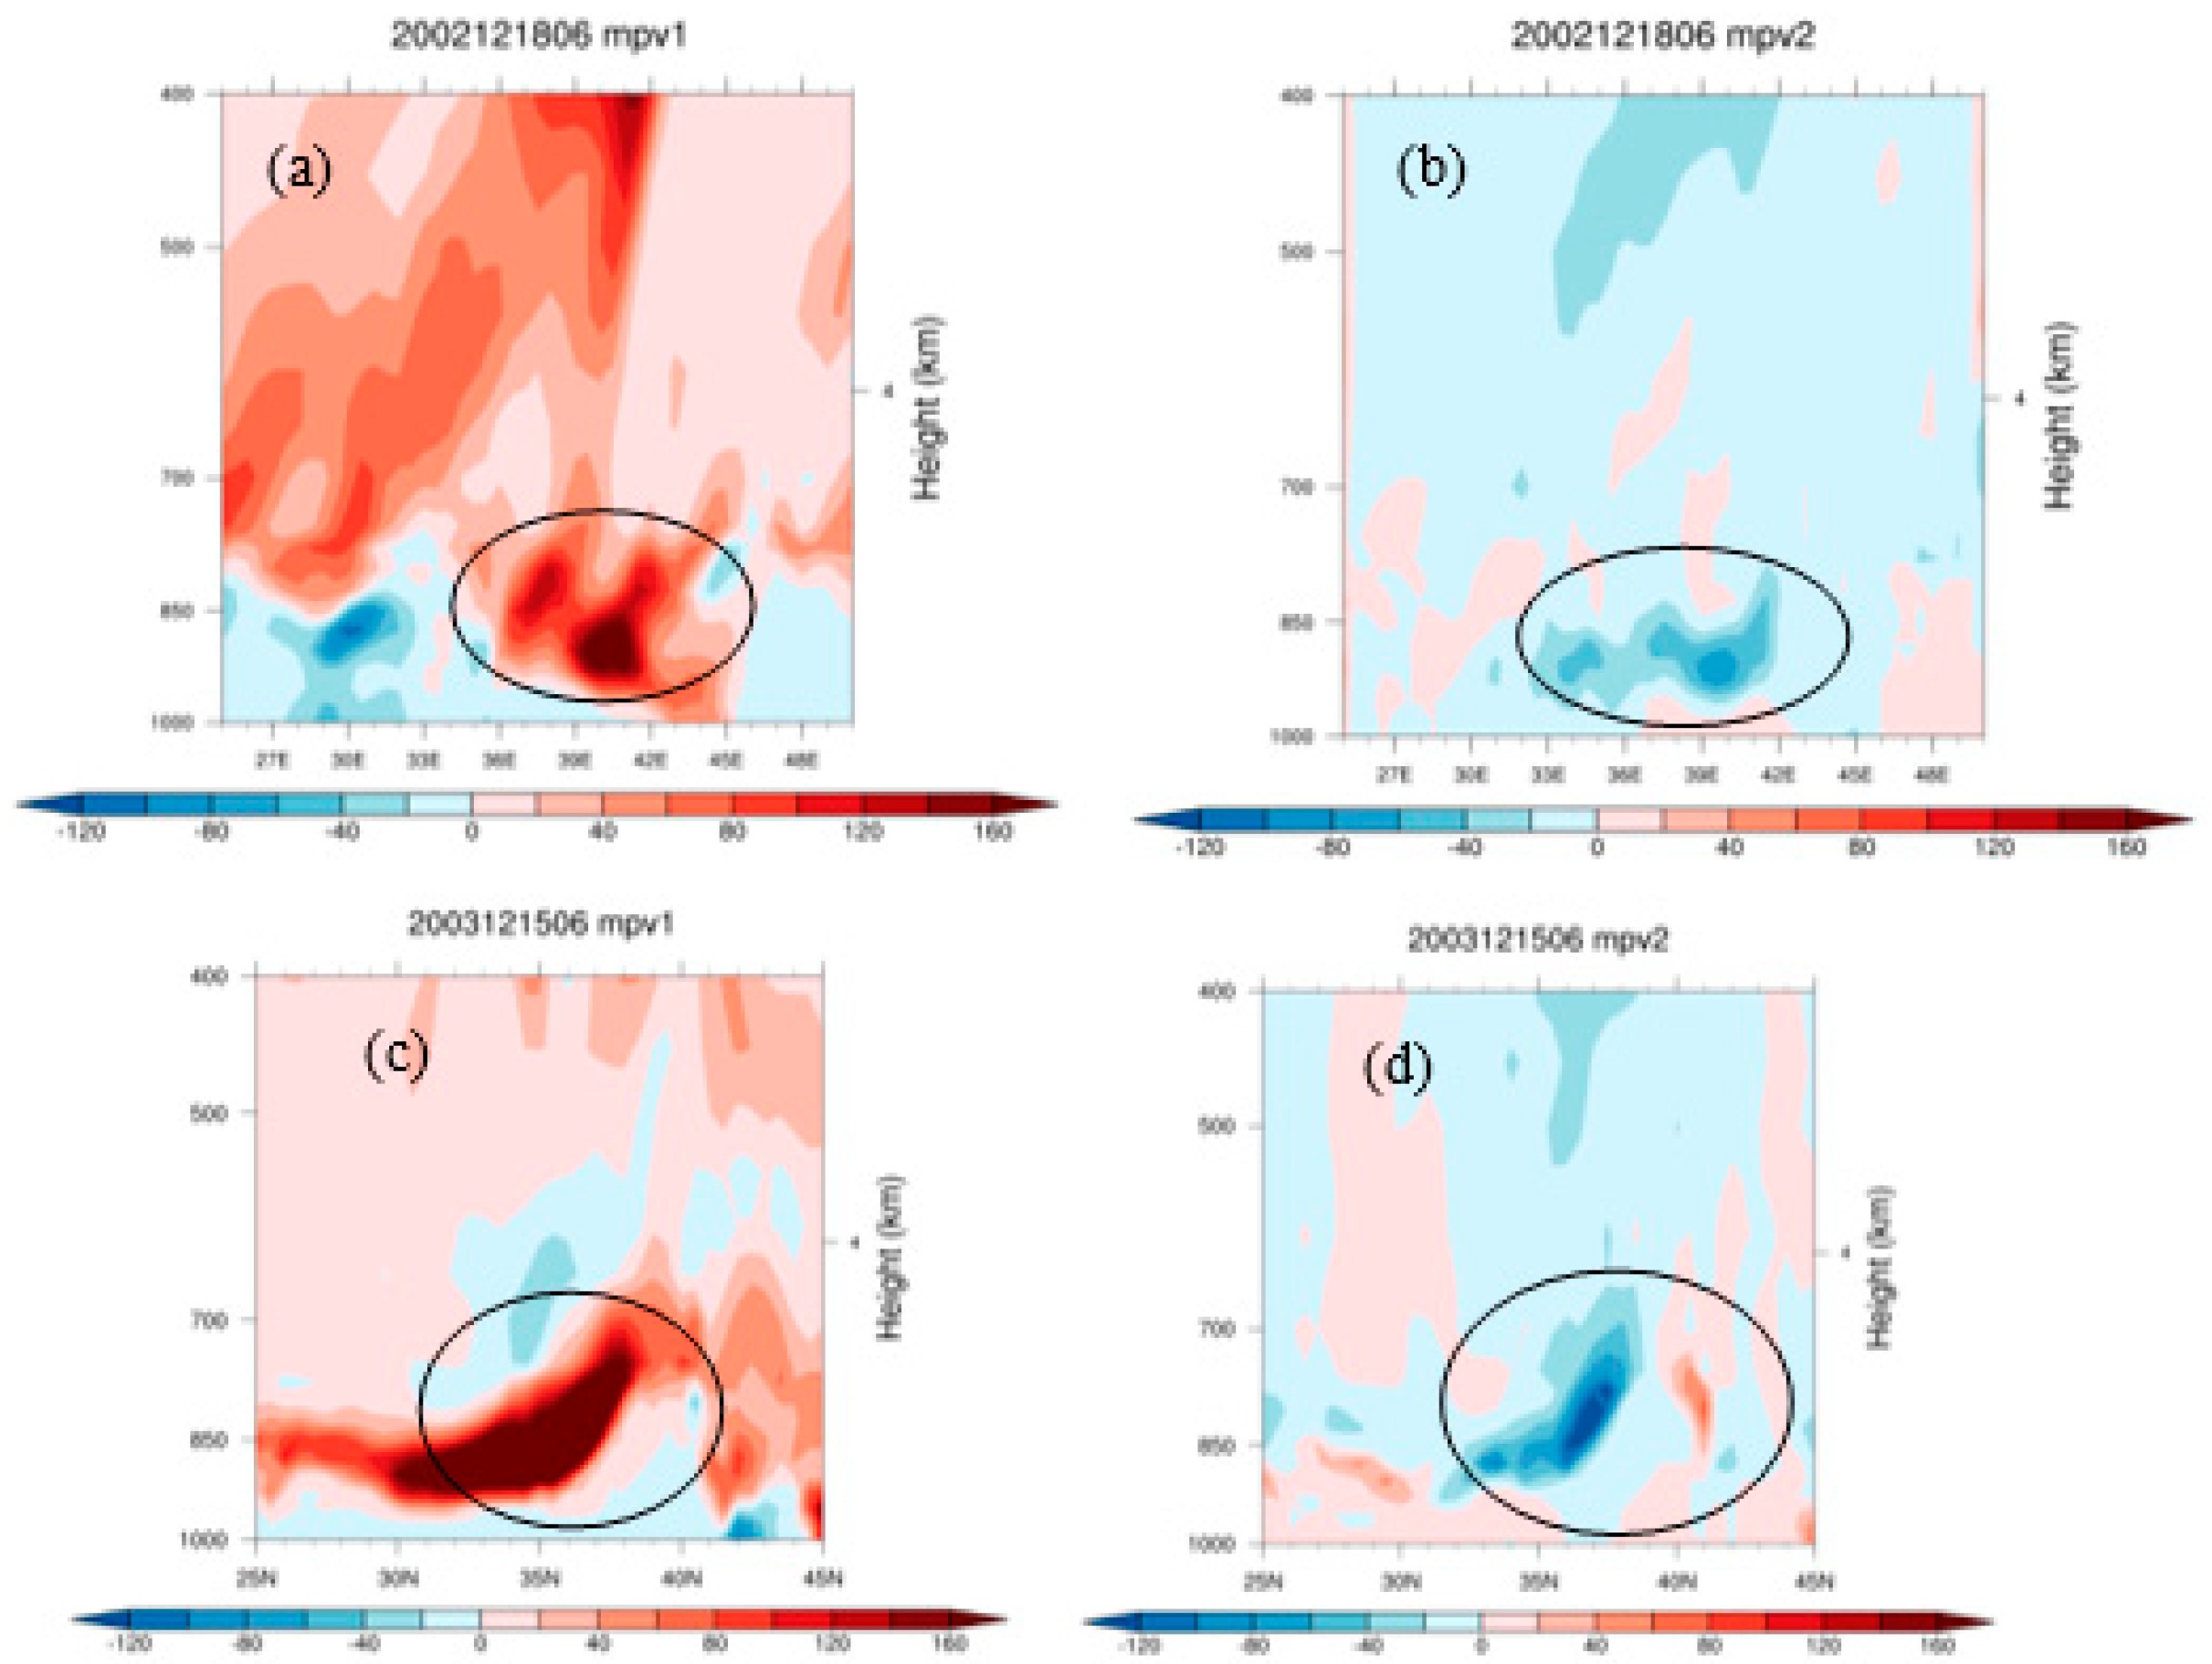
The calculation of sensible and latent heat in the cyclone area shows that the sensible heat is stronger than the latent heat in the vertical. It reveals that warm advection is more important (10/16, 62% of cases). Other cases show that the two kinds of heat are similar in intensity. The calculation of the Moist Potential Vorticity (MPV) (Miao et al. [27]) shows that inertial instability (MPV1 > 0) and baroclinic instability (MPV2 < 0) all support vertical vorticity increasing in the cyclonic systems. Therefore, the local unstable condition is favorable for moisture thermodynamic instability growth and precipitation generation. Figure 8 shows the case of the inertial instability and baroclinic instability distribution along the latitude and longitude.
In such an environment, the different airflow rising mechanisms can be summarized as follows: ① the forced uplift of the coastal mountains (in Regions III and IV), ② the topographic convergence uplift in the eastern low interior area (Region I), ③ the convergence uplift of the cyclone in the middle and lower layers (all four regions) and ④ the thermal dynamic uplift of the warm front (Regions I and II). The combination of the rising mechanisms maintains an active and strong local convection. These different uplift mechanisms affect the local characteristics of cloud and rain. The forced uplift of the coastal mountains results in the development of convective cloud systems in the coastal area. The clouds are continuously generated and accumulated, form thicker and larger cloud bodies and generate strong or continuous precipitation. The convergence uplifts in the areas near the center and eastern part of cyclones, causing more random variance in the intensity and location and supporting the local convective clouds’ development and strong precipitation.
The dry, warm front extends from the south to the north and overlaps with the southeast part of the cyclone. It strengthens the thermal convection intensity in this area. However, this kind of warm front is dry and mixes with the wet air in the north of the cyclone, and forms a mixture of dynamic, thermodynamic, and moisture thermodynamic instability (dry, light air mass is under the wet, heavy air mass), which then results in the complexity of convection. Therefore, the clouds and rainfall in the center and eastern parts of the cyclone are characterized by strong local spatial–temporal variance. According to the above circulation analysis of strong rainfall days, the main characteristics of the precipitation circulation system covering Syria can be summarized as in Table 1.
Table 1 shows that in the upper layer, the airflow in the front part of the westerly trough is a cyclonic circulation with temperature front zone in the middle and low layers. In the lower surface layer, it is a cyclone or low-pressure system with a dry, warm front. The northern moisture is from the Mediterranean Sea and is stored there. These are strong precipitation circulation backgrounds. In the middle layer, the humidity is higher than near the ground layer (caused by the influence of the dry, warm front). The cyclones provide more dynamic power and instability energy, instead of water vapor, to the precipitation area. The vertical rising motion in the east part of the cyclone is active and can extend up to over 200 hPa. The vertical flow affects the local cloud top characteristics. The sensible heating due to advection is stronger than latent heating in the baroclinic cyclone.
3.2.5. Convective Cloud Top Information of Satellite MODIS
The satellite cloud top information includes the average height, average brightness, temperature, average pressure and average cloud amount at the cloud top. The information reflects the top structure and status of the cloud body, but there may be no precipitation, even with the presence of clouds. Hence, the extraction and application of cloud top information has to be linked to the basic circulation characteristics in the corresponding period and area.
From the above analysis, there are more active convective clouds at the eastern part of the cyclone with varying locations, but the western part of the cyclone is mainly around the coastal mountains. Thus, there are more fixed convective cloud locations with thick cloud bodies. The satellite cloud top information shows corresponding characteristics: there is more variance in information value, or a more rich texture of cloud body in the eastern part than in the western part of the cyclone. Therefore, the cloud top information in the eastern part of the cyclone is more suitable to be used.
3.3. Construction and Application of Data Mining Model
To forecast the strong precipitation events discussed above, a data mining decision tree model method is chosen. The precipitation influencing factors have to be selected for the model. Those factors will construct the decision tree model of precipitation forecast.
3.3.1. Composition of the Model Factor Dataset
The first step is to set up a multi-source factor dataset by designing the index factors. According to the above analysis, the three-dimensional variables distribution characteristics should be considered for the circulation factors. To select factors related to the dynamic, thermal and water vapor conditions, a total of 24 influencing factors are constructed. For the satellite parameters, the distribution of each cloud top parameter and its intensity gradient distribution is considered to describe the characteristics of the cloud body by the satellite parameter factors. Since 22 influencing factors, or indices, are also constructed, the multi-sources influencing factor indices set has 46 factors.
3.3.2. Data Pre-Possessing
The factor dataset usually contains some noise, such as missing data or no reliable statistic correlation between factor data and determination target. Hence, data pre-processing is needed. The process includes various methods such as the interpolation of missing values, data transformation and data standardization processing. A correlation test is performed to eliminate the factors irrelevant or redundant to local precipitation.
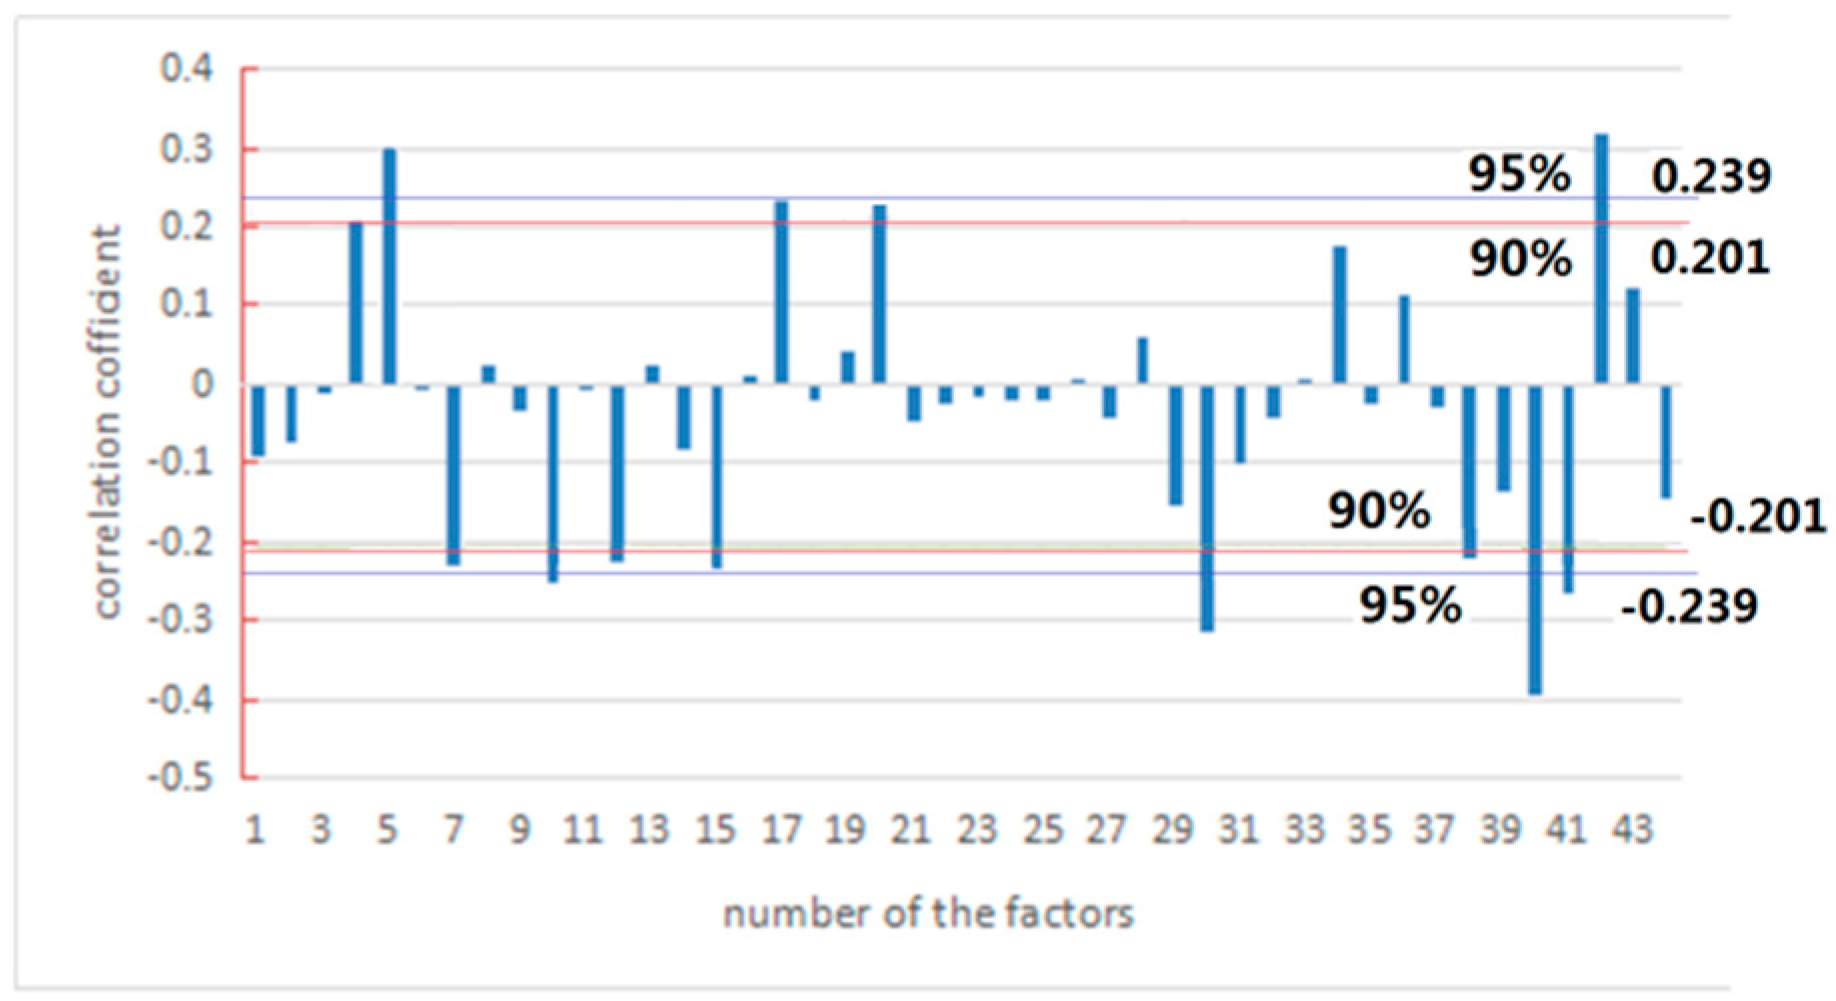
Including factors that have no relationship with precipitation in the calculation may mislead the computation procedure and affect the calculation results. Therefore, the correlation between the influencing factors and regional precipitation from 2002 to 2016 is computed. The selected precipitation time series has 67 individual daily precipitation cases with greater than 10 mm/day (Figure 9). The threshold value corresponding to 90% (95%) confidence level is ±0.201 (±0.239). There are 13 factors out of the 46 indices that passed the 90% significance test. Among them, 6 passed the 95% significance test.
Only the factors that passed the 90% confidence level are considered to be used in model construction. The details of the factors that passed the significance test are shown in Table 2.
Table 2 shows that the influence indices of strong rainfall with a correlation coefficient above 95% reliability include the following: a thermal dynamic factor of dry, warm front intensity at a low level; a dynamic factor of a thick layer of rising vertical velocity; moisture conditions are a thick layer of high relative humidity; and local cloud characteristics of the satellite average cloud amount and satellite average cloud top brightness temperature. The indices above 90% significance include more satellite cloud top parameter gradient information, such as cloud top pressure difference, cloud amount difference, cloud top brightness temperature difference and cloud top height difference, as well as average cloud top pressure, average cloud top height and ground dry, warm front zone. CTT means cloud top brightness temperature, or color temperature, a large value (K) CCT indicates more blue color, so the cloud will be colder, and a small value (K) CCT indicates more red color, thus the cloud will be warmer.
The negative correlation shows an inverse relationship between the strength of indices, or the gradient direction of indices and the intensity of the precipitation. These index factors are essential to explain the significance to the target variables. For instance, the dynamics and moisture characteristics of the circulation factors show the favorable impact of regional meteorological conditions on rainfall. The cloud parameter information provides more explanation on the intensity of local cloud growth. The meanings of these factors provide theoretical and logical support for the rationality of the model construction.
3.3.3. Construction Base of a Decision Tree Model
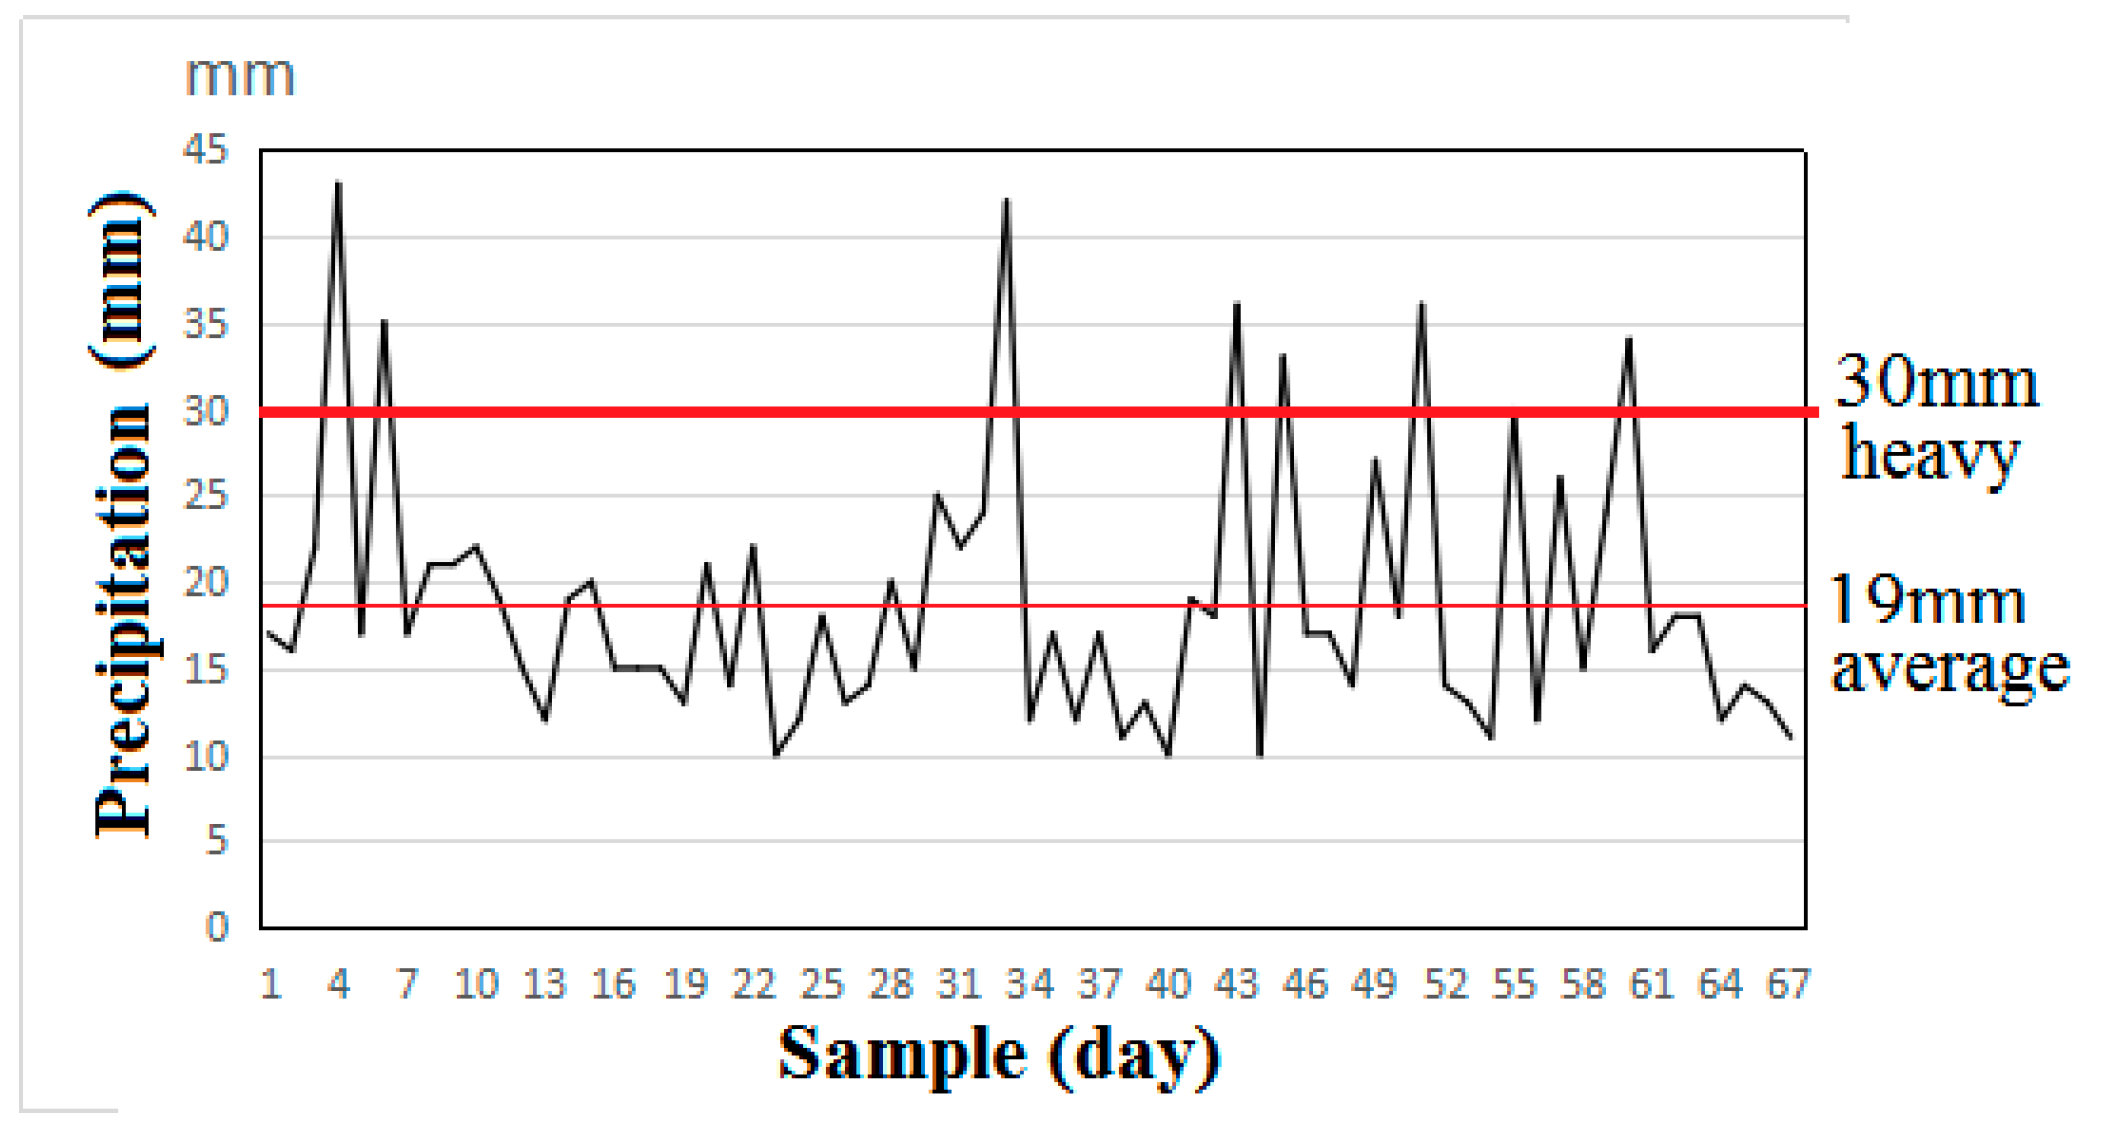
The decision tree model classifies the target variables by a group of regulations of information entropy and makes decisions in a binary yes–no format. The selection of the target time series is based on 67 strong precipitation days with local daily precipitation greater than 10 mm and within a dry, warm front environment in the rainy season (December and January) from 2002 to 2016. In Figure 10, the bold red solid line indicates strong precipitation days (daily rainfall > 30 mm), while the thin red solid line denotes normal heavy precipitation days (19 mm).
According to the two target classification requirements of 30 and 19 mm, the models can judge four categories: whether or not the precipitation reaches 19 mm, whether or not the precipitation is less than the average 19 mm precipitation, whether or not the precipitation is more than 30 mm, and whether or not the precipitation is less than 30 mm. At the same time, the probability effect of model discrimination can be obtained.
3.3.4. Model Construction and Evaluation
The inner nodes of the decision tree are set up by calculating the information quantity, entropy and gain of the index factor set. Further, through top-down recursion, a series of leaf nodes and branches is worked out, and a set of rules for classifying judgment of precipitation is obtained. Then, the most appropriate rule set or rule tree is determined through the training factor set, and the applicability of rules is evaluated by probability.
The training process constitutes 80% of the precipitation days, and all the factors are randomly selected from the target dataset and factor dataset for learning and training. There are two processes in training: pruning and verification. Pruning is the use of statistical measures to cut off the most unreliable branches. This will lead to faster classification and improve the ability of decision trees to correctly classify independent test data.
After obtaining a decision tree (i.e., a set of rules), the remaining 20% of the target set, called the test set, is used for verification. K-fold cross-validation is usually used for the test. When k is 10, it is called 10-fold cross-validation. In our research, the 10-fold cross-validation method, which has low bias and variance, is used. The rule is confirmed through verification; that is, the decision tree is reasonable and available.
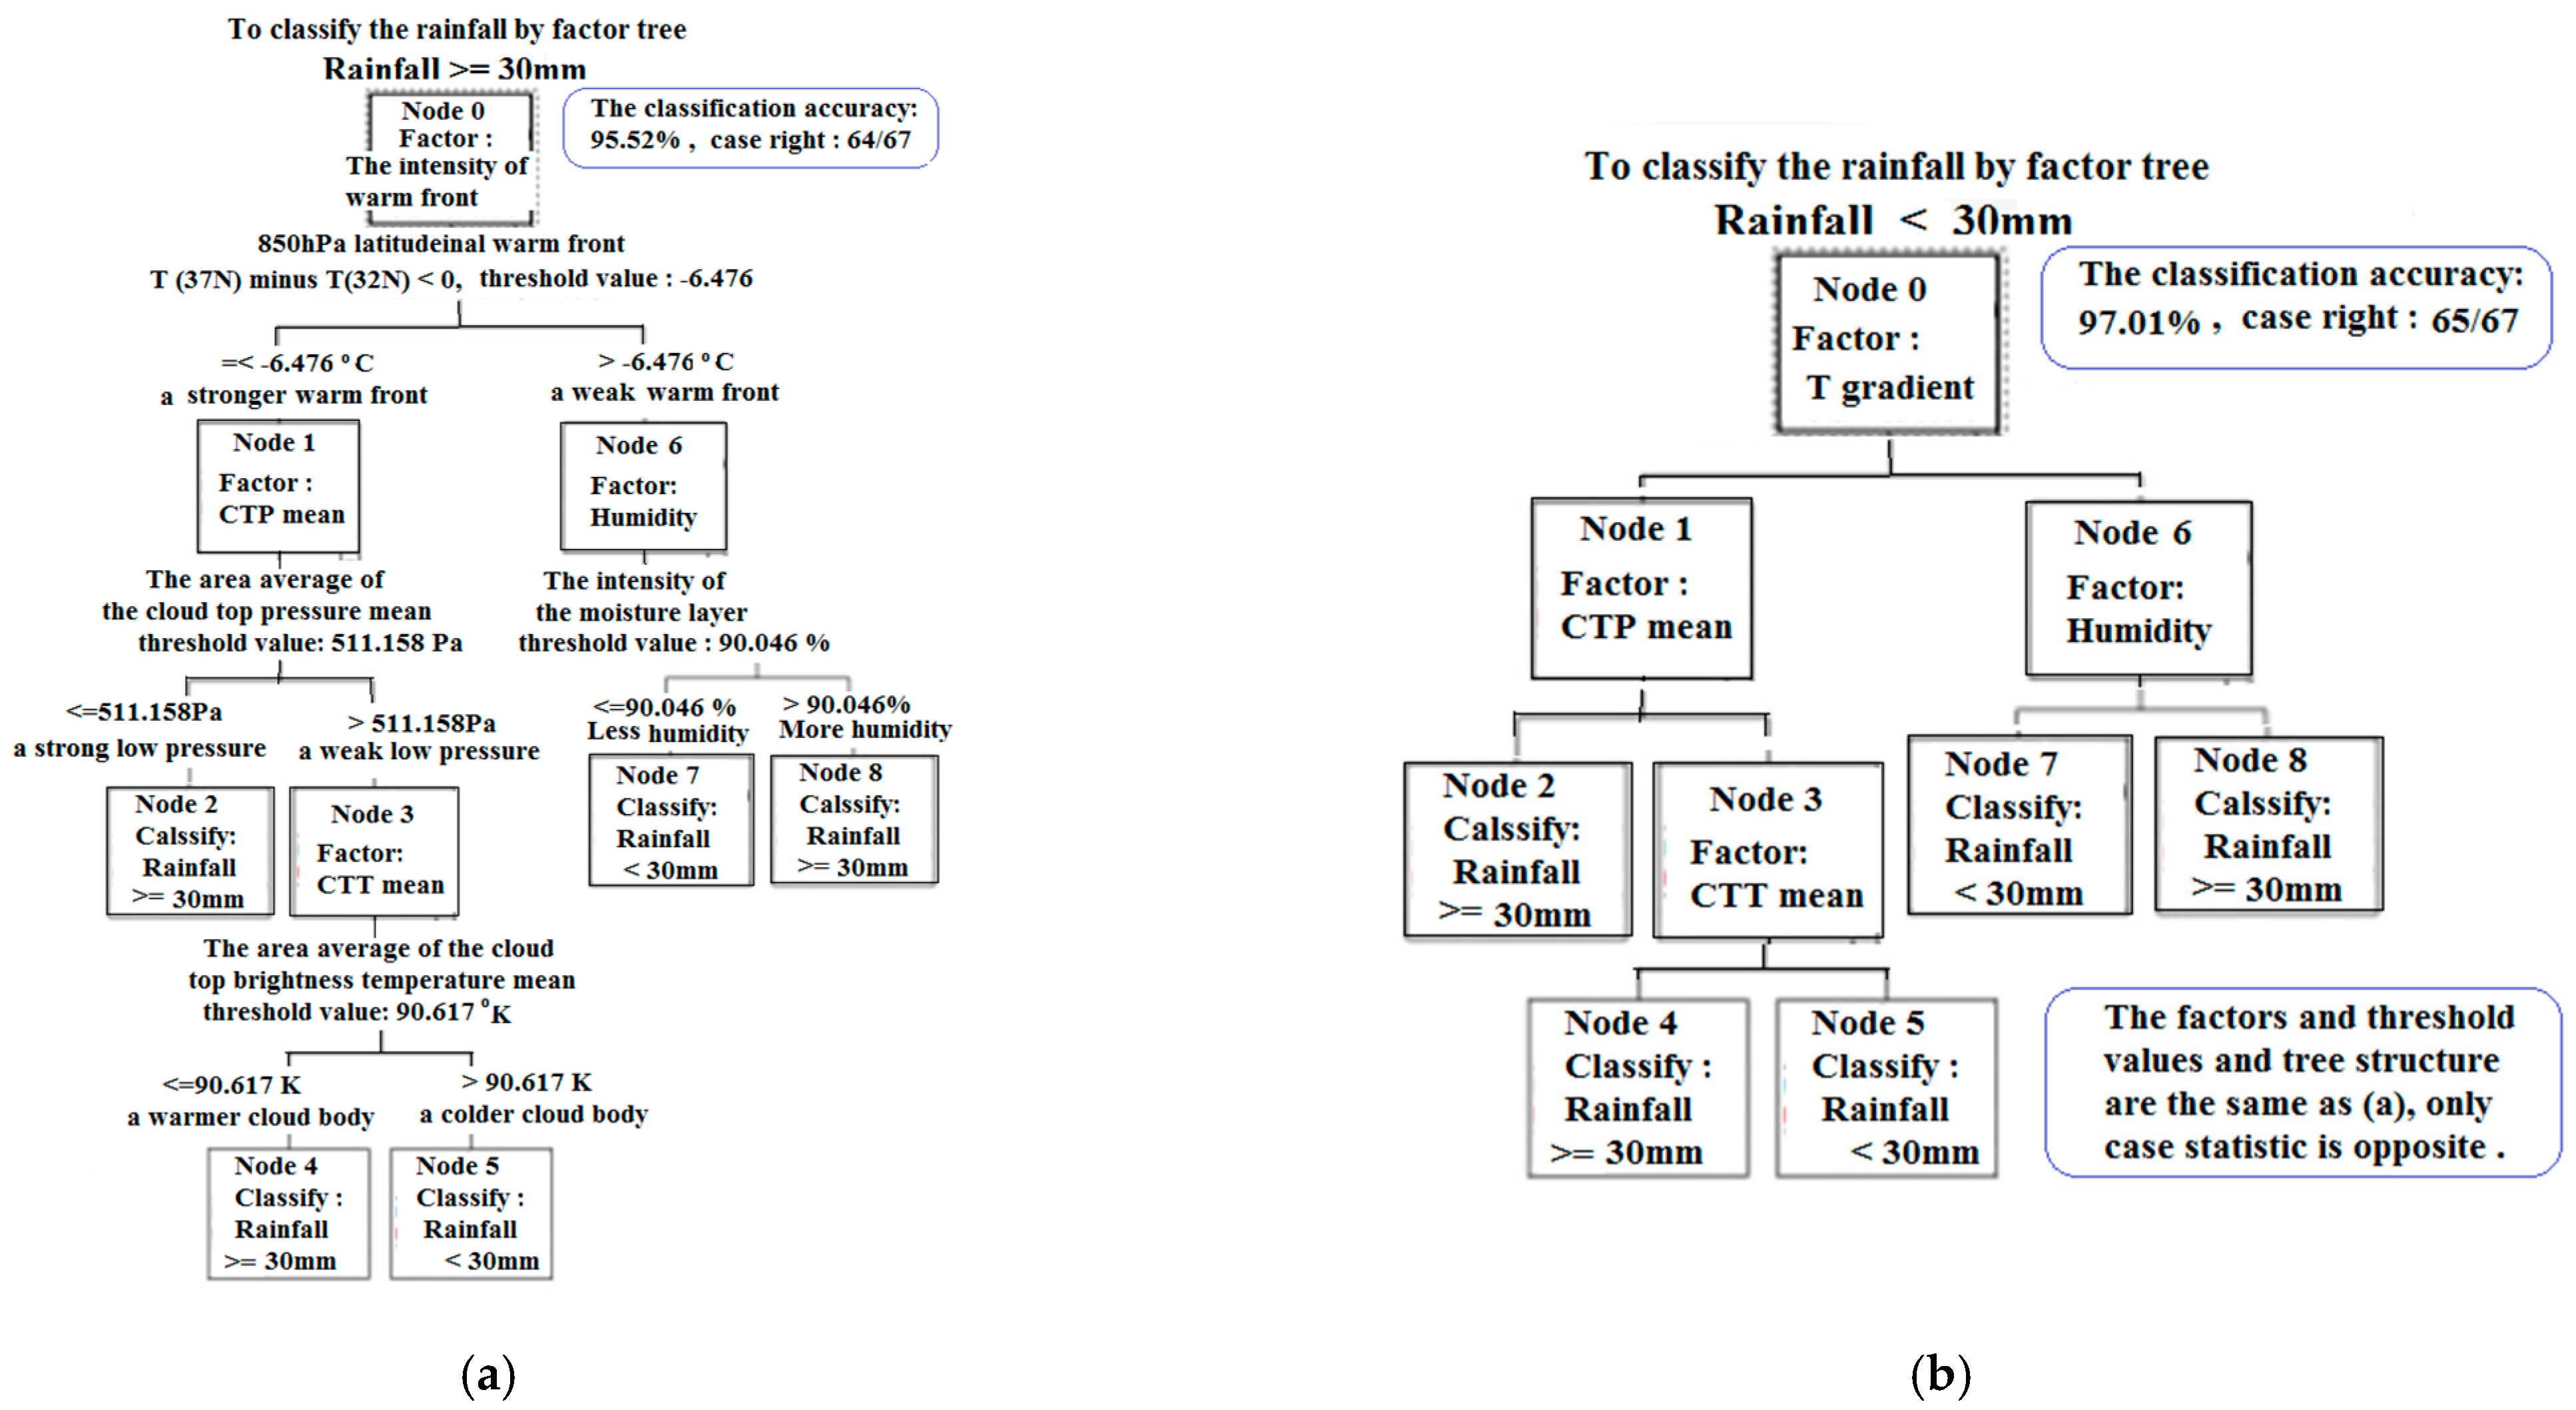
Since it is a binary discrimination (yes and no) type of classification, it is necessary to judge whether precipitation is larger or smaller than the classification threshold value independently. That is, some target variables do not meet the ≥30 mm group classification rules, or the <30 mm classification group conditions. Following the judging classification, four decision trees are obtained: ≥30 mm, <30 mm, ≥19 mm and <19 mm (Figure 11).
Figure 11 shows that there are five rules for determining whether a target variable belongs to precipitation ≥ 30 mm, including the intensity of low-level dry, warm front and the relative humidity content in the moisture layer, as well as several satellite index factors, such as cloud top average pressure and cloud top average brightness temperature. The classification tree has a classification accuracy of 95.52%. For the decision tree to classify precipitation belonging to <30 mm, its structure happens to be the same as for the precipitation ≥ 30 mm tree, but the classification statistic condition is opposite (see Figure 11a,b), and its accuracy is higher, reaching up to 97.01%.
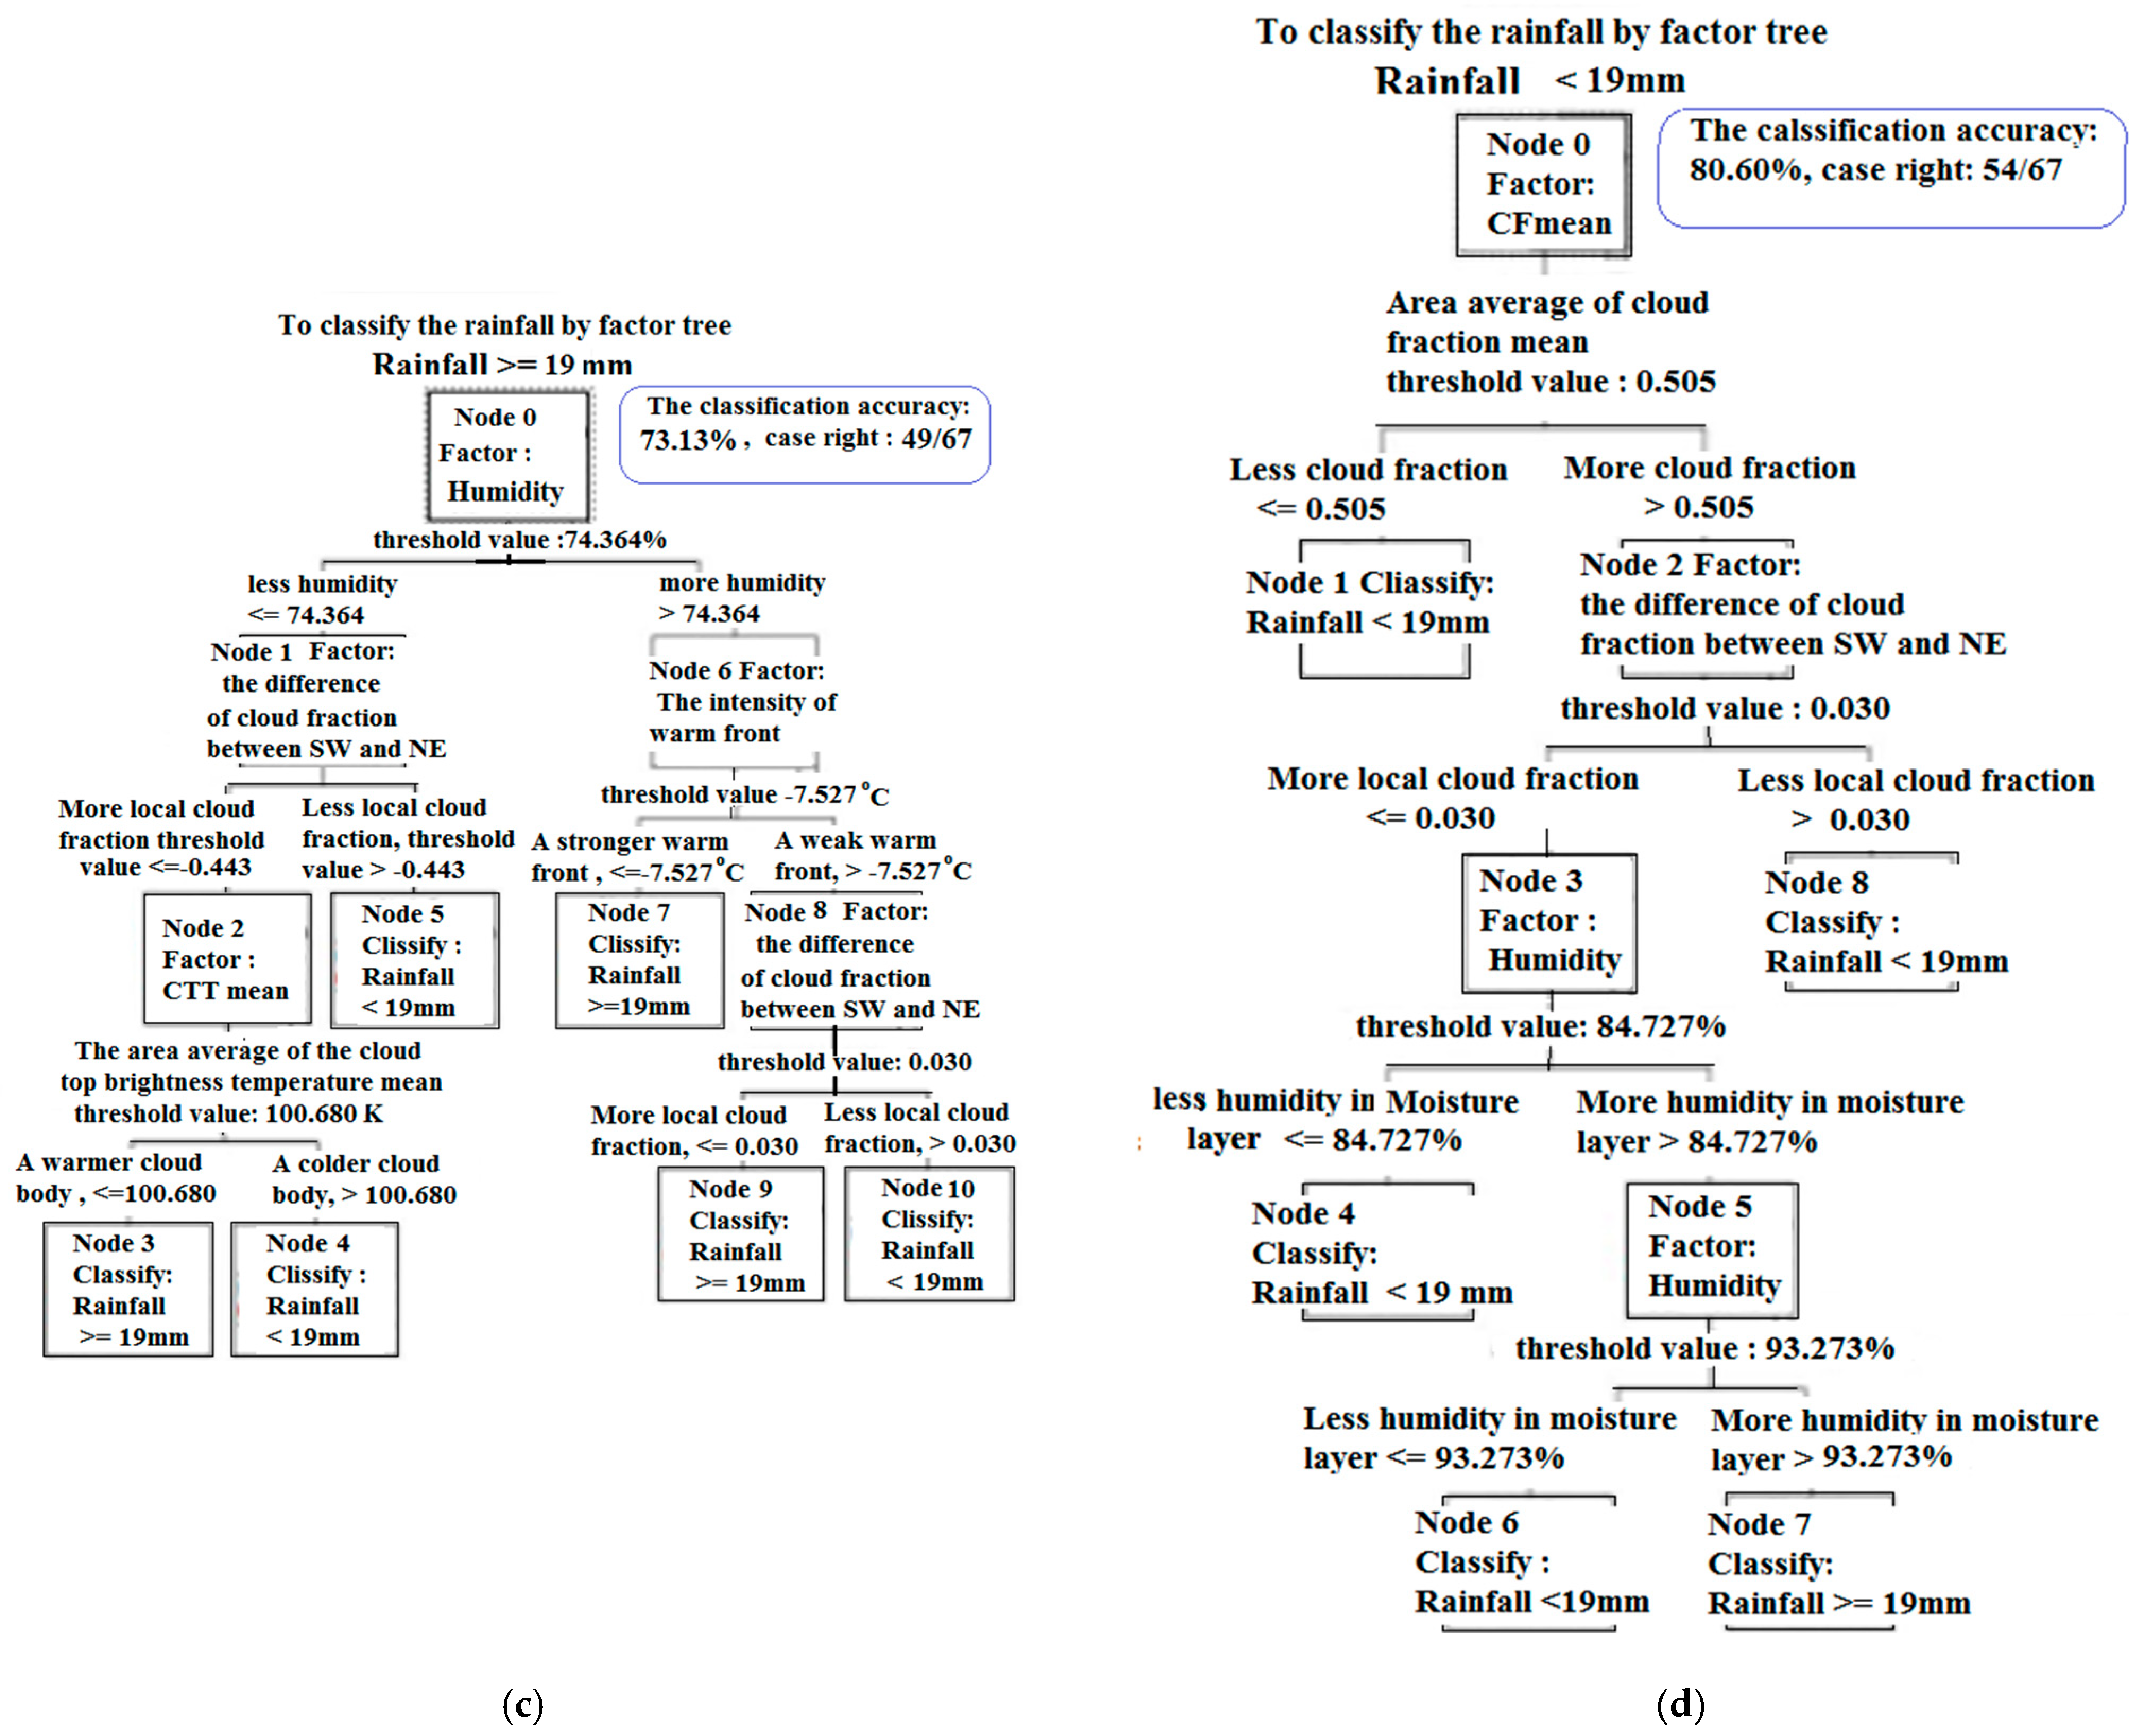
In comparison, for another threshold of 19 mm, the effectiveness of the decision tree classification reduces significantly (73.13%). For example, the decision tree for precipitation ≥19 mm has six rules, including the index factors, such as the relative humidity content in the moisture layer, the intensity of the dry, warm front, the cloud fraction gradient and the average brightness temperature of the cloud top. For the decision tree with precipitation <19 mm, there are five rules, including indices of average cloud fraction, cloud fraction gradient and relative humidity content in the moisture layer. The humidity factor is used twice with different threshold values. The classification accuracy for this decision tree is 80.6%.
The differences in classification accuracy between 30 mm and 19 mm could be related to two reasons. One is the unclear classification of the target variable (precipitation), which combines moderate and strong rain into the same classification (>19 mm). The other reason is that, for the two different precipitation intensities of moderate and strong rain, their dynamic factors, thermodynamic factors, water vapor condition and local cloud development intensity have some remarkable differences. The difference causes deviation in evaluating the rule satisfaction grade of the target variables and further reduces the classification accuracy. Normally, people pay more attention to the strong rainfall, such as the precipitation of 30 mm and above. The classification results of the corresponding strong precipitation by the decision tree model are satisfactory.
The tree structure is selected and determined by learning and training. The different 80% of the target data are randomly selected from the target dataset and the corresponding related factors and their combinations are determined by learning and training processing. The remaining 20% of the target variables are used to test the new decision trees by repeating the cycles. The probabilities of classification accuracy of these decision trees can be obtained according to the probabilities, to determine an optimal decision tree. Since 80% of the target data is selected randomly, there will be an amount of new decision trees.
Figure 11 also shows that the structure of the decision tree for ≥ 30 mm of strong rain is more scientific compared with the decision tree for 19 mm precipitation, as the tree structure does not re-use any factors, and the meaning of tree structure is clearer and more reasonable. It is worth noting that the factor of the vertical velocity layer has the highest correlation with precipitation (−0.39613), but it was not selected into the decision tree rules by the learning and training process. The other two factors of satellite cloud top pressure and cloud top brightness temperature are selected into the tree rules. Both the satellite parameters reflect cloud vertical extension and internal vertical rising motion characteristics. Thus, factors in the decision tree are all the observed variables. The vertical velocity is a calculated variable that may contain some instabilities or calculation error propagation. In fact, the two satellite parameters used in the decision tree can present the characteristic intensity of local convection clouds. The factors and structure of a decision tree are selected and constructed by automatic and non-artificial data mining methods. The final factors in the tree include the circulation thermal dynamics, water vapor condition and the local strong convection that meet precipitation theory. Therefore, the decision tree and its classification can be an excellent intelligence method.
3.3.5. Model Application in Early Warning
The time sequence of data should be considered in the construction of an early warning model of decision tree. Therefore, the target variable time series set is divided into previous 80%, which is used as a historical time series training dataset, and latter 20%, which is used as a time series test dataset or verification dataset. By probability, it can choose 10–30% of the target variable set for test or verification. Then, the corresponding training dataset will be 70–90%. The training set is used to construct the rule-based decision tree through multi-source factor composition, while the test set is used for probability calculation and decision tree verification. The selection percentage is adjustable within a range, and within one percentage point, the tree structures are variable. Thus, the prediction and warning results have to select the best one from a lot of probability comparison. For the four target precipitation grade groups mentioned above, four warning decision trees are constructed. Their constructions look similar to that in Figure 11, but with lower prediction accuracy.
The prediction decision tree has two accuracies for the training and testing sets respectively. For rainfall ≥ 30 mm, the accuracy is 98.21% (90.91%) for the training (testing) set. For rainfall < 30 mm, the accuracy is 96.61% (87.5%) for the training (testing) set. For rainfall ≥ 19 mm, the accuracy is 81.36 and 62.5% for the training and testing set, respectively. For rainfall < 19 mm, the accuracy is 78.85% for the training set and 60% for the testing set. The decision tree encompasses six rules, including abundant water–vapor conditions, cloud-fraction gradient, average cloud-top brightness temperature and active and extending thick vertical rising motion.
4. Discussion and Conclusions
According to the analysis of the paper, the following basic conclusions can be obtained:
- (1)
- Syria is located at the east end of the Mediterranean Sea. It is an arid country with a rainy season in winter, mainly in December and January. In addition to the Mediterranean climate zones along the Mediterranean coastal areas, the northern interior of Syria also belongs to the Mediterranean climate zone. The mountains on the northern coastline of Syria are narrower and lower than the mountains along the southern coast. The northeast part of Syria is the lowest part of the country. The westerlies bring the Mediterranean moisture over the northern coastal mountain to eastern Syria where the moisture is stored in the low land. The southern coastal mountains connect with desert, causing a tropical desert climate over southern Syria. Thus, the Syrian climate is wet, cold in the north and dry, warm in the south. Moreover, Syrian weather has more precipitation over the north and northeastern interior.
- (2)
- The main characteristics (80–100% of 16 strong rainfall cases) of the key systems during the rainy season in the area are: the dry, warm front cyclonic systems at low and middle levels and the westerly trough at high levels. Further analysis reveals the uniqueness of the structure of such cyclones: the moisture in the north part of the cyclones is higher than that in the south of the cyclone (influenced by the Mediterranean climate zone and the tropical desert climate zone). The humidity in the middle layer is stronger than that in the near-surface (caused by the dry, warm front entering the cyclone). The moisture layer and the vertical ascending motion layer extend vertically up to 200 hPa (affected by active convection in mid-high levels and revealed by the satellite cloud top parameters). Such a regional environmental condition causes the moisture thermodynamic instability (dry, warm air mass at low level and wet, cold air mass at upper level) in the precipitation area. The dry, warm front cyclones provide more dynamic power and instability energy to the precipitation area instead of water vapor. The features are different from that of the common mid-latitude warm front cyclones. The common mid-latitude warm front cyclone is wet in the south and dry in the north, wet at the surface and dry in the upper level, and a warm front usually transmits the abundant moisture to the precipitation area. Especially, the moisture in the dry, warm front cyclone depends on the vapor storage in the low plains of the Mediterranean climate zone, as the northern flow of cyclone is from the plateau to the Mediterranean Sea. It causes a 30 mm rainfall, considered strong precipitation in the arid area, without which enough moisture would not be transported into the area during cyclonic precipitation.
- (3)
- The cloud top information of the MODIS satellite directly reflects the top-level structure and state of the cloud body. However, cloud coverage does not necessarily guarantee precipitation. Therefore, a combination of satellite parameters with the basic characteristics of circulation in the corresponding period is designed, which will improve the effectiveness of the satellite parameter’s application. The cloud-top parameters can indirectly reflect vertical motion characteristics within the cloud body. The advantage of satellite remote sensing is to capture the texture of the convective cloud body and present local cumulus convection characteristics. Therefore, adding the satellite cloud-top parameters and their gradients into the index construction can provide better supplement and improvement to local precipitation information. It is helpful to the areas lacking ground monitoring station data.
- (4)
- The decision tree method of data mining is used to build the factor index datasets based on system circulations and satellite cloud parameters. On this basis, precipitation prediction models are constructed, and the models and their prediction effectiveness are evaluated. The decision tree model does not predict specific values of a precipitation event. Instead, it classifies the intensity precipitation through a series of rules (branches and nodes in decision trees) and to make proactive warnings. It is noticed that the model can select the tree node factor and branch rules by objective intelligent training and testing processes. It is suitable to apply to regions lacking effective and systematic near-ground meteorological networks and data. The model has a classification training accuracy reaching up to 98.21% and a 90.91% classification prediction accuracy for ≥30 mm strong rainfall. However, for ≥19 mm of precipitation, the model has a 81.36% classification training accuracy and a 62.5% classification prediction accuracy. The sharp drop in accuracy should be related to the unclear target variable (>19 mm rainfall), which includes strong and moderate precipitations, and the model mixes the nodes and branches with remarkable differences in one decision tree. The model can be applied to other places or larger areas according to the statistic locations and area sizes of precipitation, and it can provide a good reference for predicting results to other numerical forecast models.
Author Contributions
Conceptualization: J.W.; methodology, software and validation: X.W., C.M. and D.H.; formal analysis, investigation and resources: N.A.; data curation: X.W. and D.H.; writing—original draft preparation: N.A.; writing—review and editing: J.W.; visualization: X.W. and D.H.; supervision: J.W. and C.M.; project administration: J.W.; funding acquisition: J.W., X.W. and C.M.; English correcting: K.R.K. All authors have read and agreed to the published version of the manuscript.
Funding
This research was funded by the National Natural Science Foundation of China (Grant Numbers: 41276033 and 41805033). K.R.K. acknowledges the Department of Science and Technology (DST), Government of India, for the award of DST-FIST Level-1 (SR/FST/PS-1/2018/35) scheme to the Department of Physics, KLEF.
Acknowledgments
The authors are thankful to NCEP (National Centers for Environmental Prediction), CFSR (Climate Forecast System Reanalysis), ECMWF (European Centre for Medium-Range Weather Forecasts), and NASA (National Aeronautics and Space Administration) for making datasets freely available. Our thanks also go to Yitao Liu, a graduate student in NUIST, for his assistance in generating the most of the figures. We are grateful to Kenny Thiam Choy Lim Kam Sian for the English language editing. The numerical calculation of this paper is supported and aided by the High-Performance Computing Center of Nanjing University of Information Science and Technology.
Conflicts of Interest
The authors declare no conflict of interest.
Appendix A
The Lagrange Interpolation Polynomial interpolation method.
where x is variable, y is an interpolated function of x, l is basis polynomials.
Appendix B
C5.0 Method Application
To compare C5.0 with C4.5, the memory occupation ratio is reduced, the operation speed is faster, the error is also reduced and more accurate rules are produced (Chen, 2018 [31], Lam et al. 1994 [32]). C4.5 and C5.0 are a kind of structuring method of the decision tree model. A series of factor discrimination rules was built through training (recursive operation). They can achieve the classification of target variables. When the time sequence is considered, the prediction can be obtained. The method can carry out numerical classification prediction and analyze and evaluate the comprehensive structure of factors. It is a model prediction method widely used in data mining calculation, as compared with other decision tree algorithms.
The C5.0 algorithm has the advantages of simple calculation, high data processing efficiency and easy model interpretation. The structure of a decision tree is composed of a root node, classification branch and leaf node. The C4.5 algorithm is based on the theory of information entropy and builds a decision tree recursively. Set s is the dataset containing S data samples, Ci(1, 2, 3,…, m), is the m categories of samples, Si is the number of samples which belong to a category Ci. The information quantity of the sample is calculated as follows:
Using an attribute A to divide datasets, let the attribute A have different values, then S can be S(S1, S2, S3,…, Sm). The calculation formula of information entropy is:
The information gain of attribute A is as follows:
The information gain rate is calculated as follows:
Simplifying a decision tree is an indispensable step. To find an optimal decision tree, the following three optimization problems should be solved: (1) to generate the least number of target leaf nodes for each attribute, (2) to generate the least levels of leaf nodes for each attribute and (3) to generate the least overall leaf nodes and the least levels of each leaf node in the decision tree. Then, the scale of the prediction model (level and number of influencing factors involved) is determined. In this process, the relationship of multi-source factors in the decision tree structure is analyzed systematically, and the relative importance of multi-source factors can be verified and evaluated through the test process.
References
- Wallace, J.M.; Hobbs, P.V. Atmospheric Science: An Introductory Survey, 2nd ed.; Helé, J., Ed.; University of Washington: Washington, DC, USA, 2006; ISBN 0-12-732951-X. [Google Scholar]
- Feng, S.Z.; Li, F.Q.; Li, S.J. Introduction to Marine Science, 1st ed.; Li, Y.Q., Ed.; Higher Education Press: Beijing, China, 1999; ISBN 704007267. (In Chinese) [Google Scholar]
- Alkhalaf, I.; Solakova, T.; Zelenakova, M.; Gargar, I. Recent climate change in Syria: Seasonal rainfall and climatology of Syria for 1991–2009. Sel. Sci. Pap.-J. Civ. Eng. 2018, 13, 77–96. [Google Scholar] [CrossRef] [Green Version]
- Zakhem, B.A.; Kattaa, B. Investigation of hydrological drought using cumulative standardized precipitation index (SPI 30) in the eastern Mediterranean region (Damascus, Syria). J. Earth Syst. Sci. 2016, 125, 969–984. [Google Scholar] [CrossRef] [Green Version]
- Al Charideh, A.R.; Zakhem, B.A. Distribution dutritiumet desisotopes stables dansles précipitations en Syrie. Hydrol. Sci. J. 2010, 55, 832–843. [Google Scholar] [CrossRef]
- Keatinge, J.D.H.; Dennett, M.D.; Rodgers, J. The influence of precipitation regime on the crop management of dry areas in Northern Syria. Field Crop. Res. 1985, 104, 281–287. [Google Scholar] [CrossRef]
- Thomson, E.F.; Gruner, L.; Bahhady, F.; Orita, G.; Termanini, A.; Ferdawi, A.K.; Hreitani, H. Effects of gastro-intestinal and lungworm nematode infections on ewe productivity in farm flocks under variable rainfall conditions in Syria. Livest. Prod. Sci. 2000, 63, 65–75. [Google Scholar] [CrossRef]
- Karam, A.; Safwan, M.; Ali, M.; Mohammed, S.; He, H. Fine-resolution precipitation mapping over Syria using local regression and spatial interpolation. Atmos. Res. 2021, 256, 16. [Google Scholar] [CrossRef]
- Bilal, A.; Ammar, O. Rainfall water management using satellite imagery—Example from Syria. Int. J. Remote Sens. 2002, 23, 207–219. [Google Scholar] [CrossRef]
- Bilal, A. An Advanced Remote Sensing Mapping Technique Aimed at a Better Rainfall Water Preservation in Syria. J. Earth Sci. Eng. 2013, 3, 613–620. [Google Scholar]
- Duong, H.T.; Sorooshian, A.; Feingold, G. Investigating potential biases in observed and modeled metrics of aerosol-cloud-precipitation interaction. Atmos. Chem. Phys. 2011, 11, 4027–4037. [Google Scholar] [CrossRef] [Green Version]
- Cheng, F.; Zhang, J.; He, J.; Zha, Y.; Li, Q.; Li, Y. Analysis of aerosol-cloud-precipitation interactions based on MODIS data. Adv. Space Res. 2017, 59, 63–73. [Google Scholar] [CrossRef]
- Platnick, S.; King, M.D.; Ackerman, S.A.; Menzel, W.P.; Baum, B.A.; Riedi, J.C.; Frey, R.A. The MODIS cloud products: Algorithms and examples from Terra. IEEE Trans. Geosci. Remote Sens. 2003, 41, 459–472. [Google Scholar] [CrossRef] [Green Version]
- Miao, C.; He, D.; Wang, J.; Shi, D. Research and application of summer rainfall prediction model in the middle and lower reaches of the Yangtze River based on C4.5 algorithm. J. Meteorol. Soc. 2017, 37, 256–264. (In Chinese) [Google Scholar] [CrossRef]
- Zhang, W.; Gao, S.; Chen, B.; Cao, K. The application of decision tree to intensity change classification of tropical cyclones in western North Pacific. Geophys. Res. Lett. 2013, 40, 1883–1887. [Google Scholar] [CrossRef]
- Hertig, E.; Seubert, S.; Jacobeit, J.; Paxian, A.; Vogt, G.; Paeth, H. Statistical and dynamical downscaling assessments of precipitation extremes in the Mediterranean area. Meteorol. Z. 2012, 21, 61–77. [Google Scholar] [CrossRef]
- Nabavi, S.O.; Haimberger, L.; Abbasi, R.; Samimi, C. Prediction of aerosol optical depth in West Asia using deterministic models and machine learning algorithms. Aeolian Res. 2018, 35, 69–84. [Google Scholar] [CrossRef]
- Mishra, N.; Soni, H.K.; Sharma, S.; Upadhyay, A.K. A comprehensive survey of data mining techniques on time series data for rainfall prediction. J. ICT Res. Appl. 2017, 11, 167–183. [Google Scholar] [CrossRef] [Green Version]
- Bhatkande, S.S.; Hubballi, R.G. Weather Prediction Based on Decision Tree Algorithm Using Data Mining Techniques. Int. J. Adv. Res. Comput. Commun. Eng. 2016, 5, 483–487. [Google Scholar]
- Olaiya, F.; Adeyemo, A.B. Application of Data Mining Techniques in Weather Prediction and Climate Change Studies. Int. J. Inf. Eng. Electron. Bus. 2012, 4, 51–59. [Google Scholar] [CrossRef] [Green Version]
- Talebi, H.; Peeters, L.J.M.; Otto, A.; Delgado, R.T. A Truly Spatial Random Forests Algorithm for Geoscience Data Analysis and Modelling. Math. Geosci. 2021, 53, 1–22. [Google Scholar] [CrossRef]
- Binita, S.; Haroon, S.; Sajjad, A. Impervious Surfaces Mapping at City Scale by Fusion of Radar and Optical Data through a Random Forest Classifier. Remote Sens. 2021, 13, 3040. [Google Scholar] [CrossRef]
- Berrisford, P.; Kållberg, P.; Kobayashi, S.; Dee, D.; Uppala, S.; Simmons, A.J.; Poli, P.; Sato, H. Atmospheric conservation properties in ERA-Interim. Q. J. R. Meteorol. Soc. 2011, 137, 1381–1399. [Google Scholar] [CrossRef]
- Kumar, K.R.; Yin, Y.; Sivakumar, V.; Kang, N.; Yu, X.; Diao, Y.W.; Adesina, A.J.; Reddy, R.R. Aerosol climatology and discrimination of aerosol types retrieved from MODIS, MISR and OMI over Durban (29.88° S, 31.02° E), South Africa. Atmos. Environ. 2015, 117, 9–18. [Google Scholar] [CrossRef]
- Xiong, X.; Wenny, B.; Xie, X.; Salomonson, V.; Barnes, W. Summary of terra and aqua MODIS on-orbit calibration and characterization results. In Proceedings of the 2007 IEEE International Geoscience and Remote Sensing Symposium, Barcelona, Spain, 23–28 July 2007; pp. 4128–4131. [Google Scholar] [CrossRef]
- Zurbenko, I.; Smith, D.; Potrzeba-Macrina, A.; Loneck, B.; Valachovic, E.; Sun, M. High-Resolution Noisy Signal and Image Processing; Cambridge Scholars Publishing: Newcastle upon Tyne, UK, 2021; ISBN 1-5275-6293-X. [Google Scholar]
- Miao, C.; Liu, W.; Wang, J.; Wu, M.; Li, T. Comparison between Two Rainstorm Meso-scale Vortices Circumambulated Respectively From Two Sides of Mountain Dabieshan During Meiyu Season. Plateau Meteorol. 2014, 33, 394–406. (In Chinese) [Google Scholar] [CrossRef]
- Luhunga, P.M.; Djolov, G. Evaluation of the Use of Moist Potential Vorticity and Moist Potential Vorticity Vector in Describing Annual Cycles of Rainfall over Different Regions in Tanzania. Front. Earth Sci. 2017, 5, 7. [Google Scholar] [CrossRef] [Green Version]
- Hardy, S.; Schultz, D.M.; Vaughan, G. The 23–26 September 2012 U.K. floods: Using PV surgery to quantify sensitivity to upper-level forcing. Mon. Weather Rev. 2017, 145, 4055–4079. [Google Scholar] [CrossRef]
- Qian, W.; Du, J.; Shan, X.; Jiang, N. Incorporating the Effects of Moisture into a Dynamical Parameter: Moist Vorticity and Moist Divergence. Weather Forecast. 2015, 30, 1411–1428. [Google Scholar] [CrossRef]
- Chen, L.P.; Sun, Y.J. Comparison of object-oriented remote sensing image classification based on different decision trees in forest area. J. Appl. Ecol. 2018, 29, 3995–4003. (In Chinese) [Google Scholar] [CrossRef]
- Lam, W.; Bacchus, F. Learning Bayesian Belief Networks: An Approach Based on the MDL Principle. Comput. Intell. 1994, 10, 269–293. [Google Scholar] [CrossRef] [Green Version]
Figure 1.
The Middle East climate regions and topography. (a) The climate zone divisions; and (b) topography. The white and yellow arrows indicate the north and south coastal mountains.
Figure 1.
The Middle East climate regions and topography. (a) The climate zone divisions; and (b) topography. The white and yellow arrows indicate the north and south coastal mountains.

Figure 2.
The locations of the four regions (I, II, III, IV) for precipitation statistics in Syria.

Figure 3.
Surface temperature and precipitation in the four regions of Syria for 1979–2016. (a) Temperature, (unit: °C); and (b) precipitation (unit: mm).
Figure 3.
Surface temperature and precipitation in the four regions of Syria for 1979–2016. (a) Temperature, (unit: °C); and (b) precipitation (unit: mm).

Figure 4.
Typical circulations at 200 and 500 hPa during rainfall days (200 hPa: (a) 20161214, (b) 20131230, (c) 20150111, (d) 20131204; 500 hPa: (e) 20161214, (f) 20131230, (g) 20150111, (h) 20131204). The region shaded yellow is Syria. The red line indicates the contour of temperature (unit: °C) and the black line indicates the contour of geopotential height (unit gpm).

Figure 5.
Circulations during strong precipitation days at 850 hPa ((a) 20161214, (b) 20131204, (c) 20031215) and 1000 hPa (d) 20161214, (e) 20131204, (f) 20031215). The black arrows indicate the direction of the warm front movement. The red line indicates the contour of temperature (unit: °C) and the black line indicates the contour of geopotential height (unit gpm). The black vectors in Figure 5d–f indicate the direction of the dry, warm front movement.

Figure 6.
Vertical cross-section of relative humidity (unit: %) along 36° N and 34° N on strong rainfall days: 20161214 ((a) 34° N, (b) 36° N), 20131204 ((c) 34° N, (d) 36° N), 20150111 ((e) 34° N, (f) 36° N).
Figure 6.
Vertical cross-section of relative humidity (unit: %) along 36° N and 34° N on strong rainfall days: 20161214 ((a) 34° N, (b) 36° N), 20131204 ((c) 34° N, (d) 36° N), 20150111 ((e) 34° N, (f) 36° N).

Figure 7.
Vertical cross-section of vertical velocity (unit: 10−3 Pa/s) during two strong rainfall days along 34–36° N ((a) 20161214 strong case, (b) 20150111 weak case).
Figure 7.
Vertical cross-section of vertical velocity (unit: 10−3 Pa/s) during two strong rainfall days along 34–36° N ((a) 20161214 strong case, (b) 20150111 weak case).

Figure 8.
Meridional and zonal vertical cross-sections of inertial and baroclinic instability. (a) MPV1 > 0 along longitude; (b) MPV2 < 0 along longitude; (c) MPV1 > 0 along latitude; and (d) MPV2 < 0 along latitude. Longitude: mean of 38° E–42° E, latitude: mean of 34° N–36° N.
Figure 8.
Meridional and zonal vertical cross-sections of inertial and baroclinic instability. (a) MPV1 > 0 along longitude; (b) MPV2 < 0 along longitude; (c) MPV1 > 0 along latitude; and (d) MPV2 < 0 along latitude. Longitude: mean of 38° E–42° E, latitude: mean of 34° N–36° N.

Figure 9.
Correlation between precipitation and influencing factors.

Figure 10.
Daily strong precipitation time series in the wet season of 2002–2016 (December and January).
Figure 10.
Daily strong precipitation time series in the wet season of 2002–2016 (December and January).

Figure 11.
Four decision trees for judging four precipitation grade groups. (a) a decision tree for precipitation ≥ 30 mm, (b) a decision tree for precipitation < 30 mm, (c) a decision tree for precipitation ≥ 19 mm, (d) a decision tree for precipitation < 19 mm.
Figure 11.
Four decision trees for judging four precipitation grade groups. (a) a decision tree for precipitation ≥ 30 mm, (b) a decision tree for precipitation < 30 mm, (c) a decision tree for precipitation ≥ 19 mm, (d) a decision tree for precipitation < 19 mm.


Table 1.
Representative proportion of the basic characteristics of strong rainfall system circulation (%).
Table 1.
Representative proportion of the basic characteristics of strong rainfall system circulation (%).
| Category of Circulation Features | Representative Proportion of Circulation Features in the 16 Strong Rainfall Day Cases | |||
|---|---|---|---|---|
| Circulation at high level (200–500 hPa) | In front part of the westerly trough 81% | A cyclone 6.3% | Behind a westerly trough 6.3% | A Saddle field 6.3% |
| Circulation at the mid-low level (850 hPa) | Closed cyclone 88% | Low-pressure area 12% | -- | -- |
| Surface level (1000 hPa) | Cyclone with warm front 88% | Low-pressure with warm front 12% | -- | -- |
| Wind field at low level (1000 hPa) | Inland cyclone 87% | Coastal cyclone 6.3% | Convergence line 6.3% | |
| Moisture conditions | Higher humidity in the north Humidity center in the middle level 88% | Higher humidity in the south Humidity center in the middle level 12% | -- | -- |
| Vertical rising motion | Convection is active in the east. Extensive thicker layers 94% | Weak convection in the east 6% | -- | -- |
| Heating | Advection larger than latent heating 63% | Advection similar to latent heating; both weak 18% | Advection similar to latent heating; both negative 18% | -- |
Table 2.
Statistical significance of influence factors and their correlation coefficient values at 90% and 95% of confidence.
Table 2.
Statistical significance of influence factors and their correlation coefficient values at 90% and 95% of confidence.
| Correlation | Significance and Coefficient Value of Factors (Statistic Area: within 38.5–41.5° E, 32.5–35.5° N) | ||||||
|---|---|---|---|---|---|---|---|
| 90% confidence level | Difference between east and west of cloud top pressure mean −0.21618 | Difference between SW–NE of cloud fraction 0.20688 | Difference between east and west of cloud top temperatures mean (brightness temperature) −0.23027 | Cloud top pressure means −0.23645 | Difference between east and west of cloud top height mean 0.23403 | Cloud top height mean 0.2180 | 1000 hPa latitude front (warm front): Difference of T (37° N–32° N) −0.22300 |
| 95% confidence level | 850 hPa latitude front (warm front): T (37° N–32° N) −0.31304 | Vertical velocity 38° E–43° E mean 850 hPa + 500 hPa −0.39613 | Cloud fraction mean 0.29734 | Cloud top brightness temperature mean −0.25509 | Vertical velocity 38° E–43° E mean 700 hPa −0.27196 | Relative humidity 38° E–43° E mean 850 hPa + 500 hPa 0.31667 | ------ |
Publisher’s Note: MDPI stays neutral with regard to jurisdictional claims in published maps and institutional affiliations. |
© 2021 by the authors. Licensee MDPI, Basel, Switzerland. This article is an open access article distributed under the terms and conditions of the Creative Commons Attribution (CC BY) license (https://creativecommons.org/licenses/by/4.0/).
Share and Cite
MDPI and ACS Style
Wang, J.; Alakol, N.; Wang, X.; He, D.; Kumar, K.R.; Miao, C. The Strong Precipitation of the Dry Warm Front Cyclone in Syria and Its Prediction by Data Mining Modeling. Atmosphere 2021, 12, 1667. https://doi.org/10.3390/atmos12121667
AMA Style
Wang J, Alakol N, Wang X, He D, Kumar KR, Miao C. The Strong Precipitation of the Dry Warm Front Cyclone in Syria and Its Prediction by Data Mining Modeling. Atmosphere. 2021; 12(12):1667. https://doi.org/10.3390/atmos12121667
Chicago/Turabian StyleWang, Jianhong, Nour Alakol, Xing Wang, Dongpo He, Kanike Raghavendra Kumar, and Chunsheng Miao. 2021. "The Strong Precipitation of the Dry Warm Front Cyclone in Syria and Its Prediction by Data Mining Modeling" Atmosphere 12, no. 12: 1667. https://doi.org/10.3390/atmos12121667
Note that from the first issue of 2016, this journal uses article numbers instead of page numbers. See further details here.