
Urban Effect on Sea-Breeze-Initiated Rainfall: A Case Study for Seoul Metropolitan Area


Department of Astronomy and Atmospheric Sciences, Kyungpook National University, Daegu 41566, Korea
*
Author to whom correspondence should be addressed.
Atmosphere 2021, 12(11), 1483; https://doi.org/10.3390/atmos12111483
Submission received: 30 September 2021
/
Revised: 5 November 2021
/
Accepted: 6 November 2021
/
Published: 9 November 2021
(This article belongs to the Special Issue Influence of Sea Breeze on Urban Meteorology)
Abstract
:We examined the sea-breeze-initiated rainfall in the Seoul Metropolitan area (SMA) on 6 July 2017 using the weather research and forecasting (WRF) model. The model captures the arrival of the sea breeze front (SBF), the development of afternoon rainfall in the SMA, and the location of the sea-breeze-initiated maximum rainfall in the northeastern SMA reasonably well but overestimates the subsequent rainfall. We conducted sensitivity tests to better understand the urban effect on the sea-breeze-initiated rainfall event. Through factor separation analysis, we first examined the explicit role of sea and urban effect on sea-breeze-initiated rainfall. The results show that the interaction of sea and urban effects cause rainfall in the northwest and northeast of the SMA, indicating that both urban heat island circulation (UHIC) and sea breeze play an important role in the study case’s rainfall. We further examined the relative role of urban roughness and anthropogenic heat on the sea-breeze-initiated rainfall through factor separation analysis. Both anthropogenic heat and urban roughness play a role in increasing precipitation in the northeastern area of the SMA, with a larger contribution of anthropogenic heat than urban roughness. The relationship between low-level convergence at the SBF and urban factors is discussed.
1. Introduction
A sea breeze is a local circulation caused by differential heating between sea and land and occurs in all coastal areas around the world. Low-level convergence and updraft motions at the sea breeze front (SBF) develop convective clouds, which sometimes leads to precipitation [1,2,3]. The sea-breeze-initiated rainfall at coastal areas has been investigated in many studies [2,4,5,6]. Baker et al. [2] investigated the influence of soil moisture, coastline curvature, and land breeze circulation on sea-breeze-initiated precipitation in Florida. They showed that soil moisture and coastline curvature have a significant impact on the timing and location of precipitation. Fu et al. [4] investigated the detailed process of deep convection initiation through the collisions of two SBFs and subsequent generation of deep convection using large-eddy simulations. Shepherd et al. [5] investigated the urban impact on coastal precipitation in Houston and found that two urban-induced features, convergence zones, and an urban low-pressure perturbation appear to be important factors leading to enhanced rain clouds in conjunction with the sea breeze. However, the relative contribution of sea breeze and urban effect to rainfall has not been addressed.
Urban characteristics such as large roughness, anthropogenic heat, large heat storage (building, asphalt, etc.), and high Bowen ratio induce changes in temperature, wind, humidity, etc., affecting rainfall in an urban area [7,8]. According to Jauregui and Romales [7], the urban heat island effect is associated with the intensification of rain showers in Mexico City. Shem and Shepherd [8] used a numerical model to investigate the urban effect on rainfall and found that precipitation on the city’s downwind is 10–13% higher in urban simulation than in non-urban simulation. Han and Baik [9] used an analytic solution that is a typical internal gravity wave with low-level upward motion downwind of the heating center to explain precipitation enhancement observed downwind of the urban area. On the other hand, Miao et al. [10] suggested that the urban effect leads to the breaking of the squall line to a convective cell over the urban area, and the change of precipitation amount depends on the degree of urbanization. Most modeling studies have been performed by comparing urban and non-urban simulations. Here, we further isolated which urban factors contribute and to what extent.
The Seoul metropolitan area (SMA), the largest city in Korea, is located 30 km from the Yellow Sea and is influenced by penetrating sea breeze in the late afternoon [11]. The interaction of local winds such as sea breeze, urban breeze, and valley breeze on a clear day in the SMA has been studied by Ryu and Baik [12]. They reported that the sea breeze inland penetration speed slows due to rough roughness at a coastal city, Incheon, but it accelerates at an inland city, Seoul, due to urban heat island circulation (UHIC). However, few studies have been conducted on convective rainfall caused by the interaction of sea breeze and UHIC in the inland city, Seoul.
In this study, we examined the urban effect on sea-breeze-initiated rainfall in the SMA. To this end, we first studied the performance of the weather research and forecasting (WRF) model in simulating a sea-breeze-initiated rainfall event in Seoul and then explored the urban effect on the sea-breeze-initiated rainfall through sensitivity simulations. Factor separation was performed to examine the relative role of sea breeze and urban effect on the rainfall amount and distribution.
2. Materials and Methods
2.1. Model
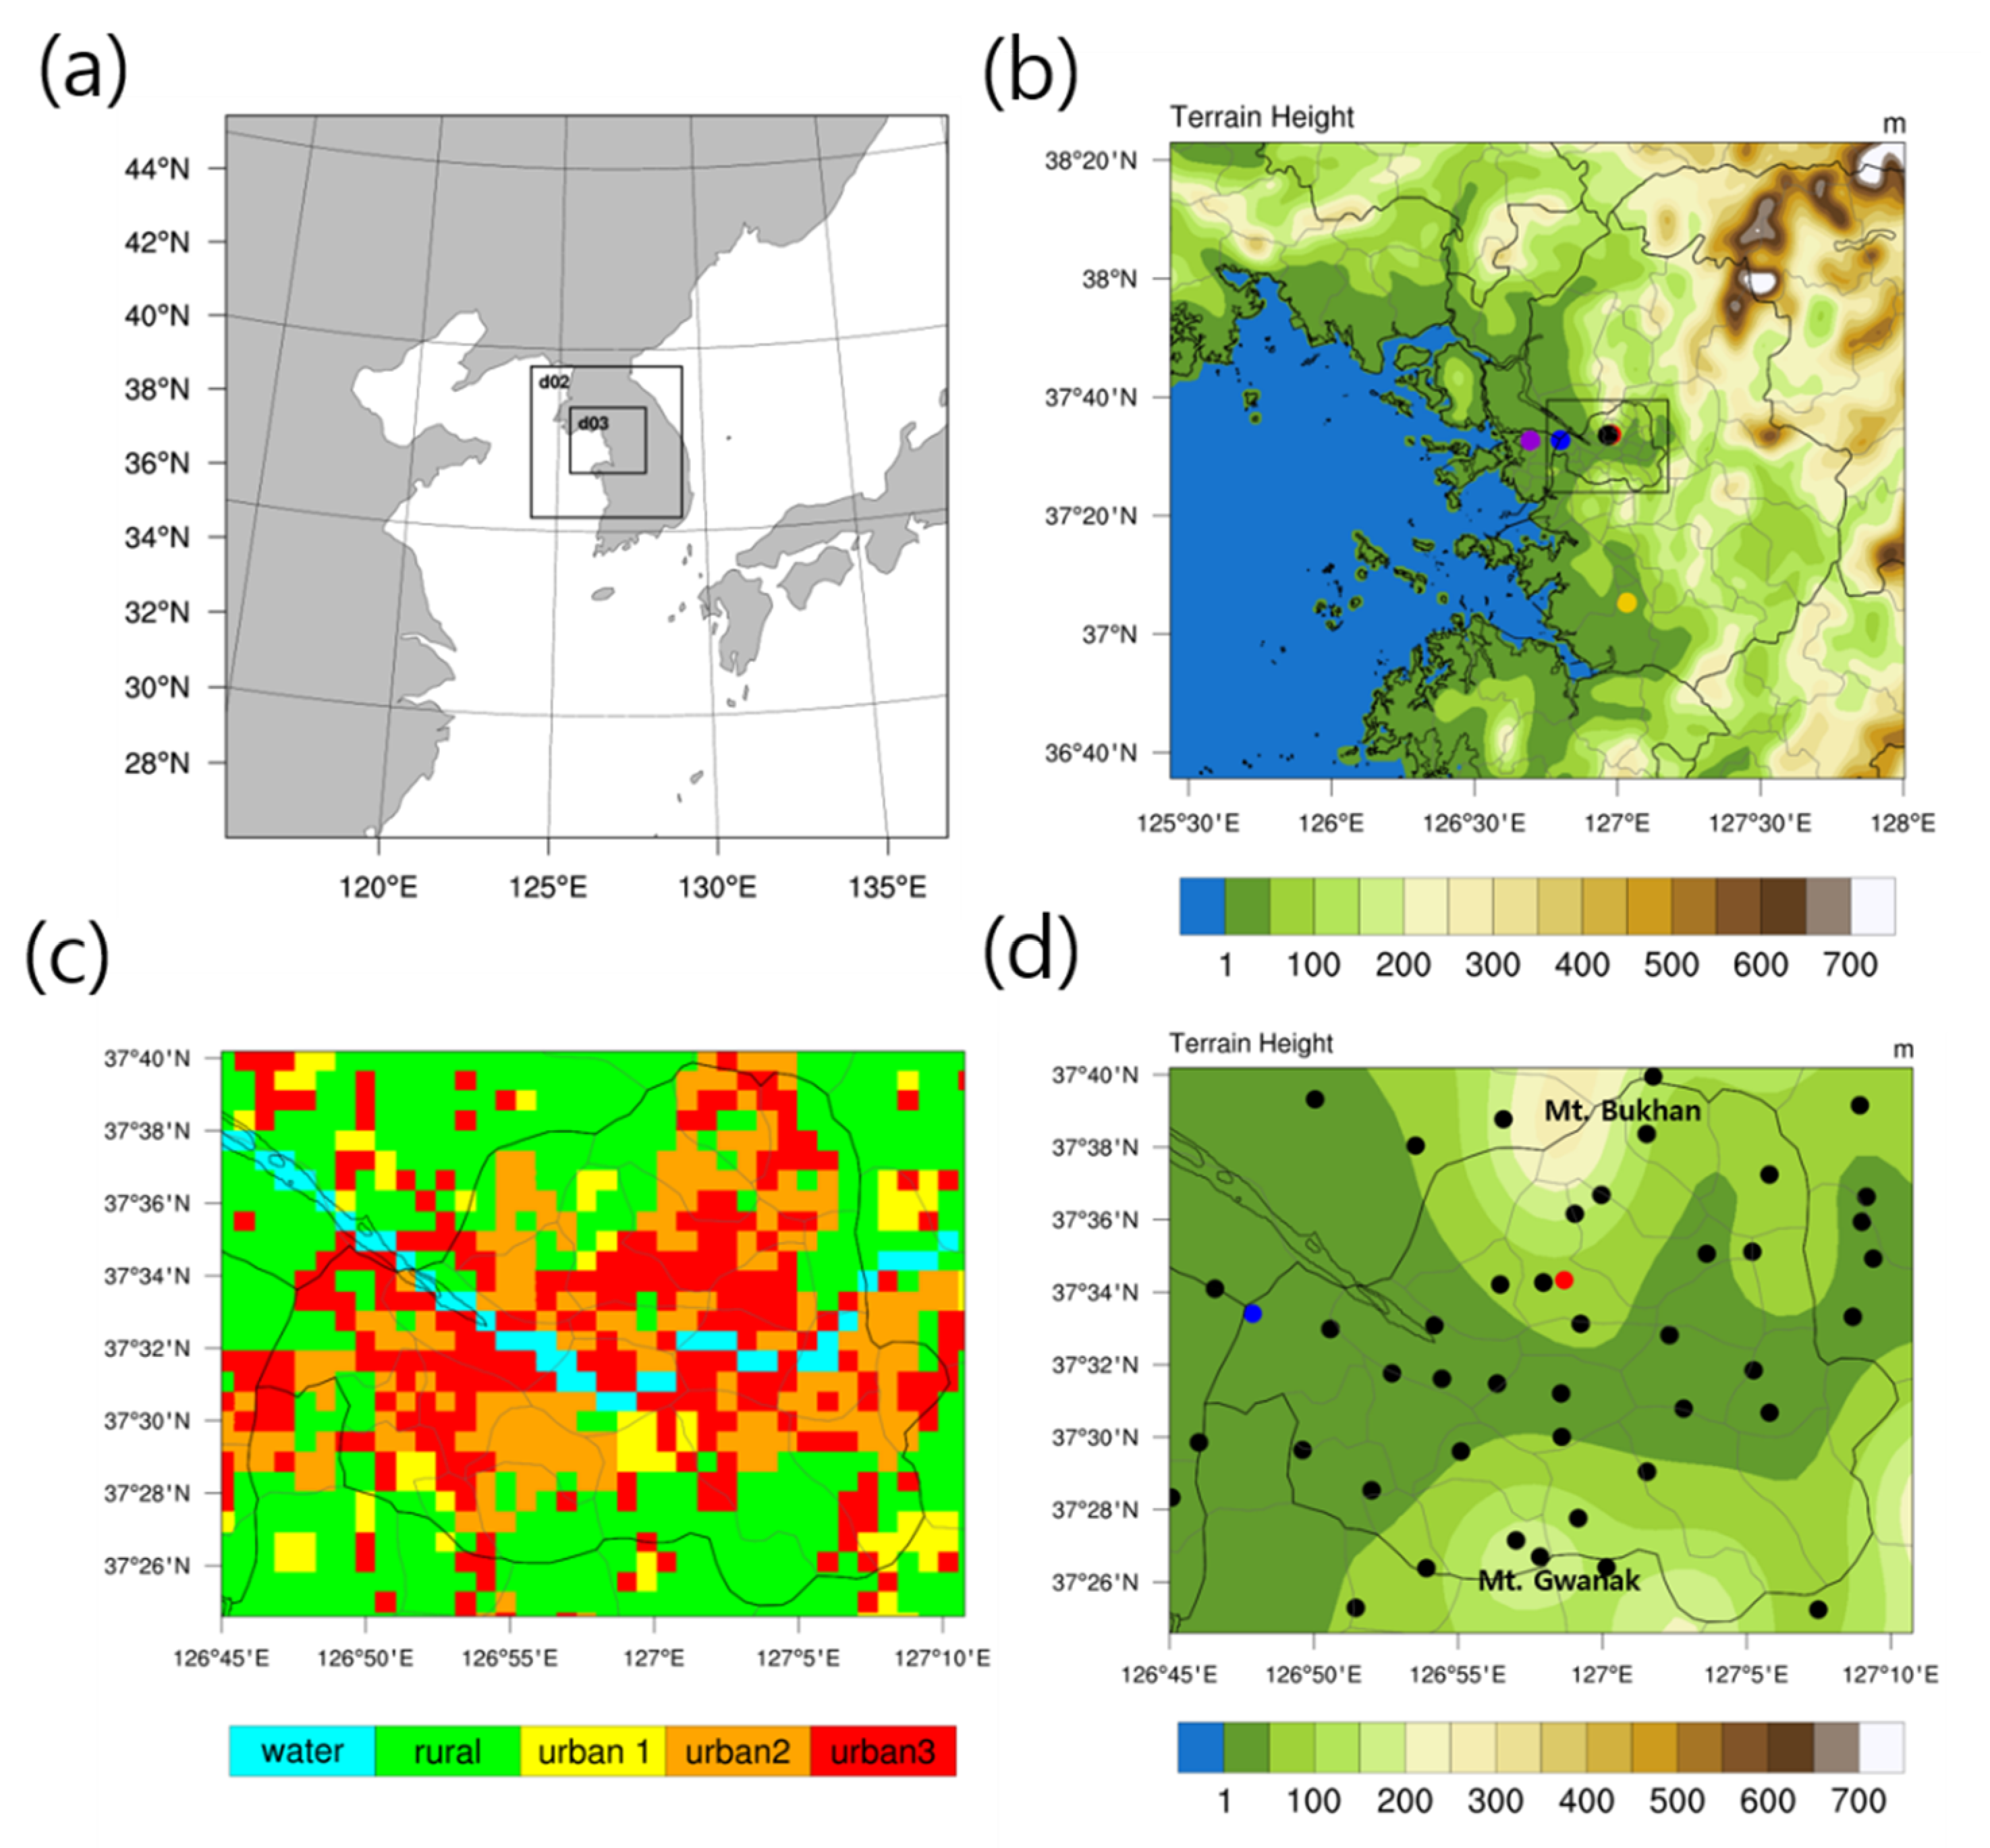
In this study, we used the WRF model 4.0 version [13] developed by the University Corporation for Atmospheric Research/National Center for Atmospheric Research (UCAR/NCAR). The model area was composed of 3 domains with a grid resolution of 9, 3, and 1 km centering on the SMA (Figure 1a). Figure 1b,d show the topographic distribution of domain 3 and the analysis domain (SMA), respectively, and Figure 1c shows the land use distribution in the analysis domain. The number of horizontal grids is 240 × 240 (domain 1), 151 × 151 (domain 2), and 226 × 196 (domain 3), and the nesting method is a two-way interaction. We used 60 vertical layers with the model top at 50 hPa. For the parameterization of cloud microphysics, the Morrison 2-moments scheme [14] was used, and for the planetary boundary layer, the Shin–Hong scale-aware planetary boundary-layer scheme [15] was used. We selected the rapid radiative transfer model (RRTM) [16] for the long-wave radiation process and the Dudhia Shortwave scheme [17] for the shortwave radiation process. The Kain–Fritsch scheme [18] was used in domain 1 but was not applied to domains 2 or 3. We used the Noah land-surface model [19] for non-urban areas and the single-layer urban canopy model (SLUCM) [20] for urban areas. In the urban canopy model, the urban canyon structure, roof, wall, and road heat capacity, as well as anthropogenic sensible and latent heat, were considered to represent the urban geometric structure. In SLUCM, the urban roughness length is formulated as follows [21]:
where h is the building height, d is the displacement height, k is von Karman constant, is the building drag coefficient, is the frontal area of buildings, and is the total area of the building.
We used default urban parameter values in SLUCM; the building height ranges from 5 to 10 m, and the anthropogenic heat ranges from 20 to 90 W m−2. Kwon et al. [22] reported that mean building height at a Seoul site ranges from 10 m for the residential area to 13 m for the commercial area. Lee et al. [23] estimated annual mean anthropogenic heat as 50 W m−2 in Seoul. Therefore, the urban parameter values used in SLUCM are reasonable for use in the SMA. We performed numerical simulations for 30 h from 1200 UTC on 5 July 2017 to 1800 UTC on 6 July 2017.
Table 1 summarizes the experimental design in this study. CNTL is a control simulation. To investigate the effect of urban and sea on sea-breeze-induced rainfall, we performed experiments without sea and urban areas. NOSEA is an experiment in which the Yellow Sea is replaced by irrigated cropland and pasture in domain 2, NOURBAN is an experiment in which an urban area is replaced by irrigated cropland and pasture in domain 3, and NOSEANOURB is an experiment in which both the Yellow Sea and the urban area are replaced by irrigated cropland and pasture. To further investigate the effects of urban parameters such as anthropogenic heat and roughness on precipitation, we designed additional sensitivity experiments by changing anthropogenic heat and roughness. NA is an experiment that does not include anthropogenic heat or anthropogenic latent heat, LB is an experiment with reduced roughness length over an urban area, and NALB is an experiment that does not include anthropogenic heat or anthropogenic latent heat and that has reduced roughness length over an urban area. Table 2 shows the urban parameter values used in the CNTL experiment and three sensitivity experiments. In the reduced roughness experiment, the building height was set as 1 m, and the standard deviation of the roof height was set as 0.2 m in all urban types.
2.2. Data
In this study, we used precipitation data from automated weather station (AWS) and automated synoptic observing system (ASOS) in the SMA (Figure 1d) to compare the simulated rainfall. The surface wind data at three stations (Gongchondong: 37°33′18″ N, 126°41′26″ E, Gimpo airport: 37°34′6″ N, 126°46′32″ E, Seoul: 37°34′17″ N, 126°57′57″ E), which are located at similar latitude (Figure 1b), were also used to detect the passage of the SBF. The wind profiles were measured using a Doppler wind lidar (Windcube-200, Leosphere) at Gwanghwamun station (37°34′21″ N, 126°58′40″ E) [24]. The wind data were obtained from 100 m above ground level (a.g.l.) at a 10 min interval with a vertical interval of 50 m to several kilometers. In this study, we used the wind data below 2 km a.g.l. Measurements of wind, air temperature, and vapor pressure were also obtained from the 7 m tower at Gwanghwamun station.
For the initial and boundary condition of the WRF model, we used the Global Data Assimilation System (GDAS) FNL data with a resolution of 0.25° provided by the National Centers for Environmental Prediction/National Centers for Atmospheric Research (NCEP/NCAR). For the land cover data, 30-arc second data [25] were used in domains 1 and 2, and 3-arc second data for the SMA [26] were used in domain 3. For topography data, the USGS 30-arc second data were used for domains 1 and 2 and the Shuttle Radar Topography Mission (SRTM) 3-arc second data [27] were used for domains 3. For the sea surface temperature (SST), we used the NCEP real-time SST archives with a 0.083° horizontal resolution that are commonly used in WRF simulations.
2.3. Factor Separation
To investigate the effect of sea and urban factors on sea-breeze-initiated rainfall, we used the factor separation method [28]. In sensitivity experiments to consider two factors i and j, each sensitivity simulation result is expressed as the sum of factors given by
where simulation represents the results in which both factor i and j are not considered.
Based on Equations (2)–(4), each factor can be calculated as a linear combination of sensitivity simulations. We first performed factor separation for urban effect () and sea (). To examine the urban effect further, we performed factor separation for urban roughness () and anthropogenic heat (). Table 3 summarizes the factor separation used in this study.
3. Control Simulation and Observations
3.1. Observational Features of Study Case
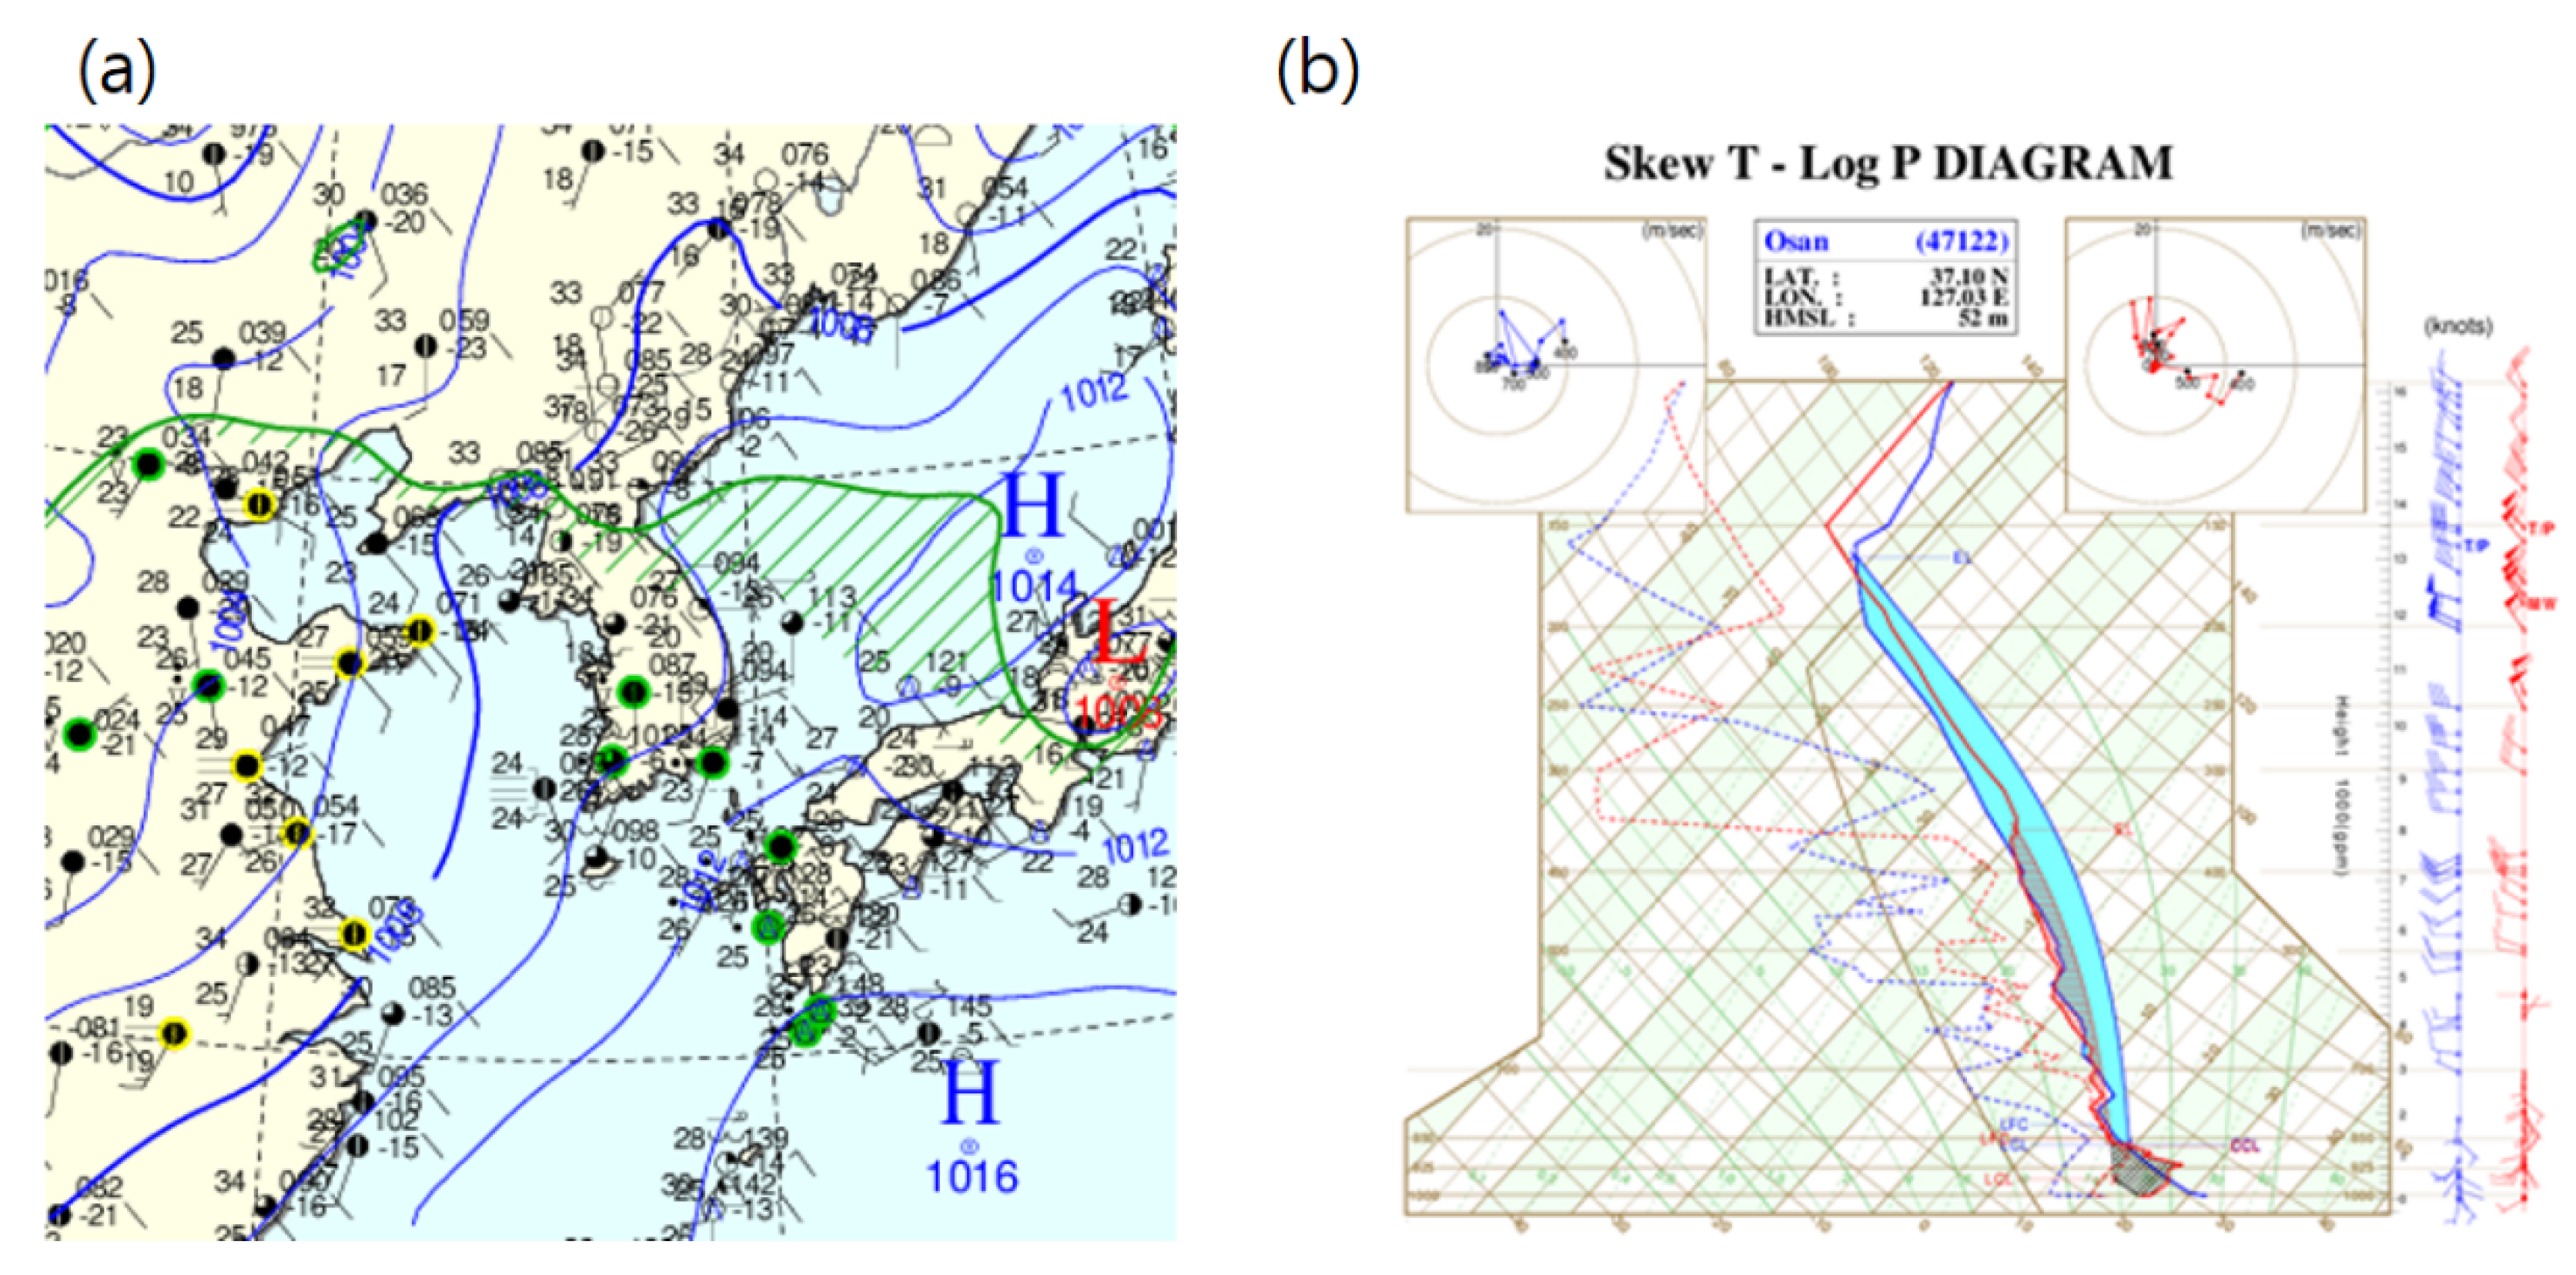
On 6 July 2017, the SMA is located in the western edge of the North Pacific High, and hot and humid air flows into the SMA along the edge of the High (Figure 2a), which leads to large convective available potential energy (CAPE). CAPE is often used to indicate the likelihood of convective rainfall. On this day, CAPE at 1500 LST is 1979 m2 s−2 at Osan station (37°6′ N, 127°2′ E), which is the closest sounding station to the SMA (Figure 2b). The colored area in Figure 2b represents CAPE. After the afternoon rainfall event, CAPE decreases 439 m2 s−2 at 2100 LST. Furthermore, a weak southeasterly flow of 2 at 850 hPa provides favorable conditions for the development of local wind such as sea breeze. Thus, the thermodynamic conditions of the study case are favorable for the occurrence of sea-breezed-initiated convective rainfall.
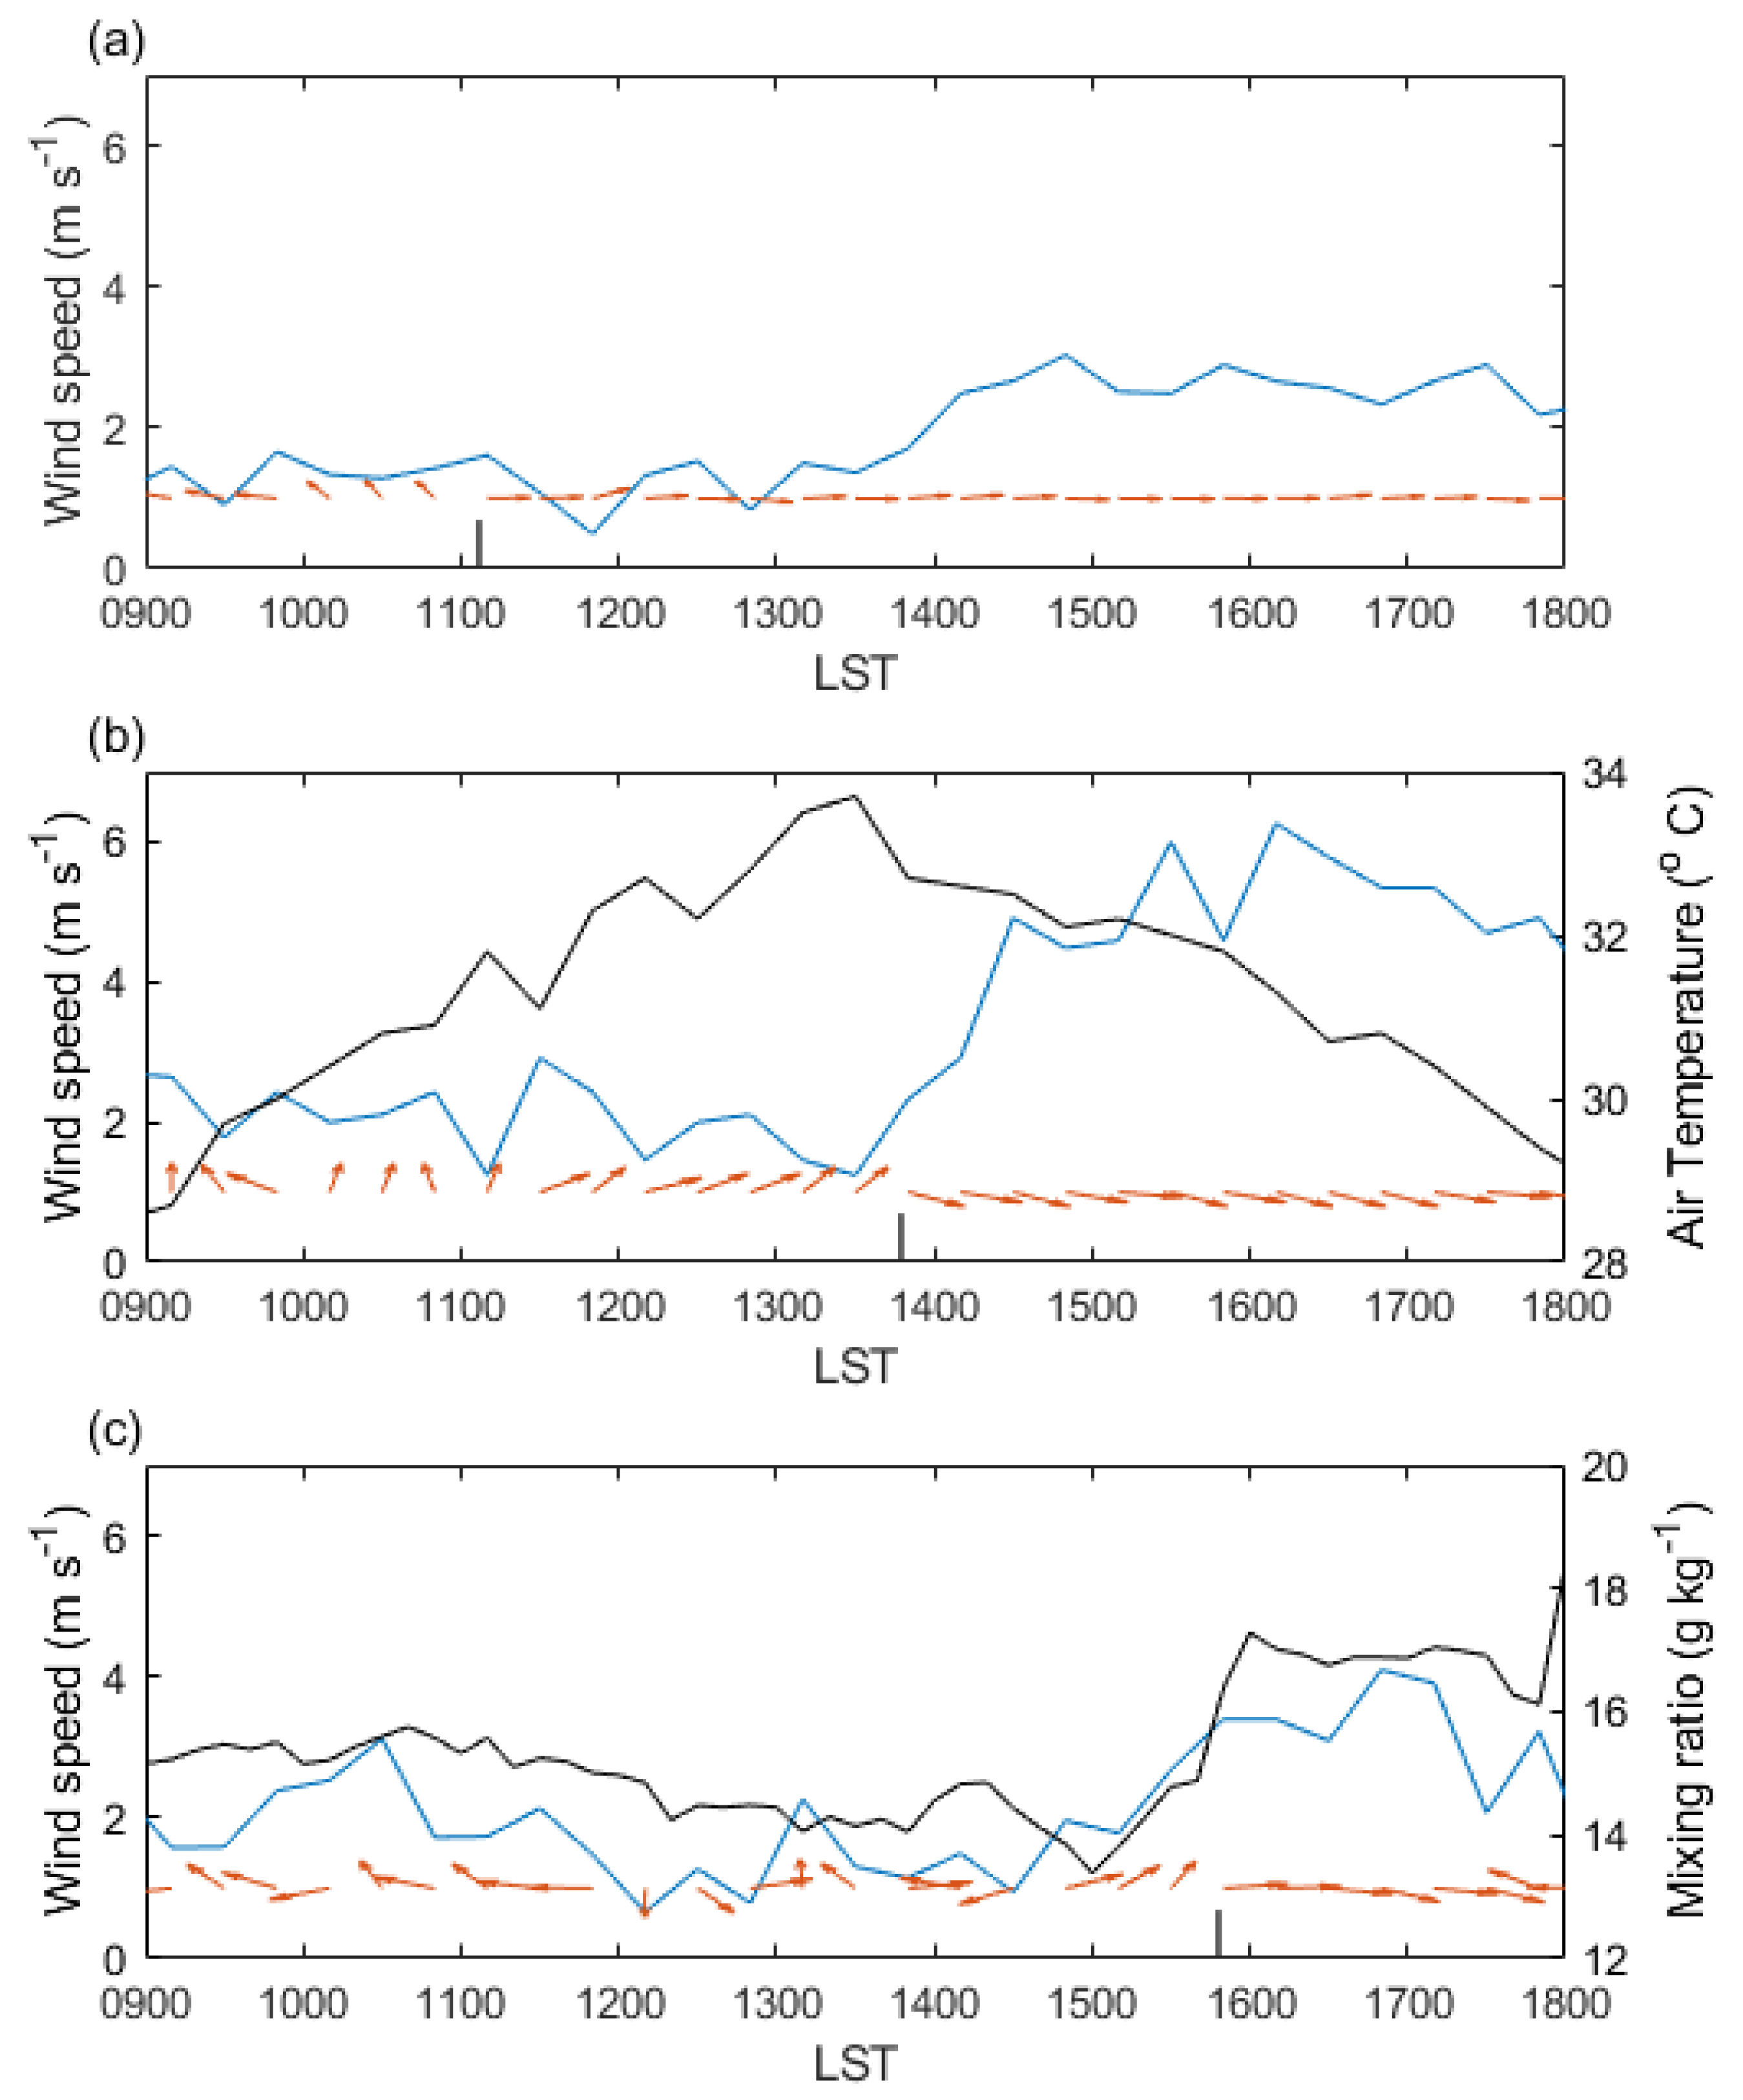
To identify the occurrence and inland penetration of sea breeze in the study case, we examined the time series of wind vectors at three stations: Gongchondong, Gimpo Airport, and Seoul on 6 July 2017 (Figure 3). The west coastline is parallel to the north–south direction (Figure 2a), and hence the sea breeze component is given by the westerly wind component [29]. The arrival of the sea breeze is easily identified as the onset of westerly flow with duration at Gongchongdong station. On the other hand, winds at the other two stations are also influenced by UHIC in the same direction as the sea breeze. To detect the SBF at the two stations, we considered an increase in wind speed. Additionally, we also checked the decrease in air temperature at Gimpo Airport station and a significant increase in the mixing ratio at Seoul station. In Figure 3, we used a black vertical line to indicate the arrival of the SBF. The onset of sea breeze occurred at 1110 LST at Gongchondong station, which is the closest to the west coast, and continued until 1800 LST. The SBF arrived at Gimpo Airport station at 1350 LST. At the Seoul station, the SBF arrived at 1550 LST, accompanied by an abrupt increase in mixing ratio from 14.9 to 16.4 g kg−1. The wind direction at Seoul station changes from westerly to easterly at 1750 LST, which is due to outflow from sea-breeze-initiated rainfall area in the east. Therefore, we confirmed that the sea breeze developed on the west coast, and the SBF arrived at Seoul on the study day.
The rainfall started at 1611 LST at Eunpyeong station in the northwestern edge of the SMA, and then rainfall occurred at 21 stations (50% of stations in analysis domain) between 1700 and 1800 LST. The largest rainfall (56.6 mm h−1) was reported at Dongdaemun station in the northeast of the SMA. This case is chosen as a study case because relatively large rainfall occurred in a wide area of the SMA on a sea breeze day.
3.2. Comparison of Simulation with Observation
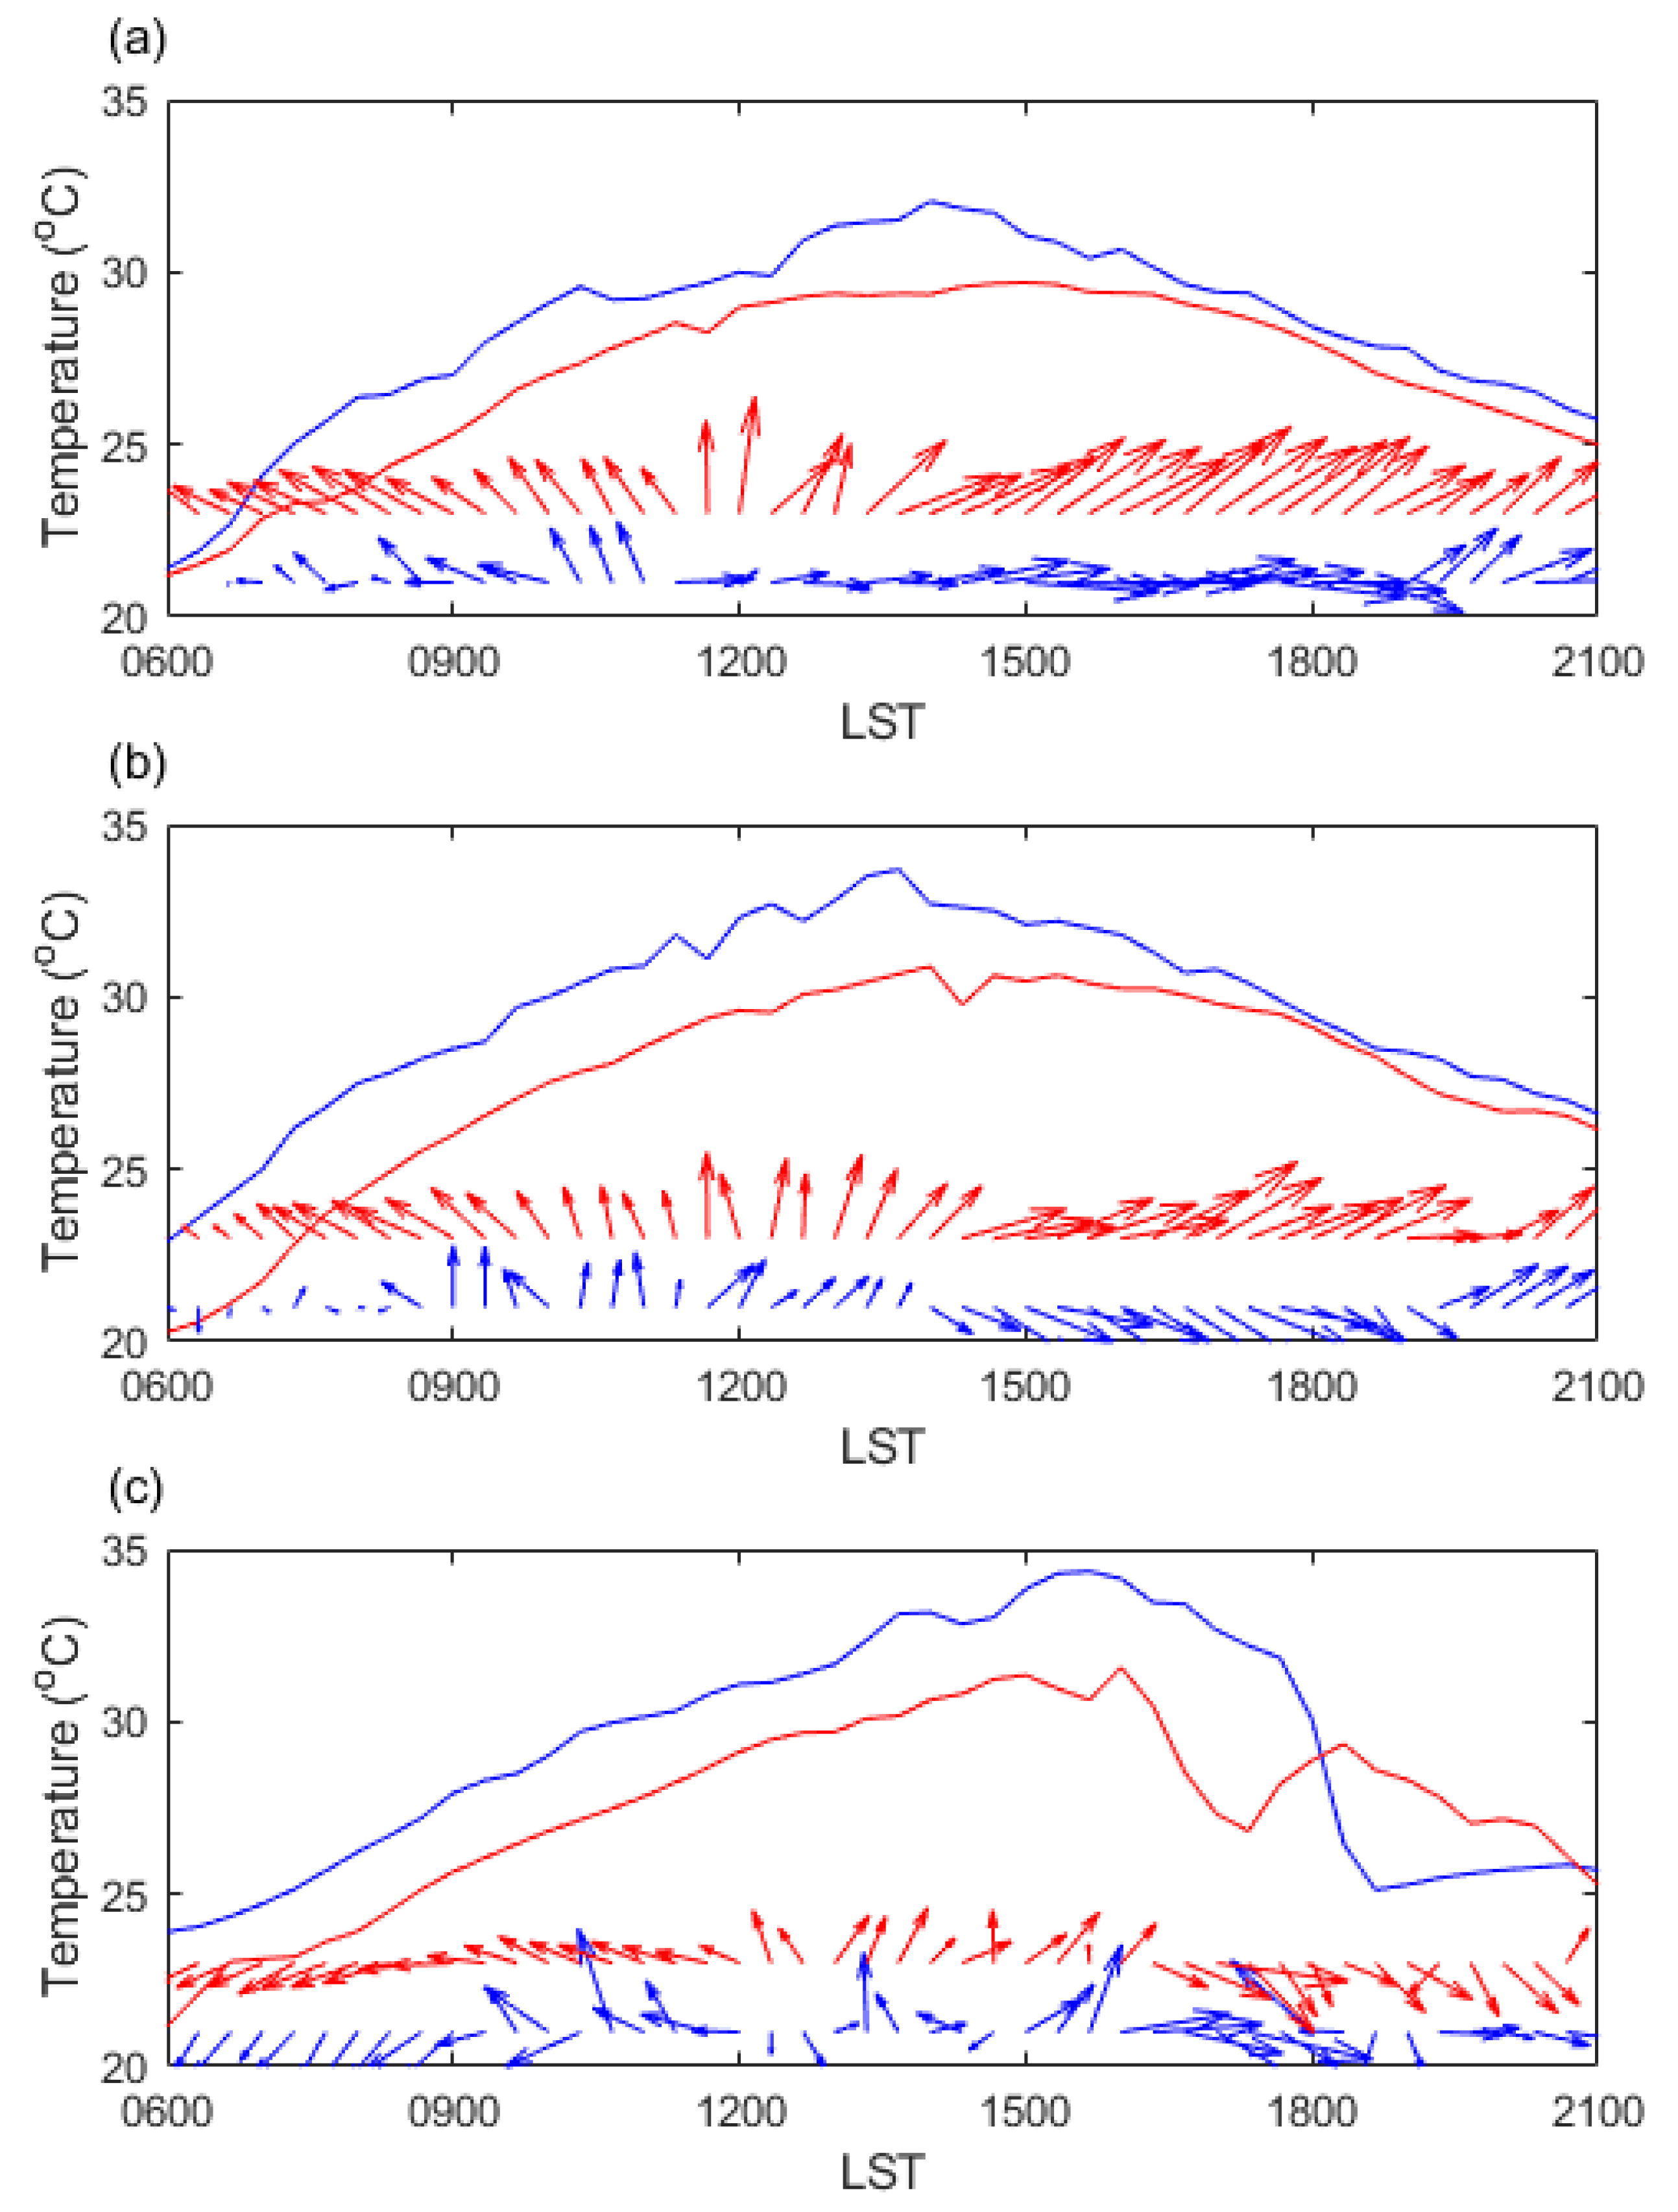
The sea-breeze-initiated rainfall amount depends on the sea breeze depth and intensity that determines the low-level convergence at the SBF. To examine model performance in simulating sea-breeze-initiated rainfall, we first compared the simulated sea breeze with observation. Figure 4 compares 10 m wind and 2 m air temperature at three surface stations (Gongchondong, Gimpo Airport, and Seoul) between CNTL and observation. The model underestimates air temperature, particularly at urban stations. After the arrival of the SBF, air temperature bias is reduced except for Seoul station, where sea-breeze-induced rainfall occurred and contributed to cooling. The model captures the temporal variation of wind vector reasonably at three stations but shows a difference in sea breeze direction by around 30° compared to observation. Before the arrival of the SBF, southwesterly flows appear at Gimpo Airport and Seoul station in both CNTL and observation. The SMA is warmer than the surroundings, leading to urban breezes toward the city center. The observed southwesterly urban breeze appears later at Seoul station than Gimpo Airport station at the western edge of the city. Both urban breeze and sea breeze have westerly components.
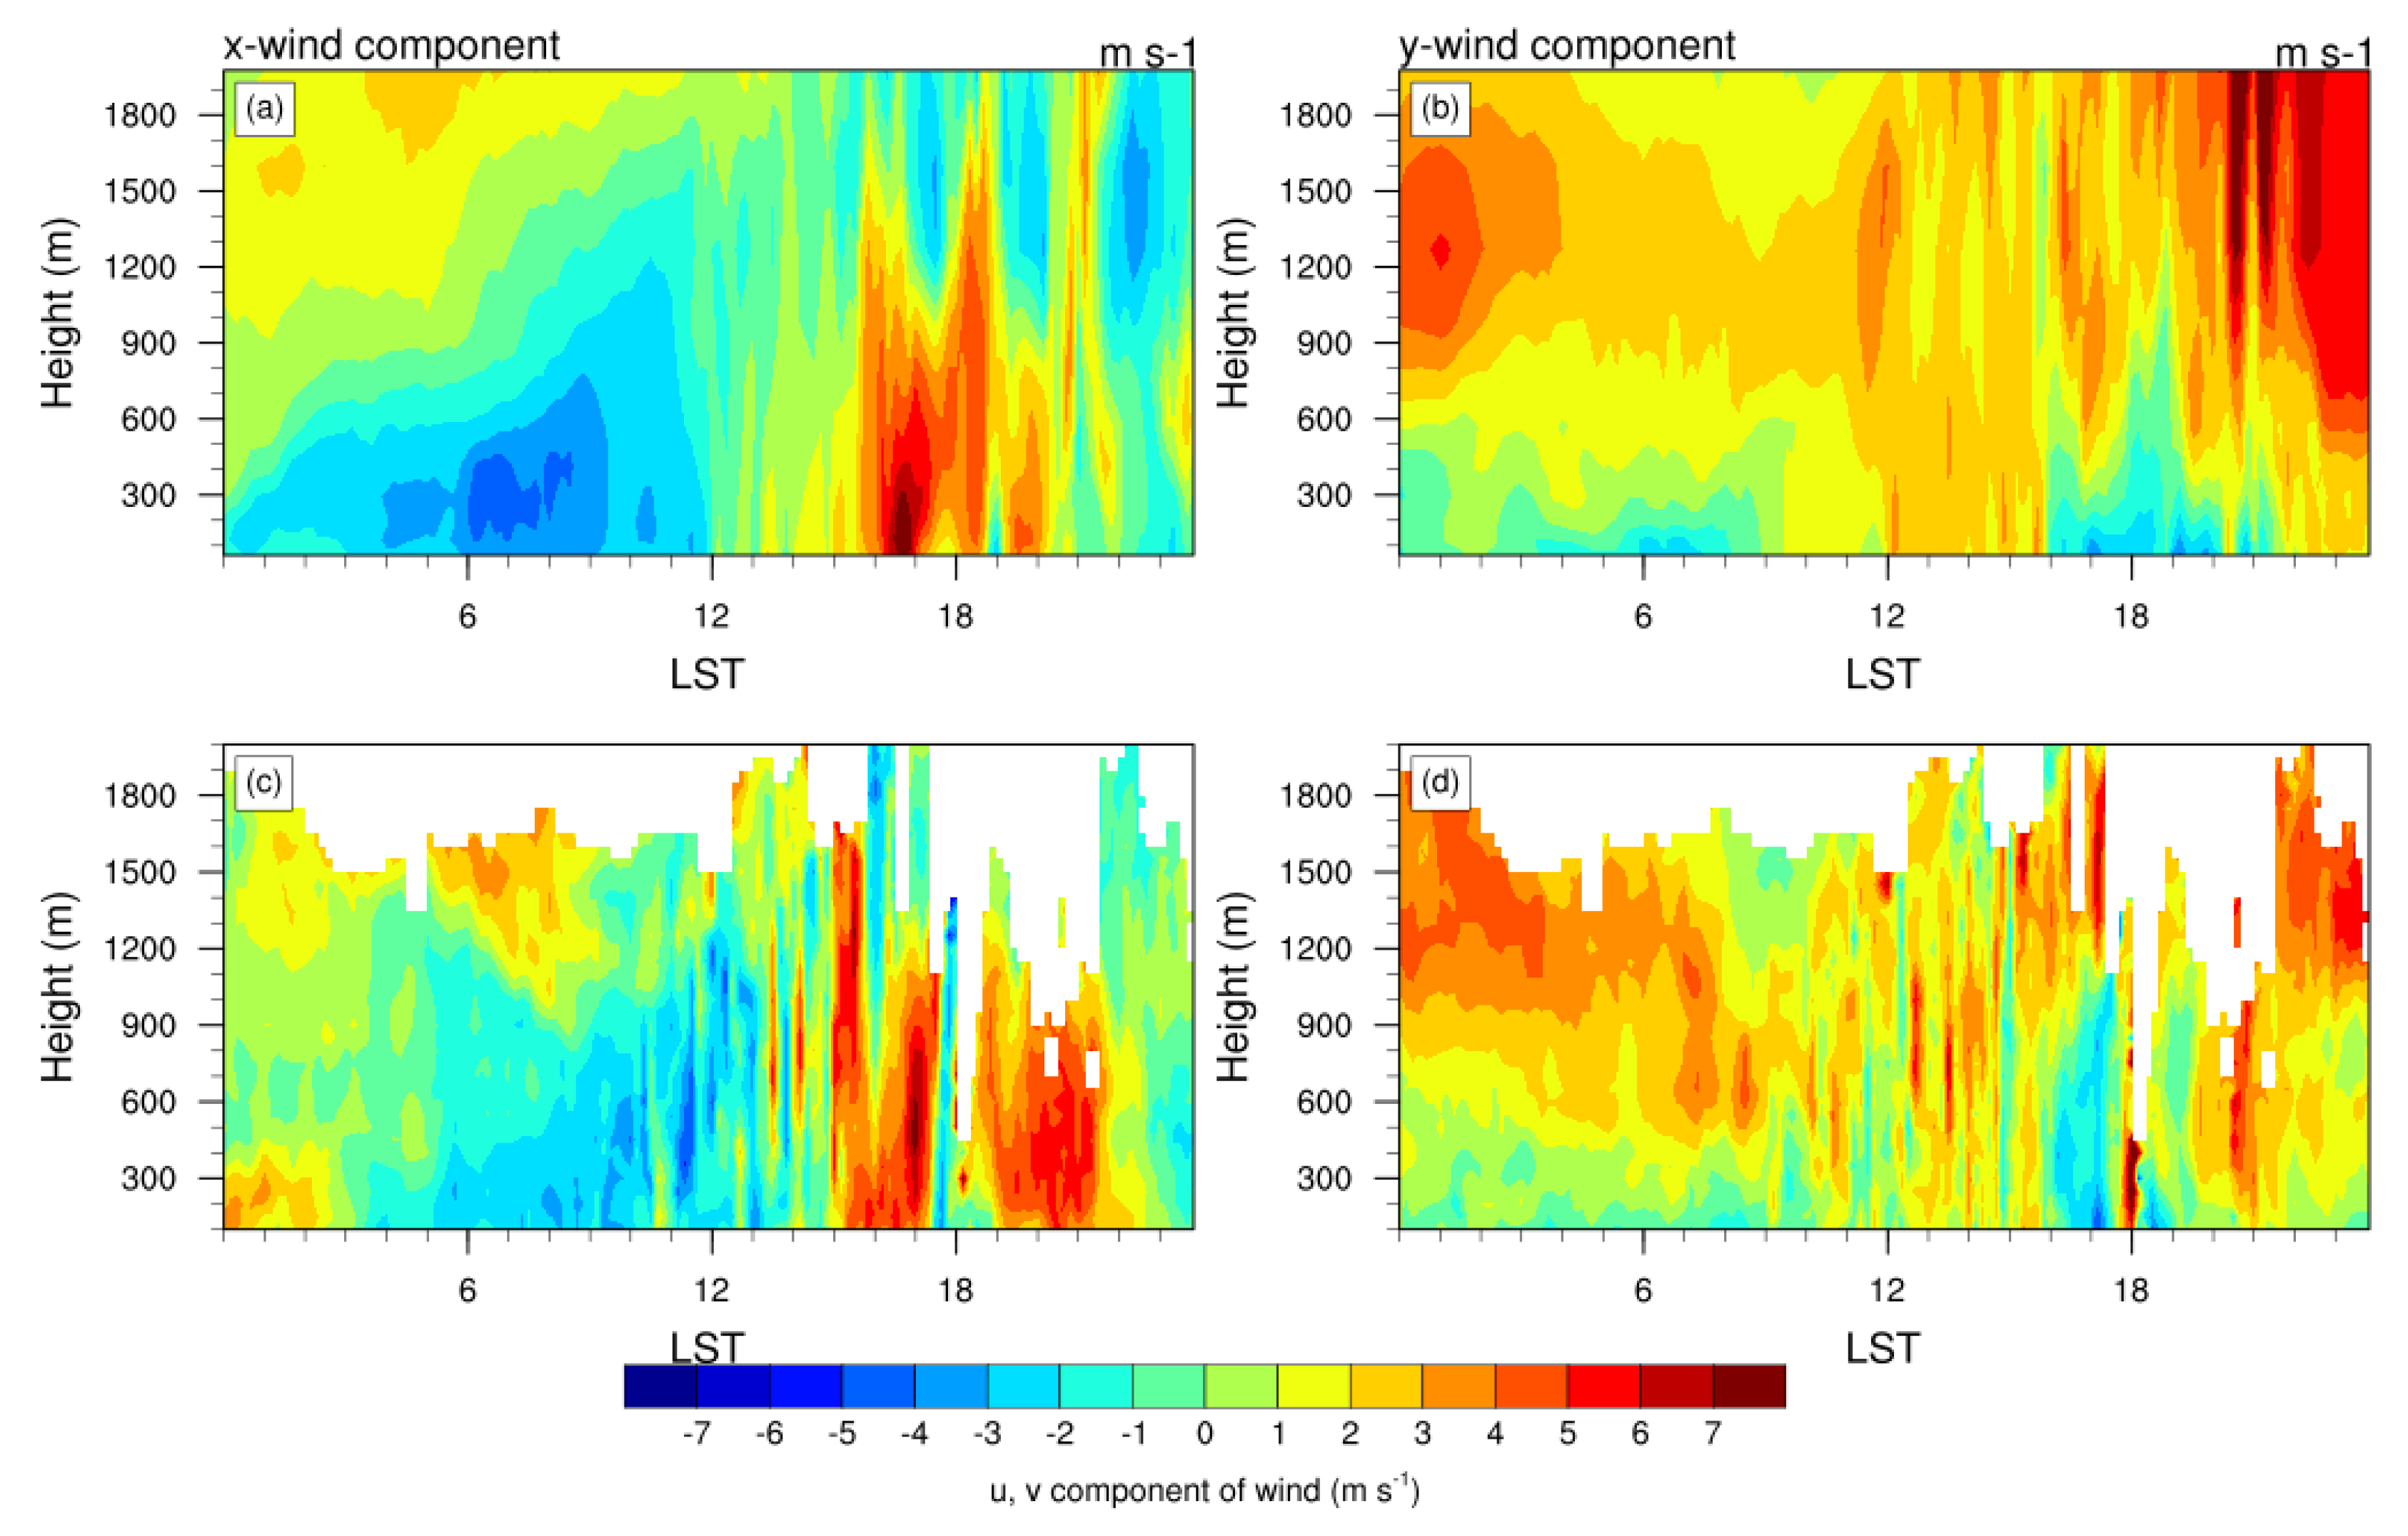
Figure 5 shows the time–height cross-section of u, v-components of wind between CNTL simulation and the observation obtained from wind lidar at the Gwanghwamun station in the SMA. The model captures the general pattern of u, v-components of wind qualitatively. Before 1200 LST, easterly flow is shown below 900 m. At 1510 LST, there is a sudden increase in westerly flow intensity, with a vertical extent of 1700 m a.g.l. in observation. Surface observations at Gwanghwamun station show an abrupt increase in vapor pressure and a decrease in air temperature between 1530 and 1600 LST, indicating the arrival of the SBF during this period. In the simulation, a sudden increase in westerly flow in the boundary layer occurs at 1540 LST later than in observation, but the low-level mixing ratio (below 570 m) increases from 14.3 to 16.1 g kg−1 between 1530 and 1600 LST, indicating that the model well captures the arrival of the SBF at Gwanghwamun station.
The maximum sea-breeze-initiated rainfall occurred between 1700 and 1800 LST in the northeastern area of the SMA. The Gwnaghwamun station is located in the upwind of the maximum rainfall location. To compare low-level inflow due to sea breeze between model and observation, we calculated depth and intensity of westerly flow at 1700 LST at Gwnaghwamun station. We calculated the depth where the u-component is larger than 2 m s−1 and then the depth-averaged u-component. The depth of westerly wind is 1200 and 760 m, and the depth mean intensity of westerly flow is 4.7 and 5.9 m s−1 in observation and CNTL, respectively. The low-level inflow, the product of depth and intensity, is slightly larger in observation by 25% than in CNTL simulation.
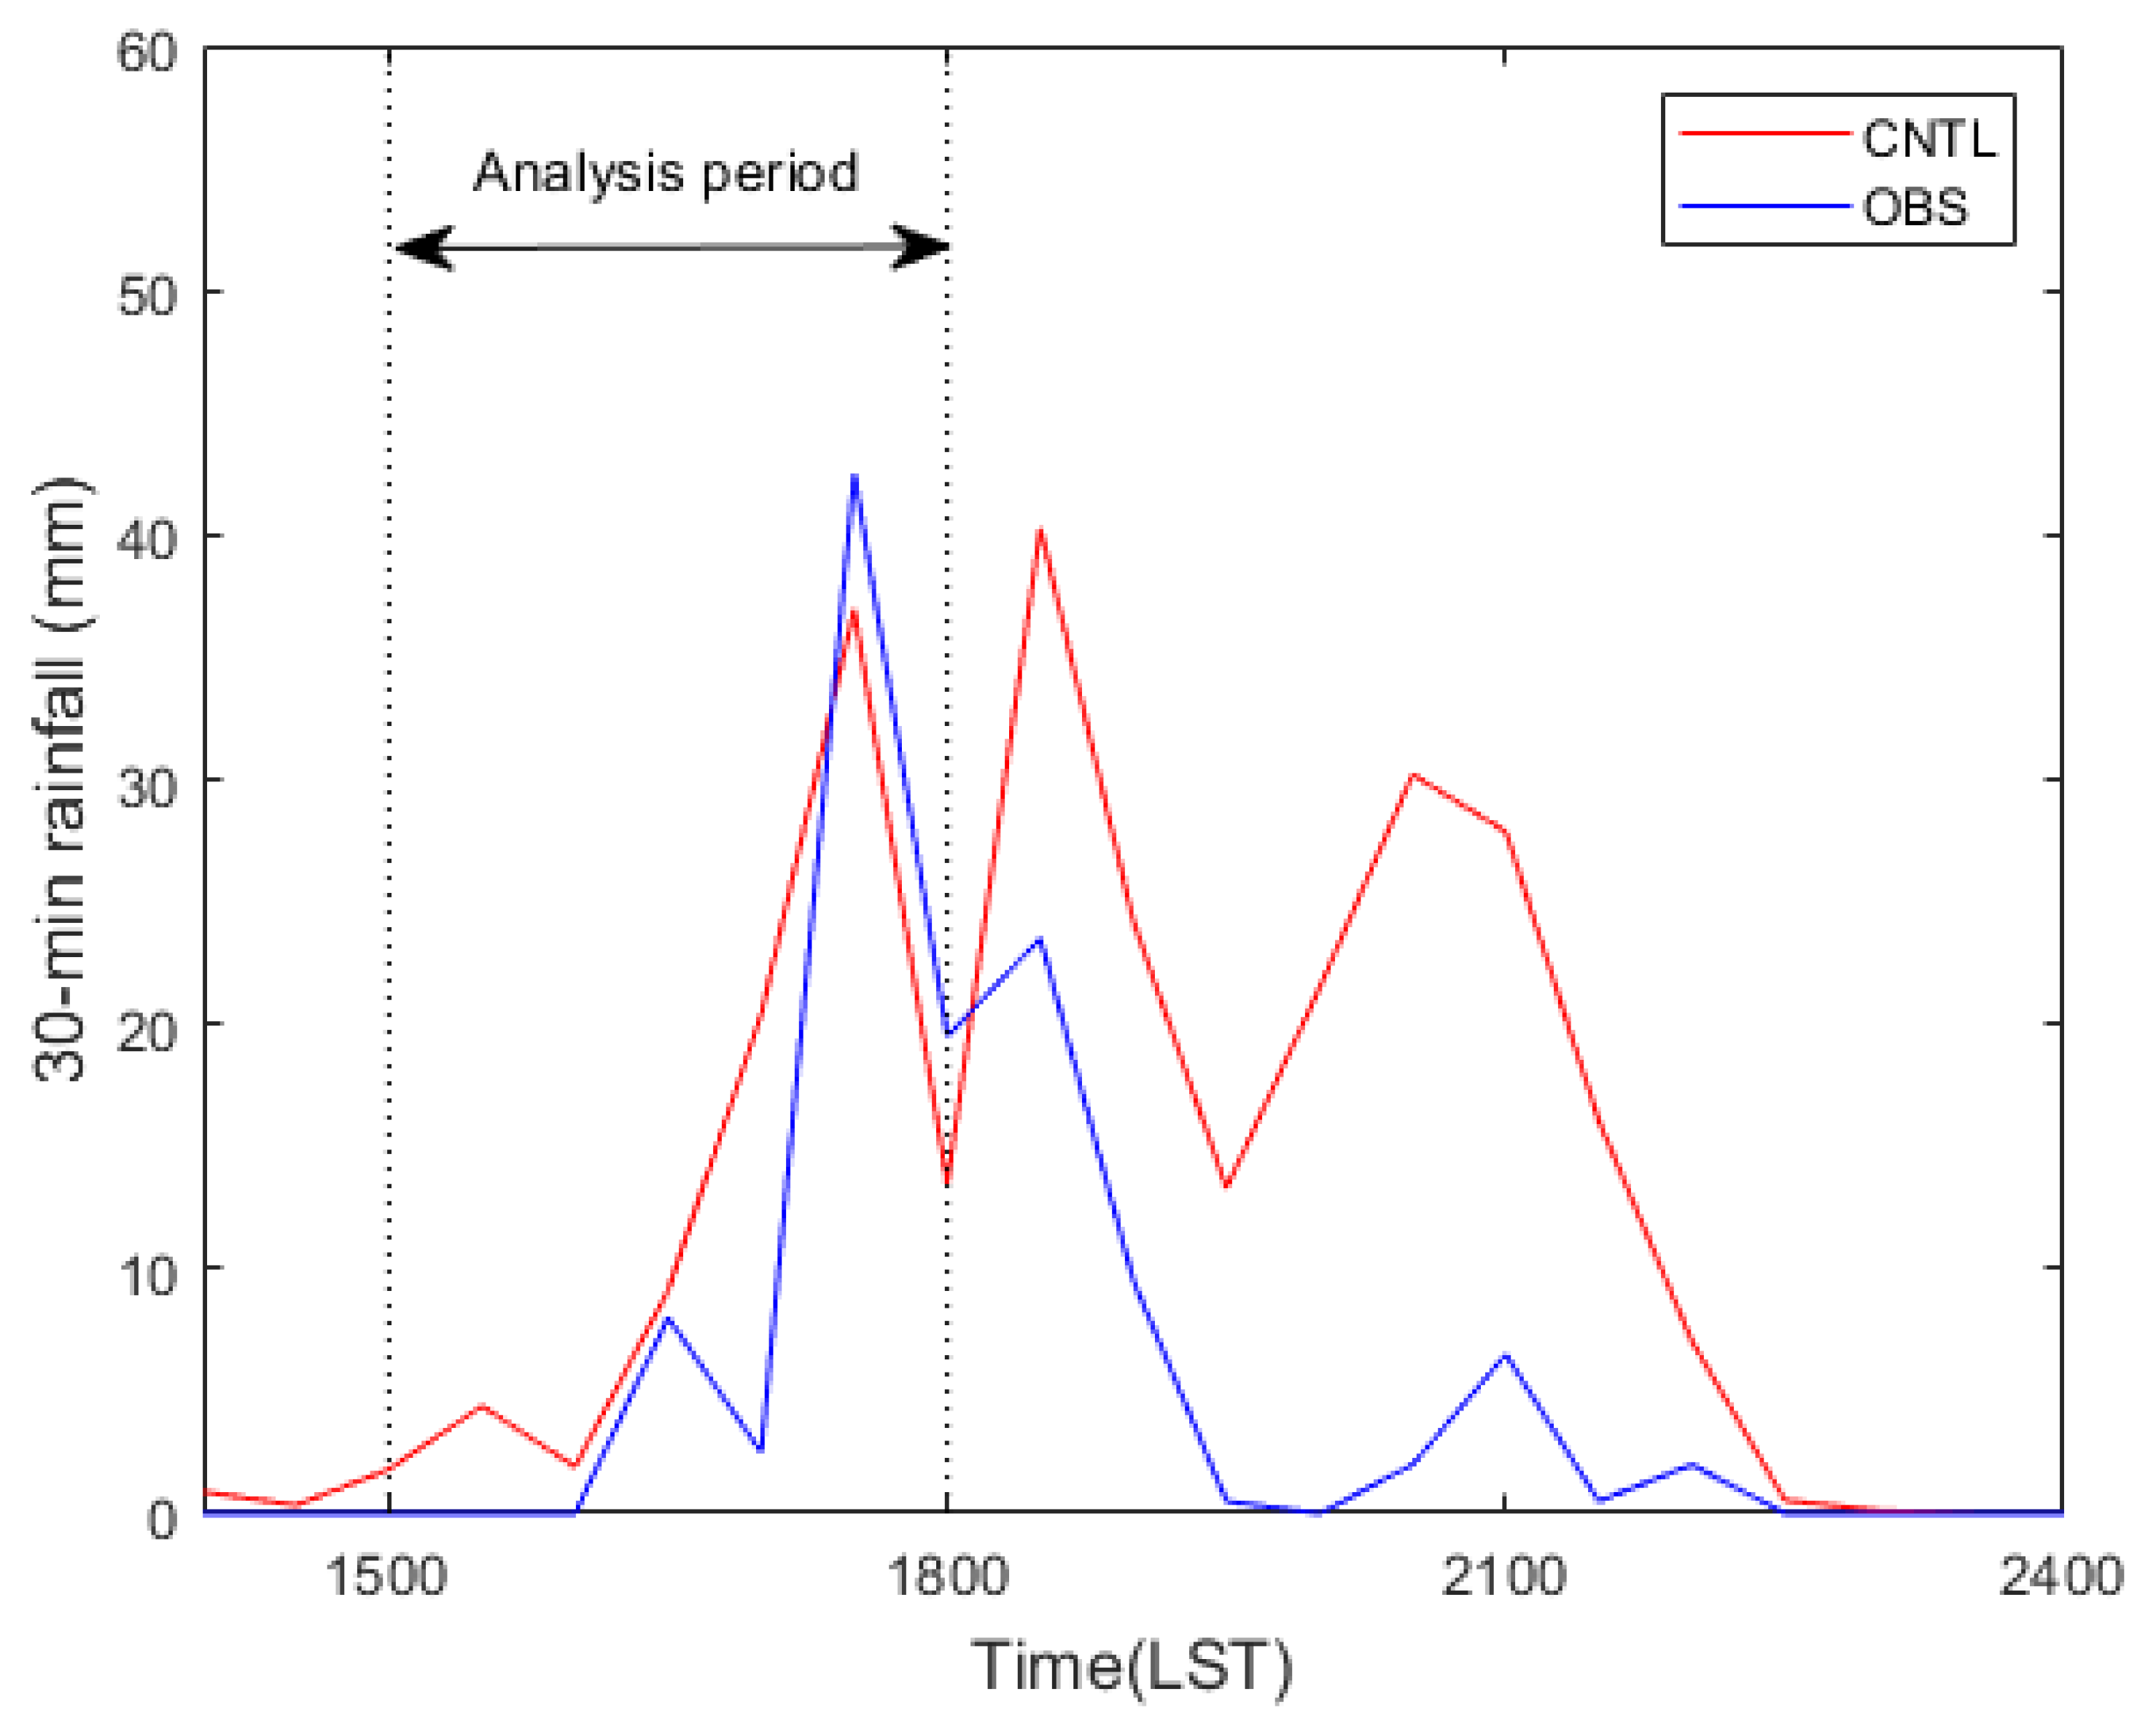
Figure 6 compares the time series of analysis domain maximum rainfall between CNTL and observations. Both CNTL and observation show multiple peaks, indicating that deep convection is accomplished through the development of multiple generations of convection. Each peak represents different convection at different locations in both CNTL and observation. Each convection event has a duration of about 1 h. The first rainfall peak between 1700 and 1800 LST is initiated by the interaction of the SBF and urban breeze, while subsequent peaks are generated at the intersection points of cold pools by the previous generation of convection [4]. The model simulates the magnitude of the first peak of rainfall well but overestimates subsequent rainfall amount. In this study, we are interested in the rainfall produced through the interaction of the SBF and urban breeze and hence focused on the first peak of rainfall before 1800 LST.
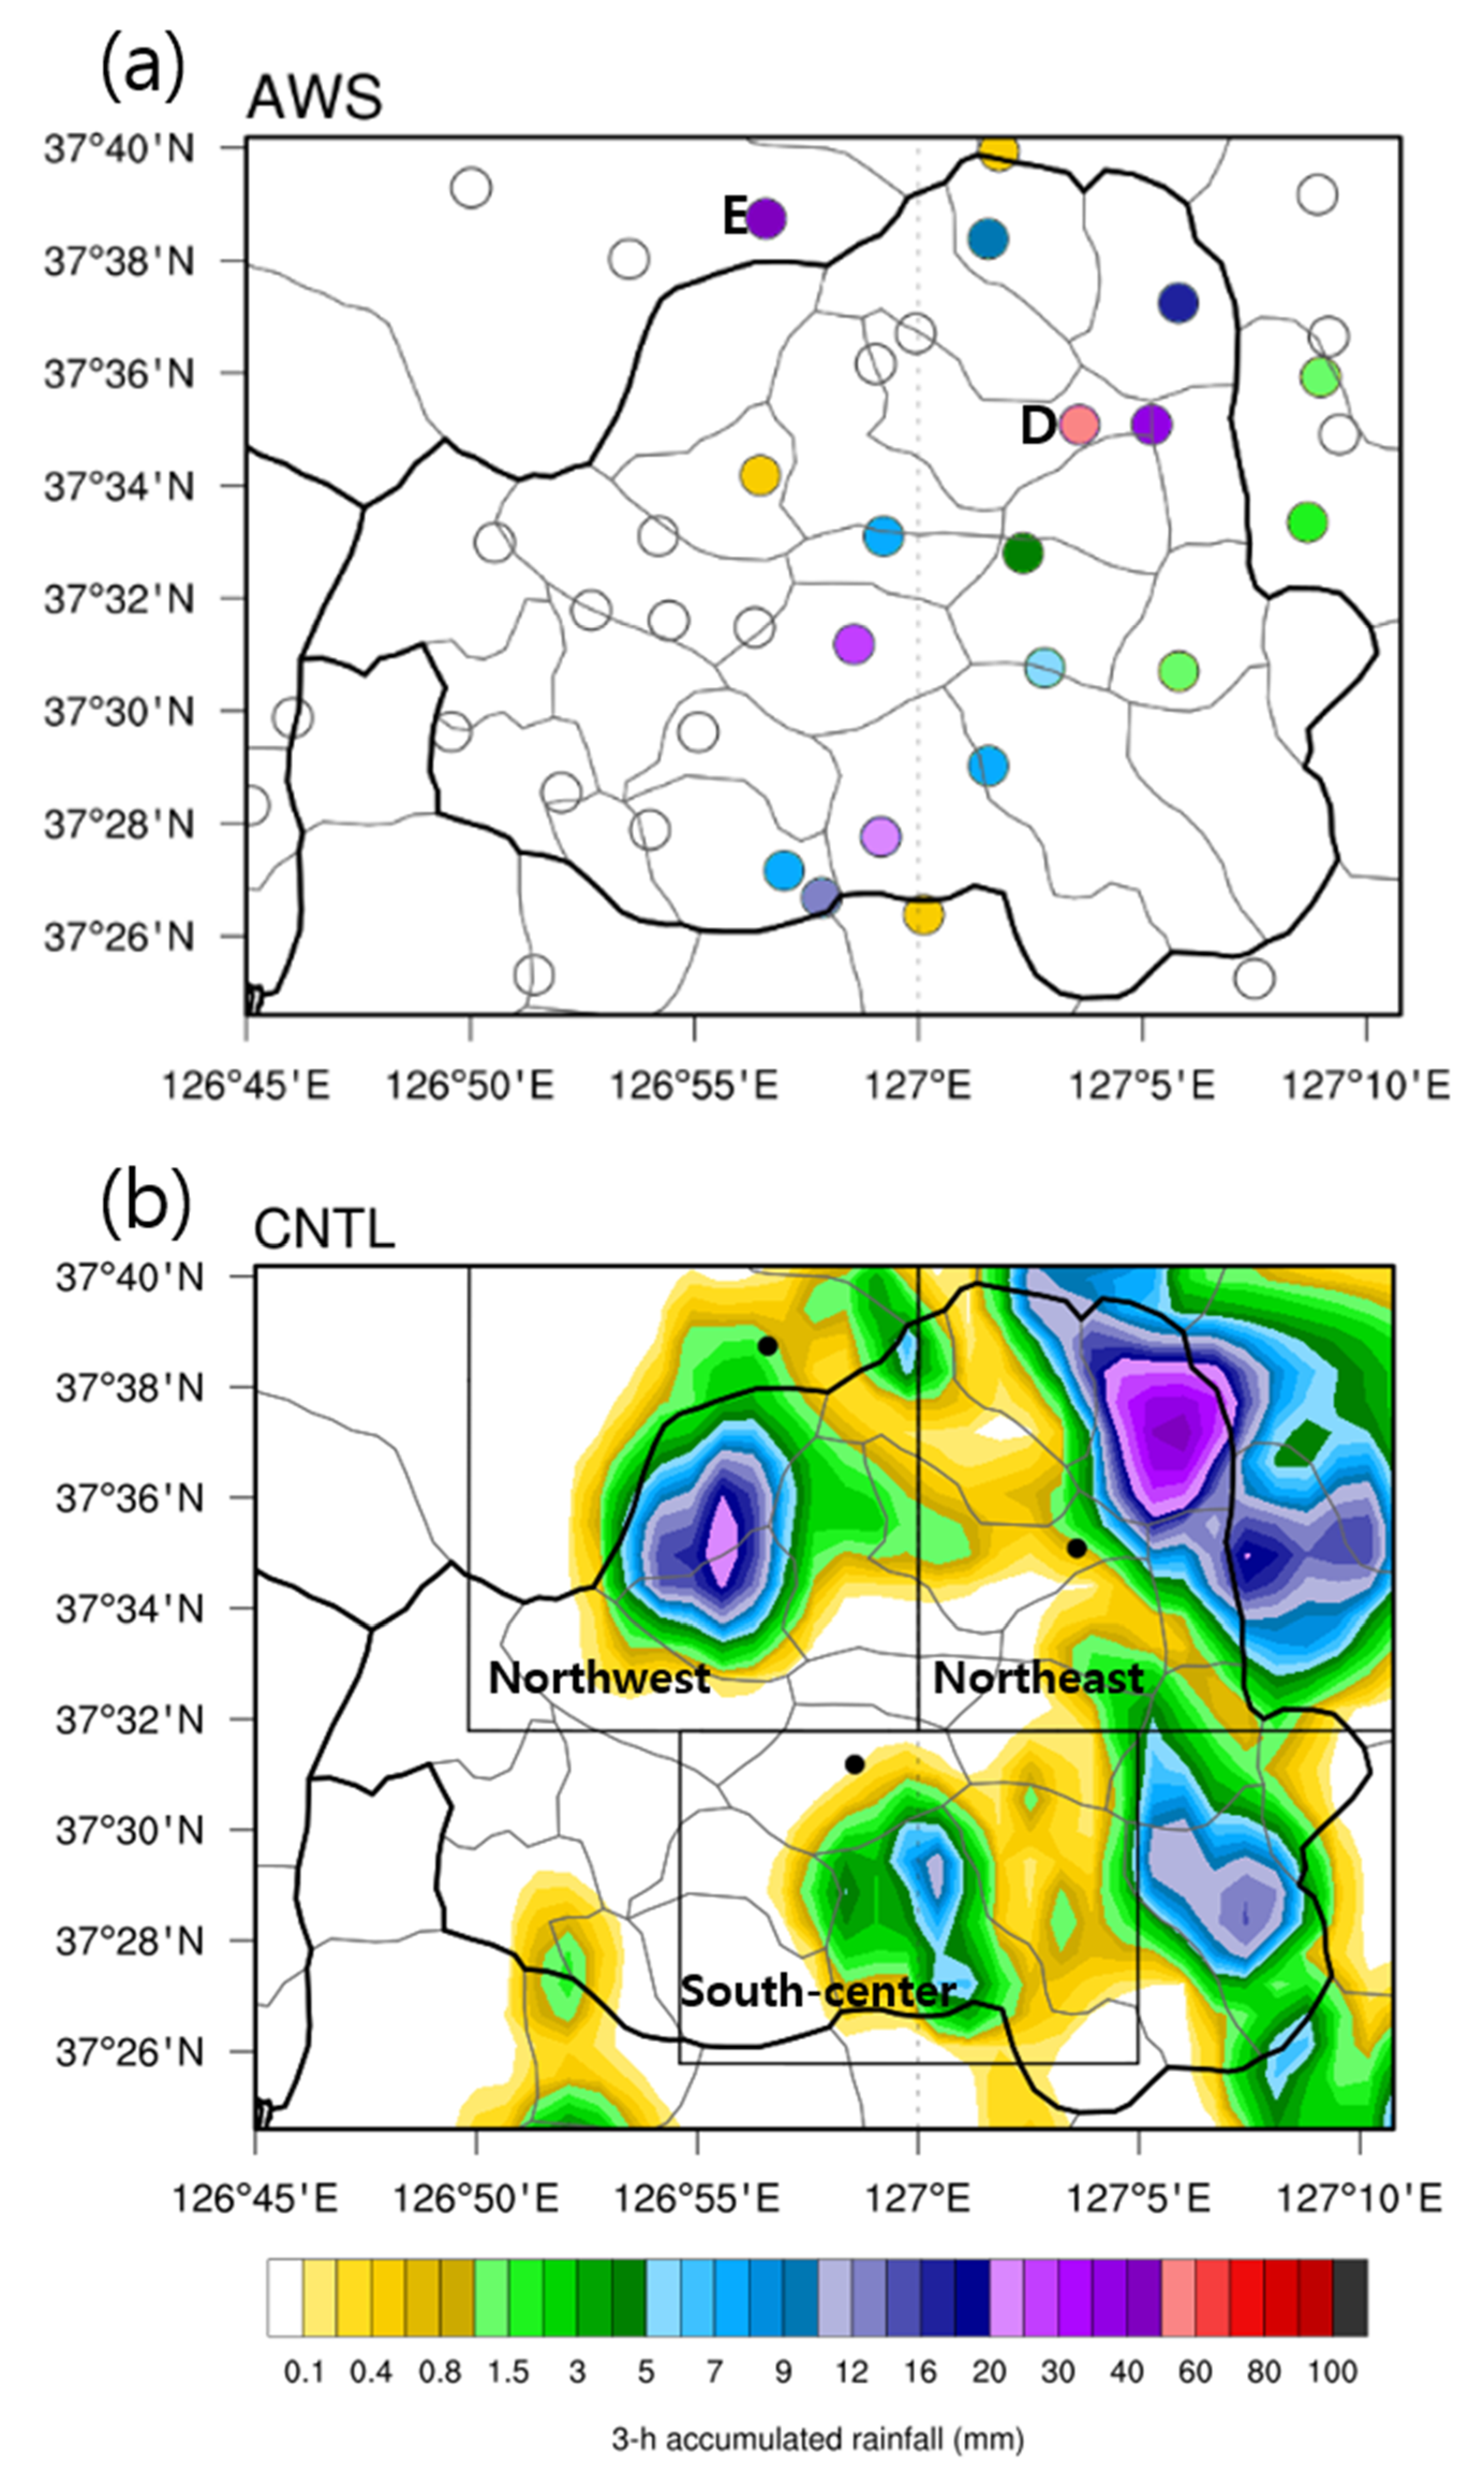
Figure 7 compares the horizontal distribution of the 3-h accumulated precipitation for the period 1500–1800 LST on 6 July between observation and CNTL simulation. Observation shows that rainfall larger than 20 mm occurred in the northeastern area, northwestern edge, and south-center of the SMA. The evaluation of high-resolution rainfall simulation is not simple. Because a model rarely simulates the exact spatial distribution of precipitating events, qualitative evaluation is common [5]. For qualitative evaluation, we focused on three stations with maximum rainfall in the northwest, northeast, and south-center of the SMA (Figure 7b) and compared them to the simulated maximum rainfall in each region. Table 4 displays the maximum 3-h accumulated rainfall in each region for observation and simulation. The simulated maximum rainfall locations do not correspond to observation counterparts (dots in Figure 7b), and location difference is provided as location error in Table 4. The model predicts the location and amount of the largest rainfall in the northeast region with small errors but underestimates rainfall by 50% in the northwest and south-central regions. The northwest rainfall location is in an upsloping region (Figure 1d), indicating that topography plays a role in triggering the rainfall. Some location errors could be due to the smoothing of terrain height on a 1 km grid and scarcity of observation stations. The model also well captures no rainfall in a flat southwestern area of the SMA. The simulated maximum 3-h accumulated rainfall in the analysis domain is 43.6 mm, which is a little smaller than observation (56.5 mm).
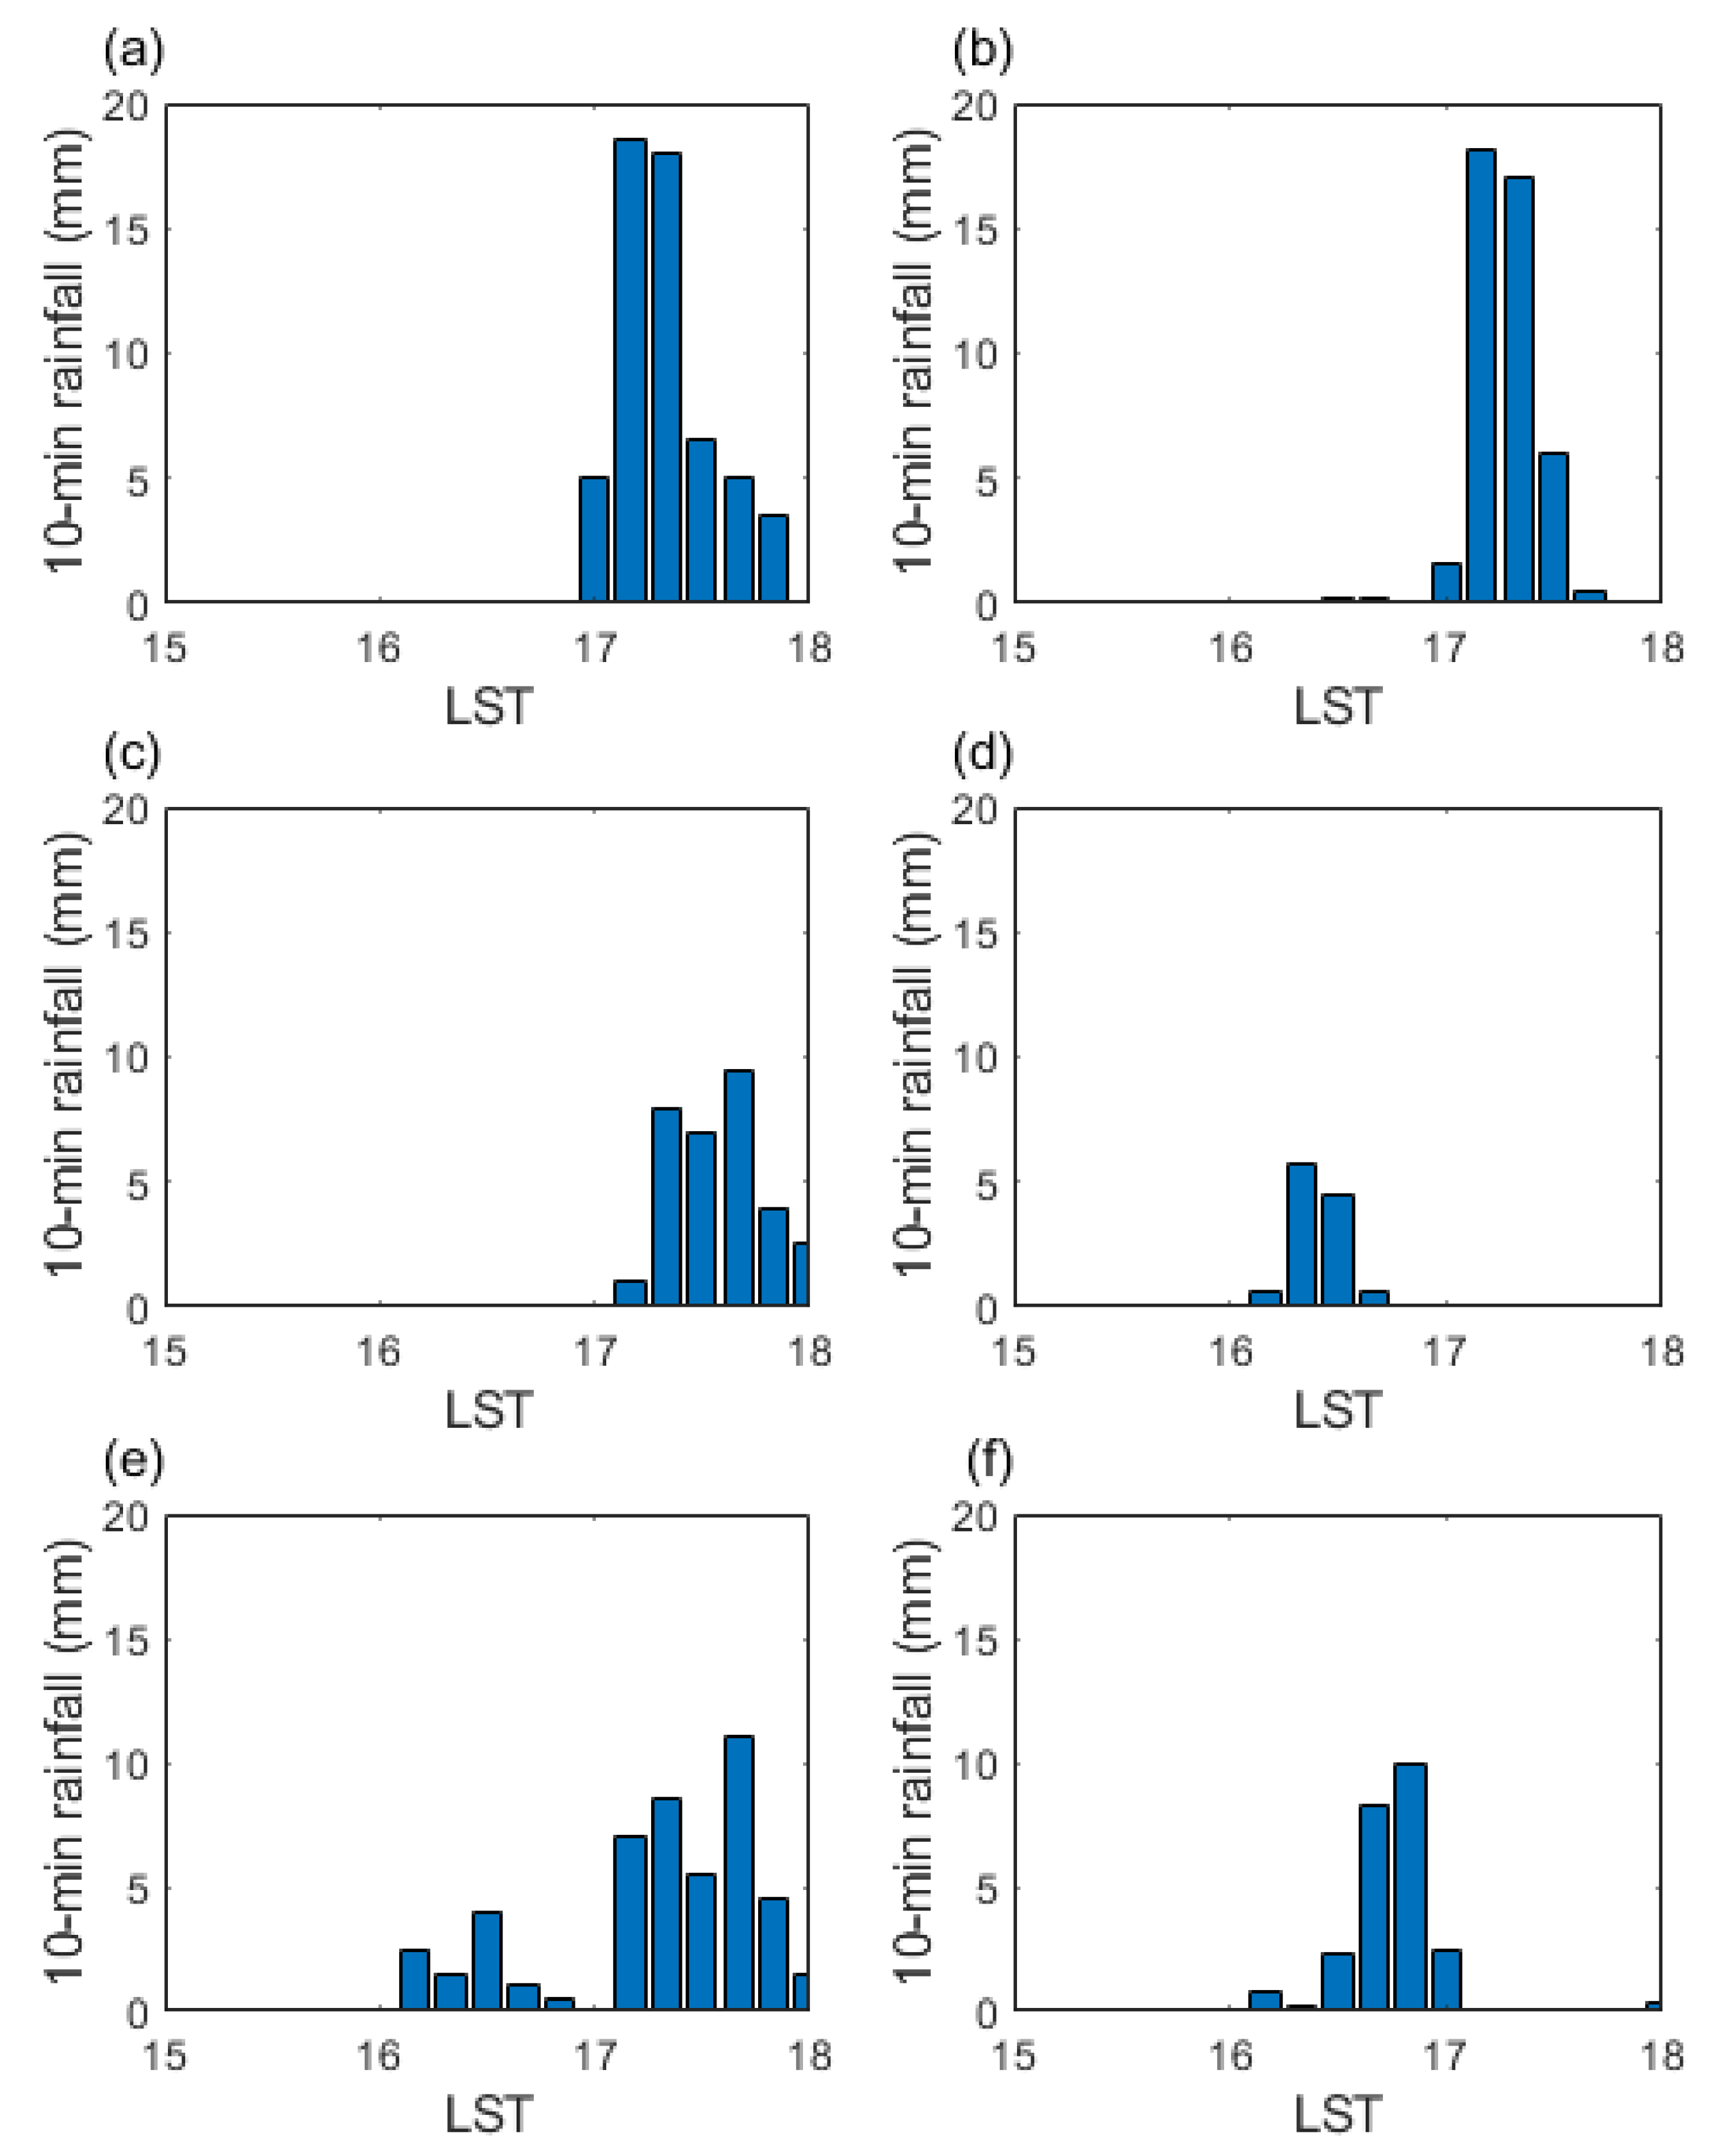
Time series of the observed 10-min accumulated precipitation at three stations with the maximum rainfall in each region are compared with CNTL in Figure 8. In the northeastern area, the 10-min maximum precipitation was observed between 1710 and 1720 LST, which is well simulated in CNTL. In the south-center, weak rainfall occurred 1 h earlier in simulation, which removes instability and prevents the development of convection in this region in the later time. The model captures the early occurrence of rainfall in the upsloping area in the northwest, although it overestimates rainfall amount.
4. Sensitivity Experiments
4.1. Horizontal Distribution of Accumulated Rainfall
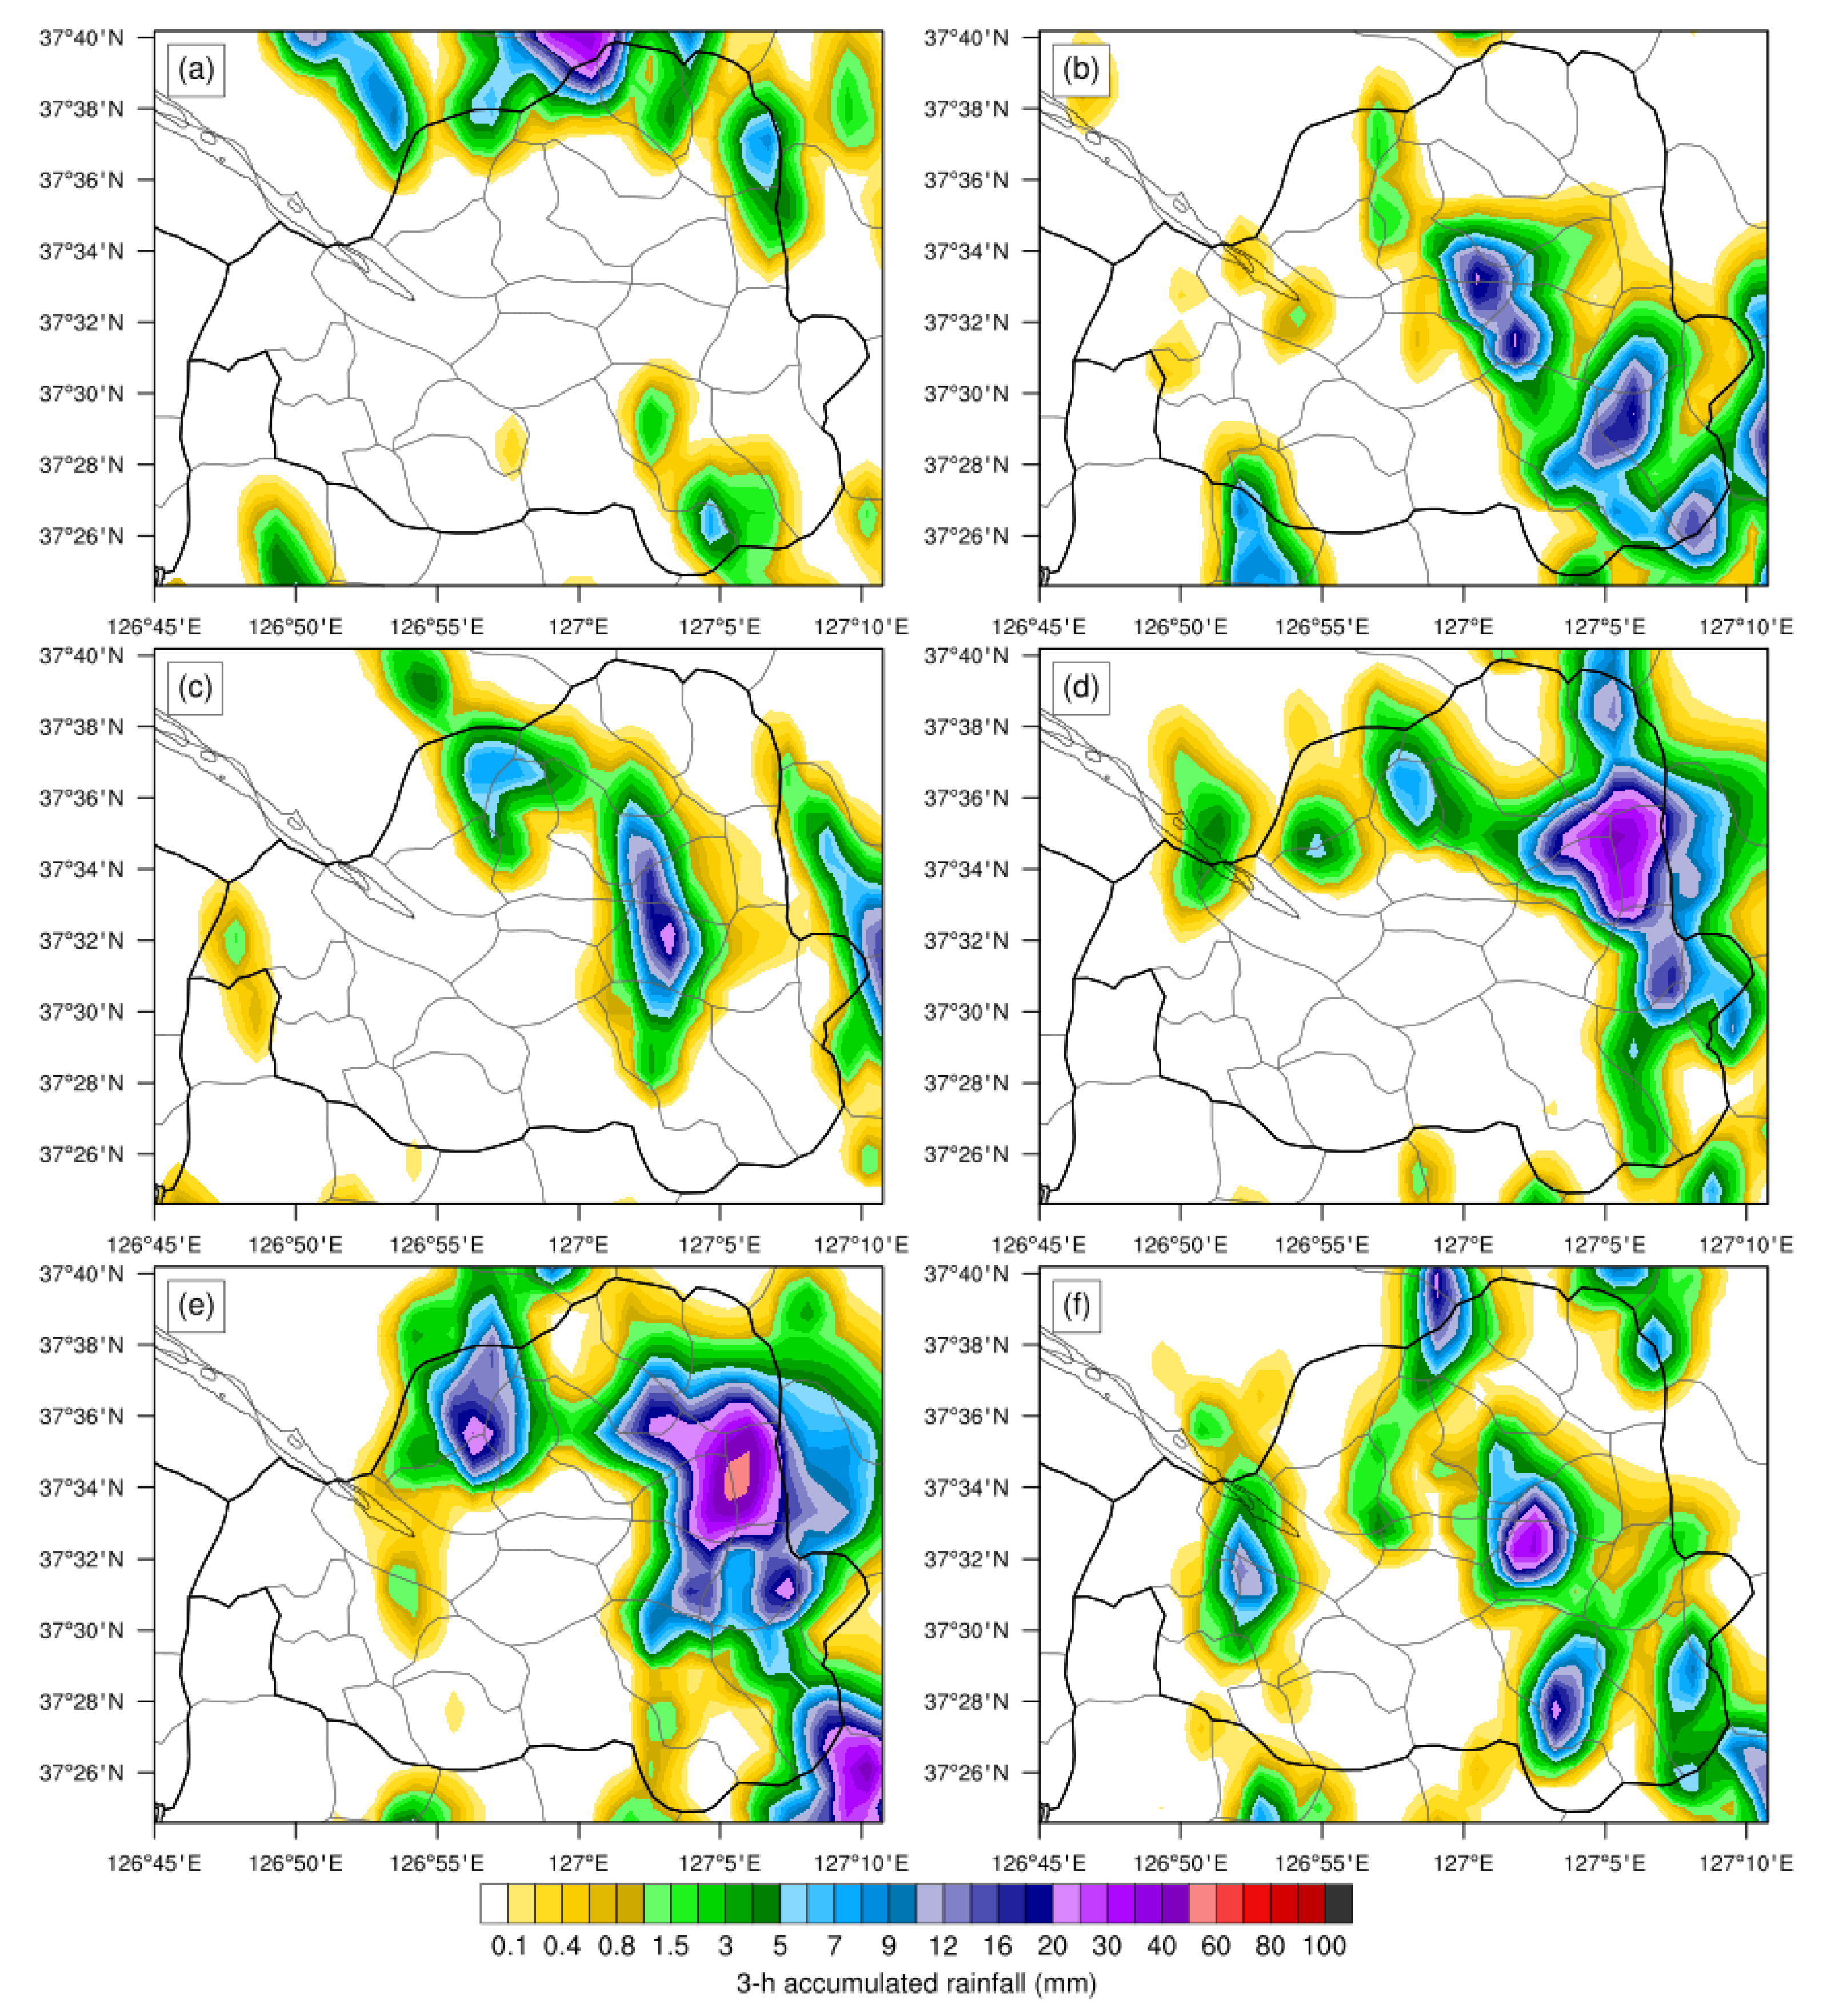
Figure 9 shows the horizontal distribution of the 3-h accumulated precipitation between 1500 and 1800 LST in the sensitivity simulations. Compared with CNTL simulation (Figure 7b), NOSEA and NOSEANOURBAN simulations show little rainfall in the SMA, indicating that sea breeze has a significant impact on rainfall in the SMA. NOSEANOURBAN has more precipitation than NOSEA because the urban area is replaced by cropland, and hence moisture supply is increased. Although CAPE is high on the study day, substantial boundary-layer moisture and low-level convergence are required for the occurrence of deep convection [30]. Precipitation occurred in central and Southeastern Seoul in the NOURBAN simulation but with less rainfall than in the CNTL simulation. In the NA and LB simulations, the overall precipitation zone was concentrated in the eastern part of the SMA. In the NALB simulation without both urban roughness and anthropogenic heat, locations of precipitation move to the west compared to LB and NA simulations. This indicates that both urban roughness and anthropogenic heat contribute to displacing precipitation areas into the east. Table 5 displays the 3-h maximum accumulated rainfall in the analysis domain in simulations with a sea breeze. The maximum rainfall is the largest in LB simulation and the smallest in NOURBAN simulation. Although the SBF can trigger deep convection on its own, deep convection is better triggered when an SBF interacts with other low-level convergence zones, such as gust fronts [31] or river breezes [32]. Interaction of the urban convergence zone and SBF could lead to deeper convection and hence more rainfall in urban simulations compared to NOURBAN simulation. Urban factors also influence the timing and location of maximum rainfall; earlier occurrence of maximum rainfall and its location in the center of the SMA in NOURBAN and later occurrence and its location in the northeast of the SMA in CNTL, LB, and NA. Freitag et al. [33] also showed earlier convective initiation in NOURBAN than URBAN simulation. They explained that the reduction in moisture in urban area inhibits convective initiation.
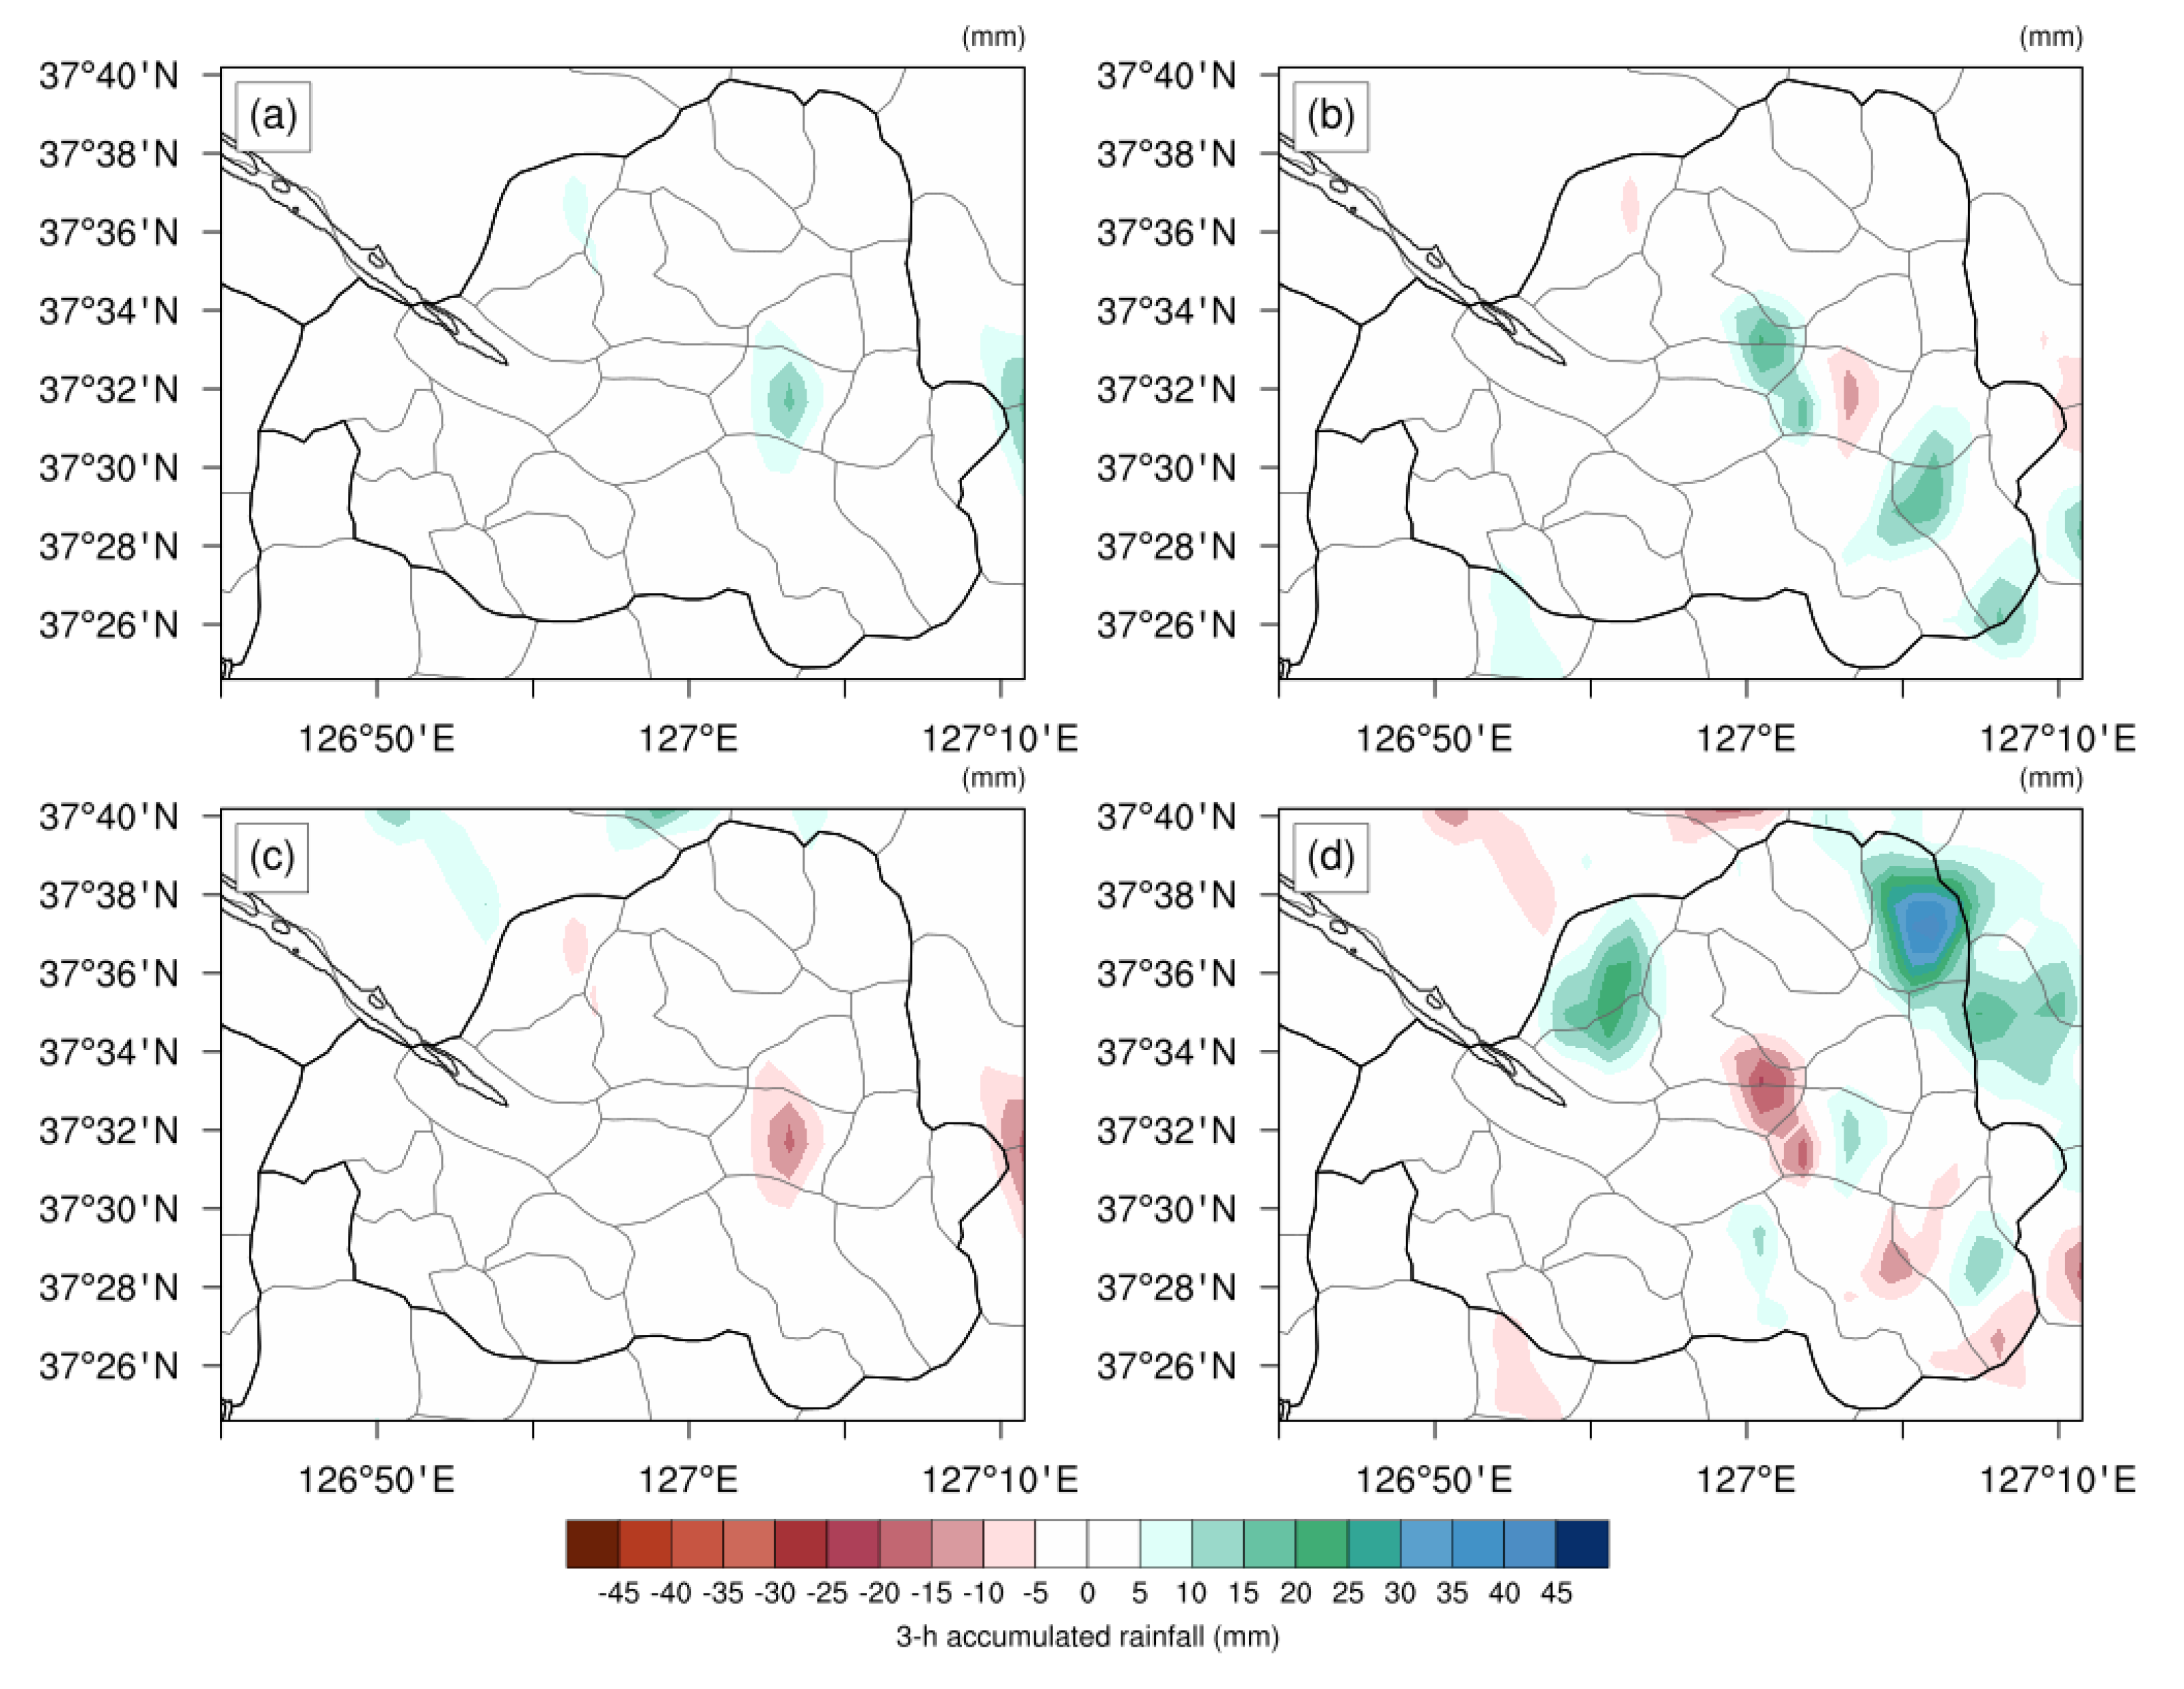
To examine the relative role of sea and urban factors in sea-breeze-initiated rainfall, we performed factor separation analysis for the 3-h accumulated precipitation. Figure 10 shows the explicit contribution of each factor to the 3-h accumulated precipitation. The sea contributes to increased precipitation in Seoul’s central and southeastern areas, whereas the urban effect reduces precipitation in the SMA due to less moisture supply. Although an urban heat island causes low-level convergence and thus upward motion over an urban area, it is insufficient to cause convective rainfall without moisture supply. The interaction between sea and urban effect leads to the occurrence of precipitation in the northwest and northeastern area of the SMA instead of the center and southeastern of the SMA.
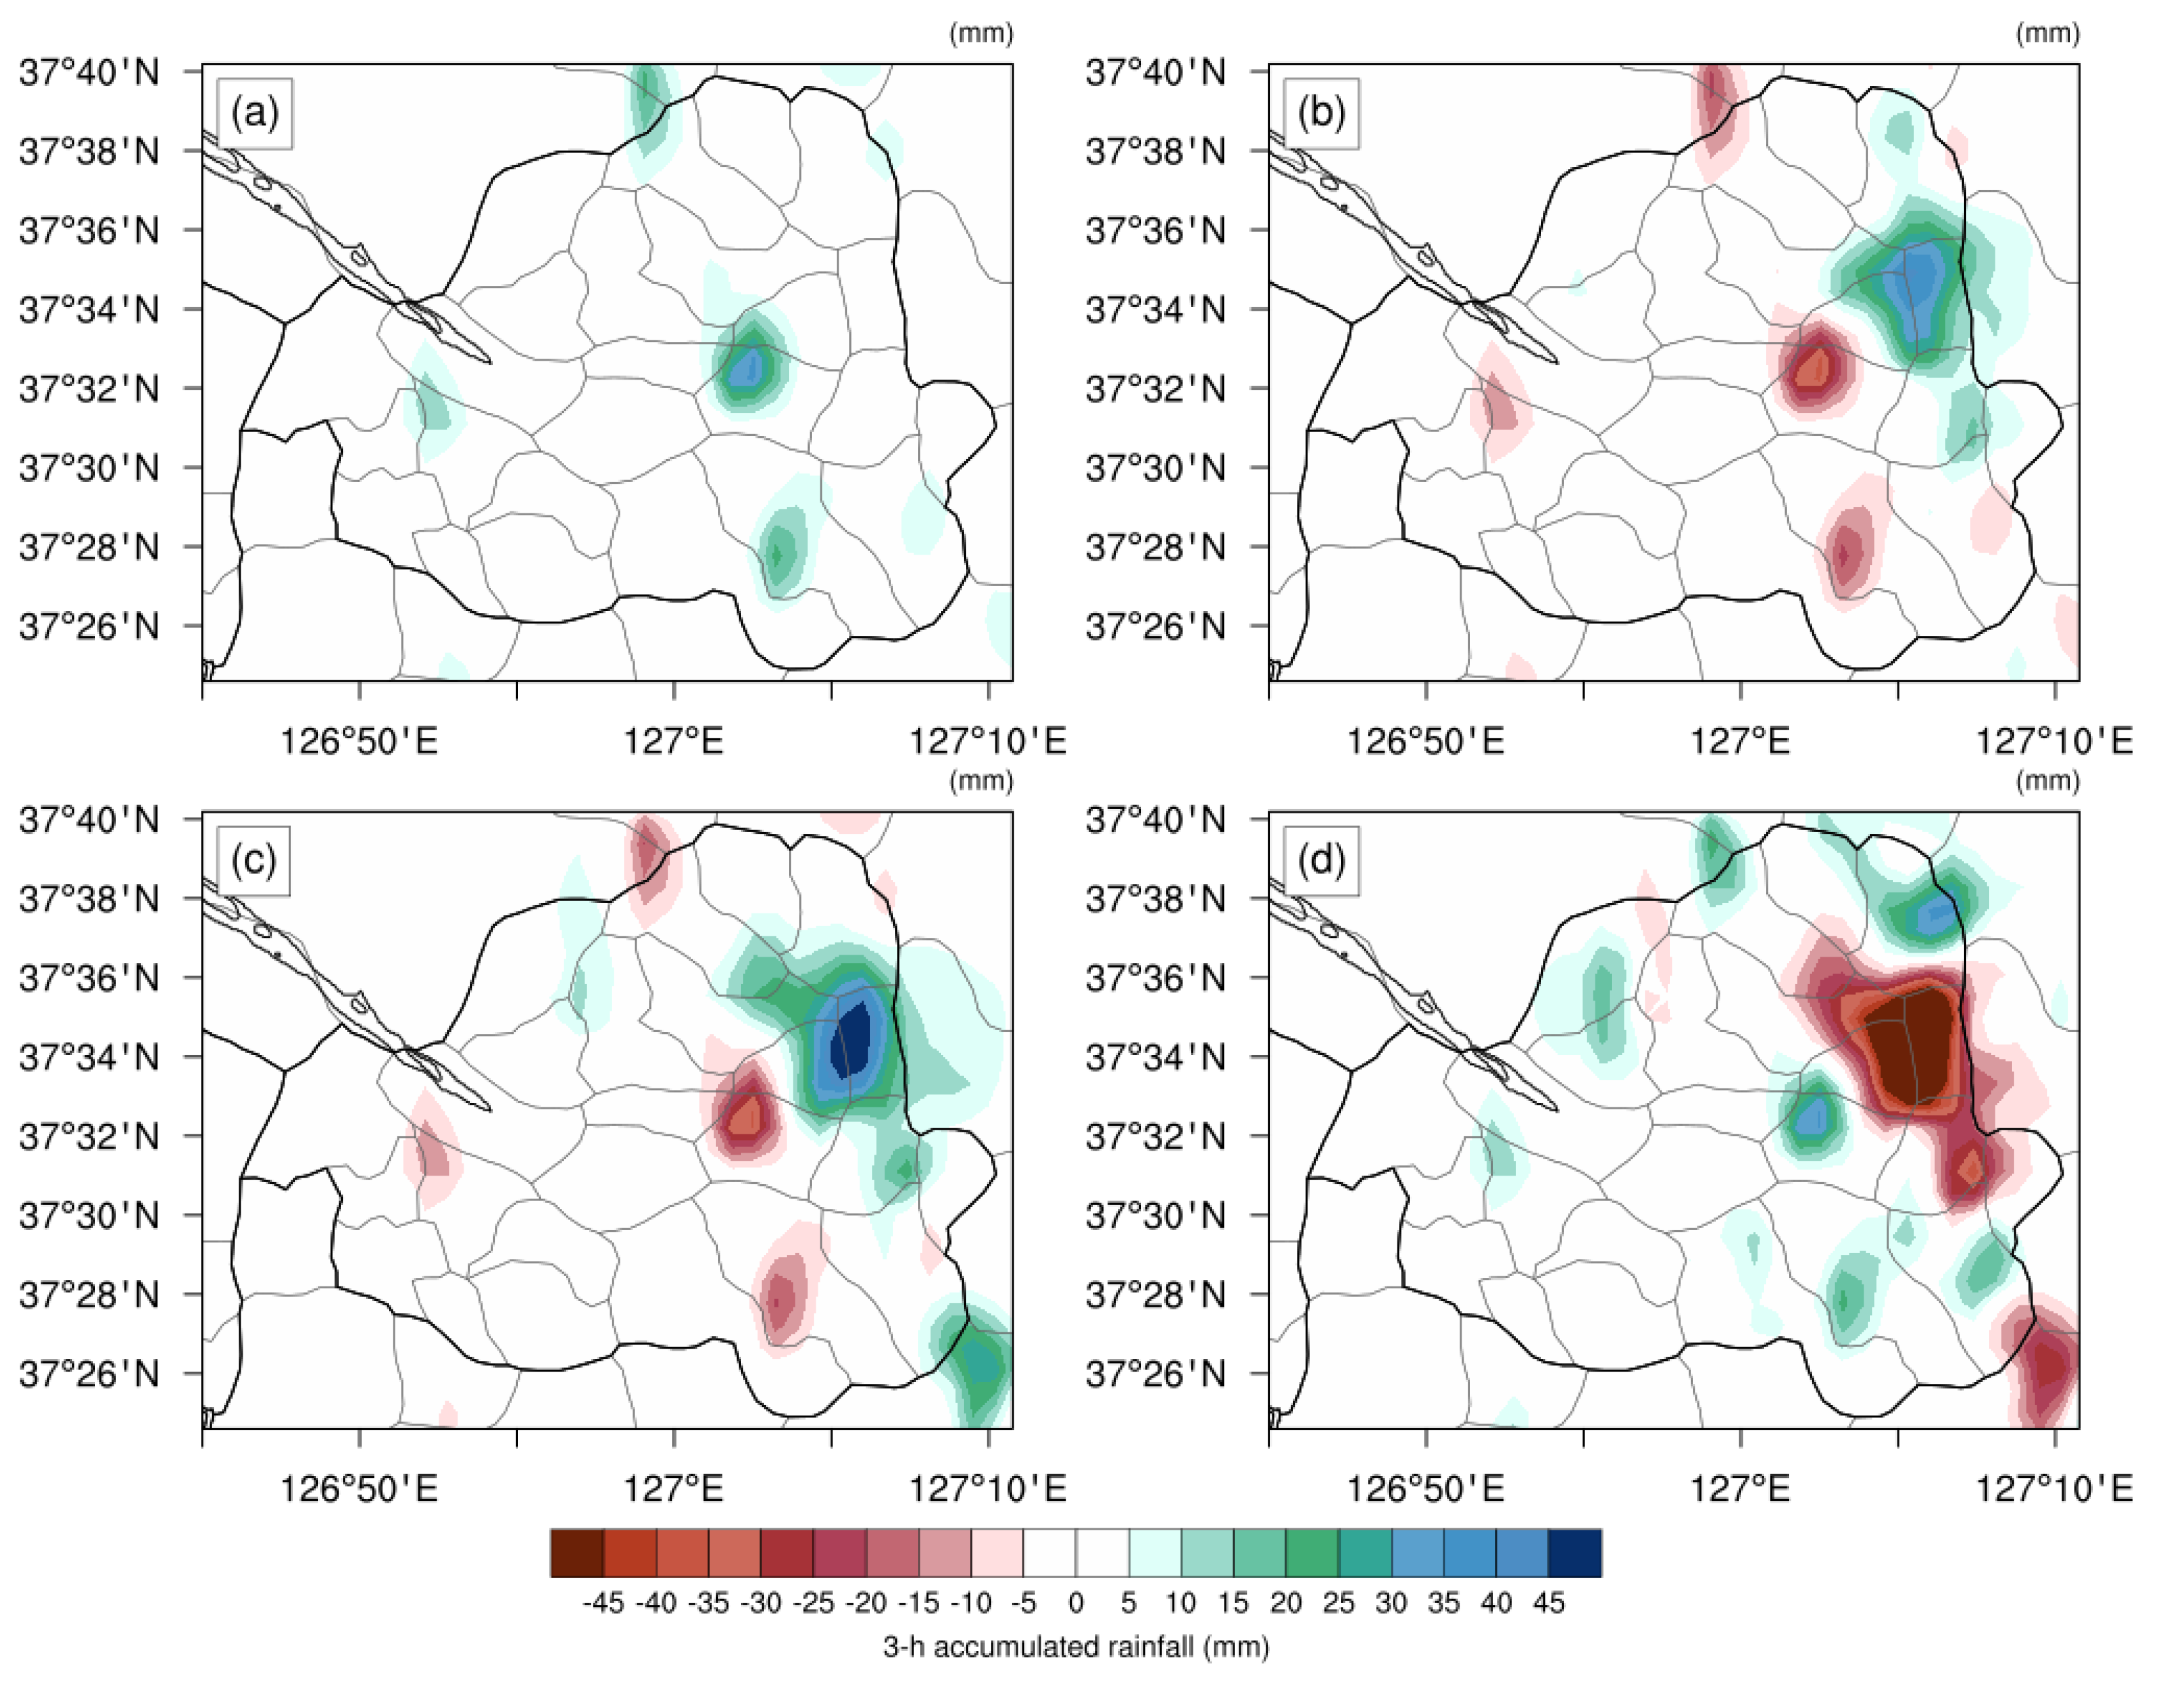
To examine further which urban factor influences the location of rainfall, we performed the factor separation analysis for anthropogenic heat and urban roughness under the influence of sea breeze. Figure 11 shows the explicit contribution of each urban factor to 3-h accumulated precipitation under the influence of sea breeze. NALB does not simulate rainfall in the northeastern area of Seoul under the influence of a sea breeze. Anthropogenic heat and urban roughness both contributed to increased precipitation in Seoul’s northeastern region, with anthropogenic heat contributing more than urban roughness. The interaction between anthropogenic heat and urban roughness increases precipitation in the northwest and reduces precipitation in the northeast of the SMA. A large reduction in precipitation in the northeast indicates that precipitation amount is not simply added by each factor because precipitation amount is limited by moisture supply. Rainfall has also increased in the urban area at the foot of Mt. Bukhan in the northwest. Given forced lifting by terrain and sufficient moisture supply, both urban roughness and anthropogenic heat increases near-surface air temperature over an urban area, which provides a more favorable condition for vertical convection and thus leads to rainfall in the northwest.
4.2. Sea and Urban Breeze
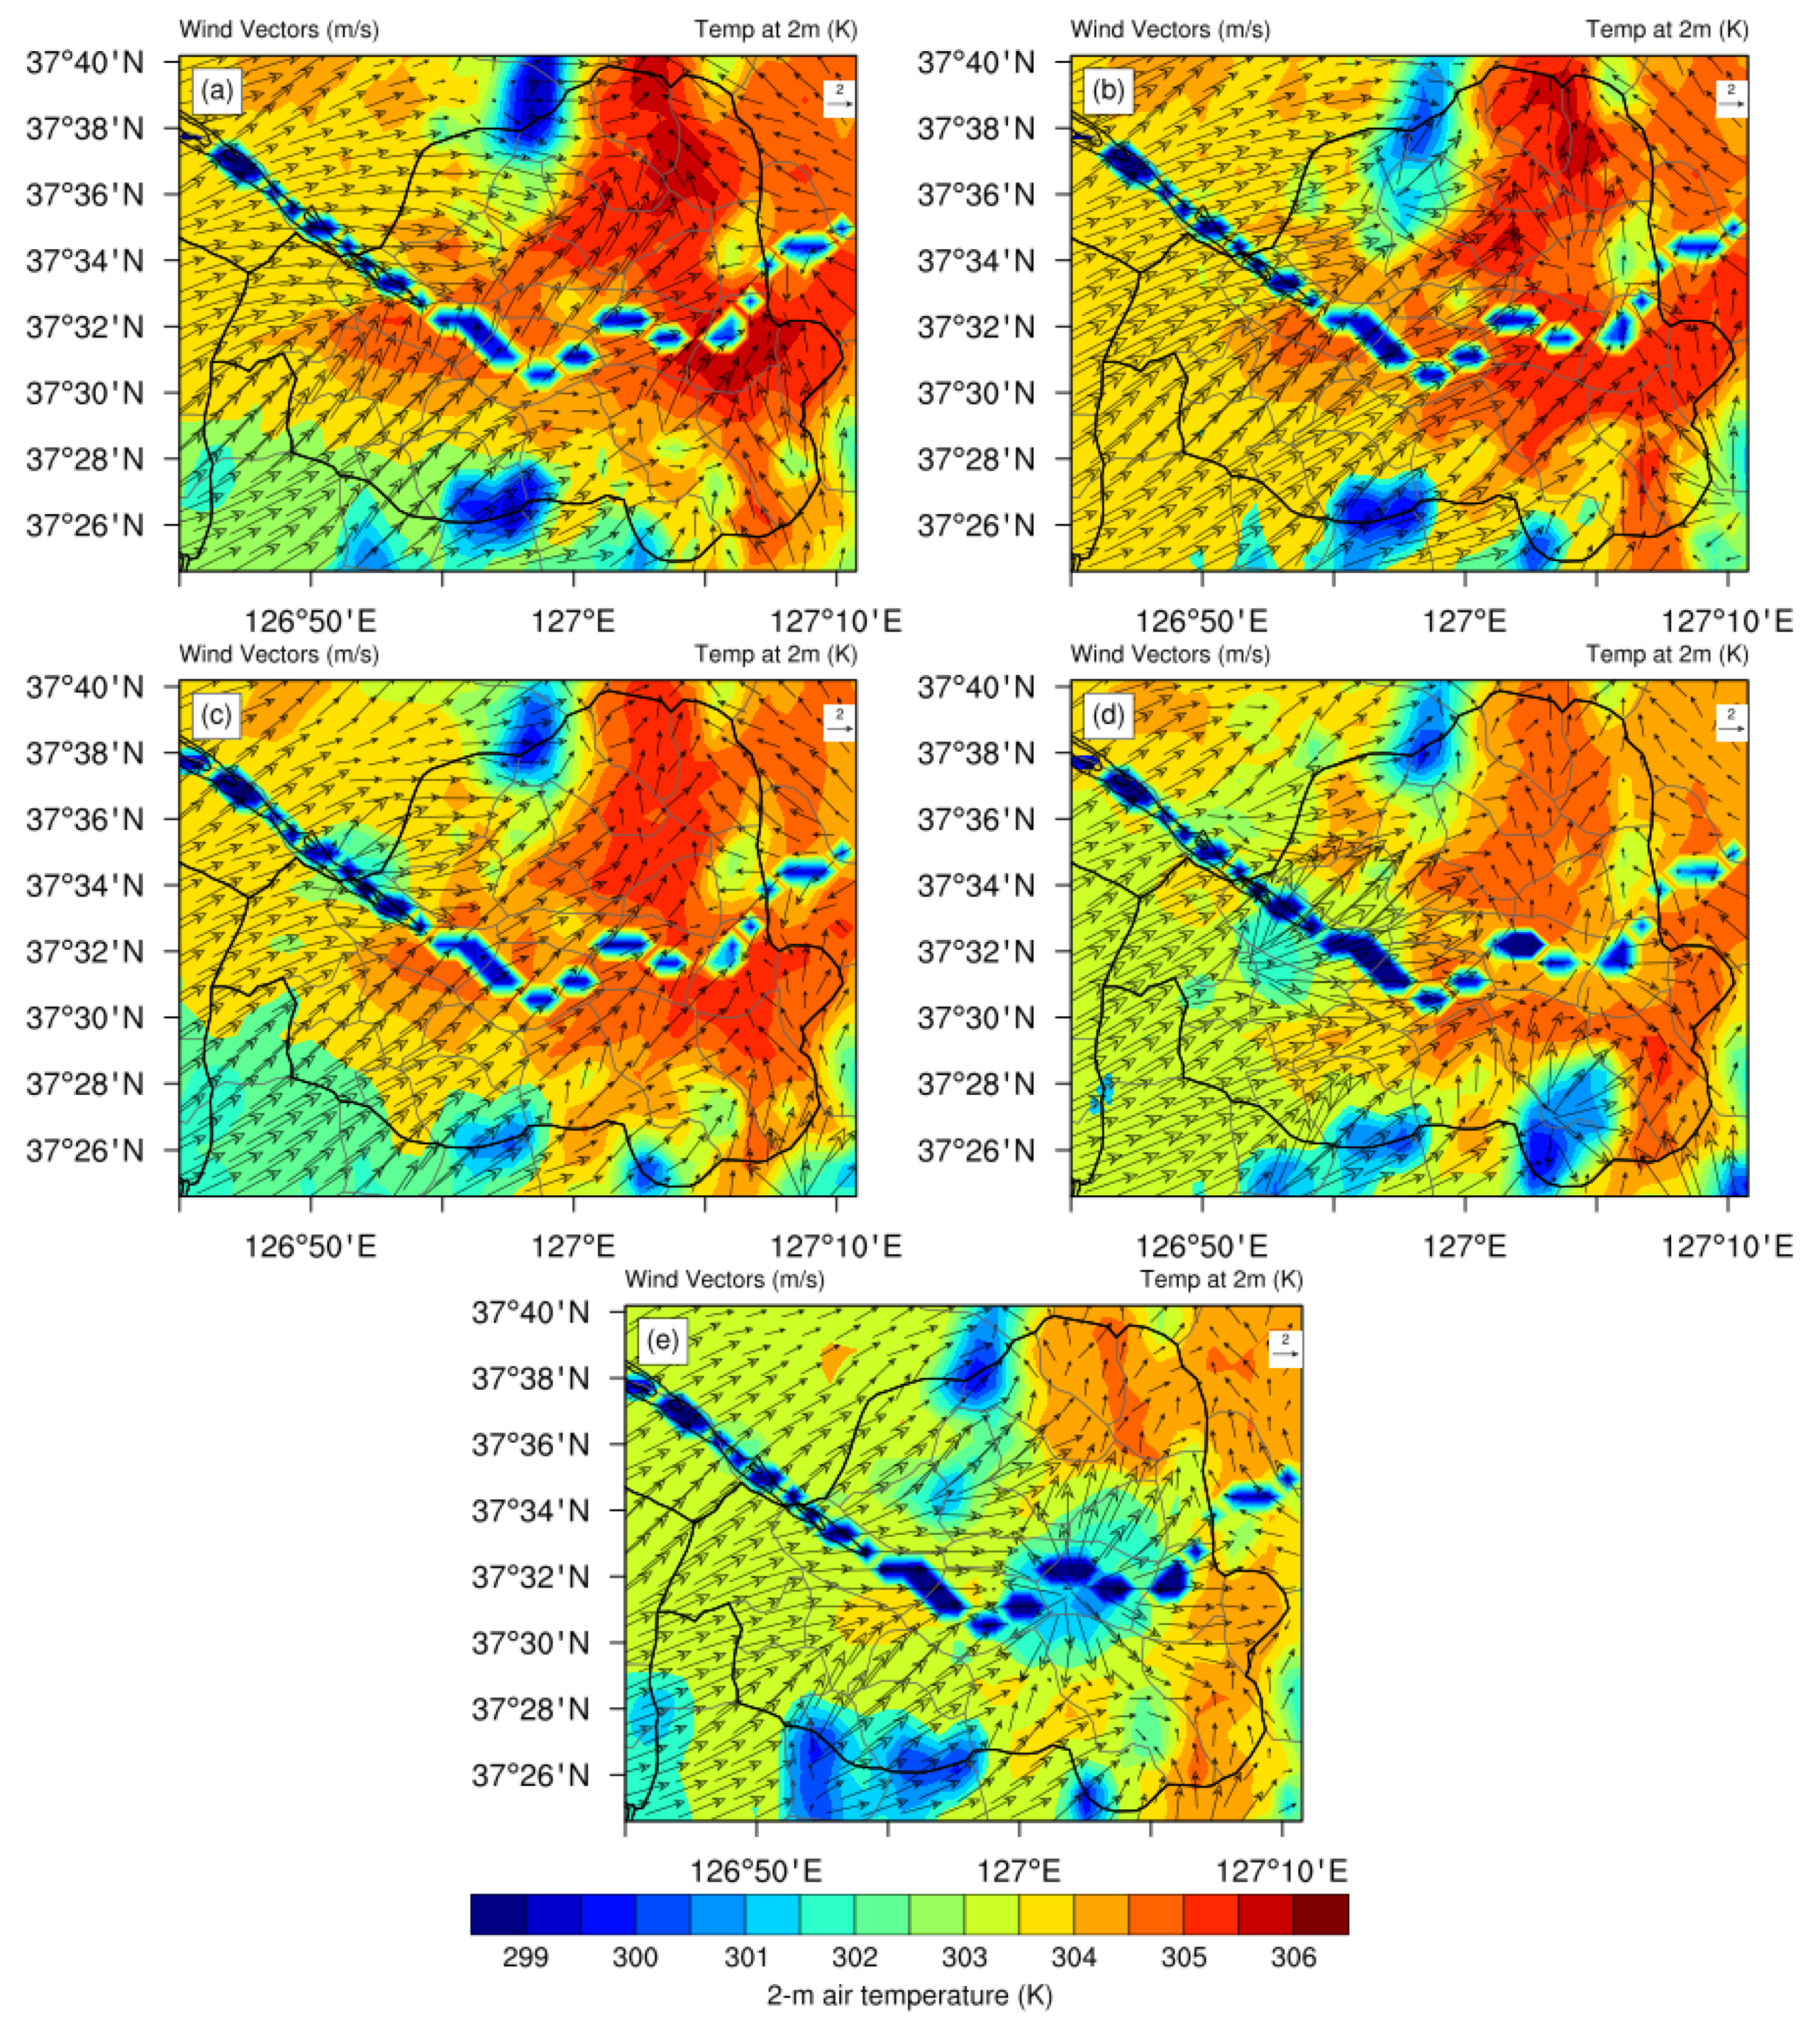
In this section, we examine how urban factors influence urban breeze and low-level convergence and thermal instability at the SBF and discuss their relation to sea-breeze-initiated rainfall. We first examined the horizontal distribution of 10 m wind vector and 2 m air temperature at 1600 LST for simulations with sea breeze (Figure 12). In the SMA, there are various local circulations such as river breeze, valley breeze, and urban breeze as well as sea breeze [12]. The strong southwesterly sea breeze is shown in the west of the SMA, and easterly flow is shown at the eastern edge of the SMA in urban simulations. High air temperature is shown over the northeastern valley of the SMA (Figure 1d), inducing strong UHIC. The shift of a UHI-related local maximum temperature zone from the city center to the inland is reported in previous studies [5,34]. This hot spot is close to the location of maximum rainfall in CNTL, LB, and NA (Figure 7b and Figure 9d,e). Because of large low-level convergence and high thermal instability, the hot spot aids in the initiation of deep convection and subsequent rainfall. The western area, on the other hand, is influenced by the sea breeze and thus has a lower temperature than the eastern area. The near-surface air temperature appears in the order of CNTL > LB > NA > NALB > NOURBAN, which implies the largest thermal instability in CNTL and the lowest one in NOURBAN. Anthropogenic heat increases the air temperature in CNTL and LB. Urban roughness increases surface sensible heat flux, leading to higher near-surface temperature in NA and CNTL than their counterparts (NALB and LB).
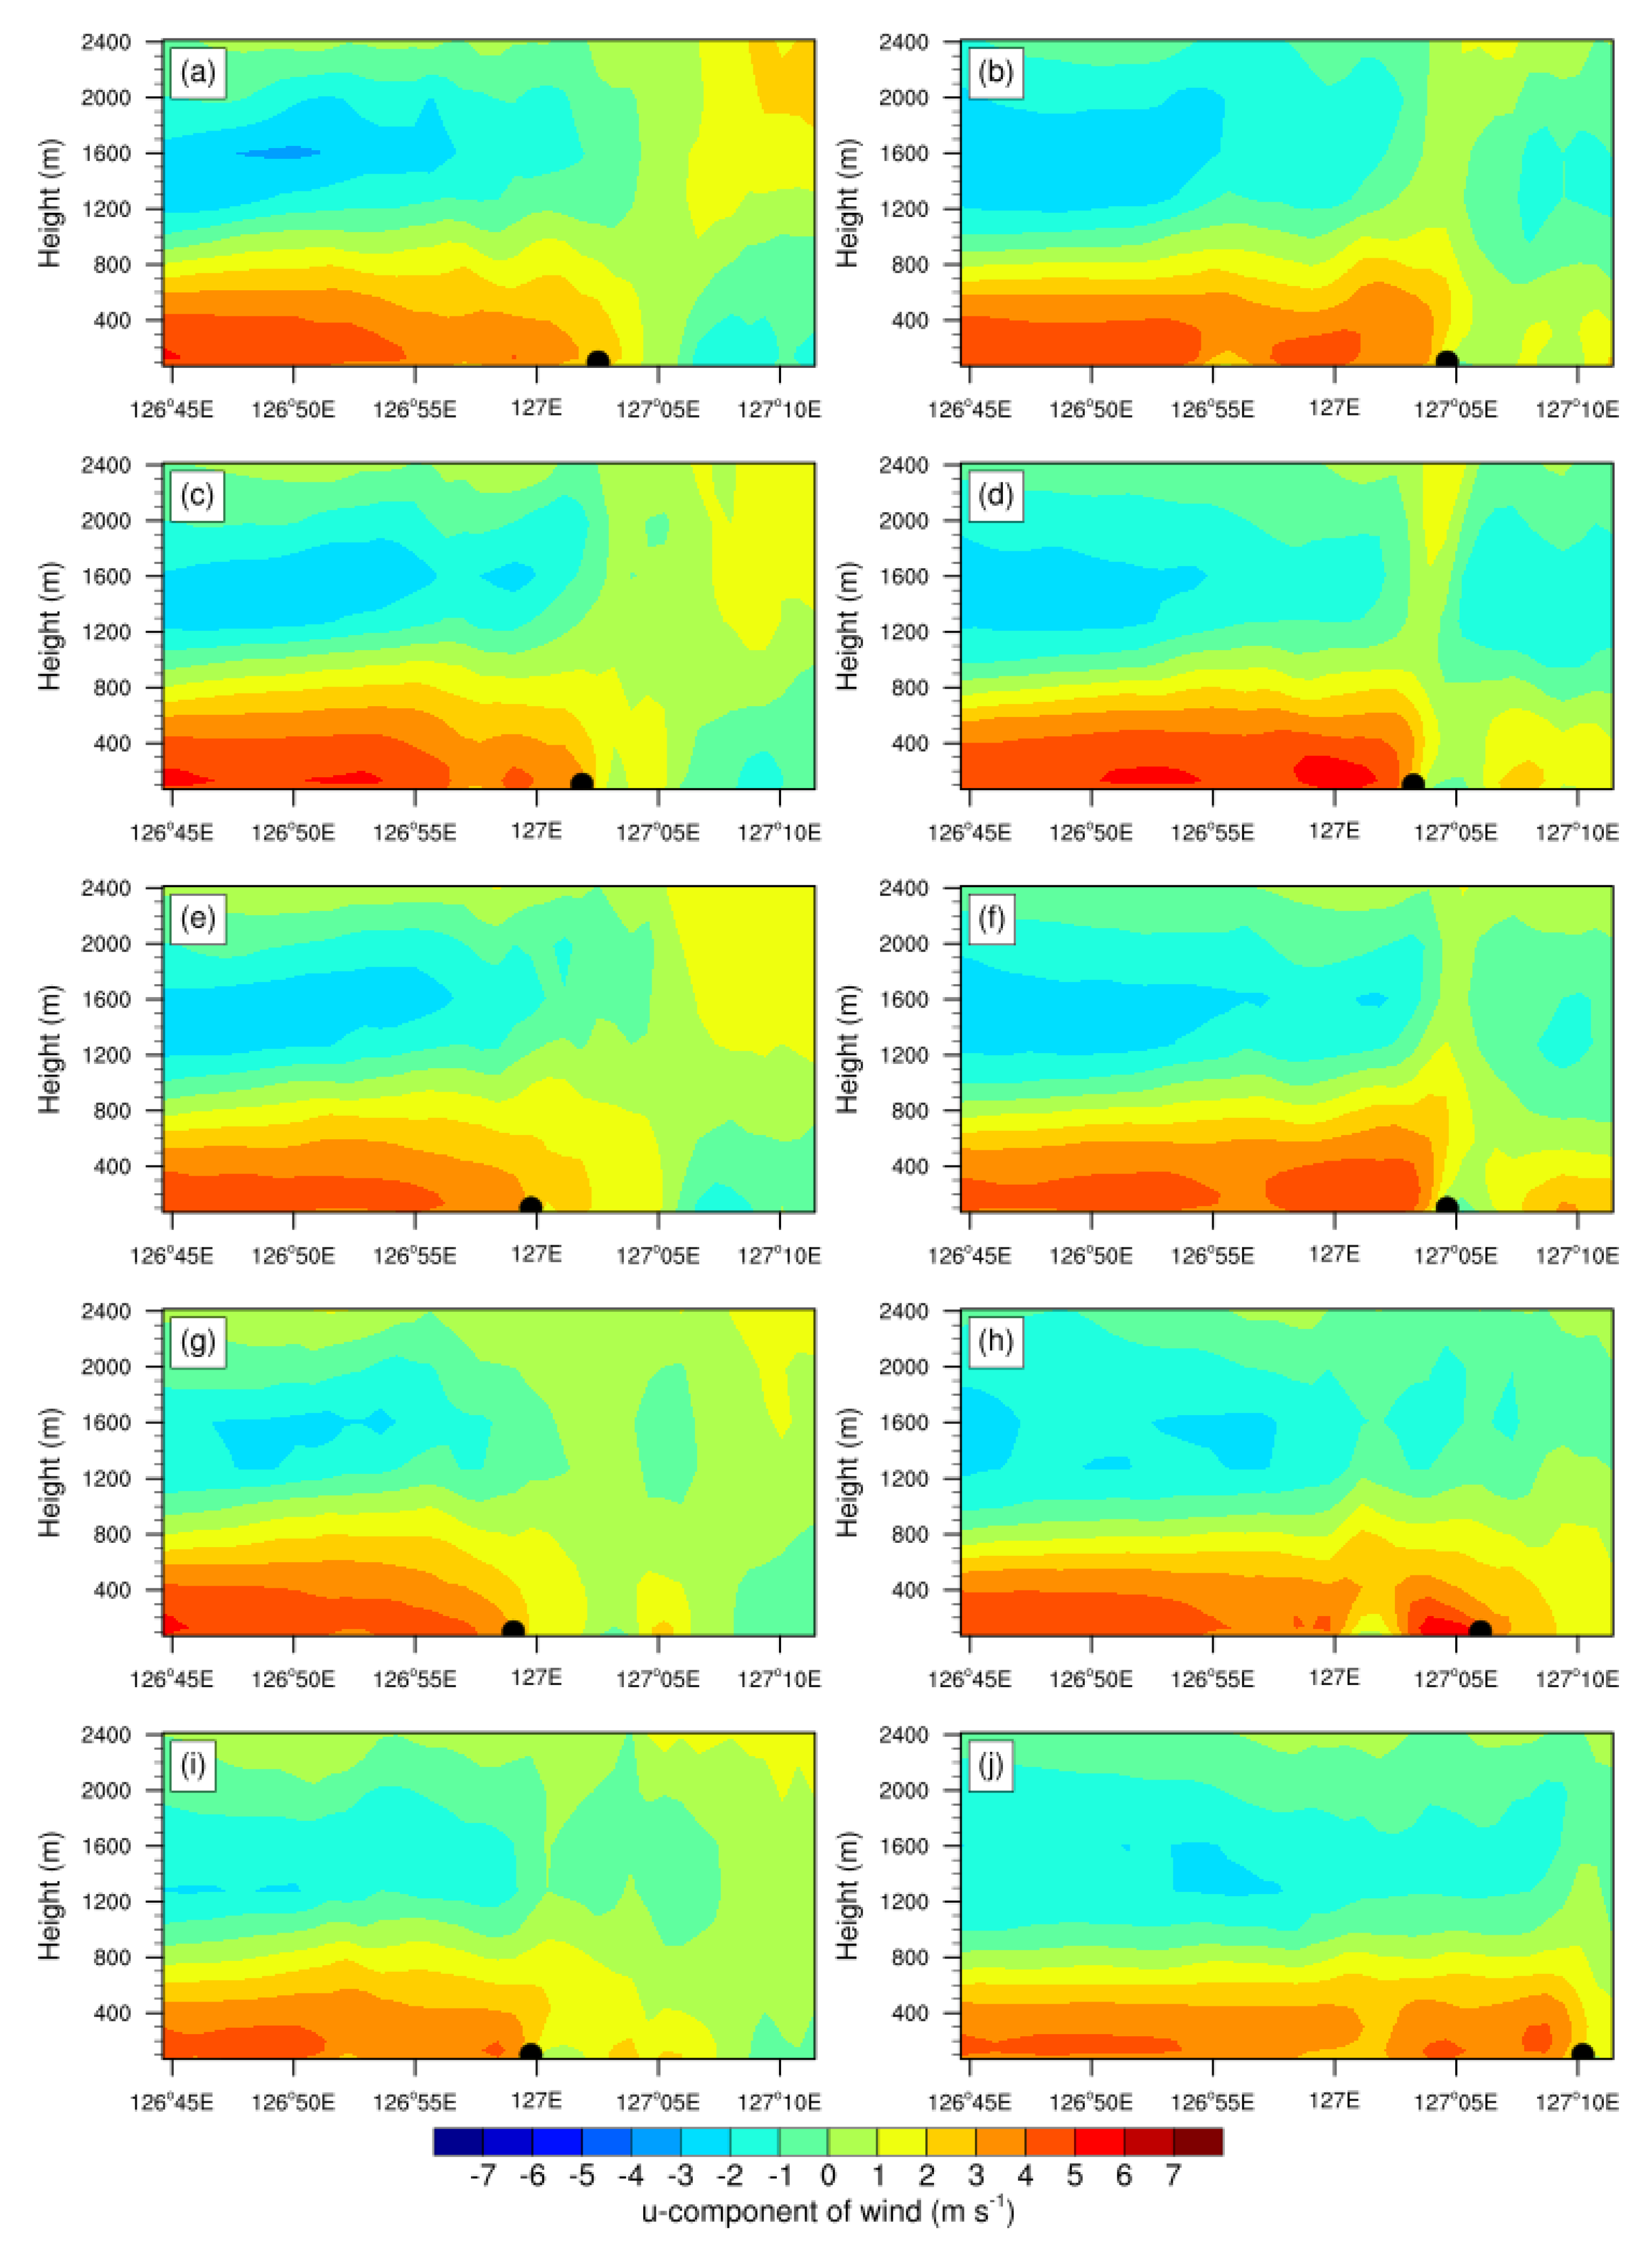
Large low-level convergence at the SBF leads to deep convection under favorable conditions. The location of the maximum rainfall is different among simulations (Table 5). To examine the difference in maximum rainfall between simulations in terms of low-level convergence at the SBF, we analyzed meridional-averaged (37° 25′ N–37°40′ N) urban and sea breeze features in the analysis domain. The sea breeze over the SMA is westerly flow, and hence we analyzed the meridional-averaged u-component of wind ua. Figure 13 shows the longitude-height cross-section of ua at 1600 and 1700 LST. At 1600 LST, there are two large-low-level convergence zones in CNTL, LB, and NA; one appears at the SBF, which is accompanied by a strong westerly wind, and the other is around 127°05′ E, which is the center of UHIC. To calculate low-level convergence, we used low-level (570 m) mean ua (Um). Here, we determined the location of the SBF as the position at which the horizontal gradient of Um is largest among locations where Um is larger than 2 m s−1 and marked it as a black dot in Figure 13. To compare the incoming sea breeze intensity among simulations, we calculated Um at the western boundary (126°45′ E).
Table 6 summarizes sea breeze characteristics. The incoming sea breeze intensity in urban simulations is stronger than that in NOURBAN, consistent with the previous finding [5,35]. At 1600 LST, the SBF is located slightly further east in CNTL and LB than other simulations. Previous studies have found such an acceleration of the SBF in an inland urban area [12,36]. Early weak rainfall and subsequent divergent flow ahead of the SBF also retards propagation of the SBF in NALB and NOURBAN. Because of the dry urban surfaces, the mixing ratio at the SBF is lower in urban simulations than in NOURBAN. When enough moisture is supplied, low-level convergence at the SBF could lead to deep convection. The magnitude of low-level convergence at the SBF is smaller in simulations (CNTL, NA) with urban roughness than their counterparts (LB and NALB) due to the reduction in wind speed. The presence of a westerly urban breeze ahead of the SBF also reduces low-level convergence at the SBF in CNTL, LB, and NA simulations compared to NOURBAN. Both urban roughness and anthropogenic heat increases the intensity of UHIC. Although the location of the SBF depends on the definition used, the aforementioned low-level convergence pattern at the SBF is less sensitive to the definition. To summarize, urban roughness and anthropogenic heat reduce low-level convergence at the SBF, and the dry urban surface provides less moisture, preventing deep convection at the SBF in CNTL, LB, and NA at 1600 LST.
At 1700 LST, strong low-level convergence occurs at the SBF in CNTL, LB, and NA. When the SBF arrives at the center of UHIC, the interaction of two low-level convergence zones produces deep convection and consequently rainfall. The rainfall produces a cold pool and outflow, and then subsequent convection is produced through the collision between the outflow and the SBF [4]. Notice the presence of low-level divergent flow in the east of 127°05′ E in LB and NA. Stagnation of the SBF at 127°05′ E also allows moisture to accumulate at the SBF, leading to large rainfall ahead of the SBF. A less stable boundary layer provides a more favorable condition for deep moist convection [37]. The higher near-surface temperature in CNTL seems to compensate for less low-level convergence, leading to a similar maximum rainfall amount to NA. On the other hand, the SBF propagates to the east in NALB and NOURBAN where UHIC is weak or absent.
5. Summary and Discussion
In this study, we evaluated the performance of the WRF model in simulating the sea-breeze-initiated precipitation in the SMA against observations taken from AWS and wind lidar on 6 July 2017. The model performs well in capturing the development of a sea breeze and the sea-breeze-initiated maximum precipitation in the SMA. The location of sea-breeze-initiated maximum precipitation is associated with hot spots in the northeastern valley, which form as a result of topography as well as urban effects [12]. The model, on the other hand, does a poor job in simulating subsequent rainfall by overestimating rainfall produced by the interaction of outflow boundaries.
We performed factor separation analysis for the sea-breeze-initiated 3-h accumulated precipitation to examine the relative role of sea breeze and urban effect in the sea-breeze-initiated precipitation. The results show that the interaction of sea breeze and urban circulation influences both location and amount of precipitation in Seoul, leading to large precipitation in the northwest and northeast of Seoul. To further examine which urban factor plays a role in the precipitation, we performed factor separation of anthropogenic heat and urban roughness. We found that both anthropogenic heat and urban roughness increase precipitation in the northeast of the SMA with a larger contribution of anthropogenic heat. Our result confirms the previous finding of precipitation enhancement of downwind of the urban area [5,9]. Compared with the previous studies, we provide the explicit role of anthropogenic heat and urban roughness on the sea breeze and subsequent deep convection in terms of low-level convergence at the SBF and thermal instability. Both urban roughness and anthropogenic heat increase the intensity of UHIC. The presence of a westerly urban breeze ahead of the SBF reduces low-level convergence at the SBF. Wind speed in the boundary layer is reduced by urban roughness, which reduces low-level convergence at the SBF. As a result of the reduced low-level convergence at the SBF and the dry urban surface, the occurrence of deep convection at the SBF is delayed until the SBF reaches the convergence zone of UHIC, resulting in large low-level convergence and subsequent rainfall. Both anthropogenic heat and urban roughness increase near-surface temperature, increasing thermal instability.
The sensitivity of our simulations to anthropogenic heat and urban roughness has implications for convective storm forecasting. Both factors increase near-surface air temperature and thus play a role in forming hot spots favorable for deep convection. The use of high spatial resolution of anthropogenic heat and building information is required for good forecasting.
This study has scope for further analysis that will be carried out in future studies. For example, how aerosols affect the rainfall pattern and their relative contribution to the SBF effect needs to be examined by considering a greater number of cases.
Author Contributions
Conceptualization, methodology, formal analysis, and writing—original draft preparation: Y.C.; writing—review and editing, supervision: Y.-H.L. All authors have read and agreed to the published version of the manuscript.
Funding
This study was supported by the Korea Environmental Industry & Technology Institute (KEITI) of the Korea Ministry of Environment (MOE) as “Water Management Research Program” (79615) and by the Basic Science Research Program through the National Research Foundation of Korea (NRF) funded by the Ministry of Science, ICT & Future Planning (2020R1A2C1009538).
Institutional Review Board Statement
Not applicable.
Informed Consent Statement
Not applicable.
Data Availability Statement
The data that support the findings of this study are available from the corresponding author upon request.
Acknowledgments
This study was supported by the Korea Environmental Industry & Technology Institute (KEITI) of the Korea Ministry of Environment (MOE) as “Water Management Research Program” (79615) and by the Basic Science Research Program through the National Research Foundation of Korea (NRF) funded by the Ministry of Science, ICT & Future Planning (2020R1A2C1009538). The wind lidar data were jointly provided by the Korea Meteorological Administration (Weather Information Service Engine) and Hankuk University of Foreign Studies.
Conflicts of Interest
The authors declare no conflict of interest.
References
- Pielke, R.A. A three-dimensional numerical model of the sea breezes over south Florida. Mon. Weather Rev. 1974, 102, 115–139. [Google Scholar] [CrossRef] [Green Version]
- Baker, R.D.; Lynn, B.H.; Boone, A.; Tao, W.-K.; Simpson, J. The influence of soil moisture, coastline curvature, and land-breeze circulations on sea-breeze-initiated precipitation. J. Hydrometeorol. 2001, 2, 193–211. [Google Scholar] [CrossRef] [Green Version]
- Miller, S.T.K.; Keim, B.D.; Talbot, R.W.; Mao, H. Seabreeze: Structure, forecasting, and impacts. Rev. Geophys. 2003, 41, 1011. [Google Scholar] [CrossRef] [Green Version]
- Fu, S.; Rotunno, R.; Chen, J.; Deng, X.; Xue, H. A large-eddy simulation study of deep-convection initiation through the collision of two sea-breeze fronts. Atmos. Chem. Phys. 2021, 21, 9289–9308. [Google Scholar] [CrossRef]
- Shepherd, J.M.; Carter, M.; Manyin, M.; Messen, D.; Burian, S. The impact of urbanization on current and future coastal precipitation: A case study for Houston. Environ. Plan. B Urban Anal. City Sci. 2010, 37, 284–304. [Google Scholar] [CrossRef] [Green Version]
- Dauhut, T.; Chaboureau, J.-P.; Escobar, J.; Mascart, P. Giga-LES of Hector the Convector and its two tallest updrafts up to the stratosphere. J. Atmos. Sci. 2016, 73, 5041–5060. [Google Scholar] [CrossRef]
- Jauregui, E.; Romales, E. Urban effects on convective precipitation in Mexico City. Atmos. Environ. 1996, 30, 3383–3389. [Google Scholar] [CrossRef]
- Shem, W.; Shepherd, M. On the impact of urbanization on summertime thunderstorms in Atlanta: Two numerical model case studies. Atmos. Res. 2009, 92, 172–189. [Google Scholar] [CrossRef]
- Han, J.-Y.; Baik, J.-J. A theoretical and numerical study of urban heat island-induced circulation and convection. J. Atmos. Sci. 2008, 65, 1859–1877. [Google Scholar] [CrossRef]
- Miao, S.; Chen, F.; Li, Q.; Fan, S. Impacts of urban processes and urbanization on summer precipitation: A case study of heavy rainfall in Beijing on 1 August 2006. J. Appl. Meteorol. Climatol. 2011, 50, 806–825. [Google Scholar] [CrossRef]
- Park, M.S.; Chae, J.H. Features of sea-land-breeze circulation over the Seoul Metropolitan area. Geosci. Lett. 2018, 5, 28. [Google Scholar] [CrossRef] [Green Version]
- Ryu, Y.H.; Baik, J.J. Daytime local circulations and their interactions in the Seoul Metropolitan area. J. Appl. Meteorol. Climatol. 2013, 52, 784–800. [Google Scholar] [CrossRef]
- Skamarock, W.C.; Klemp, J.B.; Dudhia, J.; Gill, D.O.; Barker, D.M.; Duda, M.G.; Huang, X.Y.; Wang, W.; Powers, J.G. A Description of the Advanced Research WRF Version 3. Tech. Note NCAR/TN-475+STR, NCAR. 2008, p. 174. Available online: https://opensky.ucar.edu/islandora/object/technotes:500 (accessed on 5 November 2021).
- Morrison, H.; Thompson, G.; Tatarskii, V. Impact of Cloud Microphysics on the Development of Trailing Stratiform Precipitation in a Simulated Squall Line: Comparison of One- and Two-Moment Schemes. Mon. Weather Rev. 2009, 137, 991–1007. [Google Scholar] [CrossRef] [Green Version]
- Shin, H.H.; Hong, S.-Y. Representation of the subgrid-scale turbulent transport in convective boundary layers at gray-zone resolutions. Mon. Weather Rev. 2015, 143, 250–271. [Google Scholar] [CrossRef]
- Mlawer, E.J.; Taubman, S.J.; Brown, P.D.; Jacono, M.J.; Clough, S.A. Radiative transfer for inhomogeneous atmosphere: RRTM, a validated correlated k-model for the long-wave. J. Geophys. Res. 1997, 102, 16663–166682. [Google Scholar] [CrossRef] [Green Version]
- Dudhia, J. Numerical study of convection observed during the Winter Monsoon Experiment using a mesoscale two–dimensional model. J. Atmos. Sci. 1989, 46, 3077–3107. [Google Scholar] [CrossRef]
- Kain, J.S. The Kain-Fritsch convective parameterization: An update. J. Appl. Meteorol. 2004, 43, 170–181. [Google Scholar] [CrossRef] [Green Version]
- Tewari, M.; Chen, F.; Wang, W.; Dudhia, J.; LeMone, M.; Mitchell, K.; Ek, M.; Gayno, G.; Wegiel, J.; Cuenca, R. Implementation and verification of the unified NOAH land surface model in the WRF model. In 20th Conference on Weather Analysis and Forecasting/16th Conference on Numerical Weather Prediction; American Meteorological Society: Seattle, WA, USA, 2004; Volume 1115, pp. 2165–2170. [Google Scholar]
- Kusaka, H.; Kondo, H.; Kikegawa, Y.; Kimura, F. A simple single-layer urban canopy model for atmospheric models: Comparison with multi-layer and slab models. Bound.-Layer Meteorol. 2001, 101, 329–358. [Google Scholar] [CrossRef]
- Macdonald, R.W.; Griffiths, R.F.; Hall, D.J. An improved method for estimation of surface roughness of obstacle arrays. Atmos. Environ. 1998, 32, 1857–1864. [Google Scholar] [CrossRef]
- Kwon, T.H.; Park, M.-S.; Yi, C.; Choi, Y.J. Effects of different averaging operators on the urban turbulent fluxes. Atmos. KMS 2014, 24, 197–206. [Google Scholar] [CrossRef]
- Lee, S.-H.; Song, C.-K.; Baik, J.-J.; Park, S.-U. Estimation of anthropogenic heat emission in the Gyeong—In region of Korea. Theor. Appl. Clim. 2009, 96, 291–303. [Google Scholar] [CrossRef]
- Park, M.S.; Park, S.H.; Chae, J.H.; Choi, M.H.; Song, Y.; Kang, M.; Roh, J.W. High-resolution urban observation network for user-specific meteorological information service in the Seoul Metropolitan area, South Korea. Atmos. Meas. Tech. 2017, 10, 1575–1594. [Google Scholar] [CrossRef]
- Park, J.-Y.; Suh, M.-S. Improvement of MODIS land cover classification over the Asia-Oceania region. Korean J. Remote Sens. 2015, 31, 51–64. [Google Scholar] [CrossRef] [Green Version]
- NIMR Construction of Input Data for WRF-UCM Using GIS and Its Operating Method, NIMR-TN2014-016, NIMR. 2014; p. 47.
- Reuter, H.I.; Nelson, A.; Jarvis, A. An evaluation of void filling interpolation methods for SRTM data. Int. J. Geogr. Inf. Sci. 2007, 21, 983–1008. [Google Scholar] [CrossRef]
- Stein, U.; Alpert, P. Factor separation in numerical simulations. J. Atmos. Sci. 1993, 50, 2107–2115. [Google Scholar] [CrossRef] [Green Version]
- Reddy, T.V.R.; Mehta, S.K.; Ananthavel, A.; Ali, S.; Annamalai, V.; Rao, D.N. Seasonal characteristics of sea breeze and thermal internal boundary layer over Indian coast region. Meteorol. Atmos. Phys. 2021, 133, 217–232. [Google Scholar] [CrossRef]
- Wallace, J.M.; Hobbs, P.V. Atmospheric Science an Introductory Survey, 2nd ed.; Academic Press: San Diego, CA, USA, 2006; pp. 344–366. [Google Scholar]
- Fovell, R.G. Convective initiation ahead of the sea-breeze front. Mon. Weather Rev. 2005, 133, 264–278. [Google Scholar] [CrossRef]
- Laird, N.F.; Kristovich, D.A.R.; Rauber, R.M.; Ochs, H.T.; Miller, L.J. The Cape Canaveral Sea and River Breezes: Kinematic structure and convective initiation. Mon. Weather Rev. 1995, 123, 2942–2956. [Google Scholar] [CrossRef] [Green Version]
- Freitag, B.M.; Nair, U.S.; Noyogi, D. Urban modification of convection and rainfall in complex terrain. J. Geophys. Res. 2018, 45, 2507–2515. [Google Scholar] [CrossRef]
- Kitada, T.; Okamura, K.; Tanaka, S. Effects of topography and urbanization on local winds and thermal environment in the Nohbi Plain, coastal region of central Japan: A numerical analysis by mesoscale meteorological model with a k-turbulence model. J. Appl. Meteorol. 1998, 37, 1026–1046. [Google Scholar] [CrossRef]
- Ryu, Y.-H.; Smith, J.A.; Bou-zeid, E.; Baeck, M.L. The influence of land surface heterogeneities on heavy convective rainfall in the Baltimore-Washington Metropolitan area. Mon. Weather Rev. 2016, 144, 553–573. [Google Scholar] [CrossRef]
- Freitas, E.D.C.; Rozoff, C.M.; Cotton, W.R.; Silva Dias, P.L. Interactions of an urban heat island and sea-breeze circulations during winter over the metropolitan area of Sao Paulo, Brazil. Bound.-Layer Meteorol. 2007, 122, 43–65. [Google Scholar] [CrossRef]
- Baik, J.J.; Kim, Y.-H.; Kim, H.-J.; Han, J.-Y. Effects of boundary-layer stability on urban heat island-induced circulation. Theor. Appl. Clim. 2007, 89, 73–81. [Google Scholar] [CrossRef]
Figure 1.
(a) Domain configuration of the WRF model simulation, (b) the horizontal distribution of terrain height in domain 3. The black box in domain 3 denotes the analysis domain of the Seoul Metropolitan Area, and the horizontal distribution of (c) land use and (d) terrain height in the analysis domain in this study. In (b), the location of observation stations is marked by dots (purple: Gongchondong, blue: Gimpo airport, black: Seoul, red: Gwanghwamun, yellow: Osan). In (d), black dots indicate all of the AWS and ASOS stations in the analysis domain.

Figure 2.
(a) Surface weather chart, and (b) Skew T–Log P diagram at Osan station at 1500 LST on 6 July 2017 (blue line: 1500 LST, red line: 2100 LST, solid line: temperature, dot line: dew point temperature) (Source: Korea Meteorological Administration).
Figure 2.
(a) Surface weather chart, and (b) Skew T–Log P diagram at Osan station at 1500 LST on 6 July 2017 (blue line: 1500 LST, red line: 2100 LST, solid line: temperature, dot line: dew point temperature) (Source: Korea Meteorological Administration).

Figure 3.
The time series of wind direction (arrow) and speed (blue line) for (a) Gongchondong, (b) Gimpo airport, and (c) Seoul station. The black line in (b) and (c) indicates air temperature and the mixing ratio, respectively. The black vertical line indicates the arrival time of the sea breeze front (SBF).

Figure 4.
Comparison of 10 m wind vector and 2 m air temperature at (a) Gongchongdong, (b) Gimpo Airport, and (c) Seoul station from 0600 to 2100 LST on 6 July 2017 between CNTL (red) and observation (blue).
Figure 4.
Comparison of 10 m wind vector and 2 m air temperature at (a) Gongchongdong, (b) Gimpo Airport, and (c) Seoul station from 0600 to 2100 LST on 6 July 2017 between CNTL (red) and observation (blue).

Figure 5.
The time–height cross-section of u-component of wind for (a) CNTL simulation and (c) observation, v-component of wind for (b) CNTL simulation, and (d) observation measured by wind lidar at Gwanghwamun site from 0000 to 2400 LST on 6 July 2017.
Figure 5.
The time–height cross-section of u-component of wind for (a) CNTL simulation and (c) observation, v-component of wind for (b) CNTL simulation, and (d) observation measured by wind lidar at Gwanghwamun site from 0000 to 2400 LST on 6 July 2017.

Figure 6.
The time series of peak rain rates in the analysis domain in CNTL and observation (OBS) from 1400 to 2400 LST on 6 July 2017.
Figure 6.
The time series of peak rain rates in the analysis domain in CNTL and observation (OBS) from 1400 to 2400 LST on 6 July 2017.

Figure 7.
The horizontal distribution of the 3 h accumulated rainfall (mm) for the period of 1500–1800 LST for (a) observation and (b) CNTL simulation. E and D in (a) represent Eunpyeong and Dongdaemun stations, respectively. Boxes in (b) indicate regions in Table 4, and black dots indicate observation stations with maximum rainfall in each region.

Figure 8.
The time series of 10-min rainfall (mm) at the locations with maximum rainfall in northeastern (a,b), south-center (c,d), and northwest (e,f) in the analysis domain. (a,c,e) Observation, (b,d,f) CNTL simulation from 1500 to 1800 LST on 6 July 2017.
Figure 8.
The time series of 10-min rainfall (mm) at the locations with maximum rainfall in northeastern (a,b), south-center (c,d), and northwest (e,f) in the analysis domain. (a,c,e) Observation, (b,d,f) CNTL simulation from 1500 to 1800 LST on 6 July 2017.

Figure 9.
3-h accumulated rainfall (mm) for the period of 1500–1800 LST for (a) NOSEA, (b) NOURBAN, (c) NOSEANOURB, (d) NA, (e) LB, and (f) NALB simulation on 6 July 2017.
Figure 9.
3-h accumulated rainfall (mm) for the period of 1500–1800 LST for (a) NOSEA, (b) NOURBAN, (c) NOSEANOURB, (d) NA, (e) LB, and (f) NALB simulation on 6 July 2017.

Figure 10.
3-h accumulated rainfall (mm) (a) unrelated to either sea or urban, (b) induced by sea, (c) induced by urban, and (d) induced by the interaction between sea and urban from 1500 to 1800 LST.
Figure 10.
3-h accumulated rainfall (mm) (a) unrelated to either sea or urban, (b) induced by sea, (c) induced by urban, and (d) induced by the interaction between sea and urban from 1500 to 1800 LST.

Figure 11.
3-h accumulated rainfall (mm) (a) unrelated to either urban roughness or anthropogenic heat, (b) induced by urban roughness, (c) induced by anthropogenic heat, and (d) induced by the interaction between urban roughness and anthropogenic heat from 1500 to 1800 LST.
Figure 11.
3-h accumulated rainfall (mm) (a) unrelated to either urban roughness or anthropogenic heat, (b) induced by urban roughness, (c) induced by anthropogenic heat, and (d) induced by the interaction between urban roughness and anthropogenic heat from 1500 to 1800 LST.

Figure 12.
Horizontal distribution of 10 m wind vector and 2 m air temperature in analysis domain at 1600 LST in (a) CNTL, (b) LB, (c), NA, (d) NALB, and (e) NOURBAN simulation.
Figure 12.
Horizontal distribution of 10 m wind vector and 2 m air temperature in analysis domain at 1600 LST in (a) CNTL, (b) LB, (c), NA, (d) NALB, and (e) NOURBAN simulation.

Figure 13.
Longitude-height cross-section of meridional-averaged u-component of wind (m s−1) in analysis domain for (a,b) CNTL, (c,d) LB, (e,f) NA, (g,h) NALB, (i,j) NOURBAN at 1600 (a,c,e,g,i) and 1700 (b,d,f,h,j) LST. The black dots indicate the location of the SBF.
Figure 13.
Longitude-height cross-section of meridional-averaged u-component of wind (m s−1) in analysis domain for (a,b) CNTL, (c,d) LB, (e,f) NA, (g,h) NALB, (i,j) NOURBAN at 1600 (a,c,e,g,i) and 1700 (b,d,f,h,j) LST. The black dots indicate the location of the SBF.


Table 1.
Description of control and sensitivity simulations.
| Simulation | Description |
|---|---|
| CNTL | Control |
| NOSEA | Cropland replaces sea |
| NOURBAN | Cropland replaces urban area |
| NOSEANOURB | Cropland replaces sea and urban area |
| NA | No anthropogenic heat or anthropogenic latent heat |
| LB | Lowered building height |
| NALB | No anthropogenic heat, anthropogenic latent heat or lowered building height |
Table 2.
Values of urban parameters depending on the urban type used in CNTL and sensitivity simulations. Urban 1, 2, and 3 represent low-intensity residential, high intensity residential, and industrial or commercial, respectively.
Table 2.
Values of urban parameters depending on the urban type used in CNTL and sensitivity simulations. Urban 1, 2, and 3 represent low-intensity residential, high intensity residential, and industrial or commercial, respectively.
| Simulation | Land Use | Building Height (m) | Standard Deviation of Roof Height (m) | Anthropogenic Heat (W m−2) | Anthropogenic Latent Heat (W m−2) |
|---|---|---|---|---|---|
| CNTL | Urban 1 | 5 | 1 | 20 | 20 |
| Urban 2 | 7.5 | 3 | 50 | 25 | |
| Urban 3 | 10 | 4 | 90 | 40 | |
| NA | Urban 1 | 5 | 1 | 0 | 0 |
| Urban 2 | 7.5 | 3 | 0 | 0 | |
| Urban 3 | 10 | 4 | 0 | 0 | |
| LB | Urban 1 | 1 | 0.2 | 20 | 20 |
| Urban 2 | 1 | 0.2 | 50 | 25 | |
| Urban 3 | 1 | 0.2 | 90 | 40 | |
| NALB | Urban 1 | 1 | 0.2 | 0 | 0 |
| Urban 2 | 1 | 0.2 | 0 | 0 | |
| Urban 3 | 1 | 0.2 | 0 | 0 |
Table 3.
Calculation of factor separation.
| Factor | Calculation | Description |
|---|---|---|
| NOSEANOURB | Unrelated to either urban or sea breeze | |
| NOSEA − NOSEANOURB | Effect of urban | |
| NOURBAN − NOSEANOURB | Effect of sea breeze | |
| CNTL − (NOSEA + NOUR BAN) + NOSEANOURB | Interaction between urban and sea breeze | |
| NALB | Unrelated to either roughness or anthropogenic heat | |
| NA − NALB | Effect of roughness | |
| LB − NALB | Effect of anthropogenic heat | |
| CNTL − (NA + LB) + NALB | Interaction between roughness and anthropogenic heat |
Table 4.
Maximum 3 h accumulated rainfall for the period of 1500–1800 LST in each region (Figure 7b) in the analysis domain for observation and CNTL simulation and location error between model and observation.
Table 4.
Maximum 3 h accumulated rainfall for the period of 1500–1800 LST in each region (Figure 7b) in the analysis domain for observation and CNTL simulation and location error between model and observation.
| Region | Obs (mm) | Mod (mm) | Location Error (km) |
|---|---|---|---|
| Northeast | 56.5 | 43.6 | 5 |
| Northwest | 47.0 | 23.9 | 7 |
| South-center | 29.5 | 11.5 | 4 |
Table 5.
Summary of maximum 3-h accumulated rainfall in the analysis domain for the period of 1500–1800 LST in the analysis domain on 6 July 2017.
Table 5.
Summary of maximum 3-h accumulated rainfall in the analysis domain for the period of 1500–1800 LST in the analysis domain on 6 July 2017.
| Simulation | Time of Maximum Rainfall (LST) | Maximum 3-h Accumulated Rainfall (mm) | Longitude (Degree E) | Latitude (Degree N) |
|---|---|---|---|---|
| CNTL | 1700–1800 | 43.6 | 127.10 | 37.62 |
| LB | 1700–1800 | 54.4 | 127.09 | 37.56 |
| NA | 1700–1800 | 41.3 | 127.09 | 37.58 |
| NALB | 1600–1700 | 36.0 | 127.04 | 37.55 |
| NOURBAN | 1600–1700 | 20.7 | 127.01 | 37.55 |
Table 6.
Summary of meridional-averaged sea breeze features in the analysis domain. Here, the low level indicates below the fifth model level (around 570 m a.g.l.).
Table 6.
Summary of meridional-averaged sea breeze features in the analysis domain. Here, the low level indicates below the fifth model level (around 570 m a.g.l.).
| Simulation | CNTL | LB | NA | NALB | NOURBAN |
|---|---|---|---|---|---|
| Mean low-level wind speed at the western boundary at 1600 LST (m s−1) | 4.3 | 4.3 | 3.9 | 4.3 | 3.5 |
| Low-level convergence at the SBF at 1600 LST (10−4 s−1) | 3.5 | 6.4 | 4.3 | 5.1 | 7.1 |
| Low-level mixing ratio at the SBF at 1600 LST (g kg−1) | 15.3 | 15.2 | 15.3 | 15.5 | 16.2 |
| Mean low-level wind speed at the western boundary at 1700 LST (m s−1) | 4.0 | 4.0 | 3.7 | 3.9 | 3.4 |
| Low-level convergence at the SBF at 1700 LST (10−4 s−1) | 7.76 | 13.8 | 13.2 | 4.8 | 9.5 |
| Low-level mixing ratio at the SBF at 1700 LST (g kg−1) | 16.5 | 16.7 | 16.5 | 16.3 | 16.2 |
Publisher’s Note: MDPI stays neutral with regard to jurisdictional claims in published maps and institutional affiliations. |
© 2021 by the authors. Licensee MDPI, Basel, Switzerland. This article is an open access article distributed under the terms and conditions of the Creative Commons Attribution (CC BY) license (https://creativecommons.org/licenses/by/4.0/).
Share and Cite
MDPI and ACS Style
Choi, Y.; Lee, Y.-H. Urban Effect on Sea-Breeze-Initiated Rainfall: A Case Study for Seoul Metropolitan Area. Atmosphere 2021, 12, 1483. https://doi.org/10.3390/atmos12111483
AMA Style
Choi Y, Lee Y-H. Urban Effect on Sea-Breeze-Initiated Rainfall: A Case Study for Seoul Metropolitan Area. Atmosphere. 2021; 12(11):1483. https://doi.org/10.3390/atmos12111483
Chicago/Turabian StyleChoi, Yuna, and Young-Hee Lee. 2021. "Urban Effect on Sea-Breeze-Initiated Rainfall: A Case Study for Seoul Metropolitan Area" Atmosphere 12, no. 11: 1483. https://doi.org/10.3390/atmos12111483
Note that from the first issue of 2016, this journal uses article numbers instead of page numbers. See further details here.