Article

Seasonal to Interannual Variability of Vertical Wind Shear and Its Relationship with Tropical Cyclogenesis in the Mozambique Channel

by
Atanásio João Manhique
1,*,
Isac Arnaldo Guirrugo
1,
Bernardino João Nhantumbo
2 and
Alberto Francisco Mavume
1
1
Departamento de Física, Faculdade de Ciências, Universidade Eduardo Mondlane, Maputo C.P. 257, Mozambique
2
Instituto Nacional de Meteorologia, Maputo C.P. 256, Mozambique
*
Author to whom correspondence should be addressed.
Atmosphere 2021, 12(6), 739; https://doi.org/10.3390/atmos12060739
Submission received: 18 March 2021 / Revised: 18 May 2021 / Accepted: 21 May 2021 / Published: 9 June 2021
(This article belongs to the Special Issue Tropical Cyclones in the Indian Ocean)

Abstract

:
This article explores the relationship between vertical wind shear (VWS) and tropical cyclone (TC) genesis in the Mozambique Channel (MC) for the period 1979–2019. Additionally, SST, low-level relative vorticity, 700 hPa relative humidity and upper-level divergence were also analyzed for the peak cyclogenesis months to explore their relative contributions. The analyses were done using NCEP/NCAR Reanalysis-1 for the atmospheric fields, monthly Optimum Interpolation SST V2, and for the cyclogenesis the TC best track data from the La Reunion–Regional Specialized Meteorological and Joint Typhoon Warning Centre. A total of 43 TCs generated in the MC were observed for the analysed period. The maximum frequency of cyclogenesis in the MC was observed during January and February and the spatial location of maximum TC genesis was coincident with the minimum values of the VWS. The VWS showed significant correlations with TC intensity, particularly when considering the upper atmosphere (200–500 hPa) or the bulk (200–850 hPa) VWS. The mean composites of the cyclogenesis months over the MC of SST, relative humidity at 700 hPa, divergence at upper atmosphere, showed significant values. However, linear correlations between these factors vs. TC genesis frequency and intensity were not significant. Analyses of interannual correlations between VWS and Niño-3.4 (subtropical southwest Indian Ocean dipole-SIOD) showed statistically significant positive (negative) correlations at different lags, suggesting that La Niña and the positive phase of SIOD conditions are favorable to weaker VWS and thus to intensification of TCs in the Mozambique Channel. Thirteen landfall cases were observed with seven over the Madagascar west coast and six over the Mozambique coast. The landfall over the Madagascar (Mozambique) coast was associated with strengthened (weakened) VWS.

1. Introduction

The process by which tropical cyclones (TCs) form and intensify, often referred to as tropical cyclogenesis, is strongly dependent on the existence of several environmental conditions. Gray [1] listed six basic conditions favoring TC genesis, namely: (i) sea surface temperature (SST) exceeding 26 °C, (ii) enhanced mid-troposphere (700 hPa) relative humidity, (iii) conditional instability, (iv) enhanced lower troposphere relative vorticity, (v) weak vertical environmental wind shear (VWS) and (vi) a displacement by at least 5° latitude away from the equator. Chan et al. [2] suggested that VWS is one of the main governing factors of both tropical cyclogenesis and tropical cyclone intensity. Moreover, some studies indicate that the uncertainties in forecasting the environmental wind shear values prevent the improvements in TC intensity forecast [3,4]. Over the tropical Pacific, some studies have indicated that VWS is a key environmental variable that determines the TCs development [5,6]. Jones et al. [7] considered the VWS a key predictor of seasonal TC activity. Although some literature has shown cases of cyclones intensifying under moderate to strong VWS (e.g., [8,9,10]), in general large values of VWS are considered to be detrimental to the formation as well as the intensification of TCs, due to the “ventilation” effect [1,11,12,13]. Chan et al. [2] have indicated that the reduction of ventilation above the boundary layer due to vertical alignment is crucial to accumulate the energy within the inner core region of a TC. Nolan and McGauley [6] studied the relationship between VWS and TC genesis events within the latitudes 20° S and 20° N from 1969 to 2008, and found that VWS values in the range of 1.25–5 m/s are the most favorable for TC genesis, although previous studies suggested VWS values between 5–10 m/s (e.g., [14]). Some studies also suggested that there is a VWS threshold value above which TCs may not develop, for example, a threshold value of 12.5 m/s was determined for the western North Pacific by Zehr [15].
The Southwest Indian Ocean (SWIO) is one of the major basins of TCs formation and intensification. TCs forming in this region account for about 14% of the global total, with an average of 12–13 TCs forming each year in the cyclone season running from November to April [16,17,18]. SWIO TCs, especially those forming in the Mozambique Channel (MC) have been poorly studied so far although they frequently impact island nations and countries on the mainland of southeastern Africa [19,20,21]. Leroux et al. [21] stated that over the cyclone seasons from 1999/2000 to 2015/16, on average, Mozambique was hit by tropical systems once per year and by TCs about once every 3 years, and that those numbers are even worse for Madagascar, which was hit twice per year by tropical systems and was hit once every 2 years by TCs. These countries are listed as the world’s least developed, with high levels of vulnerability to climatic shocks. This study aims to contribute to the improvement of monitoring and seasonal forecast of TCs in the SWIO and thus to mitigation of the destructive impacts of TCs in the affected countries, which is one of the main objectives of the research project ReNovRisk-Cyclone [22].
Previous studies [23,24,25] have described several characteristics of the VWS and its association with tropical cyclone activity in the SWIO. Their results showed a band of weak VWS located near the Equator with a tendency to move (south–north) accompanying the displacement of the Inter-Tropical Convergence Zone (ITCZ) which is an important mechanism for tropical cyclogenesis. During the cyclone season in the SWIO, the ITCZ stretches across the MC between 15–20° S and the area of weak VWS along it can enhance the positive vorticity needed for tropical cyclogenesis in the region [18,26,27]. Matyas [28] indicated that given the displacement of the ITCZ in the MC during the cyclone season, TC formation frequency, location and environmental conditions by month. Ho et al. and Kuleshov et al. [17,25] suggested that during the cold phase of El Niño–Southern Oscillation (ENSO), there is a reduction of TC genesis in the western part of the South Indian Ocean (SIO, west of 75° E) and an increase in the eastern part (east of 75° E) as well as displacement of the area favorable for TC genesis further away from the equator and an inverted scenario is observed during the warm phase. The impact of VWS on TC genesis and intensification has been significantly explored globally, however, to our knowledge over the SWIO there are few studies, and none focusing on the MC. The MC has unique environmental conditions for TCs genesis, namely the presence of a summer trough which is associated with moist convection (e.g., [29]) the summer convergence zone, known as the South Indian Convergence Zone, which is associated with zonal wind convergence and moisture convergence [30] and the relative higher SST as compared to the same latitude east of Madagascar [18]. Moreover, the topography of Madagascar has a shielding effect, thus affecting the low-level circulation in the channel (e.g., [31]). Given these peculiarities, it is of interest to explore how the environmental factors contribute to the cyclogenesis in this region. The main objective of this study is to assess the relationship between the seasonal to interannual variability of the VWS and TC genesis frequency and intensity in the MC.
This paper is organized into five sections as follows: Section 1 presents the introduction, Section 2 describes the datasets used and the methodology, Section 3 presents the results and Section 4 and Section 5 present the discussions and conclusions, respectively.

2. Data and Methodology

TC intensity and track data were obtained from La Reunion–Regional Specialized Meteorological Centre (LR-RSMC) freely available at http://www.meteo.fr/temps (accessed on 16 December 2019) and Joint Typhoon Warning Centre (JTWC) freely available at http://www.npmoc.navy.mil/jtwc.html (accessed on 16 December 2019). The data used cover the seasons 1978/79 to 2018/19 (the TC season in the SWIO is considered to be November to April) and the main region of analysis is restricted to the MC (10–27.5° S e 30–50° E). The datasets contain TC centre position (latitude and longitude) and intensity at 6-h intervals. In this study, a cyclogenesis point is defined as the first centre position along a cyclone track where the system reaches storm intensity (i.e., 1 min maximum sustained wind (MSW) > 17 m/s in JTWS data and 10-min maximum sustained wind > 15.4 m/s in LR- RSMC data). These data sets were used to plot the spatial distribution of cyclogenesis events and to analyze the seasonal and interannual frequency of cyclogenesis in the MC and the relationship with VWS. The JTWC dataset was used as the basic sample and the LR-RSMC dataset was used to fill in gaps encountered in JTWC data. A similar approach was previously used for the same region by Mavume et al. [18] and Bessafi and Wheeler [24]. Linear correlations were used to explore the statistical relationship between the number of TC cyclogenesis and VWS and also the maximum intensity and VWS. For years, with more than one TC system only the one with the maximum intensity has been considered, but if all have had the same category then all have been considered.
Monthly mean gridded atmospheric fields are obtained from the National Center for Environmental Prediction/National Centre for Atmospheric Research (NCEP/NCAR) Reanalysis-1 [32]. The datasets include zonal and meridional wind fields at the 200 and 850 hPa pressure levels, 850 hPa relative vorticity, 700 hPa relative humidity and 200 hPa divergence, available on a 2.5-degree global resolution in both latitude and longitude, from January 1948 to the present. Monthly mean Optimum Interpolation Sea Surface Temperature (OI SST) V2 [33] datasets are sourced from the National Oceanic and Atmospheric Administration (NOAA), and are available on a 1.0-degree global resolution in both latitude and longitude, from December 1981 to the present (accessed 10 March 2021).
The wind data were used to calculate the VWS, defined here as the magnitude of the vector difference of the 200 and 850 hPa horizontal winds. The magnitudes here are divided as in Rios-Berios and Torn [34], into three groups: weak (VWS < 4.5 m/s), moderate (4.5 ≤ VWS ≤ 11 m/s) and strong (VWS > 11 m/s). Mean maps of SST, 850 hPa relative vorticity, 700 hPa relative humidity, and 200 hPa divergence of the months with cyclogenesis in the MC are used to explore their potential contribution to the TC genesis.
Correlation analyses were used to explore the VWS versus El Niño and VWS versus SIOD relationships. The Niño 3.4 index is freely available at https://origin.cpc.ncep.noaa.gov/products/analysis_monitoring/ensostuff/ONI_v5.php (accessed on 22 April 2021), The SIOD index is defined as in Behera and Yamagata [35] and it was computed based on (OI SST) V2. Unless stated, all correlations shown in this study are above the 95% confidence level.

3. Results

The analyses of VWS and TC genesis were particularly focused on the MC for the December–March (Dec–Mar) period. This period covers more than 85% of TC activity in the MC [18,28].

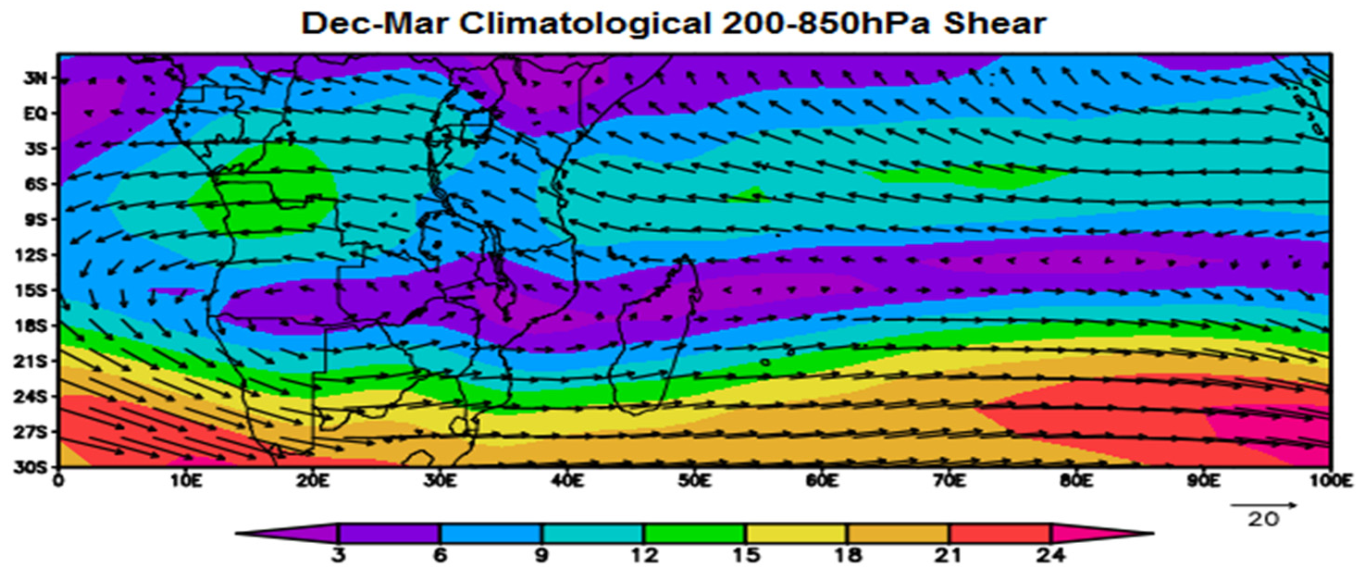
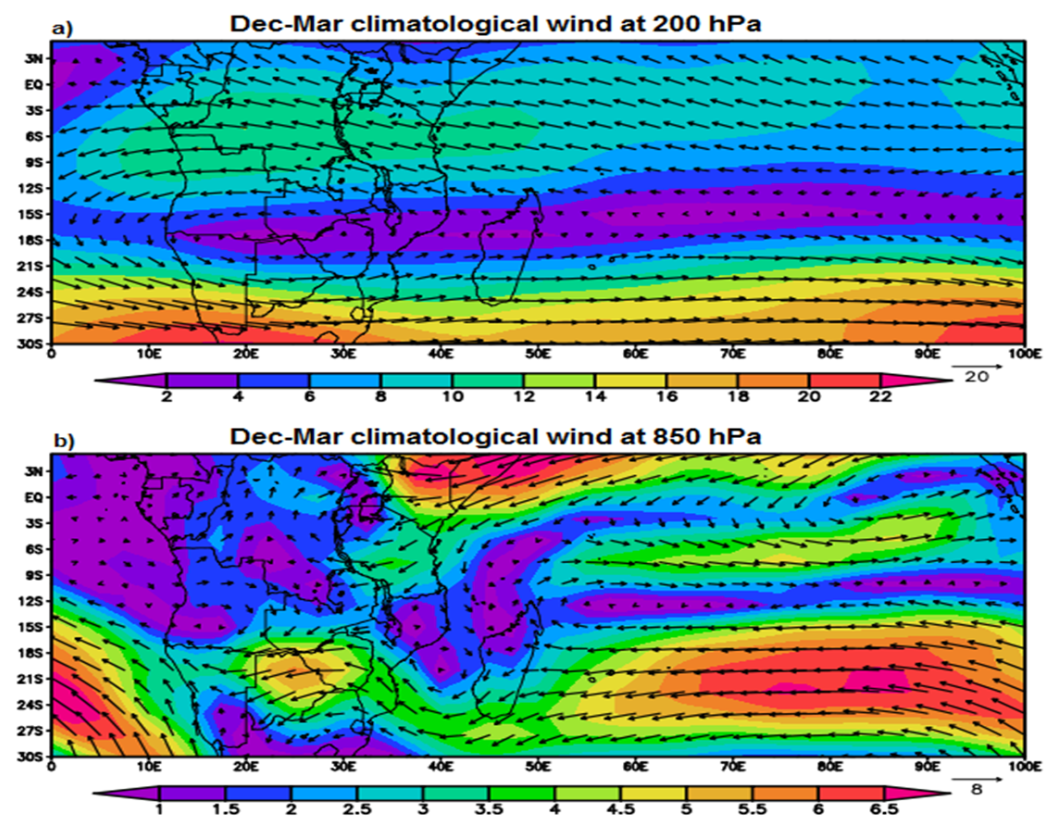
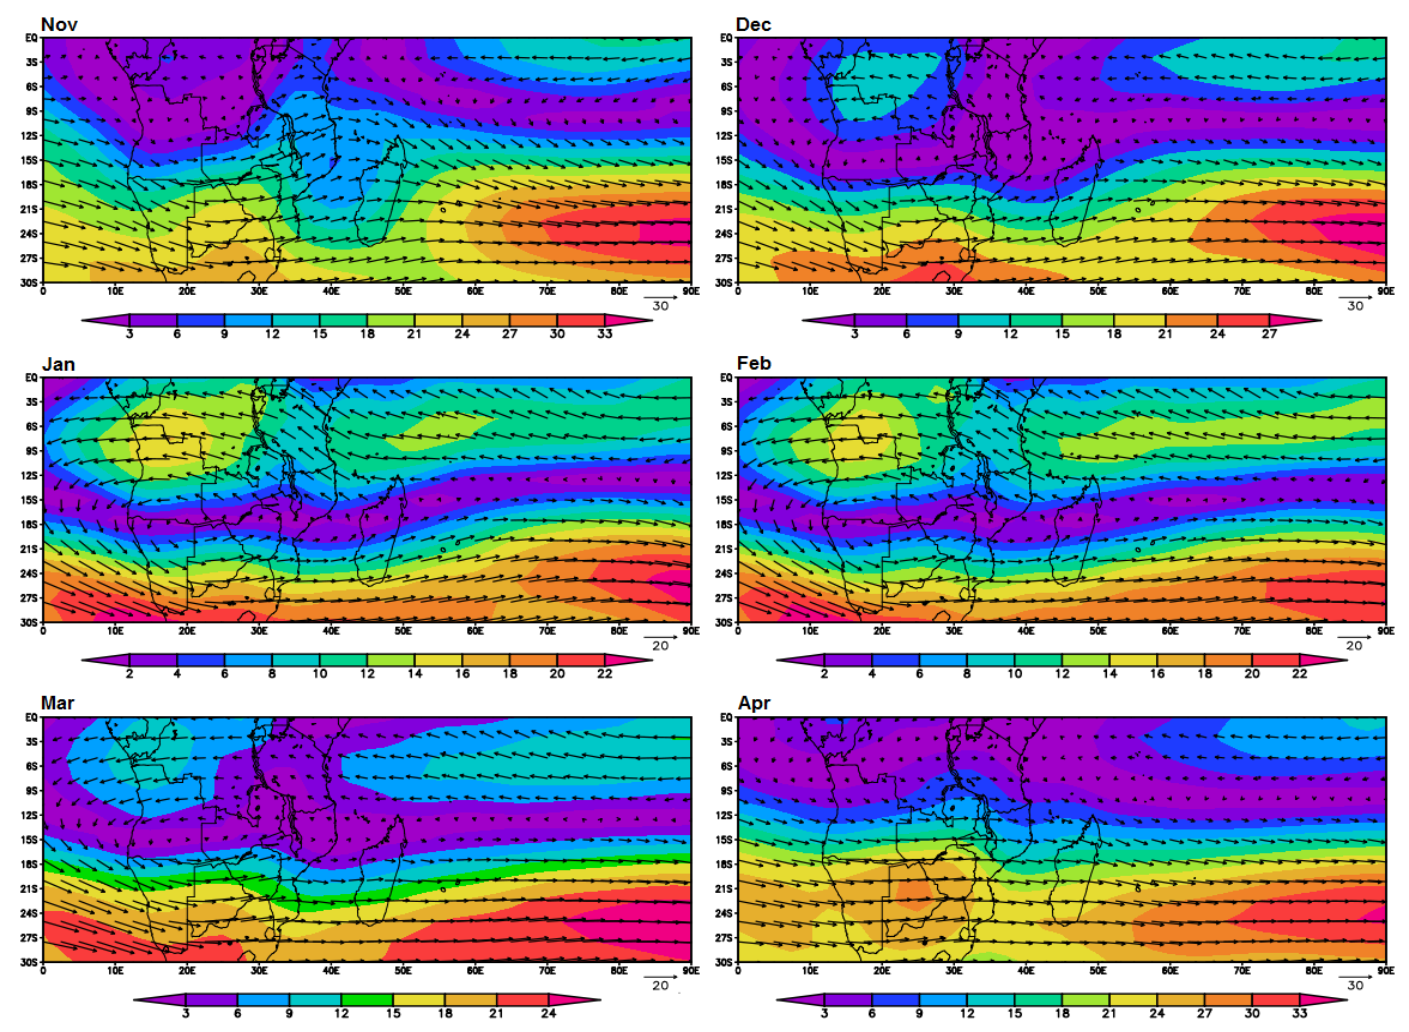
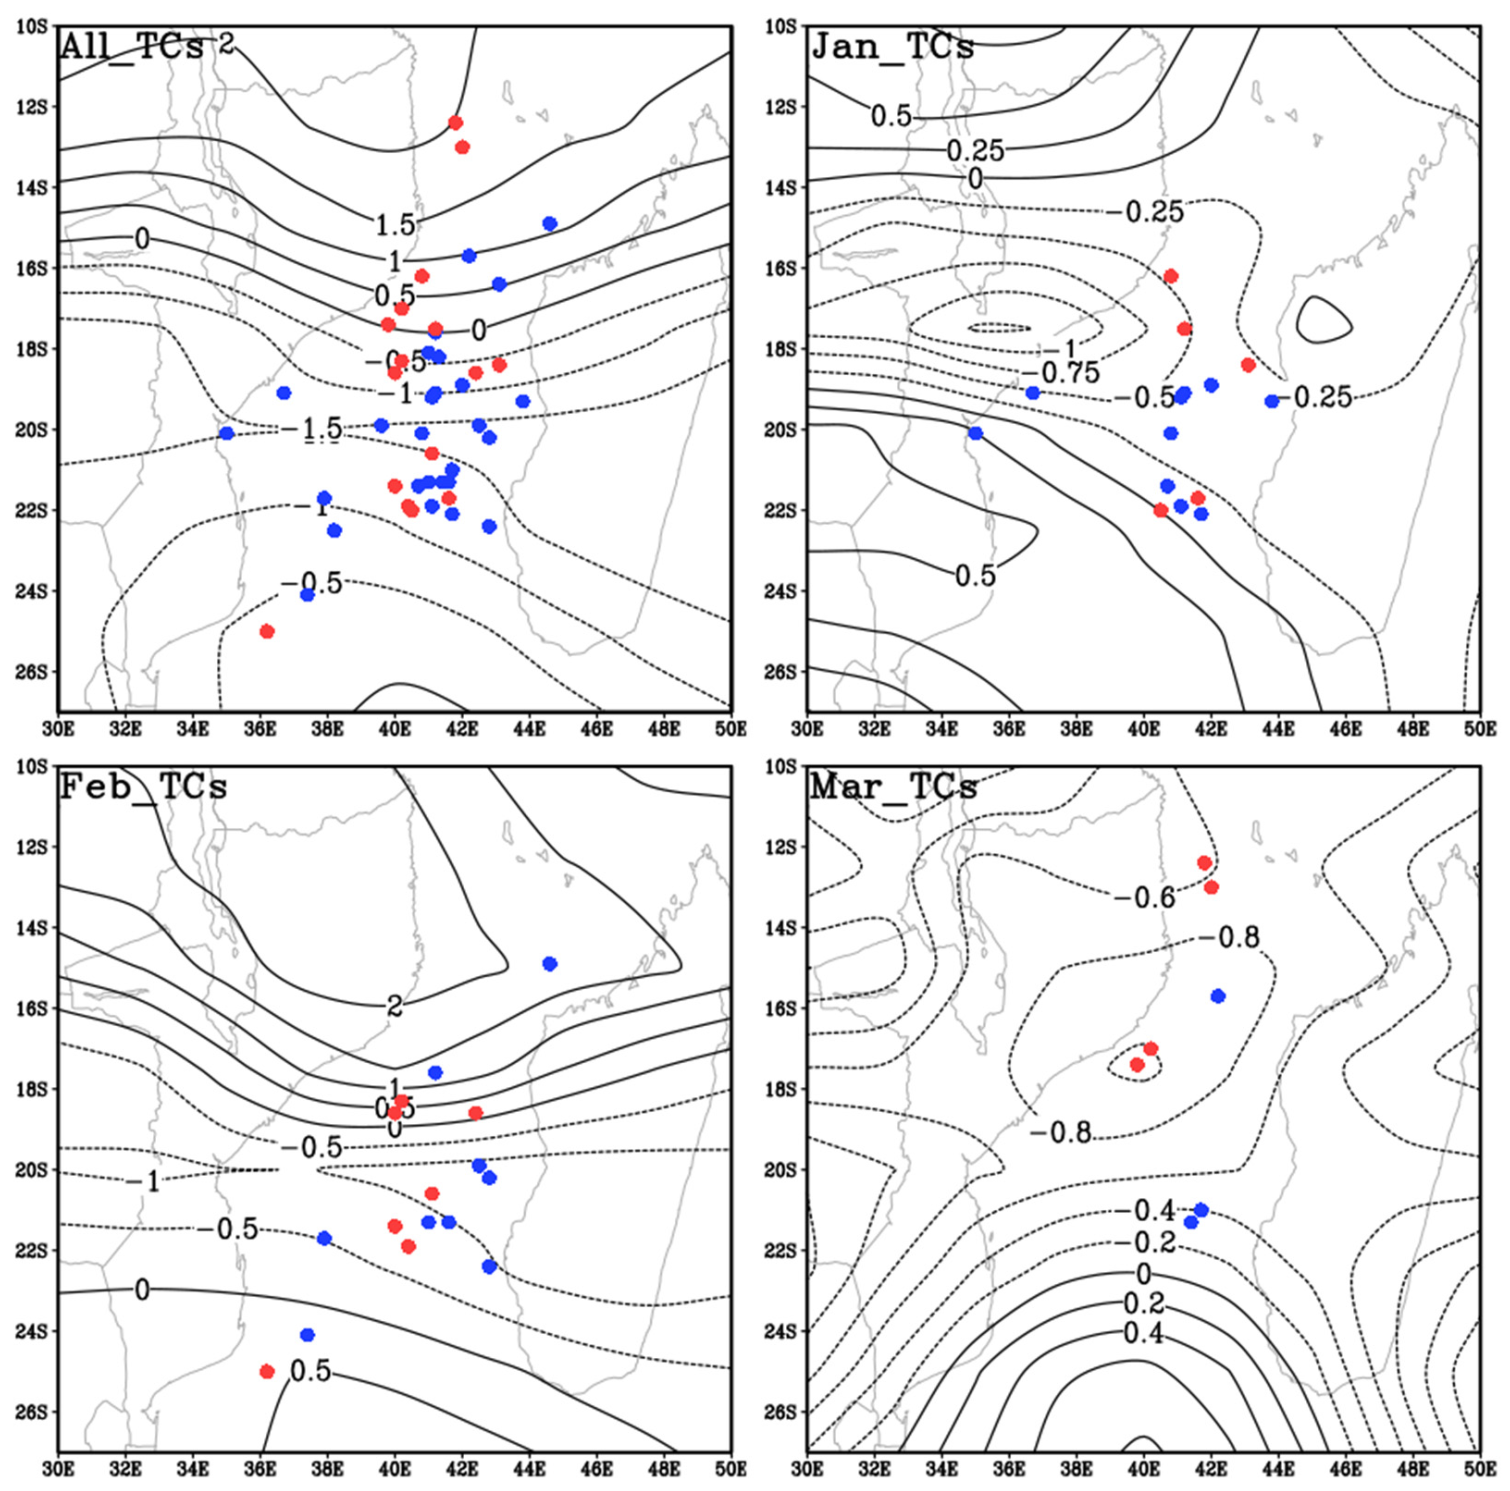
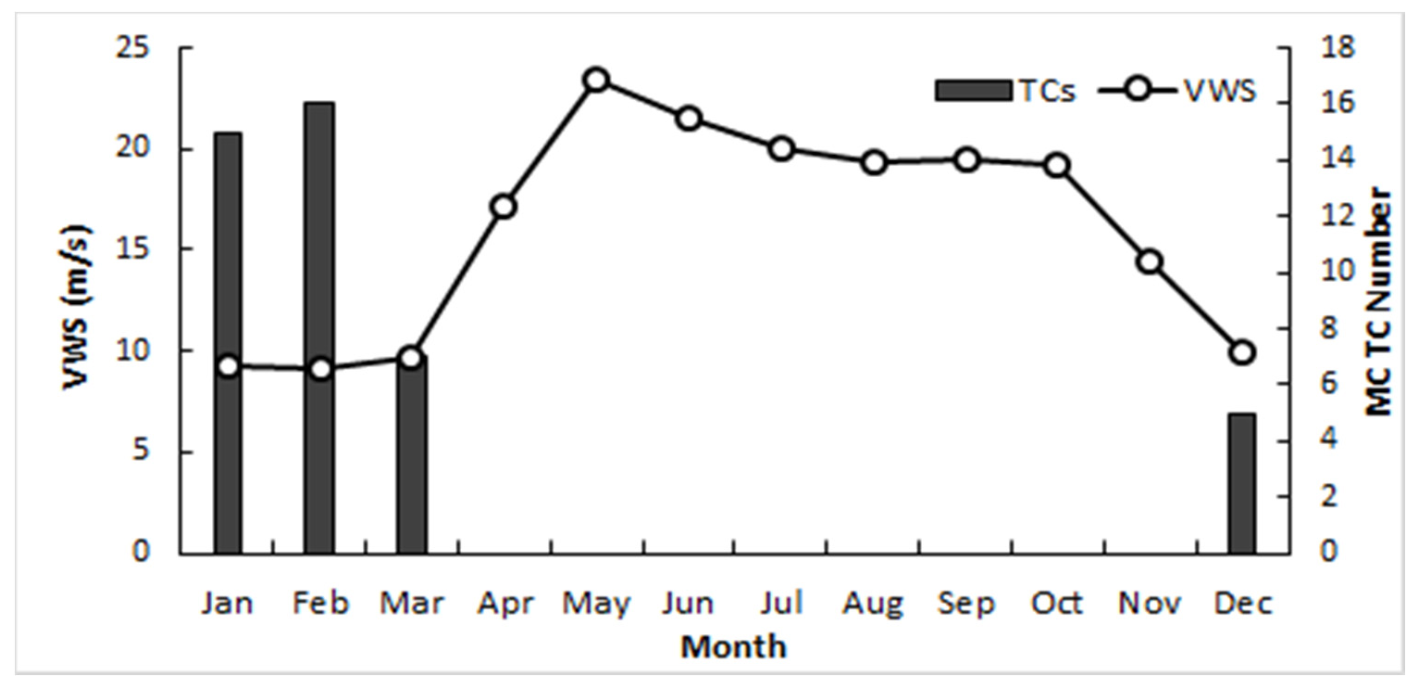
3.1. Spatial and Temporal Variability of Vertical Wind Shear

The mean Dec–Mar VWS for 1979–2019 and the respective circulation are shown in Figure 1. The prominent feature is the area of weak to moderate shear (not exceeding 6 m/s) extending across the SWIO between the latitudes 10–21° S. The VWS values are even smaller (equal or below 3 m/s) in some parts of the strip of low VWS, namely over central SWIO, northern Madagascar, the central Mozambique Channel and central parts of Mozambique.
Figure 2 shows the upper and lower-level Dec–Mar wind fields. It is noticeable that the band of weak VWS observed in the mean Dec–Mar (Figure 1) is associated with a band of weak winds at the 200 hPa level which separates the up-level subtropical westerlies and tropical easterlies (Figure 2a). At 850 hPa a similar band of weak winds observed, however, with less latitudinal extension, and with the wind direction on both side of the band reversed, i.e., with the westerlies over the tropical region associated with the cross-equatorial northeasterly monsoons and easterlies over the subtropical region accompanying the southward movement of the Indian Ocean high-pressure cell (see e.g., [29]). Over the MC a region of weak low-level wind associated with the MC trough (e.g., [29]) is observed. This region extends in a diagonal band from the central MC towards northern Mozambique.
The seasonal progression of the band of weak VWS is shown in Figure 3. The band moves southward in November and December and reaches its maximum southward position between January and February and then reverses equatorward.

3.2. Correlations between Vertical Wind Shear vs. El Niño and Subtropical Indian Ocean Dipole (SIOD)

Correlations were performed at different lags for December–March VWS (200–850 hPa) vs. Niño-3.4 and SIOD indices. Table 1 shows the correlation coefficients. The Niño-3.4 (SIOD) index showed significant and positive (negative) correlations with 200–850 hPa VWS at different lags.

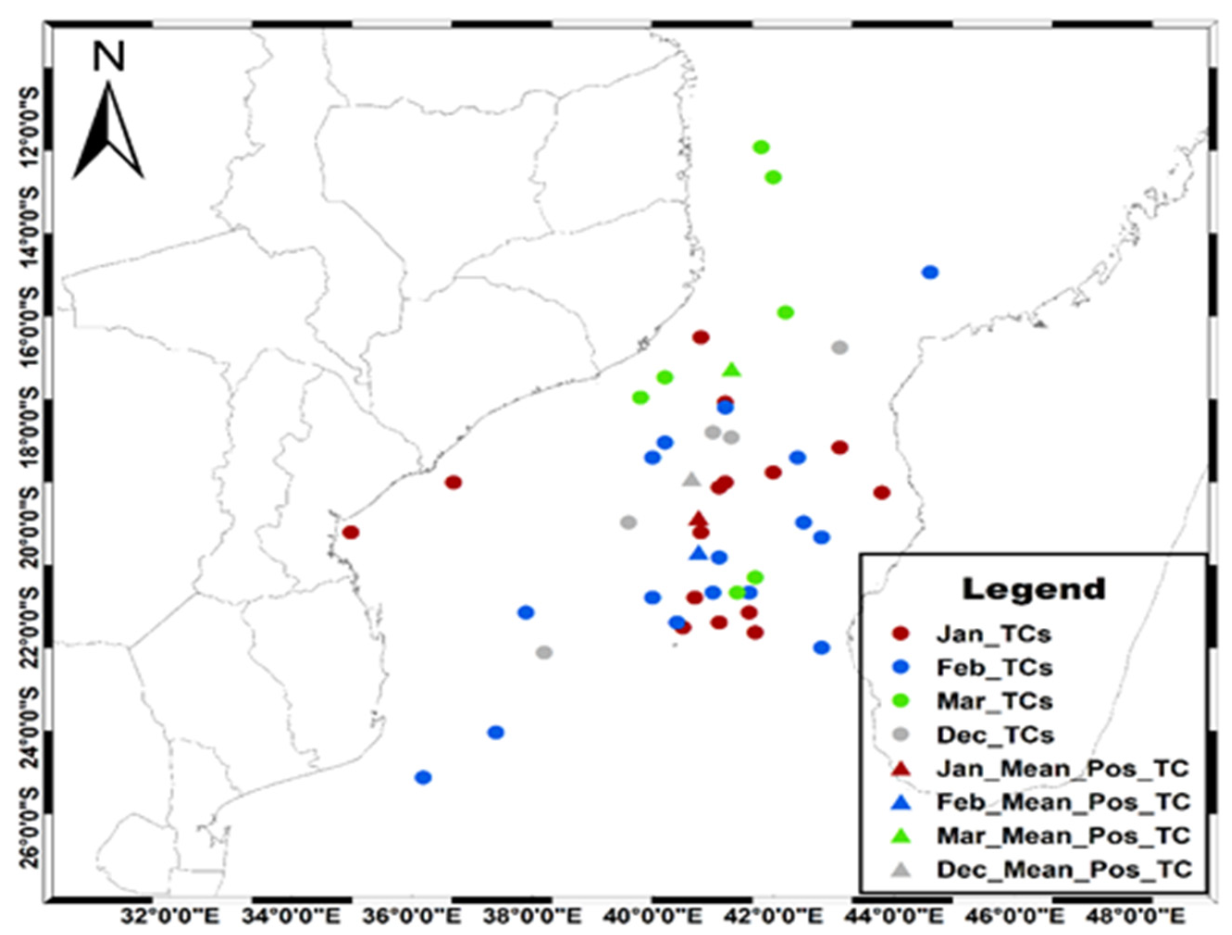
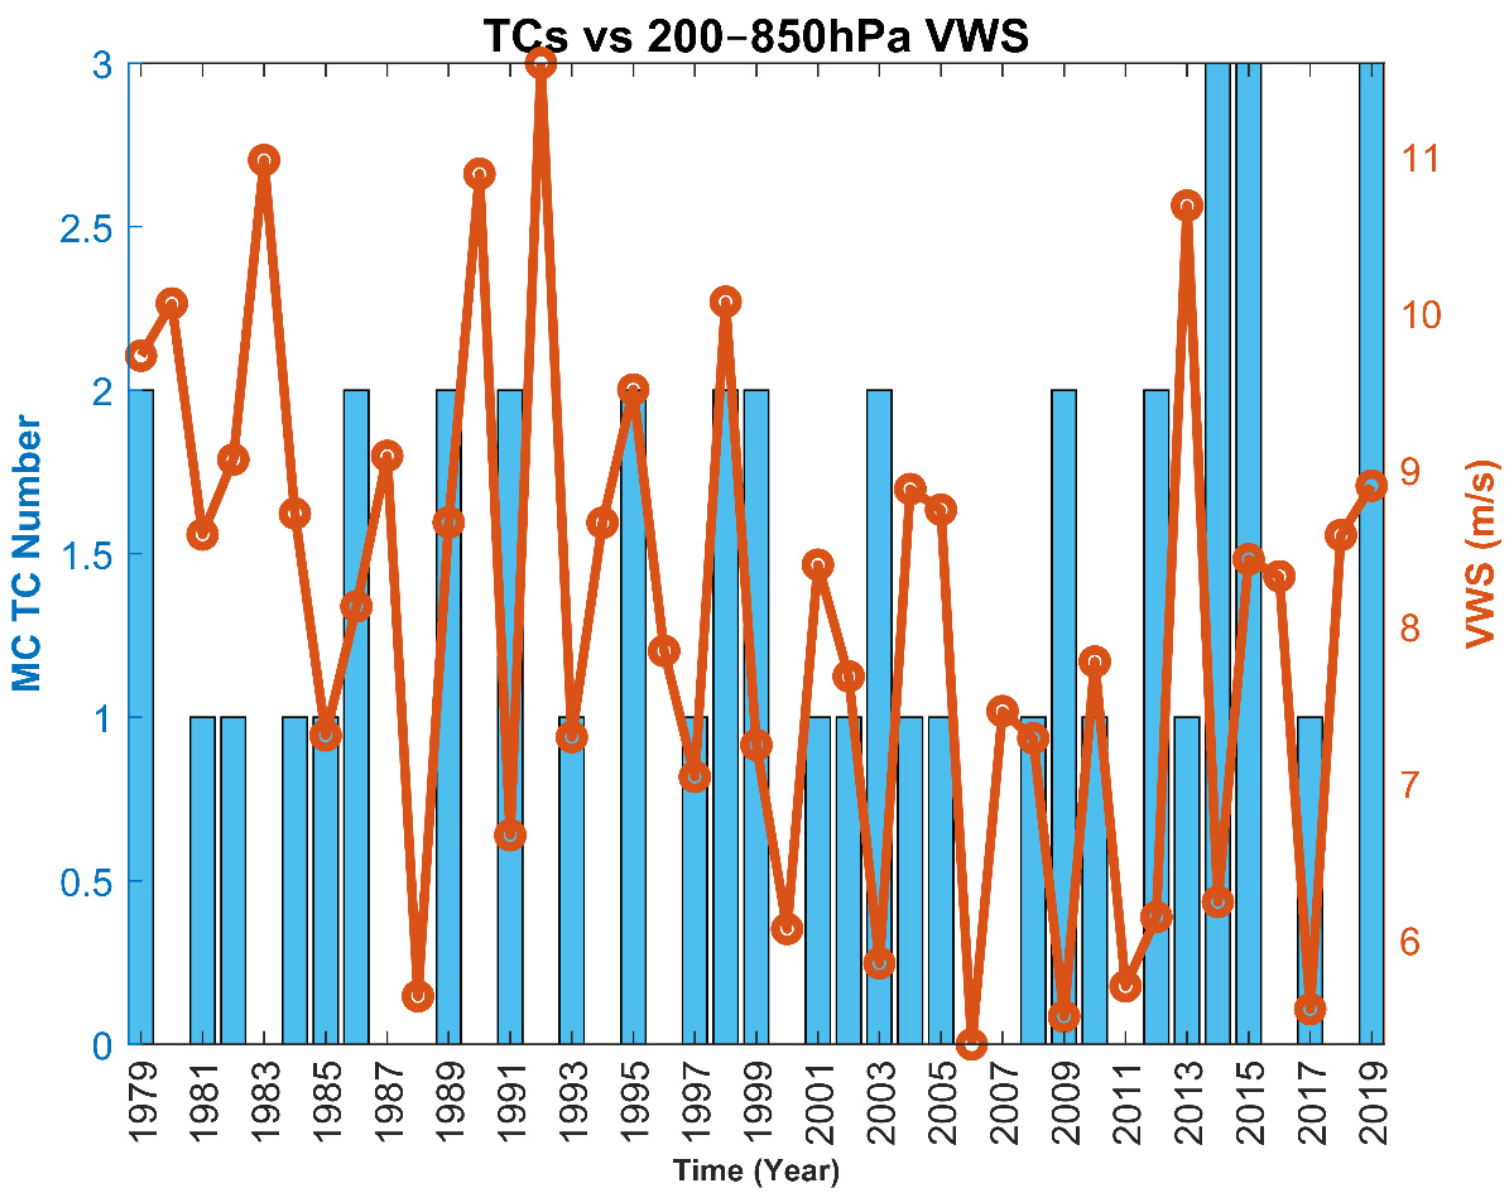
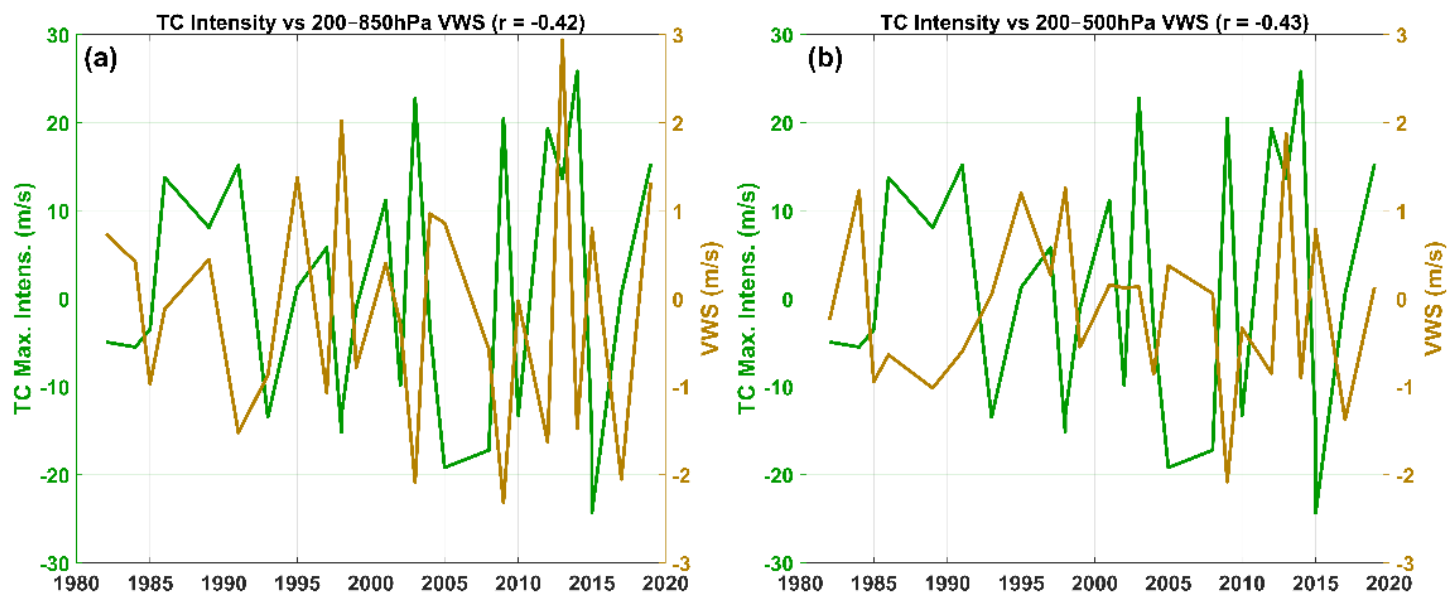
3.3. Vertical Wind Shear vs. Tropical Cyclone Genesis and Intensity

The spatial distribution of TC genesis over the MC for the 1978/1979 to 2018/2019 TC seasons, are presented in Figure 4. TC genesis in the MC is observed between around 12–24° S. A total of 43 TC genesis were observed, with maximum occurrence over the region of weak VWS which coincides with a region of low-level winds (compare with Figure 2b).
Monthly anomalies of 200–850 hPa VWS were computed together with TC genesis for January to March (Figure 5), to explore their relationship. It is observed from Figure 5 that most TC genesis are located in regions with negative anomalies of VWS. Few cases are observed in regions with positive anomalies, particularly in February, with cases that developed to TC intensity. A total of 15 cases developed to at least TC intensity.
The monthly mean VWS in the MC (10–27.5° S e 30–50° E) and the number of monthly totals of cyclogenesis are shown in Figure 6. The lowest values of VWS and higher number of cyclogenesis are observed between January and February. The average shear for the SWIO cyclone season is 11.64 m/s, and during the cyclone season months, the shear remains below this value, except in November and April. January and February show the lowest values of VWS and are also the most active in terms of tropical cyclogenesis, representing about 72% of the events. Although November and April are part of the cyclone season in the SWIO basin, cyclogenesis is not observed during these months, which is consistent with the observed strong shear.
The interannual variability of Dec–Mar VWS and the number of TC genesis per season in the MC are shown in Figure 7. For the period considered here, the maximum VWS is 10.63 m/s observed in 1992 and the minimum is 5.36 m/s observed in 2017. The number of TC genesis per season is between 0–3, the maximum number of cyclogenesis occurred in 2014, 2015 and 2019, there were fourteen years in which no TCs formed and an average of 1.1 TCs occurred per season.

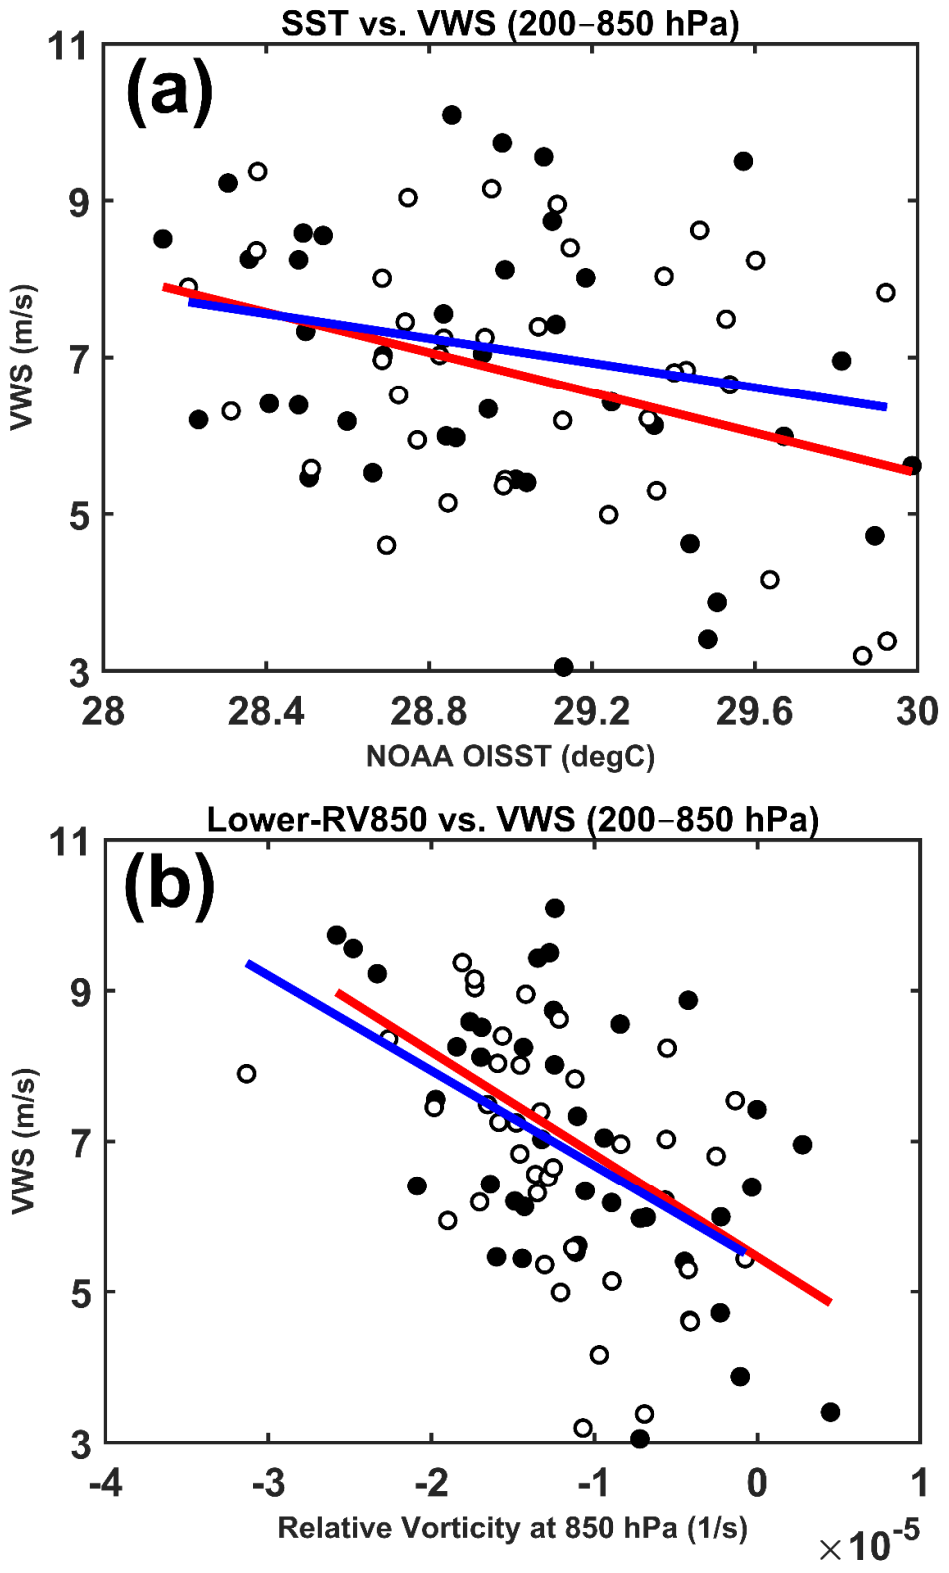
VWS vs. TC Genesis and Intensity Correlations

Correlations were performed between the VWS in different layers and the number of TC genesis in the MC and also between the VWS in different layers and TC maximum intensity. The VWS and number of TC genesis correlations were in general weak. The VWS and TC maximum intensity correlations exhibited significant values for the bulk (200–850 hPa) and upper (200–500 hPa) atmosphere VWS (values above −0.4) while for the lower (500–850) atmosphere there were no significant correlations. Figure 8a,b shows plots of TC max intensity vs. VWS anomalies with the correlation coefficients shown on the top of the panels for 200–850 hPa (a) and 200–500 hPa (b). The long-term linear trend was removed from both time series.

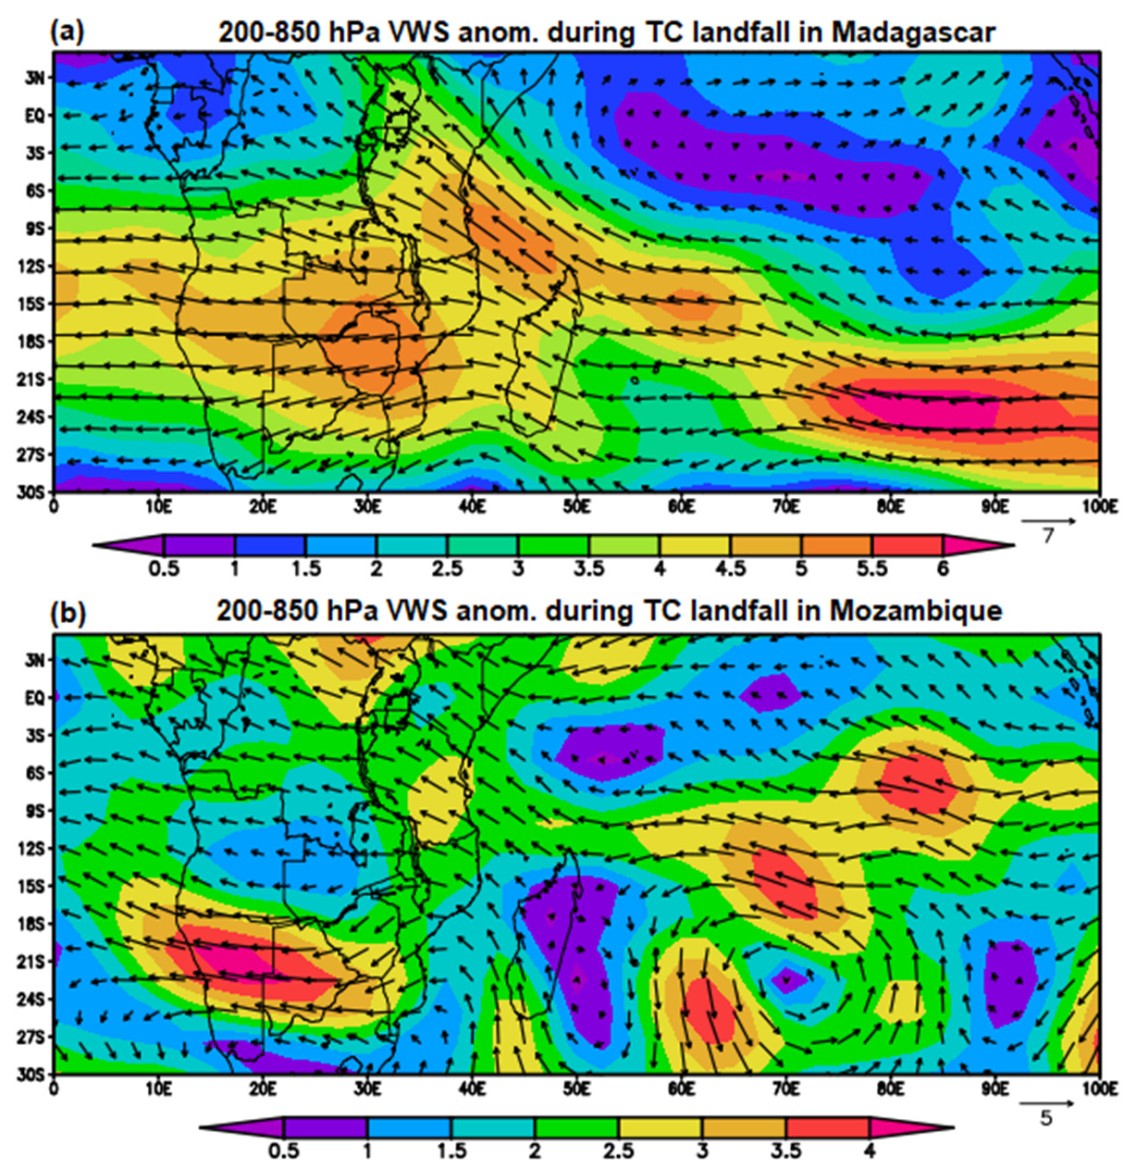
3.4. Vertical Wind Shear vs. TC Landfall Coast

During the analyzed period, 13 TC systems formed in the MC made landfall (six over Mozambique coast and seven over Madagascar west coast). Only systems with a storm intensity (equal or greater than 17 m/s) during landfall were considered. Composite anomalies (mean months with TC events making landfall-long term mean) of December–March 200–850 hPa VWS were analyzed to explore the potential role of VWS in the landfall position (Mozambique coast or Madagascar west coast). Figure 9 shows the composite anomalies. The VWS anomalies associated with landfall over Madagascar coast exhibit higher values over the MC, between 4 and 5 m/s (Figure 9a) as compared to values associated with landfall over the Mozambique coast, between 1 to 2 m/s (Figure 9b). The pattern of VWS direction is in general similar for the two cases, however, in case of landfall over Madagascar west coast the VWS is more zonal while for the Mozambique coast a meridional component is also observed. Significant (weak) low level geopotential and wind composite anomalies (figures not shown) are observed when the landfall is over the west coast Madagascar (Mozambique coast).

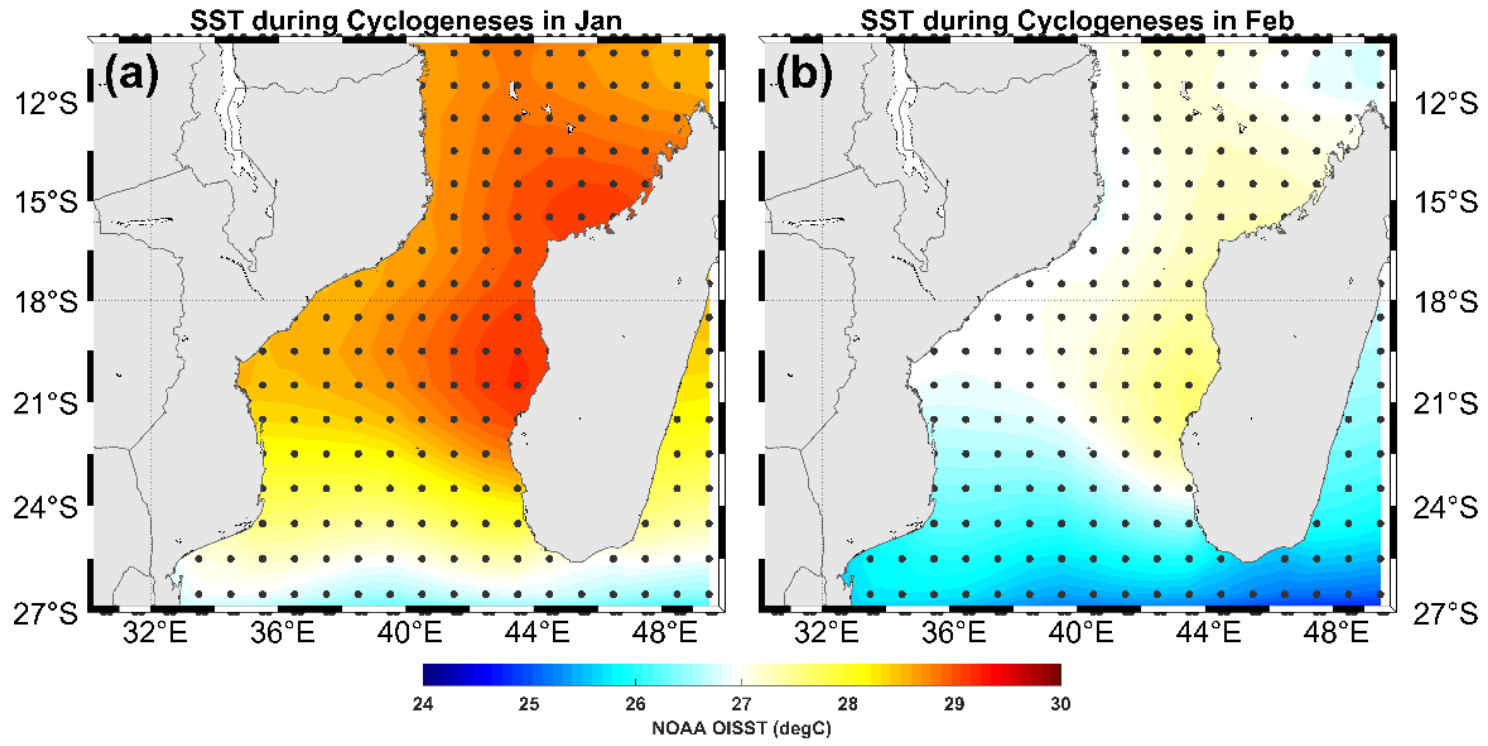
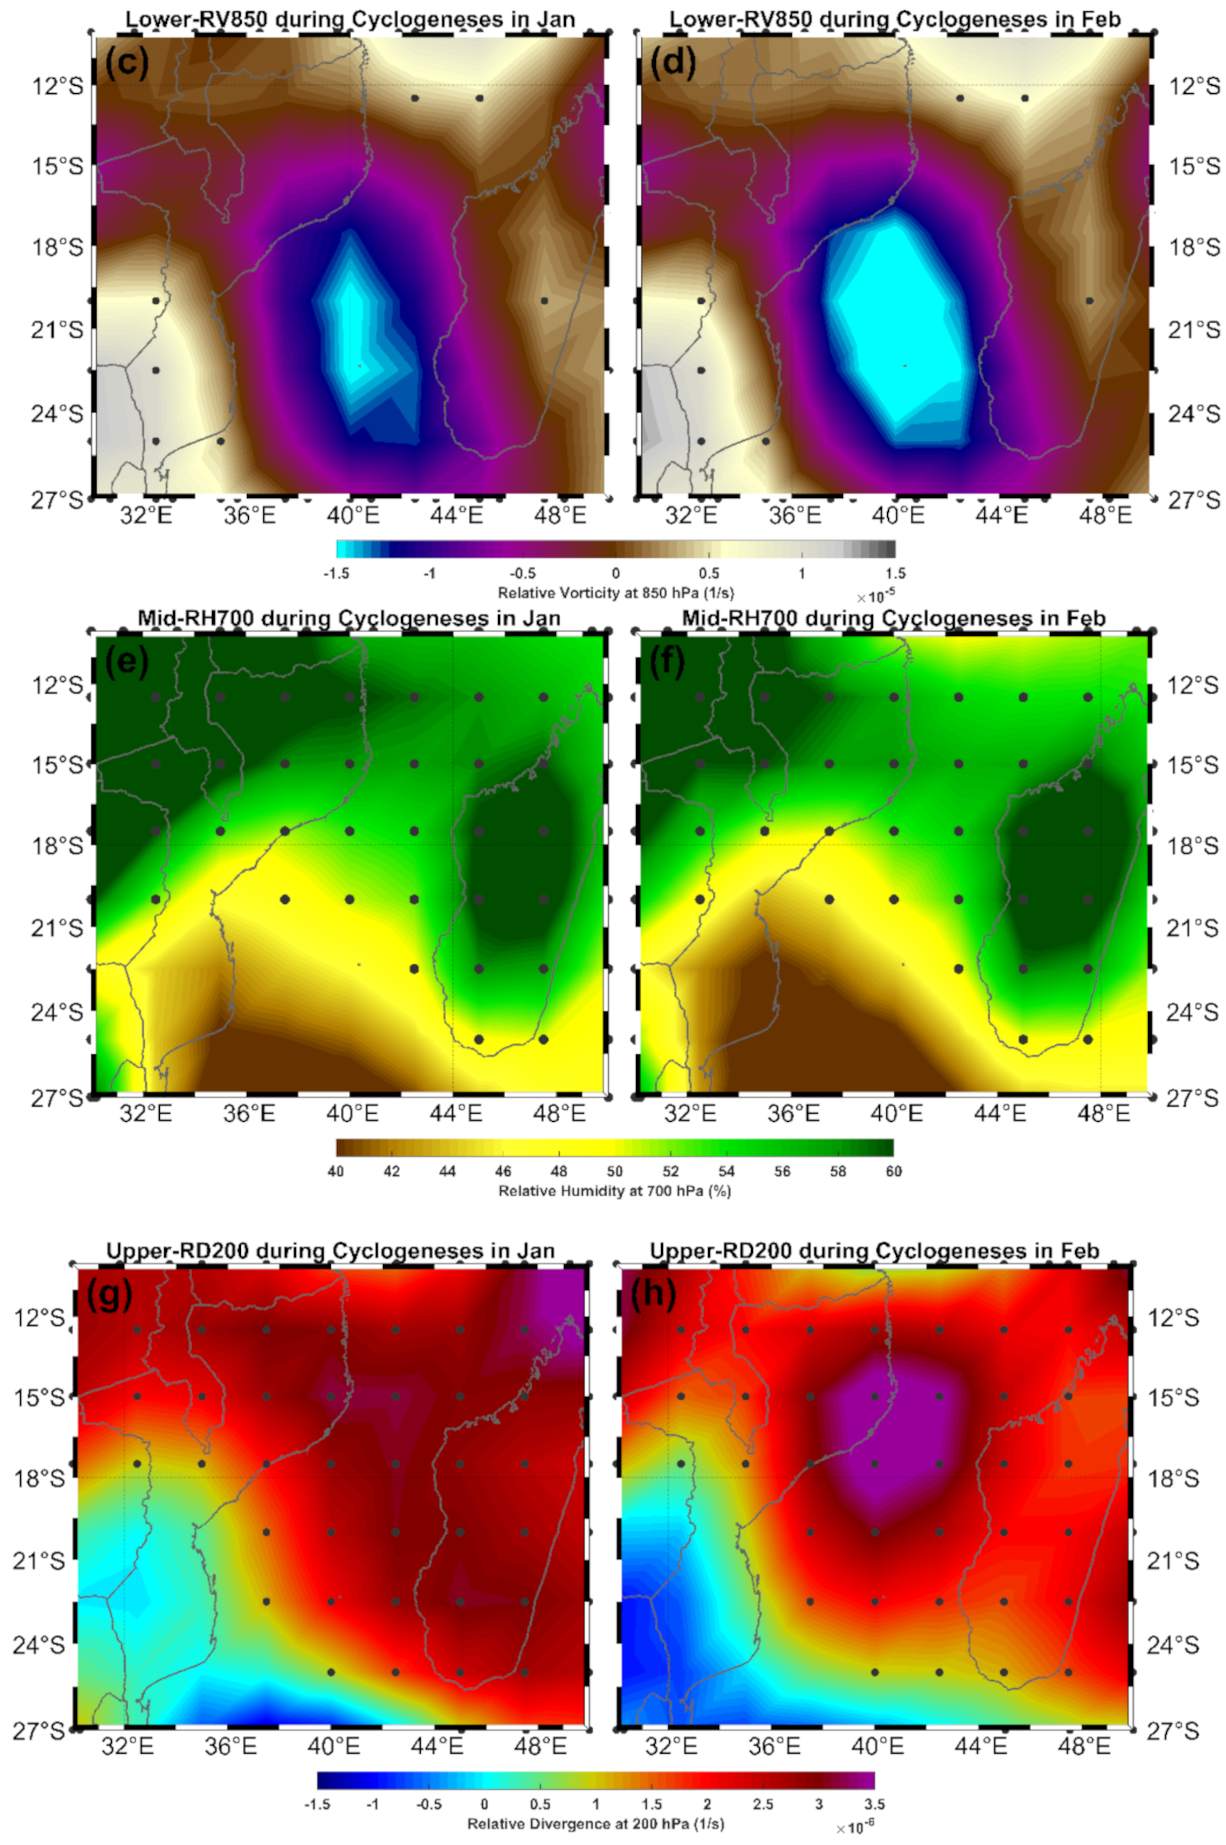
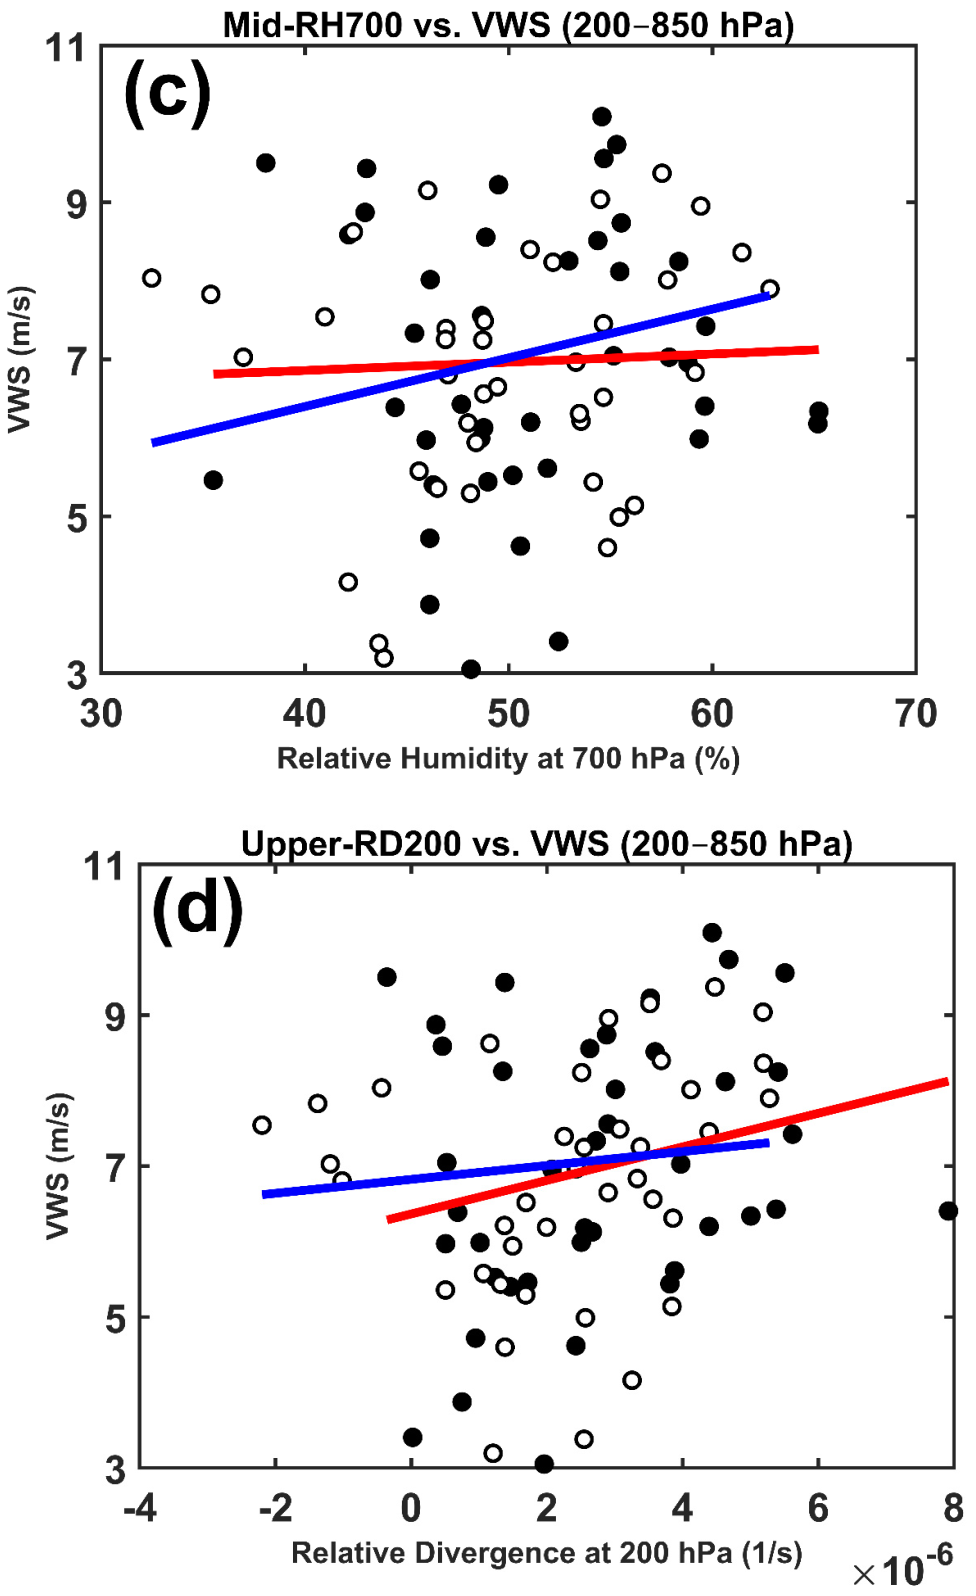
3.5. Potential Role of Different Environmental Factors to the Cyclogenesis in the MC

January and February composite mean (only months with cyclogenesis events in the MC) of SST, relative vorticity at 850 hPa, relative humidity at 700 hPa and divergence at 200 hPa were calculated and mapped to explore their potential role on TC genesis over the MC (Figure 10). Mean SST (Figure 10a,b) exhibit high and significant values while the vorticity (Figure 10c,d) values are in general not significant over the MC during cyclogenesis. The relative humidity at 700 hPa (Figure 10e,f) and upper-level divergence (Figure 10g,h) also exhibit significant values (45–60% and 2–3.5 × 10⁻⁵ s−1 respectively) over the central and northern parts of the MC. However, correlation analyses between time series of the elements considered here and TC genesis and intensity did not show significant values.
Scatter plots analyses of January and February are used here to explore the relationship between the VWS and the environmental factors indicated above, averaged over the region (16–22° S and 39–43° E) of TC genesis maximum occurrence (Figure 11). All the environmental factors show a good and consistent relationship with the 200–850 hPa VWS. The SST and vorticity at 850 hPa show a negative linear relationship while relative humidity at 700 hPa, and divergence at 200 hPa show a positive linear relationship with the VWS.

4. Discussion

Lower values of mean 200–850 hPa VWS over the SWIO are observed during the period December–February, with a distinct band (values below 6 m/s) extending across central South Indian Ocean towards southern Africa. In the MC, the mean position of this band is located between the latitudes 16−22° S. The region is also coincident with the highest cyclogenesis in the MC, above 40 TC formed in the period here considered. January to March monthly VWS anomalies maps, plotted together with TC genesis, show that most TCs are formed in regions of negative anomalies, although some developed to at least TC intensity in regions with positive monthly anomalies. However, it is important to note that the February mean VWS, over the region where all the cyclogenesis was observed, is within the values considered to be favorable for TC genesis (e.g., [5]). The region in the MC with maximum cyclogenesis events is coincident with the mean location of the center of the MC trough and the months (January and February) with highest events are also coincident with the period of the peak of strength of the trough. Barimalala et al. [29] indicate that the interannual variability in the MCT is associated with moist convection over the MC and is modulated by the location of the warm SST in the south Indian Ocean. These environmental conditions, as indicated in the introduction, are also important for cyclogenesis. Mean composite analyses of SST, relative humidity at 700 hPa and divergence at 200 hPa for January and February (with cyclogenesis) showed significant values, however, at the interannual timescale, no significant correlations were observed with TC genesis and TC maximum intensity. Statistically significant correlations were only observed between TC maximum intensity and VWS (200–850 hPa and 500–200 hPa) suggesting the influence of upper atmosphere vertical wind shear at interannual time scales in the development of TCs.
Correlation analyses of interannual variability of 200–850 hPa VWS (December –March) with Nino 3.4 (SIOD) index at different lags (SON, OND, NDJ, DJF and JFM), shown in Table 1, were significantly positive (negative). This suggests that high values of VWS are associated with El Niño, hence not favorable for TC intensification. Most of the 15 cases of TC that developed to at least TC intensity, developed under La Niña or neutral conditions (six under La Niña, six under neutral and three under El Niño conditions). It is noteworthy that four cases of the neutral condition were under the negative Niño-3.4 index. On the other hand, the negative correlation with the SIOD, suggests that warm SST over SWIO, linked to SIOD, is associated with weaker VWS over the MC. These results may indicate that both La Niña and positive SIOD are favorable to weaker VWS and to intensification of TC in the Mozambique Channel.
Analysis of composite anomalies of 200–850 hPa VWS for landfall events suggest that higher values over the MC are favorable to landfall over Madagascar west coast while weaker values are more favorable to landfall over the Mozambique coast. Composite analyses of low level geopotential height and wind suggest a significantly strengthened MC trough during landfall over the Madagascar west coast.

5. Conclusions

This study analyzed the seasonal to interannual relationship between vertical wind shear and the cyclogenesis and TC development in the Mozambique Channel. The cyclone activity in the MC has not been much studied, particularly the cyclogenesis, however, there is a significant number of cyclones making landfall or affecting Mozambique and Madagascar that are generated in the MC. The VWS over the SWIO is characterized by a band of minima magnitude, propagating southward and reaching its maxima southward position between January and February. Over the MC, the region of minima is associated with the highest number of cyclogenesis. A total of 43 cases of TC genesis were observed in the MC and 15 developed to at least Tropical Cyclone intensity. The VWS showed significant correlations with TC intensity, particularly when considering the upper atmosphere (200–500 hPa) or the bulk (200–850 hPa) VWS. The lower atmosphere VWS (500–850 hPa) did not show statistically significant correlation, a similar result was observed with the correlations between the TC genesis frequency and VWS. Analyses of interannual correlations of VWS and Niño-3.4 (SIOD) showed significant positive (negative) correlations at different lags suggesting that La Niña and positive phase of the SIOD conditions are favorable to weaker VWS and to intensification of TC in the Mozambique Channel. Thirteen landfall cases were observed with seven over the Madagascar west coast and six over the Mozambique coast. The landfall cases over the Madagascar (Mozambique) coast were associated with strengthened (weakened) VWS. The landfall events over Madagascar appear to also be associated with a significantly stronger MC trough.

Author Contributions

Conceptualization A.F.M., A.J.M. and I.A.G.; software, I.A.G., A.F.M. and B.J.N.; data acquisition and processing, I.A.G., A.J.M. and B.J.N.; writing—original draft preparation, I.A.G. and A.J.M.; writing—review and editing, all co-authors; supervision, A.J.M.; project administration, A.J.M.; funding acquisition, A.J.M. All authors have read and agreed to the published version of the manuscript.

Funding

This research work was funded by the European Union, La Réunion Regional Council and the French state under the framework of the INTERREG-5 Indian Ocean 2014–2020 project “ReNovRisk Cyclone and Precipitation”.

Institutional Review Board Statement

Not applicable.

Informed Consent Statement

Not applicable.

Data Availability Statement

Data used here is freely available on the internet and the sources are indicated in the manuscript and referenced in the reference list.

Acknowledgments

The authors would like to thank Eduardo Mondlane University, Faculty of Sciences (UEM-FC) in Maputo, Mozambique, where all computer work was conducted including the software facilities provided by the Department of Physics. The authors would also like to thank the important contribution of the reviewers who through their comments contributed significantly for the improvement of this paper.

Conflicts of Interest

The authors declare no conflict of interest with regard to this work and publication in this journal.

Software

The data analysis and output for this paper was generated using Matlab software, Version [10a], License number 506085, from the Department of Physics, Faculty of Sciences, UEM, Maputo, Mozambique.

References

  1. Gray, W.M. Global view of the origin of tropical disturbances and storms. Mon. Weather Rev. 1968, 96, 669–700. [Google Scholar] [CrossRef]
  2. Chan, K.T.F.; Wang, D.; Zhang, Y.; Wanawong, W.; He, M.; Yu, X. Does strong vertical wind shear certainly lead to the weakening of a tropical cyclone? Environ. Res. Commun. 2019, 1, 1–13. [Google Scholar] [CrossRef]
  3. Emanuel, K.; DesAutels, C.; Holloway, C.; Korty, R. Environmental control of tropical cyclone intensity. J. Atmos. Sci. 2004, 61, 843–856. [Google Scholar] [CrossRef]
  4. Finocchio, P.M.; Majumdar, S.J. A Statistical Perspective on Wind Profiles and Vertical Wind Shear in Tropical Cyclone Environments of the Northern Hemisphere. Mon. Weather Rev. 2017, 145, 361–378. [Google Scholar] [CrossRef] [Green Version]
  5. Aiyyer, A.R.; Thorncroft, C. Climatology of Vertical Wind Shear over the Tropical Atlantic. J. Clim. 2006, 19, 2969–2983. [Google Scholar] [CrossRef]
  6. Nolan, D.S.; McGauley, M.G. Tropical cyclogenesis in wind shear: Climatological relationships and physical processes. In Cyclones: Formation, Triggers and Control; Nova Science Publishers, Inc.: New York, NY, USA, 2012; pp. 1–36. [Google Scholar]
  7. Jones, J.J.; Bell, M.M.; Klotzbach, P.J. Tropical and Subtropical North Atlantic Vertical Wind Shear and Seasonal Tropical Cyclone Activity. J. Clim. 2020, 33, 5413–5426. [Google Scholar] [CrossRef] [Green Version]
  8. Molinari, J.; Vollaro, D. Rapid Intensification of a Sheared Tropical Storm. Mon. Weather Rev. 2010, 138, 3869–3885. [Google Scholar] [CrossRef]
  9. Montgomery, M.T.; Lussier, L.L., III; Moore, R.W.; Wang, Z. The genesis of Typhoon Nuri as observed during the Tropical Cyclone Structure 2008 (TCS-08) field experiment—Part 1: The role of the easterly wave critical layer. Atmos. Chem. Phys. 2010, 10, 9879–9900. [Google Scholar] [CrossRef] [Green Version]
  10. Rios-Berrios, R.; Torn, R.D.; Davis, C.A. An Ensemble Approach to Investigate Tropical Cyclone Intensification in Sheared Environments. Part II: Ophelia (2011). J. Atmos. Sci. 2016, 73, 1555–1575. [Google Scholar] [CrossRef]
  11. Mundell, D.B. Prediction of Tropical Cyclone Rapid Intensification Events. Master’s Thesis, Colorado State University, Fort Collins, CO, USA, 1990. [Google Scholar]
  12. DeMaria, M. The effect of vertical shear on tropical cyclone intensity change. J. Atmos. Sci. 1996, 53, 2076–2087. [Google Scholar] [CrossRef] [Green Version]
  13. Zehr, R.M. Environmental vertical wind shear with Hurricane Bertha (1996). Weather Forecast. 2003, 18, 345–356. [Google Scholar] [CrossRef]
  14. Bracken, W.E.; Bosart, L.F. The role of Synoptic-Scale flow during tropical cyclogenesis over the North Atlantic Ocean. Mon. Weather Rev. 2000, 128, 353–376. [Google Scholar] [CrossRef]
  15. Zehr, R.M. Tropical Cyclogenesis in the Western North Pacific; NOAA Technical Report NESDIS 61; NOAA: St. Petersburg, FL, USA, 1992; p. 181. [Google Scholar]
  16. Fink, H.A.; Speth, P. Tropical cyclones. Naturwissenschaften 1998, 85, 482–493. [Google Scholar] [CrossRef]
  17. Ho, C.-H.; Kim, J.-H.; Jeong, J.-H.; Kim, H.-S.; Chen, D. Variation of tropical cyclone activity in the South Indian Ocean: El Niño–Southern Oscillation and Madden-Julian Oscillation effects. J. Geophys. Res. 2006, 111, 1–9. [Google Scholar] [CrossRef] [Green Version]
  18. Mavume, A.F.; Rydberg, L.; Rouault, M.; Lutjeharms, J.R.E. Climatology and landfall of tropical cyclones in the SouthWest Indian Ocean. J. Mar. Sci. 2009, 8, 15–36. [Google Scholar]
  19. Malherbe, J.; Engelbrecht, F.A.; Landman, W.A.; Engelbrecht, C.J. Tropical systems from the southwest Indian Ocean making landfall over the Limpopo River Basin, southern Africa: A historical perspective. Int. J. Climatol. 2012, 32, 1018–1032. [Google Scholar] [CrossRef] [Green Version]
  20. WMO. Global Guide to Tropical Cyclone Forecasting; Guard, C., Ed.; WMO: Geneva, Switzerland, 2017; p. 399. Available online: http://www.wmo.int/cycloneguide/pdf/Global-Guide-to-TropicalCyclone-Forecasting.pdf (accessed on 7 January 2020).
  21. Leroux, M.-D.; Meister, J.; Mekies, D.; Dorla, A.-L. A Climatology of Southwest Indian Ocean Tropical Systems: Their Number, Tracks, Impacts, Sizes, Empirical Maximum Potential Intensity, and Intensity Changes. J. Appl. Meteorol. Climatol. 2018, 57, 1021–1041. [Google Scholar] [CrossRef]
  22. Bousquet, O.; Barruol, G.; Cordier, E.; Barthe, C.; Bielli, S.; Calmer, R.; Rindraharisaona, E.; Roberts, G.; Tulet, P.; Amelie, V.; et al. Impact of Tropical Cyclones on Inhabited Areas of the SWIO Basin at Present and Future Horizons. Part 1: Overview and Observing Component of the Research Project RENOVRISK-CYCLONE. Atmosphere 2021, 12, 544. [Google Scholar] [CrossRef]
  23. Chen, S.S.; Knaff, J.A.; Marks, F.D., Jr. Effects of Vertical Wind Shear and Storm Motion on Tropical Cyclone Rainfall Asymmetries Deduced from TRMM. Mon. Weather Rev. 2006, 134, 3190–3208. [Google Scholar] [CrossRef]
  24. Bessafi, M.; Wheeler, M.C. Modulation of South Indian Ocean Tropical Cyclones by the Madden–Julian Oscillation and Convectively Coupled Equatorial Waves. Mon. Weather Rev. 2006, 134, 638–656. [Google Scholar] [CrossRef]
  25. Kuleshov, Y.; Ming, F.C.; Qi, L.; Chouaibou, I.; Hoareau, C.; Roux, F. Tropical cyclone genesis in the Southern Hemisphere and its relationship with the ENSO. Ann. Geophys. 2009, 27, 2523–2538. [Google Scholar] [CrossRef] [Green Version]
  26. Jury, M.R.; Pathack, B. A study of climate and weather variability over the tropical Southwest Indian Ocean. Meteorol. Atmos. Phys. 1991, 47, 37–48. [Google Scholar] [CrossRef]
  27. Jury, M.R. A preliminary study of climatological associations and characteristics of tropical cyclones in the SW Indian Ocean. Meteor. Atmos. Phys. 1993, 51, 101–115. [Google Scholar] [CrossRef]
  28. Matyas, C.J. Tropical cyclone formation and motion in the Mozambique Channel. Int. J. Climatol. 2015, 35, 375–390. [Google Scholar] [CrossRef]
  29. Barimalala, R.; Blamey, R.C.; Desbiolles, F.; Reason, C.J.C. Variability in the Mozambique Channel Trough and Impacts on Southeast African Rainfall. J. Clim. 2020, 33, 749–765. [Google Scholar] [CrossRef]
  30. Cook, H.H. The South Indian Convergence Zone and Interannual Rainfall Variability over Southern Africa. J. Clim. 2000, 13, 3789–3804. [Google Scholar] [CrossRef]
  31. Barimalala, R.; Desbiolles, F.; Blamey, R.C.; Reason, C. Madagascar Influence on the South Indian Ocean Convergence Zone, the Mozambique Channel Trough and Southern African Rainfall. Geophys. Res. Lett. 2018, 45, 11380–11389. [Google Scholar] [CrossRef]
  32. Kalnay, E.; Kanamitsu, M.; Kistler, R.; Collins, W.; Deaven, D.; Gandin, L.; Iredell, M.; Saha, S.; White, G.; Woollen, J.; et al. The NCEP/NCAR 40-Year Reanalysis Project. B. Am. Meteorol. Soc. 1996, 77, 437–472. [Google Scholar] [CrossRef] [Green Version]
  33. Reynolds, R.W.; Rayner, N.A.; Smith, T.M.; Stokes, D.C.; Wang, W. An Improved in Situ and Satellite SST Analysis for Climate. J. Clim. 2002, 15, 1609–1625. [Google Scholar] [CrossRef]
  34. Rios-Berrios, R.; Torn, R.D. Climatological Analysis of Tropical Cyclone Intensity Changes under Moderate Vertical Wind Shear. Mon. Weather Rev. 2017, 145, 1717–1738. [Google Scholar] [CrossRef]
  35. Bahera, S.K.; Yamagata, T. Subtropical SST dipole events in the southern Indian Ocean. Geophys. Res. Lett. 2001, 28, 327–330. [Google Scholar] [CrossRef]
Figure 1. Mean (Dec–Mar 1979–2019) vertical wind shear. Colors indicate the magnitude (m/s) and vectors the direction.
Atmosphere 12 00739 g001
Figure 2. Mean (Dec–Mar 1979–2019) wind fields at 200 (a) and 850 hPa (b). Colors indicate the magnitude (m/s) and vectors the direction.
Atmosphere 12 00739 g002
Figure 3. Same as Figure 1, but for mean monthly VWS.
Atmosphere 12 00739 g003
Figure 4. Geographical distribution of tropical cyclogenesis events over the MC during the 1979–2019 period. The colors distinguish the events by month (dots) and the monthly mean position is represented by triangles.
Atmosphere 12 00739 g004
Figure 5. VWS monthly anomaly (contours in m/s) and the geographical distribution of TC genesis events (blue dots indicate monthly distribution and red dots the systems that intensified to at least TC intensity) for the period 1979–2019. Doted lines indicate negative values.
Atmosphere 12 00739 g005
Figure 6. Monthly totals of cyclogenesis events in the MC (bars) and monthly mean VWS (m/s).
Atmosphere 12 00739 g006
Figure 7. An overlay of the number of cyclones (blue bars) and 200–850 hPa VWS (red solid line) per season (Dec–Mar) over the MC between 1978/1979 and 2018/2019 TC seasons. The long-term linear trend and seasonal cycle have been removed in both time series.
Atmosphere 12 00739 g007
Figure 8. Plots of TC maximum intensity and VWS anomalies for 200–850 layer (a) and 200–500 hPa layer (b) for December–March over the MC. Green and red colors indicate the TC maximum intensity and VWS, respectively. The time series correlation coefficients (at zero lag) are shown on the top of the panel.
Atmosphere 12 00739 g008
Figure 9. Composite anomalies of December–March 200–850 hPa VWS associated wind landfall over Madagascar west coast (a) and Mozambique coast (b).
Atmosphere 12 00739 g009
Figure 10. Composite mean of SST (a,b), vorticity at 850 hPa (c,d), relative humidity at 700 hPa (e,f) and divergence at 200 hPa (g,h) for January (left panel) and February (right panel) cyclogenesis (dots indicate 95% t-test confidence level).
Atmosphere 12 00739 g010aAtmosphere 12 00739 g010b
Figure 11. Relationship between VWS and SST (a), vorticity at 850 hPa (b), relative humidity at 700 hPa (c) and divergence at 200 hPa (d) for January (red line and black dots) and February (blue line and white dots).
Atmosphere 12 00739 g011aAtmosphere 12 00739 g011b
Table 1. Correlation coefficients of 200–850 hPa VWS vs. Niño-3.4 and SIOD.
PeriodNiño-3.4 vs. 200–850 hPa VWSSIOD vs. 200–850 hPa VWS
September–November (SON)0.34
October–December (OND)0.37−0.34
November–January (NDJ)0.40−0.40
December–February (DJF)0.43−0.41
January–March (JFM)0.50−0.38
Publisher’s Note: MDPI stays neutral with regard to jurisdictional claims in published maps and institutional affiliations.

